- 1State Key Laboratory of Remote Sensing Science, Aerospace Information Research Institute, Chinese Academy of Sciences, Beijing, China
- 2University of Chinese Academy of Sciences, Beijing, China
- 3Aerospace Information Research Institute, Chinese Academy of Sciences, Beijing, China
Plantations are formed entirely by artificial planting which are different from natural forests. The rapid expansion of plantation forestry has brought about a series of ecological and environmental problems. Timely and accurate information on the distribution of plantation resources and continuous monitoring of the dynamic changes in plantations are of great significance. However, plantations have similar spectral and texture characteristics with natural forests. In addition, cloud and rain greatly affected the image quality of large area mapping. Here, we tested the possibility of applying Continuous Change Detection and Classification to distinguish plantations from natural forests and described the spatiotemporal dynamic changes of plantations. We adopted the Continuous Change Detection and Classification algorithm and used all available Landsat images from 2000 to 2020 to map annual plantation forest distribution in Guangxi Zhuang Autonomous Region, China and analyzed their spatial and temporal dynamic changes. The overall accuracy of the plantation extraction is 88.77%. Plantations in Guangxi increased significantly in the past 20 years, from 2.37 × 10⁶ ha to 5.11 × 10⁶ ha. Guangxi is expanding new plantation land every year, with the largest expansion area in 2009 of about 2.58 × 10⁵ ha. Over the past 20 years, plantations in Guangxi have clearly shown a tendency to expand from the southeast to the northwest, transformed from natural forests and farmland. 30% of plantations have experienced at least one logging-and-replanting rotation event. Logging rotation events more intensively occur in areas with dense plantation forests. Our study proves that using fitting coefficients from Continuous Change Detection and Classification algorithm is effective to extract plantations and mitigating the adverse effects of clouds and rain on optical images in a large scale, which provides a fast and effective method for long-time and large-area plantation identification and spatiotemporal distribution information extraction, and strong data support and decision reference for plantation investigation, monitoring and management.
1. Introduction
Disturbance of terrestrial ecosystems can significantly affect and alter ecosystem function and structure and thus have a major impact on the spatial and temporal patterns of the terrestrial carbon cycle (Lin et al., 2022). As a major part of terrestrial ecosystems, forest ecosystems play an important role in the global carbon cycle, energy balance, and material exchange (Paul et al., 2002; Bonan, 2008; Pan et al., 2011). The main factors causing forest disturbance are climate change, natural disasters, and human activities, of which human activities are the most significant (Foley et al., 2005; Song et al., 2018; Trisasongko and Paull, 2020).
China is a country with large forest resources and a large population, and the number of forest resources owned per capita is at a low level in the world. During vigorous industrial development, the destruction of forests due to the long-term over-harvesting of natural forests has led to increasing ecological degradation (Zhang et al., 2000; Deng et al., 2014). Deforestation for timber, farming or urban expansion has exacerbated environmental problems such as land desertification, soil erosion, and a sharp decline in biodiversity (Foley et al., 2005). In addition, forest resources, especially those available for logging, were in severe shortage. To restore the ecological environment, China has been developing ecological projects since the 1970s, conserving and restoring natural forests and expanding forest plantations. Plantations are a completely different forest type from natural forests. Plantations are formed entirely by artificial planting, while natural forests grow naturally or regenerate through human promotion. Plantations are characterized by short rotation periods, good materials, and high survival rates. Guangxi Zhuang Autonomous Region of China, a province with rich forest resources, has undergone a large amount of deforestation and land reclamation for economic development, resulting in a sharp decline in forest resources. With the launch of the “Coastal Shelterbelt” Program in 1991 and the “Grain-for-Green” program in 1999 (Deng et al., 2014), Guangxi began planting large areas of forest plantations and has created a large amount of forestry output through rotational logging and replanting.
Plantations are currently the main raw material for timber supply in China, and the repetitive deforestation and afforestation resulting from their rotation is an important influence on changes in regional carbon sinks. Although the rapid expansion of plantation forestry can alleviate the demand for timber for social development, reduce the increasing level of carbon dioxide in the atmosphere (Bonan, 2008), and mitigate climate change to a certain extent, the rapid development in a crude manner has also brought about a series of ecological and environmental problems, which are disruptive to the balance of the original ecosystem. Furthermore, compared to the natural forests, the non-native and exotic species in plantation forestry projects can change the physical, chemical, and biological properties of the soil, which may also reduce soil quality and forest productivity. Thus, the problems caused by massive plantations should not be ignored (Jackson et al., 2005; Brockerhoff et al., 2008). Likewise, timely and accurate information on the distribution of plantation resources and continuous monitoring of the dynamic changes in plantation forests are of great significance to forestry management, economic estimation of plantation forests, ecological environmental protection, and carbon cycle research.
With the launch of satellites carrying various sensors and the rapid development of remote sensing technology, remote sensing has become an important means of monitoring plantation forests. Plantation forests and natural forests both belong to forest land cover type, so they are highly similar in many characteristics, as a result, how to distinguish between them becomes a problem worthy of research. In terms of distinguishing natural forests from plantation forests, most studies are based on the classification of land use and land cover (LULC). As for the classifier selection, the traditional classifiers of remote sensing are involved in many researches, such as Decision Tree (Han et al., 2018), Support Vector Machine (Razak et al., 2018). Recent studies have widely used random forest as the classifier (Senf et al., 2013; Wu et al., 2022), because random forest classifier can achieve higher accuracy, handle high-dimensional features and avoid overfitting. The difference mainly lies in the fact that researchers chose different classification features. Since the spectral features of plantation forests and natural forests are highly similar, it is more difficult to distinguish between them using only spectral features. Some studies have used phenological features (Senf et al., 2013). The advantages of using such features are that some plantation species, such as rubber trees, have a deciduous period, which has obvious phenological features that can be used to separate them from natural forests (Senf et al., 2013). However, methods using phenological features have limitations, because evergreen plantations, for example eucalyptus, that do not have a deciduous period may not be easily separated from natural forests using the phenological characteristics (Wu et al., 2022). Other studies use multiple features (Torbick et al., 2016; Xu et al., 2017; Fagan et al., 2018; Sun et al., 2022; Wu et al., 2022), including spectral, textural, topographic, and ancillary data. The regular planting of plantations results in different texture characteristics than natural forests, and some plantations will be planted in areas with relatively gentle slopes. These combined features can separate plantations from natural forests through multi-feature methods (Torbick et al., 2016). However, when multiple features are used, parameter selection is required to choose the optimal parameters (Wu et al., 2022).
In terms of plantation change detection and spatiotemporal distribution information extraction, there are two main methods. The first is to directly compare the differences after LULC classification, and the second is based on long time series change detection. For the first method, forest change is monitored based on LULC classification by comparing the classification results of images in different time periods, usually through the land conversion matrix (Mahmoud et al., 2011; Liu et al., 2016; Twisa and Buchroithner, 2019; Chen, H et al., 2021; Sun et al., 2021; Wang et al., 2021; Chen et al., 2023). The advantage of this method is that it can reduce the effects of light radiation differences, sensor differences, and seasonal phenology differences, and can clearly represent the land cover type conversion (Twisa and Buchroithner, 2019). The disadvantage is that there are different degrees of error in the classification results for different time phases, and in some cases the error can be even greater than the degree of change (Azizan et al., 2021). Moreover, if only optical satellites are used, it also leads to the problem of susceptibility to cloud influence and difficulty in obtaining high-quality coverage of the complete study area in certain cloudy and rainy areas, especially in large regions (Azizan et al., 2021). In contrast, methods based on long time series change detection can directly detect vegetation changes, and the problem of images being obscured by clouds can be solved by processing multi-year time series data. Breakpoint detection algorithms such as Landsat-based detection of Trends in Disturbance and Recovery (LandTrendr) and Continuous Change Detection and Classification (CCDC) can significantly reduce the effects of clouds, cloud shadows, and snow, realizing to monitor the dynamics of different land cover types. Grogan et al. (2015) used the LandTrendr algorithm to study forest disturbance caused by rubber forest expansion. The LandTrendr algorithm, proposed by Kennedy, was designed specifically for Landsat time series imagery to detect trends in forest change (Kennedy et al., 2012). Specifically, LandTrendr uses characteristic points in a time series consisting of annual synthetic values to segment long-term trends in vegetation into segments and simulate the process of vegetation change based on a segmented linear model. In this method, several complex control parameters are necessary and need to be constantly changed depending on both signal-to-noise ratios and spectral characteristics of the different sensors (Kennedy et al., 2012). In addition, the CCDC algorithm, based on all available Landsat images, first initializes the model according to 15 cloud-free observations in each pixel’s time series and then detects changes by comparing the discrepancies between the model predictions and observations (Zhu and Woodcock, 2014). The algorithm can detect a wide range of land cover changes, both gradual (e.g., changes due to vegetation growth and succession, pests, abnormal weather, etc.) and abrupt changes, which also can be applied to improve land cover classification accuracy. Besides, as the CCDC algorithm makes use of all available Landsat images, its change detection results are more comprehensive than that of using only annual composite images and are particularly effective in gradual change detection (Vogelmann et al., 2016). The cost of data storage has fallen dramatically in recent years and we have witnessed a rapid increase in computing power, which has laid the foundation for time series analysis using Landsat data (Zhu, 2017), especially with the advent of the Google Earth Engine (GEE) cloud platform, which provides an efficient solution for the spatial and temporal dynamics analysis of plantations using medium resolution long time series Landsat imagery in large scale.
The objectives of our study are to: (1) explore the possibility of using the CCDC algorithm to discriminate plantations from natural forests through plantations’ temporal features of rapid growth and harvest rotation in a large area of cloudy and rainy conditions, (2) describe the spatiotemporal dynamic changes of plantations from different perspectives, including area changes, expansion years, and expansion times. Based on the above background, we adopted the CCDC algorithm and used all available Landsat images from 2000–2020 to map annual plantation forest distribution in Guangxi Zhuang Autonomous Region and analyze their spatial and temporal dynamic changes. The values and contributions of this study are: (1) using the fitting parameters of CCDC as classification features to extract information on the rapid growth of plantation forests and distinguish them from natural forests, which provides a fast and effective method for long time and large area plantation forest identification and spatio-temporal distribution information extraction and (2) revealing the spatio-temporal distribution information and change characteristics of plantation forests in Guangxi within 20 years, which can provide data support and decision reference for plantation forest resource investigation, management and rotation time adjustment.
2. Materials and methods
2.1. Study area
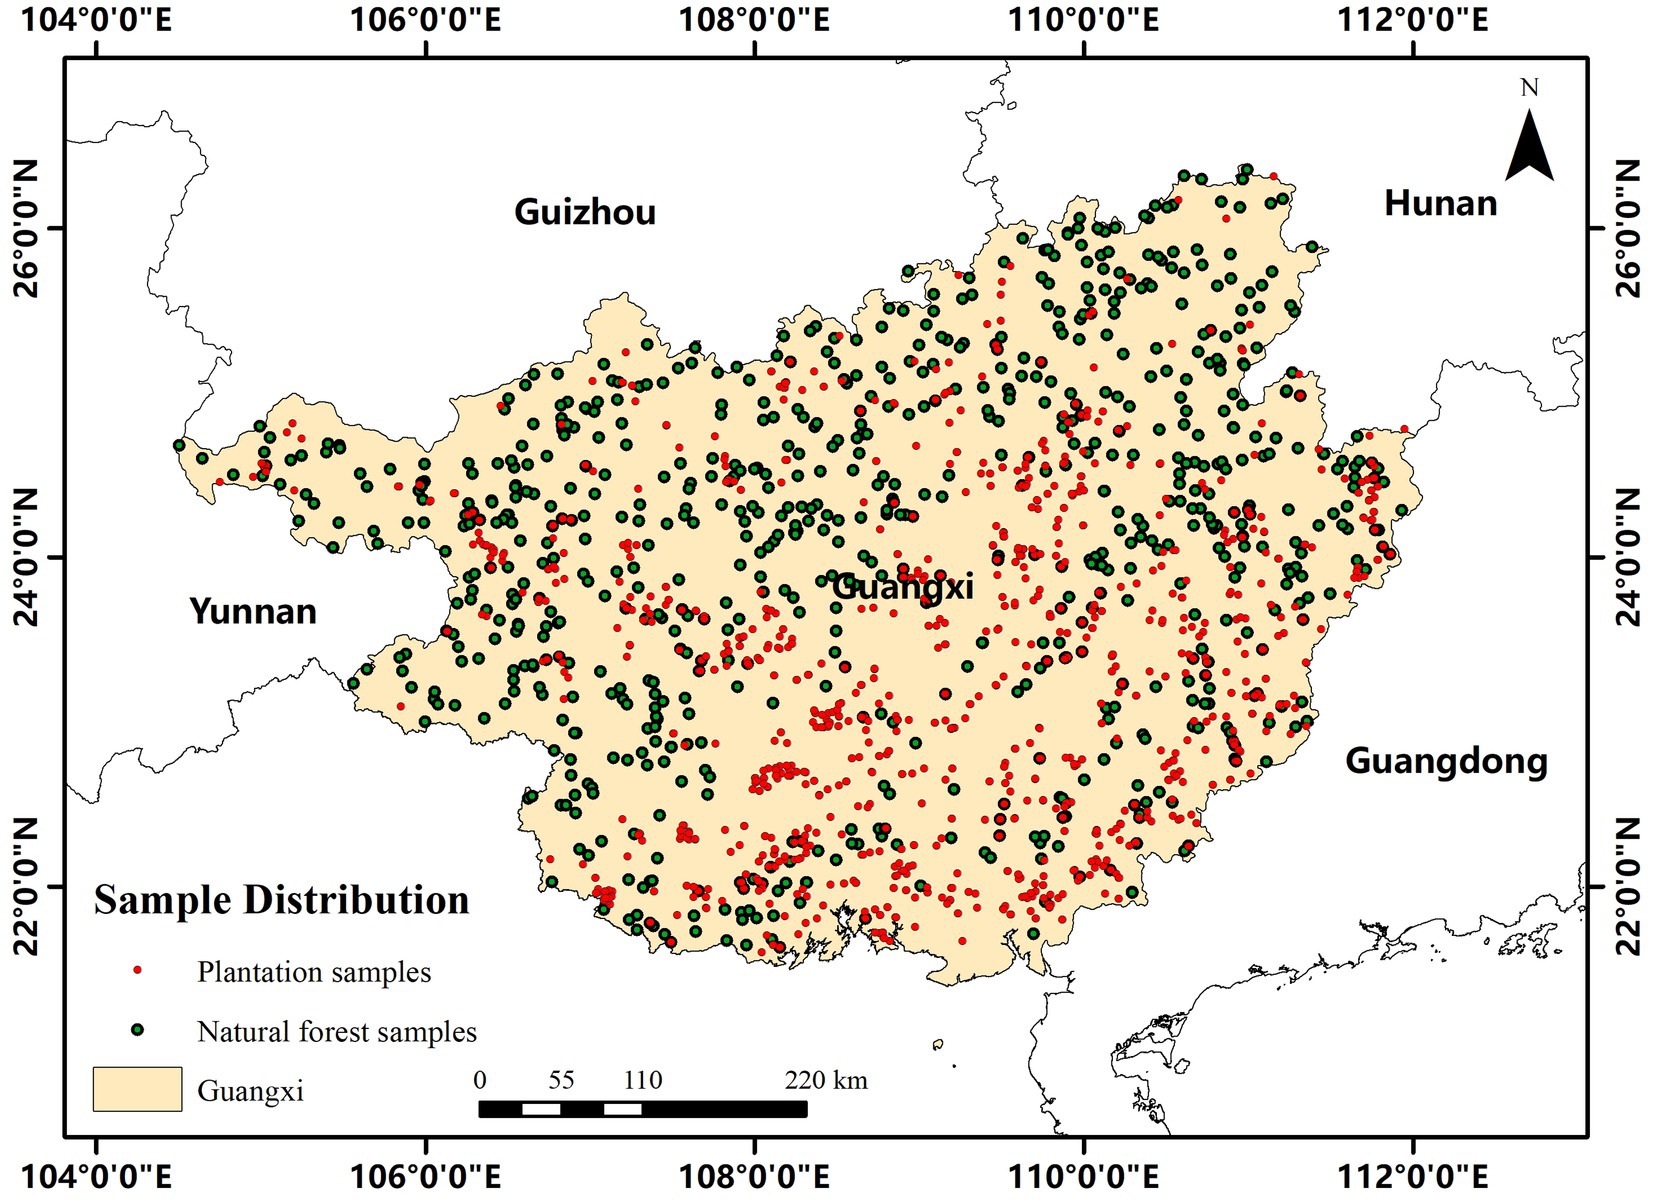
Guangxi Zhuang Autonomous Region (104°28′-112°04′ E, 20°54′-26°23’ N, Figure 1) is a provincial-level administrative region in China, located in South China, with a land area of 2.38 × 10⁵ km2. The terrain is high in the northwest and low in the southeast, surrounded by mountains and plateaus, known as “Guangxi Basin.” It belongs to subtropical monsoon climate and tropical monsoon climate, with warm climate, abundant precipitation and sufficient light. Guangxi has superior hydrothermal conditions and long tree growth season, which is suitable for the growth of various trees. Guangxi are rich in forestry land resources, and the natural conditions for the development of plantations are superior.
In the mid-1980s, Guangxi’s forest coverage rate was only 22%. Over the past 30 years, Guangxi has been reforesting an average area of about 2,666 km2 annually. Since 2012, Guangxi has continuously planted 2,000 km2 of trees every year. The forest stock volume increased from 6.40 × 10⁸ m3 in 2012 to 9.78 × 10⁸ m3 in 2021, with an average annual growth rate of 12.5%. The annual output of timber increased from 2.1 × 10⁷ m3 in 2012 to 3.9 × 10⁷ m3 in 2021, with an average annual growth of 7.1%, which made Guangxi the largest timber producing area in China. The total output value of forestry industry increased from 219.4 billion yuan in 2012 to 848.7 billion yuan in 2021, with an average annual growth rate of 16.2%. In 2018, the forest area of Guangxi is 1.48 × 10⁵ km2, with the forest coverage rate reaching 62.55%, nearly twice the national average forest coverage rate. Over 30 years, the forest area has increased by 96,000 km2 (mostly plantations), with the increase equal to nearly twice the original stock. Eucalyptus (evergreen forests) is the main type of plantations in Guangxi. Eucalyptus timber production accounts for about 70% of China. Given the abundant precipitation, the rapid increase in the evergreen plantations and the existence of a large timber industry (plantation forest logging rotation), Guangxi is very suitable to test method using plantations’ temporal features of rapid growth and harvest rotation to distinguish plantations and natural forests in rainy areas.
2.2. Data source and preprocessing
Table 1 shows the data used in this study. The imagery data used in this study were acquired from Landsat series of satellites including Landsat 5, 7, and 8 images with a total number of 15,522 from 2000-01-01 to 2020-12-31. All of the images are surface reflectance products, which contain four visible and near-infrared bands, and two short-wave infrared bands, and were processed to orthorectified surface reflectance.
The two sets of samples used in this study were derived from GlobeLand30 and Global Forest Cover, consisting of a land cover sample set and a plantations/natural forests sample set. The land cover sample points were sampled from the GlobeLand30 of 2000 and 2010 using the stratified random sampling method. GlobeLand30, a 30 m spatial resolution global land cover dataset (Chen, J et al., 2021), includes a total of 10 primary types, namely: cultivated land, forest, grassland, shrubland, wetland, water bodies, tundra, artificial surfaces, bareland, and permanent snow and ice. The dominant land cover in Guangxi is forest, followed by cultivated land. Grassland and shrubland account for a small amount in Guangxi, and water bodies and artificial surfaces are even less. Wetlands, tundra, bareland, and permanent snow and ice are almost non-existent in Guangxi. Moreover, the main object of this study are plantations which are one type of forests, therefore in the land cover classification section, the samples from GlobeLand30 were simply divided into five categories: farmland, forest, grassland, water, and artificial surface.
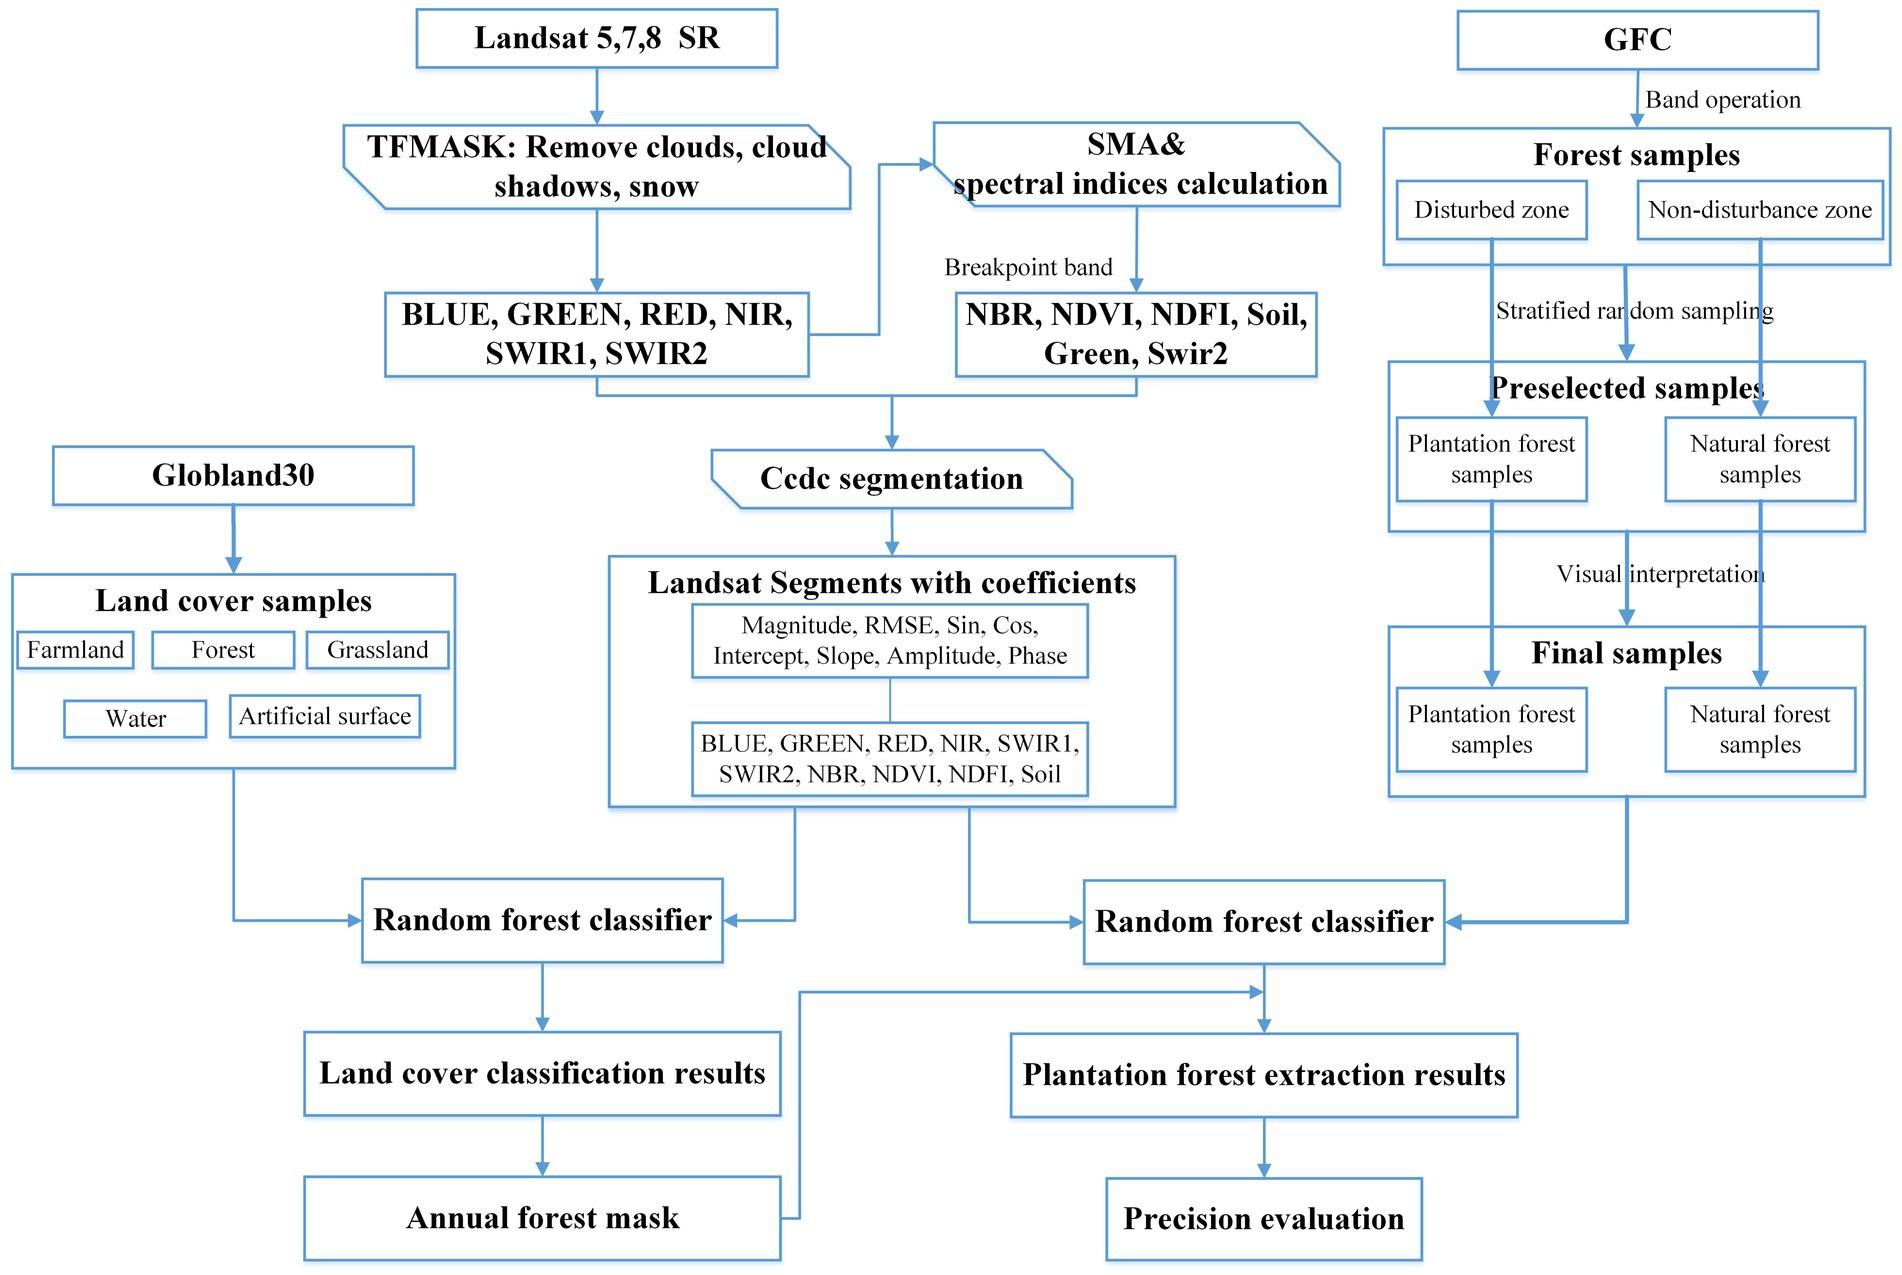
Samples of plantations and natural forests were obtained using the Global Forest Change product (Hansen Global Forest Change v1.9 2000–2021, GFC) developed by M.C. Hansen’s team at the University of Maryland (Hansen et al., 2013). The method for generating pre-selected sample points using the GFC is shown in the top right of Figure 2. First, the “treecover” band of the GFC product was used to produce a mask of the forest coverage. Second, the forest coverage area was divided into two complementary class layers by intersecting the “loss” band and the “gain” band. The two class layers are “Both Loss&Gain” (logging rotation will result in both “loss” and “gain” in plantation areas) and “Not Both.” Third, a stratified random sampling method was applied to generate two types of pre-selected sample points. Finally, the sample points were filtered and validated based on high-resolution satellite imagery from the Google Earth Pro platform. Combined with priori knowledge from ground surveys, plantation sample points were identified on the basis of three characteristics: (1) signs of logging rotation (“plantation – bare soil – plantation” time serial characteristics), (2) regular plantation characteristics, and (3) signs of artificial work.
2.3. Methods
The research framework (Figure 2) was divided into four steps: (1) spectral indices calculation: de-clouding and index calculation of Landsat surface reflectance data, (2) CCDC breakpoint detection and segment fitting: temporal segmentation and segment fitting at the pixel level using the CCDC algorithm, (3) classification of segments: classifying land cover types to generate annual forest extent, and then masking with forest extent to annually classify plantations and natural forests, and (4) validation of the accuracy of the plantations’ extraction results.
2.3.1. Spectral indices calculation
The Landsat images were pre-processed on the GEE platform, which is the world’s most advanced cloud computing platform dedicated to processing geospatial observations such as satellite imagery. Firstly, clouds, cloud shadows, water vapor and snow in the Landsat images were removed by using pixel_qa, radsat_qa, and sr_aerosol quality bands. Normalized Difference Vegetation Index (NDVI), Normalized Burn Ratio (NBR), and Normalized Difference Fraction Index (NDFI) were then calculated and integrated into the Landsat surface reflectance datasets.
NDVI (Eq. 1) is the most commonly used vegetation index, reflecting the background effects of the plant canopy, such as soil, wet ground, snow, dead leaves and roughness. The value of NDVI raises with the increasing of vegetation coverage. NDVI was widely employed to characterize vegetation phenology for mapping plantation (Wu et al., 2022). NBR enhances larger areas of fire, and is calculated similarly to NDVI (Eq. 2). Duan et al. (2022) proved that NBR outperformed NDVI, EVI, NDMI in short-rotation plantation identification. NDFI can be used to express the degree of degradation of forest vegetation and the health of the forest. The four components of NDFI were calculated through Spectral Mixing Analysis (SMA model). The SMA model assumes that the image spectra are formed by a linear combination of four pure spectra (i.e., endmembers) (Souza et al., 2005). The Landsat surface reflectance of each pixel can be decomposed into fractions of GV, NPV, Soil and Shade through SMA model, and then NDFI can be calculated by these four endmembers (see in Eqs 3, 4). NDFI enhances the degradation signal caused by selective logging and is sensitive to forest disturbance detection using CCDC (Zhang et al., 2022). As we were trying to discriminate plantations from natural forests through plantations’ temporal features of rapid growth and harvest rotation, NDFI was selected as one of the features in this study.
where is the surface reflectance of the near-infrared red band, is the surface reflectance of the red band, is the surface reflectance of short wave infrared red band, is the green vegetation endmember, is the shadow endmember, is an intermediate variable for the calculation of in equation 4, is the non-photosynthetic vegetation endmember and is the soil endmember (Erith et al., 2020).
2.3.2. Breakpoint detection and segment fitting
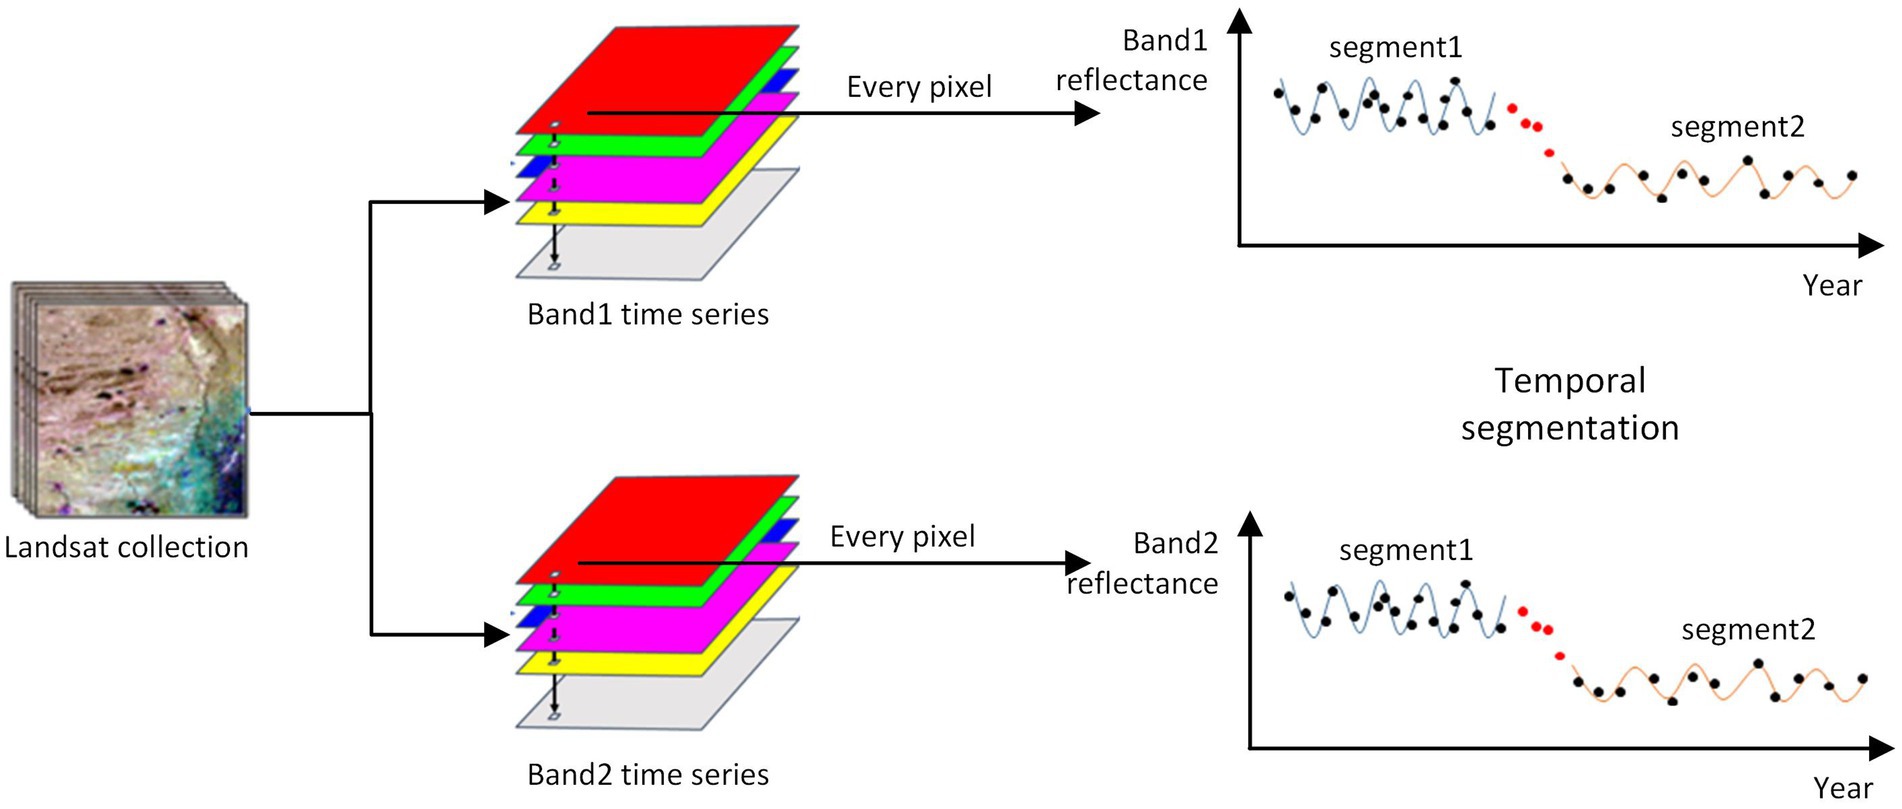
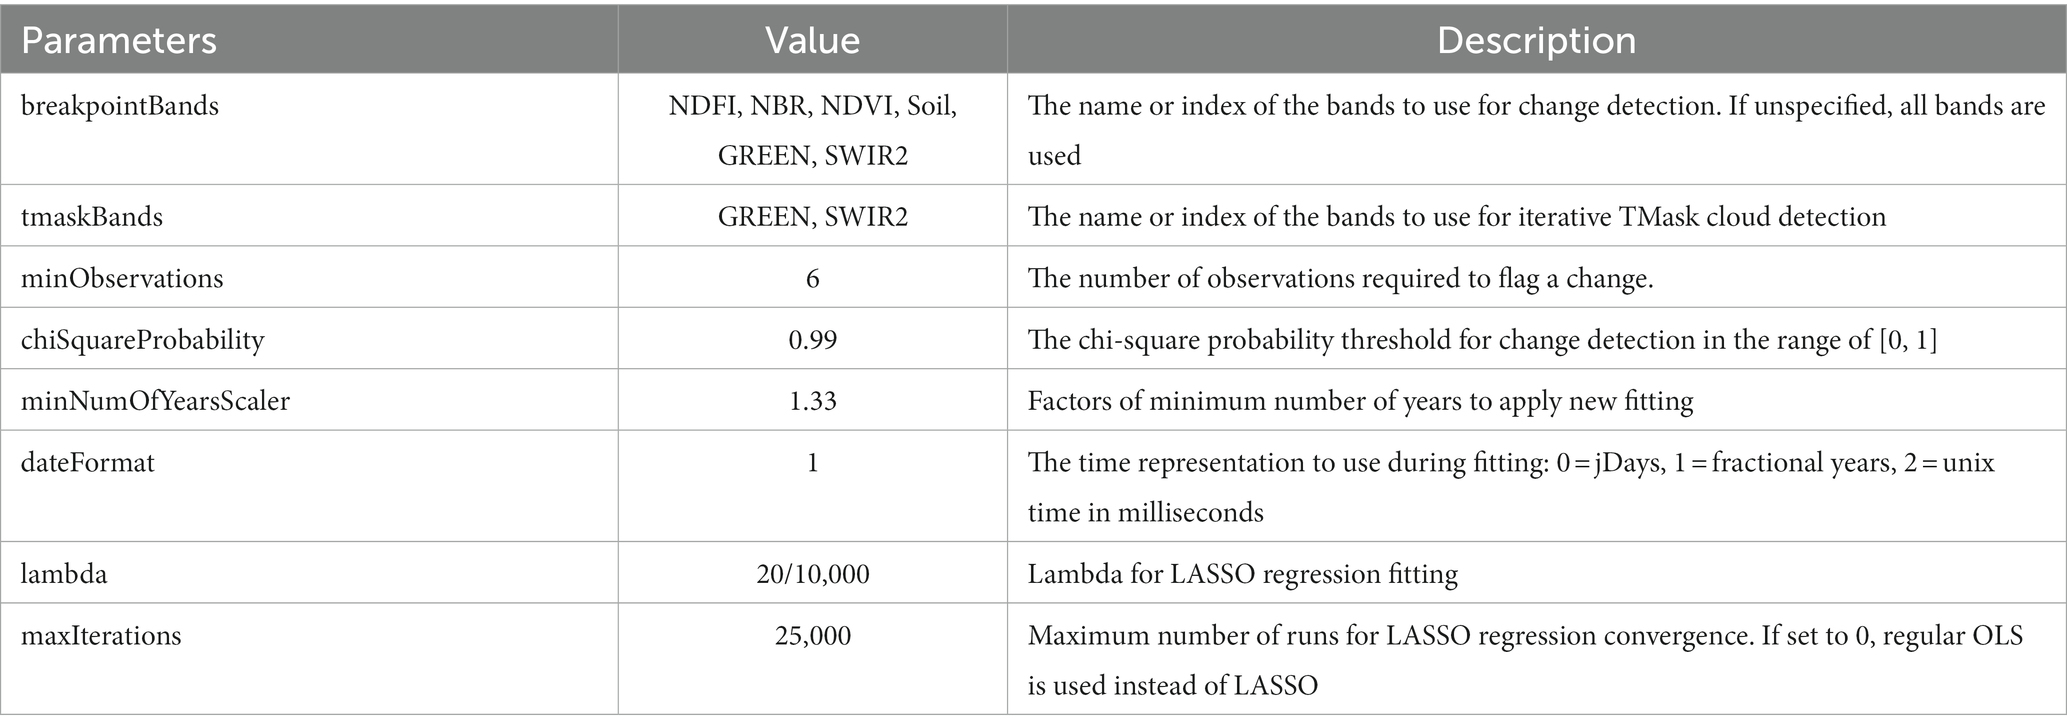
CCDC algorithm was adopted as the main algorithm for plantation extraction. The CCDC algorithm, a change detection algorithm proposed by Zhu and Woodcock (2014) in 2014, uses a harmonic model with variable coefficients to fit and predict each band or spectral index of Landsat time series at a pixel level for a given date (Figure 3). The harmonic model has three modes (four, six, and eight parameters, see Eq. 5). When the model fitting prediction differs significantly (greater than three times the RMSE) from the actual observation, anomalous slopes occur, or the first or last observation differs by three standard deviations from the model prediction during model initialization, the point is identified as a breakpoint (Zhang et al., 2022). The CCDC algorithm divides the time series of the image into a finite number of segments based on breakpoints. Each segment contains three types of coefficients: the harmonic model fitting coefficients, the spectral phase coefficients, and the breakpoint indication coefficients (Table 2). Different land cover types correspond to different CCDC coefficients, based on which plantations were extracted. The CCDC algorithm has been integrated into the API on the GEE platform and the corresponding parameters can be set to obtain the information for each segment. Table 3 explains the input parameters and the specific values for the CCDC algorithm applied in this study.
where is the Julian date, is the ith Landsat band or vegetation index, is the number of days per year (i.e., 365), is the coefficient for overall value for the ith Landsat band or vegetation index, is the coefficient for inter-annual change for the ith Landsat band or vegetation index, , , , , and are coefficients for intra-annual change for the ith Landsat band or vegetation index and is the predicted value for the ith Landsat band or vegetation index at Julian date x. The equation 5 has three modes (four, six, and eight parameters). In the four-parameter mode, , , and are set to zero. In the six-parameter mode, and are set to zero. In the eight-parameter mode, all of the eight parameters are used. We chose the eight-parameter mode in this study.
2.3.3. Classification and validation
The random forest classifier was adopted for land cover classification and then plantation extraction. The features in Table 4 were used as features for the classification. As CCDC algorithm generated a fitted model for every band or index, there were 154 features used for classification (the number of band/spectral indices multiplies the number of CCDC coefficients and adds the number of auxiliary bands).
Land cover classification was first performed to generate annual forest extends, with sample points from five categories (farmland, forest, grassland, water and artificial surface) in 2000 as the training set and those in 2010 as the validation set. The forest extent mask was then used to extract forest coverage. Plantations and natural forests were classified in the forest extent. The plantations/natural forests samples were divided by the proportion of 7:3 into training and validation sets. As the timestamps for all the plantation and natural forest samples were 2016, the result accuracy of the plantation extraction in 2016 were validated by confusion matrix.
3. Results
3.1. Validation of land cover classification and plantation extraction
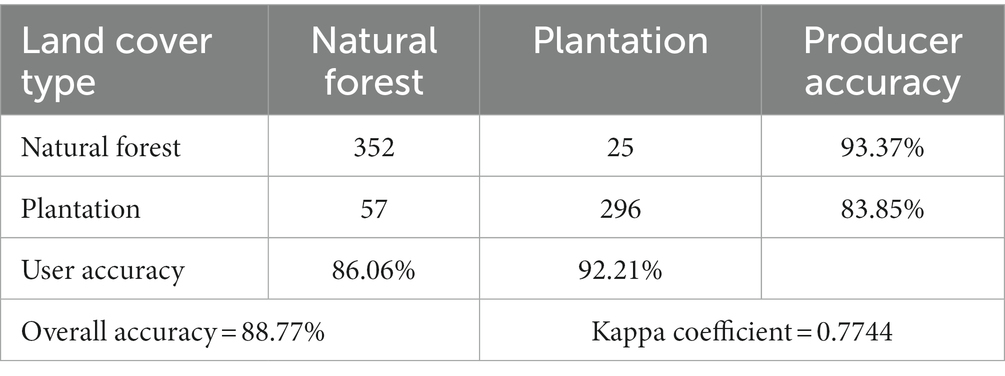
To test the applicability of CCDC for plantation forest extraction, we evaluated the accuracy of the classification results. Table 5 is the confusion matrix of land cover classification results in Guangxi in 2010. As shown in Table 5, the overall accuracy is 87.83%, among which the user accuracy of the forest type is 90.54%, and the producer accuracy of the forest type is 94.77%. The accurate forest extraction can provide an effective forest range mask for plantation extraction. Table 6 shows the accuracy evaluation of plantation extraction results in 2016. The overall accuracy of the plantation extraction results is 88.77%, with the user accuracy of 92.21% and the producer accuracy of 83.85%, both of which are relatively high. The validation results indicate that the plantation extraction method adopted in this study has high accuracy and can provide strong support for the subsequent analysis of the spatiotemporal distribution of plantation forests.
3.2. Distribution pattern of plantations
In order to investigate the changes in the distribution pattern and area of plantation forests, we annually mapped land cover from 2000 to 2020 and then calculated the area of each type, five maps of which were shown in this paper. In addition, the changes from 2000 to 2020 were also mapped. Figures 4A–E are land cover classification maps of Guangxi in 2000, 2005, 2010, 2015, and 2020, and Figure 4F shows the land cover conversion from 2000 to 2020. Figure 4 shows that the dominant land cover types in Guangxi are natural forest, farmland and plantations. Figure 5A is the annual area ratio graph of 6 land cover types. Figures 5B,C show the area changes of all the land cover types. As shown in Figure 5, from 2000 to 2020, the area of natural forests was the largest, followed by the area of farmland, both of which decreased year by year. On the contrary, the area of plantations was increasing in the general trend, except for the last year which decreased. The area changes of grassland and water land cover types are not obvious, while the area of artificial surface has increased a little.
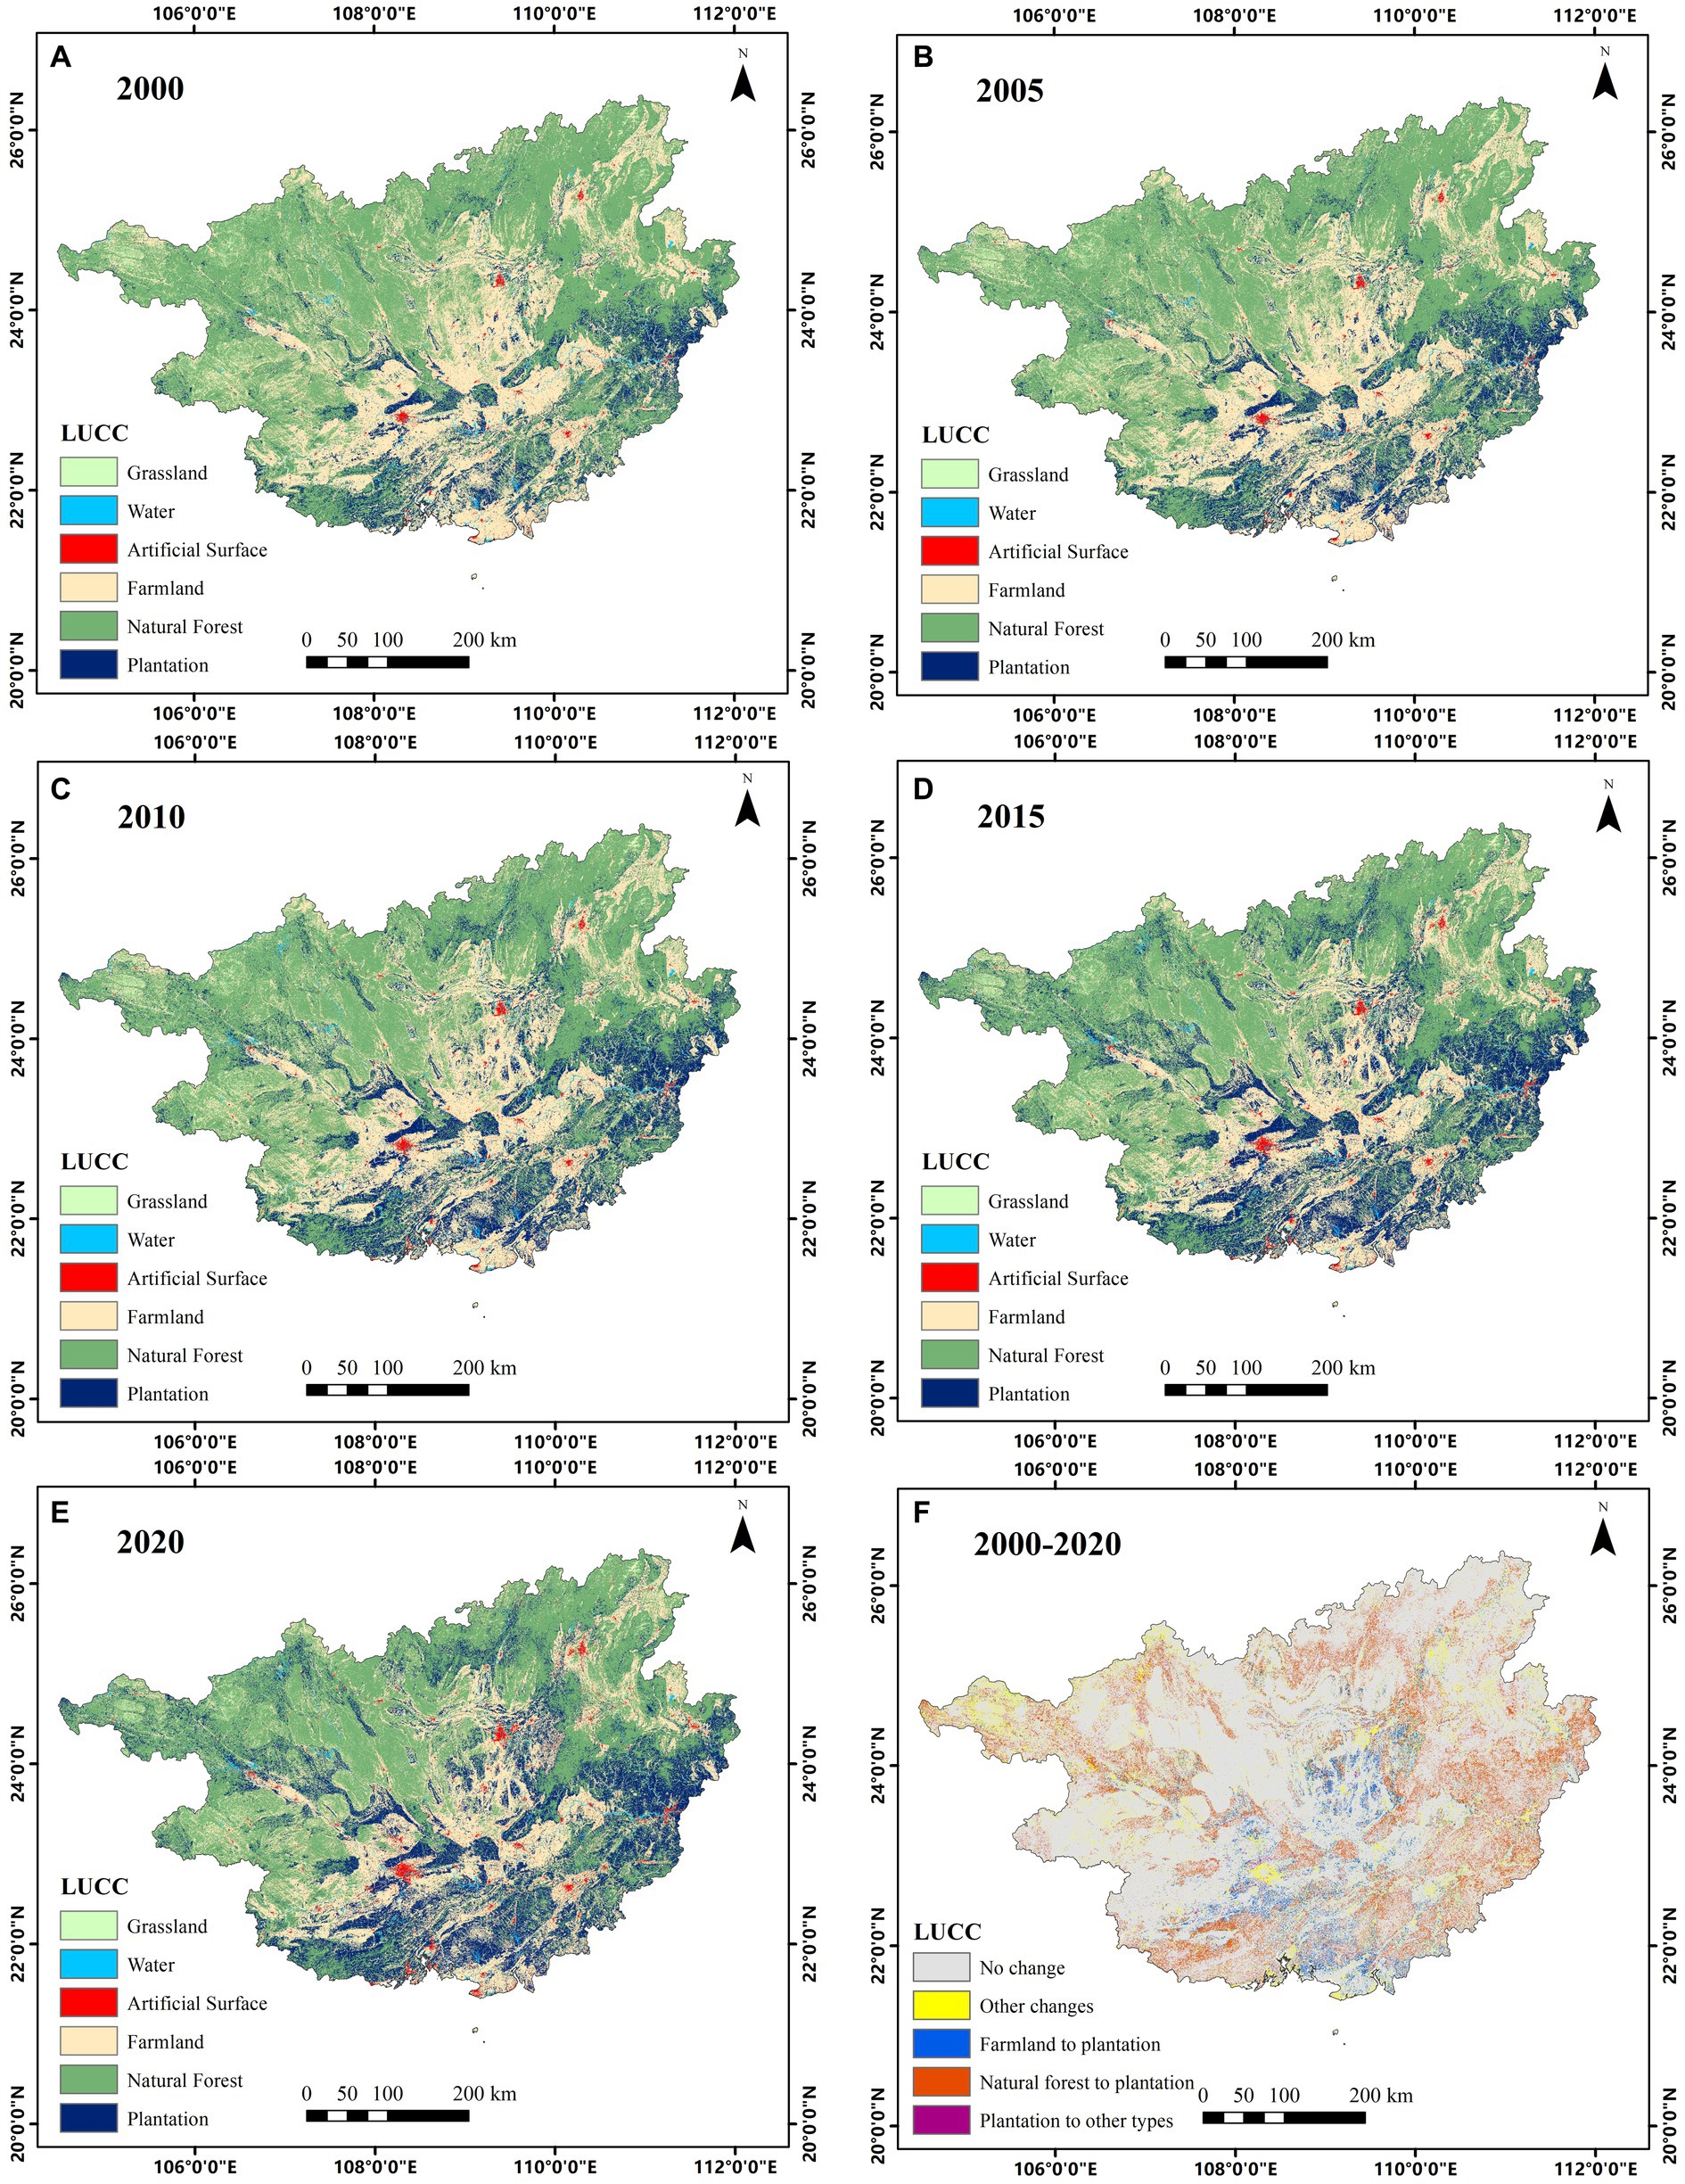
Figure 4. The land cover classification maps and the land cover change map in Guangxi from 2000 to 2020. (A) The land cover classification map in 2000. (B) The land cover classification map in 2005. (C) The land cover classification map in 2010. (D) The land cover classification map in 2015. (E) The land cover classification map in 2020. (F) The land cover change map from 2000 to 2020.
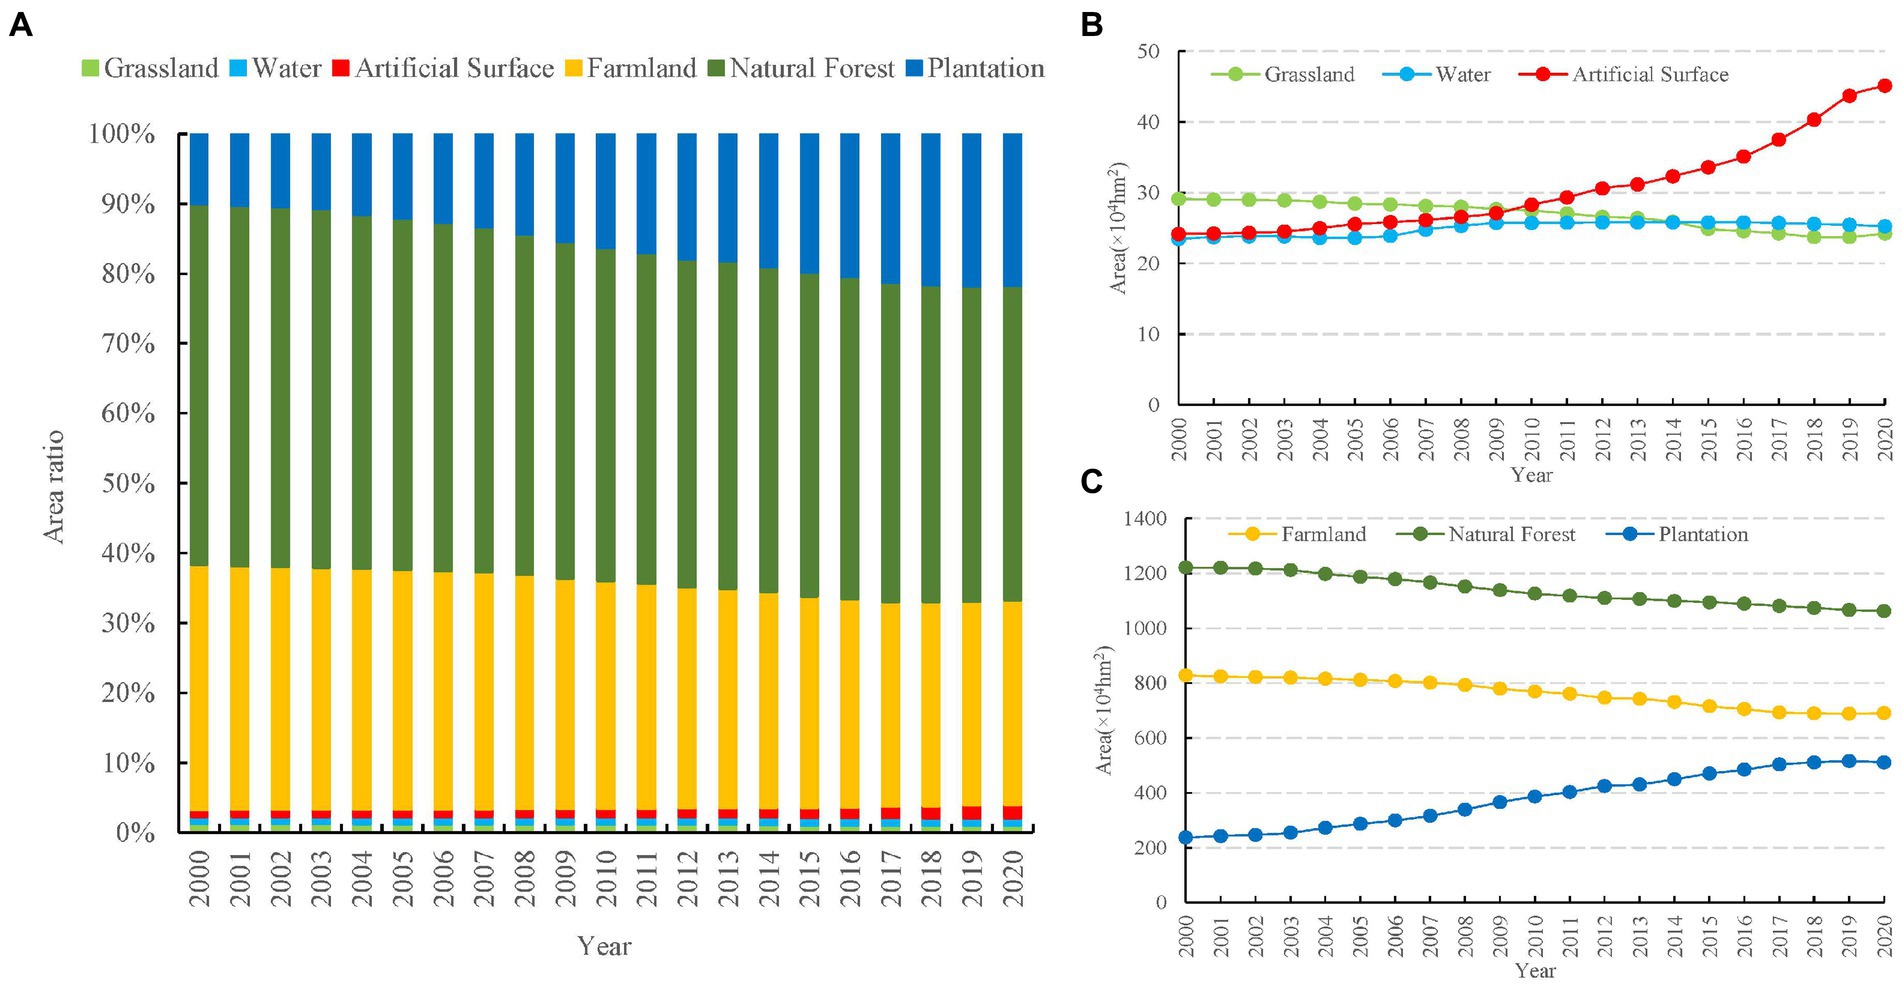
Figure 5. The area change graphs of 6 land cover types in Guangxi from 2000 to 2020. (A) The area ratio of 6 land cover types from 2000 to 2020. (B) The area change graph of grassland, water and artificial surface. (C) The area change graph of farmland, natural forest and plantation.
As shown in Figures 4A–E, the forest (natural and plantation forests) coverage rate of Guangxi is high and increasing year by year, with the forest distributed around the border of Guangxi and gradually extending to the central part of Guangxi. The farmland is radially distributed from the central part of Guangxi to the surrounding area. Over the past 20 years, the area of farmland has gradually reduced from 8.29 × 10⁶ ha in 2000 to 6.90 × 10⁶ ha in 2020 (shown in Figure 5C). Accordingly, Figure 4F shows that a large number of farmland and natural forests were transformed into plantations, which is closely related to the “Grain-for-Green” program and logging rotation in Guangxi.
In 2000, plantation forests were mainly distributed in central, southern and eastern parts of Guangxi, a small number of which were in the north, with a total area of 2.37 × 10⁶ ha. In 2005, the density of plantation forests in the central and southern Guangxi increased a bit on the original basis, with the area increasing to 2.87 × 10⁶ ha. In 2010 and 2015, plantations distributed in the central, southern, and eastern parts significantly increased and extended to the north, with the area of 3.86 × 10⁶ ha and 4.70 × 10⁶ ha, respectively. By 2020, the area of plantations has reached 5.11 × 10⁶ ha, which is 2.16 times that of 20 years ago.
3.3. Analysis of spatiotemporal changes in plantations
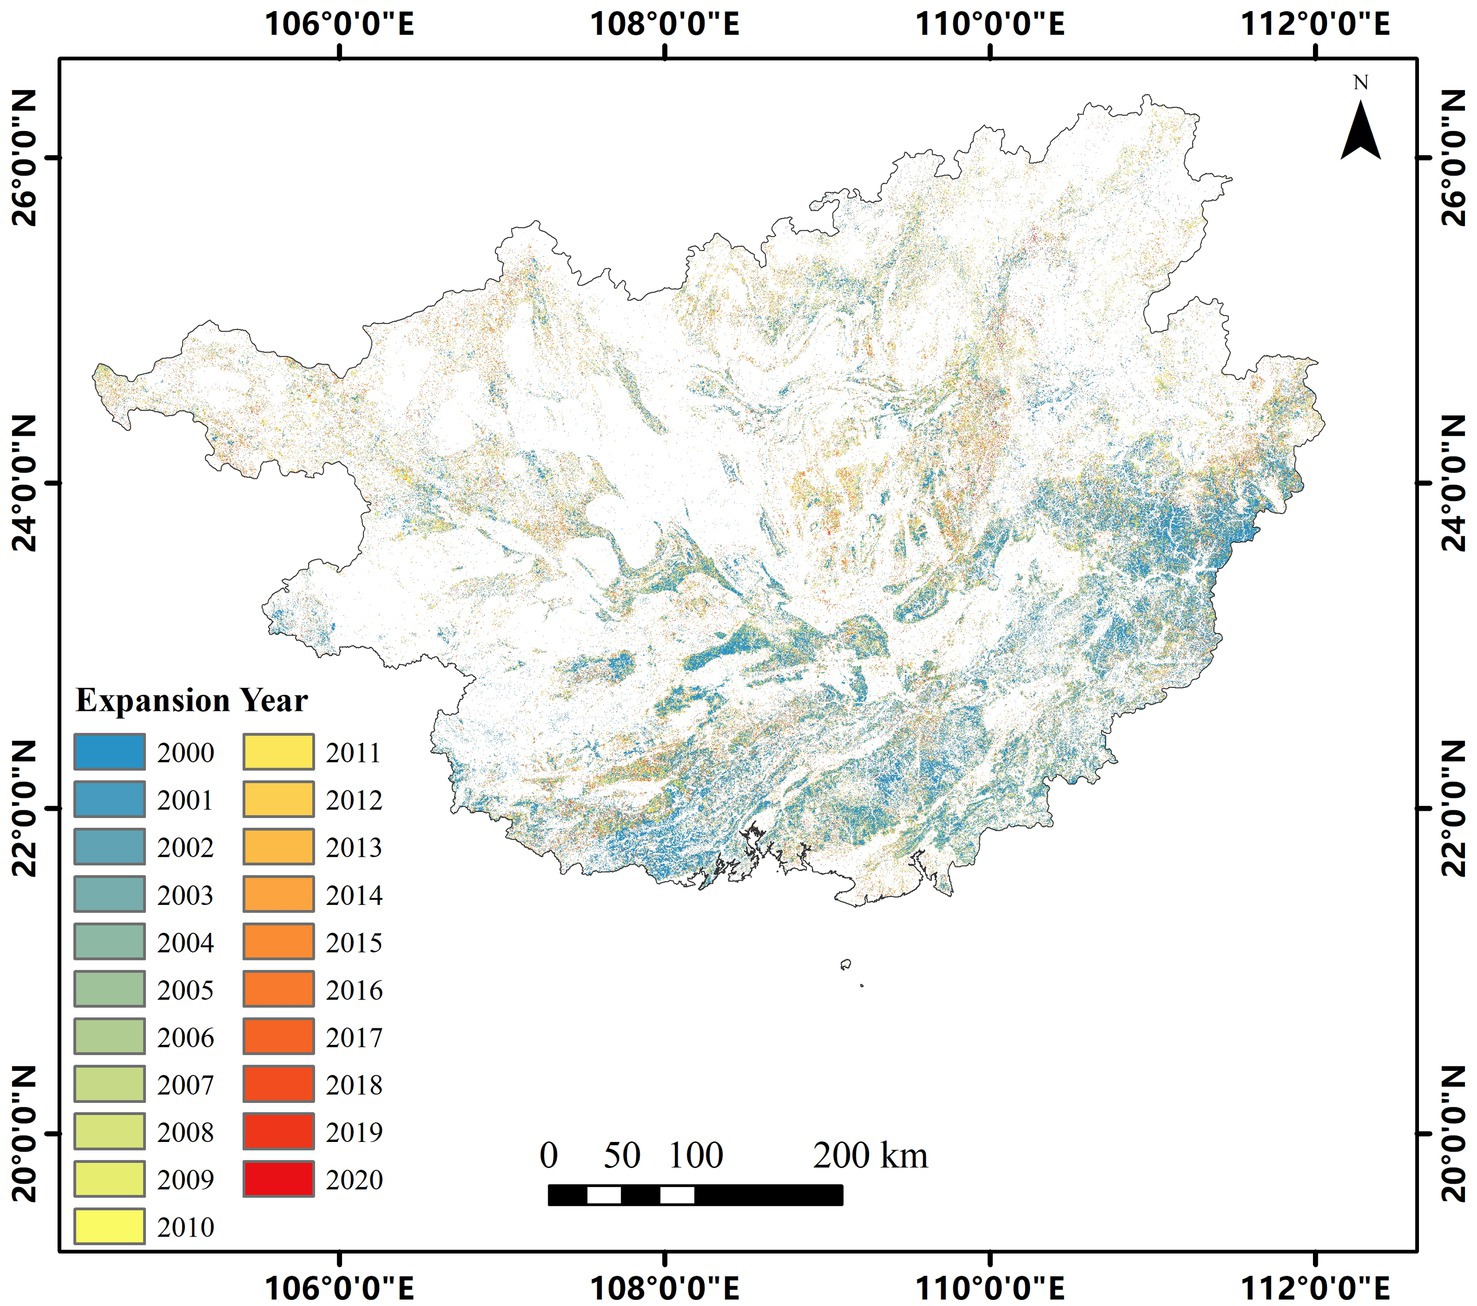
To describe plantations in a finer perspective, we mapped the year and frequency of plantation expansion. Figure 6 shows the annual distribution map of the initial expansion years of plantations from 2000 to 2020. The values in the map indicate the year when the land cover of the pixel was first converted into plantations. Among them, the value of 2000 represents the surviving plantations in Guangxi as of 2000. Over the past 20 years, plantations in Guangxi have clearly shown a tendency to expand from the southeast to the northwest. As of 2000, plantations were mainly distributed in the central and southeastern parts of Guangxi, which were in a larger density and distributed in patches. By contrast, the degree of fragmentation of plantations in the north and northwest was higher, because the northwest and northern regions are characterized by karst terrain, rocky desertification, and fragile ecological environment, which is not conducive to the growth of plantations. After 2000, the plantations in the central, southern, and eastern regions continued to increase on the basis of the original plantations, while the plantation forests in the northern and western regions grew in a scattered and slow manner.
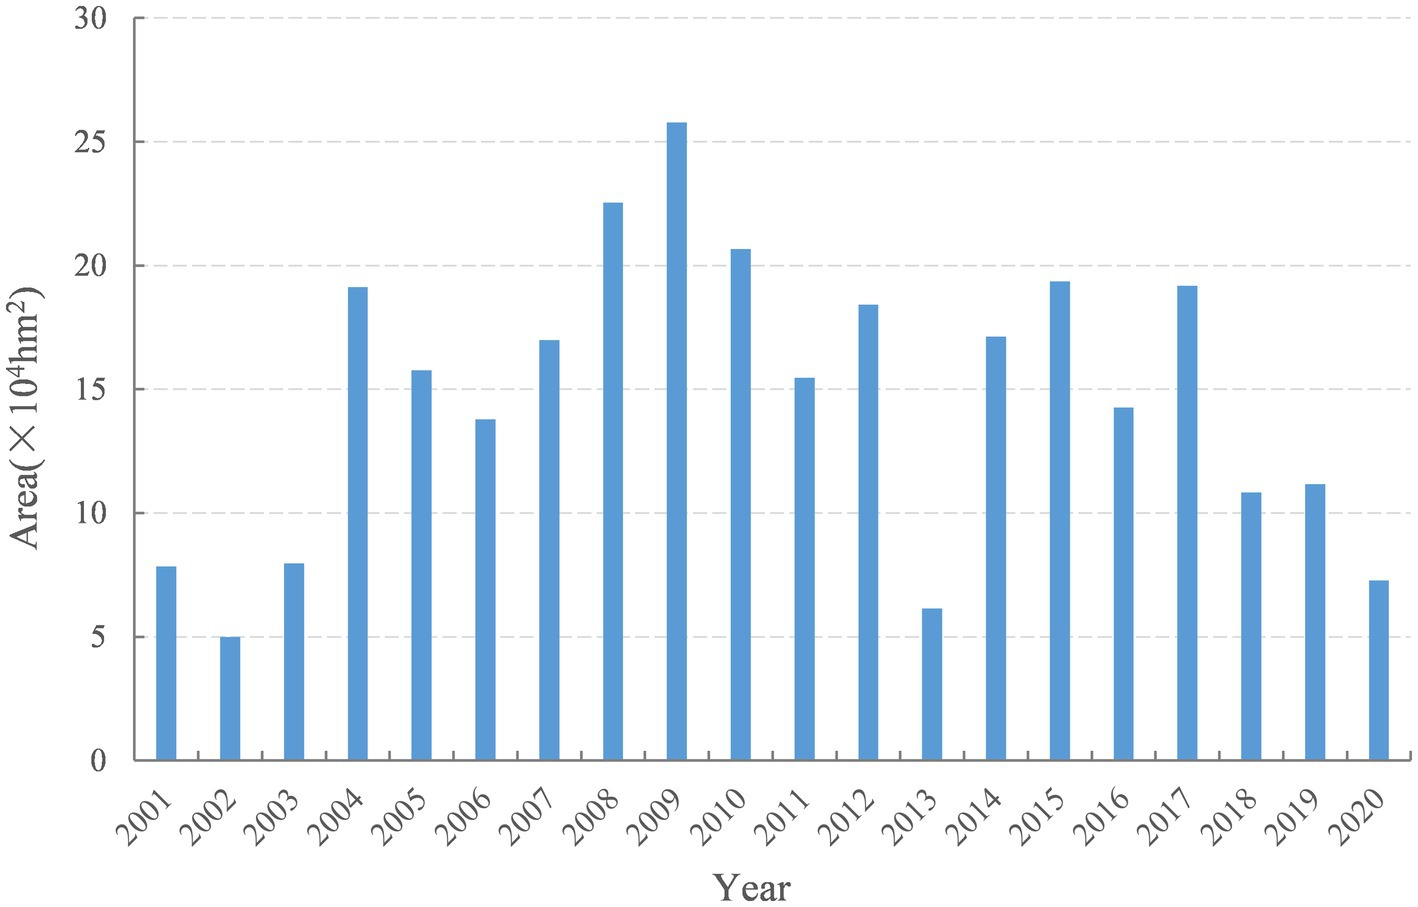
Figure 7 shows the chart map of the expansion area of Guangxi’s plantations from 2000 to 2020, representing the total area of plantations which first expanded in that year. In the past 20 years, the year with the least expansion area of plantations was 2002, with about 4.99 × 10⁴ ha, and the year with the most expansion area was 2009, with about 2.58 × 10⁵ ha. The area of the first expansion into plantation forests shows a fluctuating state, but all are positive, indicating that in addition to the original plantation forests, new plantation forest land in Guangxi expanded every year.
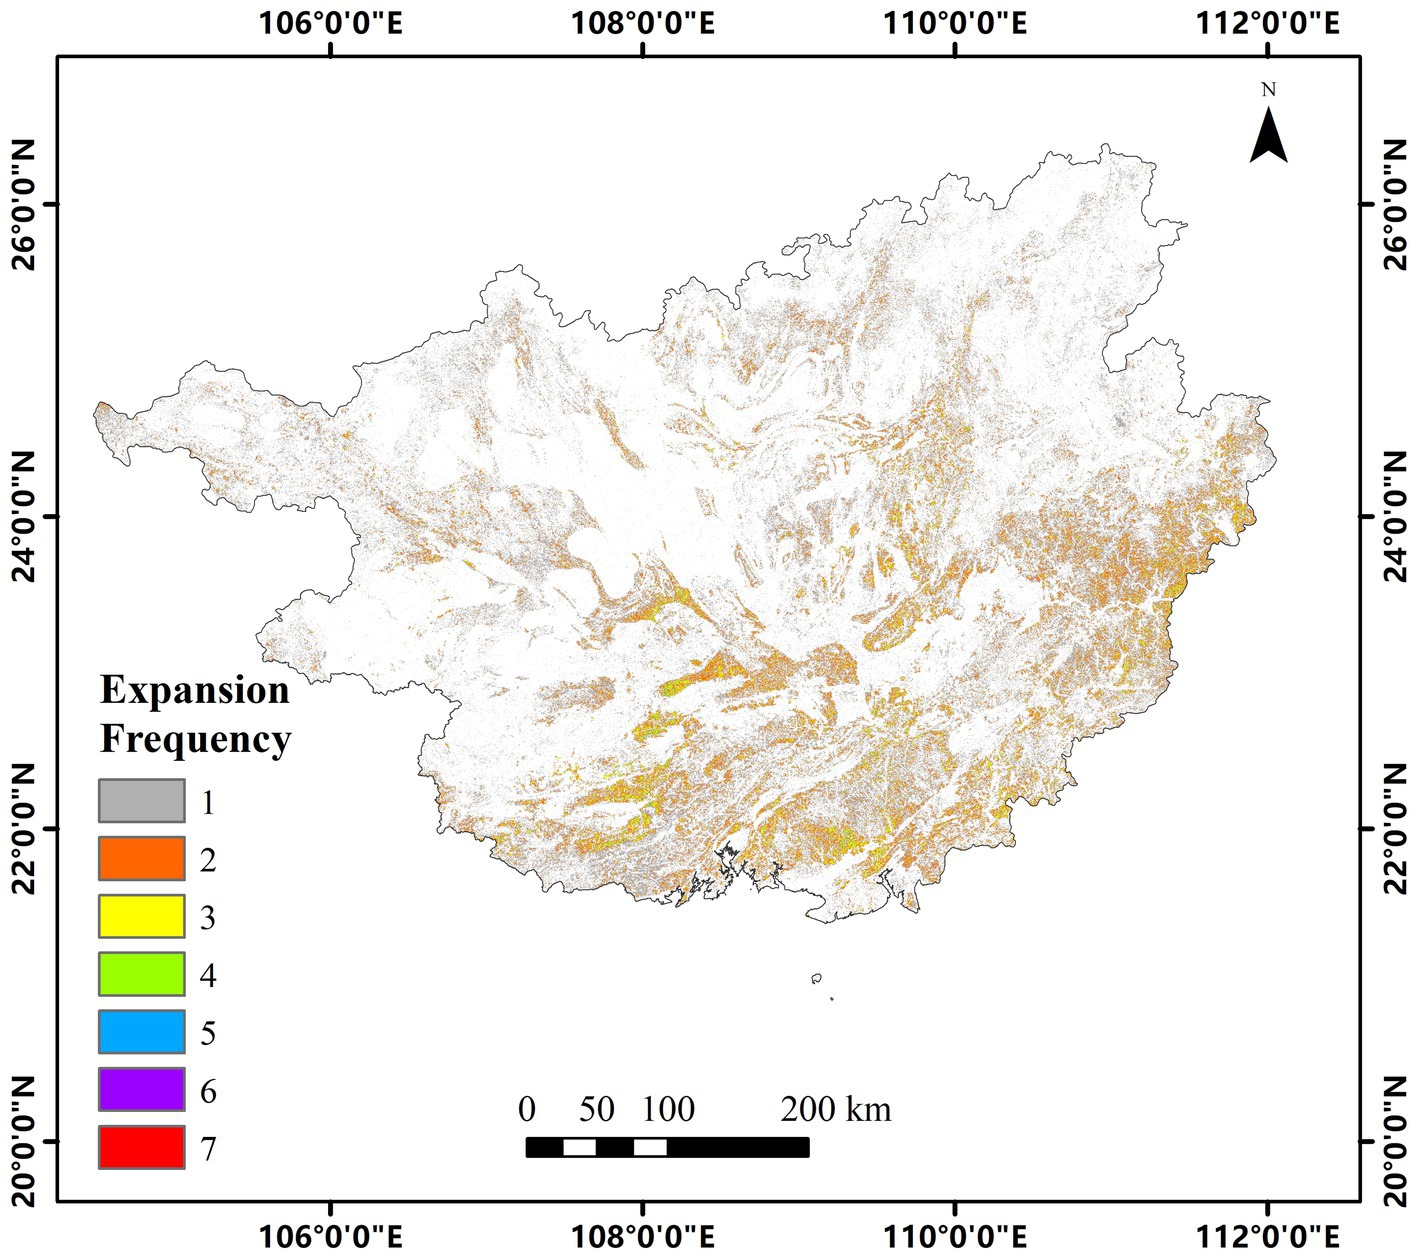
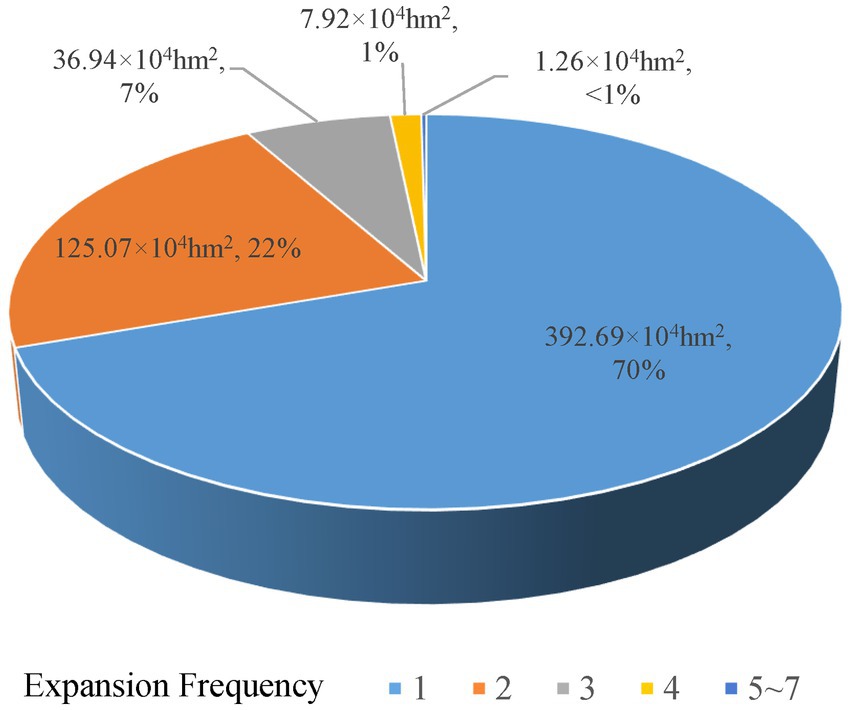
Figure 8 shows the number of times the land cover type changed to plantation forests from 2000 to 2020. If this value is greater than 1, it corresponds to the number of logging-and-replantation events in the past 20 years. For instance, value 2 indicates that the pixel was once harvested as plantations and replanted subsequently, and value 3 indicates such events happened twice. Logging-and-replantation most frequently occurred in central, southern and eastern Guangxi, which is consistent with the areas where plantation forests are distributed in patches shown in Figure 4, indicating that logging rotation events more intensively occur in areas with dense plantation forests. Figure 9 shows the percentage of plantation expansion times. The expansion frequency value of 1 indicates that an area of 3.93 × 10⁶ hm2 of land has been converted to plantations once in 20 years, accounting for 70% of all plantation areas. The value 2 indicates that an area of 1.25 × 10⁶ hm2 of land has been converted to plantations 2 times, showing one logging-and-replantation event. As shown in Figure 9, 30% of the land that has been converted to plantation forests was transformed into plantations at least 2 times, which means that 30% (1.71 × 10⁶ hm2) of plantation forests have been harvested and replanted at least once over 20 years.
4. Discussion
In this paper, based on the CCDC algorithm, we used all available Landsat data from 2000 to 2020 to distinguish between plantations and natural forests in Guangxi and describe the expansion years and replanting times of plantations. Applying the CCDC algorithm to plantation forest extraction has the following advantages: (1) The characteristics to discriminate plantation forests from natural forests are derived from the parameters of the CCDC fitting curve, which are different from the spectral, textural or phenological features used in most previous studies. Plantations and natural forests both belong to the forest land cover type, therefore, little difference in spectral or texture features can be detected when using medium-resolution optical satellite data, resulting in hard work to difference the two types. Hence, in previous studies of small areas, high spatial resolution images or optical images fused with LiDAR were frequently used (Fagan et al., 2018; Wu et al., 2022). In large-area studies using only medium-resolution satellites, phenological features are commonly used to extract plantation forests with significant deciduous periods such as rubber forests (Li et al., 2015; Xiao et al., 2019; Yang et al., 2021; Xiong et al., 2022). In contrast, the plantation forests in Guangxi are mainly evergreen forests such as fir, horsetail pine, and eucalyptus, thus they do not have obvious phenological characteristics enough to distinguish them from natural forests. Fortunately, plantation forests are characterized by rapid inter-annual variation in growth due to artificial planting, which is very different from the more slow-growing natural forests. The CCDC algorithm can precisely describe the change trend of pixels (Zhu and Woodcock, 2014), which can be used to more accurately identify plantations, (2) The CCDC algorithm uses all available images with less cloud at the pixel scale, which can greatly improve the utilization of partially cloudy images and reduce the influence of clouds and rain on the classification, thus resulting in more conducive recognition of plantation forests in large areas. Cases are often mentioned in previous studies sorely using optical satellites that cloud and rain contaminated pixels lead to less available data and limitations in classification accuracy and study regions (Wu et al., 2022), and (3) The entire experiment ran on the GEE platform, including preprocessing, segmentation, classification and spatiotemporal distribution description. GEE platform is the world’s most advanced cloud computing platform dedicated to processing geospatial observations such as satellite imagery. The GEE cloud database integrates nearly 40 years of historical archived data from the Landsat series of satellites, providing individual users with strong computing power and cloud storage, as well as a fast and easy JavaScript language API interface for data processing, algorithm implementation, and result analysis (Dong et al., 2016; Gorelick et al., 2017). The area of Guangxi is 2.38 × 10⁵ km2, and a total of 15,522 Landsat images were used. In this study, GEE platform’s massive cloud storage and fast calculation speed provided much support to process such a large volume of data.
To further improve the classification accuracy and provide a finer description of the dynamic change of plantations, improvements can be made in the following directions: (1) In this study, plantation and natural forest samples from 2016 were used for classification training and accuracy validation of plantation extraction, while the study period in this paper is up to 20 years, and using samples from one single year may affect the classification accuracy due to inadequate samples. Therefore, samples of plantation forests and natural forests in different years should be added to improve the completeness of the samples in future research work and (2) We discussed the inter-annual variation of plantation forests in this paper. Actually, the fitted model of CCDC algorithm can describe the intra-annual variation, and thus the time of plantation expansion can be further accurate to months. Therefore, the changes of plantation forests on a regular basis of every 6 months or every month can be explored.
5. Conclusion
In this study, the CCDC algorithm was used to extract plantations in Guangxi and explore their spatial and temporal dynamic changes from 2000 to 2020. The following conclusions are obtained:
1. The overall accuracy of the plantation extraction is 88.77%, with the user accuracy of 92.21% and the producer accuracy of 83.85%, which proves that CCDC fitting coefficients are effective to discriminate plantations from natural forests.
2. Plantations in Guangxi increased significantly in the past 20 years. The area of plantations in Guangxi has increased from 2.37 × 10⁶ ha in 2000 to 5.11 × 10⁶ ha in 2020, 2.16 times that of 20 years ago.
3. Guangxi is expanding new plantation land every year. The year with the most expansion of plantations was 2009, about 2.58 × 10⁵ ha. Plantation harvest rotation events occurred more frequently in densely distributed areas. Over 20 years, 30% of plantations have experienced at least one logging-and-replanting rotation event.
Data availability statement
The original contributions presented in the study are included in the article/supplementary material, further inquiries can be directed to the corresponding author.
Author contributions
QZ: methodology, data curation, software, formal analysis, visualization, writing – original draft, and writing – review and editing. LW: methodology, writing – review and editing, funding acquisition, and project administration. FT: visualization and writing – review and editing. SZ: validation and writing – review and editing. NH and KZ: writing – review and editing. All authors contributed to the article and approved the submitted version.
Funding
This work was supported by the National Key Research and Development Program of China (grant no. 2021YFE0117900) and the National Natural Science Foundation of China (grant no. U2244230).
Acknowledgments
The authors thank the USGS, Google Earth Engine and Google Earth Pro for providing data and calculation power. In addition, the authors thank Wensheng Duan and Yangjian Zhang for their encouragement and assistance.
Conflict of interest
The authors declare that the research was conducted in the absence of any commercial or financial relationships that could be construed as a potential conflict of interest.
Publisher’s note
All claims expressed in this article are solely those of the authors and do not necessarily represent those of their affiliated organizations, or those of the publisher, the editors and the reviewers. Any product that may be evaluated in this article, or claim that may be made by its manufacturer, is not guaranteed or endorsed by the publisher.
References
Azizan, F. A., Kiloes, A. M., Astuti, I. S., and Abdul Aziz, A. (2021). Application of optical remote sensing in rubber plantations: a systematic review. Remote Sens. 13:429. doi: 10.3390/rs13030429
Bonan, G. B. (2008). Forests and climate change: Forcings, feedbacks, and the climate benefits of forests. Science 320, 1444–1449. doi: 10.1126/science.1155121
Brockerhoff, E. G., Jactel, H., Parrotta, J. A., Quine, C. P., and Sayer, J. (2008). Plantation forests and biodiversity: oxymoron or opportunity? Biodivers. Conserv. 17, 925–951. doi: 10.1007/s10531-008-9380-x
Chen, J., Chen, L., Chen, F., Ban, Y., Li, S., Han, G., et al. (2021). Collaborative validation of globe land 30: methodology and practices. Geo Spat. Inf. Sci. 24, 134–144. doi: 10.1080/10095020.2021.1894906
Chen, H., Chen, C., Zhang, Z., Lu, C., Wang, L., He, X., et al. (2021). Changes of the spatial and temporal characteristics of land-use landscape patterns using multi-temporal Landsat satellite data: a case study of Zhoushan Island, China. Ocean Coast. Manag. 213:105842. doi: 10.1016/j.ocecoaman.2021.105842
Chen, C., Liang, J., Yang, G., and Sun, W. (2023). Spatio-temporal distribution of harmful algal blooms and their correlations with marine hydrological elements in offshore areas, China. Ocean Coast. Manag. 238:106554. doi: 10.1016/j.ocecoaman.2023.106554
Deng, L., Liu, G.-B., and Shangguan, Z.-P. (2014). Land-use conversion and changing soil carbon stocks in China's ‘grain-for-green’ program: a synthesis. Glob. Chang. Biol. 20, 3544–3556. doi: 10.1111/gcb.12508
Dong, J., Xiao, X., Menarguez, M. A., Zhang, G., Qin, Y., Thau, D., et al. (2016). Mapping paddy rice planting area in northeastern Asia with Landsat 8 images, phenology-based algorithm and Google earth engine. Remote Sens. Environ. 185, 142–154. doi: 10.1016/j.rse.2016.02.016
Duan, W., Chen, Y., Wang, L., Huang, N., He, Y., Zhang, C., et al. (2022). Information extraction of temporal and spatial distribution of short-rotation plantations in Guangxi Zhuang autonomous region. National Remote Sens. Bull. 1–12. doi: 10.11834/jrs.20221059
Erith, M., Alfonso, Z., and Erik, L. (2020). "A multi-sensor approach to separate palm oil Plantations from Forest cover using NDFI and a modified Pauli decomposition technique", in: IGARSS 2020–2020 IEEE International Geoscience and Remote Sensing Symposium, 4481–4484.
Fagan, M. E., Morton, D. C., Cook, B. D., Masek, J., Zhao, F., Nelson, R. F., et al. (2018). Mapping pine plantations in the southeastern US using structural, spectral, and temporal remote sensing data. Remote Sens. Environ. 216, 415–426. doi: 10.1016/j.rse.2018.07.007
Foley, J. A., DeFries, R., Asner, G. P., Barford, C., Bonan, G., Carpenter, S. R., et al. (2005). Global consequences of land use. Science 309, 570–574. doi: 10.1126/science.1111772
Gorelick, N., Hancher, M., Dixon, M., Ilyushchenko, S., Thau, D., and Moore, R. (2017). Google earth engine: planetary-scale geospatial analysis for everyone. Remote Sens. Environ. 202, 18–27. doi: 10.1016/j.rse.2017.06.031
Grogan, K., Pflugmacher, D., Hostert, P., Kennedy, R., and Fensholt, R. (2015). Cross-border forest disturbance and the role of natural rubber in mainland Southeast Asia using annual Landsat time series. Remote Sens. Environ. 169, 438–453. doi: 10.1016/j.rse.2015.03.001
Han, P., Chen, J., Han, Y., Yi, L., Zhang, Y., and Jiang, X. (2018). Monitoring rubber plantation distribution on Hainan Island using Landsat OLI imagery. Int. J. Remote Sens. 39, 2189–2206. doi: 10.1080/01431161.2017.1420933
Hansen, M. C., Potapov, P. V., Moore, R., Hancher, M., Turubanova, S. A., Tyukavina, A., et al. (2013). High-resolution global maps of 21st-century Forest cover change. Science 342, 850–853. doi: 10.1126/science.1244693
Jackson, R. B., Jobbagy, E. G., Avissar, R., Roy, S. B., Barrett, D. J., Cook, C. W., et al. (2005). Trading water for carbon with biological sequestration. Science 310, 1944–1947. doi: 10.1126/science.1119282
Kennedy, R. E., Yang, Z., Cohen, W. B., Pfaff, E., Braaten, J., and Nelson, P. (2012). Spatial and temporal patterns of forest disturbance and regrowth within the area of the northwest Forest plan. Remote Sens. Environ. 122, 117–133. doi: 10.1016/j.rse.2011.09.024
Li, P., Zhang, J., and Feng, Z. (2015). Mapping rubber tree plantations using a Landsat-based phenological algorithm in Xishuangbanna, Southwest China. Remote Sens. Lett. 6, 49–58. doi: 10.1080/2150704X.2014.996678
Lin, T., Wu, D., Yang, M., Ma, P., Liu, Y., Liu, F., et al. (2022). Evolution and simulation of terrestrial ecosystem carbon storage and sustainability assessment in karst areas: a case study of Guizhou Province. Int. J. Environ. Res. Public Health 19:16219. doi: 10.3390/ijerph192316219
Liu, X., Jiang, L., Feng, Z., and Li, P. (2016). Rubber plantation expansion related land use change along the Laos-China border region. Sustainability 8:1011. doi: 10.3390/su8101011
Mahmoud, A., Elbialy, S., Pradhan, B., and Buchroithner, M. (2011). Field-based landcover classification using TerraSAR-X texture analysis. Adv. Space Res. 48, 799–805. doi: 10.1016/j.asr.2011.04.005
Pan, Y., Birdsey, R. A., Fang, J., Houghton, R., Kauppi, P. E., Kurz, W. A., et al. (2011). A large and persistent carbon sink in the World’s forests. Science 333, 988–993. doi: 10.1126/science.1201609
Paul, K. I., Polglase, P. J., Nyakuengama, J. G., and Khanna, P. K. (2002). Change in soil carbon following afforestation. For. Ecol. Manag. 168, 241–257. doi: 10.1016/S0378-1127(01)00740-X
Razak, J. A. B. A., Shariff, A. R. B. M., Ahmad, N. B., and Ibrahim Sameen, M. (2018). Mapping rubber trees based on phenological analysis of Landsat time series data-sets. Geocarto Int. 33, 1–24. doi: 10.1080/10106049.2017.1289559
Senf, C., Pflugmacher, D., Van der Linden, S., and Hostert, P. (2013). Mapping rubber plantations and natural forests in Xishuangbanna (Southwest China) using multi-spectral Phenological metrics from MODIS time series. Remote Sens. 5, 2795–2812. doi: 10.3390/rs5062795
Song, X.-P., Hansen, M. C., Stehman, S. V., Potapov, P. V., Tyukavina, A., Vermote, E. F., et al. (2018). Global land change from 1982 to 2016. Nature 560, 639–643. doi: 10.1038/s41586-018-0411-9
Souza, C. M., Roberts, D. A., and Cochrane, M. A. (2005). Combining spectral and spatial information to map canopy damage from selective logging and forest fires. Remote Sens. Environ. 98, 329–343. doi: 10.1016/j.rse.2005.07.013
Sun, W., Liu, K., Ren, G., Liu, W., Yang, G., Meng, X., et al. (2021). A simple and effective spectral-spatial method for mapping large-scale coastal wetlands using China ZY1-02D satellite hyperspectral images. Int. J. Appl. Earth Obs. Geoinf. 104:102572. doi: 10.1016/j.jag.2021.102572
Sun, W., Ren, K., Meng, X., Yang, G., Xiao, C., Peng, J., et al. (2022). MLR-DBPFN: a multi-scale low rank deep Back projection fusion network for anti-noise Hyperspectral and multispectral image fusion. IEEE Trans. Geosci. Remote Sens. 60, 1–14. doi: 10.1109/TGRS.2022.3146296
Torbick, N., Ledoux, L., Salas, W., and Zhao, M. (2016). Regional mapping of plantation extent using multisensor imagery. Remote Sens. 8:236. doi: 10.3390/rs8030236
Trisasongko, B. H., and Paull, D. (2020). A review of remote sensing applications in tropical forestry with a particular emphasis in the plantation sector. Geocarto Int. 35, 317–339. doi: 10.1080/10106049.2018.1516245
Twisa, S., and Buchroithner, M. E. (2019). Land-use and land-cover (LULC) change detection in Wami River basin, Tanzania. Land 8:136. doi: 10.3390/land8090136
Vogelmann, J. E., Gallant, A. L., Shi, H., and Zhu, Z. (2016). Perspectives on monitoring gradual change across the continuity of Landsat sensors using time-series data. Remote Sens. Environ. 185, 258–270. doi: 10.1016/j.rse.2016.02.060
Wang, L., Chen, C., Xie, F., Hu, Z., Zhang, Z., Chen, H., et al. (2021). Estimation of the value of regional ecosystem services of an archipelago using satellite remote sensing technology: a case study of Zhoushan archipelago, China. Int. J. Appl. Earth Obs. Geoinf. 105:102616. doi: 10.1016/j.jag.2021.102616
Wu, F., Ren, Y., and Wang, X. (2022). Application of multi-source data for mapping plantation based on random Forest algorithm in North China. Remote Sens. 14:4946. doi: 10.3390/rs14194946
Xiao, C., Li, P., and Feng, Z. (2019). A renormalized modified normalized burn ratio (RMNBR) index for detecting mature rubber plantations with Landsat-8 OLI in Xishuangbanna, China. Remote Sens. Lett. 10, 214–223. doi: 10.1080/2150704X.2018.1541106
Xiong, Y., Xu, W., Huang, S., Wu, C., Dai, F., Wang, L., et al. (2022). Ecological environment quality assessment of Xishuangbanna rubber plantations expansion (1995–2018) based on multi-temporal Landsat imagery and RSEI. Geocarto Int. 37, 3441–3468. doi: 10.1080/10106049.2020.1861663
Xu, C., Morgenroth, J., and Manley, B. (2017). Mapping net stocked plantation area for small-scale forests in New Zealand using integrated RapidEye and LiDAR sensors. Forests 8:487. doi: 10.3390/f8120487
Yang, J., Xu, J., and Zhai, D.-L. (2021). Integrating Phenological and geographical information with artificial intelligence algorithm to map rubber plantations in Xishuangbanna. Remote Sens. 13:2793. doi: 10.3390/rs13142793
Zhang, P., Shao, G., Zhao, G., Le Master, D. C., Parker, G. R., Dunning, J. B., et al. (2000). China's Forest policy for the 21st century. Science 288, 2135–2136. doi: 10.1126/science.288.5474.2135
Zhang, Y., Wang, L., Zhou, Q., Tang, F., Zhang, B., Huang, N., et al. (2022). Continuous change detection and classification-spectral trajectory breakpoint recognition for Forest monitoring. Land 11:504. doi: 10.3390/land11040504
Zhu, Z. (2017). Change detection using landsat time series: a review of frequencies, preprocessing, algorithms, and applications. ISPRS J. Photogramm. Remote Sens. 130, 370–384. doi: 10.1016/j.isprsjprs.2017.06.013
Keywords: plantation, Landsat time series, continuous change detection and classification, Guangxi, plantation spatiotemporal dynamics
Citation: Zhou Q, Wang L, Tang F, Zhao S, Huang N and Zheng K (2023) Mapping spatial and temporal distribution information of plantations in Guangxi from 2000 to 2020. Front. Ecol. Evol. 11:1201161. doi: 10.3389/fevo.2023.1201161
Edited by:
Wei Song, Chinese Academy of Sciences (CAS), ChinaReviewed by:
Qunou Jiang, Beijing Forestry University, ChinaChao Chen, Suzhou University of Science and Technology, China
Chen Zeng, Huazhong Agricultural University, China
Copyright © 2023 Zhou, Wang, Tang, Zhao, Huang and Zheng. This is an open-access article distributed under the terms of the Creative Commons Attribution License (CC BY). The use, distribution or reproduction in other forums is permitted, provided the original author(s) and the copyright owner(s) are credited and that the original publication in this journal is cited, in accordance with accepted academic practice. No use, distribution or reproduction is permitted which does not comply with these terms.
*Correspondence: Li Wang, d2FuZ2xpQHJhZGkuYWMuY24=
 Quan Zhou
 Li Wang
 Feng Tang1
 Ni Huang