- 1School of Public Administration, Hebei University of Economics and Business, Shijiazhuang, China
- 2Hebei Collaborative Innovation Center for Urban-Rural Integrated Development, Hebei University of Economics and Business, Shijiazhuang, China
- 3Hebei Province Economics and Social Development Geographic Information Big Data Platform, Hebei University of Economics and Business, Shijiazhuang, China
- 4Center for Urban Sustainability and Innovation Development (CUSID), Hebei University of Economics and Business, Shijiazhuang, China
The structure and function of ecological spaces play a crucial role in resisting risk interference and providing ecological services. Conducting resilience assessments of ecological spaces is of great significance for maintaining ecological security. Taking the Baiyangdian Basin as the research object, based on the evaluation results of ecosystem service function importance and ecological environmental sensitivity, the ecological space importance level of the Baiyangdian Basin is divided. Based on the three basic characteristics of “resistance, adaptability, recoverability”, the resilience of ecological space model was constructed by selecting ecosystem service value, landscape structure stability, ecological resilience model and coefficient. The research results show that: (1) The overall importance index of ecological space in the Baiyangdian Basin is relatively low. The non-critical area accounted for 43.00% of the total area, the general area accounted for 30.78%, and the core area accounted for 26.22%, which mainly distributed in the northern part of the study area and at the confluence of rivers. (2) The proportion of areas with extremely important ecosystem service functions in Baiyangdian Basin is 31.73%, concentrated in the central and southwestern parts of the basin. The highly sensitive ecological environment areas accounted for 21.96%, mainly distributed in high-altitude areas in the northern part of the basin and river convergence areas. (3) On the whole, the overall resilience level of the study area is not high and there is a significant difference in resilience between the north and south, with 68.60% of the regions in the low level of resilience. The area with high resilience level accounted for only 1.51%, and the highest resilience level was found at river confluence. The research results provide a theoretical basis for maintaining and improving the ecological environment of the basin, and provide a basis for implementing precise policies to optimize the ecological space of the basin.
1 Introduction
Ecological space is the basic space to maintain ecosystem balance and ensure regional ecological security (Zhang and Yue, 2019). At present, climate change, socio-economic development, construction land expansion and other phenomena have brought about many problems such as water resource shortage, reduction of biological and landscape diversity, and continuous degradation of ecological functions (Liu et al., 2016; Jin et al., 2019; Gao et al., 2021; Liu et al., 2022), resulting in unreasonable distribution of ecological space, affecting the ecological environment and the well-being of residents (Liu et al., 2023). Under this background, it is urgent to change the thinking of ecological space management and control, from the perspective of restoration and management of ecological space after damage to prevention and control of ecological space before damage, and enhance the ability of ecological space to cope with the impact of uncertain risks. Resilience theory, as a dynamic approach to analyzing how systems respond to risks, provides a new perspective for ecological spaces to deal with uncertain risks (Luo et al., 2018). “Ecological space resilience” is a new attempt to combine the concept of resilience with the study of ecological space. The concept can be defined as the ability of ecological space to resist and adapt to the impact of external shocks and recover or transform from them by optimizing its structure and function. Therefore, the resilience assessment of ecological space can provide a theoretical basis for improving its resilience level and achieving sustainable development.
Ecological space originates from the term “green space” (Ngom et al., 2016). It is an important space component to maintain biodiversity, ensure ecosystem service supply and improve residents’ quality of life (Xie et al., 2015; Fabien et al., 2017; Deng et al., 2022). The follow-up research of ecological space should be based on the quantitative identification of ecological space. In recent years, the research of ecological space identification has made some progress. From the perspective of research objects, most of them focus on meso-scale and macro-scale such as urban agglomeration and municipal level, while few studies are conducted from the watershed scale (Huang et al., 2020; Wang et al., 2022). From the perspective of research, the structure and function of ecological space are mainly studied from the perspectives of ecological functions, ecological elements and ecological protection red lines (Long et al., 2015; Yu et al., 2015; Kong et al., 2019; Pan et al., 2020). From the perspective of ecological space delineation method, the main methods are land use type merging method and spatial attribute evaluation method. Among them, land use type merging method is to identify the structure of ecological space by using different land use types (Jiang and Liu, 2020; Zhao et al., 2022), but this method can draw the amount of ecological space, but it is difficult to draw the function of ecological space. Spatial attribute method is mainly used to quantitatively identify ecological space through ecosystem service function evaluation, ecological sensitivity evaluation and other methods (Jin et al., 2020). This method can more intuitively reflect the structure and function of ecological space, and is currently an important way to identify ecological space.
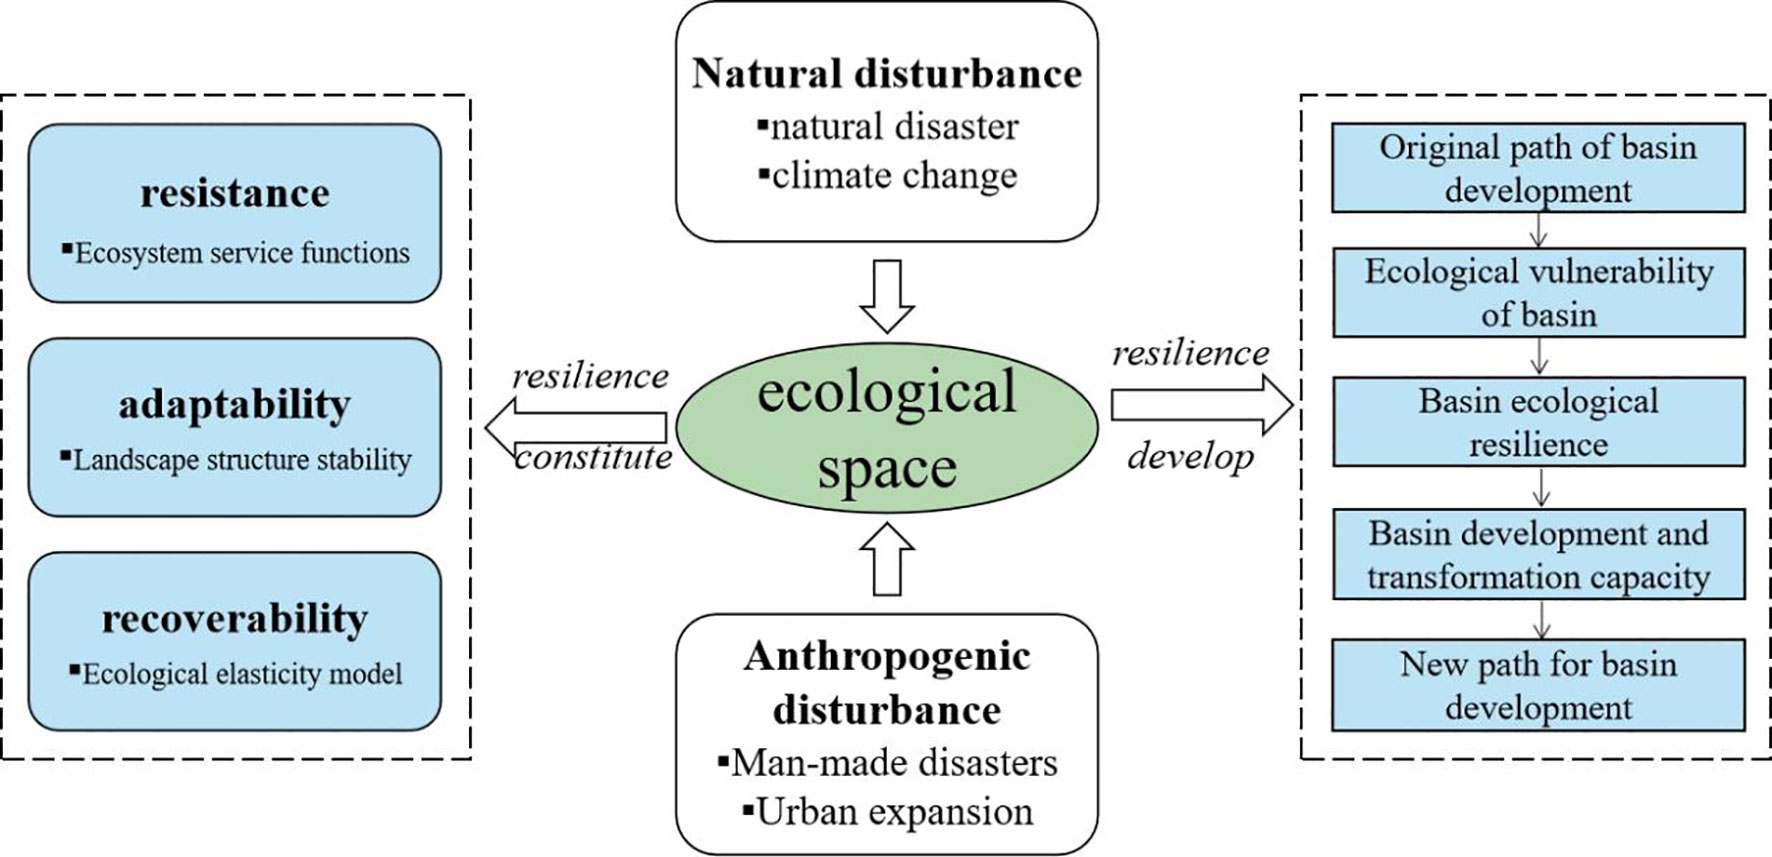
Originally meant to “restore vitality”, resilience was introduced into ecology by Canadian scholar Holling in 1973 to characterize the characteristics of stable state of ecosystem (Holling, 1973). Since the concept of resilience was put forward, it has undergone step modification and development from engineering resilience to ecological resilience and then to evolution resilience. Engineering resilience is characterized by the ability of the system to recover to a balanced or stable state after external impact (Walker and Salt, 2006), focusing on a single ultimate equilibrium state (Yang et al., 2021). With the deepening of the research, the academic community gradually realized that resilience has a certain ability to absorb disturbance before it suffers from impact and changes its own state (Folke, 2006), and ecological resilience to mitigate impact, resist risks, restore balance and adapt to new paths has become the mainstream view (Holling, 1996). With the development of The Times and the frequent occurrence of various crises, scholars have new thoughts on resilience and gradually realize that the path of system development is not single or balanced, but complex and unbalanced. Therefore, evolution resilience, as a resilience theory that emphasizes system interaction and dynamic feedback, immediately becomes a mainstream paradigm widely recognized by the current academic community (Walker et al., 2004). In the perspective of evolution resilience, resilience is not the recovery to normal state, but the ability of social complex ecosystem to adjust, adapt and transform in response to pressure (Carpenter et al., 2005; Zhou, 2015). Evolutionary resilience focuses on the maintenance of system structure and function, focusing on three aspects of social ecosystems: resistance, adaptability, and recoverability. Under the concept of evolutionary resilience, the concept of resilience has been applied in multiple fields. In recent years, the research objects on resilience involve urban resilience, economic resilience, ecological resilience, organizational resilience and other aspects. As modern society is facing threats from natural disasters, public security and other aspects, the current research on urban resilience accounts for the majority. The research methods can be divided into qualitative research and quantitative research. Among them, the qualitative research mainly focuses on the concept and analysis framework of resilience (Wei and Xiu, 2020) and the formation mechanism of resilience (Du et al., 2022). Quantitative studies mostly focus on building index systems to assess the level of resilience and analyze its influencing factors. Most scholars explain the spatial distribution of resilience level from the three core characteristics of resilience (namely resistance, adaptability and recoverability) (Xia et al., 2022), among which, Resistance is the ability of the system to withstand disturbances without significantly deviating from the normal development path (Vugrin et al., 2011), and adaptability is the ability of the system to adapt to shocks in the normal development process (Chen et al., 2022). Recoverability is the ability of a system to quickly recover from a disaster with minimal self-damage (Haimes Yacov, 2009). The combination of resilience and ecological space gives rise to the concept of ecological space resilience. Resilience can be seen as an attribute of ecological space, which can measure the ability of ecological space to face future disturbances, optimize its structure and function by taking preemptive actions to reduce the impact of disturbances, and quickly respond and restore to a new equilibrium state when impacts occur (Figure 1). At present, although there is a high degree of recognition of the concept of resilience in the existing literature, the grasp and emphasis of resilience vary. There is a lack of research on the measurement and comprehensive evaluation of ecological spatial resilience, and a complete theoretical framework has not yet been formed. Further exploration is needed to incorporate the theory of evolutionary resilience into the practice of ecological spatial optimization layout.
As the ecological hinterland of Xiong’an New Area, the structure and function of the ecological space in the Baiyangdian Basin are crucial for maintaining and improving the regional ecological environment. With the improvement of urbanization level, the ecological environment of Baiyangdian Basin is facing increasing pressure, and the function of ecological space cannot be effectively played. It is necessary to transform the concept of ecological problem restoration into the concept of ecological problem prevention, and integrate resilience thinking into the construction of ecological space to enhance the adaptability of the basin to respond to uncertain risks. In this paper, 35 counties and cities in five prefectural cities in Hebei Province, China, through which Baiyangdian Basin flows, are studied. Based on two evaluation methods, the importance of ecosystem services and the sensitivity of ecological environment, the ecological spatial importance index system is established to quantitatively identify the ecological space of Baiyangdian Basin. Based on the three basic characteristics of “resistance, adaptability and recoverability”, the resilience evaluation index was selected to analyze the spatial distribution of resilience level of ecological space structure and function, and divide resilience zones, in order to provide quantitative basis for improving the ecological space structure and ecological space function of Baiyangdian Basin and realize the sustainable development of the basin.
2 Materials and methods
2.1 Overview of the study area
The Baiyangdian Basin in Hebei Province, China, as defined in this study, is a part of the Daqing River Basin (Figure 2). The study area is located at 113°46’ -116°25’ east longitude and 37°51’ - 40°29’ north latitude. The terrain presents a stepped downward trend from northwest to southeast, showing a mountain-hill-plain with a relative height of 2815 meters. The average temperature is 12.1°C, the average annual water storage is 1.32×10⁹m3. By 2020, the total area of the study area is 4.43×10⁶hm2, among which the cultivated land area is 2.51×10⁶hm2, accounting for 56.58% of the total land use type. The area of forest land was 1.01×10⁶hm2, accounting for 22.84%. The grassland area was 2.47×10⁵hm2, accounting for 5.56%. The water area was 4.56×10⁴hm2, accounting for 1.03%; The construction land area is 6.19×10⁵hm2, accounting for 13.96%. The unused land area is 1.1×10³hm2, accounting for 0.02%. In general, cultivated land is the main study area, followed by woodland and construction land. In recent years, the structure and function of the ecological space in the Baiyangdian Basin have been affected to a certain extent. Studying the resilience level is important to ensure the ecological security of the Baiyangdian Basin.
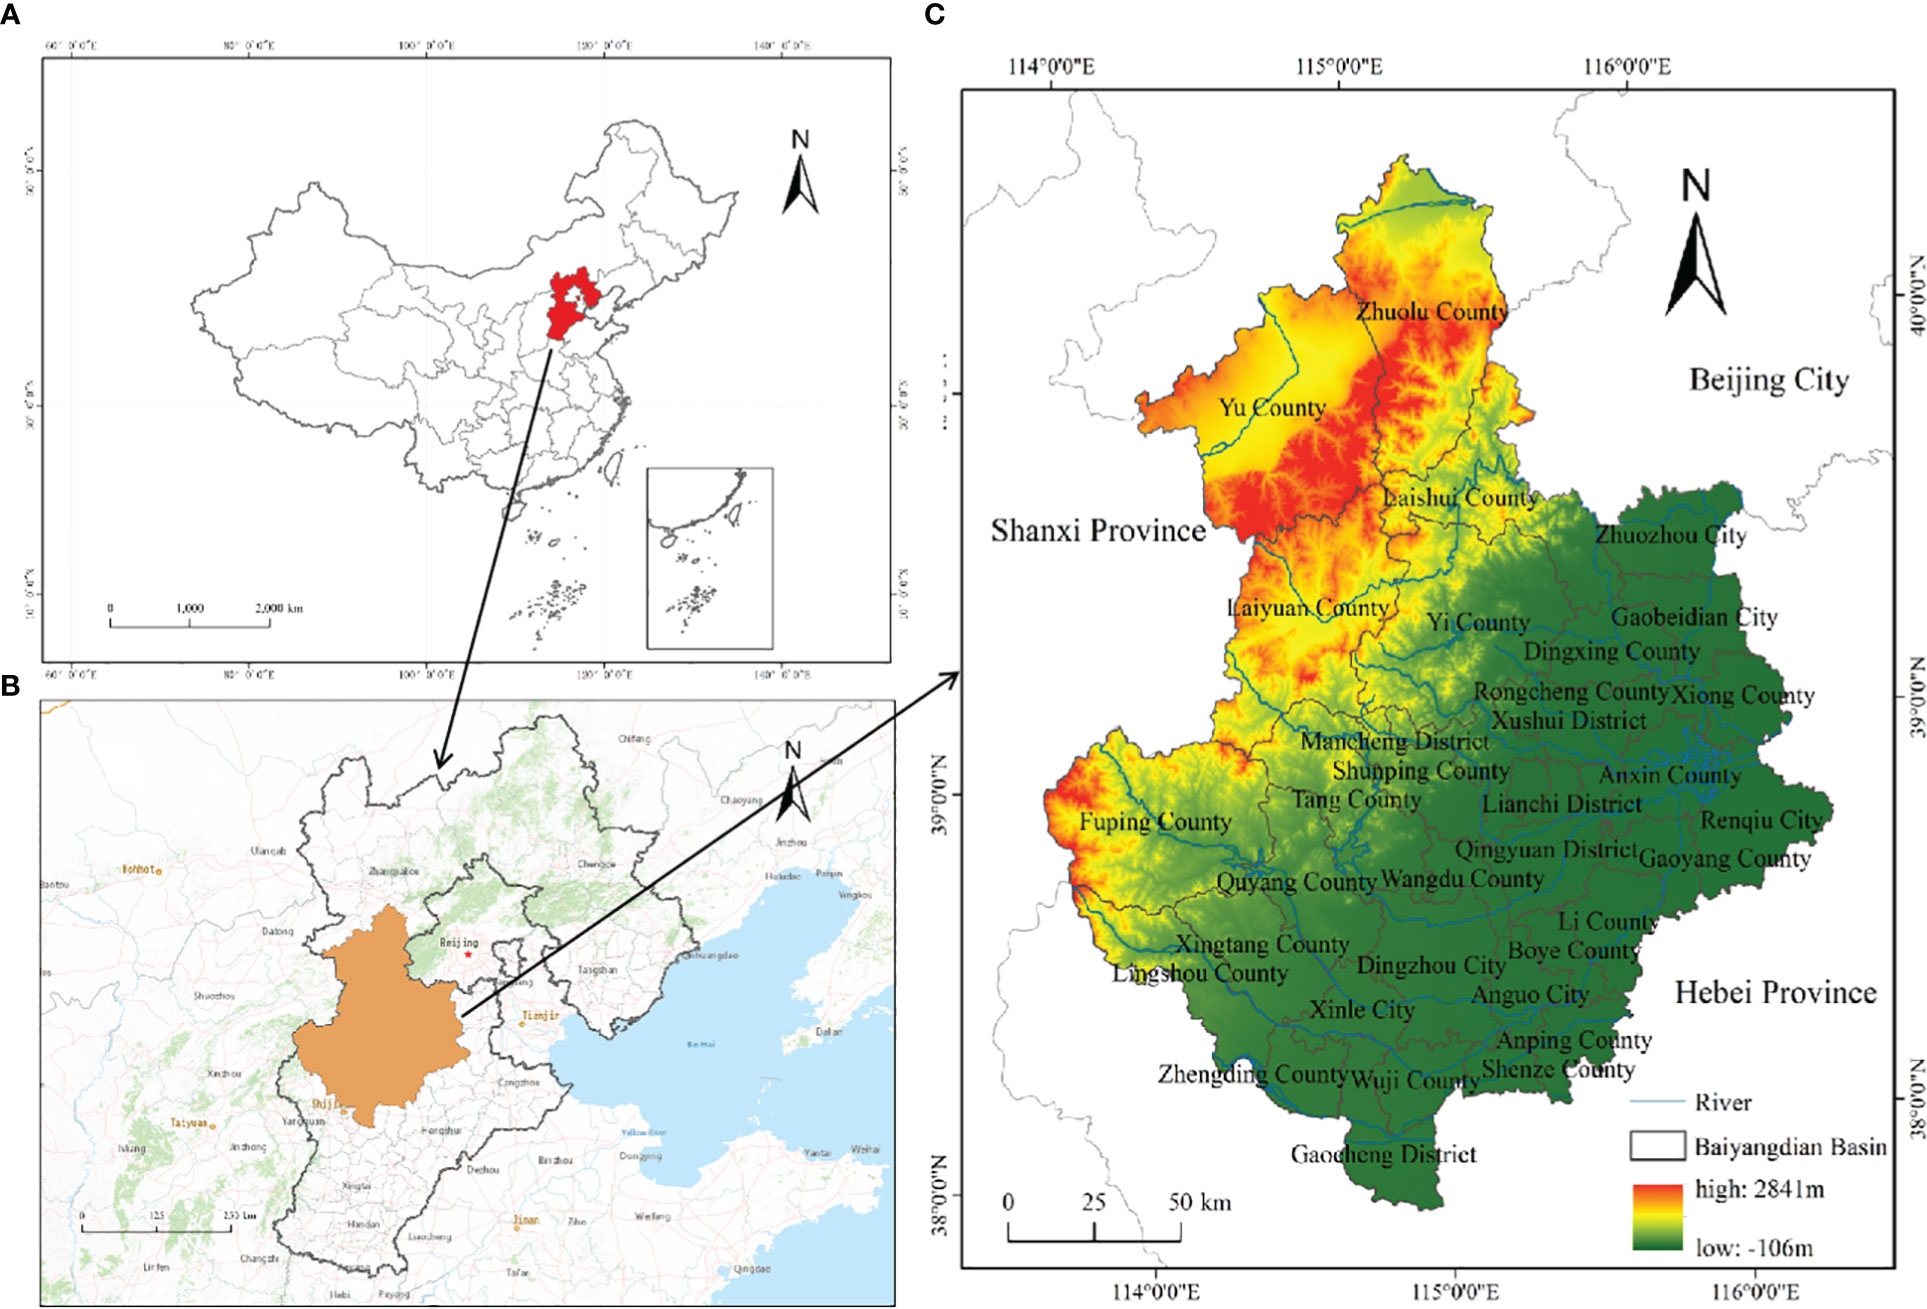
Figure 2 Spatial location of the study area ((A) China scope; (B) Hebei Province; (C) Baiyangdian Basin).
2.2 Data source and preprocessing
The data used in this study include remote sensing image data, land use data, DEM elevation data, slope data, NDVI data, soil texture data, meteorological data, NPP data and socio-economic data. Among them:
1. The remote sensing image data of the study area in 2020 came from the geospatial data cloud (https://www.gscloud.cn/).
2. Land use data was interpreted from remote sensing images. ENVI software was used to preprocess, supervise and classify remote sensing images, and land use types were divided into cultivated land, forest land, grassland, water area, construction land and unused land. After testing, the accuracy of the image is higher than 85%, which can be used in this study.
3. DEM elevation data comes from geospatial data cloud (https://www.gscloud.cn/) with a resolution of 30m and a time of 2020. Slope data are extracted from DEM elevation data.
4. All NDVI data and soil data were obtained from Data Center for Resources and Environmental Sciences, Chinese Academy of Sciences (https://www.resdc.cn/). ArcGIS software was used to carry out reprojection and mask processing on Chinese soil data, extract soil data in the study area, connect the “Value” field in its attribute table with the “MU_GLOBAL” field in the soil attribute table HWSD.mdb, and obtain the raster data of soil texture in the study area.
5. Meteorological source: National Data Center for Meteorological Sciences (https://data.cma.cn/). In the grid calculator, the maximum and minimum method is used to normalize the annual average rainfall, and the distribution map of annual average precipitation in the study area is obtained. The annual average temperature data of several meteorological stations around the study area was obtained by spatial interpolation calculation.
6. NPP data from MODIS data set (https://ladsweb.modaps.eosdis.nasa.gov/). The MRT tool was used to extract the NPP data. Referring to the MODIS17A3 data document, the conversion factor 0.0001 was used in the raster calculator to process the obtained NPP data, and the mask extraction was carried out based on the vector boundary of the study area in ArcGIS software. Because of the holes in the data, raster point transformation was carried out, and Kriging method was used to carry out spatial interpolation on the point data, and finally resampling the data after interpolation was processed to obtain data with a spatial resolution of 30m×30m.
7. Socio-economic data are derived from statistical yearbooks.
2.3 Research methods
2.3.1 Identification of ecological space
Ecological space is a space that provides ecosystem services (Wang et al., 2017; Cui et al., 2020), whose quantitative scale and spatial pattern have a great impact on the ecological security of the watershed (Chen et al., 2018). In view of a series of ecological problems in the study area, the study of ecological space should not only pay attention to the “structure”, but also to the “function” of ecological space. Therefore, the factors that can reflect the ecological spatial function of Baiyangdian basin are selected. Based on the two evaluation methods of the importance of ecosystem service function and the sensitivity of ecological environment, the ecological space is identified comprehensively and quantitatively, and the importance degree is graded.
2.3.1.1 Evaluation of the importance of ecosystem service functions
(1) Importance index of water conservation function
The water conservation function is an important function in ecosystem regulation services, and its change directly affects the hydrology and vegetation of the basin (Zhang et al., 2023). The calculation formula is:
Where, WR is the ecosystem water conservation function importance index, NPPmean is the average annual net primary productivity of vegetation, Fsicis the soil seepage factor, Fpre is the average annual precipitation factor, Fslo is the slope factor.
(2) Importance index of soil and water conservation function
The function of soil and water conservation is the regulation service of ecosystem (such as forest, grassland, etc.) to reduce soil erosion caused by water erosion through its structure (Zhang et al., 2015). The modified general soil and water loss equation is used to measure the soil and water conservation function. The calculation formula is:
Where, A is the importance index of soil and water conservation function, R is rainfall erosivity factor, K is soil erodibility factor, LS is the topographic relief factor, C is the vegetation cover factor.
(3) Importance index of biodiversity conservation function
Biodiversity conservation function refers to the role played by an ecosystem in maintaining the diversity of genes, species and ecosystems, and is one of the most important functions provided by an ecosystem (Liu and Liu, 2021). The calculation formula is:
Where, Sbiois the importance index of biodiversity conservation function, NPPmean is the average annual net primary productivity of vegetation, Fpre is the average annual precipitation, Falt is the average annual temperature, and is the altitude factor.
(4) Evaluation of the importance of ecosystem service functions
The ecosystem service value after the normalization of each single function is divided into three levels: unimportant, generally important, and extremely important. Then the ecosystem service function importance index () is obtained by using the disjunction algorithm. Using the natural breakpoint method, the results of the importance of ecosystem service functions are divided into three levels: unimportant, generally important, and extremely important. The calculation formula is:
2.3.1.2 Ecological environment sensitivity assessment
The sensitivity of ecological environment can reflect the sensitivity of ecosystem to natural environment changes and interference from human activities (Ouyang et al., 2000). The terrain of the Baiyangdian Basin is complex, and its ecological environment sensitivity is influenced by various ecological factors. Therefore, dominant and representative factors are selected to comprehensively evaluate the ecological environment sensitivity (Zhan and Zhu, 2019), and the sensitivity degree is divided.
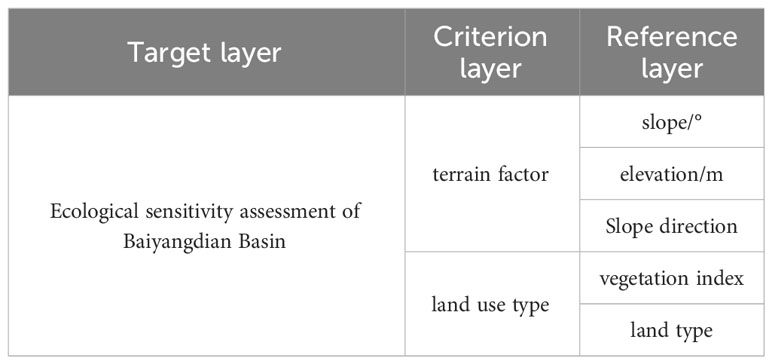
1. Build a hierarchical model. The model is divided into three levels: target layer, criterion layer and reference layer (Table 1). The target layer is the ecological sensitivity assessment of Baiyangdian Basin, and the criterion layer includes two judgment criteria: terrain factor and land use type. The reference layer can be determined by the following indicators:
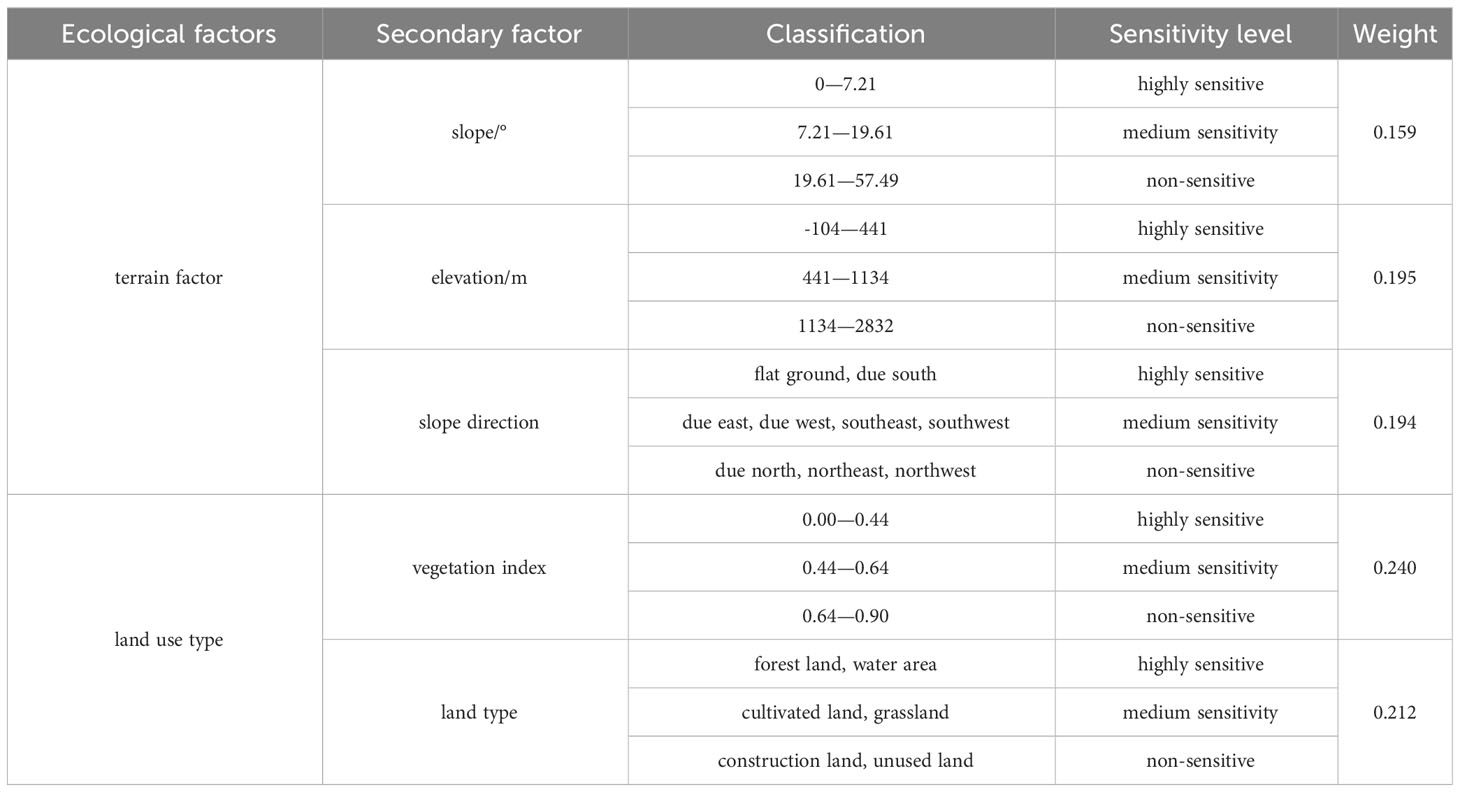
2. Sensitivity level definition. Determine the weights of each factor using the Analytic Hierarchy Process and define the sensitivity level of each ecological factor (Table 2).
3. The ecological environmental sensitivity () of the study area is obtained by weighted superposition of the selected factors. The natural breakpoint method is used to reclassify the results, resulting in three levels of non-sensitivity, medium sensitivity, and high sensitivity.
2.3.1.3 Comprehensive identification of ecological space
In the ArcGIS software, ecological space () is obtained by disjunctive algorithm, and it is divided into three levels: non-critical type, general type, and core type. The calculation formula is:
2.3.2 Horizontal measure of resilience
In view of the negative impact brought by the disturbance, the concept of resilience is introduced to improve the ability of the study area to cope with various risks. From the perspective of evolutionary resilience, resilience refers to the persistence, adaptability, and transferability of complex social ecosystems, focusing on the ability of ecological space to respond, adapt, and shape changes. Its emphasis is not on the pursuit of equilibrium, but on the ability of the system to continuously improve its own structure to cope with risks, thus enabling sustainable development. Therefore, constructing resilience evaluation indicators by considering the three basic characteristics of “resistance, adaptability and recoverability” in evolutionary resilience, and the horizontal spatial distribution of resilience in ecological space was analyzed.
2.3.2.1 Resistance index
Resistance (P) refers to the ability of ecological space to resist external disturbance. Many studies have pointed out that the resistance characteristic of ecological space is closely related to ecosystem service function. This study is based on the modified ecological service equivalence table per unit area of Chinese ecosystems (Xie et al., 2015), combined with the socio-economic development status, to modify the economic value created by the unit area grain yield in the study area, and obtain the unit area ecological service value of the Baiyangdian Basin, which represents the resistance of ecological space resilience. The calculation formula is:
Where, P is ecological space resistance, ESV is ecosystem service value, Ai is the area of land use type i, VCi is the ecosystem service value per unit area of class i land use type, ECj is the equivalent of the ecosystem service value of item j of certain land use type, and Eais the economic value (yuan/hectare) of providing food production service function for farmland ecosystem per unit area. i is the crop type, pi is the national average price of a crop in a given year (yuan/ton), qi is the planted area of a crop (hectare), M is the planted area of all crops (hectare).
2.3.2.2 Adaptability
The more stable the ecological space is, the more adaptability (A) it is. In this study, the adaptability is expressed through the relevant indicators of landscape structure stability (Peterson, 2002). Among them, the stability of landscape structure is measured by the relevant landscape index (Turner, 1989). The calculation formula is:
Where, A is ecological space adaptability index; C is landscape fragmentation degree; SHDI is Shannon’s diversity index (SHDI); AWM is the the area-weighted mean patch fractal dimension (AWMPFD).
2.3.2.3 Recoverability
The resilience of ecological space (R) reflects the ability and potential of ecological space to recover from damage. Land use plays an important role in the concept of ecosystem recoverability (Foster et al., 2003; Colding, 2007), so the recoverability is quantified by summing the area-weighted ecosystem resilience coefficients of all land use types. The calculation formula is based on the ecological resilience model and coefficient proposed by Peng et al. (2015). The calculation formula is:
Where, R is ecological space recoverability; Ai is the area ratio of land use type; RCi is the ecosystem elasticity coefficient of land use type.
The calculations of resistance, adaptability and recoverability have different units, so when calculating resilience levels, it is necessary to standardize various indicators to the [0,1] range. In addition, to avoid amplification calculations when multiplying indicators, a root sign is needed to neutralize the order of magnitude. According to the natural breakpoint method, the resilience level is divided into high level, medium level and low level.
The specific calculation formula is as follows:
Where, P is resistance, A is adaptability, R is recoverability.
3 Results
3.1 Evaluation results of ecosystem service function importance
3.1.1 The importance of water conservation function
According to the extracted average annual net primary productivity of vegetation, soil seepage factor, annual average precipitation factor and slope factor, formula (1) is used to calculate and obtain the evaluation result of the importance of water conservation function in Baiyangdian Basin, which is normalized in ArcGIS software. According to the natural breakpoint method, the results are divided into the areas of water conservation function is unimportant, generally important and extremely important (Table 3) (Figure 3). The results show that the water conservation function in Baiyangdian Basin is affected by landform, temperature and precipitation, land use conditions, vegetation and other factors. Among them, 23.31% of the water conservation function in Baiyangdian Basin is unimportant, distributed in Zhuolu County and Yu County in the northern part of the study area. The terrain in this area is relatively high with a large slope, and an annual precipitation of less than 400 millimeters. Therefore, the importance of water conservation is relatively low. Generally important areas accounted for 53.57%, mainly distributed in flat terrain areas such as urban construction and development areas. There is a large amount of arable land with high density, and rainfall and vegetation coverage are at a moderate level in the entire study area. Therefore, the water conservation capacity is average. The extremely important area accounts for 23.12%, mainly distributed in the southern part of Laishui County, the southeastern part of Yi County, Dingxing County and other areas. The terrain in this area is relatively flat and open, so the water conservation capacity is better.
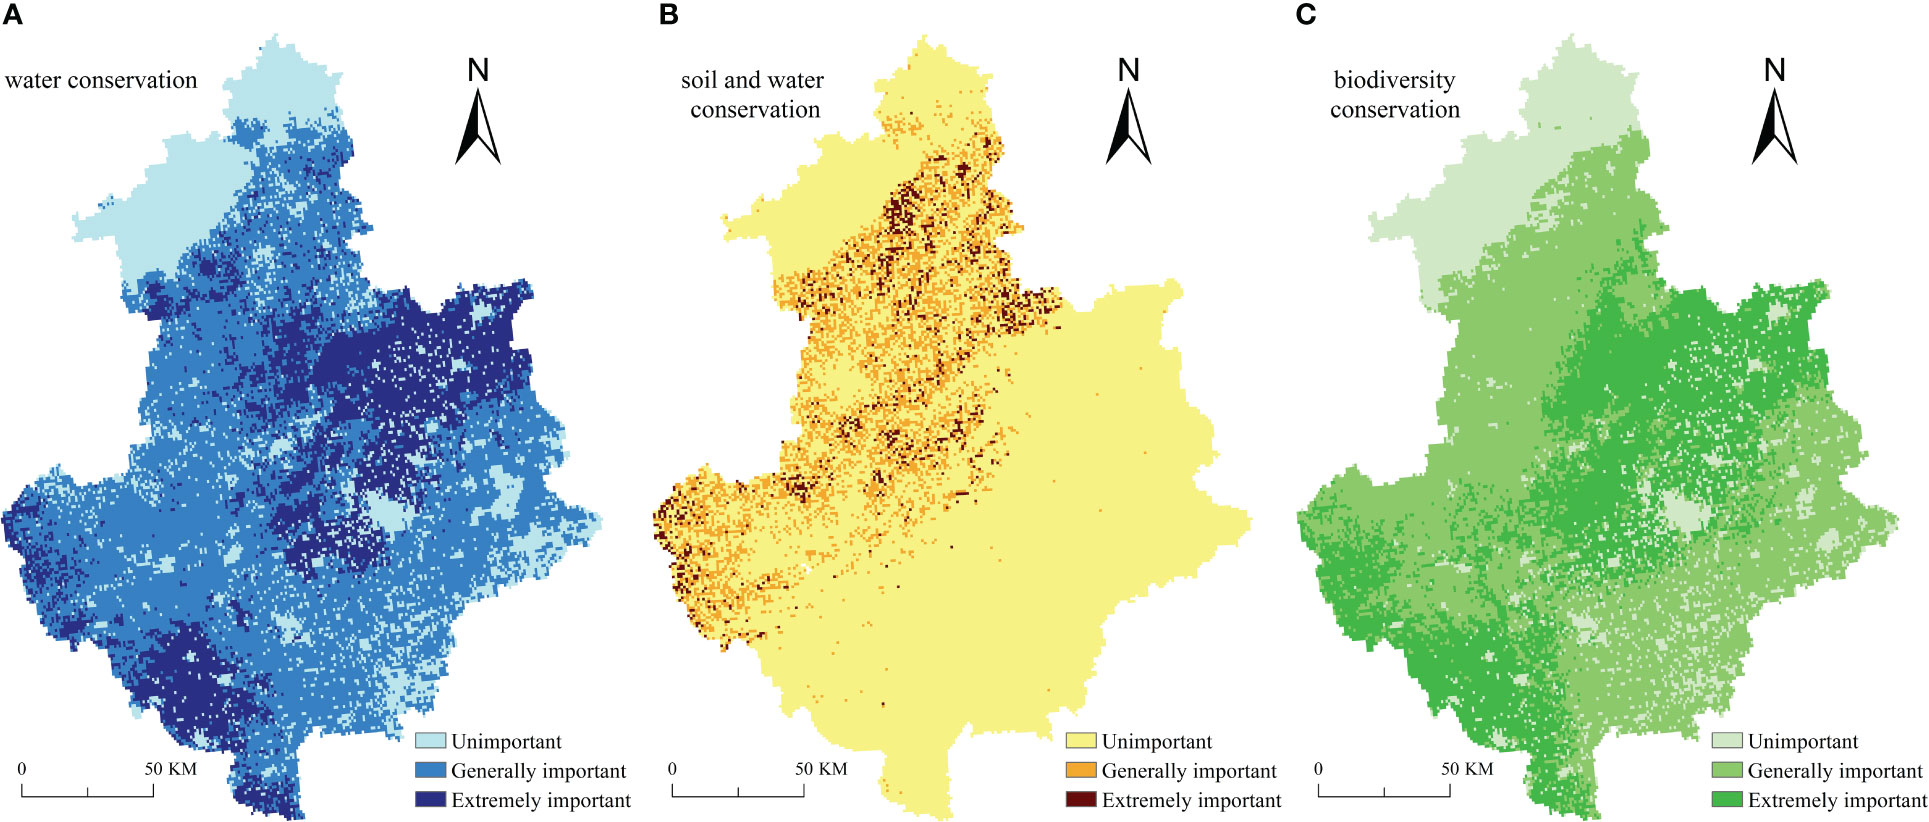
Figure 3 Each Single Factor Importance Evaluation Results [(A) Water conservation; (B) Soil and water conservation; (C) Biodiversity conservation].
3.1.2 The importance of soil and water conservation
According to the extracted rainfall erosivity factor, soil erodibility factor, topographic relief factor and vegetation cover factor, formula (2) is used for calculation, and the evaluation results of soil and water conservation function importance in Baiyangdian Basin are obtained, which are normalized in ArcGIS software. According to the method of natural segment point, the results are divided into the areas of unimportant, generally important and extremely important soil and water conservation function (Table 3) (Figure 3). The results show that the spatial distribution of water and soil conservation importance index in Baiyangdian Basin show a trend of higher in northwest and lower in southeast. Among them, 83.90% of the areas in Baiyangdian Basin are unimportant in soil and water conservation function, mainly distributed in the plain area in the southeast of the study area. The terrain in this area is relatively flat, and most of them are cultivated land and construction land. The economy in this area is relatively developed, and there are relatively many artificial soil and water conservation measures. Therefore, there is less soil erosion and the importance of soil and water conservation functions is relatively low. The general important area accounts for 12.95%, while the extremely important area accounts for 3.14%. It is mainly distributed in the northwest of the study area. This area is mostly low mountains and hills, mainly composed of forest land and grassland, with high altitude, significant terrain fluctuations, and more precipitation in the area. Therefore, soil and water loss is serious.
3.1.3 The importance of biodiversity conservation functions
According to the extracted average annual net primary productivity of vegetation, average annual precipitation, average annual temperature and altitude factors, formula (3) is used to calculate and obtain the assessment result of biodiversity conservation function importance in Baiyangdian Basin, which is normalized in ArcGIS software. According to the method of natural segment point, the results are divided into regions with unimportant, generally important and extremely important biodiversity conservation functions (Table 3) (Figure 3). The results show that the biodiversity conservation function in Baiyangdian Basin is mainly of general importance. Among them, 19.17% of the areas in the Baiyangdian Basin have unimportant biodiversity conservation functions, mainly distributed in the northern part of the study area. Due to the high terrain and significant changes in temperature during the day and night, the importance of biodiversity conservation functions is relatively low in this area. The generally important areas account for 49.60% of the total, mainly distributed in the southern part of the study area where there is more cultivated land and construction land. This area has a large population, urban and agricultural spaces continue to expand, and the self repair ability of the ecosystem is weak, so the biodiversity conservation function is poor. The extremely important area accounts for 31.23%, mainly distributed in the south of Laishui County, the southeast of Yi County and Dingxing County. The terrain in this area is mostly low mountains, hills and plains. Compared with the northern part of the study area, the terrain is lower, with abundant rainfall, abundant light and heat, and rich vegetation, so the importance of biodiversity conservation function is high.
3.1.4 Evaluation of the importance of ecosystem service functions
The evaluation results of a single function often can only reflect the impact results of a single type of factor, rather than being holistic. Therefore, ArcGIS is used to overlay each importance index to calculate the importance of ecosystem service functions. The results are normalized in the ArcGIS software, and the results are divided into regions with unimportant ecosystem service functions, generally important ecosystem service functions and extremely important ecosystem service functions according to the natural breakpoint method (Table 4) (Figure 4).
The results indicate that 19.14% of the areas with unimportant ecosystem service functions in Baiyangdian Basin are mainly distributed in the northern part of the study area, where the net primary productivity of vegetation is low and the altitude is high. The general important areas account for 49.13%, mainly distributed in transition areas from high to low terrain, as well as flat terrain areas such as urban development areas. The extremely important area accounts for 31.73%, mainly distributed in the central and southwestern parts of the basin. This region is low in elevation and flat in terrain, with more rivers flowing through it and better water storage capacity and water regulation capacity. And the land use type of this area is mostly cultivated land, with good cultivation conditions. In addition, the importance of water conservation function is higher in the eastern part of the study area, the importance of water and soil conservation is lower, and the importance of biodiversity conservation function is higher, so the ecosystem in this region is better.
3.2 Assessment result of eco-environmental sensitivity
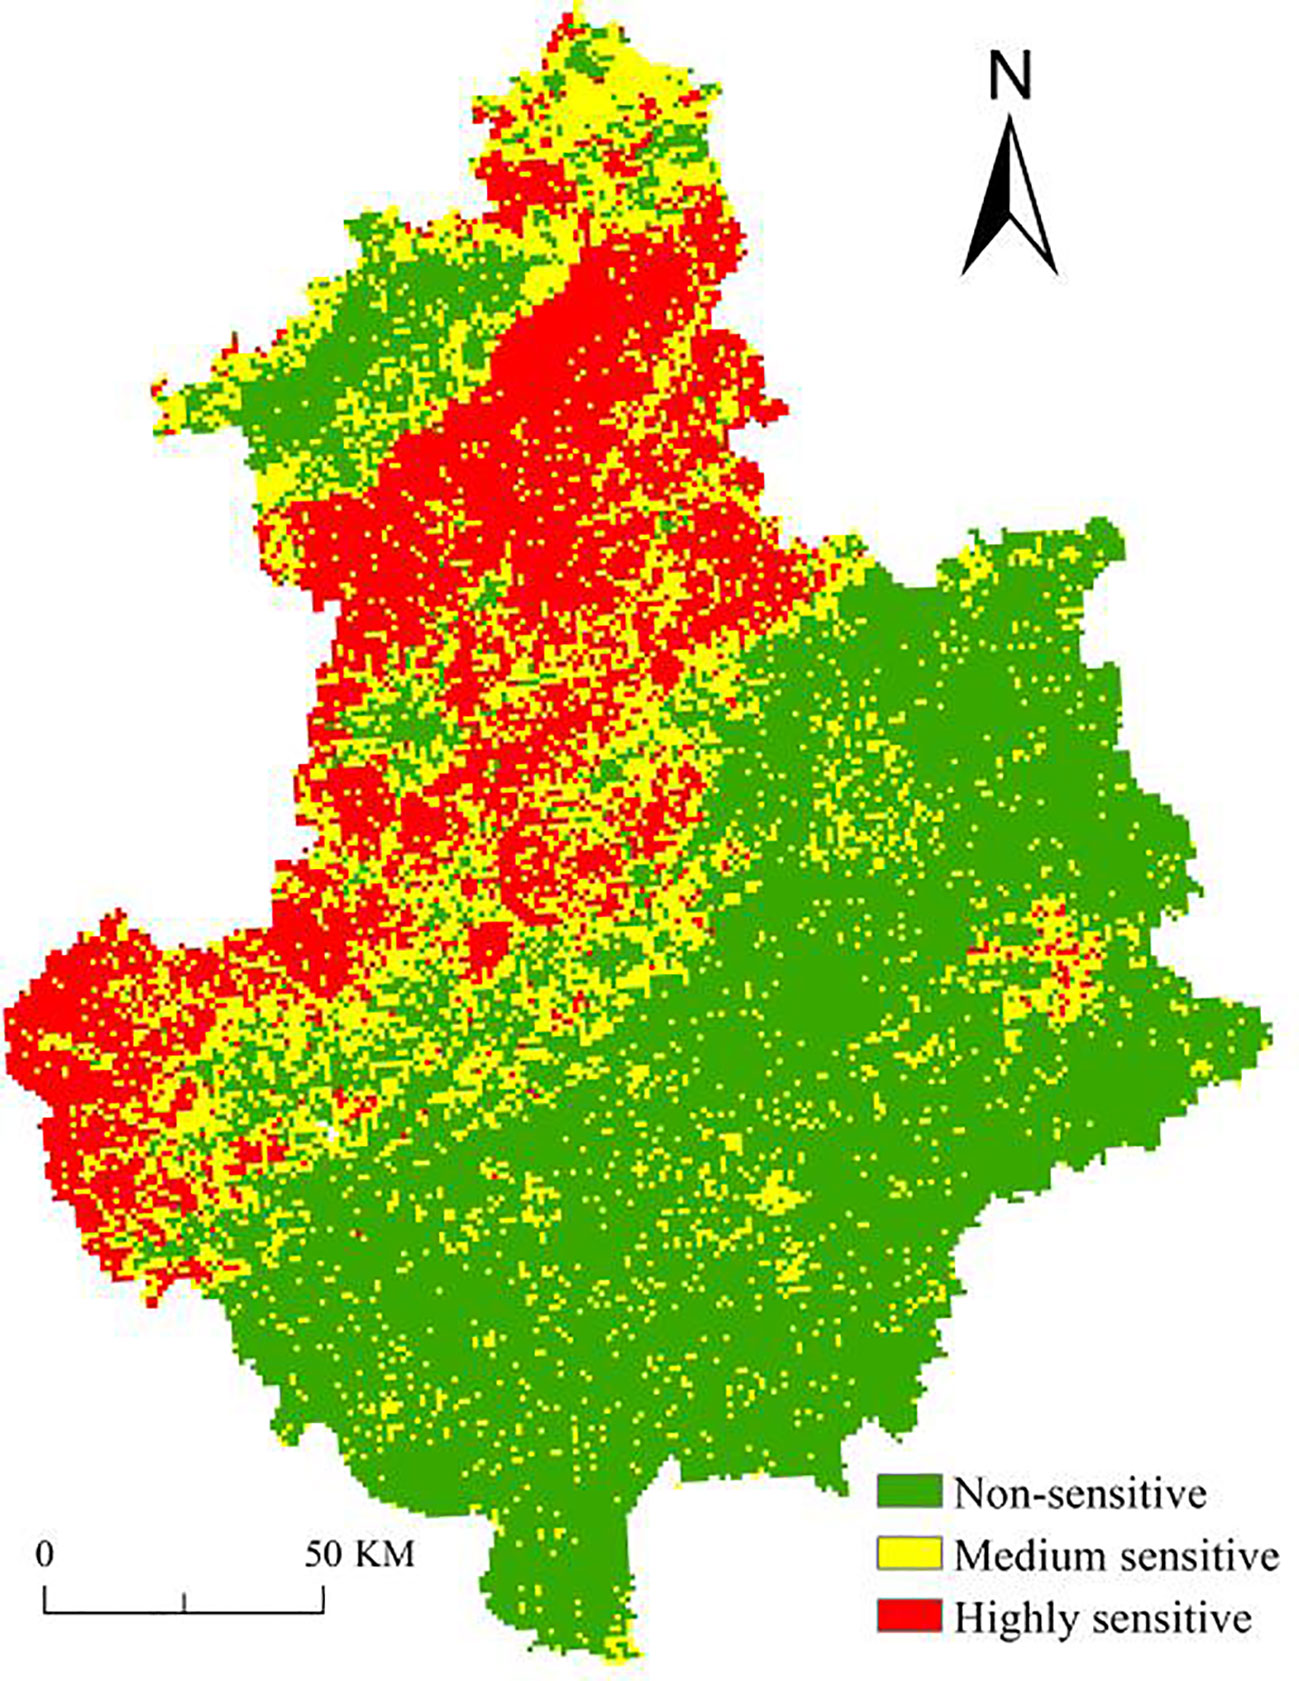
The ecologically sensitive areas of Baiyangdian basin are mainly distributed in the north of the basin with higher elevations and the river pooling area, and the overall pattern is non-sensitive > medium sensitive > highly sensitive (Table 5) (Figure 5). Among them, the non-sensitive areas accounted for 54.63%, mainly concentrated in the southern plain, where the terrain was flat and open, with distinct four seasons and obvious continental climate characteristics. However, because human production and living activities would bring certain pressure to the ecological environment, there were also some medium-sensitive areas in this region. The medium sensitive area accounted for 23.41%, and the highly sensitive area accounts for 21.96%. They are mainly distributed in areas such as Zhuolu County, Laishui County, Laiyuan County, and Fuping County with higher elevations in the northwest. The average temperature in this area is low, the temperature difference between day and night is large, there are many mountains, basins and hills in some areas, complicated terrain, poor living environment and frequent geological disasters, so the ecological sensitivity is relatively high. In addition, Baiyangdian District has a high ecological sensitivity due to the vast water area where rivers gather, rich aquatic animal and plant resources, and high ecosystem diversity.
3.3 Identification of ecological space
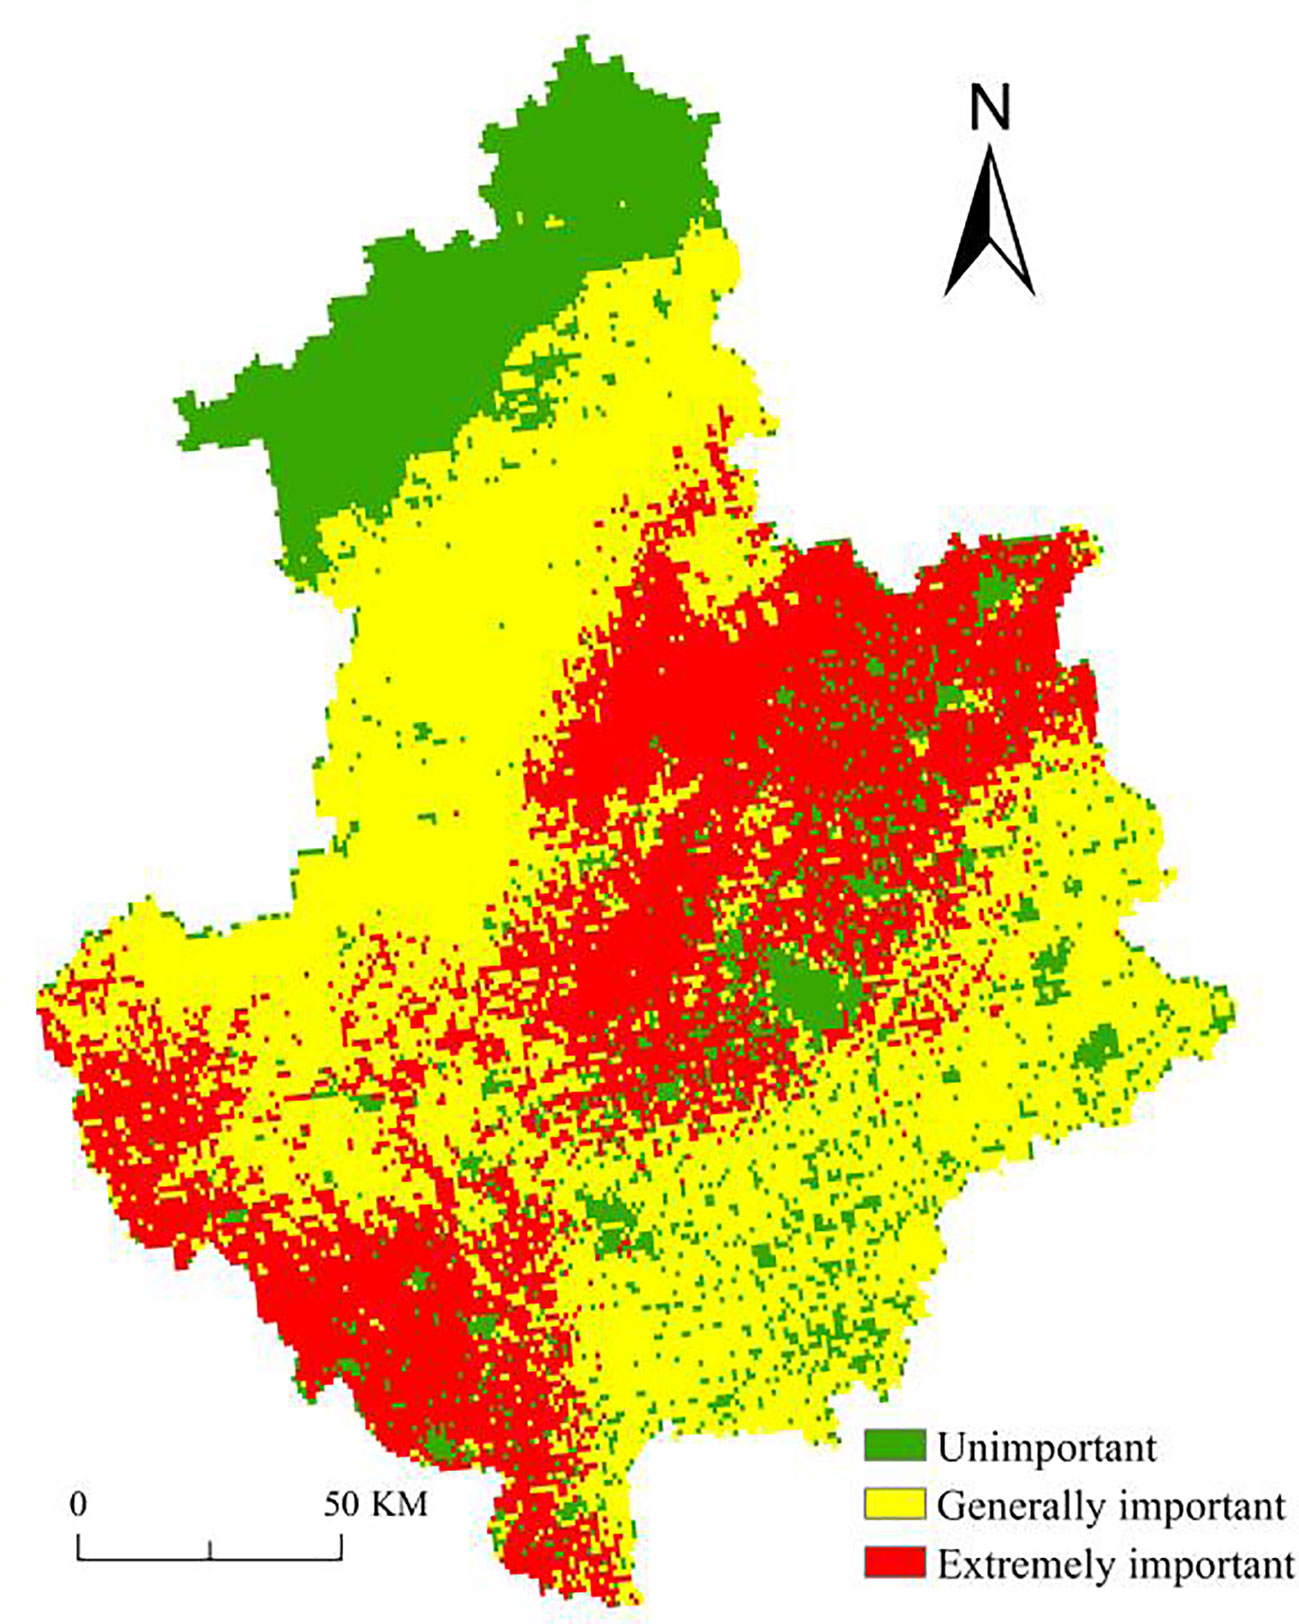
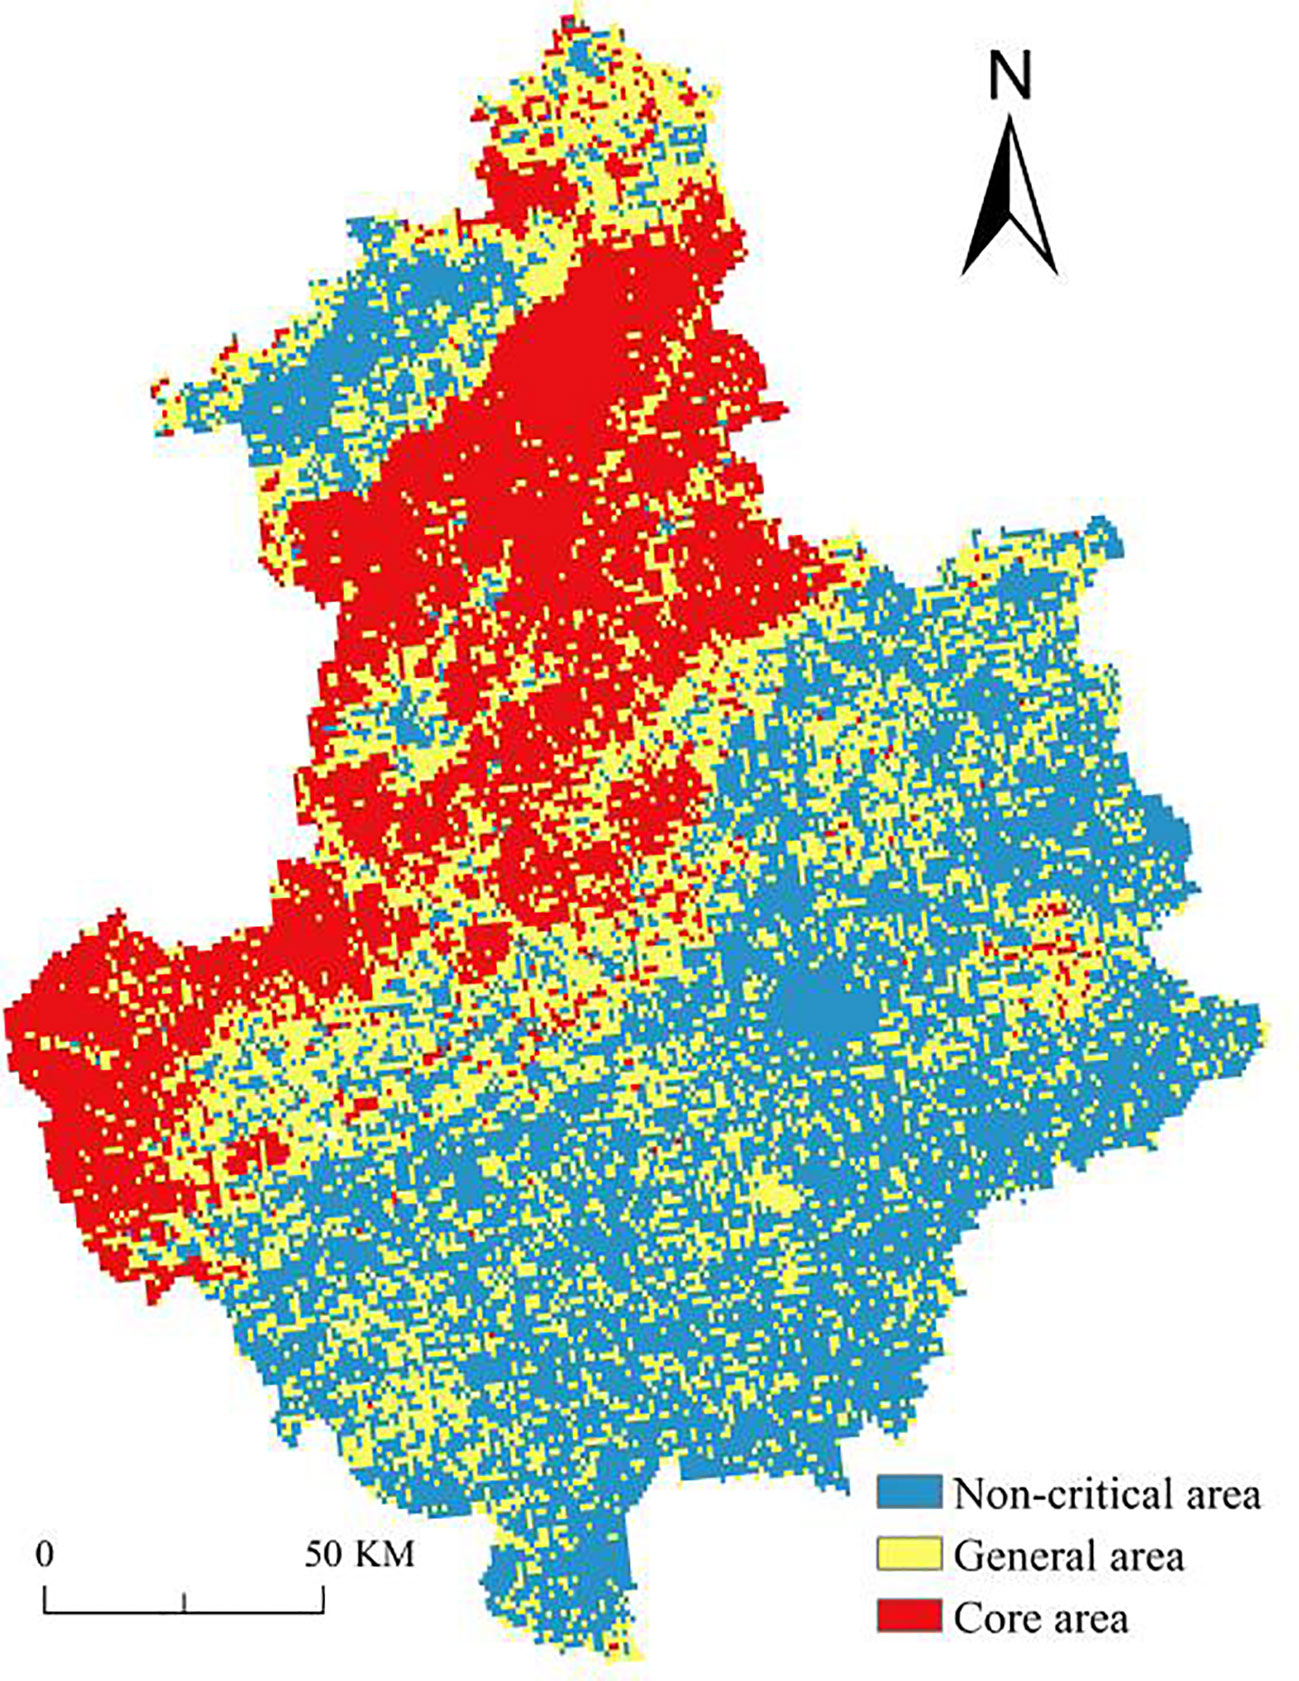
By using ArcGIS to overlay the importance layer of ecosystem service functions and the sensitivity layer of ecological environment, the ecological space of the study area is comprehensively identified. According to the natural breakpoint method, the ecological space is classified into importance levels (Table 6) (Figure 6).
The results show that 43.00% of the ecological space in the Baiyangdian Basin is non-critical area, mainly distributed in the southern part of the Baiyangdian Basin and the northern part of Yu County. Among them, Yu County has a relatively high altitude and typical loess landform development, while the southern region of the study area is mainly composed of construction land and cultivated land, which is a gathering area for human activities with less vegetation coverage. Therefore, the importance of ecological space is relatively low. The general type area accounts for 30.78%, and its distribution is relatively uniform but fragmented. The core type accounts for 26.22%, mainly in Laishui County, Layuan County, Fuping County, Tang County, Yi County and other central mountainous areas as well as Baiyangdian District where rivers come together. Among them, the land use types in the central part of the basin are mainly woodland and grassland, which is the main distribution area of forest ecosystem in the basin. There are a number of forest parks and natural ecological scenic spots, the terrain includes mountains, hills, plains, river gullies, is the main ecological space protection zone; Baiyangdian District is the gathering place of several rivers, which is the largest lake in Hebei Province and an important ecological water body, so it has become the core area of ecological space in the basin.
3.4 Horizontal spatial distribution of resilience
According to the calculation results of formula (11), the resilience level is divided into high level, medium level and low level according to the natural breakpoint method in ArcGIS (Table 7) (Figure 7).
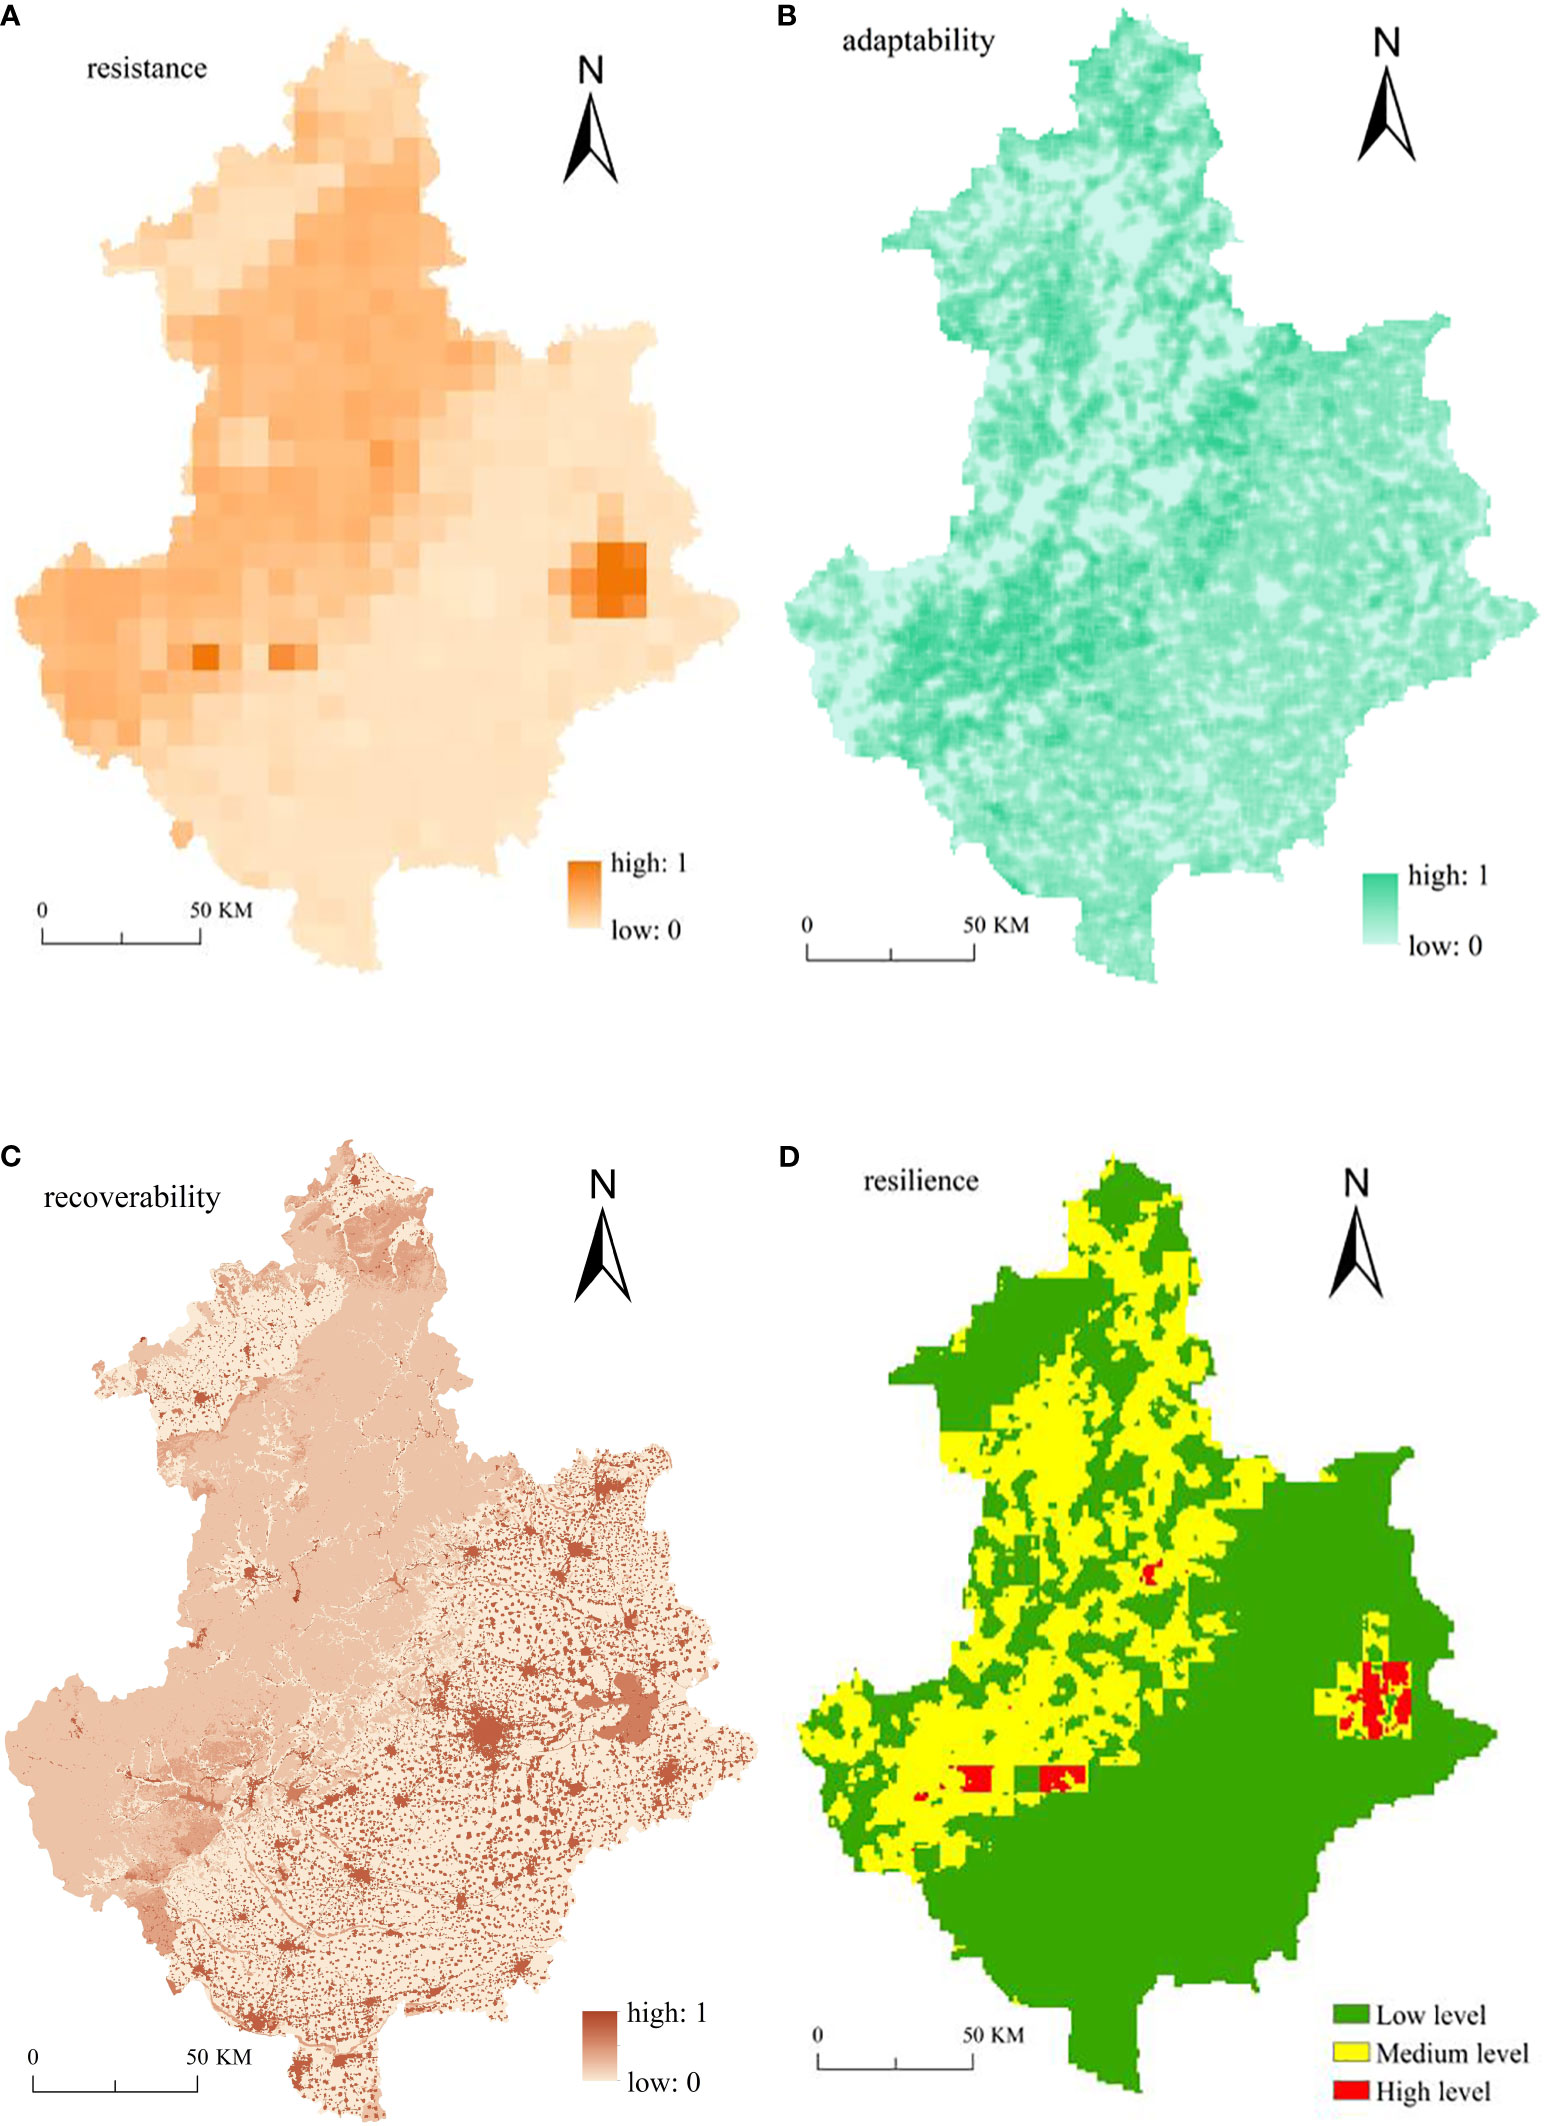
Figure 7 Distribution of Ecological Space Resilience Level in Baiyangdian Basin [(A) the result of resistance; (B) the result of adaptability; (C) the result of recoverability; (D) the result of resilience].
The results show that the resilience level of Baiyangdian Basin is not high, and the area with low resilience level accounts for 68.60%, mainly in the southern part of the study area and the northern part of Yu County. Among them, there are a lot of cultivated land and construction land in the southern part of the study area, which occupy a large amount of natural resources. In addition, the flat terrain and convenient transportation have led to the continuous improvement of the urbanization level in these areas, which has led to the increase of landscape fragmentation and the increase of human interference on the landscape, thus reducing the level of ecological resilience in these areas; The northern part of Yu County is high in altitude, and the temperature difference between day and night is large, so that its ability to resist external interference is reduced. The medium level areas account for 29.89%, mainly distributed in Laishui - Laiyuan - Fuping area. These areas have variable topography, including mountains, hills, plains, rivers and ravines, etc. The land use types are mainly woodland and grassland, and there are a large number of forest parks and ecological scenic spots. However, due to the high altitude of this area, insufficient rainfall and great disparity in geomorphology, the resilience level is not high and is in the medium grade. The proportion of areas with high resilience levels is only 1.51%, mainly in the Baiyangdian District. This area has a high diversity index of aroma, high landscape heterogeneity, and abundant species. Therefore, its ecosystem has a good self-regulation ability and a high resilience level.
In contrast, the resilience level of core and important ecological space regions is higher, while that of non-critical ecological space regions is lower. This shows that the more complex the structure of ecological space is, the more complete the function is, the better the ecological environment is, the higher its own stability is, the less susceptible it is to external interference, and the higher the resilience level is. On the other hand, when the ecological space is not critical, the production efficiency of the ecosystem is low, the ability to resist natural disasters and external interference is also low, and the resilience level of the ecosystem is low due to the simple species composition of the ecosystem.
4 Conclusion and discussion
4.1 Conclusion
In this study, the ecological space of Baiyangdian Basin was identified by combining the evaluation of the importance of ecosystem service function and the evaluation of eco-environmental sensitivity. Secondly, based on the principles of integrity, orientation and operability, resilience evaluation indexes were selected from three aspects: resistance, adaptability and recoverability to cope with crises. Finally, the ecological resilience level of the study area was analyzed. It lays a theoretical foundation for the optimization of ecological space pattern in Baiyangdian Basin. Through the above research, this paper draws the following conclusions:
1. There is a significant difference in the importance of ecological space in the study area. In general, 26.22% of the study area belongs to the core type of ecological space, 30.78% to the general type of ecological space, and 43.00% to the non-critical type of ecological space. In addition, it can be clearly found through the research that the core areas of ecological space are concentrated in the areas with good vegetation, superior water conditions and high biodiversity. The non-critical areas are mostly plain areas, where the terrain is flat, mainly cultivated land and intensive construction land, or the non-critical areas are the northern Yu County with higher elevation, poor ecological environment and relatively less vegetation.
2. The resilience level in the study area is not high, the threshold of low resilience level is 0.06, the threshold of medium resilience level is 0.19, and the threshold of high resilience level is 0.57. From the perspective of spatial distribution, regions with low resilience level accounted for 68.60%, regions with medium resilience level accounted for 29.98%, and regions with high resilience level accounted for 1.51%. The low resilience level area is concentrated in the southern part of the basin where the city is rapidly expanding, the medium level area is concentrated in the central and northern part of the basin with more forest vegetation and relatively uneven terrain, and the high resilience level area is less concentrated in the river convergence area.
4.2 Discussion
At present, the study of ecological spatial resilience is still in the exploratory stage, and most of the existing studies are on the theoretical level of ecological resilience. This study considered the structure and function of ecological space, delineated the importance level of ecological space in Baiyangdian Basin, combined with the ecological environment characteristics of the study area, quantitatively assessed the resilience level of ecological space from the perspective of evolutionary resilience, and established an evaluation index system of ecological space resilience.
In terms of the method of identifying ecological space, from the perspective of ecological needs, this study selects the factors that can directly reflect the function of ecological space. Combined with the importance analysis of ecosystem service function and the sensitivity analysis of ecological environment, the ecological space of Baiyangdian Basin was more comprehensively identified and classified into important types of ecological space. However, due to the different sources of basic data, there may be some errors in data fusion and calculation. In the future, it is necessary to further improve the evaluation accuracy when identifying ecological space.
In terms of the method of evaluating resilience, a more comprehensive evolutionary resilience concept was chosen from a research perspective. One is to view ecological space as a complex dynamic system with structure and function, with a focus on considering its ability to cope with uncertain risks. Secondly, from the perspective of evolutionary resilience, resilience is seen as the ability of ecological spaces to absorb external interference, reduce their own risks, and accelerate self recovery, in order to enhance the resistance, adaptability and recoverability of ecological spaces. In order to ensure the ecological security of Baiyangdian Basin, a different evaluation system was established according to the current situation of land use and local characteristics, and a resilience measurement model was established to measure the resilience level on a spatial scale. However, the results obtained by this research method are greatly influenced by the process of land use change, and there is inevitable uncertainty in the interpretation of remote sensing images. In addition, this study only considers ecological factors and neglects the impact of economy and society on resilience levels. In the future, comprehensive consideration should be given from multiple dimensions to improve the ecological space resilience indicator system.
Data availability statement
The raw data supporting the conclusions of this article will be made available by the authors, without undue reservation.
Author contributions
XG, XL, WS contributed to the conception of the study. XG, XL performed the experiment. XG, XL, ZG, MZ, WS contributed significantly to analysis and manuscript preparation. XL performed the data analyses and wrote the manuscript. All authors contributed to the article and approved the submitted version.
Funding
This research is funded by the Social Science Fund of Hebei Province (HB22GL030).
Conflict of interest
The authors declare that the research was conducted in the absence of any commercial or financial relationships that could be construed as a potential conflict of interest.
Publisher’s note
All claims expressed in this article are solely those of the authors and do not necessarily represent those of their affiliated organizations, or those of the publisher, the editors and the reviewers. Any product that may be evaluated in this article, or claim that may be made by its manufacturer, is not guaranteed or endorsed by the publisher.
References
Carpenter S. R., Westley F., Turner M. G. (2005). Surrogates for resilience of social-ecological systems. Ecosystems 8, 941–944. doi: 10.1007/s10021-005-0170-y
Chen M., Jiang Y., Wang E. D., Wang Y., Zhang J. (2022). Measuring urban infrastructure resilience via pressure-state-response framework in four chinese municipalities. Appl. Sci. 12, 2819–2819. doi: 10.3390/APP12062819
Chen Y. L., Xie B. G., Zhong D., Wu L. Q., Zhang A. M. (2018). Predictive simulation of ecological space based on a particle swarm optimization-Markov composite model: a case study for Chang Zhu-Tan urban agglomcrations. Acta Ecol. Sinica 38, 55–64. doi: 10.5846/stxb201612082530
Colding J. (2007). ‘Ecological land-use complementation’ for building resilience in urban ecosystems. Landscape Urban Planning 81, 46–55. doi: 10.1016/j.landurbplan.2006.10.016
Cui L., Wang J., Sun L., Lv C. D. (2020). Construction and optimization of green space ecological networks in urban fringe areas: a case study with the urban fringe area of Tongzhou district in Beijing. J. Cleaner Prod. 276, 124266. doi: 10.1016/j.jclepro.2020.124266
Deng H. D., Ye L. F., Liu L. X., Yang K., Han Y. W. (2022). Review of urban ecological security research. J. Environ. Eng. Technol. 12, 248–259. doi: 10.12153/j.issn.1674-991X.20210179
Du W. X., Shi Y. J., Xu L. H., Zhai G. F., Chen W., Lu Z. W. (2022). Multidimensional measurements and analysis of urban economic resilience under the disturbance of economic risks: A case study of the Yangtze River Delta, China. Prog. Geography 41, 956–971. doi: 10.18306/d1kxiz.2022.06.002
Fabien R., Schulp C. J. E., Verburg P. H., Teeffelen A. J. A. v. (2017). Testing the applicability of ecosystem services mapping methods for peri-urban contexts: A case study for Paris. Ecol. Indicators 83, 504–514. doi: 10.1016/j.ecolind.2017.07.046
Folke C. (2006). Resilience: The emergence of a perspective for social- ecological systems analyses. Global Environ. Change 16, 253–267. doi: 10.1016/j.gloenvcha.2006.04.002
Foster D., Swanson F., Aber J., Burke I., Brokaw N., Tilman D., et al. (2003). The importance of land-use legacies to ecology and conservation. BioScience 53, 77–88. doi: 10.1641/0006-3568(2003)053[0077:TIOLUL]2.0.CO;2
Gao J. X., Liu X. M., Wang C., Wang Y., Fu Z., Hou P., et al. (2021). Evaluating changes in ecological land and effect of protecting important ecological spaces in China. J. Geographical Sci. 31, 1245–1260. doi: 10.11821/dlxb202107010
Haimes Yacov Y. (2009). On the definition of resilience in systems. Risk Analysis 29, 498–501. doi: 10.1111/j.1539-6924.2009.01216.x
Holling C. S. (1973). Resilience and stability of ecological systems. Annu. Rev. Ecol. Systematics 4, 1–23. doi: 10.1146/ANNUREV.ES.04.110173.000245
Holling C. S. (1996). “Engineering resilience versus ecological resilience,” in Engineering within ecological constraints (Washington: National academies press), 31–34.
Huang X. Y., Zhao X. M., Guo X., Jiang Y. F., Lai X. H. (2020). The natural ecological spatial management zoning based on ecosystem service function and ecological sensitivity. Acta Ecol. Sinica 40, 1065–1076. doi: 10.5846/stxb201811152474
Jiang M. Q., Liu Y. (2020). Discussion on the concept definition and spatial boundary classification of “Production-Living-Ecological” space. Urban Dev. Stud. 27, 43–48. doi: CNKI:SUN:CSFY.0.2020-04-007
Jin G., Chen K., Wang P., Guo B. S., Dong Y., Yang J. (2019). Trade-offs in land-use competition and sustainable land development in the north China plain. Technol. Forecasting Soc. Change 141, 36–46. doi: 10.1016/j.techfore.2019.01.004
Jin X., Wei L., Wang Y., Lu Y. (2020). Construction of ecological security pattern based on the importance of ecosystem service functions and ecological sensitivity assessment: a case study in Fengxian County of Jiangsu Province, China. Environment Dev. Sustainability 23, 1–28. doi: 10.1007/s10668-020-00596-2
Kong L. Q., Wang Y. Q., Zheng H., Xiao Y., Xu W. H., Zhang L., et al. (2019). A method for evaluating ecological space and ecological conservation redlines in river basins: A case of the Yangtze River Basin. Acta Ecol. Sinica 39, 835–843. doi: 10.5846/stxb201802060314
Liu H. J., Niu T., Yu Q., Yang L. Z., Ma J., Qiu S. (2022). Evaluation of the spatiotemporal evolution of China’s ecological spatial network function-structure and its pattern optimization. Remote Sensing 14, 4593–4593. doi: 10.3390/RS14184593
Liu H. L., Liu H. F. (2021). Value evaluation of biodiversity conservation in Dongting lake wetland. J. Cent. South Univ. Forestry Technol. 41, 140–147. doi: 10.14067/j.cnki.1673-923x.2021.10.016
Liu J. Y., Liu W. C., Kuang W. H., Ning J. (2016). Remote sensing-based analysis of the spatiotemporal characteristics of built-up area across China based on the Plan for Major Function-oriented Zones. Acta Geographica Sinica 71, 355–369. doi: 10.11821/dlxb201603001
Liu X. Q., Wang X., Chen K. L., Li D. (2023). Simulation and prediction of multi-scenario evolution of ecological space based on FLUS model: A case study of the Yangtze River Economic Belt, China. J. Geographical Sci. 33, 373–391. doi: 10.1007/S11442-023-2087-9
Long H. L., Liu Y. Q., Li T. T., Wang J., Liu A. X. (2015). A primary study on ecological land use classification. Ecol. Environ. Sci. 24, 1–7. doi: 10.16258/j.cnki.1674-5906.2015.01.001
Luo F. H., Liu Y. X., Peng J., Wu J. S. (2018). Assessing urban landscape ecological risk through an adaptive cycle framework. Landscape Urban Planning 180, 125–134. doi: 10.1016/j.landurbplan.2018.08.014
Ngom R., Gosselin P., Blais C. (2016). Reduction of disparities in access to green spaces: Their geographic insertion and recreational functions matter. Appl. Geography 66, 35–51. doi: 10.1016/j.apgeog.2015.11.008
Ouyang Z. Y., Wang X. K., Miao H. (2020). China’s eco-environmental sensitivity and its spatial heterogeneity. Acta Ecol. Sinica 20, 9–12. doi: 10.3321/j.issn:1000-0933.2000.01.002
Pan F. J., Wang H. Z., Song M. J., Chen A., Wang L. Y. (2020). Research on spatial identification of ecological space in national key ecological function regions based on GIS: a case study of Changyang County in Hubei Province, China. J. Cent. China Normal Univ. (Nat. Sci.) 54, 658–669. doi: 10.19603/j.cnki.1000-1190.2020.04.017
Peng J., Liu Y. X., Wu J. S., Lv H. L., Hu X. X. (2015). Linking ecosystem services and landscape patterns to assess urban ecosystem health: A case study in Shenzhen City, China. Landscape Urban Planning 143, 56–68. doi: 10.1016/j.landurbplan.2015.06.007
Peterson G. D. (2002). Contagious disturbance, ecological memory, and the emergence of landscape pattern. Ecosystems 5, 329–338. doi: 10.1007/s10021-001-0077-1
Turner M. G. (1989). Landscape ecology: The effect of pattern on process. Annu. Rev. Ecol. Systematics 20, 171–197. doi: 10.1146/annurev.es.20.110189.001131
Vugrin E. D., Warren D. E., Ehlen M. A. (2011). A resilience assessment framework for infrastructure and economic systems: Quantitative and qualitative resilience analysis of petrochemical supply chains to a hurricane. Process Saf. Progress 30, 280–290. doi: 10.1002/prs.10437
Walker B., Holling C. S., Carpenter S. R., Kinzig A. (2004). Resilience, adaptability and transformability in social-ecological systems. Ecol. Society 9, 5. doi: 10.5751/ES-00650-090205
Walker B., Salt D. (2006). Resilience thinking: sustaining ecosystem and people in a changing world (Washington, DC: Island Press).
Wang S. H., Huang L., Xu X. L., Li J. H. (2022). Spatio-temporal variations in ecological spaces and their ecological carrying status in China’s mega-urban agglomerations. J. Geographical Sci. 32, 1683–1704. doi: 10.1007/s11442-022-2018-1
Wang F. Y., Wang K. Y., Chen T., Li P. (2017). Progress and prospect of research on urban ecological space. Prog. Geography 36, 207–218. doi: 10.18306/dlkxjz.2017.02.007
Wei Y., Xiu C. L. (2020). Study on the concept and analytical framework of city network resilience. Prog. Geography 39, 488–502. doi: 10.18306/dlkxiz.2020.03.013
Xia C. Y., Dong Z. Y. Z., Chen B. (2022). Spatio-temporal analysis and simulation of urban ecological resilience: A case study of Hangzhou. Acta Ecol. Sinica 42, 116–126. doi: 10.5846/stxb202101030007
Xie G. D. (2015). Biodiversity and ecosystem services in city. Environ. Protection 43, 25–28. doi: 10.14026/j.cnki.0253-9705.2015.05.004
Xie G. D., Zhang C. X., Zhang L. M., Chen W. H., Li S. M. (2015). Improvement of the evaluation method for ecosystem service value based on per unit area. J. Natural Resources 30, 1243–1254. doi: 10.11849/zrzyxb.2015.08.001
Yang X. P., Wang L. K., Li Y. B., Hou Y. J., Niu J. (2021). Review and prospects of resilient city theory. Geogr. Geo-Information Sci. 37, 78–84. doi: 10.3969/j.issn.1672-0504.2021.06.012
Yu F., Li X. B., Zhang L. J., Xu W. H., Fu R., Wang H. (2015). Study of ecological land in China: Conception, classification, and spatial-temporal pattern. Acta Ecol. Sinica 35, 4931–4943. doi: 10.5846/stxb201311052672
Zhan M. S., Zhu J. H. (2019). Spatial planning of Qingyun Mountain scenic spot in Benxi, Northeast China based on ecological sensitivity assessment. Chin. J. Appl. Ecol. 30, 2352–2360. doi: 10.13287/j.1001-9332.201907.037
Zhang C. S., Fan N., Liu C. L., Xie G. D. (2023). Spatio-temporal pattern and evolution of ecosystem water conservation in China from 1990 to 2018. Acta Ecol. Sinica 43, 1–10. doi: 10.5846/stxb202107191937
Zhang L., Yue W. Z. (2019). Integrated recognition of urban ecological space: A case study on Hangzhou. Acta Ecol. Sinica 39, 6460–6468. doi: 10.5846/stxb201804100817
Zhang C. X., Zhang L. M., Li S. M., Zhang C. S. (2015). Soil conservation of national key ecological function areas. J. Resour. Ecol. 6, 397–404. doi: 10.5814/j.issn.1674-764x.2015.06.007
Zhao H. L., Xu Y., Zhou Y., Zhang G. L., Chen X. (2022). Quantitative identification and analysis of spatiotemporal evolution characteristics of ecological space: A case study of Hulun Buir city. J. Natural Resources 37, 2153–2168. doi: 10.31497/zrzyxb.20220815
Keywords: ecological space, resilience, ecosystem service, landscape pattern, Xiong’an New Area
Citation: Liang X, Gao X, Zhao M, Guo Z and Shen W (2023) Ecological space resilience assessment of Baiyangdian Basin from the perspective of evolutionary resilience. Front. Ecol. Evol. 11:1200218. doi: 10.3389/fevo.2023.1200218
Received: 04 April 2023; Accepted: 17 October 2023;
Published: 27 October 2023.
Edited by:
Hualin Xie, Jiangxi University of Finance and Economics, ChinaReviewed by:
Zhe Feng, China University of Geosciences, ChinaPattiyage Ishan Ayantha Gomes, Sri Lanka Institute of Information Technology, Sri Lanka
Copyright © 2023 Liang, Gao, Zhao, Guo and Shen. This is an open-access article distributed under the terms of the Creative Commons Attribution License (CC BY). The use, distribution or reproduction in other forums is permitted, provided the original author(s) and the copyright owner(s) are credited and that the original publication in this journal is cited, in accordance with accepted academic practice. No use, distribution or reproduction is permitted which does not comply with these terms.
*Correspondence: Xing Gao, Z2FveGluZ0BodWViLmVkdS5jbg==
 Xinyu Liang
 Xing Gao1,2,3,4*