 Xin-xin Sun
 Shou-gong Wang3†
95% of researchers rate our articles as excellent or good
Learn more about the work of our research integrity team to safeguard the quality of each article we publish.
Find out more
ORIGINAL RESEARCH article
Front. Ecol. Evol. , 04 September 2023
Sec. Biogeography and Macroecology
Volume 11 - 2023 | https://doi.org/10.3389/fevo.2023.1197548
Since China’s reform and opening-up period, the southern Jiangsu urban agglomeration has been one of the fastest urbanizing regions in the country. This rapid urbanization has led to dramatic changes in land use cover that have been the primary drivers of carbon stock changes in the terrestrial ecosystem. In this study, we utilize the Integrated Valuation of Ecosystem Services and Trade-offs (InVEST) model and a patch-generating land use simulation (PLUS) model to analyze the land use changes and carbon stocks in the southern Jiangsu urban agglomeration over the past 30 years. We then simulate the carbon stock changes in the study area in the year 2050 under natural growth, cultivated land conservation, and ecological conservation scenarios. The results showed that 1) over the past 30 years, the urban area has increased by 2.98 times, reaching 7,408.42 km2 by 2020. In contrast, the area of cultivated and forested land has continued to decrease with rapid urbanization. 2) Between 1990 and 2020, the carbon stock of the urban agglomeration in southern Jiangsu decreased by 5.34%. The changes in the spatial distribution of carbon stocks are consistent with the changes in land use. 3) By 2050, the carbon stock loss was the largest under the natural growth scenario at 10.49 mt, while the carbon stock loss was the smallest under the cultivated land protection scenario at 0.97 mt. Under the ecological protection scenario, the carbon stock loss was 9.9 mt. The results indicate that the adoption of cultivated land and ecological protection measures can effectively control the reduction of carbon stock in rapidly urbanizing areas. 4) The conversion of cultivated land and forest land to urban land was the primary reason for the carbon stock reduction in the study area, which was primarily located in the urban outward expansion area. This study provides a reference- and data-based support for the management, decision-making, and planning in rapidly urbanizing areas.
In recent decades, cities worldwide, and especially in developing countries, have experienced rapid urbanization. The global urbanized area increased from 650,000 km2 in 2000 to 1.86 million km2 in 2030 (Yang et al., 2020). Urbanization is a long-term process that can improve socioeconomic development and enhance people’s quality of life (Bhatti et al., 2016; Hofmann et al., 2019). However, it can also cause land use cover changes and ecological problems in cities (Zhao et al., 2013; Sadiq Khan et al., 2020; Iserhard et al., 2021; Cao et al., 2022; Tian et al., 2022; Zeng et al., 2023).
The carbon stock of terrestrial ecosystems is an important component of the global carbon stock that can effectively absorb atmospheric CO2 and slow down global warming. It is an important factor in the global carbon cycle balance (Xiang et al., 2022) and plays a key role in regulating global climate change (Zhu et al., 2021). Land use changes alter the structure and function of urban ecosystems. These changes also affect the carbon sequestration capacity of vegetation and soils, leading to changes in carbon stocks in terrestrial ecosystems (Wang et al., 2021). Quantifying the relationship between land use and carbon storage is important for studying carbon storage in terrestrial ecosystems (Qu et al., 2011).
Current studies on changes in carbon stock due to changes in land use have been conducted primarily in terms of countries and groups of countries (Zaehle et al., 2007; Janes-Bassett et al., 2021; Olorunfemi et al., 2021; Whitehead et al., 2021), special geoclimatic zones (Yang et al., 2009; Yang et al., 2017; Li et al., 2020), watersheds (Tong et al., 2019; Zhu et al., 2020; Wang J. et al., 2022), provinces (Liu et al., 2022), and urban clusters and cities (Jiang et al., 2017; Yang et al., 2020; Wang C. et al., 2022; Wang Z. et al., 2022; Wang Ao. et al., 2022; Wu et al., 2023). Zaehle et al. (2007) studied the changes in carbon stocks in Europe under climatic land use changes from 1990 to 2100 and showed that a decrease in agricultural land and forest land was the primary reason for carbon stock changes in Europe. Olorunfemi et al. (2021) studied land use changes and the carbon stock in sub-Saharan Africa and found that the primary cause of carbon stock change on the continent was deforestation, particularly the expansion of agricultural land, which caused 70%−80% of the total forest loss. Zhu et al. (2021) discussed the decline in carbon stocks due to land use changes in China’s drylands from 1980 to 2015 and found that grassland degradation was the primary reason for the decrease in the dryland carbon stocks. Zhu et al. (2022) studied coastal urban agglomerations in China from 1980 to 2050 and found that the more rapidly urbanizing the area was, the more pronounced the decline in carbon stocks was.
China has experienced rapid urbanization since its reform and opening-up period. The level of urbanization increased from 17.9% in 1978 to 56.1% in 2015, and it is expected to reach 66.4% by 2050 (Yuan et al., 2018). The Yangtze River Delta city cluster is one of the most urbanized regions in China, and super metropolises such as Shanghai, Nanjing, Hangzhou, and Suzhou have emerged in it. The southern Jiangsu urban agglomeration is the core urban agglomeration in the Yangtze River Delta urban agglomeration in China. It includes the five cities of Nanjing, Zhenjiang, Changzhou, Wuxi, and Suzhou. Notably, 33.6% of China’s national GDP in 2022 came from the 41 cities in the Yangtze River Delta urban agglomeration.
This rapid urbanization has caused massive changes in land use. Between 1990 and 2020, the construction land area in the southern Jiangsu urban agglomeration expanded by 2.98 times. The dramatic changes in land use have had a significant impact on the ecological environment and carbon storage of the region (Zhang et al., 2021). As one of the fastest growing regions in China, the South Jiangsu urban agglomeration has developed a series of initiatives to cope with these changes. Each city has promulgated the 14th Five-Year Plan for Low Carbon Development and the Three-Year Action Plan for Green Low-Carbon Cycle Development; however, the energy-saving and carbon reduction situation remains serious.
This study investigates the land use and carbon stock changes in the southern Jiangsu urban agglomeration during the past 30 years based on the Integrated Valuation of Ecosystem Services and Trade-offs (InVEST) model. We also simulate the carbon stock status of the southern Jiangsu urban agglomeration in 2050 under different development scenarios using the patch-generating land use simulation (PLUS) model. We analyze the contribution from the driving factors of land use changes, with the specific objectives of 1) investigating land use changes in the southern Jiangsu urban agglomeration from 1990 to 2020, 2) determining the impact of land use changes on the carbon stock in the southern Jiangsu urban agglomeration from 1990 to 2020, and 3) simulating the carbon stock changes in the southern Jiangsu urban agglomeration in 2050 under different scenarios. Land use is an important factor that limits the carbon stock calculation in terrestrial ecosystems. Although there are many studies on carbon stock changes due to land use change, the driving factors of land use changes in rapidly urbanizing areas are less studied, and most of the existing studies have studied the carbon stock or spatial and temporal changes in ecosystems based on past land use. There have been fewer studies that have simulated the carbon stock status of future cities under different development scenarios. This study combines the InVEST model and the PLUS model to calculate the future carbon stock in the study area more accurately. The results of this study are intended to provide scientific data for territorial spatial planning of the southern Jiangsu urban agglomeration. We also provide a reference for regional ecological environmental protection, ecosystem carbon storage, and the protection of the Yangtze River economic zone ecosystem.
The South Jiangsu urban agglomeration (Figure 1) is located in the lower reaches of the Yangtze River, with geographical coordinates of 30°47′N–32°37′N, 118°22′E–121°20′E. Its total land area is 28,085.36 km2, its resident population is 38.318 million, and its urbanization rate is 81.96%. It is one of the most densely populated areas in China. The 2022 GDP of the South Jiangsu urban agglomeration was 70,283 trillion, accounting for 57.20% and 5.81% of the total economic output of Jiangsu Province and the country, respectively. The study area has a subtropical monsoon climate with an average annual temperature of 17.4°C and an average annual rainfall of 1,326 mm. The landscape is dominated by low hills in the west and plains in the east, with abundant water systems and a dense network of rivers. The land resources in the region are primarily cultivated land and water areas, while the amount of woodland and grassland is small and unevenly distributed. The eastern portion lacks mature woodland. The rapid expansion of construction land has led to many ecological problems, such as habitat fragmentation and shrinking lake areas.

Figure 1 Map of the study area.
The land use data in this study were obtained from the Resource and Environment Science and Data Center of the Chinese Academy of Sciences (https://www.resdc.cn/). The remote sensing image interpretation data from 1990, 2000, 2010, and 2020 had a resolution of 30 m. Six categories of land were included: cultivated land, forest land, grassland, water areas, construction land, and unused land (Table 1).
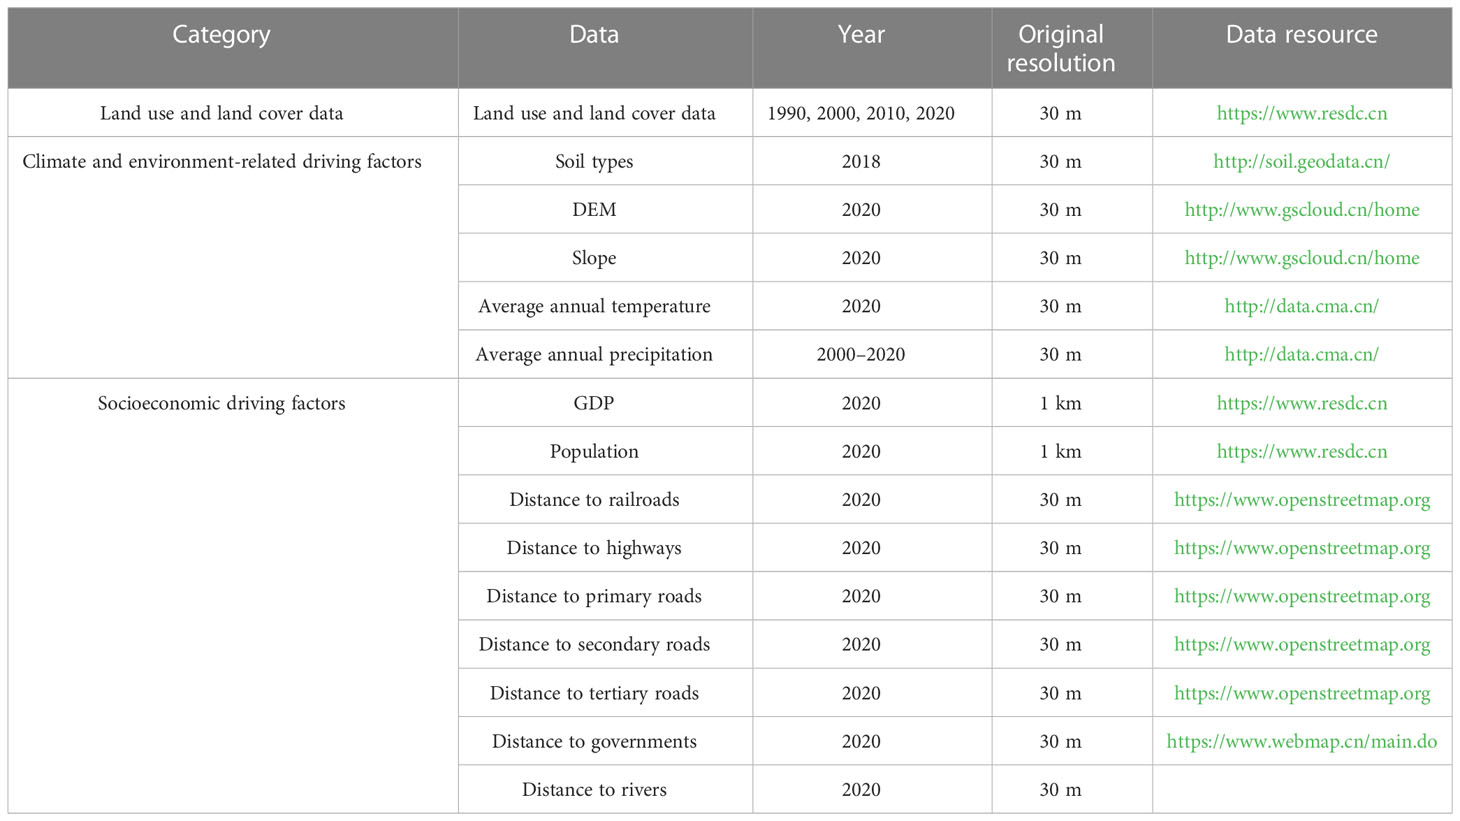
Table 1 Spatial driving factors of the land use changes in this study.
There were 14 driving factors of land use changes, which were divided into two categories; specifically, there were five drivers related to climate and the environment and nine drivers related to socioeconomic factors (Figure 2). The GDP and population data were obtained from the Resource and Environment Science and Data Center of the Chinese Academy of Sciences (https://www.resdc.cn) with a resolution of 1 km. The digital elevation model (DEM) elevation data and slope data were obtained from the Geospatial Data Cloud (http://www.gscloud.cn/home) with a resolution of 30 m. For the climate and environment data, the average annual temperature and average annual precipitation were obtained by interpolating the data from the National Meteorological Science Database (http://data.cma.cn) with inverse distance weights. The soil type data were obtained from the National Earth System Science Data Center Soil Subcenter (http://soil.geodata.cn). For the socioeconomic data, the distances to roads, county governments, and rivers and bodies of water were obtained from OpenStreetMap (https://www.openstreetmap.org), and the ArcGIS Euclidean distances were calculated (Table 1).
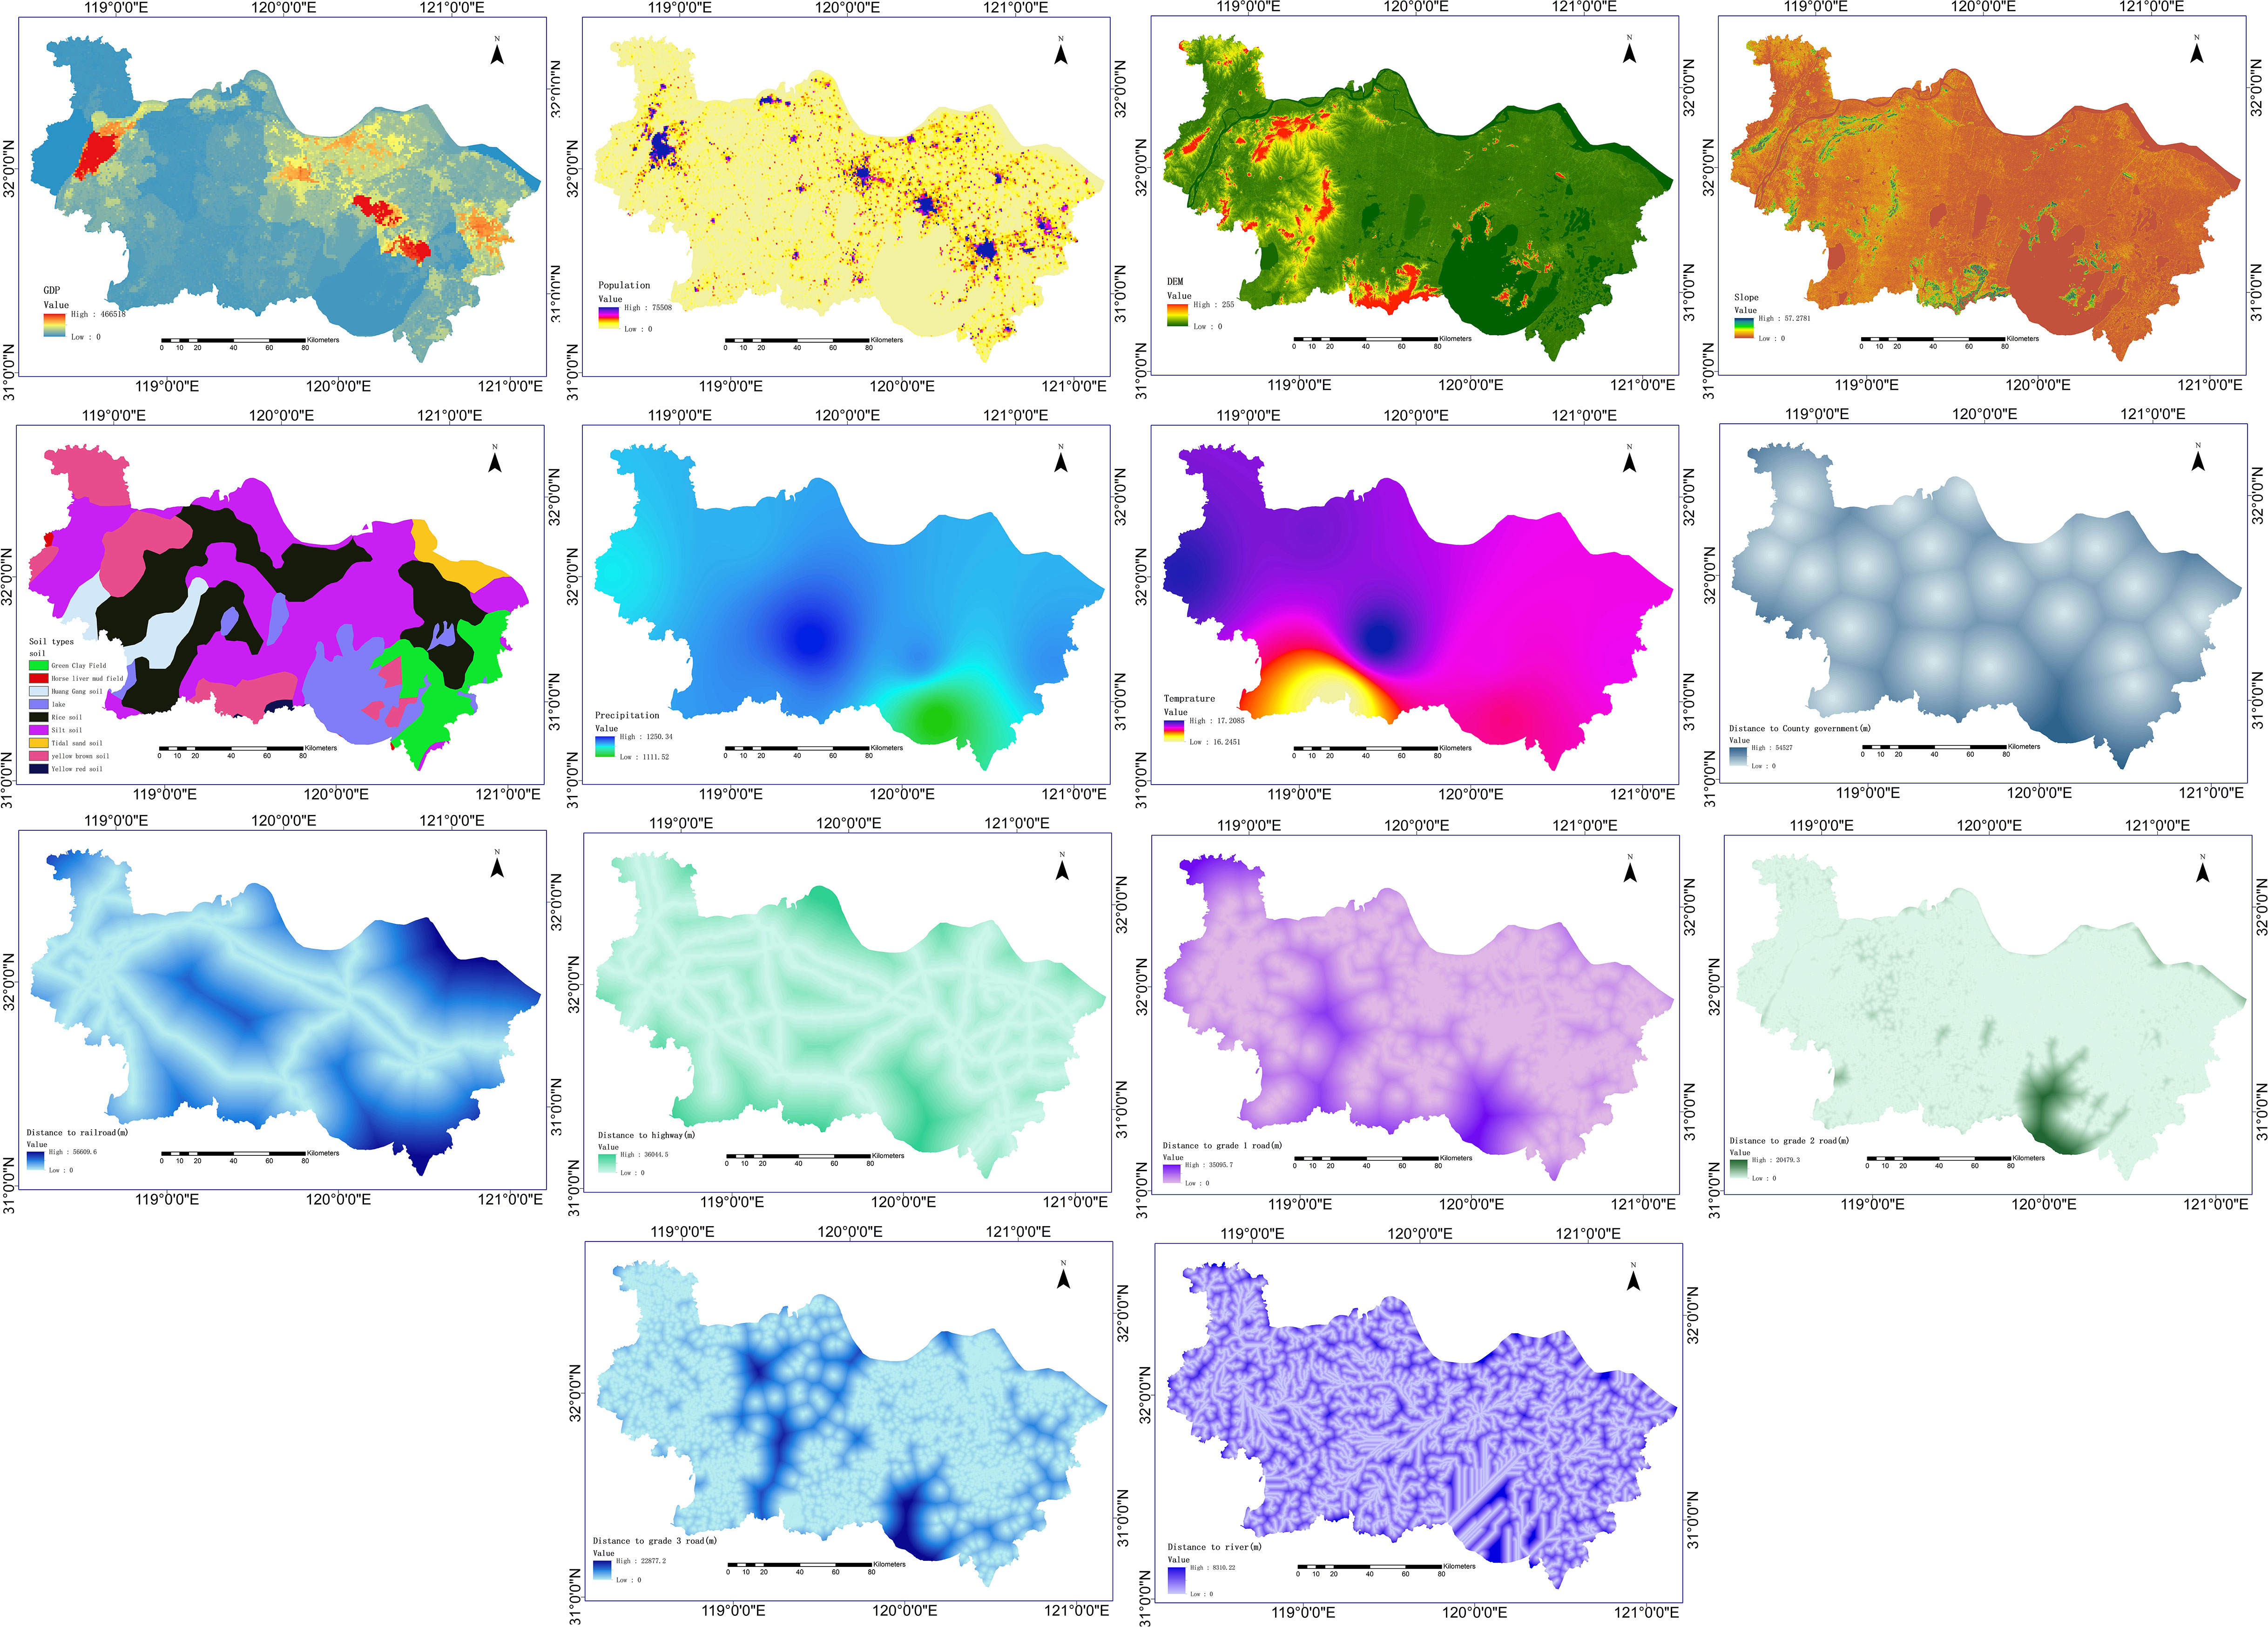
Figure 2 Primary driving factors of land use changes in the southern Jiangsu urban agglomeration.
InVEST is a model that is used to assess ecosystem services and their economic value, including water conservation, soil and water conservation, habitat quality, carbon storage, and other modules. It is currently used in national, regional, and watershed ecological function zoning; ecological red line delineations; ecological restoration; and resource and environmental carrying capacity assessments. The carbon storage module of the InVEST model consists of four primary modules of carbon storage: aboveground biochar (carbon in living vegetation on land), belowground biochar (carbon in living plant roots), soil carbon (carbon contained in soil), and dead organic carbon (carbon in dead plant litter). The total carbon stock is calculated using the following equation (Liu et al., 2019):
where i is the land use type; Ci is the total carbon density of the land use type i; Ci-above is the carbon density of aboveground vegetation of the land use type i; Ci-below is the carbon density of underground living roots of the land use type i; Ci-soil is the carbon density in the soil of the land use type i; Ci-dead is the carbon density of vegetation die-off of the land use type i; the unit of the above carbon density is t/hm2; Ctotal is the total carbon stock; Si is the total area of the land use type i, hm2; and n is the total number of land use types. In this study, n = 6.
In this study, the carbon density data were obtained from the existing literature, and the same or similar areas as the study area were preferred. The carbon densities of these areas were measured, or the surveyed data were utilized. The aboveground carbon density was obtained from the 2010 Chinese terrestrial ecosystem soil 0–100 cm carbon density dataset (Xu et al., 2019) and a study of the impact of land use changes on carbon storage in terrestrial ecosystems in Jiangsu Province (Chuai et al., 2011). The soil carbon density data were selected with reference to the values of carbon density studies by Chuai et al. (2011); Jiang et al. (2005), and others, and these were combined with the soil types of urban clusters in southern Jiangsu. The precipitation–carbon density relationship model (Alam et al., 2013) was used to correct the aboveground carbon density and soil carbon density data, and the model equation was as follows:
where MAP is the average annual rainfall in the study area; CBP is the aboveground biological carbon density calculated based on rainfall; CSP is the soil carbon density calculated based on rainfall, kg/m2; KBP is the rainfall correction factor for the aboveground biological carbon density; KSP is the rainfall correction factor for the soil biological carbon density; CBP1 and CSP1 are the aboveground and soil carbon density of Nanjing, respectively; and CBP2 and CSP2 are the aboveground and soil carbon density of Jiangsu Province, respectively. CBP1 and CSP1 are the aboveground and soil carbon density in Nanjing, respectively, and CBP2 and CSP2 are the aboveground and soil carbon density in Jiangsu Province, respectively. The carbon density data of Jiangsu Province were multiplied with the KBP and KSP correction coefficients to obtain the aboveground biological carbon density values and soil carbon density values in southern Jiangsu, and the above carbon density units were t/hm2.
For the belowground carbon density values, the biomass factor conversion method (Fang and Wang, 2001) was used, and the calculation equation was as follows:
where Cibelow is the belowground biological carbon density, t/hm2; i is the land use type; DWi is the aboveground biomass of the i, land use type (t/hm2); a is the conversion coefficient; b is the ratio of the belowground to aboveground biomass according to the research results of Fang and Wang (2001) and Huang et al. (2006), and the value of b is 0.2 for cultivated land, 0.3 for forest land, and 4.3 for grassland. The dead carbon density was taken according to the research results of Li et al. (2020) and modified by the rainfall model. Finally, a carbon density table of the land use types in the southern Jiangsu urban agglomeration was created (Table 2).
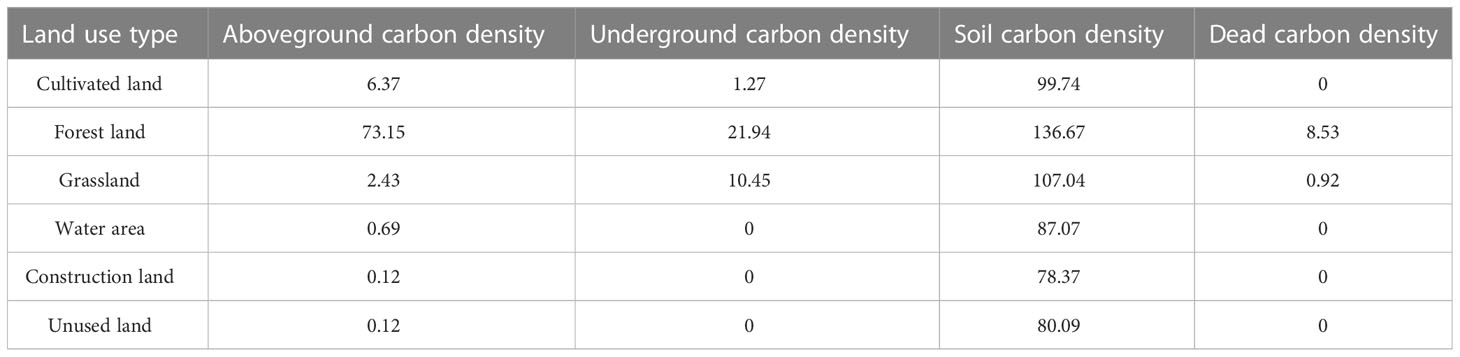
Table 2 Carbon density value of each land use type in the study area (t/hm2).
The PLUS model is a new land use simulation model based on cellular automata. It is utilized for studying the causes of land use change and dynamically simulating a variety of land use change patches, especially for forest land and grassland. By extracting samples of the intertransformation of various types of land use between two periods of land use data for training, future land use is simulated based on the probability of transformation. The random forest algorithm is used to calculate the factors and drivers of land use expansion for each type. The probability of each land use type being developed and the contribution of the drivers to the expansion of each land use type can then be obtained. This is then combined with the generation of random patches and the establishment of a transfer transition matrix used to determine the future land use situation. Two primary modules are included.The land expansion analysis strategy (LEAS) is used to analyze the land use data of two dates and to obtain the change pattern of land use types using the growth patches of each changing land use type. This is utilized to describe the characteristics of land use changes in a specific time interval. In addition, the random forest classification (RFC) algorithm is utilized to explore the relationship between the growth of different land use types and multiple drivers. The probability of development is obtained and calculated using Eq. 1 (Liang et al., 2021) as follows:
where X is a vector consisting of the driving factors; M is the number of decision trees; d takes the value of 0 or 1, where 1 means other land use types that can be transformed to land use type k and 0 means other land types that cannot be transformed to land type k; hn(X) is the simulated land use type calculated at the decision tree of n; I[hn(X) = d] is the exponential function of the decision number; and is the type k at spatial unit i the probability of land use type growth at spatial cell i.
Cellular automata based on multiple random seeds (CARS) is a scenario-driven land use simulation model based on meta-cellular automata that primarily simulates the subsequent land use distribution pattern by obtaining the development probability of each type of land use. The total probability of conversion of a land use type k in Eq. 2 (Liang et al., 2021) is as follows:
where denotes the probability of the growth of land use type k on cell i, is the domain effect of cell i, and denotes the effect of future demand for land use k. These are calculated using Eqs. 3 and 4 (Liang et al., 2021) as follows:
where con denotes the total number of grid cells occupied by the kth land use type in the last iteration in the n × n window, wk is the weight between different land use types with a default value of 1, and is the difference between the current demand and future demand of land use type k at the t−1st and t−2nd iterations.
The LEAS parameters were set as follows: the value of the decision tree was set to 20, the sampling rate was 0.01 by default, mTry did not exceed the number of driving factors and was set to 14, and the number of parallel threads was set to 1. The CARS parameters were set as follows: the neighborhood range was set to the default value of 3, the thread was set to 1, the decreasing threshold factor was 0.5, the diffusion factor was 0.1, and the random patch seed probability was 0.0001.
Using land use data from 2000 and 2010, a Markov simulation of land use in 2020 was obtained using the PLUS model, the actual land use data in 2020 were entered in the validation module, and the kappa coefficient was obtained as 0.85. When the kappa coefficient was greater than 0.75, this indicated that the land use results simulated by the model were more accurate.
Three development scenarios were established in this study: the natural development scenario (NDS), where the development of each land use type continued the current development trend without adjustment; the ecological protection scenario (EPS), which is a scenario that restricts the conversion of ecological land, such as forest land, grassland, and water areas, to other land; and the cultivated land protection scenario (CPS), which protects cultivated land and restricts the conversion of cultivated land to other land. The multiscenario transfer matrix is established in Table 3, where 1 means that the conversion of land types can occur and 0 means that the conversion of land types cannot occur. a, b, c, d, e, and f represent the six land types: cultivated land, forest land, grassland, water areas, construction land, and unused land, respectively. The research framework is shown in Figure 3.
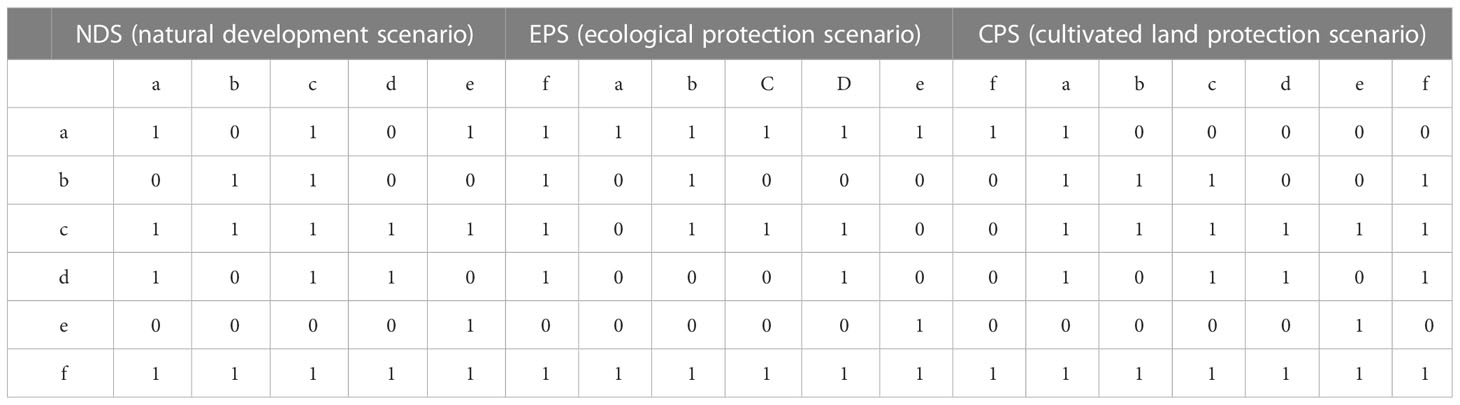
Table 3 Multiscene transfer matrix setting.
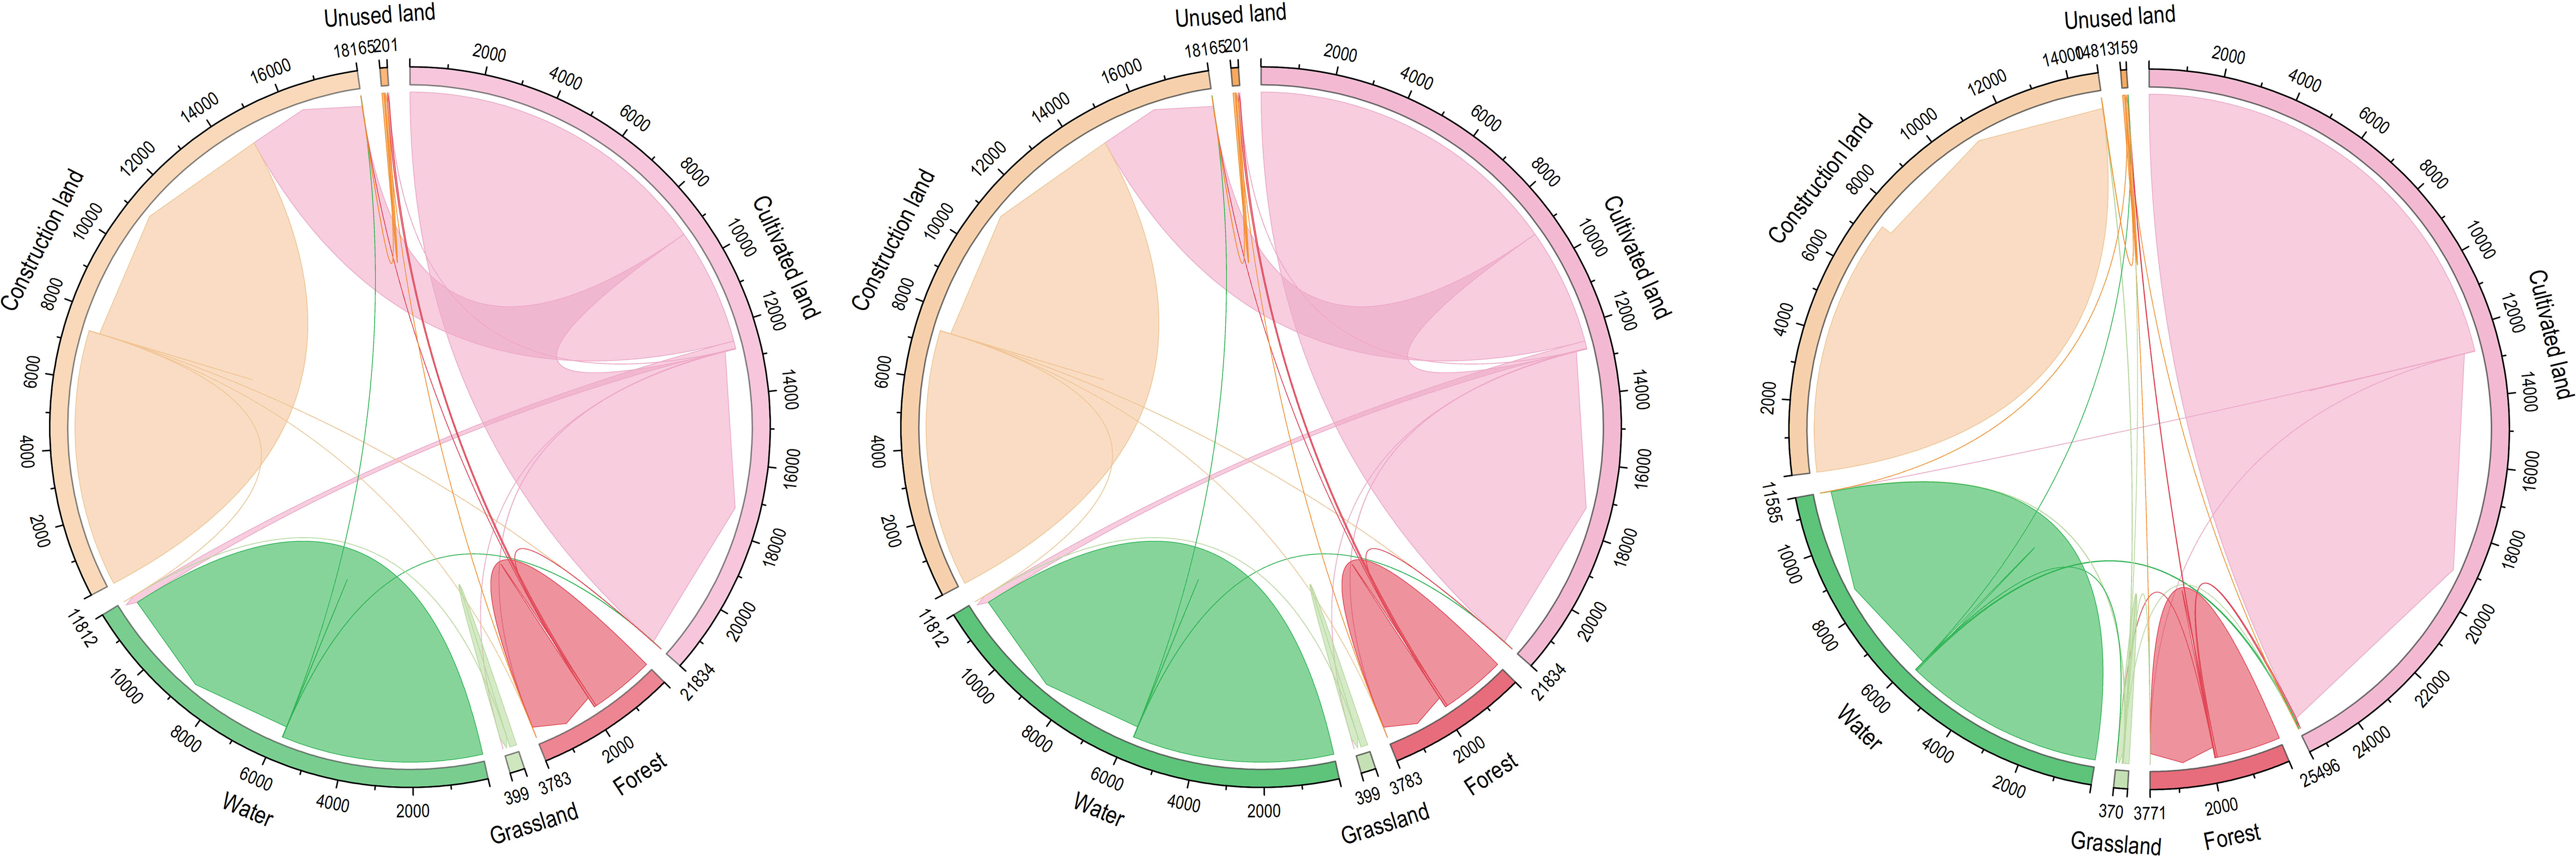
Figure 3 Research framework.
In this study, the InVEST model and the PLUS model were combined to calculate the carbon stock in the study area. First, based on the four periods of LULC classification data in the study area in 1990, 2000, 2010, and 2020, the InVEST model was used to calculate the carbon stocks of different land use types. Then, the total carbon stock was aggregated. After that, the LULC data from 2010 were used as the base period data, and the changing trend from 2010 to 2020 was used to forecast the LULC in 2020 using the PLUS model. Then, the simulation accuracy was verified with the actual LULC data from 2020 to ensure that the simulation accuracy met the research requirements. Finally, the LULC in 2050 was simulated by the PLUS model using the 1990–2020 change trend with the LULC data in 2020 as the base period data.
From 1900 to 2020, the areas of cultivated land and forest land in the southern Jiangsu urban agglomeration decreased by 5,292.48 and 115.11 km2, respectively. The proportion of cultivated land decreased from 64.01% to 45.18%. The percentage of forest land decreased from 7.23% to 6.82%. The areas of grassland, water areas, construction land, and unused land increased by 46.24, 377.09, 4,921.32, and 61.77 km2, respectively, and the proportions increased by 0.22%, 1.99%, 13.47%, and 0.17%. Across all land types, the proportion of cultivated land decreased the most, whereas that of construction land increased the most. The specific conversion of land use changes in the study area from 1990 to 2020 is shown in Table 3, The distribution of new land and land use from 1990 to 2020 is shown in Figure 4.
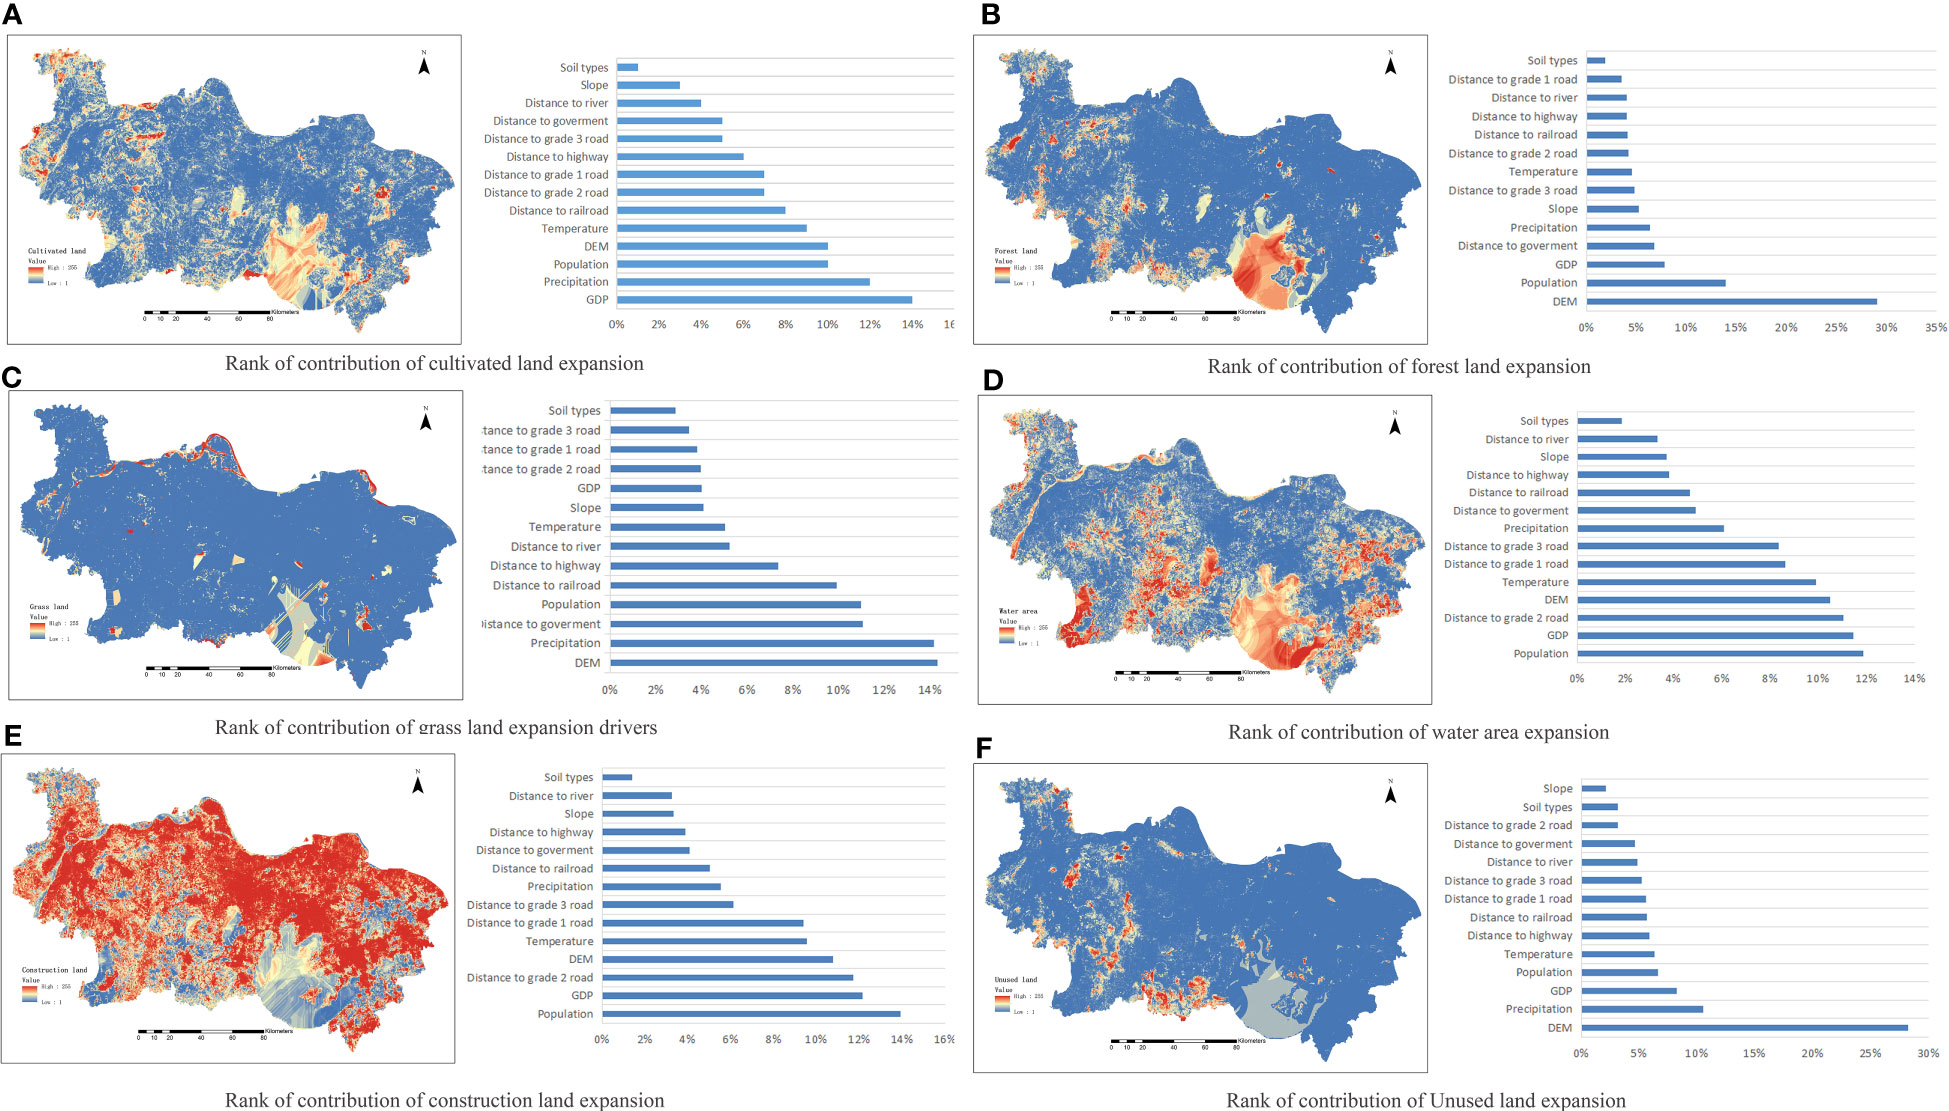
Figure 4 Land use and change from 1990 to 2020 and land use in the 2050 scenarios.
From 1990 to 2020, land use changes in the study area could be divided into approximately three stages (Table 4). 1) In the slow development stage (1990−2000), the study area’s economy and urbanization were in the early development stage. During this period, cultivated land area decreased by 5.42% and the construction land area increased by 5.1%. 2) The rapid development stage (2000−2010) was a decade of rapid economic development in the study area, and the expansion of land use caused by urbanization was the most significant in this phase, with the area of cultivated land decreasing by 11.17% and that of construction land increasing by 9.63%. 3) In the stable development phase (2010−2020), economic development and urban construction in the study area entered a relatively stable phase, and the rate of change of various land types gradually slowed down. During this decade, the area of cultivated land in the study area decreased by 2.24%, while that of the construction land increased by 2.79%. The new construction land caused by rapid urbanization in the study area was primarily converted from cultivated land, and this part of the conversion was primarily located in the area where the original built-up area of the city expanded outward, as shown in Figure 4 and Table 4.
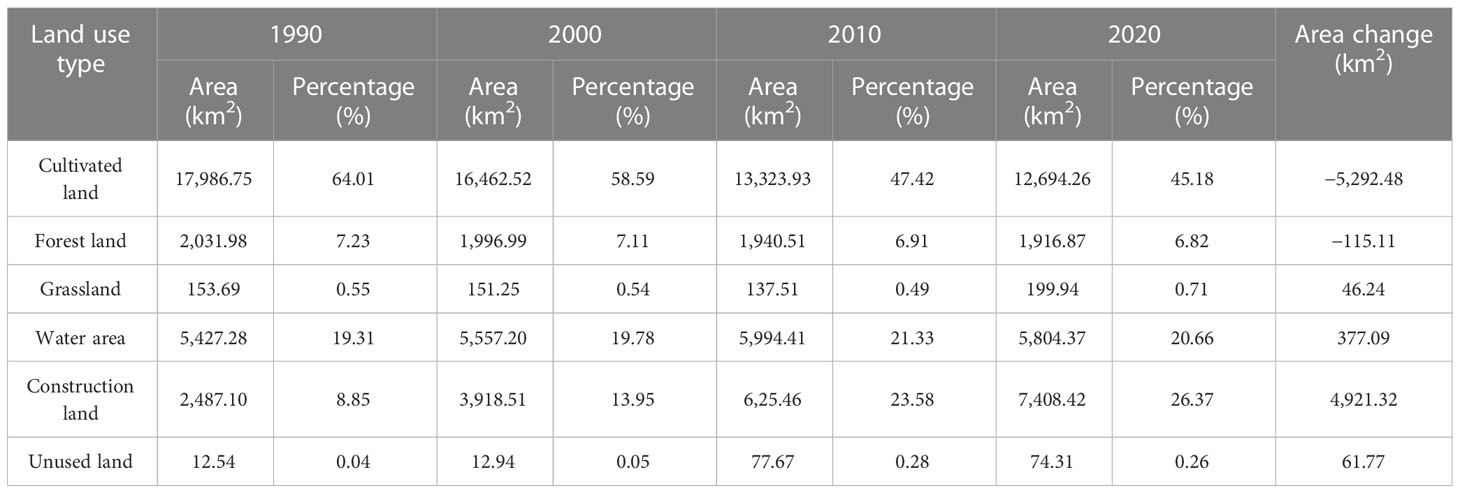
Table 4 Area and percentage of land use in the study area from 1990 to 2020.
The conversion of cultivated land area to construction land area and water area was the largest, at 4,777.78 and 651.21 km2, respectively, from 1990 to 2020 (Table 5). With an increase in the people’s awareness of environmental protection, under ecological protection policies such as returning polder fields to their lakes, cultivated land area was converted to water area. In addition, the demand for aquatic products has increased, and the aquaculture area also increased. The increase in water areas was primarily located in the Gaochun District of Nanjing, Zhenjiang Danyang City in Nanjing, Liyang City in Changzhou, and Yangcheng Lake in Suzhou.
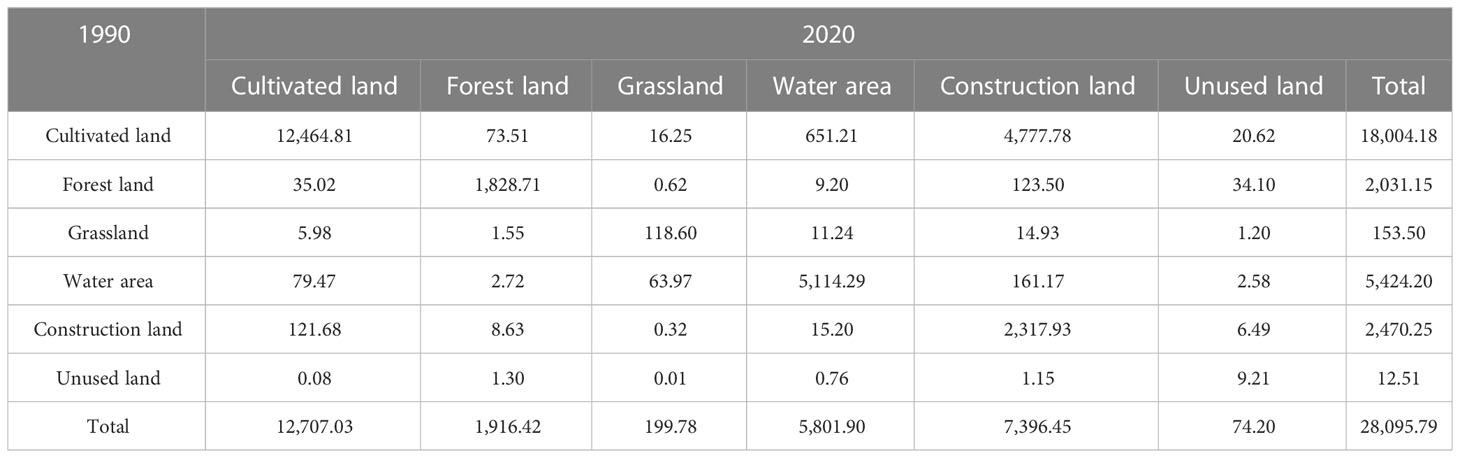
Table 5 Land use transfer matrix from 1990 to 2020.
The conversion of forest land to construction land, cultivated land, and unused land was high, at 123.50, 35.02, and 34.10 km2, respectively, from 1990 to 2020 (Table 5). This was because the expansion of urban construction land caused encroachments into forest land, while indiscriminate deforestation caused the conversion of forest land to cultivated land and unused land.
The proportion of grassland in the study area from 1990 to 2020 was relatively small, accounting for only approximately 0.7% of the total land area. It was primarily located on the riverbanks and islands along the Yangtze River, as well as Ge Lake, Taihu Lake, Tianmu Lake, and other lakes. Most of the converted grassland became construction land and water areas. This was attributed to urban development and fish farming along rivers and lakes encroaching on the original grasslands. To some extent, the ecological environment along the Yangtze River and lakes, especially the habitats of plants and animals, has been destroyed.
Water areas were primarily converted to construction land and cultivated land, with 161.17 and 79.47 km2 of water converted to these land types, respectively. This was due to the expansion of urban and rural areas causing some water areas to be filled and turned into construction land.
Construction land was primarily converted to cultivated land and water, with 121.68 and 15.20 km2 of construction land being converted to these land types, respectively, because urbanization led to a large amount of unused construction land in the countryside. This land has since been reclaimed into farmland. In addition, urban and rural original construction land was also converted to water areas due to water conservancy and flood storage.
The percentage of unused land was relatively small, accounting for only 0.26% of the land use area in 2020, and its conversion was not significant.
Based on the PLUS model, this study simulated the land use distribution under three development scenarios in 2050 using 2020 as the base period (Figure 4).
Under the natural development scenario, the changes in land use continued according to the trend from 1990 to 2020. Cultivated land, forest land, and water areas decreased by 3,365.53, 11.64, 46.56, and 14.87 km2, respectively. Grassland, construction land, and unused land increased by 7.03, 3,363.22, and 52.88 km2, respectively (Table 6). In terms of the direction of land use area transfer (Figure 5), cultivated land was mainly converted to construction land. Forest land was mainly shifted to unused land. Grassland was primarily shifted to watershed and construction land. The largest changes were in construction land. The contribution of other land use types was smaller and was mainly attributed to the large transfer of cultivated land (NDS in Figure 5).
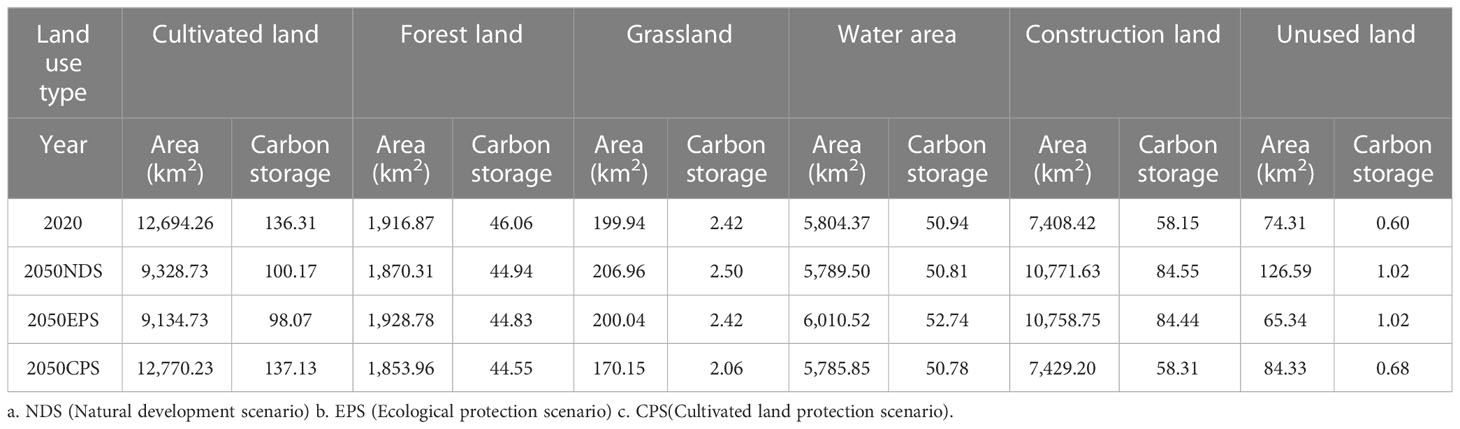
Table 6 Land use structure and carbon storage of the study area in 2050 (mt).
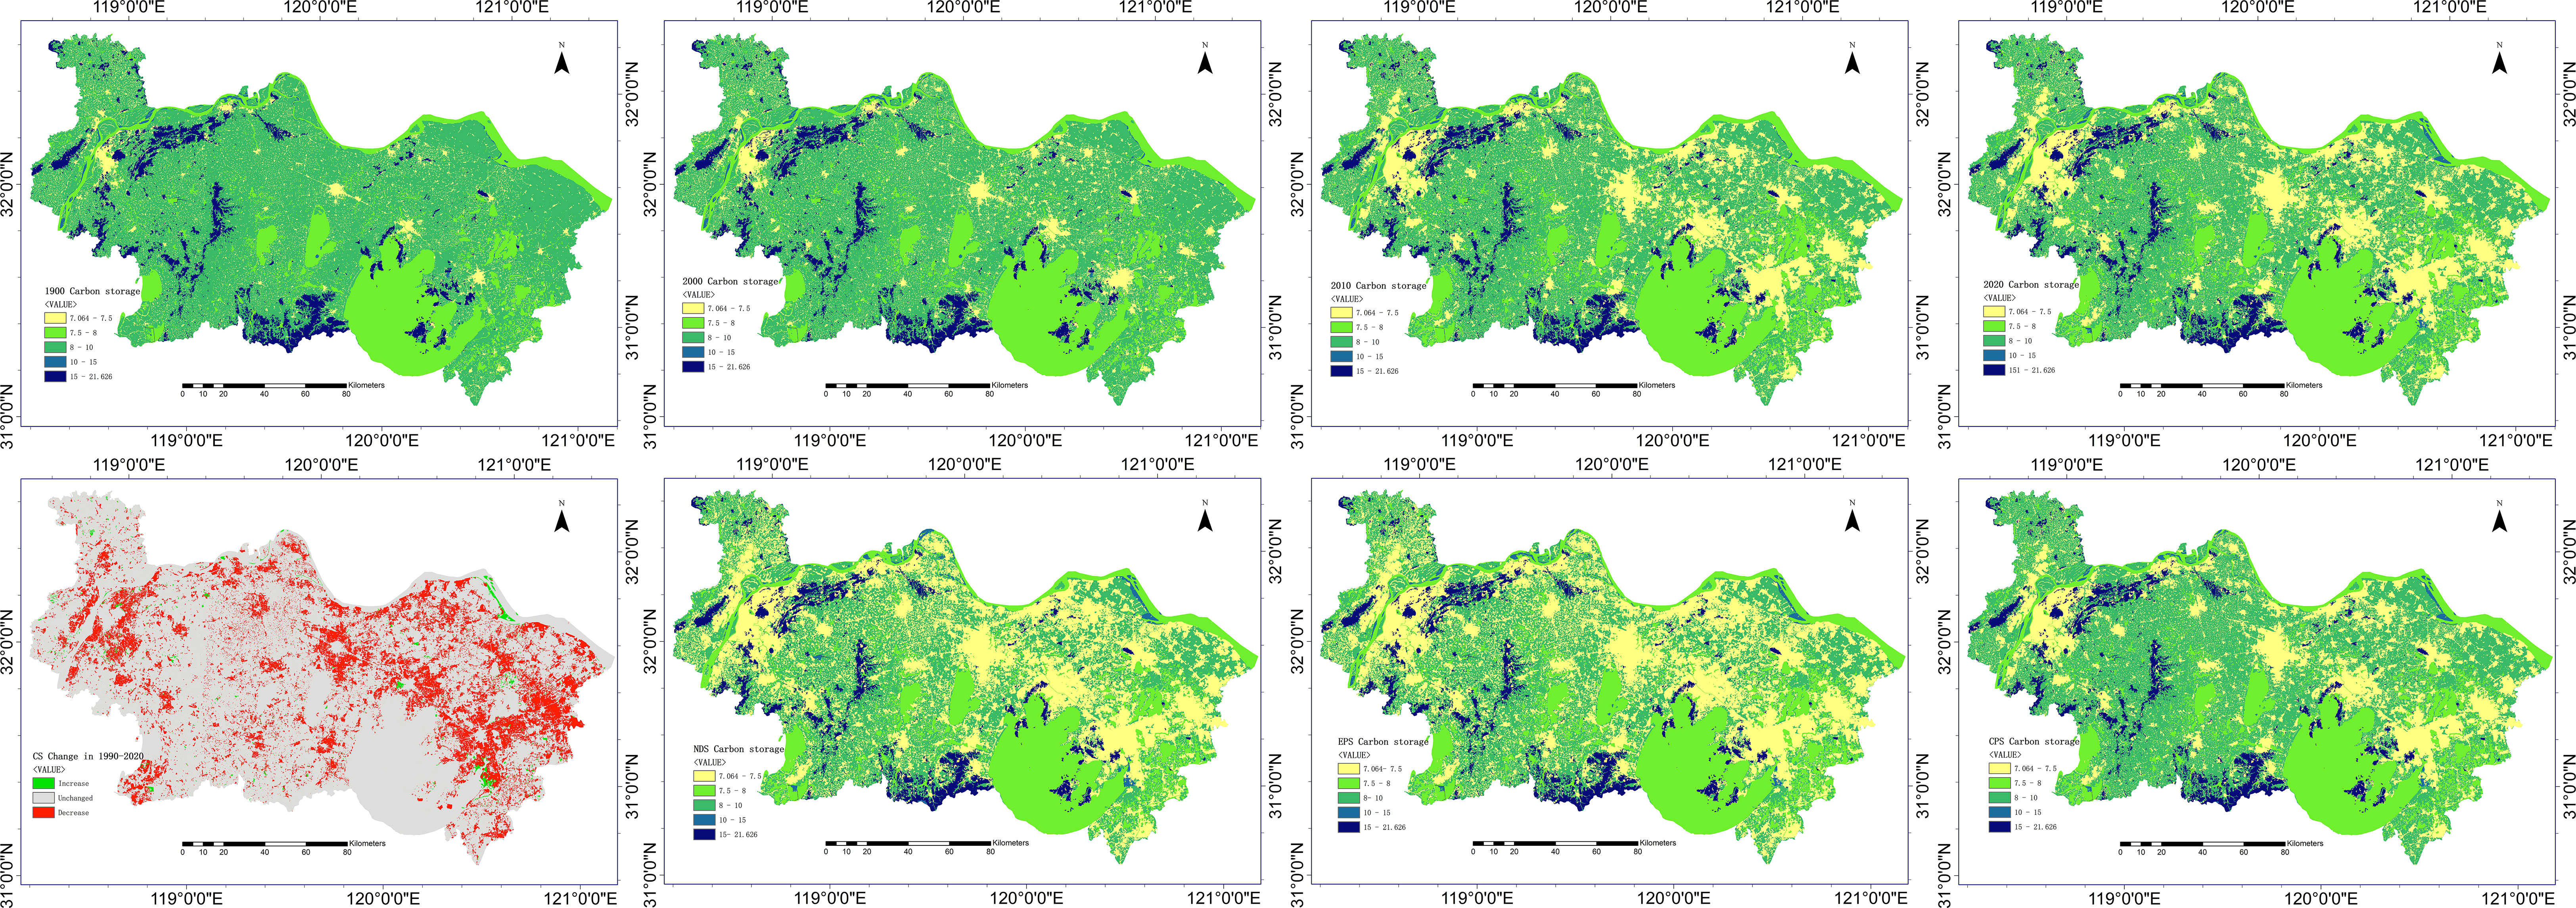
Figure 5 Chord diagram of the land use transfer.
Under the ecological protection scenario, the highest reduction in cultivated land was 3,559.53 km2, and the areas of forest land and water area increased by 11.91 and 206.15 km2, respectively, due to water source protection and returning farmland to forest and grass policies (Table 6). As shown in Figure 5, cultivated land was mainly converted to construction land and water areas. Forest land was primarily converted to unused land. The amount of converted land under this scenario was comparatively small because ecological lands such as grassland and watershed were protected.
Under the cultivated land protection scenario, construction land expansion was controlled due to the restriction on converting cultivated land to other lands, which only increased by 20.79 km2 compared with 2020. Forest land also decreased by 62.91 km2, all converted to cultivated land. Cultivated land increased by 75.97 km2, according to the direction of land use area transfer (Figure 5). Cultivated land was protected in this scenario, and conversion to construction land was restricted. The forest land was mainly converted to cultivated land and unused land. Grassland was primarily converted into water areas, and water areas were mainly converted into cultivated land.
In summary, under the three development scenarios, except for the cultivated land protection scenario, the expansion of construction land was obviously controlled. However, the expansion of construction land in the other two scenarios still maintained the previous trend and speed. In the ecological protection scenario, the reduction of cultivated land was higher, while the areas of forest land and water areas with higher ecological values increased. Therefore, under the scenario of simultaneous cultivated land protection and ecological protection, the expansion of construction land was effectively controlled. This is beneficial to the protection of the regional ecological environment (Table 6).
The probability of land use development and the contribution of driving factors in 2050 were simulated according to the development trend of land use in the study area from 1990 to 2020 (Figure 6). The GDP was the factor with the greatest influence on the conversion of cultivated land, which indicates that the better the economic development of a region, the greater the chance of cultivated land being encroached upon. The DEM was the factor with the greatest influence on the probability of the development of forest land and unused land. The other driving factors were not significant, indicating that natural factors had a more obvious influence on these two land use types. For grassland, DEM and rainfall were the most influential factors, and this was related to the distribution of grassland in low elevations near water areas such as riverbanks and islands. For construction land and water areas, population was the factor with the greatest influence on the development probability. Construction land expanded more quickly in the more densely populated places.
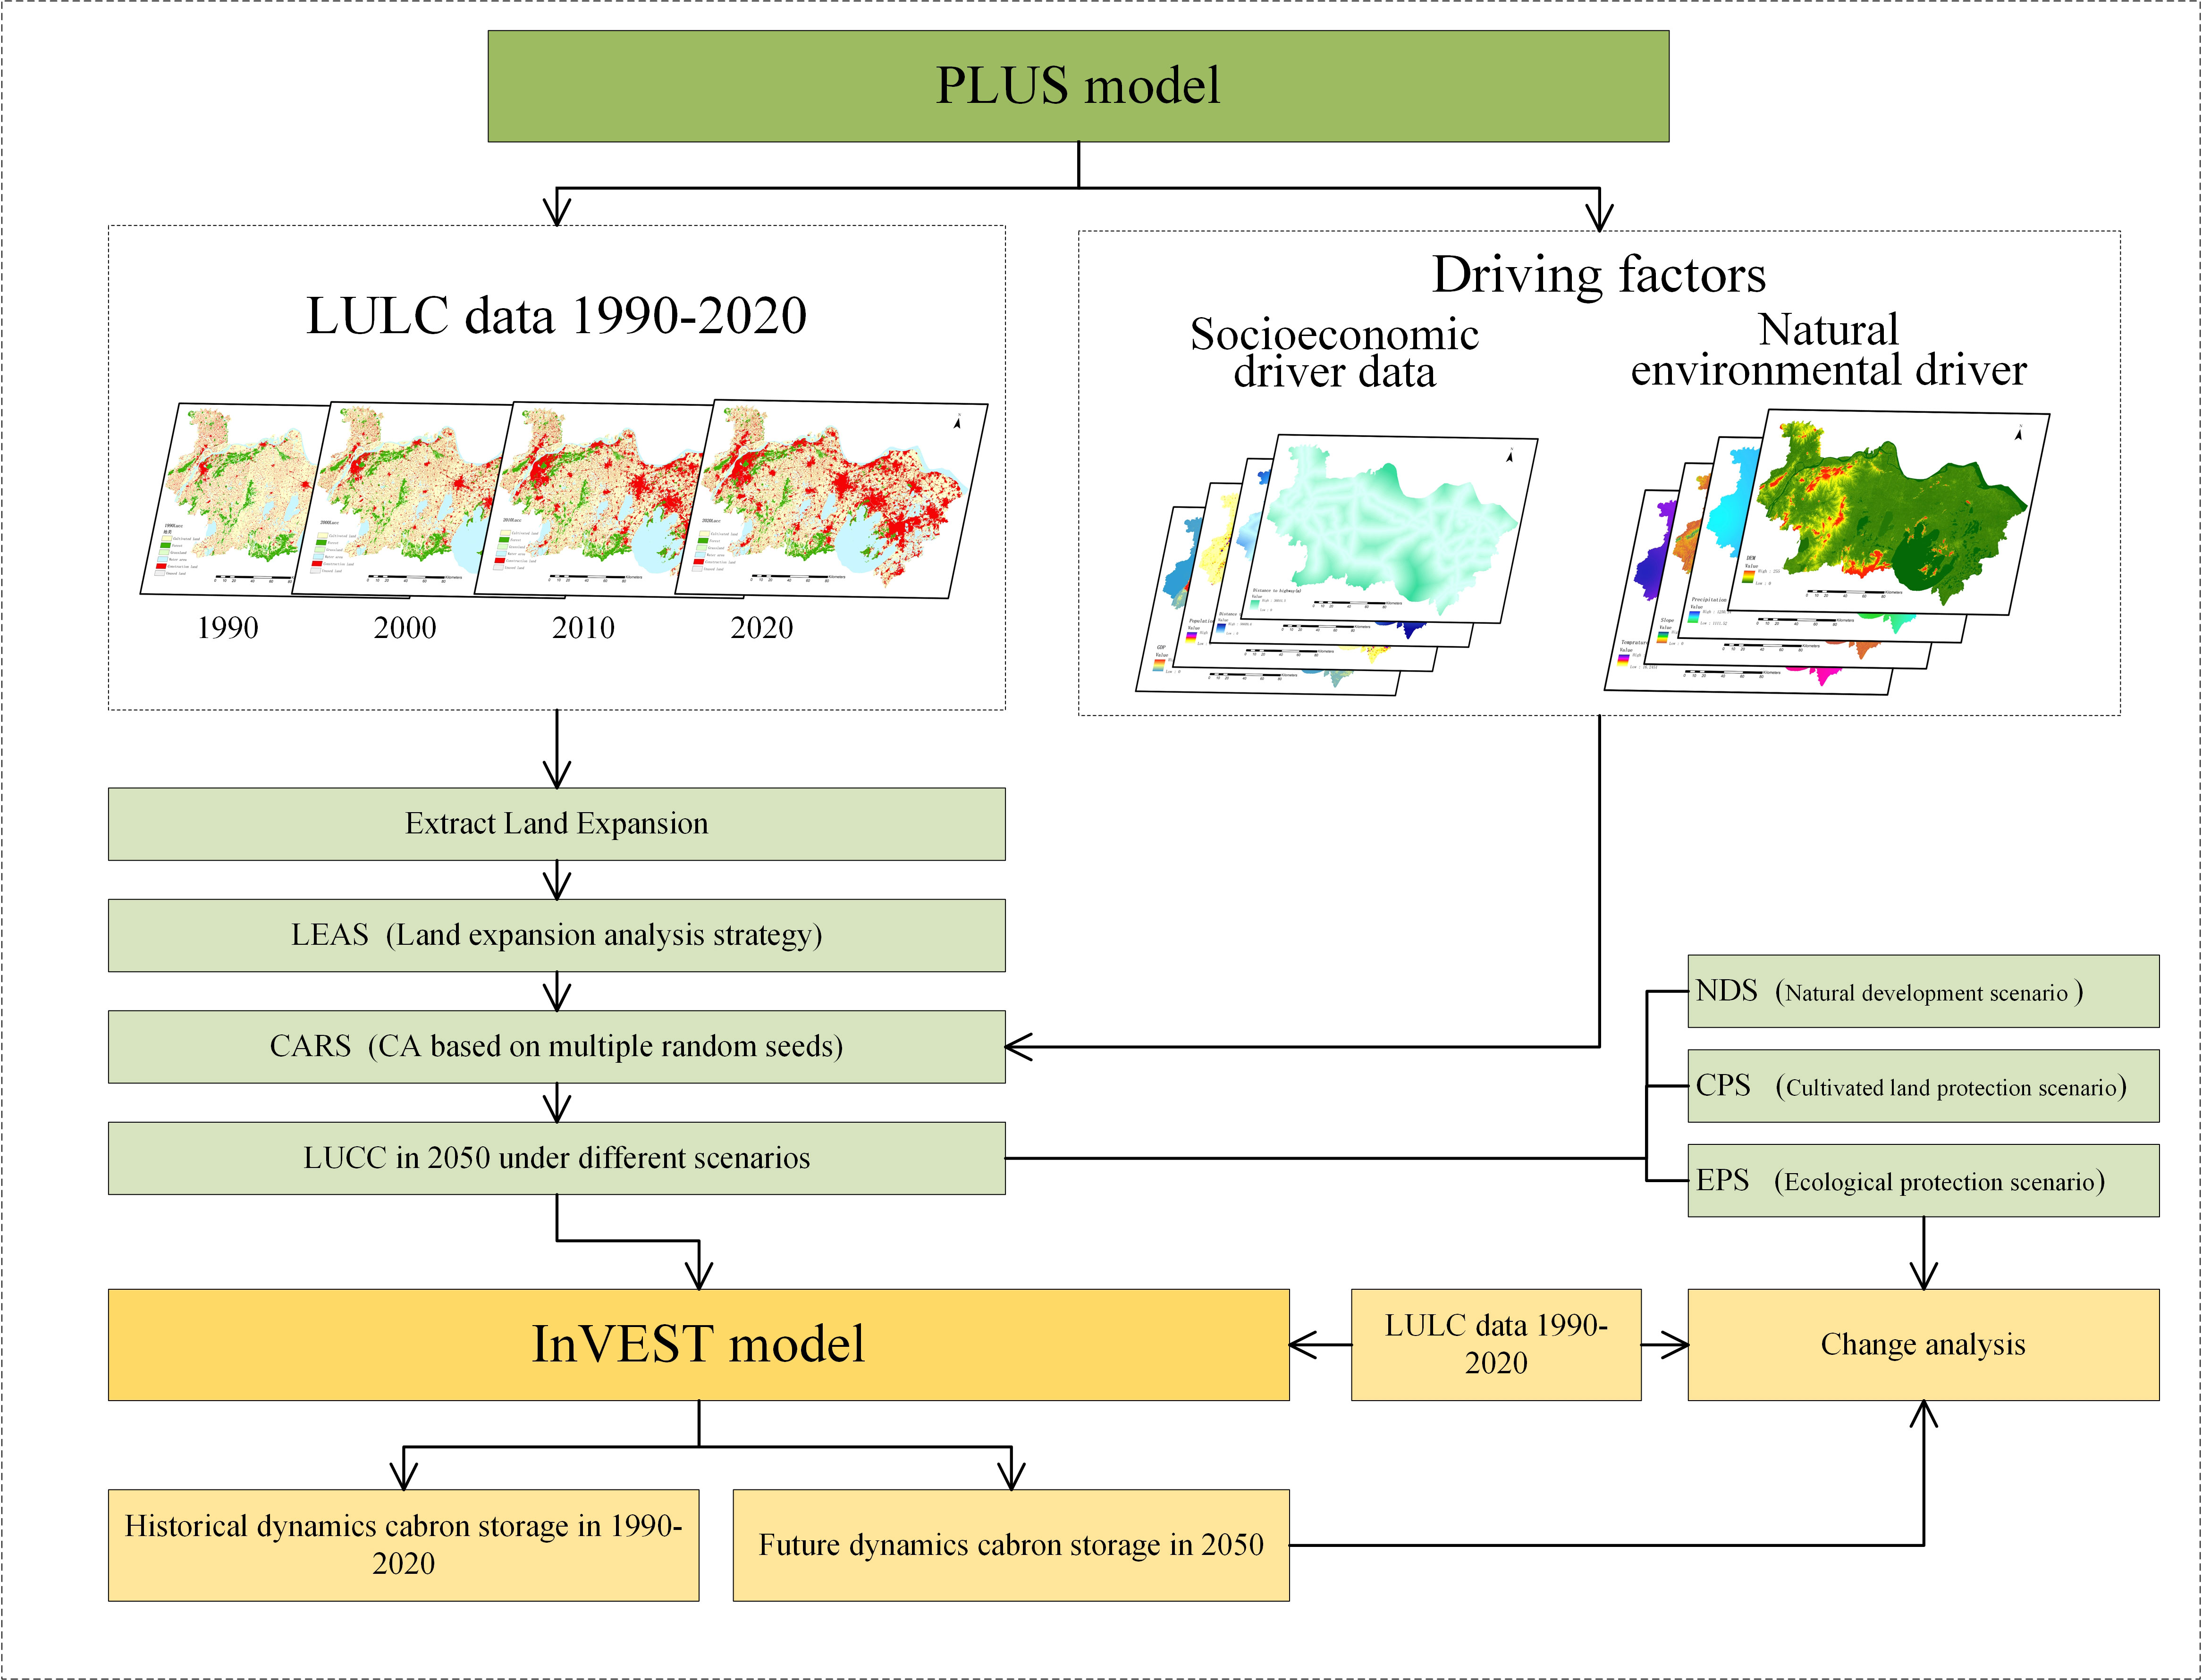
Figure 6 Ranking of land use probabilities and their driving factors.
The carbon module of the InVEST model was used to calculate the carbon storage in the southern Jiangsu urban agglomeration from 1990 to 2020 (Table 7). The carbon storage showed a decreasing trend, with an overall decrease of 5.34% from 1990 to 2020. Specifically, carbon storage decreased by 1.56% from 1990 to 2000, 3.09% from 2000 to 2010, and 0.68% from 2010 to 2020. In terms of land use types, the carbon stocks in 2020 from the largest to the smallest were as follows: cultivated land > construction land > water > forest land > grassland > unused land. The southern Jiangsu urban agglomeration is located in the Yangtze River Delta region. This region has a developed economy, a high urbanization level, a high population density, and a high degree of land development and utilization. The urban expansion occupies a large area of land with high carbon storage, such as cultivated land and forest land. This was the primary reason for the carbon storage decrease in the study area.
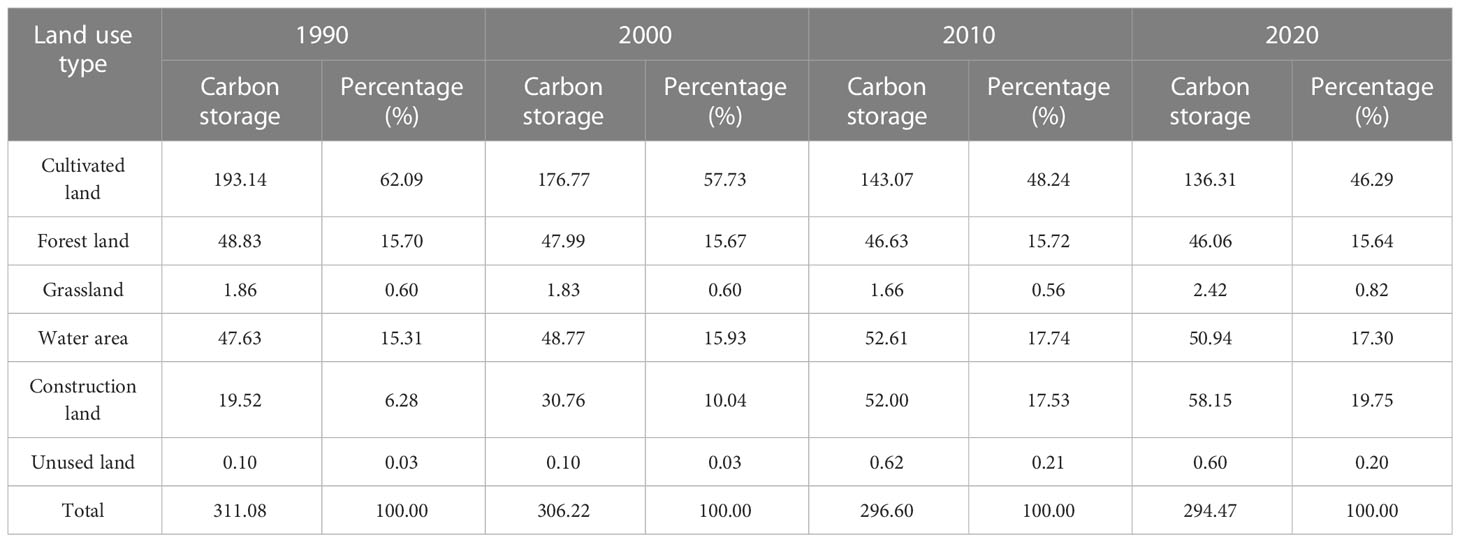
Table 7 Carbon storage by land use type in the study area from 1990 to 2020 (mt).
As shown in Figure 6, there was no large difference in the carbon storage spatial distribution in the southern Jiangsu urban agglomeration from 1990 to 2020. In addition, the areas with lower carbon storage were primarily water and construction land areas, whereas the areas with higher carbon storage were primarily forest land and grassland areas. The carbon storage decrease was primarily due to the construction land expansion and water area increases. In addition, the areas where carbon storage increased were mainly where other land types were converted to forest, grassland, or cultivated land, and the distribution had a sporadic tendency.
The carbon stock of the southern Jiangsu Province urban agglomeration decreased from 1990 to 2020. Based on this trend, the land use data for 2050 were simulated under three scenarios (Figure 7). The carbon stock for the three scenarios was calculated using the InVEST model. Compared with the carbon stock in 2020, the total carbon stock decreased for each of the three scenarios. Under the cultivated land protection scenario, the carbon stock decreased the least, and this was only due to the decrease in forest land. Under the natural development scenario, the carbon stock decreased, and the decrease was more significant than under the ecological land protection model. Under the ecological protection scenario, the carbon stock decreased much more than under the cropland protection model. Although in this scenario, ecological protection measures were utilized to limit the reduction in ecological land, a large amount of cropland continued to be converted to construction land. In addition, the decrease in carbon stock was primarily caused by a reduction in cropland. The largest decrease in carbon stock was under the natural development scenario, and the total carbon stock in the natural development scenario decreased by 1.62 × 10⁶ t, maintaining the declining trend of the past 20 years. Additionally, the decline was primarily caused by a decrease in cultivated land and forest land. In summary, the carbon stock decline was significantly controlled under the cropland protection scenario and somewhat controlled under the ecological protection scenario, whereas the largest decrease was seen under the natural development scenario. Therefore, by 2050, cultivated land protection and ecological protection measures should be taken to effectively limit the expansion of construction land and therefore limit the carbon stock decrease.
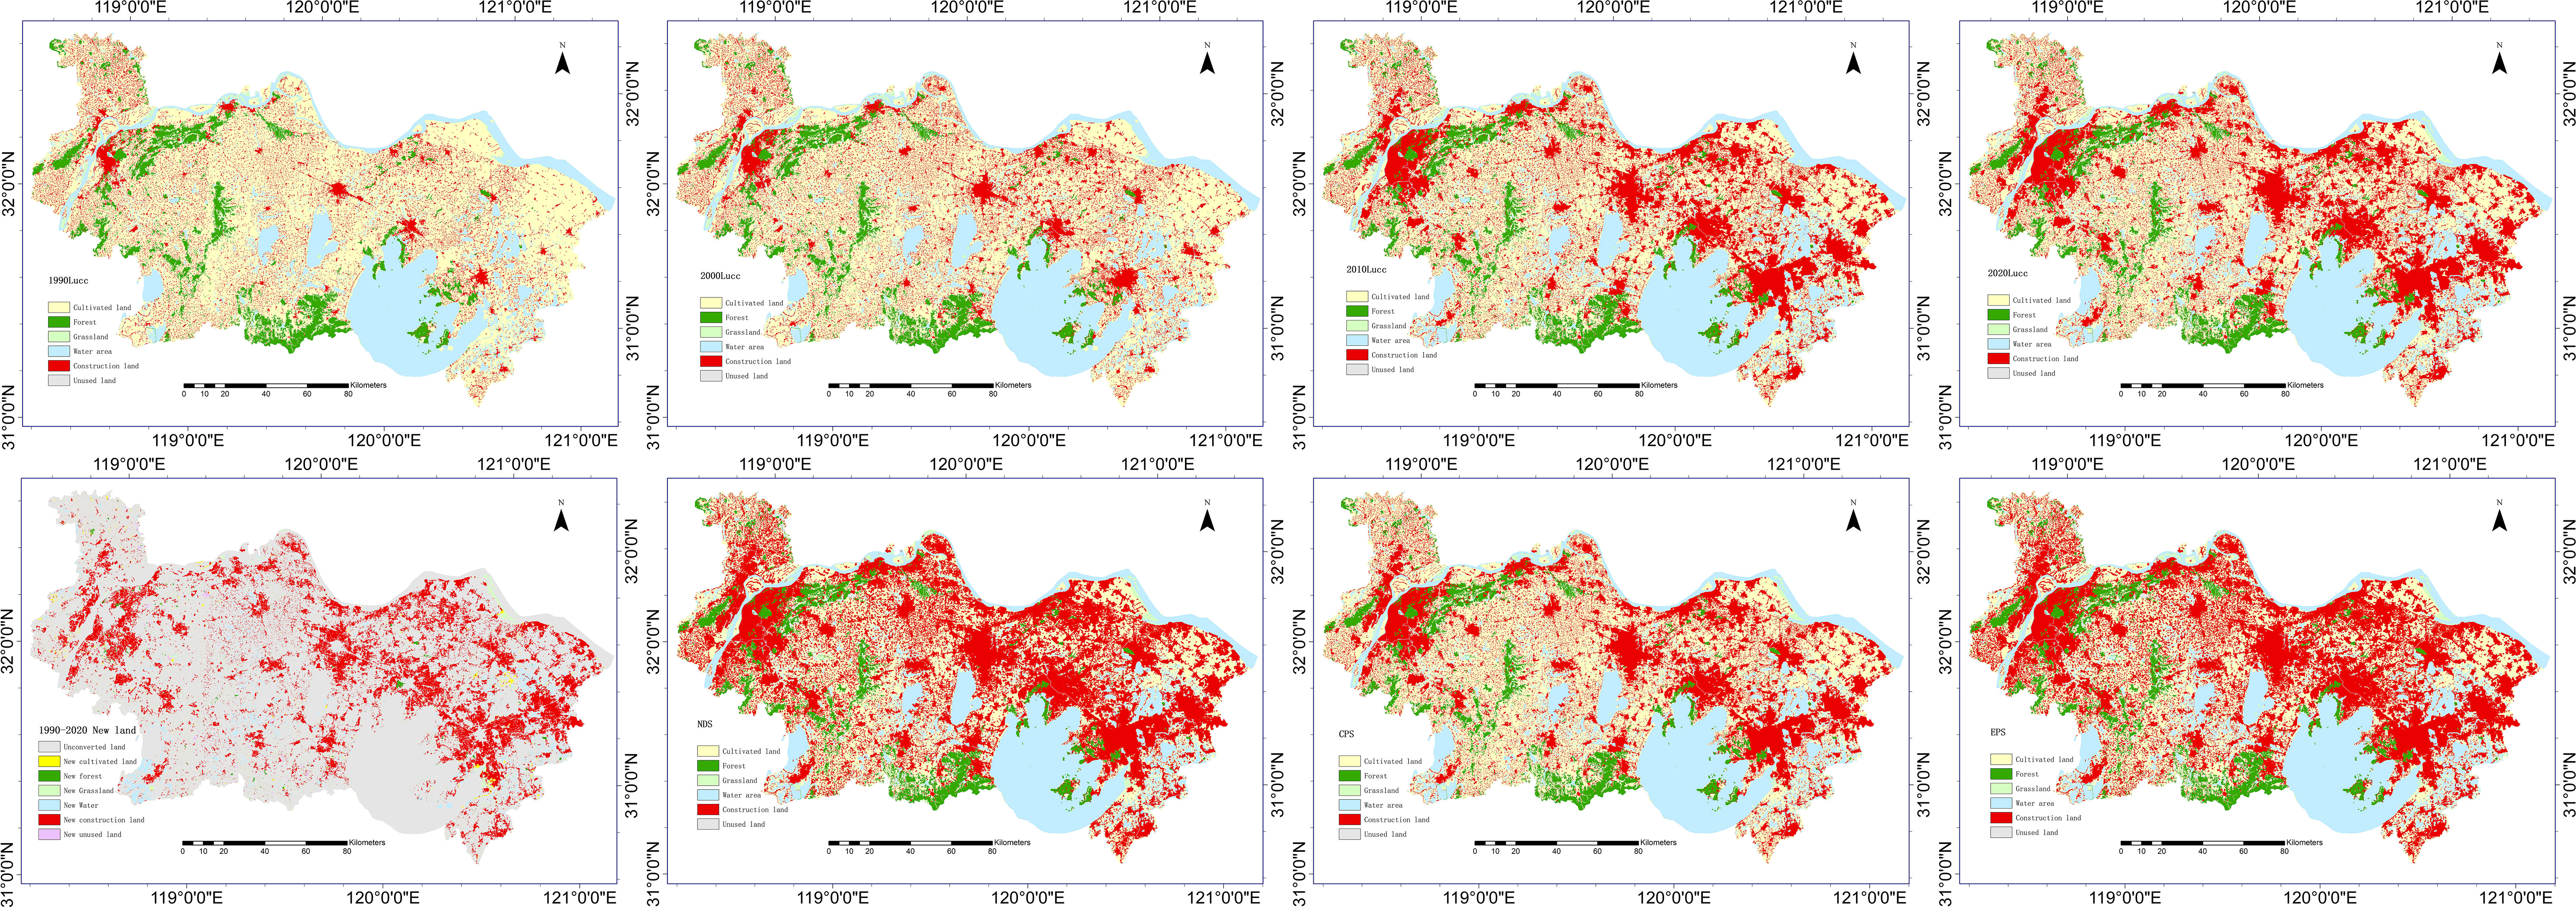
Figure 7 Carbon storage and change from 1990 to 2020 and carbon storage in the 2050 scenarios.
The southern Jiangsu urban agglomeration is located in the coastal and the Yangtze River Delta economic zone, which is one of the most dynamic and economically powerful regions in China (Li et al., 2023). As of 2020, the proportion of cultivated land and construction land in this region was much higher than the national average, and the proportion of forest land, grassland, and unused land was much lower than the lowest national level (Zong et al., 2021). In terms of land use changes, the study area has experienced dramatic changes in land use over the past 30 years, especially for cultivated land and construction land, which accounted for a relatively large proportion of all types of land use changes. This was consistent with previous findings (Zhu et al., 2022). In the future projection, in comparison with the natural development scenario, under the ecological conservation scenario, the area of ecological lands, such as woodland, grassland, and water, increased, and the area of cultivated land continued to decrease. In addition, the expansion of construction land area was primarily at the expense of cultivated land area, but since the proportion of ecological land, such as woodland, in the study area was relatively low, the ecological conservation scenario did not effectively curb the expansion of construction land in the city. Under the cropland protection scenario, the area of cropland increased and there was a certain degree of reduction in forest land, grassland, and water. Additionally, the expansion of construction land was effectively curbed due to the restriction on the conversion of cropland to construction land.
Land use change is considered to be one of the most important factors that contribute to global carbon stock changes in terrestrial ecosystems (Thompson, 2018). Studies have shown that carbon emissions due to land use change have become the second largest source of carbon emissions globally (Houghton et al., 2012; Xia and Yang, 2022), and over 95% of the decline in soil carbon stocks in the United Kingdom from 1990 to 2006 was caused by land use change (Ostle et al., 2009). In addition, land use change affects the carbon cycle and flow of terrestrial ecosystems. Therefore, assessing the impact of land use on carbon stocks can guide the development of future land use and carbon management policies (Zeng et al., 2022).
From 1990 to 2020, the proportion of converted land area to the total land area in the study area was 22.21%, which is consistent with previous findings (Zhang et al., 2015), and this conversion was primarily due to the conversion of other lands to construction land. Additionally, large land areas were converted from high-carbon density land to low-carbon density land, resulting in a decrease in total carbon stocks. The areas with more pronounced carbon stock changes overlapped highly with areas of land use conversion, which was consistent with previous findings (Feng et al., 2020), suggesting that land use change has an important impact on carbon stock reduction. Therefore, land control policies should be designated to control urban land expansion in future urban planning. This study also simulated three future land use change scenarios and found that the dynamics of carbon stock changes were closely related to the dynamics of land use changes. Under the ecological protection scenario, the decline in carbon stock was slowed, and the carbon stock of woodland and grassland was larger than that under other scenarios. However, the decline in the total carbon stock was effectively curbed due to the low percentage of woodland and grassland in the study area. Under the cropland protection scenario, the carbon stock in the study area was the highest.
According to the land use change trend in the study area and the 2050 simulation of the carbon stock, an ecological protection policy and cultivated land protection policy will have a significant influence on the future carbon stock of the southern Jiangsu urban agglomeration. The calculation results for carbon stock in previous years showed that the largest carbon pool by the land use type in the study area was cultivated land, followed by forest land and water. Therefore, protecting the carbon pools of cultivated land, forests, and water is of great significance. This is consistent with the current planning policy of the Chinese government, especially the idea of delineating permanent basic agricultural land protection and ecological protection lines. In future planning, the specific method of delineating the protection line and its impact on the regional carbon pool needs to be studied in more depth.
This study has certain advantages. In this study, the InVEST model was used to calculate the carbon stock of the study area by assigning corresponding carbon density to different land use types. Furthermore, the combination of the InVEST model and the PLUS model can calculate the carbon stock more accurately. However, the InVEST model has some limitations regarding carbon stock calculations. Specifically, it is a static model that does not consider dynamic spatial and temporal changes in carbon density. For example, studies have shown that urbanization makes cities warmer, causing an urban heat island effect (Oke, 1982), which in turn causes physical changes (Qiu et al., 2020) that promote the growth of urban vegetation (Jia et al., 2018; Jiang et al., 2021). This leads to an increase in urban carbon stocks, and this effect compensates for the decrease in carbon stocks due to land use change (the replacement of original surface vegetation by impervious surfaces) by approximately 30%–40% (Zhao et al., 2016; Jia et al., 2018). The influence of the heat island effect on the carbon stock is not considered in this study, and only the influence of land use change on the carbon stock is calculated.
Furthermore, the carbon density values in the current study referred to the research results of previous scholars to select the carbon density values appropriate to the study area, and the rainfall model was used to correct the carbon density so that the carbon density values are close to the actual values. However, this did not take into account the differences in the carbon sequestration functions of different vegetation types, ages, and structures. Follow-up studies will be supplemented with field measurements of different vegetation types to improve the accuracy of carbon density measurements. In the future, we will pay more attention to the heat island effect, climate change, and ecological feedback in such studies.
Finally, although the PLUS model has obvious advantages over previous simulation models in terms of the simulation accuracy and the exploration of driving factors, it has certain limitations. In addition, national policies and future plans have an important influence on land use. Therefore, these aspects will be discussed in depth in a subsequent study to obtain more accurate and reliable simulation results.
Based on the PLUS and InVEST models, this study assessed the carbon stock of the southern Jiangsu urban agglomeration from 1990 to 2020. The land use and carbon stock of the study area in 2050 were simulated and analyzed under multiple scenarios. We drew the following conclusions.
1) The areas of cultivated land and forest land in the southern Jiangsu urban agglomeration decreased from 1990 to 2020, and the area of cultivated land decreased the most, by 5,292.48 km2. The areas of grassland, water area, construction land, and unused land increased. The primary conversion trend was from cultivated and forest land to construction land and water areas. From 2020 to 2050, under the natural development scenario, the construction land area increased the most. However, under the cultivated land protection scenario, the construction land expansion was controlled. Under the ecological protection scenario, the areas of forest land, grassland, and water areas increased, but the area of cultivated land decreased more significantly.
2) The GDP was the factor that had the greatest impact on the development probability of the cultivated land. The DEM had the greatest impact on the development probability of forest land, grassland, and unused development land. Population was the driving factor that most significantly affected construction land and water areas.
3) The carbon stock of the southern Jiangsu urban agglomeration decreased from 1990 to 2020. In a comparison of three different scenarios, by 2050, the carbon stock decreased the least under the arable land protection scenario, indicating that arable land protection can effectively control carbon stock decrease. Under the ecological protection scenario, which only protects ecological land such as forest land, grassland, and water areas, the carbon stock decreases moderately compared with the other two plans, and the expansion of construction land mainly occupies arable land. Under the natural development scenario, the carbon stock decreases the most. Therefore, the combination of arable land protection and ecological protection measures should be considered, and to protect arable land, simultaneous ecological and environmental protection should be considered to restrict the conversion of arable and ecological land to construction land.
The data analyzed in this study is subject to the following licenses/restrictions: The processed data required to reproduce these findings cannot be shared at this time as the data also forms part of an ongoing study. Requests to access these datasets should be directed toMDMwMjE0QGpseHkubmp1LmVkdS5jbg==.
X-XS and S-GW: conceptualization, data processing, methodology, visualization, and writing—first draft. J-HX: project management and supervision. L-ND: editing. X-XS, J-HX, and L-ND: funding acquisition. All authors contributed to this article and approved the submitted version.
We are honored that this research was supported by the Science and Technology Project of Nanjing Greening and Gardening Bureau, Jiangsu Province (YLKJ202113JH); the Forestry Science and Technology Innovation and Extension Program of Jiangsu Province (LYKJ(2022)02); and the Priority Academic Program Development of Jiangsu Higher Education. Institutions: PAPD (Priority Academic Program Development of Jiangsu Higher Education Institutions).
We thank LetPub (www.letpub.com) for its linguistic assistance during the preparation of this manuscript.
The authors declare that the research was conducted in the absence of any commercial or financial relationships that could be construed as a potential conflict of interest.
All claims expressed in this article are solely those of the authors and do not necessarily represent those of their affiliated organizations, or those of the publisher, the editors and the reviewers. Any product that may be evaluated in this article, or claim that may be made by its manufacturer, is not guaranteed or endorsed by the publisher.
Alam S. A., Starr M., Clark B. J. F. (2013). Tree biomass and soil organic carbon densities across the Sudanese woodland savannah: A regional carbon sequestration study. J. Arid Environ. 89, 67–76. doi: 10.1016/j.jaridenv.2012.10.002
Bhatti S. S., Tripathi N. K., Nagai M., Nitivattananon. V. (2016). Spatial interrelationships of quality of life with land use/land cover, demography and urbanization. Soc. Indic. Res. 132 (3), 1193–1216. doi: 10.1007/s11205-016-1336-z
Cao J., Zhou W., Yu W., Hu X., Yu M., Wang J., et al. (2022). Urban expansion weakens the contribution of local land cover to urban warming. Urban Climate 45, 101285. doi: 10.1016/j.uclim.2022.101285
Chuai X., Huang X., Zheng Z., Zhang M., Liao Q., Lai Li, et al. (2011). Land use change and its influence on carbon storage of terrestrial ecosystems in jiangsu province. Resour. Sci. 33 (10), 1932–1939. Available at: https://kns.cnki.net/kcms2/article/abstract?v=nnFo4n0nVBGo_UlXP94M4UNfPMri8u4xcHavJ_p74iDv9S7vVCvsPQCsaKthz-zZ69XpPOStUaLMaDNzn3PwjhJ8vEtKqCgFGMOr4VFC_a833xzj9vYaYA==&uniplatform=NZKPT&language=gb.
Fang J.-Y., Wang Z. M. (2001). Forest biomass estimation at regional and global levels, with special reference to China's forest biomass. Ecol. Res. 16 (3), 587–592. doi: 10.1046/j.1440-1703.2001.00419.x
Feng Y., Chen S., Tong X., Lei Z., Gao C., Wang J. (2020). Modeling changes in China’s 2000–2030 carbon stock caused by land use change. J. Cleaner Production 252, 119659. doi: 10.1016/j.jclepro.2019.119659
Hofmann M., Münster S., Noennig. JörgR. (2019). A theoretical framework for the evaluation of massive digital participation systems in urban planning. J. Geovisualization Spatial Anal. 4 (1), s41651-019-0040-3. doi: 10.1007/s41651-019-0040-3
Houghton R. A., House J. I., Pongratz J., van der Werf G. R., DeFries R. S., Hansen M. C., et al. (2012). Carbon emissions from land use and land-cover change. Biogeosciences 9 (12), 5125–5142. doi: 10.5194/bg-9-5125-2012
Huang M. I., JinJun J. I., MingKui C. A. O., KeRang L. I. (2006). Modeling study of vegetation shoot and root biomass in China. Acta Ecologica Sin. 26 (12), 4156–4163.
Iserhard C. A., Duarte L., Seraphim N., Freitas. AndréV. L. (2021). Correction to: How urbanization affects multiple dimensions of biodiversity in tropical butterfly assemblages. Biodiversity Conserv. 30 (4), 1203–1203. doi: 10.1007/s10531-021-02111-z
Janes-Bassett V., Bassett R., Rowe E., Tipping E., Yumashev D., Davies J. (2021). Changes in carbon storage since the pre-industrial era: A national scale analysis. Anthropocene 34, 100289. doi: 10.1016/j.ancene.2021.100289
Jia W., Zhao S., Liu. S. (2018). Vegetation growth enhancement in urban environments of the Conterminous United States. Global Change Biol. 24 (9), 4084–4094. doi: 10.1111/gcb.14317
Jiang W., Deng Y., Tang Z., Lei X., Chen. Z. (2017). Modelling the potential impacts of urban ecosystem changes on carbon storage under different scenarios by linking the CLUE-S and the InVEST models. Ecol. Model. 345, 30–40. doi: 10.1016/j.ecolmodel.2016.12.002
Jiang M., He Y., Song C., Pan Y., Qiu T., Tian S. (2021). Disaggregating climatic and anthropogenic influences on vegetation changes in Beijing-Tianjin-Hebei region of China. Sci. Total Environ. 786, 147574. doi: 10.1016/j.scitotenv.2021.147574
Jiang X., Pan J., Li. X. (2005). Organic carbon density and storage in topsoil of jiangsu and spatial analysis. J. Soil Sci. 36 (4), 501–503. doi: 10.19336/j.cnki.trtb.2005.04.008
Li W., Chen Z., Li M., Zhang H., Li M., Qiu X., et al. (2023). Carbon emission and economic development trade-offs for optimizing land-use allocation in the Yangtze River Delta, China. Ecol. Indic. 147, 109950. doi: 10.1016/j.ecolind.2023.109950
Li J., Gong J., Guldmann J.-M., Li S., Zhu. J. (2020). Carbon dynamics in the northeastern qinghai–tibetan plateau from 1990 to 2030 using landsat land use/cover change data. Remote Sens. 12 (3), rs12030528. doi: 10.3390/rs12030528
Liang X., Guan Q., Clarke K. C., Liu S., Wang B., Yao Y. (2021). Understanding the drivers of sustainable land expansion using a patch-generating land use simulation (PLUS) model: A case study in Wuhan, China. Computers Environ. Urban Syst. 85, 101569. doi: 10.1016/j.compenvurbsys.2020.101569
Liu X., Li X., Liang X., Shi H., Ou. J. (2019). Simulating the change of terrestrial carbon storage in china based on the FLUS-inVEST model. Trop. Geogr. 39 (3), 397–409. doi: 10.13284/j.cnki.rddl.003138
Liu Q., Yang D., Cao L., Anderson B. (2022). Assessment and prediction of carbon storage based on land use/land cover dynamics in the tropics: A case study of hainan island, china. Land 11 (2), land11020244. doi: 10.3390/land11020244
Oke T. R. (1982). The energetic basis of the urban heat-island. Q. J. R. Meteorol. Soc 108, 1–24. doi: 10.1002/qj.49710845502
Olorunfemi I. E., Olufayo A. A., Fasinmirin J. T., Komolafe. A. A. (2021). Dynamics of land use land cover and its impact on carbon stocks in Sub-Saharan Africa: an overview. Environ. Dev. Sustain. 24 (1), 40–76. doi: 10.1007/s10668-021-01484-z
Ostle N. J., Levy P. E., Evans C. D., Smith P. (2009). UK land use and soil carbon sequestration. Land Use Policy 26, S274–S283. doi: 10.1016/j.landusepol.2009.08.006
Qiu T., Song C., Zhang Y., Liu H., Vose. J. M. (2020). Urbanization and climate change jointly shift land surface phenology in the northern mid-latitude large cities. Remote Sens. Environ. 236. doi: 10.1016/j.rse.2019.111477
Qu F., Lu N., Feng S. (2011). Effects of land-use change on carbon emissions. China Popul. Resour. Environ. 21 (10), 76–83 (in Chinese).
Sadiq Khan M., Ullah S., Sun T., Rehman A., Chen. L. (2020). Land-use/land-cover changes and its contribution to urban heat island: A case study of islamabad, pakistan. Sustainability 12 (9), su12093861. doi: 10.3390/su12093861
Thompson T. M. (2018). Modeling the climate and carbon systems to estimate the social cost of carbon. WIREs Climate Change 9 (5), wcc.532. doi: 10.1002/wcc.532
Tian S., Wu W., Shen Z., Wang J., Liu X., Li L., et al. (2022). A cross-scale study on the relationship between urban expansion and ecosystem services in China. J. Environ. Manage 319, 115774. doi: 10.1016/j.jenvman.2022.115774
Tong J., Hu J., Lu Z., Sun H., Yang X. (2019). The impact of land use and cover change on soil organic carbon and total nitrogen storage in the Heihe River Basin: A meta-analysis. J. Geographical Sci. 29 (9), 1578–1594. doi: 10.1007/s11442-019-1678-y
Wang C., Li T., Guo X., Lu C., Wang. C. (2022). Plus-inVEST study of the chengdu-chongqing urban agglomeration's land-use change and carbon storage. Land 11 (10), land11101617. doi: 10.3390/land11101617
Wang J., Li L., Li Q., Wang S., Liu X., Li. Ya (2022). The spatiotemporal evolution and prediction of carbon storage in the yellow river basin based on the major function-oriented zone planning. Sustainability 14 (13), su14137963. doi: 10.3390/su14137963
Wang Z., Xu L., Shi Y., Ma Q., Wu Y., Lu Z., et al. (2021). Impact of land use change on vegetation carbon storage during rapid urbanization: A case study of hangzhou, china. Chin. Geographical Sci. 31 (2), 209–222. doi: 10.1007/s11769-021-1183-y
Wang Z., Zeng J., Chen. W. (2022). Impact of urban expansion on carbon storage under multi-scenario simulations in Wuhan, China. Environ. Sci. pollut. Res. 29 (30), 45507–45526. doi: 10.1007/s11356-022-19146-6
Wang Ao, Zhang M., Kafy A. Al, Tong B., Hao D., Feng. Y. (2022). Predicting the impacts of urban land change on LST and carbon storage using InVEST, CA-ANN and WOA-LSTM models in Guangzhou, China. Earth Sci. Inf. 16 (1), 437–454. doi: 10.1007/s12145-022-00875-8
Whitehead D., McNeill S. J.E., Mudge. P. L. (2021). Regional and national changes in soil carbon stocks with land-use change from 1990 to 2016 for New Zealand. Regional Environ. Change 21 (4), /s10113-021-01837-4. doi: 10.1007/s10113-021-01837-4
Wu W., Xu L., Zheng H., Zhang. X. (2023). How much carbon storage will the ecological space leave in a rapid urbanization area? Scenario analysis from Beijing-Tianjin-Hebei Urban Agglomeration. Resources Conserv. Recycling 189, 106774. doi: 10.1016/j.resconrec.2022.106774
Xia S., Yang Yu (2022). Spatio-temporal differentiation of carbon budget and carbon compensation zoning in Beijing-Tianjin-Hebei Urban Agglomeration based on the Plan for Major Function-oriented Zones. Acta Geographica Sin. 77 (3), 679–696. Available at: https://kns.cnki.net/kcms2/article/abstract?v=nnFo4n0nVBFrjux7oehzxMVAgxmJGyk6OHcTmIf1c9Eo2FbFHdmhX8v-9nJTBMr44DivytU3AXuTkzTV7F-JTDws2gnbuz8EE6e0LFF5sJzKj1vaPYGYpioO8YZWJFA&uniplatform=NZKPT&language=g.
Xia S.-x., Yu X.-b., Li S.-x., Xu Ce, Zhao N., Wang. S.-t. (2020). Evaluation of carbon storage on terrestrial ecosystem in hebei province based on inVEST model. J. Ecol. Rural Environ. 36 (7), 854–861. doi: 10.19741/j.issn.1673-4831.2019.0918. Li, Jin-pu.
Xiang S., Wang Y., Deng H., Yang C., Wang Z., Gao. M. (2022). Response and multi-scenario prediction of carbon storage to land use/cover change in the main urban area of Chongqing, China. Ecol. Indic. 142, 109205. doi: 10.1016/j.ecolind.2022.109205
Xu Li, He N., Yu. G. (2019). A dataset of carbon density in Chinese terrestrial ecosystems). China Sci. Data 4 (1), 1–7-7-7. Available at: https://kns.cnki.net/kcms2/article/abstract?v=nnFo4n0nVBG17q2OHjSHL1rcn_t1JLGNCjpUPLpR9ieL7HnS_RLC2S6sy1xmXbkH2s2ZDdU5k72INtjRhvr1riPP2RF-UqRp6Fg3JmuUVt33-vqfEM9A83ny52TncGRR&uniplatform=NZKPT&language=gb.
Yang H., Huang J., Liu D. (2020). Linking climate change and socioeconomic development to urban land use simulation: Analysis of their concurrent effects on carbon storage. Appl. Geogr. 115, 102135. doi: 10.1016/j.apgeog.2019.102135
Yang Y., Li W., Zhu C., Wang Y., Huang X. (2017). Impact of land use/cover changes on carbon storage in a river valley in arid areas of Northwest China. J. Arid Land 9 (6), 879–887. doi: 10.1007/s40333-017-0106-3
Yang Y., Xie J., Sheng H., Chen G., Li Xu, Yang Z. (2009). The impact of land use/cover change on storage and quality of soil organic carbon in midsubtropical mountainous area of southern China. J. Geographical Sci. 19 (1), 49–57. doi: 10.1007/s11442-009-0049-5
Yuan Y., Wu S., Yu Y., Tong G., Mo L., Yan D., et al. (2018). Spatiotemporal interaction between ecosystem services and urbanization: Case study of Nanjing City, China. Ecol. Indic. 95, 917–929. doi: 10.1016/j.ecolind.2018.07.056
Zaehle Sönke, Bondeau A., Carter T. R., Cramer W., Erhard M., Prentice I.C., et al. (2007). Projected changes in terrestrial carbon storage in europe under climate and land-use change 1990–2100. Ecosystems 10 (3), 380–401. doi: 10.1007/s10021-007-9028-9
Zeng J., Cui X., Chen W., Yao X. (2023). Impact of urban expansion on the supply-demand balance of ecosystem services: An analysis of prefecture-level cities in China. Environ. Impact Assess. Rev. 99, 107003. doi: 10.1016/j.eiar.2022.107003
Zeng Li, Liu X., Li W., Ou J., Cai Y., Chen G., et al. (2022). Global simulation of fine resolution land use/cover change and estimation of aboveground biomass carbon under the shared socioeconomic pathways. J. Environ. Manage. 312, 114943. doi: 10.1016/j.jenvman.2022.114943
Zhang Y., Chang X., Liu Y., Lu Y., Wang Y., Liu. Y. (2021). Urban expansion simulation under constraint of multiple ecosystem services (MESs) based on cellular automata (CA)-Markov model: Scenario analysis and policy implications. Land Use Policy 108, 105667. doi: 10.1016/j.landusepol.2021.105667
Zhang M., Huang X., Chuai X., Yang H., Lai Li, Tan. J. (2015). Impact of land use type conversion on carbon storage in terrestrial ecosystems of China: A spatial-temporal perspective. Sci. Rep. 5 (1), srep10233. doi: 10.1038/srep10233
Zhao H., Duan X., Stewart B., You B., Jiang. X. (2013). Spatial correlations between urbanization and river water pollution in the heavily polluted area of Taihu Lake Basin, China. J. Geographical Sci. 23 (4), 735–752. doi: 10.1007/s11442-013-1041-7
Zhao S., Liu S., Zhou D. (2016). Prevalent vegetation growth enhancement in urban environment. Proc. Natl. Acad. Sci. 113 (22), 6313–6318. doi: 10.1073/pnas.1602312113
Zhu G., Qiu D., Zhang Z., Sang L., Liu Y., Wang L., et al. (2021). Land-use changes lead to a decrease in carbon storage in arid region, China. Ecol. Indic. 127, 107770. doi: 10.1016/j.ecolind.2021.107770
Zhu L., Song R., Sun S., Li Y., Hu. Ke (2022). Land use/land cover change and its impact on ecosystem carbon storage in coastal areas of China from 1980 to 2050. Ecol. Indic. 142, 109178. doi: 10.1016/j.ecolind.2022.109178
Zhu W., Zhang J., Cui Y., Zhu. L. (2020). Ecosystem carbon storage under different scenarios of land use change in Qihe catchment, China. J. Geographical Sci. 30 (9), 1507–1522. doi: 10.1007/s11442-020-1796-6
Keywords: carbon storage, land use, urbanization, InVEST model, Plus model, southern Jiangsu urban agglomeration
Citation: Sun X-x, Wang S-g, Xue J-h and Dong L-n (2023) Assessment and simulation of ecosystem carbon storage in rapidly urbanizing areas based on land use cover: a case study of the southern Jiangsu urban agglomeration, China. Front. Ecol. Evol. 11:1197548. doi: 10.3389/fevo.2023.1197548
Received: 31 March 2023; Accepted: 11 July 2023;
Published: 04 September 2023.
Edited by:
Chao Wang, Capital University of Economics and Business, ChinaReviewed by:
Amod Mani Dixit, Universal Engineering and Science College (UESC), NepalCopyright © 2023 Sun, Wang, Xue and Dong. This is an open-access article distributed under the terms of the Creative Commons Attribution License (CC BY). The use, distribution or reproduction in other forums is permitted, provided the original author(s) and the copyright owner(s) are credited and that the original publication in this journal is cited, in accordance with accepted academic practice. No use, distribution or reproduction is permitted which does not comply with these terms.
*Correspondence: Jian-hui Xue, amh4dWVAbmpmdS5lZHUuY24=
†These authors share first authorship
Disclaimer: All claims expressed in this article are solely those of the authors and do not necessarily represent those of their affiliated organizations, or those of the publisher, the editors and the reviewers. Any product that may be evaluated in this article or claim that may be made by its manufacturer is not guaranteed or endorsed by the publisher.
Research integrity at Frontiers
Learn more about the work of our research integrity team to safeguard the quality of each article we publish.