 Shuoshuo Li
 Yaobin Liu1*
 Guoen Wei
- 1School of Economics and Management, Nanchang University, Nanchang, China
- 2School of Resources and Environment, Nanchang University, Nanchang, China
- 3Graduation Program in Production Engineering, Paulista University, São Paulo, Brazil
The imbalance of the carbon cycle in terrestrial ecosystems exacerbates global warming. Identifying the spatial–temporal characteristics and drivers of the carbon budget is important for the effective management of complex ecosystems and the achievement of the United Nations Sustainable Development Goals. Based on the complex ecosystem theory, this article constructs two carbon indicators, carbon carrying capacity–carbon footprint matching degree (Carbon-MD), and carbon carrying capacity–carbon footprint coupling coordination degree (Carbon-CCD). Taking a typical lake region—urban agglomeration around Poyang Lake as an example, the spatial–temporal characteristics and driving factors of the carbon budget from 2000 to 2020 are revealed by GIS technology and geographically–temporally weighted regression model. The results show that there is a significant spatial and temporal variability of carbon budget in Poyang Lake city agglomerations from 2000 to 2020, the Carbon-MD shows a gradually decreasing trend, and the Carbon-CCD shows a gradually increasing characteristic from moderate disorder to basic coordination development. From the spatial pattern, the Carbon-MD of the study area showed an increasing character from the core area to the peripheral area of the lake, and the low-value area of Carbon-MD shows the trend of spreading from point to surface and the Carbon-CCD changes from scattered to group type. In addition, land use type always has a significant effect on the carbon budget, while there is a spatial and temporal heterogeneity in the effects of natural and socioeconomic factors on the carbon budget. The research results show that it is reasonable and scientific to construct carbon budget indicators from the perspective of matching supply and demand and coupling and coordination, which provides a quantitative carbon budget analysis tool for local policymakers.
1. Introduction
Climate warming is a major environmental threat to global sustainable development (Zhenmin and Espinosa, 2019; Wei et al., 2021; Mikulčić et al., 2022), and it has become the consensus of the international community to address global climate change and human activities by promoting a global balance of carbon in terrestrial ecosystems (Fernández-Martínez et al., 2020; Li et al., 2021). Since the release of the IPCC Special Report on Global Warming of 1.5°C, many countries and regions have specified their timelines and measures to achieve carbon reduction (Climate Change 2021: The Physical Science Basis). Since the twentieth century, accelerated global urbanization has not only increased carbon emissions (Liddle, 2014; Yao et al., 2018; Wang W. Z. et al., 2021; Zhou et al., 2022a; Wei et al., 2023) but also weakened carbon sequestration through changes in land use types (Nathaniel and Adeleye, 2021; Zhou L. et al., 2021), ultimately affecting the state of the carbon budget. Carbon cycle imbalance triggers the greenhouse effect, and rebalancing is an effective means to combat global climate change (Li et al., 2019; Mekonnen et al., 2021). Therefore, it is necessary to study the carbon budget of cities from the perspective of the carbon cycle to seek achievements at the UN sustainable development goals (SDGs) and explore the construction of low-carbon cities.
Carbon emissions from human activities and land use change significantly affect the carbon balance of terrestrial ecosystems (Gatti et al., 2014; Wang H. et al., 2021; Wei et al., 2022). Currently, geographers and biologists have conducted many studies on carbon balance accounting, regional carbon cycle, carbon balance, and carbon offset (De Wit et al., 2015; Guo et al., 2017). The research focuses on the estimation of carbon balance, wetland carbon balance, forest carbon balance, carbon balance of urban functional zones, and factors influencing carbon balance (Nepal et al., 2013; Pingoud et al., 2016; Pukkala, 2017; Dolman and Janssen, 2018; Kondo et al., 2018; Maillard et al., 2018; Chuai et al., 2019; Nag et al., 2019; Yang et al., 2021; Mathias and Trugman, 2022). The research fields mainly focus on biology, ecology, and geography (Berhongaray et al., 2017; Tcherkez et al., 2017; Feng et al., 2019), and focus on the carbon budget of various industries (Dolman and Janssen, 2018), with the scale involving countries, provinces, and cities (Williams et al., 2017; Chen et al., 2019; Zhang et al., 2023).
Under the challenge of increasingly dramatic global warming, revealing the spatial–temporal characteristics and drivers of the carbon budget is crucial for regional carbon management (Li et al., 2021; Wang C. et al., 2021). At present, scholars mostly construct the carbon budget index from the perspective of carbon emission and carbon absorption by subtracting or dividing and then exploring the carbon balance zoning of cities or provinces (Lin et al., 2016; Gao et al., 2022). Some scholars propose that the carbon balance pressure index, by calculating the ratio of energy carbon emissions to vegetation carbon sequestration, can reflect carbon neutrality more objectively and comprehensively and guide the green development of cities (Chen et al., 2021). The improvement of carbon balance has an important influence on the development of rapidly urbanized areas (Chen et al., 2019). It is an important support to promote the high-quality development of the regional economy and the construction of ecological civilization (Chuai et al., 2019). Although the traditional carbon budget index can reflect the regional carbon deficit or carbon surplus, it is difficult to truly reflect the pressure caused by carbon emissions on the ecosystem. This problem can be better solved if the carbon footprint and carbon carrying capacity are studied together. This study aimed to comprehensively analyze the spatial–temporal characteristics of the regional carbon budget through two perspectives of supply and demand matching and coupling and coordination, and further analyze its driving factors and incorporate them into the city carbon management system. This study also contributes to the goals of SDGs12 and SDGs13.
Poyang Lake is the largest freshwater lake in China (Yuan et al., 2019), and the wetland of Poyang Lake is one of the six largest wetlands in the world (Feng et al., 2012). The spatial–temporal distribution of water-ecological resources in the lake area affects the carbon cycle and ecological environment of the terrestrial ecosystem, and then the development of urban agglomeration in the lake area. As a typical urban agglomeration of the lake region, the urban agglomeration around Poyang Lake has a relatively complete ecosystem and is in the key period of rapid urbanization. The “water-dependent” urban agglomeration around Poyang Lake is a powerful carbon source and carbon sink (Dai et al., 2021), and is becoming a key area for regional carbon budget research. At the same time, the city agglomeration around Poyang Lake is also a typical fast-urbanizing area and an important ecological function protection zone (Ye et al., 2013). The rapid expansion of urban agglomerations causes changes in land use landscape patterns. It, in turn, acts on the material cycle and energy flow of urban agglomerations, thereby affecting the process and equilibrium state of the carbon cycle (Ye et al., 2013; Li et al., 2019). To combat global warming, the Chinese government has proposed the goal of “carbon peaking and carbon neutrality.” Therefore, taking the specificity and typicality of the urban agglomeration around Poyang Lake into consideration is important to construct a carbon budget index and analyze its spatial–temporal variation characteristics to achieve carbon balance in the lake area.
This study first proposes a comprehensive framework for carbon cycling in urban social–economic–natural complex ecosystems based on the complex ecosystem theory. Second, from the perspective of matching supply and demand, coupling and coordination, two carbon budget balance indicators, carbon carrying capacity–carbon footprint matching degree (Carbon-MD), and carbon carrying capacity–carbon footprint coupling coordination degree (Carbon-CCD), are constructed. Finally, this article takes the urban agglomeration around Poyang Lake as an example to conduct an application study. The third part gives a detailed introduction to the basic situation, data sources, and carbon index calculation model. The fourth part analyzes the spatial–temporal characteristics of carbon indicators of the study area Lake from 2000 to 2020 and further analyzes the driving factors of carbon indicators from land use, natural factors, economic and social factors by using land use transfer matrix, and geographically–temporally weighted regression model. The fifth section focuses on the rationality of the carbon indicator construction process and the scientific validity of the results. The sixth section concludes this study. This study provides a quantitative carbon balance analysis tool for local policymakers and a theoretical and decision basis for policymakers to achieve sustainable carbon management.
2. Carbon cycle framework for urban complex ecosystems
Based on the complex ecosystem theory, the urban social–economic–natural complex ecosystem can be divided into energy subsystem, industry subsystem, and ecological subsystem from the perspective of the carbon cycle (Wang et al., 2011a,b; Yao et al., 2015). The carbon source of the urban complex ecosystem comes from the energy subsystem, industrial subsystem, and ecological subsystem, while its carbon sink is mainly the carbon uptake by vegetation, soil, and water in the ecological subsystem (Houghton et al., 2012; Lai et al., 2016; Zhou Y. et al., 2021). Carbon flows between the three subsystems in the form of organic carbon or inorganic carbon, and under the action of various physical, chemical, and biological processes in the three subsystems, carbon transformation, and carbon storage occur, and finally enter the natural environment in various forms or formats (Schimel et al., 2015; Battin et al., 2023). Fossil energy sources enter the social–economic–natural complex ecosystem through the energy subsystem, and after electricity and heat production, part of them enter the industrial subsystem as carbon-containing products and energy products together with industrial raw materials, part of them enter the ecological subsystem in the form of solid waste, and finally part of them enter the atmosphere in gaseous form to participate in the carbon cycle of the terrestrial ecosystem (Bassham, 1971; Dusenge et al., 2019). From a long-life cycle perspective, the carbon input, carbon consumption, carbon storage, carbon accumulation, and carbon output of the social–economic–natural complex ecosystem constitute a complete carbon cycle system in the energy subsystem, industrial subsystem, and ecological subsystem. The flow of carbon between the energy subsystem, industrial subsystem, and ecological subsystem constitutes the inner cycle of the carbon cycle of the urban’s complex ecosystem. The carbon-containing products and energy products at the carbon export side of the urban complex ecosystem enter the circulation of the consumer market, the carbon-containing waste enters the ecosystem to participate in the natural ecological process again, and the carbon-containing gases enter the atmosphere to participate in the carbon cycle of the terrestrial ecosystem, which constitutes the outer cycle of the carbon cycle of the urban complex ecosystem (Figure 1). Clarifying and characterizing the process of carbon city social–economic–natural complex ecosystems is the basis for carbon budget accounting and spatial–temporal characterization.
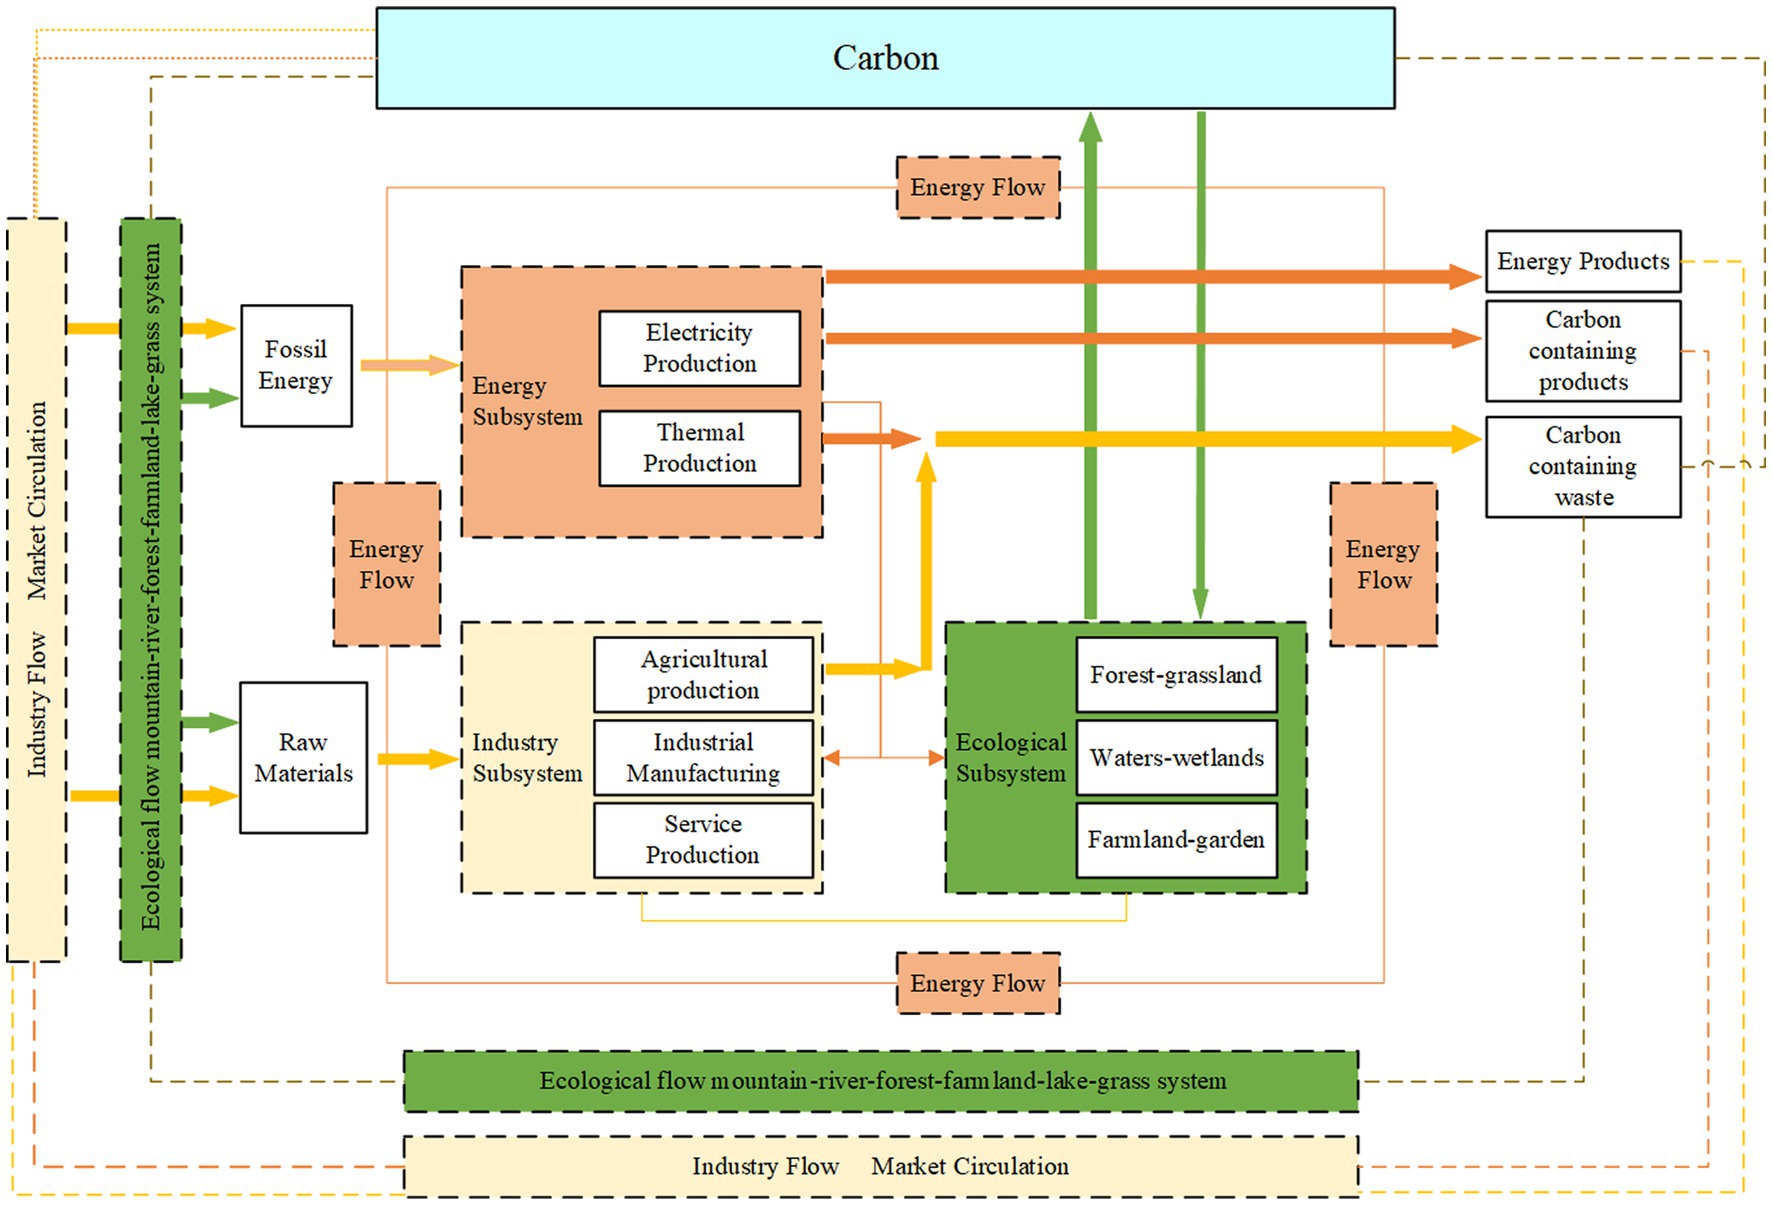
Figure 1. Carbon cycle framework for urban social–economic–natural complex ecosystems.
3. Materials and methods
3.1. Study area
Poyang Lake is the largest throughput lake in the Yangtze River basin, which plays a great role in regulating the water level of the Yangtze River, connoting water, improving the local climate, and maintaining the ecological balance of surrounding areas (Yuan et al., 2019; Dai et al., 2021). Urban agglomeration around Poyang Lake is a typical basin lake-type urban agglomeration, including five cities and some counties (districts), with a land area of approximately 5.319 million km2. Its climate is dominated by a subtropical monsoon climate, and the terrain is dominated by lakes and wetlands, and hilly plains. As shown in Figure 2, the spatial–temporal distribution of water resources in the study area is uneven, the towns and rural settlements are mostly distributed near the water area, and human activities have “hydrophilic” characteristics. Its carbon emissions are mainly concentrated in near-water areas where human activities are more frequent, while ecological resources with strong carbon sink capacity, such as forest resources and grassland resources, are mostly concentrated in far-water areas.
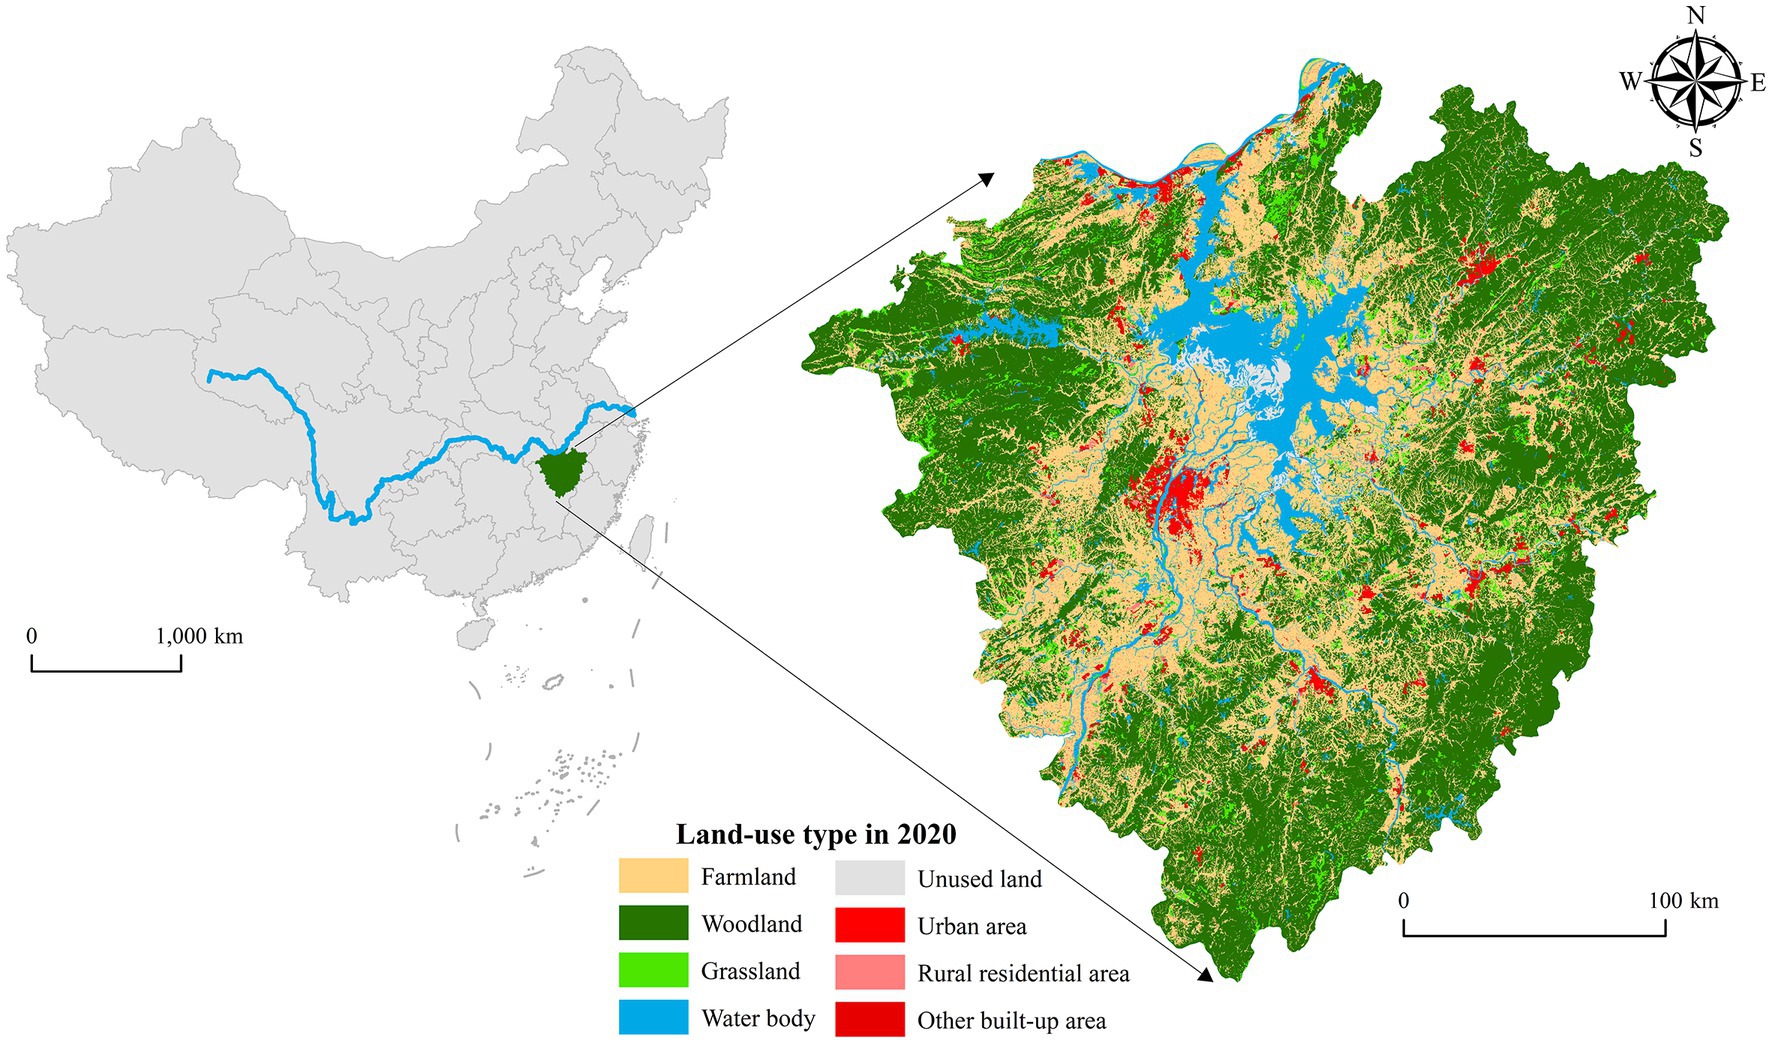
Figure 2. Location and land use type of the urban agglomeration around Poyang Lake in China.
Since the twentieth century, the Poyang Lake area has experienced three stages of “deep development (2001–2006)-ecological economic zone construction (2007–2014)-ecological urban agglomeration construction (2015-present).” The carbon footprint of the study area has changed greatly since 2000–2020. The study results of this article are important for the carbon balance and ecological protection in the lake area (Figure 2).
3.2. Methods
3.2.1. Carbon emission and carbon sink
The carbon emissions of urban social–economic–natural complex ecosystems originate from the energy subsystem, industrial subsystem, and ecology subsystem (Houghton et al., 2012; Lai et al., 2016; Li et al., 2021). The accounting equation is as follows:
The carbon sinks of urban social–economic–natural complex ecosystems mainly originate from ecological subsystems, specifically water carbon sinks, soil carbon sinks, and vegetation carbon sinks (Guo et al., 2017; Chuai et al., 2019; Li et al., 2021; Gao et al., 2022). On the one hand, scholars have estimated terrestrial vegetation carbon sinks relatively accurately, but the research on soil carbon sinks is relatively weak, and there are large differences in the valuation of soil carbon sinks due to the limitations of knowledge, data, and technology. On the other hand, in different land types, carbon absorbed by agricultural ecosystems is decomposed into the atmosphere during the harvest season, and whether there is a net sink, and the size of the sink is somewhat controversial. Therefore, only the carbon sink functions of forests, water bodies, and grasslands are considered. Considering the forest resource types in the study area and the existing research results (Zhang et al., 2022), the carbon absorption factor of forest land was calculated as 0.644 t C/(hm2·a). Considering regional similarities and in light of existing research results (Wang C. et al., 2021), combining grassland types and climatic zones in the study area, the carbon absorption factor for grasslands was calculated at 0.021 t C/(hm2·a). Poyang Lake is the largest freshwater lake in China, and its wetland ecosystem is one of the most important carbon reservoirs on earth. Considering the difference in carbon sequestration rates between the geographical location of the Lake region and wetland ecosystems in the north and south, the carbon sequestration factor in the water was 0.253 t C/(hm2·a) (Wang C. et al., 2021). The formula is as follows:
3.2.2. Carbon footprint and carbon carrying capacity
Studies on regional carbon footprints mainly focus on carbon emissions generated by human activities, which cannot portray the balanced relationship between carbon emissions and carbon sinks, while combining carbon footprint and carbon carrying capacity can better solve this problem. Carbon footprint can be regarded as the ecological footprint of carbon emissions, which is the area of ecologically productive land that needs to be occupied to absorb carbon emissions. Carbon carrying capacity can be regarded as the carbon supply capacity of the ecosystem, which is the upper limit of carbon sink capital that can be provided by the ecologically productive land in the region. Net ecosystem production (NEP) reflects the net carbon absorption capacity of terrestrial ecosystems and represents the carbon sequestration capacity of 1 hm2 (squared hectometers) of vegetation or water body in a year, and the conversion between carbon emissions and carbon footprint can be realized by using NEP. Considering the uniqueness of the lake region, the carbon sink capacity of the water body is included in the carbon footprint and carbon carrying capacity. The calculation formula is as follows:
3.2.3. Carbon budget balance evaluation index
Based on the Chen et al. (2021), Chuai et al. (2019), and Guo et al. (2017) study, the carbon budget balance evaluation indexes include Carbon-MD and Carbon-CCD. There is a certain threshold value for carbon carrying capacity to bear the carbon footprint, which depends on the local and natural state of the ecosystem and takes subject to the scale and way of carbon footprint. When the regional carbon footprint is within a certain range, the carbon carrying capacity can carry the carbon footprint to the maximum extent through self-regulation and elasticity; but when the carbon footprint exceeds a certain limit, that is, the carbon carrying capacity cannot carry the carbon footprint needs, then carbon spillover will occur.
3.2.3.1 Carbon-MD
Carbon-MD is an important indicator of whether the carbon carrying capacity in the region can carry the demand of carbon footprint, which plays an important role in restraining the intensity of carbon footprint and excessive growth of demand. The Carbon-MD further reflects the surplus status of regional carbon revenue and expenditure and can characterize whether the carbon sink of the ecological production system can offset the carbon source. Its formula is as follows:
3.2.3.2 Carbon-CCD
Carbon-CCD characterizes the level of synergistic development between carbon carrying capacity and carbon footprint, reflecting whether the carbon emissions from human activities develop in line with the carbon sinks that ecosystems can provide, which can reveal the potential of regional carbon budget balance. The formula is as follows:
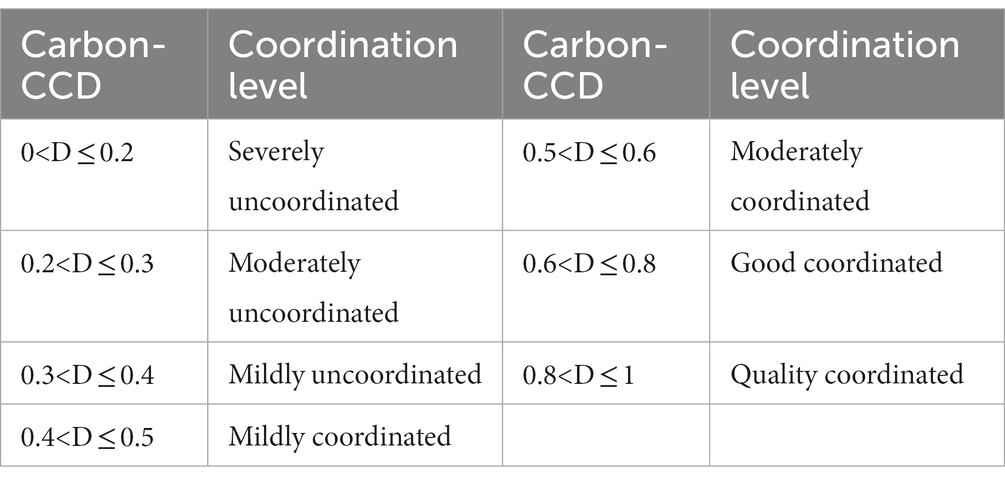
Table 1. Classification of carbon carrying capacity–carbon footprint coupling coordination degree (Carbon-CCD) types.
3.2.4. Geographically and temporally weighted regression model (GTWR)
GTWR considers the expansion of geographically weighted regressive models by considering the non-stationarity of time, incorporating both temporal and spatial effects (Xu et al., 2023). This enables the model to deal with spatiotemporal heterogeneity at the same time, so it has a clear advantage in exploring spatiotemporal variability of carbon budget influencing factors. The construction formula is as follows:
To measure the beta βk(ui,vi,ti) of each variable k in all space–time location. βk(ui,vi,ti) can be transformed as follows:
3.3. Data source
Based on 42 counties of the urban agglomeration around Poyang Lake, the data selected in this study include energy consumption data, land use data, and socioeconomic data. Energy consumption and socioeconomic data are obtained from Carbon Emission Accounts and Datasets for emerging economies (CEADs),1 China Statistical Yearbook (County-level), Jiangxi Statistical Yearbook, and corresponding yearbooks of cities and counties. Land use data were derived from 30 m × 30 m grid data from the Resource and Environmental Science Data Center of the Chinese Academy of Sciences2 for the years 2000, 2005, 2010, 2015, and 2020.
4. Results
4.1. Spatial–temporal characteristics of carbon footprint and carbon carrying capacity
It selected 50, 100, and 150% of the average carbon footprint and carbon carrying capacity of the urban agglomeration around Poyang Lake from 2000 to 2020 and divided the carbon footprint and carbon carrying capacity into four levels: low, lower, higher, and high. Then, the spatial distribution of carbon footprint and carbon carrying capacity in 2000, 2010, and 2020 was visualized through ArcGIS software (Figure 3).

Figure 3. Spatial distribution of carbon footprint and carbon carrying capacity.
During the study period, the carbon footprint of the study area shows a dynamic increasing trend from rapid increase to steady increase. Since 2000, the carbon footprint of the study area has increased rapidly from 6,255,395.63 hm2 to 14,485,241.37 hm2 in 2010, with an increase in 231.56%. After 2010, its growth rate slowed down but still increased to 27,874,164.9 hm2 in 2020, with a growth rate of 192.43%. The comparison shows that the construction of the eco-urban agglomeration around Poyang Lake (2015–2030) is beneficial to slow down the growth rate of carbon footprint.
The spatial pattern of the carbon footprint at the county level in the study area shows a “core-periphery” structure with the Nanchang municipal district as the core of high value and gradually decreasing outward. The high-value carbon footprint area in 2000 only included Nanchang City District and Nanchang County, while the rest of the areas had a lower carbon footprint due to the fledgling urbanization, slow economic development, and dispersed population. Compared with 2000, the number of high-value areas and lower-value areas of carbon footprint increased significantly in 2010. In addition to the core area of Nanchang City, the high-value area gradually spreads outward, and Jiujiang City becomes the high-value area of carbon footprint with the advantage of transportation location. By 2020, the number of high-value carbon footprint areas will increase to 14 and the number of low-value areas will shrink to 3. The carbon footprint of prefecture-level municipalities such as Fuzhou City, Jingdezhen City, and Yingtan City will increase significantly due to population concentration and economic development.
During the study period, the carbon carrying capacity of the study area shows a trend of “rising, then falling and finally declining.” Since 2000, the carbon-bearing capacity of the study area slowly increased from 15,922,773.77 hm2 to 15,994,651.77 hm2 in 2010, with an increase of only 0.45%. Since 2000, the carbon-bearing capacity of the study area slowly increased from 15,922,773.77 hm2 to 15,994,651.77 hm2 in 2010, with an increase of only 0.45%. Subsequently, it decreases to 15,591,361.26 hm2 in 2020, which is 2.52% less than in 2010. After 2010, the urbanization rate of the study area accelerated, and the urban expansion led to the shrinkage of carbon sinks in land areas such as woodland, waterbody, and grassland. The topography of the county with high carbon carrying capacity is mainly mountainous and hilly, with rich forest resources, which provides a large amount of carbon sink. The counties with a low value of carbon carrying capacity are mainly located in the core area around Poyang Lake, the topography of these areas is mainly plain, and the carbon sink capacity is weak.
4.2. Spatial–temporal characteristics analysis of Carbon-MD
The Carbon-MD can quantitatively reflect the carbon budget of the study area. We used ArcGIS10.8 software to divide the county into seven categories of areas: severe unbearable area, barely unbearable area, mild unbearable area, carbon balance area, average bearable area, good bearable area, and high-quality bearable area in 2000, 2005, 2010, 2015, and 2020 (Figure 4).
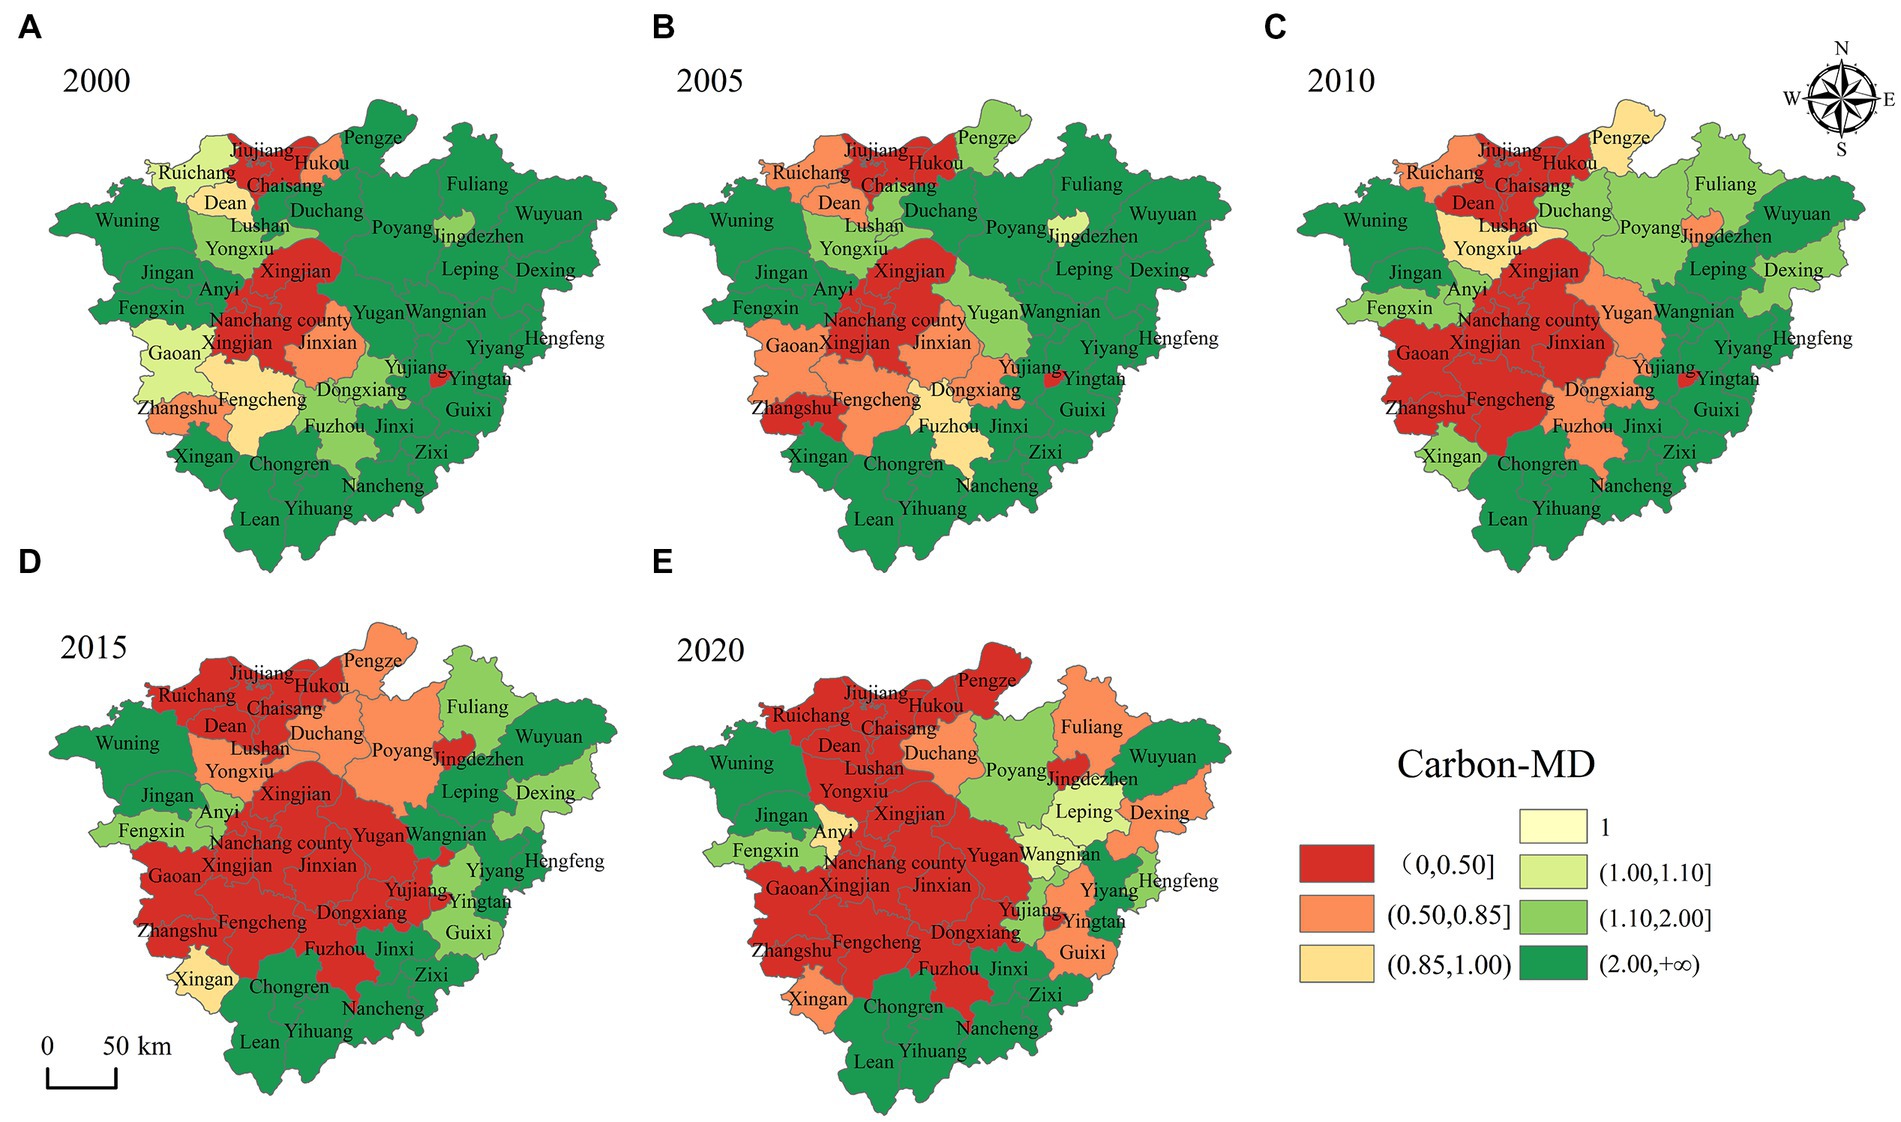
Figure 4. Spatial distribution of Carbon-MD.
From 2000 to 2020, the distribution of Carbon-MD in the study area ranges from 0.008 to 47.6597. From the time change, the Carbon-MD of the whole area decreases from 2.5454 in 2000 to 0.5593 in 2020, which decreases by 78.03% in 20 years, from high quality to barely unbearable. This indicates that the carbon budget of urban agglomeration around Poyang Lake gradually turns into a deficit over time, and its carbon carrying capacity does not meet the demand for an internal carbon footprint.
From the spatial pattern, the Carbon-MD in the study area shows the spatial distribution characteristics of increasing from the core area around the lake, where the built-up area is more concentrated, to the peripheral area around the lake with higher elevation. The low value of Carbon-MD is mainly concentrated in the Poyang Lake Plain, especially around municipal districts such as Nanchang and Jiujiang. The high carrying capacity areas are mainly distributed in Wuyi Mountain in the east of Jiangxi and Luoxiao Mountain area between Jiangxi and Hunan provinces. The spatial distribution characteristics of the Carbon-MD are similar to those of the carbon footprint and opposite to those of the carbon carrying capacity.
From the perspective of spatial evolution, the low-value area of Carbon-MD shows a “point to area” diffusion trend. From 2000 to 2020, the low-value area spreads from Nanchang City and the surrounding counties to the core area around the lake and then to the edge of the lake. In 2000, the Carbon-MD low-value area included only five counties in Nanchang City, Nanchang County, Xinjian County, Jiujiang City, and Chaisang District. By 2010, the low-value area increased to 12 counties, at which time the region-wide carbon revenue and expenditure match was 1.1042, still in a good match stage, indicating that the carbon carrying capacity could still meet the internal carbon footprint at this time. The Carbon-MD low-value area in the study area increases to 20 counties in 2020, concentrated in the core area of the lagoon and the counties in the peripheral area of the lagoon. In addition, due to the vast water area of Poyang County, which is located in the core area of the lagoon, most of its period is in a good bearable and high-quality bearable stage.
In general, the county carbon budget partition has obvious characteristics of the Great Lakes basin, and Poyang County, which is located in the center of the lake, has more water area with a long-term carbon surplus. The core area around the lake is dominated by plains, and the rapid expansion of urbanization in the core area of the “water-dependent” urban agglomeration has led to a carbon deficit. The edge area around Poyang Lake is mainly hilly and mountainous, with rich forest resources and strong carbon sink capacity, while the level of urbanization and industrialization is low due to the topography and terrain, with less carbon emission.
4.3. Spatial–temporal characteristics analysis of Carbon-CCD
There is a coupled interaction between carbon carrying capacity and carbon footprint that promotes and coerces each other. We measured the coupling degree values of county units in the study area in 2000, 2005, 2010, 2015, and 2020, respectively. Then, we spatially visualized the expression by ArcGIS10.8 software to obtain the spatial distribution map of the carbon bearing capacity–carbon footprint coupling degree in the study area (Figure 5).
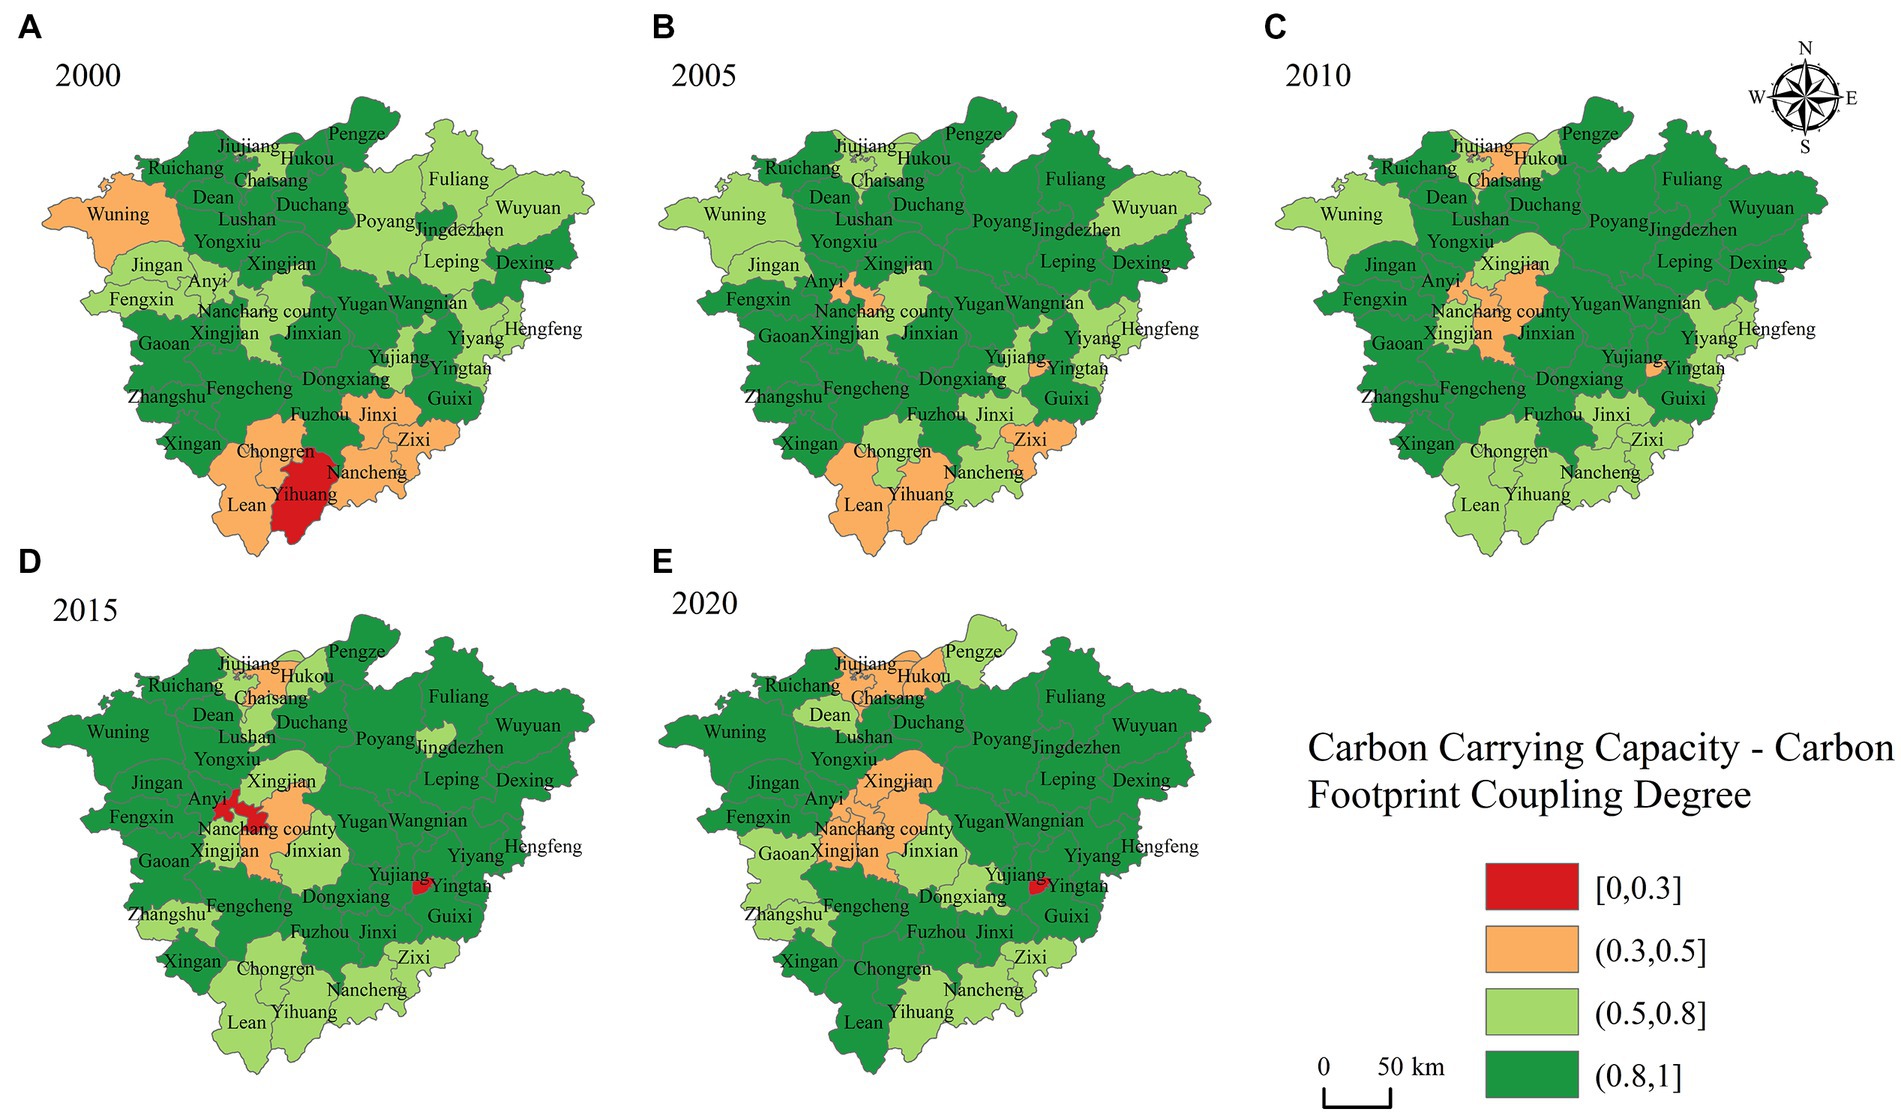
Figure 5. Spatial distribution of carbon carrying capacity–carbon footprint coupling degree.
From 2000 to 2020, the distribution of carbon carrying capacity–carbon footprint coupling degree of each county in the study area ranged from 0.2853 to 1. During the two decades, the overall carbon carrying capacity–carbon footprint coupling degree of the whole study area showed a trend of “rising and then falling.” The overall coupling degree of the whole region increased from 0.8999 in 2000 to 0.9987 in 2010 and then decreased to 0.9592 in 2020. It indicates that the whole region of the study area is in a long-term coordinated coupling period, and the carbon carrying capacity and carbon footprint gradually develop in an orderly direction.
From the spatial pattern, the high values of carbon bearing capacity–carbon footprint coupling are concentrated in most of the counties in the peripheral area of the lake ring and the peripheral area of the lake ring. In 2000 and 2005, the low-value areas were clustered in the southern counties of the study area. After 2010, the low-value areas were concentrated in the municipal districts of Nanchang and Jiujiang and the surrounding areas of both.
From the spatial evolution, the high-value area of carbon carrying capacity–carbon footprint coupling shows an increasing trend year by year, from 21 county units in 2000 to 26 county units in 2020. The coupling degree evolution of some counties shows obvious fluctuation. For example, the Nanchang city municipal area has experienced the process of “friction–antagonism–low coupling–antagonism,” and Le’an County, Zixi County has experienced the process from “antagonism” to “antagonism.” Le’an County and Zixi County experienced a leap from “antagonism” to “friction” and even “coordinated coupling.”
The Carbon-CCD can qualitatively reflect the carbon budget balance of the study area. The distribution range of Carbon-CCD in the study area from 2000 to 2020 is 0.1730 ~ 0.8661. Based on the calculation results, we used ArcGIS10.8 software to classify the county Carbon-CCD in 2000, 2005, 2010, 2015, and 2020 into eight types: severely uncoordinated, mildly uncoordinated, mildly coordinated, moderately uncoordinated, moderately coordinated, well-coordinated, and quality coordinated (Figure 6).
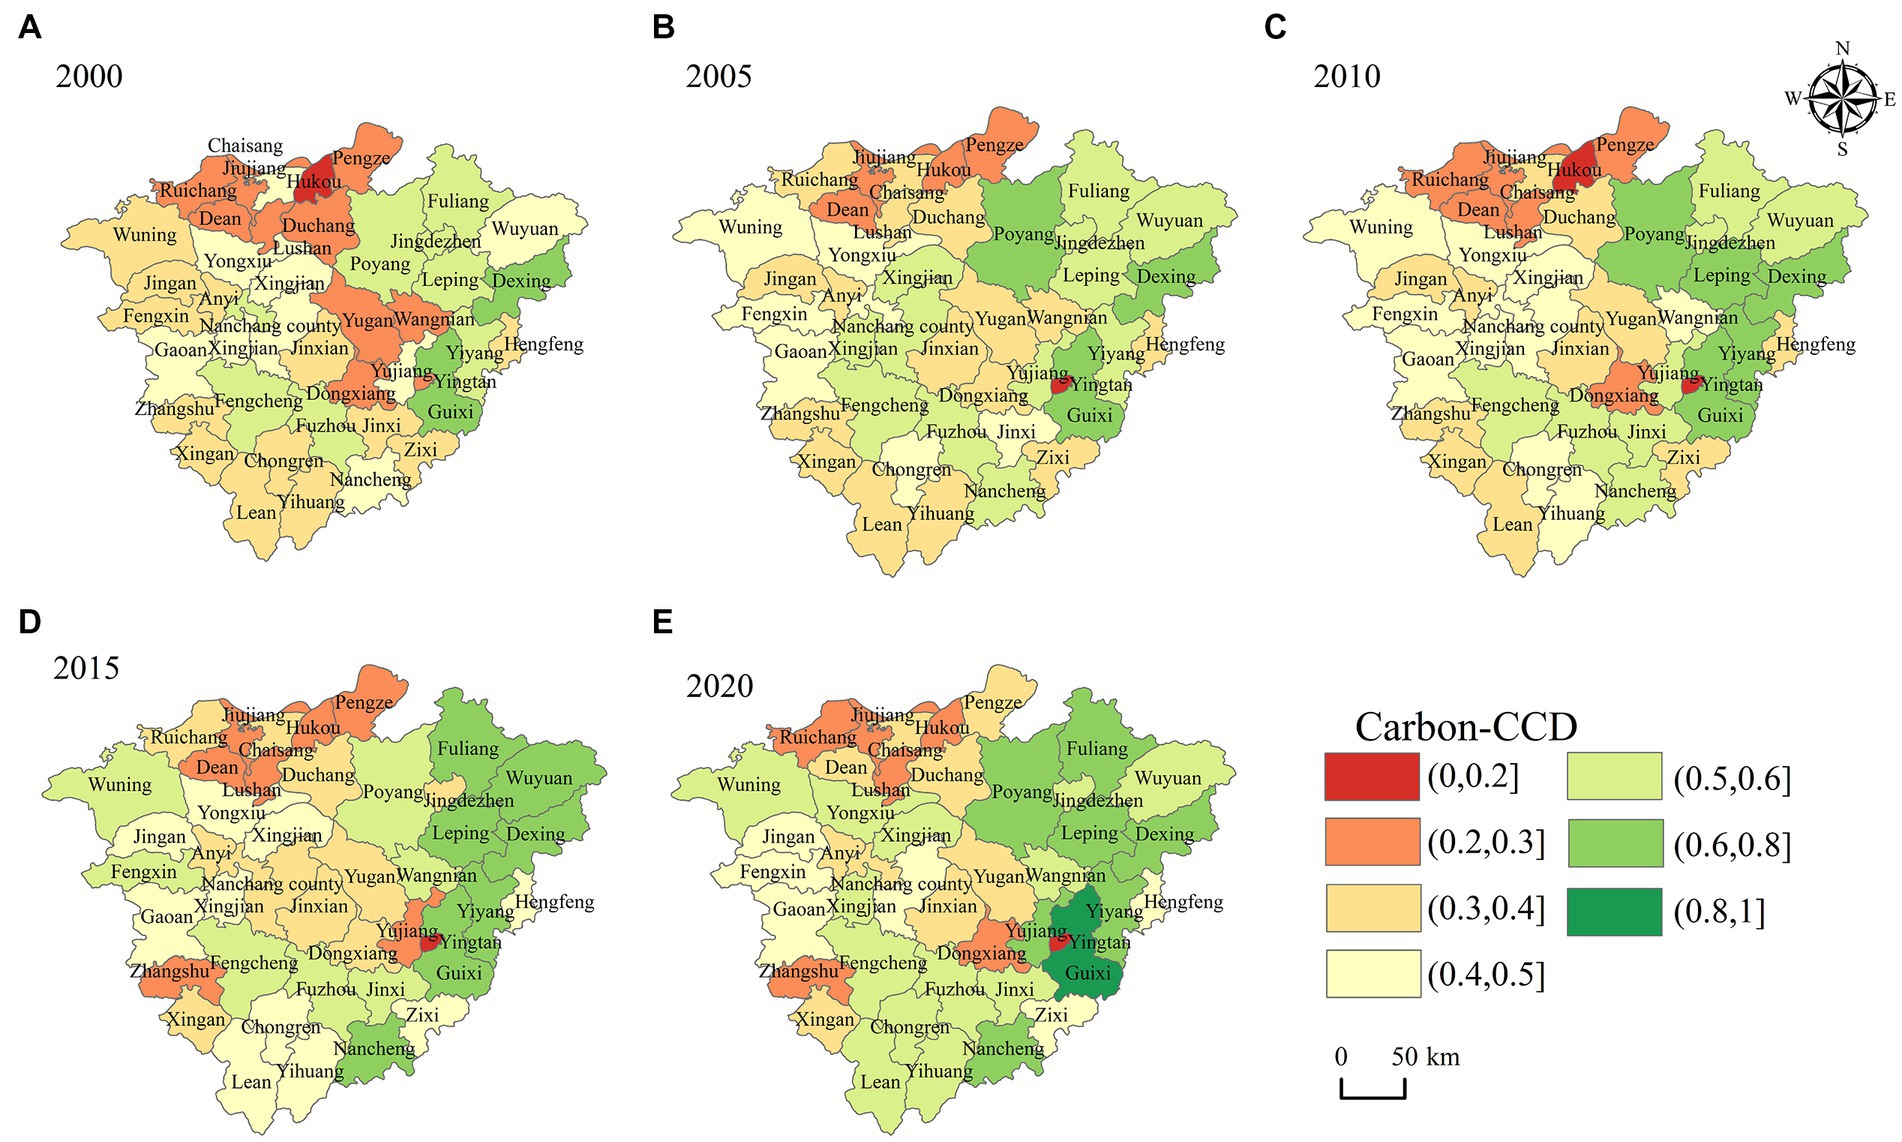
Figure 6. Spatial distribution of Carbon-CCD.
From the spatial pattern, there is a spatial heterogeneity in the distribution of Carbon-CCD of the county unit in the study area, and it shifts from scattered type to group type. The spatial distribution of Carbon-CCD of county units in the study area has a certain correlation, and the high-value area of Carbon-CCD roughly coincides with the high-value area of the coupling degree. The number of low-value areas of Carbon-CCD is much more than the number of low-value areas of coupling degree, but both show the spatial evolution characteristics of gradually spreading outward with Nanchang and Jiujiang municipal districts as the core.
In the time dimension, the Carbon-CCD in the study area showed a gradual increase from moderate disorder to basic coordination, and the average level of coupling coordination increased from 0.3927 to 0.4687. In 2000, the Carbon-CCD ranged from [0.1730, 0.6359], with the lowest value in Hukou County and the highest value in Guixi City. The types of coupling coordination are mainly severely uncoordinated, mildly uncoordinated, mildly coordinated, moderately uncoordinated, moderately coordinated, and good coordination, accounting for 2.38%, 23.81, 30.95, 19.05, 19.05, and 4.76%, respectively. Its overall level is low, and most of them are in mild dissonance. In 2010, the Carbon-CCD was between [0.1440, 0.7524], the lowest value was in Yingtan City, and the highest value was still in Guixi City. The coupling coordination types are the same as those in 2000, but the coordination types of mild and above account for 53.49%, and the overall level has improved, but the increase is not obvious. In 2020, the Carbon-CCD in the study area is between [0.1786, 0.8661], and the lowest and highest value areas are the same as in 2010. The coupling coordination type in Guixi City is improved to the coupling of high-quality coordination, and the coordination type of mild and above accounts for 60.47%. Compared with 2000 and 2010, the proportion of moderate coordination and good coordination increased significantly.
4.4. Natural and anthropogenic factors
Human activities and climate change act together on land cover, which, in turn, leads to significant changes in land use types and affects the carbon emissions and carbon sink of the urban agglomeration ecosystem around Poyang Lake. The mechanisms of land use change on carbon budget include the following two main aspects. There are differences in carbon emissions and carbon sinks between land use types, and land use changes may directly alter the amount of carbon emitted or sequestered. Land use change affects the processes of the carbon cycle in complex social–economic–natural ecosystems, such as energy exchange, carbon metabolism, and geochemical cycling of carbon.
This study made the land use transfer matrix of urban agglomeration around Poyang Lake from 2000 to 2020 through ArcGIS (Table 2). The land type in the study area from 2000 to 2020 has undergone significant changes, which overall show an increase in construction land and water body, and a decrease in farmland, grassland, woodland, and unused land. During the 20 years, the urban agglomeration around Poyang Lake, land use types, except for the same type of conversion, have shifted more unused land to construction land, more grassland to woodland, more construction land to unused land, unused land to a waterbody, and woodland to construction land. By phase, the increase in construction land from 2010 to 2020 is significantly higher than the increase from 2000 to 2010. From 2000 to 2010, the total area of other land types converted to construction land in the study was 35.06 km2. From 2010 to 2020, it is 919.99 km2. During this period, the low Carbon-MD of the study area spread rapidly, suggesting that the expansion of construction land is the main cause of its carbon deficit. The land use type shifts between different types from 2000 to 2010 mainly include farmland to a waterbody, grassland to woodland, construction land to farmland, unused land to a waterbody, waterbody to unused land, and woodland to grassland. In addition, the shift of land use types between different types from 2010 to 2020 mainly includes unused land to construction land, grassland to construction land, construction land to unused land, unused land to a waterbody, waterbody to construction land, and woodland to construction land. During this period, the shift between different land use types was dominated by the shift to built-up land.
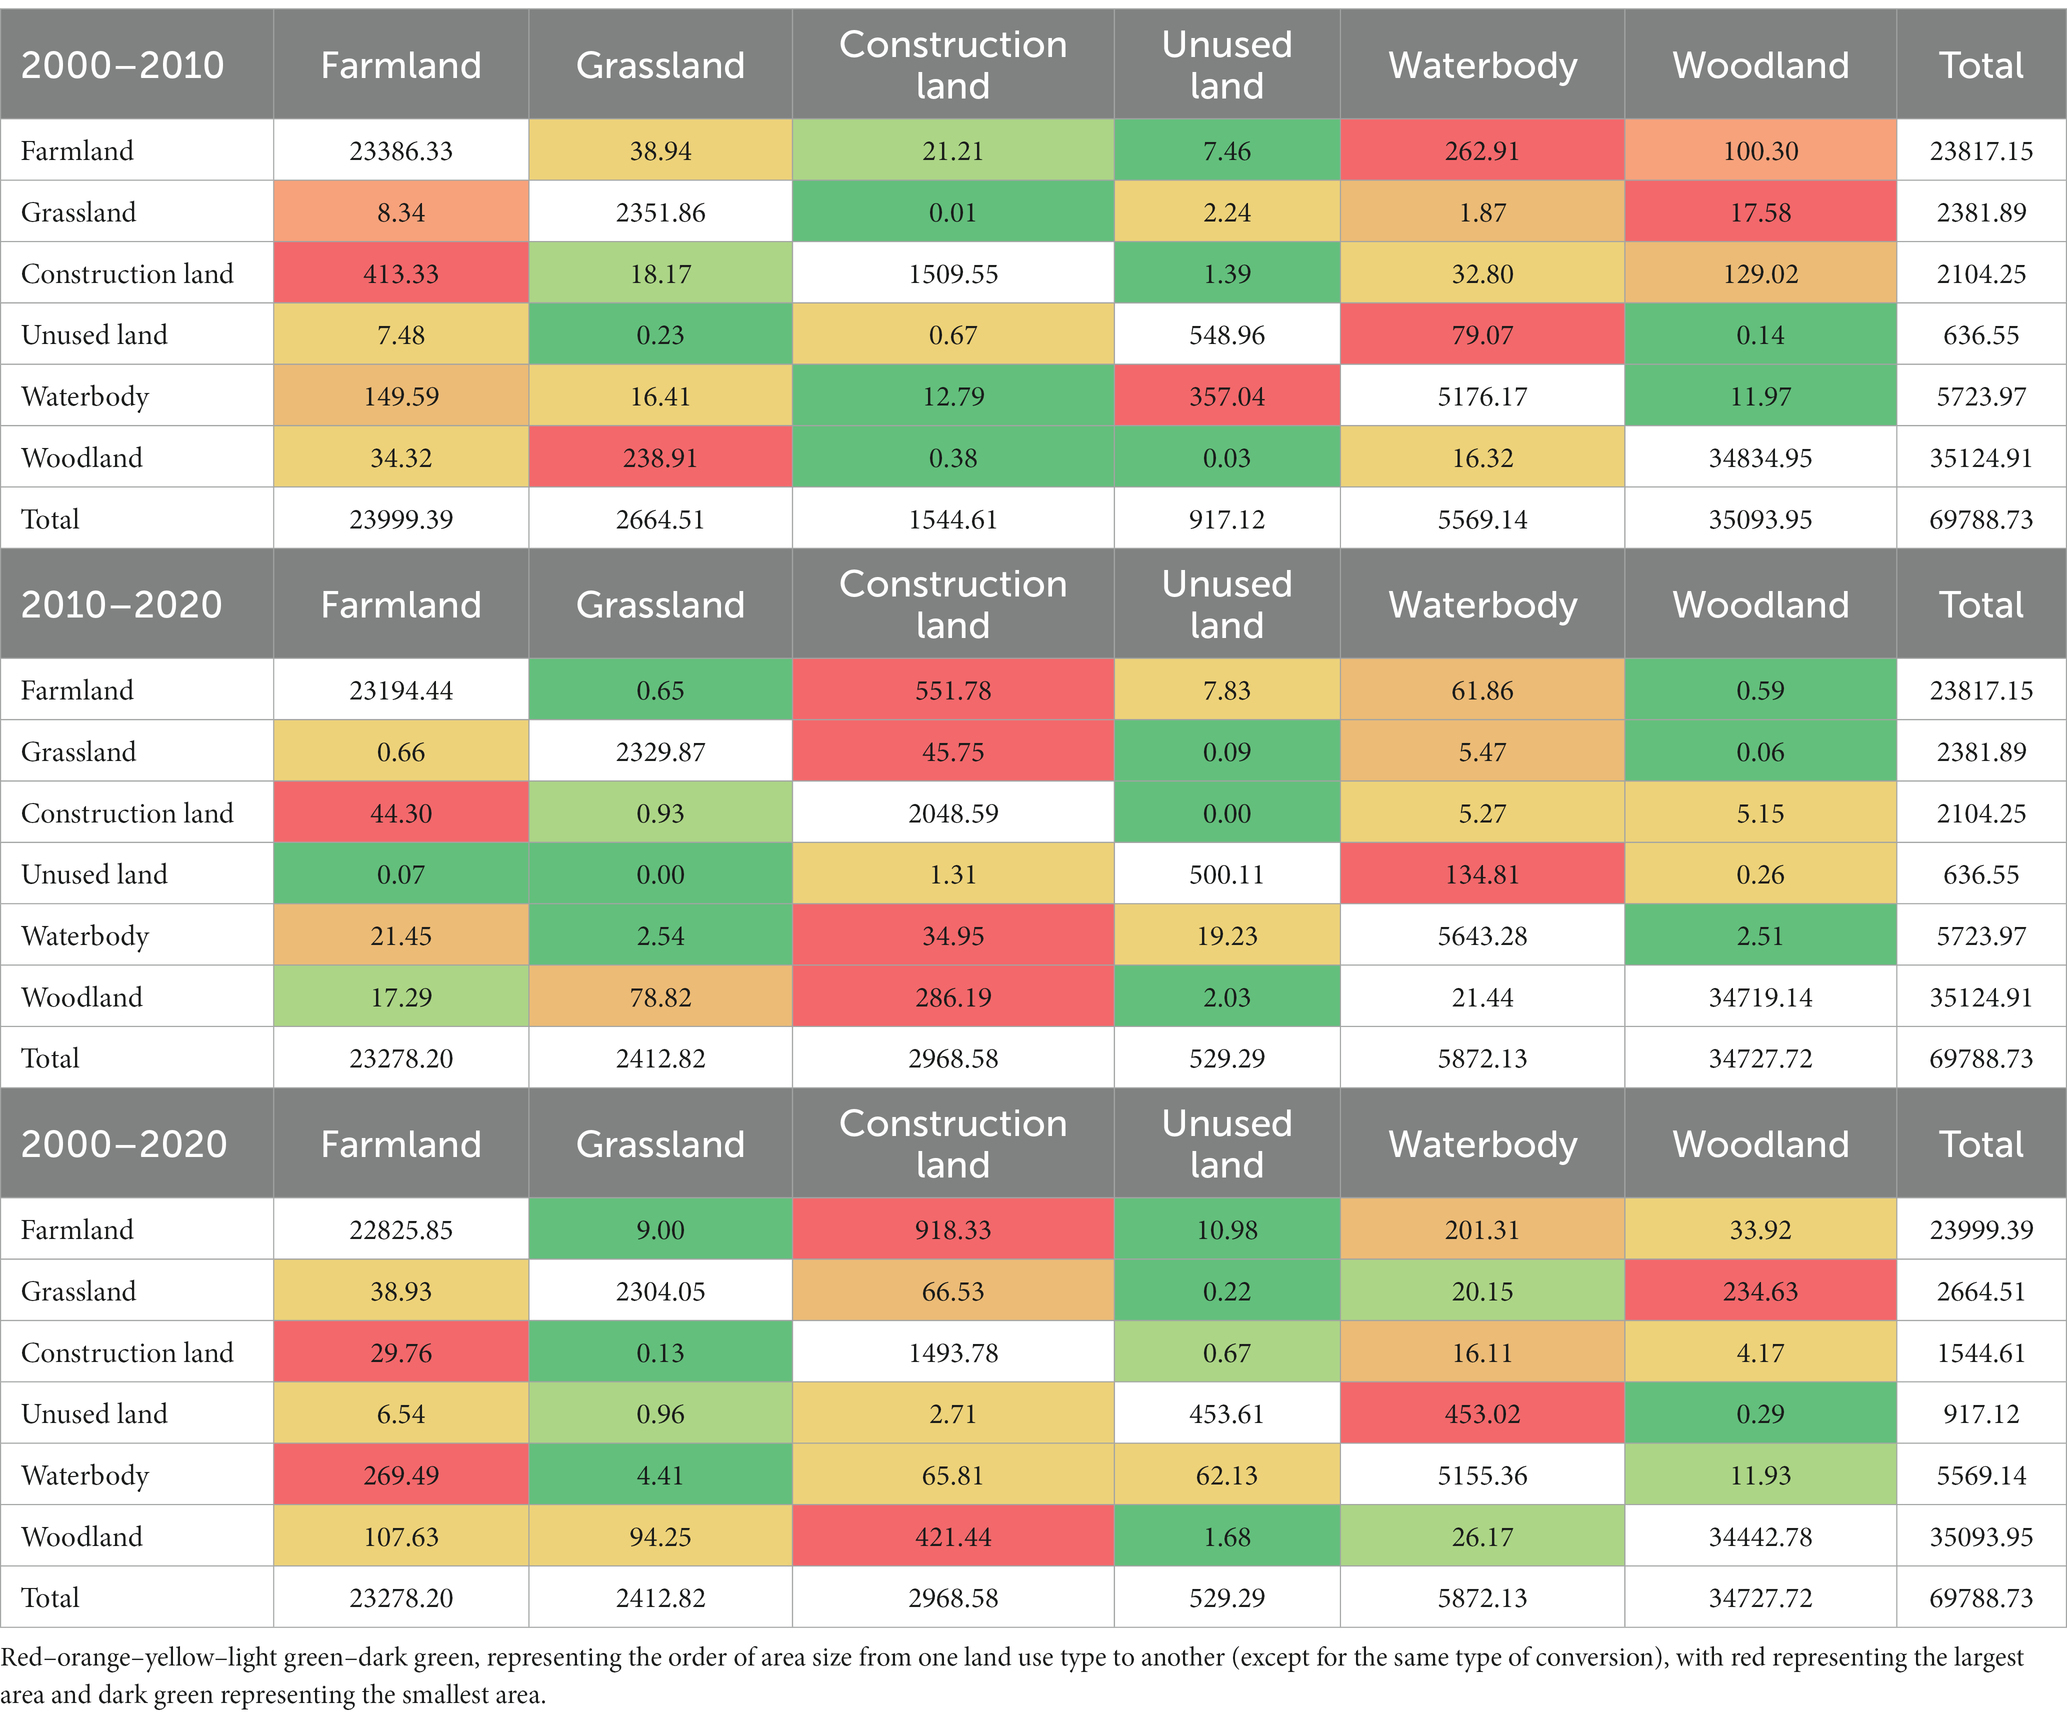
Table 2. Land transfer matrix of urban agglomeration around Poyang Lake from 2000 to 2020.
In addition to land use types, natural factors, and socioeconomic factors are also important factors affecting the carbon budget. Combined with the characteristics of this type of lake city group around Poyang Lake, the lake-ring zoning (LRZ) and normalized difference vegetation index (NDVI) are selected as natural factors. The proportion of built-up area (PBU), regional population density (RPD), and industrial structure (IS) are socioeconomic factors. To avoid interactions between variables, all variables were tested for covariance, and the variance inflation factor values of all variables were found to be less than 10, indicating that there was no significant covariance between variables.
The GTWR model is an extension of the GWR model considering the non-smoothness of time, which incorporates both temporal and spatial effects into the model, enabling the GTWR model to deal with spatiotemporal heteroskedasticity simultaneously. To test the reliability of the model, we compared the fitting results of the GTWR model with the GWR model, as shown in Table 3. The R2 adjusted value of the GTWR model is significantly higher than that of the GWR model, which indicates that the GTWR model has a better fit than the GWR model.
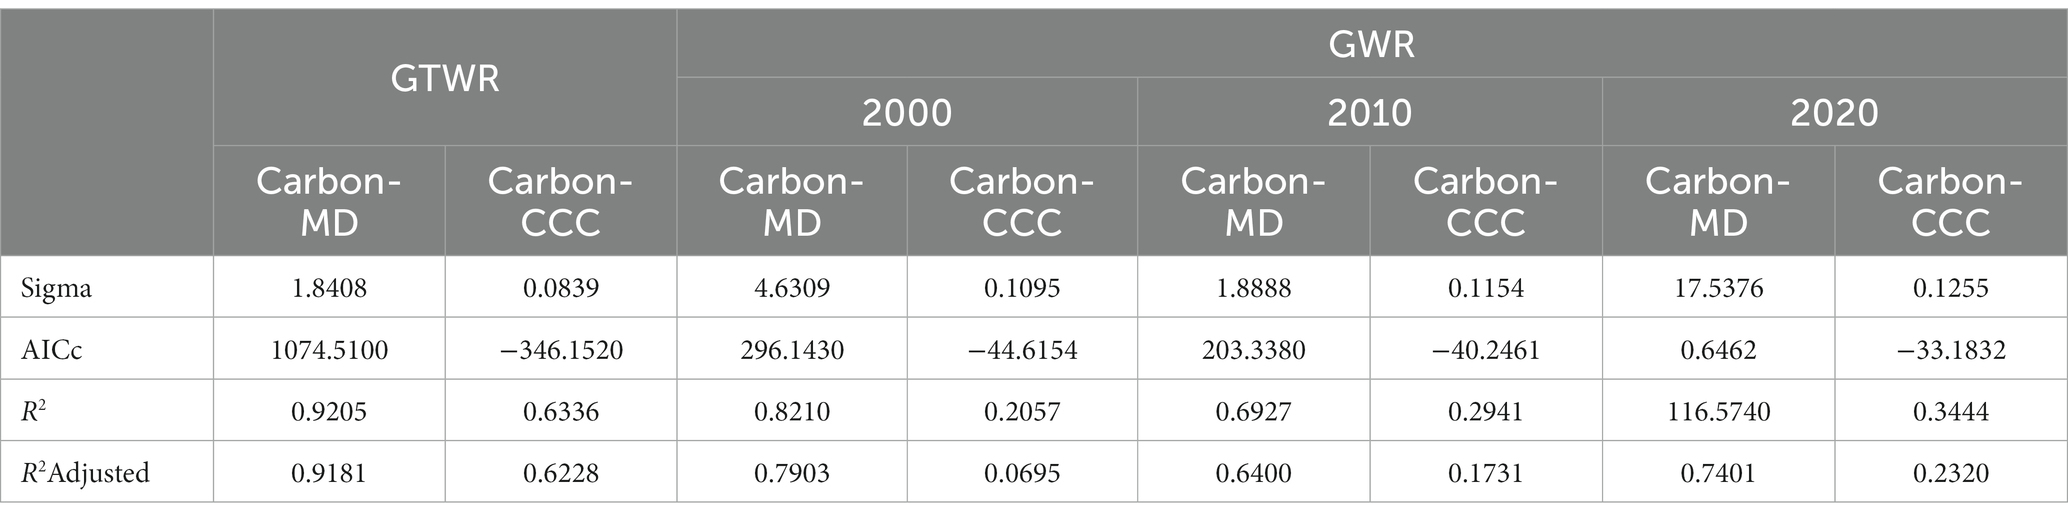
Table 3. Statistical results of GTWR and GWR parameters.
To compare the spatial–temporal variability of the effects of natural and socioeconomic factors on the Carbon-MD and Carbon-CCD, five periods of data from 2000, 2005, 2010, 2015, and 2020 were selected in this study to calculate the regression coefficients of each influencing factor after standardization. By comparing the magnitude of the absolute values of the regression coefficients of each factor, the dominant factors of each county unit were selected to spatially visualize and express the dominant factors of Carbon-MD and Carbon-CCD in 2000, 2010, and 2020.
As shown in Figure 7, the influence of socioeconomic factors on the Carbon-MD and Carbon-CCD of the study area is stronger in the study period. The area share of built-up area and population density as the highest value is most widely distributed in the county units. In terms of Carbon-MD, the counties with the highest built-up areas are mainly located in the south of the study area and show a trend of “increasing then decreasing” over time, gradually spreading to the northeast. The counties with the highest population density values are mainly located in the northern part of the study area except for Nanchang City and show a trend of “increasing then decreasing” over time and finally distributed in the western and northern parts of the study area. The county units with the highest values of natural factors are mainly distributed in and around the municipal district of Nanchang City, and they show an increasing trend over time. In general, the area dominated by socioeconomic factors gradually decreases, and the area dominated by natural factors increases correspondingly.
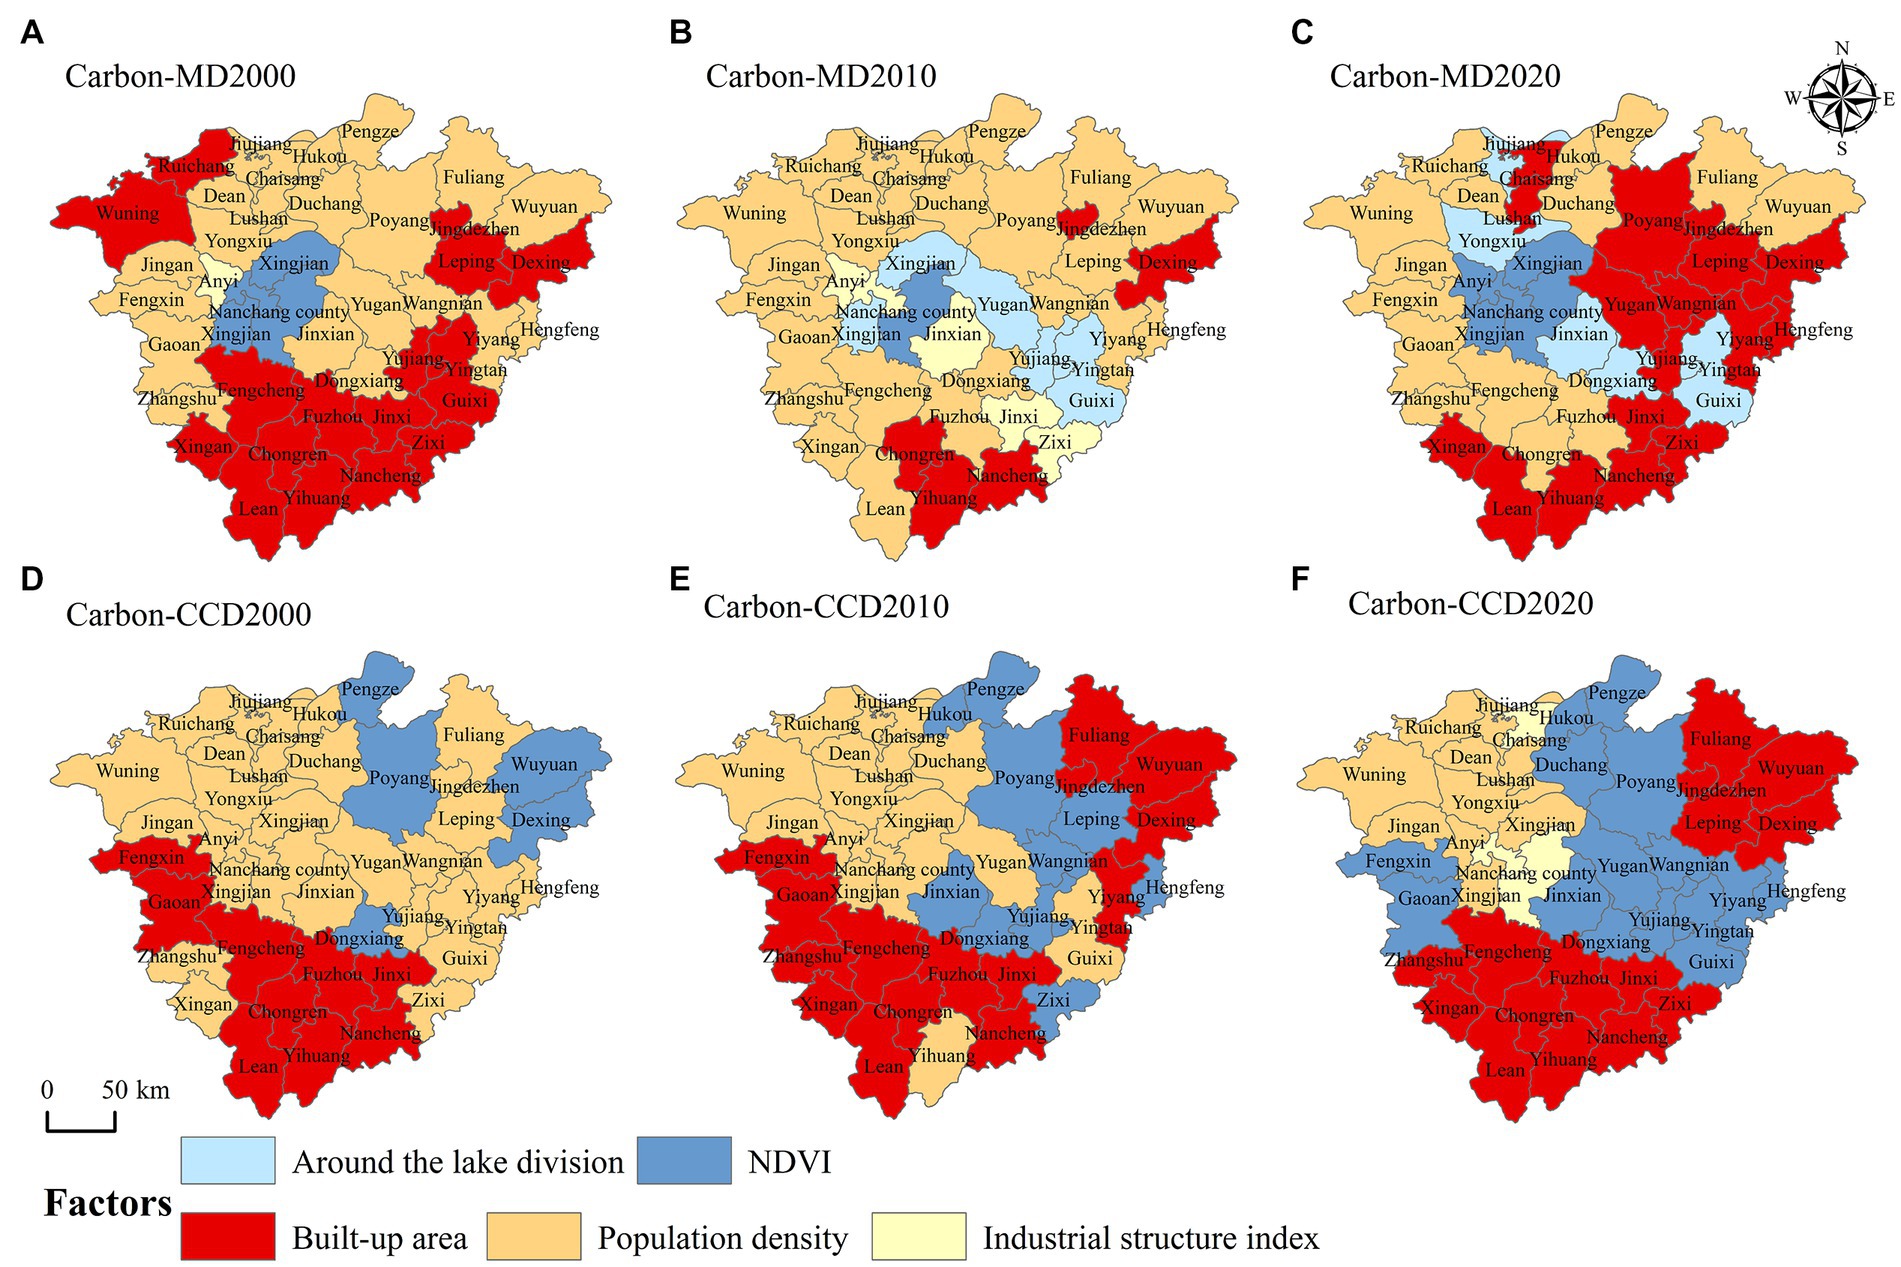
Figure 7. Spatial distribution of influencing factors of Carbon-MD and Carbon-CCD.
From the Carbon-CCD, the number of county units with the built-up area, population density, and NDVI as the dominant factors is relatively balanced. The county units with the percentage of the built-up area as the dominant factor are mainly distributed in the southwestern part of the study area, and gradually expand like the northeastern part, eventually dominated by the peripheral area around the lake. The county units with population density as the dominant factor are mainly located in the northwestern part of the study area and show a decreasing trend. The county units with NDVI as the dominant factor were mainly distributed in the eastern part of the study area and showed a gradually increasing trend. In general, the area of the strong role of socioeconomic factors on the Carbon-CCD is gradually decreasing, and the area of NDVI as the dominant factor is increasing.
5. Discussion
5.1. Rationality of the process and the scientific nature of the results
This study applies the carbon-bearing Carbon-MD and Carbon-CCD for the first time to analyze the spatial–temporal characteristics of the carbon budget in the study area, and it is necessary to explore the rationality of its process and the science of the results. Based on the complex ecosystem theory, this article portrays the complete process of the carbon cycle in the urban complex ecosystem from three perspectives: energy subsystem, industry subsystem, and ecological subsystem, which provides theoretical and framework support for carbon budget accounting in the study area. Existing studies only consider the carbon sink function of forest land and grassland when calculating carbon footprint and carbon carrying capacity (Lenzen et al., 2018). However, inland waterbody and phytoplankton, aquatic plants, heterotrophs, and microorganisms in inland waterbody have great carbon sequestration potential and can share the carbon-neutral pressure of terrestrial ecosystems. Considering the uniqueness of the lake area, this article incorporates the carbon sink of waterbody into the accounting system of carbon footprint and carbon carrying capacity of urban agglomeration around Poyang Lake. Based on the theory of human–land synergy, ecosystem service theory, and landscape ecology theory, the carbon carrying capacity–carbon footprint matching degree and coupling coordination degree indicators are constructed with solid theoretical support. The Carbon-MD and Carbon-CCD are the results of the interaction response between human activities and ecosystems. The harmonization process of the contradictory human–earth relationship is the core theme of geography research (Ouyang et al., 2022). Carbon balance is one of the best means to seek harmonious coexistence between humans and the environment in the context of global climate change (Zhou Y. et al., 2021). Carbon carrying capacity belongs to the regulating services of ecosystem services, and carbon footprint characterizes the degree of pressure of carbon emissions from human activities on natural systems. The carbon balance status of a region is an expression of its landscape pattern. Various methods such as the greenhouse gas inventory method, carbon sequestration inventory method, and carbon balance indicator method are used to integrate multisource data such as energy consumption data, land use data, ecological and environmental type data, and socioeconomic data, and the data have objectivity in the process of indicator construction. These provide a guarantee for the scientific base of the results of this article.
Since both carbon indicators are new, this study was compared with other related studies. Guo et al. (2017) used the ratio of carbon sinks to carbon emissions to construct a carbon neutrality factor and found that the unbalanced spatial distribution of carbon emissions and carbon sinks is the main reason for the spatial variation of the carbon neutrality factor. Chen et al. (2021) constructed a carbon balance pressure index using the ratio of carbon emissions to vegetation carbon sequestration to measure the ecological pressure caused by carbon emissions in 77 countries from 2000 to 2015 and found that carbon emissions have become the direct cause of the rising pressure on the global carbon balance. Wang C. et al. (2021) analyzed the spatial pattern of carbon sources, carbon sinks, and carbon balance in the Beijing–Tianjin–Hebei region from the perspective of land use carbon emissions through the difference between carbon sources and carbon sinks. Li et al. (2021) studied the terrestrial carbon sink/source changes in China caused by land use change, and carbon balance partitioning should be conducted for its six regions. Based on previous studies developed by this group, it is scientific to use carbon footprint and carbon carrying capacity to construct carbon budget balance indicators, considering spatial heterogeneity and regional uniqueness, and its comparability on spatial–temporal scales can be applied.
The Carbon-MD F reflects the carrying status of ecosystems to carbon emissions from human activities, and its index value is influenced by the endowment of ecosystems and human activities. Therefore, the differences in ecological resources and human activities determine the spatial and temporal heterogeneity of the Carbon-MD. The Carbon-CCD reflects the coupled coordination relationship between carbon carrying capacity and carbon footprint. The Carbon-CCD reflects the sustainability of the ecosystem’s carbon budget balance. Thus, the ecological resource endowment and the degree of carbon emissions from human activities determine the sustainability of the carbon balance. Therefore, the two carbon budget balance indicators of Carbon-MD and Carbon-CCD developed in this study have certain scientific and practicality.
5.2. Factors influencing the spatial–temporal characteristics of carbon indicators
The combination of internal and external factors has led to the heterogeneity of the spatial–temporal distribution of carbon budget balance in the study area. From the internal composition of the index, the carbon footprint has become the direct cause of the decrease of the Carbon-MD in the study area due to the relatively stable change of the carbon carrying capacity. The uneven spatial–temporal distribution of water-ecological resources in the lake area has led to the spatial mismatch of carbon footprint and carbon carrying capacity in the study area. The carbon footprint of the lake-ring edge area and the lake-ring periphery area gradually approaches its carbon carrying capacity, which is the main reason for the increase of the Carbon-CCD value of these two regional county units. Human activities caused a large shift in land use types, which further affected the carbon budget balance by changing the landscape pattern (Zhou et al., 2020; Ouyang et al., 2021). The research results show that the increase in construction land leads to the main reason for the decrease of Carbon-MD in the study area. Therefore, to achieve the carbon balance goal, urban agglomeration around Poyang Lake should focus on carbon reduction activities first, and adopt sink enhancement means second. In addition to land use types, we quantified the effects of five factors on carbon budget balance from two perspectives of natural factors and socioeconomic factors, focusing on comparing the absolute values of regression coefficients of natural and socioeconomic factors. It was found that the built-up area and population density were the main factors affecting the carbon budget balance of the study area. Compared with natural factors, socioeconomic factors are the main influencing factors of carbon budget balance. This also reflects from the side that the increasing human activities are the main cause of ecosystem disorders (Xing et al., 2021; Li et al., 2022; Zhou et al., 2022b).
5.3. Limitation and future research
This article analyzes the spatial–temporal characteristics of the carbon budget balance of the lake urban agglomeration through two carbon budget balance indicators, Carbon-MD and Carbon-CCD, and has achieved certain results. Since the urban carbon cycle process is extremely complex, it is a challenging task to comprehensively characterize the carbon sources, sinks, and flows in different cities. A framework of the urban carbon cycle was constructed under the guidance of the social–economic–natural complex ecosystem theory, and further measured the carbon sources and sinks of the urban agglomeration around Poyang Lake. However, the carbon source accounting process used in this study does not consider carbon emissions from human and plant, and animal respiration, and carbon emissions from microbial decomposition. Meanwhile, carbon sequestration by soils is a complex process, and our carbon sink accounting process does not include carbon sinks from soils. In terms of influencing factors, we explored the effects of land use type, NDVI, the proportion of built-up area, population density, and industrial structure on the carbon budget of the study area. Considering the special characteristics of the lake area, we analyzed the influence of the distance zoning of the city from the lake center on its carbon budget balance. However, the carbon budget of different regions is subject to different factors and there are interactions among these factors. How to reveal the interactions among multiple factors and their transmission mechanisms on carbon budget balance is one of the directions that need to be urgently researched in future.
6. Conclusion
This study proposes a carbon cycle framework for urban social–economic–natural complex ecosystems from three subsystem perspectives: industrial subsystem, energy subsystem, and ecological subsystem. The framework portrays the carbon cycle process of the city from both vertical and horizontal perspectives, which can provide a scientific reference for low-carbon urban management. Furthermore, this study constructs two carbon balance indicators, Carbon-MD and Carbon-CCD, based on the relationship between carbon carrying capacity and carbon footprint. Unlike previous studies, this study considers both the uniqueness of the lake area for carbon sink accounting and the relationship between people and land and adopts carbon carrying capacity and carbon footprint instead of carbon source and carbon sink. The spatial–temporal variability of the carbon budget balance in the urban agglomeration around Poyang Lake from 2000 to 2020 is significant. The distribution of Carbon-MD in the study area from 2000 to 2020 ranges from 0.008 to 47.6597 and shows a decreasing trend over time. The Carbon-MD in the study area shows the spatial distribution characteristics of increasing from the core area of the lake to the peripheral area of the lake with higher elevation. From 2000 to 2020, the distribution range of Carbon-CCD in the study area is 0.1730 ~ 0.8661, showing a gradual increase from moderate disorder to basic coordination. The distribution of Carbon-CCD is spatially heterogeneous in the study area, and it is shifting from scattered to grouped. Finally, this article analyzes the influencing factors of carbon budget balance in the study area in terms of land use, natural factors, and socioeconomic factors. The two carbon budget balance indicators constructed in this article not only have advantages in describing the spatial and temporal characteristics of regional carbon balance but also are effective tools for regional low-carbon management.
Data availability statement
The original contributions presented in the study are included in the article, further inquiries can be directed to the corresponding author.
Author contributions
SL and YL conceived the study. YL obtained funding for the study. WD and SL performed the statistical analysis. SL produced the figures and tables and wrote the first draft of the manuscript. GW modified and checked this manuscript. All authors contributed to the manuscript and approved the submitted version.
Funding
This study was sponsored by the National Natural Science Foundation of China (NSFC) (Response and simulation of industrial spatial pattern in the urban cluster around Poyang Lake based on the supply and demand of ecosystem services, No. 42271209) and Project of Jiangxi Provincial Humanities and Social Science, grant no. JJ21201.
Acknowledgments
The authors thank the editors and reviewers for their comments on this manuscript.
Conflict of interest
The authors declare that the research was conducted in the absence of any commercial or financial relationships that could be construed as a potential conflict of interest.
Publisher’s note
All claims expressed in this article are solely those of the authors and do not necessarily represent those of their affiliated organizations, or those of the publisher, the editors and the reviewers. Any product that may be evaluated in this article, or claim that may be made by its manufacturer, is not guaranteed or endorsed by the publisher.
Footnotes
References
Bassham, J. A. (1971). The control of photosynthetic carbon metabolism: photosynthesis of carbon compounds is regulated to allocate intermediates according to metabolic needs. Science 172, 526–534. doi: 10.1126/science.172.3983.526
Battin, T. J., Lauerwald, R., Bernhardt, E. S., Bertuzzo, E., Gener, L. G., Hall, R. O., et al. (2023). River ecosystem metabolism and carbon biogeochemistry in a changing world. Nature 613, 449–459. doi: 10.1038/s41586-022-05500-8
Berhongaray, G., Verlinden, M. S., Broeckx, L. S., Janssens, I. A., and Ceulemans, R. (2017). Soil carbon and belowground carbon balance of a short-rotation coppice: assessments from three different approaches. GCB Bioenergy 9, 299–313. doi: 10.1111/gcbb.12369
Chen, J., Li, Z., Song, M., and Dong, Y. (2021). Decomposing the global carbon balance pressure index: evidence from 77 countries. Environ. Sci. Pollut. Res. 28, 7016–7031. doi: 10.1007/s11356-020-11042-1
Chen, C., Wu, Q., and Xin, H. (2019). Carbon balance of marine energy based on carbon emission and low carbon economy: a case study of Shandong Province. J. Coast. Res. 98, 167–170. doi: 10.2112/SI98-041.1
Chuai, X., Yuan, Y., Zhang, X., Guo, X., Zhang, X., Xie, F., et al. (2019). Multiangle land use-linked carbon balance examination in Nanjing City, China. Land Use Policy 84, 305–315. doi: 10.1016/j.landusepol.2019.03.003
Dai, L., Liu, Y., and Luo, X. (2021). Integrating the MCR and DOI models to construct an ecological security network for the urban agglomeration around Poyang Lake, Chine. Sci. Total Environ. 754:141868. doi: 10.1016/j.scitotenv.2020.141868
De Wit, H. A., Austnes, K., Hylen, G., and Dalsgaard, L. (2015). A carbon balance of Norway: terrestrial and aquatic carbon fluxes. Biogeochemistry 123, 147–173. doi: 10.1007/s10533-014-0060-5
Dolman, A. J., and Janssen, T. A. J. (2018). The enigma of the Amazonian carbon balance. Environ. Res. Lett. 13:061002. doi: 10.1088/1748-9326/aac78e
Dusenge, M. E., Duarte, A. G., and Way, D. A. (2019). Plant carbon metabolism and climate change: elevated CO2 and temperature impacts on photosynthesis, photorespiration and respiration. New Phytol. 221, 32–49. doi: 10.1111/nph.15283
Feng, L., Hu, C., Chen, X., Cai, X., Tian, L., and Gan, W. (2012). Assessment of inundation changes of Poyang Lake using MODIS observations between 2000 and 2010. Remote Sens. Environ. 121, 80–92. doi: 10.1016/j.rse.2012.01.014
Feng, L., Raza, M. A., Li, Z., Chen, Y., Khalid, M. H. B., Du, J., et al. (2019). The influence of light intensity and leaf movement on photosynthesis characteristics and carbon balance of soybean. Front. Plant Sci. 9:1952. doi: 10.3389/fpls.2018.01952
Fernández-Martínez, M., Sardans, J., Musavi, T., Migliavacca, M., Iturrate-Garcia, M., Scholes, R. J., et al. (2020). The role of climate, foliar stoichiometry and plant diversity on ecosystem carbon balance. Glob. Chang. Biol. 26, 7067–7078. doi: 10.1111/gcb.15385
Gao, R., Chuai, X., Ge, J., Wen, J., Zhao, R., and Zuo, T. (2022). An integrated tele-coupling analysis for requisition–compensation balance and its influence on carbon storage in China. Land Use Policy 116:106057. doi: 10.1016/j.landusepol.2022.106057
Gatti, L. V., Gloor, M., Miller, J. B., Doughty, C. E., Malhi, Y., Domingues, L. G., et al. (2014). Drought sensitivity of Amazonian carbon balance revealed by atmospheric measurements. Nature 506, 76–80. doi: 10.1038/nature12957
Guo, R., Zhao, Y., Shi, Y., Li, F., Hu, J., and Yang, H. (2017). Low carbon development and local sustainability from a carbon balance perspective. Resour. Conserv. Recycl. 122, 270–279. doi: 10.1016/j.resconrec.2017.02.019
Houghton, R. A., House, J. I., Pongratz, J., Van Der Werf, G. R., Defries, R. S., Hansen, M. C., et al. (2012). Carbon emissions from land use and land-cover change. Biogeosciences 9, 5125–5142. doi: 10.5194/bg-9-5125-2012
Kondo, M., Ichii, K., Patra, P. K., Canadell, J. G., Poulter, B., Sitch, S., et al. (2018). Land use change and El Niño-southern oscillation drive decadal carbon balance shifts in Southeast Asia. Nat. Commun. 9:1154. doi: 10.1038/s41467-018-03374-x
Lai, L., Huang, X., Yang, H., Chuai, X., Zhang, M., Zhong, T., et al. (2016). Carbon emissions from land-use change and management in China between 1990 and 2010. Sci. Adv. 2:e1601063. doi: 10.1126/sciadv.1601063
Lenzen, M., Sun, Y. Y., Faturay, F., Ting, Y. P., Geschke, A., and Malik, A. (2018). The carbon footprint of global tourism. Nat. Clim. Chang. 8, 522–528. doi: 10.1038/s41558-018-0141-x
Li, J., Guo, X., Chuai, X., Xie, F., Yang, F., Gao, R., et al. (2021). Reexamine China’s terrestrial ecosystem carbon balance under land use-type and climate change. Land Use Policy 102:105275. doi: 10.1016/j.landusepol.2020.105275
Li, X., Li, Y., Chen, A., Gao, M., Slette, I. J., and Piao, S. (2019). The impact of the 2009/2010 drought on vegetation growth and terrestrial carbon balance in Southwest China. Agric. For. Meteorol. 269-270, 239–248. doi: 10.1016/j.agrformet.2019.01.036
Li, F., Yin, X., and Shao, M. (2022). Natural and anthropogenic factors on China's ecosystem services: comparison and spillover effect perspective. J. Environ. Manag. 324:116064. doi: 10.1016/j.jenvman.2022.116064
Liddle, B. (2014). Impact of population, age structure, and urbanization on carbon emissions/energy consumption: evidence from macro-level, cross-country analyses. Popul. Environ. 35, 286–304. doi: 10.1007/s11111-013-0198-4
Lin, T., Ge, R., Zhao, Q., Zhang, G., Li, X., Ye, H., et al. (2016). Dynamic changes of a city's carbon balance and its influencing factors: a case study in Xiamen, China. Carbon Manag. 7, 149–160. doi: 10.1080/17583004.2016.1180587
Maillard, É., McConkey, B. G., and Angers, D. A. (2018). Each rotation phase can affect soil carbon balance differently over decades. Can. J. Soil Sci. 98, 584–588. doi: 10.1139/cjss-2018-0013
Mathias, J. M., and Trugman, A. T. (2022). Climate change impacts plant carbon balance, increasing mean future carbon use efficiency but decreasing total forest extent at dry range edges. Ecol. Lett. 25, 498–508. doi: 10.1111/ele.13945
Mekonnen, Z. A., Riley, W. J., Berner, L. T., Bouskill, N. J., Torn, M. S., Iwahana, G., et al. (2021). Arctic tundra shrubification: a review of mechanisms and impacts on ecosystem carbon balance. Environ. Res. Lett. 16:053001. doi: 10.1088/1748-9326/abf28b
Mikulčić, H., Baleta, J., Wang, X., Duić, N., and Dewil, R. (2022). Sustainable development in period of climate crisis. J. Environ. Manag. 303:114271. doi: 10.1016/j.jenvman.2021.114271
Nag, S. K., Nandy, S. K., Roy, K., Sarkar, U. K., and Das, B. K. (2019). Carbon balance of a sewage-fed aquaculture wetland. Wetl. Ecol. Manag. 27, 311–322. doi: 10.1007/s11273-019-09661-8
Nathaniel, S. P., and Adeleye, N. (2021). Environmental preservation amidst carbon emissions, energy consumption, and urbanization in selected African countries: implication for sustainability. J. Clean. Prod. 285:125409. doi: 10.1016/j.jclepro.2020.125409
Nepal, P., Ince, P. J., Skog, K. E., and Chang, S. J. (2013). Forest carbon benefits, costs and leakage effects of carbon reserve scenarios in the United States. J. For. Econ. 19, 286–306. doi: 10.1016/j.jfe.2013.06.001
Ouyang, X., Tang, L., Wei, X., and Li, Y. (2021). Spatial interaction between urbanization and ecosystem services in Chinese urban agglomerations. Land Use Policy 109:105587. doi: 10.1016/j.landusepol.2021.105587
Ouyang, X., Xu, J., Li, J., Wei, X., and Li, Y. (2022). Land space optimization of urban-agriculture-ecological functions in the Changsha-Zhuzhou-Xiangtan urban agglomeration, China. Land Use Policy 117:106112. doi: 10.1016/j.landusepol.2022.106112
Pingoud, K., Ekholm, T., Soimakallio, S., and Helin, T. (2016). Carbon balance indicator for forest bioenergy scenarios. GCB Bioenergy 8, 171–182. doi: 10.1111/gcbb.12253
Pukkala, T. (2017). Does management improve the carbon balance of forestry? Forestry 90, 125–135. doi: 10.1093/forestry/cpw043
Schimel, D., Stephens, B. B., and Fisher, J. B. (2015). Effect of increasing CO2 on the terrestrial carbon cycle. Proc. Natl. Acad. Sci. 112, 436–441. doi: 10.1073/pnas.1407302112
Tcherkez, G., Gauthier, P., Buckley, T. N., Busch, F. A., Barbour, M. M., Bruhn, D., et al. (2017). Leaf day respiration: low CO 2 flux but high significance for metabolism and carbon balance. New Phytol. 216, 986–1001. doi: 10.1111/nph.14816
Wang, R., Li, F., Hu, D., and Li, B. L. (2011a). Understanding eco-complexity: social-economic-natural complex ecosystem approach. Ecol. Complex. 8, 15–29. doi: 10.1016/j.ecocom.2010.11.001
Wang, W. Z., Liu, L. C., Liao, H., and Wei, Y. M. (2021). Impacts of urbanization on carbon emissions: an empirical analysis from OECD countries. Energy Policy 151:112171. doi: 10.1016/j.enpol.2021.112171
Wang, H., Lu, S., Lu, B., and Nie, X. (2021). Overt and covert: the relationship between the transfer of land development rights and carbon emissions. Land Use Policy 108:105665. doi: 10.1016/j.landusepol.2021.105665
Wang, C., Zhan, J., Zhang, F., Liu, W., and Twumasi-Ankrah, M. J. (2021). Analysis of urban carbon balance based on land use dynamics in the Beijing-Tianjin-Hebei region, China. J. Clean. Prod. 281:125138. doi: 10.1016/j.jclepro.2020.125138
Wang, R., Zhou, T., Hu, D., Li, F., and Liu, J. (2011b). Cultivating eco-sustainability: social–economic–natural complex ecosystem case studies in China. Ecol. Complex. 8, 273–283. doi: 10.1016/j.ecocom.2011.03.003
Wei, G., Bi, M., Liu, X., Zhang, Z., and He, B. J. (2022). Investigating the impact of multi-dimensional urbanization and FDI on carbon emissions in the belt and road initiative region: direct and spillover effects. J. Clean. Prod. 384:135608. doi: 10.1016/j.jclepro.2022.135608
Wei, G., Bi, M., Liu, X., Zhang, Z., and He, B. J. (2023). Investigating the impact of multi-dimensional urbanization and FDI on carbon emissions in the belt and road initiative region: direct and spillover effects. J. Clean. Prod. 384:135608. doi: 10.1016/j.jclepro.2022.135608
Wei, G., Zhang, Z., Ouyang, X., Shen, Y., Jiang, S., Liu, B., et al. (2021). Delineating the spatial-temporal variation of air pollution with urbanization in the belt and road initiative area. Environ. Impact Assess. Rev. 91:106646. doi: 10.1016/j.eiar.2021.106646
Williams, D. R., Alvarado, F., Green, R. E., Manica, A., Phalan, B., and Balmford, A. (2017). Land-use strategies to balance livestock production, biodiversity conservation and carbon storage in Yucatán, Mexico. Global Change Biol. 23, 5260–5272. doi: 10.1111/gcb.13791
Xing, L., Zhu, Y., and Wang, J. (2021). Spatial spillover effects of urbanization on ecosystem services value in Chinese cities. Ecol. Indic. 121:107028. doi: 10.1016/j.ecolind.2020.107028
Xu, Y., Dong, Z., and Wu, Y. (2023). The spatiotemporal effects of environmental regulation on green innovation: evidence from Chinese cities. Sci. Total Environ. 876:162790. doi: 10.1016/j.scitotenv.2023.162790
Yang, B., Liu, L., and Yin, Y. (2021). Will China’s low-carbon policy balance emission reduction and economic development? Evidence from two provinces. Int. J. Clim. Change Strat. Manag. 13, 78–94. doi: 10.1108/IJCCSM-08-2020-0093
Yao, X., Kou, D., Shao, S., Li, X., Wang, W., and Zhang, C. (2018). Can urbanization process and carbon emission abatement be harmonious? New evidence from China. Environ. Impact Assess. Rev. 71, 70–83. doi: 10.1016/j.eiar.2018.04.005
Yao, L., Liu, J., Wang, R., Yin, K., and Han, B. (2015). A qualitative network model for understanding regional metabolism in the context of social–economic–natural complex ecosystem theory. Eco. Inform. 26, 29–34. doi: 10.1016/j.ecoinf.2014.05.014
Ye, X., Zhang, Q., Liu, J., Li, X., and Xu, C. Y. (2013). Distinguishing the relative impacts of climate change and human activities on variation of streamflow in the Poyang Lake catchment, China. J. Hydrol. 494, 83–95. doi: 10.1016/j.jhydrol.2013.04.036
Yuan, W., Liu, X., Wang, W., Di, M., and Wang, J. (2019). Microplastic abundance, distribution and composition in water, sediments, and wild fish from Poyang Lake, China. Ecotoxicol. Environ. Saf. 170, 180–187. doi: 10.1016/j.ecoenv.2018.11.126
Zhang, D., Zhao, Y., and Wu, J. (2023). Assessment of carbon balance attribution and carbon storage potential in China’s terrestrial ecosystem. Resour. Conserv. Recycl. 189:106748. doi: 10.1016/j.resconrec.2022.106748
Zhang, C. Y., Zhao, L., Zhang, H., Chen, M. N., Fang, R. Y., Yao, Y., et al. (2022). Spatial-temporal characteristics of carbon emissions from land use change in Yellow River Delta region, China. Ecol. Indicat. 136:108623. doi: 10.1016/j.ecolind.2022.108623
Zhenmin, L., and Espinosa, P. (2019). Tackling climate change to accelerate sustainable development. Nat. Clim. Chang. 9, 494–496. doi: 10.1038/s41558-019-0519-4
Zhou, Y., Chen, M., Tang, Z., and Mei, Z. (2021). Urbanization, land use change, and carbon emissions: quantitative assessments for city-level carbon emissions in Beijing-Tianjin-Hebei region. Sustain. Cities Soc. 66:102701. doi: 10.1016/j.scs.2020.102701
Zhou, L., Dang, X., Mu, H., Wang, B., and Wang, S. (2021). Cities are going uphill: slope gradient analysis of urban expansion and its driving factors in China. Sci. Total Environ. 775:145836. doi: 10.1016/j.scitotenv.2021.145836
Zhou, L., Hu, F., Wang, B., Wei, C., Sun, D., and Wang, S. (2022a). Relationship between urban landscape structure and land surface temperature: spatial hierarchy and interaction effects. Sustain. Cities Soc. 80:103795. doi: 10.1016/j.scs.2022.103795
Zhou, L., Yuan, B., Hu, F., Wei, C., Dang, X., and Sun, D. (2022b). Understanding the effects of 2D/3D urban morphology on land surface temperature based on local climate zones. Build. Environ. 208:108578. doi: 10.1016/j.buildenv.2021.108578
Keywords: carbon budget, matching degree, coupling coordination degree, spatial–temporal characteristics, driving factors
Citation: Li S, Liu Y, Wei G, Sevegnani F and Deng W (2023) Construction of carbon budget balance index and its application in the lake area. Front. Ecol. Evol. 11:1195833. doi: 10.3389/fevo.2023.1195833
Edited by:
Xiao Ouyang, Hunan University of Finance and Economics, ChinaReviewed by:
Ying She, Nanchang Hangkong University, ChinaSergio Noce, Foundation Euro-Mediterranean Center on Climate Change (CMCC), Italy
Cui Shixi, Liaoning Normal University, China
Copyright © 2023 Li, Liu, Wei, Sevegnani and Deng. This is an open-access article distributed under the terms of the Creative Commons Attribution License (CC BY). The use, distribution or reproduction in other forums is permitted, provided the original author(s) and the copyright owner(s) are credited and that the original publication in this journal is cited, in accordance with accepted academic practice. No use, distribution or reproduction is permitted which does not comply with these terms.
*Correspondence: Yaobin Liu, bGl1eWFvYmluQG5jdS5lZHUuY24=