
94% of researchers rate our articles as excellent or good
Learn more about the work of our research integrity team to safeguard the quality of each article we publish.
Find out more
ORIGINAL RESEARCH article
Front. Ecol. Evol., 20 June 2023
Sec. Population, Community, and Ecosystem Dynamics
Volume 11 - 2023 | https://doi.org/10.3389/fevo.2023.1194147
This article is part of the Research TopicForest Carbon Dynamics and Management PracticesView all articles
 Siqi Yang1,2,3
 Zhixiang Wu1,2,3*
 Chuan Yang2,3Bo Song1,2,3Junyi Liu1,2,3Bangqian Chen2,3
 Guoyu Lan2,3
 Rui Sun2,3Jie Zhang1,3
Introduction: On Hainan Island, a rubber plantation that occupies a large swath of land plays an important role in the regional carbon budget. However, the carbon exchange of the rubber plantation is poorly understood.
Methods: In this study, using the eddy covariance methods we measured carbon metrics in the rubber plantation for 13 years from 2010 to 2022.
Results: We clarified that the rubber plantation is a carbon sink and the annual net ecosystem exchange (NEE), ecosystem respiration, and gross primary production were −911.89 ± 135.37, 1,528.04 ± 253.50, and 2,439.93 ± 259.63 gC·m−2·a−1, respectively. Carbon fluxes differed between interannual years; specifically, rainy season fluxes were nearly double dry season fluxes. Radiation explained 46% of the variation for NEE in rainy season, and temperature explained 36% of the variation for NEE in the dry season. LAI explained the highest proportion of the monthly variation in NEE (R2 = 0.72, p < 0.001), indicating that when hydrothermal conditions are sufficient phenology may be the primary factor controlling carbon sequestration of rubber plantation. Due to climate change, there is an increasing probability of extreme climate events, such as typhoons, heat waves, and drought. Thus, we compared NEE before and after such events and results show extreme climate events reduce carbon uptake in the rubber plantation. We found that typhoons reduced NEE to varying degrees on different timescales. Heat waves generally decreased NEE during the day but recovered quickly and increased carbon uptake if there was sufficient precipitation. Drought reduced carbon uptake and continued to decrease even after precipitation.
Discussion: Estimating the carbon sink capacity of the rubber plantation and studying the response to regional environmental changes are important for both applied research (carbon sink research and market trading, sink enhancement, and emission reduction, etc.) and basic research (land use change, phenology change, etc.).
In light of the growing concerns around global climate change related to CO2 emissions, carbon exchange is receiving increased attention (IPCC, 2021). Forests are important natural carbon sinks, and in China, forest ecosystems captured about 80% of the carbon in terrestrial ecosystems (Fang et al., 2018; Cai et al., 2021; Tang et al., 2022). Forestation enhances terrestrial carbon storage, which can be considered an important climate change mitigation strategy, and occupies an increasingly important position in the ecosystem (Bonan, 2008; FAO, 2020).
Carbon sink and source relate to the processes of storing or removing CO2 from the atmosphere. The eddy covariance (EC) is widely used to investigate carbon exchange between the atmosphere and vegetation. EC can continuously monitor carbon exchange and meteorological factors in an ecosystem at a high temporal resolution (Baldocchi, 2003, 2014). This method provides a way to study the temporal dynamics of net ecosystem exchange (NEE), ecosystem respiration (Reco), gross primary productivity (GPP), and their responses to environmental change at different timescales. NEE is defined as the difference between the carbon fixed by photosynthesis in an ecosystem (GPP) and total respiration released by an ecosystem (Reco). Tropical forests, including rainforests, deciduous forests, wetlands, and mangroves, have a high CO2 uptake (Aguilos et al., 2018; Rodda et al., 2021; Sun et al., 2021; Dalmagro et al., 2022). Most of the studies that have been done on plantation carbon exchange have been conducted in subtropical and temperate regions, bamboo plantations (Song et al., 2017; Chen et al., 2018), hilly tea plantations (Pang et al., 2019), and Pinaceae plantations (Han et al., 2022).
The rubber tree (Hevea brasiliensis) is native to the Amazon River basin of Brazil. The demand for natural rubber drives the continued expansion of rubber plantations across tropical regions, including Southeast Asia and tropical Africa (Ahrends et al., 2015; Singh et al., 2021). The area of rubber plantations in Hainan has increased significantly over the past 30 years, from 3.4 × 10⁵ hectares in 1990 to 5.85 × 10⁵ hectares in 2020, with a net increase of 70.11%. Rubber plantations account for approximately one-quarter of the total vegetation type and are becoming the main vegetation type on Hainan Island (Lan et al., 2017; Li et al., 2023a). As a prevailing cash crop, there is a tradeoff between the economic benefits of rubber and ecosystem biodiversity. For past decades, many scholars believe that the conversion of natural forests to rubber plantations has a negative impact on the ecological environment. For example, rubber plantations can increase soil and water nutrient loss, soil degradation, and biodiversity reduction (Tan et al., 2011; Ahrends et al., 2015; Singh et al., 2021; Zhu et al., 2021). Some scholars suggest that disturbances via rubber plantations are a result of poor management practices of some producers (Xie et al., 2013; Lan et al., 2017).
There have been studies that used EC methods to look at carbon in rubber plantations on an ecosystem scale, but the studies were conducted for < 5 years (Song et al., 2014; Chayawat et al., 2019; Satakhun et al., 2019; Wang et al., 2022). However, results between studies are inconsistent in the ecosystem responses to climate variability and differences in biotic factors such as tree ages or phenology. Previous studies show GPP was governed by soil water content (Wang et al., 2022) but was also closely related to rubber phenology (Chayawat et al., 2019). Reco is regulated by temperature and the age of the rubber tree (Gao et al., 2019), and daytime NEE can be explained by the change in net solar radiation and ambient atmospheric CO2 concentration (Wu et al., 2014; Chayawat et al., 2019). Previous studies also show carbon fluxes were highly sensitive to various parameters when used in a model simulation, such as the average specific leaf area of the canopy and canopy light extinction coefficient (Liu et al., 2022; Yang et al., 2022). In general, the NEE impact factors of rubber plantation at different stages and scales are dynamic, and the dominant factors may change. More studies about carbon exchange in rubber plantations are needed to better understand the factors and mechanisms influencing carbon balance.
Due to climate change, there is an increased probability of extreme weather events, such as typhoons, heat waves, and drought. Typhoons usually form on the sea surface in the North and South Pacific, North Atlantic, and Indian Ocean. Therefore, most of the studies related to typhoons and carbon fluxes are conducted in oceans, lakes, bays, or coastal areas (Lin Y. et al., 2019; Lin et al., 2022; Wang et al., 2021). In Hainan, typhoons cause serious economic losses and casualties every year, and typhoon research related to rubber plantations usually focuses on the impact on latex yield, assessment loss, and improving defense capabilities (Huang et al., 2019; Liu et al., 2020). Studies using EC data to explore the impact of typhoons on rubber plantations are limited. In recent years, heat waves caused by global warming and extremely high-temperature events have become more frequent in some regions in China and studies indicated that the frequency of heat waves in Hainan Island has significantly increased (Xing et al., 2017; Li et al., 2023b). Reichstein et al. (2007) reported that the 2003 heat wave event in Europe reduced carbon fluxes overall and inhibited carbon fluxes in subtropical urban ecosystems in China (Reichstein et al., 2007; Xiang et al., 2020). Droughts suppress photosynthesis, reduce the decomposition of plant biomass, and reduce growth reduction in subsequent growing seasons; rubber plantation has a high vulnerability in short-term flash drought (Granier et al., 2007; Doughty et al., 2015; Cui et al., 2022). Ultimately, drought can increase rubber tree morbidity and reduces latex yield (He and Huang, 1987). Determining the rubber plantation carbon fluxes by EC data is needed to understand the impact of extreme events.
This study measured carbon fluxes from a 20-year-old rubber plantation in Danzhou, Hainan Island, to comprehensively assess the carbon flux characteristics and response to meteorological factors, phenology, and extreme events. We hypothesize that (1) rubber plantation is a carbon sink, (2) abiotic factors such as radiation, temperature, and some extreme weather will affect carbon fluxes, and (3) biotic factors (phenology) will also affect carbon fluxes. Therefore, using a long-time series (2010–2022) of micrometeorology EC data, this study aimed to (1) evaluate the seasonal and interannual carbon budget of a rubber plantation; (2) analyze how phenology affects the carbon exchange; (3) identify the dominant abiotic factors controlling the variation of carbon fluxes; and (4) investigate how extreme events affect carbon exchange. Here, this study assesses the influence of a rubber plantation in a regional carbon cycle and provides a basis for further assessment of the carbon sink capacity.
The study area is located in Danzhou (Figure 1A) in the northwestern quarter of Hainan Island (109°28′30″ E, 19°32′47″ N). The average altitude is 144 m with a tropical island monsoon climate with abundant water and heat conditions. The average annual sunshine duration is more than 2,000 h with an annual average temperature is 21.5–28.5°C. There are two seasons during the year. The rainy season is from May to October, and the rest of the year constitutes the dry season. The average annual precipitation is about 1,607 mm, and the annual average relative humidity is above 80%.
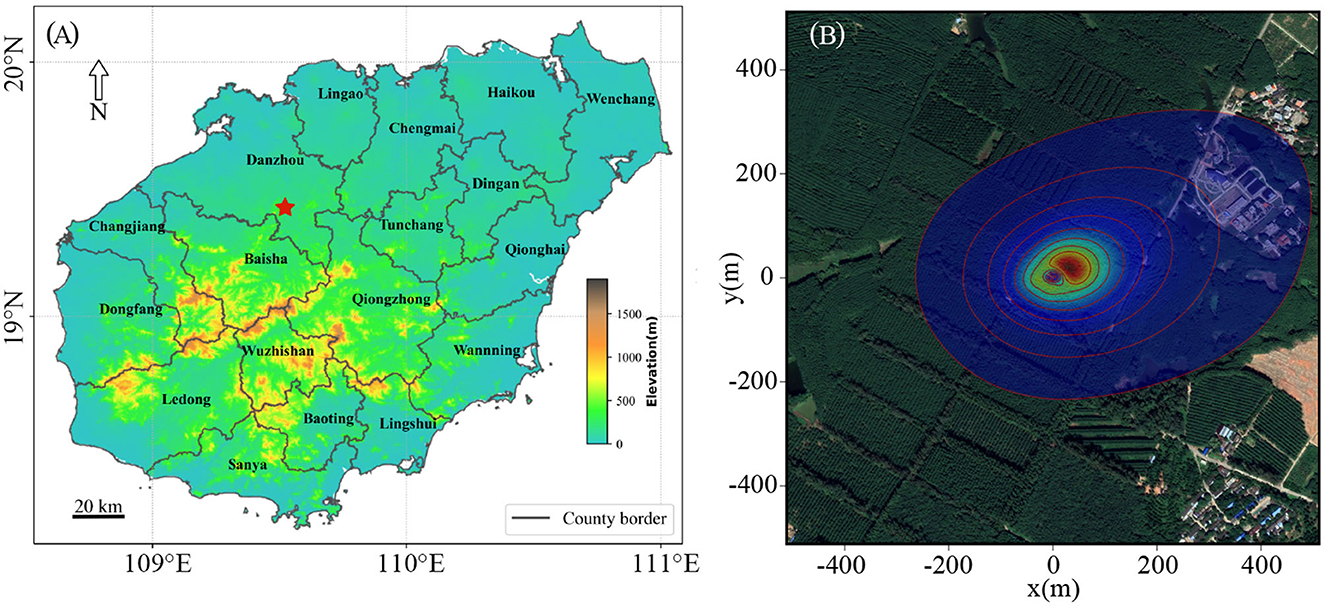
Figure 1. Overview of the study area. (A) Location of rubber sites (red star): x-axis is longitude and y-axis is latitude. (B) Corresponding flux footprint climatology at the observation site in 2019. Cumulative flux footprint contour lines are shown in 10% increment, and the outermost circle is 90%; x- and y-axis is the length range of footprint.
The micrometeorology observation tower is in the Hainan Danzhou Tropical Agro-ecosystem National Observation and Research Station (Danzhou City, Hainan Province) and continuously measures carbon fluxes. The tower is 50 m high and is equipped with a flux and gradient system (Wu et al., 2012). The slope of the area is < 25°, and the average annual wind speed is 2–2.5 m/s. The soil texture is sandy clay loam with a pH range of 4.59–5.93. Rubber plantations were widely distributed in this area. The rubber trees (clone Reyan 73397 and PR107) were planted in an area across 5 ha. During the study period, the canopy height ranged from 11.4 m (2010) to 15.2 m (2020), breast diameter ranged from 18.5 cm (2010) to 20.8 cm (2020), stand density was 476 (stems/ha), tree ages were 20–22 years, and leaf area index ranged from 2.5 to 6.9 m2·m−2 (2020). The plant community structure of the rubber plantation is divided into the rubber tree layer and the herbal layer and is intercropped with Strelitzia reginae. Other plants present included annual herbs such as Cyrtococcum patens, Alchornea rugosa, Ottochloa nodosa, Chrysopogon aciculatus, Cyathula prostrata, and Mimosa pudica. Rubber trees were planted with a row spacing of 3 m and a column spacing of 7 m. The rubber plantation was tapped for latex from April to December each year and from December to February of the following year. There was inter-forest management that included the following: green mature, fertilization, and weed removal. The mowed green manure was covered around the rubber tree with maintaining a distance of 20 cm from the tree. The average amount of fertilizer applied was 2 kg per tree, divided into three applications per year.
The EC system was installed at 25 m in height and consisted of a three-dimensional sonic anemometer (CSAT3, Campbell) to measure the three components of wind velocity vectors and sonic temperature. The system also included an open-path infrared gas analyzer (Li-7500, Li-COR) for acquiring CO2, water flux, latent heat flux, and sensible heat flux. There was also a meteorology system to collect environmental data. Air temperature, relative humidity (HMP45C, Vaisala), wind speed, and wind direction (Met 010C-1, Met One) were measured at 33 m. Canopy and average surface temperature (IRR-P, Apogee) were measured at 30 m, and atmospheric pressure (CS106, Vaisala) and radiation (Li-190SB, Li-COR) were measured at the same height of the EC system (25 m). The soil temperature (109L, Campbell) and soil water content (CS616-L, Campbell) analyzers were installed at the 5 cm depth. Precipitation was measured with a rain gauge (TE525MM, Texas) mounted at the top of the tower. All the micrometeorology variables, including fluxes and environmental factors, were measured at 10 Hz. The raw data were automatically recorded and stored by the data collector (CR3000, Campbell) and calculated by the system software LoggerNet. EC system outputs were 10 Hz real-time data, whereas the meteorology system outputs were 10-min, half-hour, and daily data.
Half-hourly fluxes were calculated from raw EC (10 Hz) data using the method improved by Wu et al. (2014), including coordinate rotation, Webb–Pearman–Leuning correction, outlier filtering, and nighttime CO2 flux correction. Raw EC data were processed by the software EdiRe written by the University of Edinburgh (www.geos.ed.ac.uk/abs/research/micromet/EdiRe/). The rubber forest ecosystem is a closed canopy, and part of the CO2 is stored in the atmosphere below the canopy and the observation height. Therefore, the NEE calculation formula is as follows: NEE = Fc + Fs, where Fc is the observed vertical eddy flux and Fs is the carbon stock flux. The specific algorithm of Fs can be found in Wu et al. (2014). Postprocessing of the data includes filling the gaps in half-hourly EC data and partitioning NEE into Reco and GPP. Gap filling refers to the improved marginal distribution sampling (MDS) method (Reichstein et al., 2005; Wutzler et al., 2018). This method combines the look-up table method and the average diurnal variation method and considers the covariation of fluxes with meteorological variables and the temporal autocorrelation of the fluxes. Net flux partition into Reco and GPP used the nighttime-based flux partitioning algorithm (Reichstein et al., 2005). The respiration is estimated from nighttime and is extrapolated to daytime. Postprocessing was conducted using the R package “ReddyProc (1.3.1)” from the Max Planck Institute for Biogeochemistry (Wutzler et al., 2018).
Data with a friction velocity (u*) < 0.12 m·s−1 were eliminated as the average value test method is used to determine the threshold as 0.12. As the obverse system is an open-path EC system, the data in the period with precipitation were eliminated to consider the influence of precipitation with 15 days as the limit. The triple standard difference method was used to eliminate outliers outside the threshold (x ± 3 σ; x and σ were the mean and standard deviation of 15 days of data, respectively). We removed data that exceed the normal range and data with equal values for a period of time. For environmental data, we removed the following outliers: air temperature and soil temperature <0°C; humidity <0 or >100%; wind speed >20 m·s−1; total radiation <0 or >2,000 W·m−2; net radiation <-150 or >1,500 W·m−2; photosynthetically active radiation <0 or 2,500 μmol·m−2·s−1.
A footprint model is usually used to explain the flux tower measurement and estimate the position and size of the source area and the relative contribution to measured fluxes. The footprint climatology in 2019 was calculated based on the half-hour required input data using the Flux Footprint Prediction R code developed by Kljun et al. (2015), code can be downloaded at https://footprint.kljun.net/. The results showed that almost 80% of the cumulative turbulent flux footprint was covered by the corresponding rubber plantation (Figure 1B).
For the assessment of turbulence data quality, we used the turbulence stability test and overall turbulence characteristic test to obtain the steady-state test index (SST) and overall turbulence characteristic index (ITC). Next, we combined SST and ITC to get the overall signal to control the final data level distribution (Wu et al., 2013), the overall signal ranged from 0 to 2, where 0 and 1 were available for flux analysis and 2 is considered invalid data. On the half-hour scale, the proportion of valid net ecosystem carbon exchange (NEE), latent heat flux (LE), and sensible heat flux (Hs) after quality control from 2010 to 2022 was 56.1%−83.5%, 53.2%−82.6%, and 59.0%−87.6%, respectively, except for 2017 and 2018 (mainly due to instruments failure). The valid fluxes reached more than 50% in the study years (Figure 2).
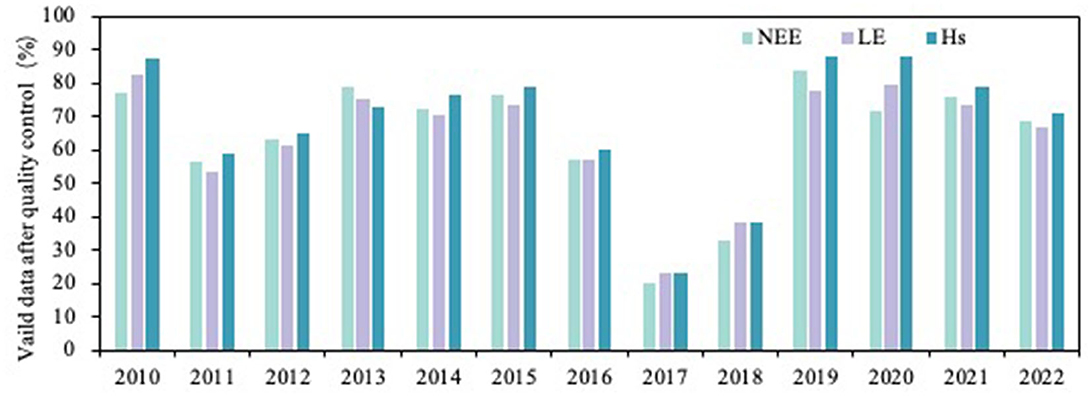
Figure 2. Proportion of valid fluxes after quality control in different years on the half-hour scale (%); x-axis is year.
The energy balance ratio (EBR) can be used to check the energy balance closure, ratio of the directly observed turbulent energy (Hs + LE), and effective energy (Rn-G-S) obtained from meteorological observations. Hs is sensible heat flux, LE is latent heat flux, Rn is net radiation, G is soil heat flux, and S is canopy heat storage. The Bowen ratio (β) was expressed as the ratio of H to LE and shows the characteristics of energy partitioning across ecosystems. The energy partitioning items also include LE/Rn and H/Rn to analyze the proportion of energy components. G and S were not considered because a previous study showed that they accounted for a small percentage (< 3%) (Zhang et al., 2016). The energy balance ratio of rubber plantation ecosystems at different timescales is above 72.0%, the annual closure is at an intermediate level, and the data quality meets the research requirements (Figure 3).
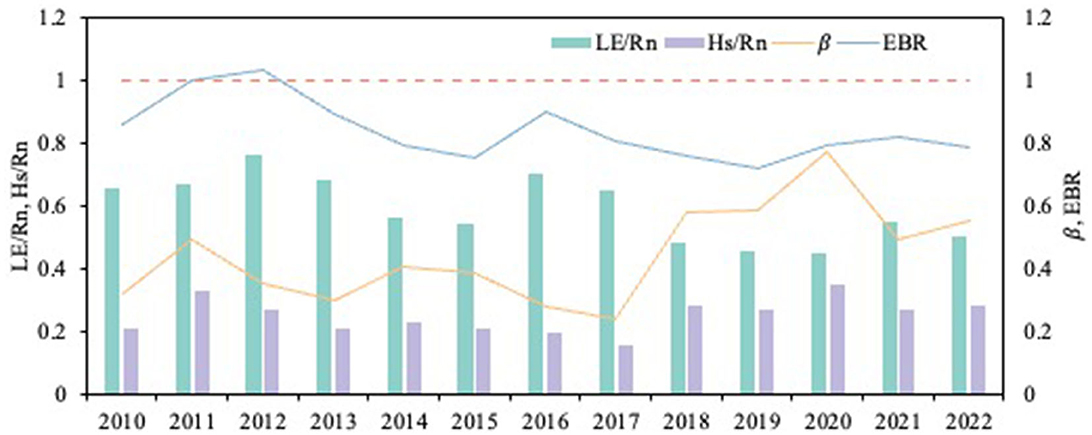
Figure 3. Variation in energy balance ratio and energy partitioning of rubber plantation in different years; x-axis is year.
The vapor pressure deficit (VPD) indicates the distance between saturated water vapor pressure and the actual water vapor pressure in the air at a certain temperature. VPD cannot be observed directly and is calculated by the measurements of air temperature (Ta) and relative humidity (RH) (Howell and Dusek, 1995):
We selected the surface temperature and humidity of the rubber plantation to calculate VPD. Thus, data were observed at 33 m height.
The leaf area index (LAI) was partly obtained from the published articles of Chen et al. (2015). Chen used LAI-2000 to measure the monthly LAI of 30 rubber plantations in Danzhou from March 2012 to March 2013. The measurement time was around the end of each month on a cloud-free morning (before 8:30 am) and afternoon (after 4:30 pm) or on a completely cloudy day. Raw data were processed by FV-2200 analysis software. We used the same measurement method as Chen et al. (2015) to measure LAI from January 2019 to December 2020. A time series of MODIS-based LAI products (MOD15A2H), acquired from Earth Observing System Data Gateway, temporal resolution was 8 days. In this study, we take the monthly average value.
We referred to the “Hainan Provincial Meteorological Disaster Plan” and defined the daily maximum temperature ≥35°C as a high-temperature day and a heat wave were defined when there are consecutive days of high temperature. Heat waves are classified into three grades: light, moderate, and severe regarding relevant studies (Xing et al., 2017). Light heat waves are high temperatures for 3–4 consecutive days. Moderate heat waves are high temperatures for 5–7 consecutive days. Severe heat waves are high temperatures for more than eight consecutive days.
Most studies use a frequency of 10% as a relative threshold for extreme environmental conditions (Gong et al., 2018). This study also uses this threshold to classify extreme water conditions in rubber plantations. Specifically, the volumetric water content (VWC) on the half-hour scale was sorted from small to large. The value with the occurrence frequency of VWC at < 10% was selected as the threshold value of extreme water conditions.
The variations of the daily air temperature (Tair), soil temperature (Tsoil), VWC, precipitation, relative humidity (RH), VPD, net radiation (Rn), photosynthetically active radiation (PAR), and LAI showed strong seasonality (Figure 4) and exhibited approximate unimodal tends and peaked in May, June, or July. The variation in VWC was closely related to precipitation patterns. As VPD is related to temperature, the trend was consistent with Ta and Ts (Figures 4A, C). Rn is relatively stable while PAR gradually decreased (Figures 4B, D). The RH trend is not as evident as the other water-related environmental factors, such as VPD, VWC, and precipitation. Overall, the RH value was high (Figures 4C, E). LAI increased from March and peaked in summer (Figure 4F).
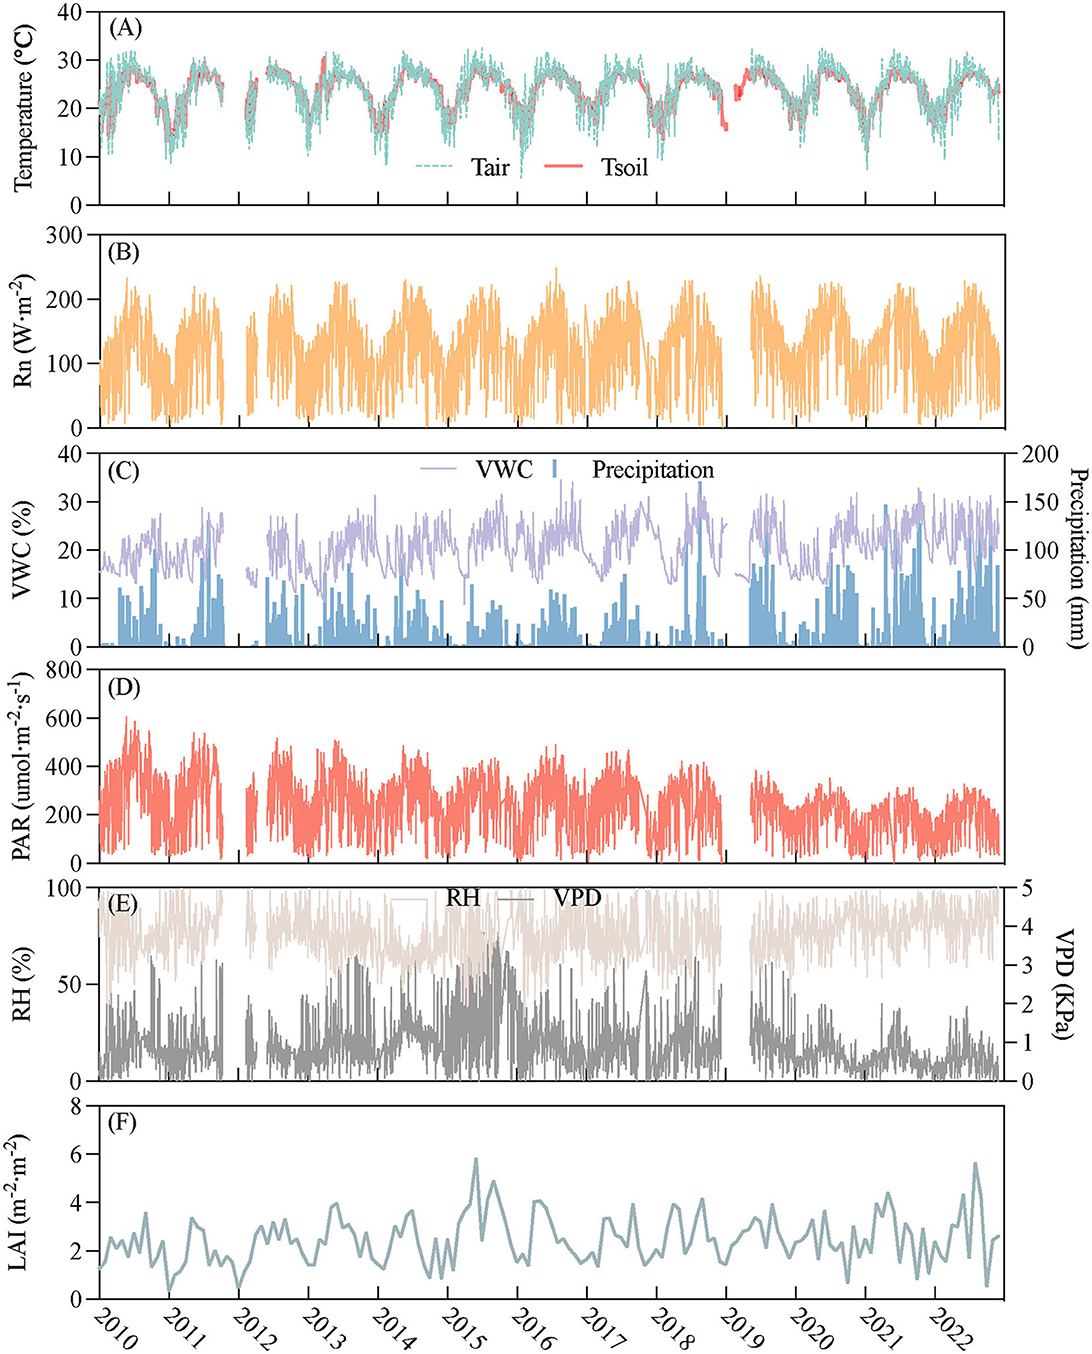
Figure 4. The temporal variation in environmental variables during 2010–2022: x-axis was year; y-axis was as follows: (A) air temperature (Tair, °C) and soil temperature at 5 cm depth (Tsoil, °C), (B) net radiation (W·m−2), (C) volumetric water content at 5 cm depth (VWC,%) and precipitation (mm), (D) photosynthetically active radiation (PAR, umol·m−2·s−1), (E) relative humidity (RH,%) and vapor pressure deficit (VPD, kPa), (F) leaf area index (LAI, m−2·m−2).
A time series of mean annual Tair, Tsoil, RH, VPD, VWC, precipitation, and LAI is shown in Figure 5. During 2010–2022, the average Tair, Tsoil, RH, VPD, VWC, precipitation, LAI, PAR, and Rn were 24.10°C, 24.01°C, 75.56%, 0.95 kPa, 20.45%, 1,817.79 mm, 2.47 m−2·m−2, 0.79, 236.70 μmol·m−2·s−1, and 119.32 W·m−2, respectively (Figure 5). The interannual patterns of Tair and Tsoil are consistent (Figure 5A), while the patterns of RH and VPD are not (Figure 5B). VWC and Rn provided a significant increasing trend over the 14-year study period (p < 0.01), increasing about 1.56%, 1.77%, and 0.85% per year, respectively (Figures 5C–E). PAR significantly decreased by 3.78% per year (Figure 5E).
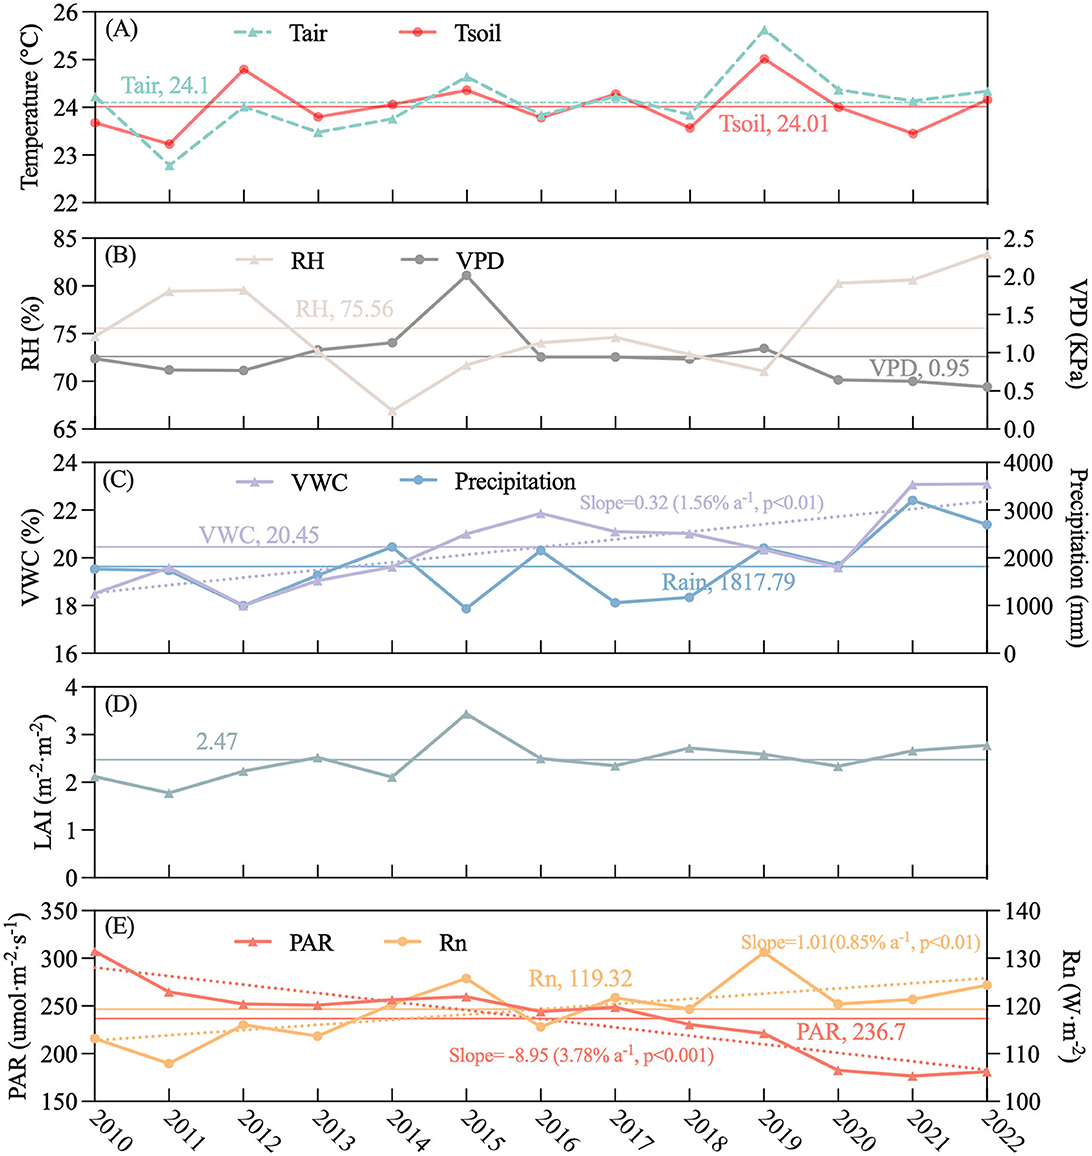
Figure 5. Interannual variation in environmental variables during 2010–2022: x-axis was year; y-axis was as follows: (A) air temperature (Ta, °C) and soil temperature at 5 cm depth (Ts, °C), (B) relative humidity (RH,%) and vapor pressure deficit (VPD, kPa), (C) volumetric water content at 5 cm depth (VWC,%) and precipitation (mm), (D) leaf area index (LAI, m−2·m−2), (E) photosynthetically active radiation (PAR, umol·m−2·s−1) and net radiation (W·m−2). The horizontal lines represent the long-term average, dotted line represents the trend, and values in parentheses give the rate of change (slope) divided by their corresponding long-term annual means.
Daily NEE, Reco, and GPP showed distinct seasonal patterns and were consistent over 13 years. Reco and GPP followed an obvious sinusoidal dynamic. NEE showed an upward first and then a downward trend. At the beginning of the year, NEE was positive and increased, reaching a peak in March or April and then decreasing to negative (Figure 6A). Reco and GPP are low at the beginning of each year, then increased and reached their peak value during July or August and decreased to the end of the year (Figures 6B, C). The dynamic of the Reco trend paralleled temperature. During the first 3 months of each year, GPP decreased and then rapidly increased after April, reaching a peak during July or August.
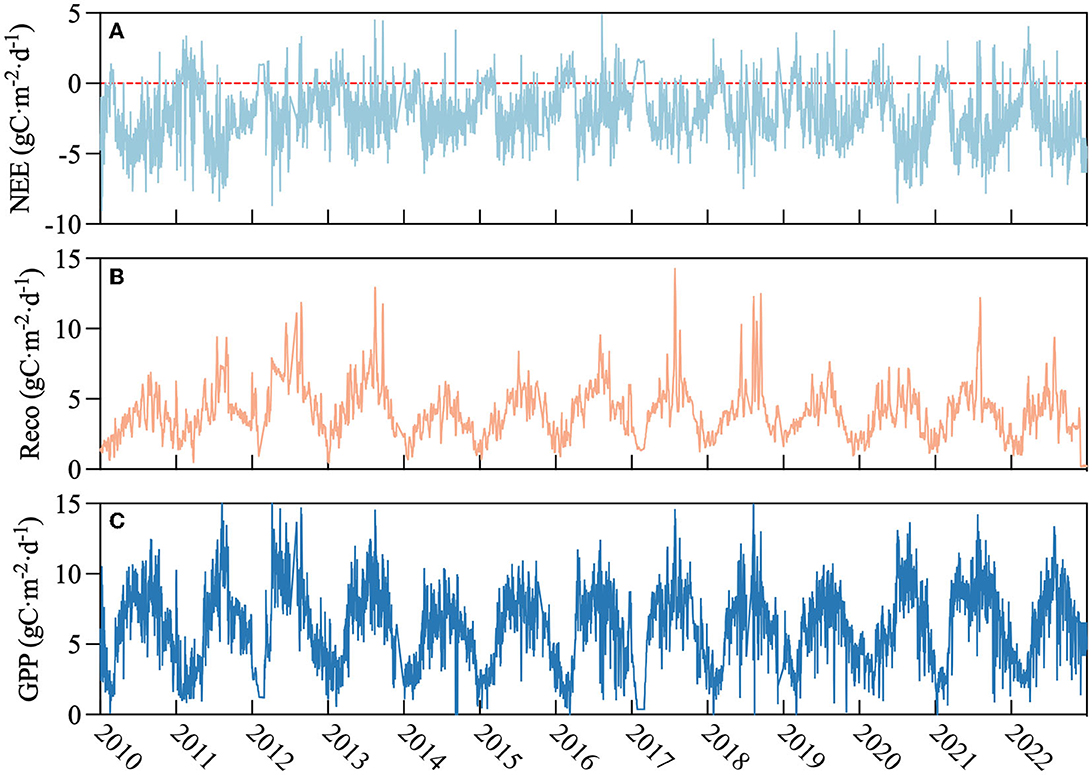
Figure 6. The seasonal variation during 2010–2022 for the rubber plantation; x-axis represents year and y-axis was as follows: (A) net ecosystem exchange (NEE, gC·m−2·d−1), (B) respiration (Reco, gC·m−2·d−1), and (C) gross primary productivity (GPP, gC·m−2·d−1); red dotted line indicates zero value.
Figure 7 demonstrates the time series of annual NEE, Reco, and GPP. From 2011 to 2015, NEE was higher than the average, indicating that less carbon was sequestered (Figure 7A). The GPP pattern was comparable to Reco (Figures 7B, C). Overall, the annual difference in carbon fluxes was not significant and the values remained high throughout the study period. The yearly mean cumulative NEE, Reco, and GPP were 911.89 gC·m−2, 1,528.04 gC·m−2, and 2,439.93 gC·m−2, respectively (Figure 7).
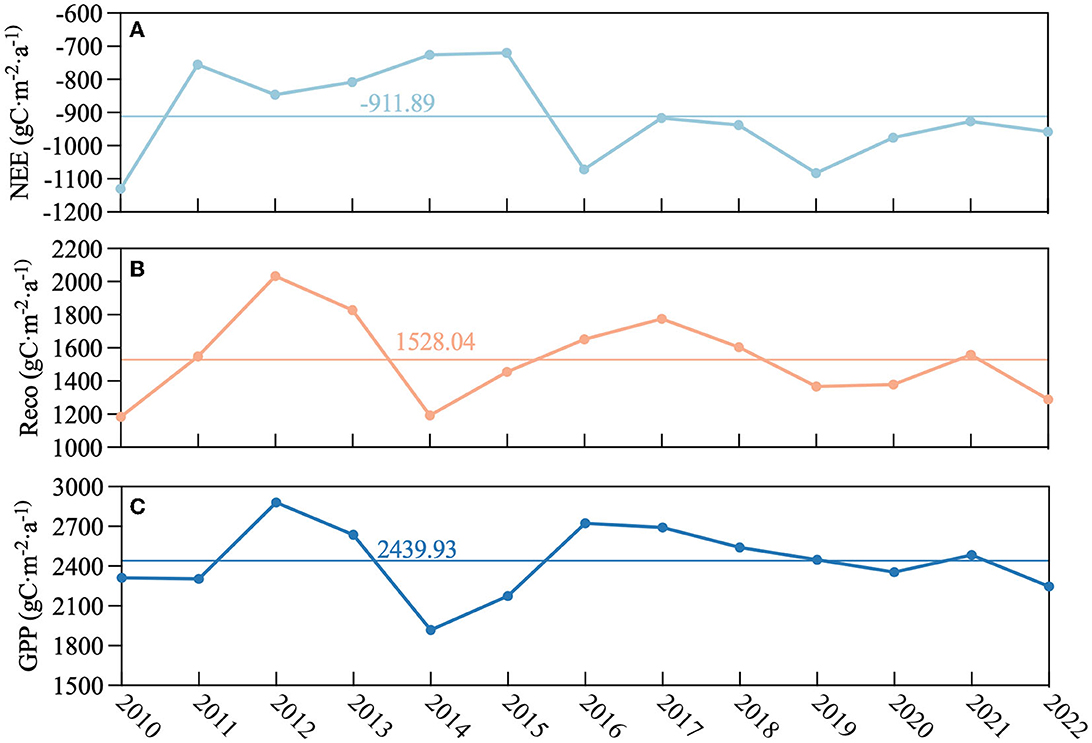
Figure 7. Interannual variation in carbon fluxes during 2010–2022: x-axis was year, and y-axis was as follows: (A) net ecosystem exchange (NEE, gC·m−2·d−1), (B) respiration (Reco, gC·m−2·d−1), and (C) gross primary productivity (GPP, gC·m−2·d−1). The horizontal lines represent the long-term average.
The co-relationship between NEE with environmental factors is presented in Supplementary Table S1. Only the significant environmental factors related to NEE were added to multiple stepwise regression models. The results of multiple stepwise regression are shown in Supplementary Table S2. Regardless of biological factors, these environmental factors could only explain ~24% of the variation in NEE generally, while 14% in the rainy season and 26% in the dry season, although these regressions were significant (p < 0.05). In addition, the degree of NEE variation explained in different yearly regressions was equal to or less than individual variables (i.e., Ta, Ts, and Vaporp). The environmental factors were divided into three categories: temperature (Ta, Ts), water factor (RH, Vaporp, VWC, precipitation, and VPD), and radiation (PAR). The stepwise regression equation showed that water factors were taken into account regardless of the rainy season or dry season. However, radiation entered the regression model more than the temperature in the rainy season and dry season. Temperature occurs more than radiation, which suggests that radiation affected NEE in the rainy season and temperature in the dry season. On a monthly scale, NEE showed a significant parabolic relationship with PAR (p < 0.001) in the rainy season, with a coefficient of determination of R2 = 0.46 (Figure 8A). Between NEE and Ta in the dry season, the coefficients of determination were lower with R2 = 0.23 (p < 0.001; Figure 8B).
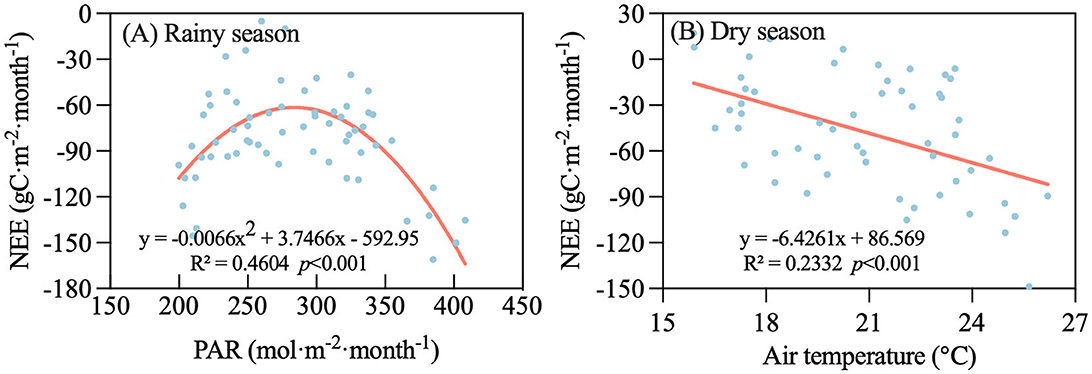
Figure 8. Relationship between net ecosystem exchange (NEE) and environmental factors in different periods on a monthly timescale during 2010–2022. (A) Photosynthetically active radiation (PAR) in rainy season and (B) air temperature (Ta) in dry season.
When biological factors were considered, NEE decreased with increasing LAI and showed a strong relationship with a coefficient of determination of R2 = 0.72 (p < 0.001). NEE decreased slowly when LAI < 4 m2·m−2 and decreased rapidly after 4 m2·m−2. This suggests that carbon exchange is faster as leaves grow (Figure 9A). Reco increased with LAI and showed a significant relationship but explains little of the variation (R2 = 0.15, p < 0.05) (Figure 9B). GPP is between Reco and NEE and exhibited a linear relationship with LAI, explaining 39% of the variation (p < 0.001) (Figure 9C). This indicates NEE was more sensitive to LAI than Reco and GPP. Reco offsets the correlation cause GPP is calculated by NEE and Reco.
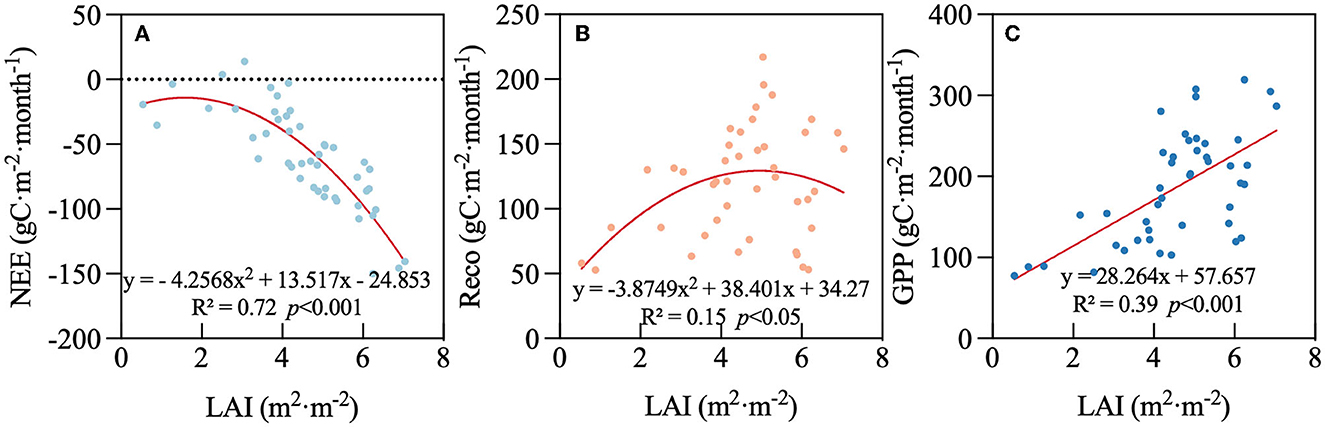
Figure 9. Relationships between leaf area index (LAI) and (A) net ecosystem exchange (NEE), (B) respiration (Reco), and (C) gross primary productivity (GPP) on a monthly timescale.
To study the effects of NEE after the typhoon, we selected three typhoons with the greatest impact on the study site during the study time. The typhoons were Rammasun (landfall on July 18, 2014), Kalmaegi (landfall on September 16, 2014), and Sarika (landfall on October 18, 2016). We compared 7 and 30 days of daily NEE before and after typhoon landfall. The results show daily NEE is reduced after the three different typhoons on different timescales. On a 7-day timescale, Rammasun reduced daily NEE by 4.6%, followed by Sarika at 8.7%, and Kalmaegi at 26% (Figure 10A). On a 30-day timescale, Rammasun reduced daily NEE the least with 0.3%, followed by Kalmaegi at 8.4%, and the greatest reduction was Sarika at 56% (Figure 10D). After typhoon Sarika landed, NEE did not decrease much in 7 days but decreased to a greater extent after 30 days. Respiration increased after typhoons Rammasun and Sarika landfall on two different timescales (Figures 10B, E). The GPP of Rammasun and Sarika increased in 7 days (Figure 10C), while the GPP of Sarika decreased after 30 days (Figure 10F).
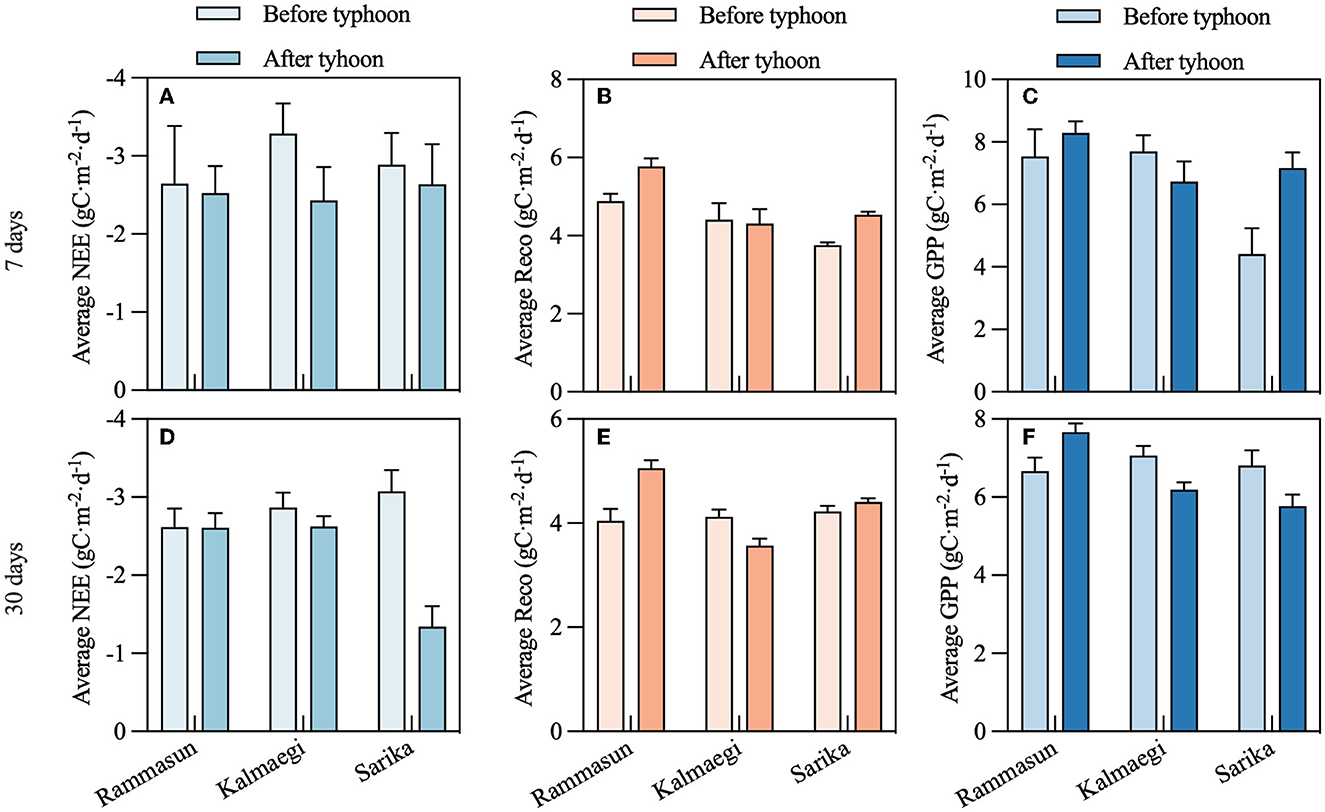
Figure 10. Average daily NEE, Reco, and GPP changes before and after the typhoon arrives. (A–C) 7 days before and after typhoon, (D–F) 30 days before and after typhoon, x-axis represents each typhoon.
Through analyzing the meteorological data of rubber plantations from 2010 to 2022, a total of 382 high-temperature days were screened out, with 51 heat waves. The heat waves occurred from February to August, and 60% of the heat waves occurred in May and June. The longest heat wave lasted for 25 days and occurred in May 2021. There was no heat wave in 2018, although the frequency of heat waves did not change significantly in the past 3 years the duration of heat waves increased significantly (Supplementary Table S3). The high-temperature days were highest in 2020 (55 days), and the fewest high-temperature days occurred in 2018 (9 days). The highest heat wave frequency was in 2015 with five light heat waves and four moderate heat waves. The lowest heat wave frequency was in 2015 (no heat wave). Severe heat waves in 2019–2021 accounted for more than half of the entire study year, indicating an increase in the high-temperature heat waves (Supplementary Figure S1).
We analyzed the NEE variation during the period of heat waves (Figure 12) and found that the heat wave affects the NEE of the rubber plantation ecosystem. Although the intensity of the heat waves is different, heat waves reduced the NEE of the rubber plantation. The NEE diurnal cycle during the heat wave period shows that the influence of heat waves on the rubber plantation is mainly concentrated during the daytime (Figures 11A–C). The decline was not expressed on the first day of the heat waves. Precipitation ended the heat waves, and the NEE level quickly returned to similar conditions as before the heat wave (Figures 11D–F). An exception was found during our study, where NEE instead increased after the end of the heat wave (Supplementary Figure S2).
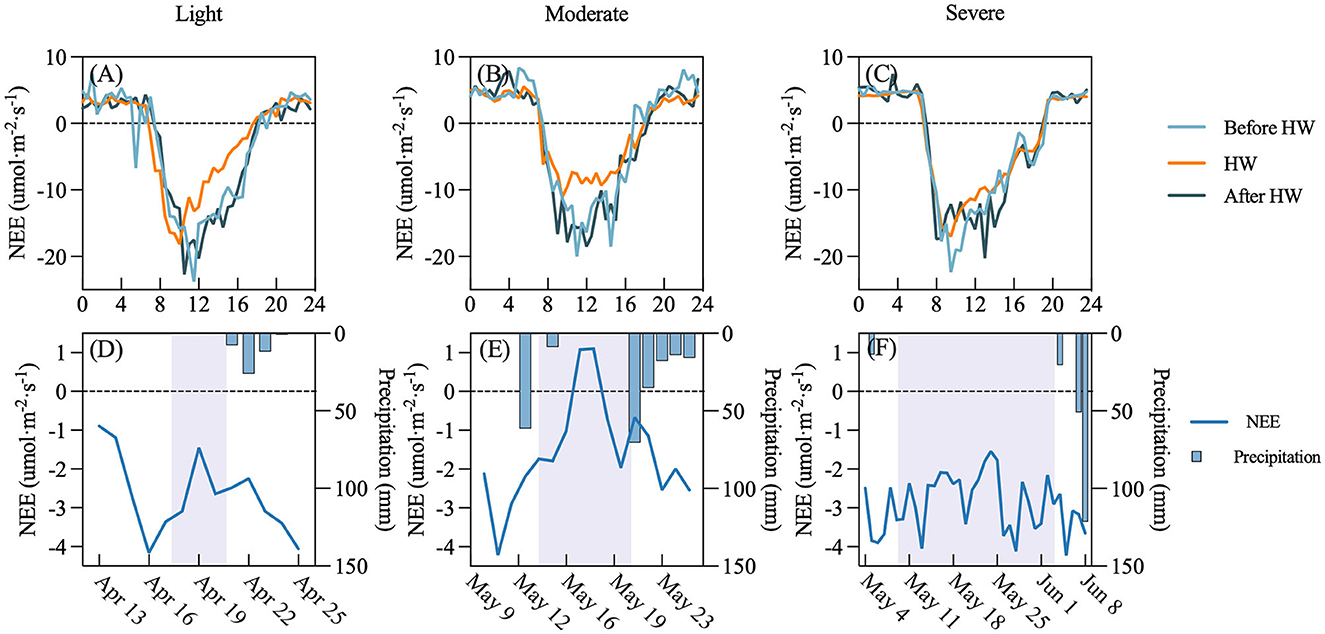
Figure 11. Average diurnal pattern of net ecosystem exchange (NEE) and daily NEE before heat waves (before HW), during heat waves (HW), and after heat waves (after HW) in different intensities. (A, D) Light heat wave, (B, E) Moderate heat wave, and (C, F) Severe heat wave. The gray-shaded area indicates the heat waves period; x-axis is the date.
Because the dry and rainy seasons were evident in Hainan Island, our classification results show that the period of low VWC is more in the dry season and rarely occurs in the rainy season. Therefore, the drought in the dry season was not affected by high temperatures. However, the drought in the rainy season was accompanied by high temperatures as described above. We selected the periods before and after the occurrence of drought without high temperatures in the dry and rainy seasons. We found that in different seasons, NEE decreased during the drought period and continued to affect NEE after the drought period even with precipitation (Figures 12A, B). The NEE of the rubber plantation decreased by 40% after the drought (from −2.06 to −1.34 gC m−2 d−1; Figure 12C).
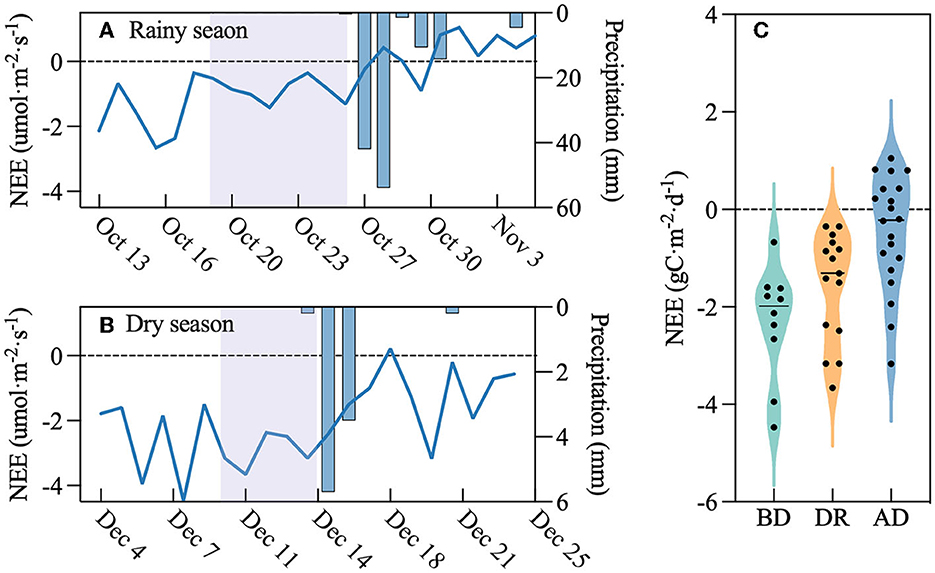
Figure 12. Daily trend of NEE before, during, and after drought: (A) rainy season, (B) dry season, and (C) total change. The mauve-shaded area indicates the drought period; x-axis in (A) and (B) is year; and (C) BD, before drought, DR, during drought, and AD, after drought.
Rubber plantation was always a carbon sink throughout the year except for the deciduous period from January to March (Supplementary Figure S3) (Yang et al., 2022), which was different from other systems. Due to the evergreen rubber tree being able to uptake carbon in winter, the rubber plantation is a carbon sink even in winter. NEE and GPP did not exhibit a perfect parabolic trend thought the year, and Reco exhibited the same parabolic trend and the same environmental factors (Supplementary Figure S3). Different seasonal variation of carbon fluxes and environmental factors shows there is hysteresis. Previous studies confirmed that interactions between NEE and the surrounding environment are hysteretic at different temporal scales, both diurnal and annual hysteresis. The magnitude of hysteresis was larger in the warmer sites (Niu et al., 2011). Similarly, there are diurnal hysteresis patterns in GPP. GPP is higher before the highest potential incoming shortwave with less water stress (Lin C. et al., 2019). The hysteresis in seasonal variation should be considered when modeling the dynamics of carbon cycling in rubber plantations.
Correlation and multiple stepwise regression methods were used to assess how environmental factors affect NEE. The results showed that NEE is jointly affected by multiple environmental factors. Thus, it is difficult to determine the specific impact of a single factor on NEE. Further, it could be better explained by the joint effect of two or three factors. A similar study on rubber plantations also showed this result (Chayawat et al., 2019). The regression analysis shows that the NEE variation could be better explained by the joint effects of water and radiation in the rainy season and the joint effects of water and temperature in the dry season. The correlations corroborated this (Figure 8). Due to the ample supply of water, the soil water content of rubber plantations remained largely stable and there is no evident pattern of water use efficiency in rubber plantations (Lin et al., 2018). The rainy season is from May to October and has a favorable thermal environment. Temperature is not the limiting factor while radiation is, because precipitation needs dense cloud cover and leads to corresponding low radiation. More clouds decrease the available light duration and result in a decrease in photosynthesis. As in the equatorial tropics, radiation was a growth-limiting factor in the rubber plantation rainy season (Nemani et al., 2003; Aguilos et al., 2018). The dry season was from November to the next year in April. Although precipitation was not as abundant as in the rainy season, it was not enough to be a limiting condition and the water use efficiency was even higher than in the rainy season. Seasonally, the dry season is in winter and spring with lower temperatures. Temperature is related to enzyme kinetics. This result was inconsistent with Aguilos et al. (2018) where the hypothesized water limit was the main driver of NEE during the dry season. The difference is the dry season from August to November, and this period is the rainy season and the transition periods from rainy to dry season in our study. A previous study showed that the environmental factors of NEE were different in the rubber growth stage (Chayawat et al., 2019). Our research is only divided into dry season and rainy season to study the influence of environmental factors. Foliation and defoliation of rubber trees could be considered in future.
Plant biotic traits, such as LAI, can also directly affect carbon fluxes, and investigating the extent of LAI changes can deepen our understanding of rubber plantation carbon cycling. LAI is an important indicator of plant growth and reflects changes in plant phenology. Our study confirmed that NEE is related to phenology (Figure 9A). Interestingly, the phenological trend of rubber plantation is not like the usual evergreen broad-leaved forest, which shows a parabolic trend throughout the year. The trend first declines and then rises from December to February of the following year. When the rubber plantation reaches the peak of the deciduous period, which is the same as the trend of NEE, there is a downward trend in January and February every year (Figures 4F, 6A). The same correlation analysis was also performed on Reco and GPP, but the correlation is weaker. This may be due to soil respiration being part of the respiration of the rubber plantation ecosystem, which can result in significant changes in atmospheric CO2 levels (Zhao et al., 2018; Gao et al., 2019). Our study found that LAI effects on carbon fluxes are stronger than environmental factors, but LAI is also a result of environmental factors. Furthermore, studies showed wind speed or nitrogen application can also influence LAI (Moinet et al., 2017; Zhang et al., 2022), and subsequent studies may also appropriately consider these factors. Nonetheless, our results solidify the fact that LAI positively affects NEE.
Annual NEE reflects the carbon source/sink of an ecosystem, which is critical for assessing the carbon balance of regional ecosystems. Our overall average annual NEE was −911.89 gC·m−2·a−1 with a strong interannual variation (SE = 135.36 gC·m−2·a−1), which suggests that the rubber plantation ecosystem is indeed a long-term carbon sink. Compared with other forest vegetation types in the tropical region, the magnitude of the rubber plantation NEE is higher than the wetland (16°22′ S, −337 gC·m−2·a−1) (Dalmagro et al., 2022), deciduous forest (21°51′ N, −524 ± 40 gC·m−2·a−1) (Rodda et al., 2021), rainforest (5°16′ N, −334.7 gC·m−2·a−1) (Aguilos et al., 2018), and mangrove (21°27′ N, −386.68 gC·m−2·a−1) (Sun et al., 2021). Related studies on other plantations (bamboo and Pinus) have shown high NEE similar to rubber plantations (Song et al., 2017; Chen et al., 2018; Han et al., 2022). At times, NEE is higher than the rubber plantation but not much (602.7 gC·m−2·a−1, 835.58 gC·m−2·a−1 for bamboo plantation and 853.28 gC·m−2·a−1, 903.91 gC·m−2·a−1 for Pinus plantation). This is likely due to the biennial routine thinning of trees aged 5 years or older in bamboo and no human disturbance and management on the Pinus plantation. We also compared our study with other rubber plantations. In this study, NEE was lower than a Thailand rubber plantation (Chayawat et al., 2019; Satakhun et al., 2019), which was reported as 715.21 and 1,000.91 gC·m−2·a−1 and was higher than Xishuangbanna rubber plantation (−543.35 gC·m−2·a−1) (Yu et al., 2021). Differences may be caused by different tree ages and abiotic drivers as they are not influencing NEE in the same way. These results suggest that the rubber plantation has the carbon uptake capacity as other tropical sites or plantations and emphasizes the important positive roles of rubber plantations in the regional carbon cycle.
Hainan Island has a tropical monsoon climate, with long summer and no winter, short spring and autumn, abundant precipitation, and a distinct dry and rainy season (Wu et al., 2022). High temperature, humidity, and radiation conditions indicate the area is suitable for a rubber plantation. Interannual variation in most environmental factors was not significant except for VWC and Rn, which had a significant increasing trend (Figure 5). PAR exhibited a significant decreasing trend over the same period. The decrease in PAR is unexpected as the net radiation was not reduced. However, we can rule out instrumentation problems and we replaced the instruments with new ones in 2016. Also, maintenance was performed every year during the dry season. However, it is doubtful whether this is a real decrease. A recent study showed an overall decreasing trend of PAR values in the Guangxi region and over mainland China, which may be due to the growing aerosol radiative forcing effect (Qin et al., 2019; Tan et al., 2022).
To explore the influence of typhoons on rubber plantation carbon fluxes, we selected the typhoons Rammasun, Kalmaegi, and Sarika as the time point and compared the daily flux changes of 7 and 30 days before and after the typhoon's landfall. Due to the typhoon destroying the tree canopy, the percentage of broken and fallen trees was high. For example, a survey showed that 100% of tapping rubber trees were hit in the Leizhou Peninsula after Rammasun made landfall (He et al., 2015). The photosynthesis and NEE were reduced. Research on mangrove forests also reported a decrease in NEE because of the reduction in LAI after typhoon disturbance (Chen et al., 2014). As for Reco, typhoons always coincide with heavy rainfall (Lu et al., 2015) and there was a local heating effect following typhoon disturbance, both can lead to high respiration (Jordan, 2012). Previous studies on rubber plantations verified that high temperatures and high humidity can promote soil respiration in rubber forests (Zhao et al., 2018). In this study, typhoon Rammasun (category 17, wind speed 70 m/s) landfalls in July 2014, there are additional typhoon Kalmaegi (category 13, wind speed 40 m/s) landfalls in September 2014 and typhoon Sarika (category 14, wind speed 45 m/s) landfalls in October 2016. Considering the landfall time, 30 days after Sarika's landfall, phenology of rubber trees enters the deciduous stage. Thus, it is unlikely that the typhoon caused a significant decrease in NEE (Figure 10D). Even though Danzhou is not a high-risk area for typhoons, the occurrence of typhoons showed decreasing frequency and increasing intensity. Methods for mitigating destruction from typhoons in rubber plantations are still needed.
Heat waves, causing higher temperatures, increase plant stress and can reduce the amount of carbon dioxide fixed by plants by affecting the Rubisco activities in the Calvin cycle (Berry and Bjorkman, 1980). This study also provides evidence that heat waves and droughts have an inhibitory effect on carbon fluxes. The heat waves occurred mainly from February to August. After experiencing different intensities of heat waves, the NEE of rubber plantation showed a downward trend (Figure 11). Interestingly, severe heat waves cause less NEE reduction than moderate. This may be due to the high temperature resistance of plants during long heat waves and that the sudden high temperature and sudden drop make rubber less adaptable and more sensitive. Although there were carbon sequestration losses at specific time points, the rubber plantation still showed a net carbon absorption. After the heat wave, the NEE of the rubber plantation will quickly return to the same state as before the heat wave (Figures 11D–F). We also found that sufficient water conditions after a heat wave allows the rubber plantation to recover quickly with NEE possibly even higher than before the heat wave (Supplementary Figure S2).
Many of the previous studies on heat waves concluded that drought was the main effect of heat waves on ecosystems (De Boeck et al., 2011; Ameye et al., 2012; Bauweraerts et al., 2013). We found that there was no heat wave from winter to early spring and that drought occurs more frequently. Heat waves are more frequent from late spring to summer and autumn, and when the precipitation is relatively sufficient, there is little drought. When investigating the impact of heat waves and drought on the rubber plantation ecosystem carbon fluxes, we selected relatively independent periods. In other words, there was no heat wave when a drought occurred and no drought when a heat wave occurred. The results show that NEE is affected even if no drought occurs after the heat wave. The maximum daily leaf temperature exceeded the photosynthetic temperature optimum. This resulted in a suboptimal carbon assimilation rate for most of the day, which affected photosynthesis (Mau et al., 2018) and drought-reduced photosynthetic activity at both leaf and plot scales (Doughty et al., 2015).
Taking advantage of the comprehensive measurements on the long-time series eddy flux data and phenology at a rubber plantation for 13 years, we characterized: daily, seasonal, and interannual variation in carbon fluxes and meteorological factors. We also discussed how meteorological factors, phenology, and extreme events influenced the carbon fluxes in rubber plantations. Our study solidified the conclusion that the rubber plantation was a net carbon sink and the annual NEE scales ranged from −720.19 to −1,129.79 gC·m−2·a−1. Carbon fluxes exhibited seasonal variation, and carbon uptake is higher in the rainy season compared with the dry season and the environmental drivers are different between the rainy and dry seasons. Radiation and water explained the variation of NEE in the rainy season, while temperature and water explained the variation in the dry season. LAI explained the higher proportion of the variation in NEE relative to GPP and Reco. This indicated that when the hydrothermal conditions are sufficient none of these environmental were limiting in rubber plantation and phenology may be the primary factor controlling carbon sequestration of rubber plantation. Rubber plantations are affected by extreme events, and on different timescales (7 and 30 days), typhoons reduce the NEE to varying degrees. After a heat wave, the NEE will recover quickly and possibly be higher than before if there is sufficient water. Drought will also lead to a decrease in carbon uptake and will continue even if rubber plantation recovers from drought due to precipitation. Estimating the carbon sink capacity of rubber plantations and studying the response to regional environmental changes are important for both applied research (carbon sink research and market trading, sink enhancement and emission reduction, etc.) and basic research (land use change, phenology change, etc.).
The datasets presented in this study can be found in online repositories. The names of the repository/repositories and accession number(s) can be found at: https://doi.org/10.57760/sciencedb.j00001.00480.
SY: analysis and wrote the original draft of the manuscript. CY: investigation. BS and JL: data curation and gap filling. BC, GL, and RS: data format standardization and data quality control. JZ: writing—review and editing. ZW: writing—review and editing, supervision, project administration, and funding acquisition. All authors have read and agreed to the published version of the manuscript.
This research was supported by the Hainan Province Science and Technology Special Fund (ZDYF2021SHFZ257) and the China Agriculture Research System (CARS-33-ZP3).
We would like to thank Dr. Joseph Elliot at the University of Kansas for her assistance with the English language and grammatical editing of the manuscript.
The authors declare that the research was conducted in the absence of any commercial or financial relationships that could be construed as a potential conflict of interest.
All claims expressed in this article are solely those of the authors and do not necessarily represent those of their affiliated organizations, or those of the publisher, the editors and the reviewers. Any product that may be evaluated in this article, or claim that may be made by its manufacturer, is not guaranteed or endorsed by the publisher.
The Supplementary Material for this article can be found online at: https://www.frontiersin.org/articles/10.3389/fevo.2023.1194147/full#supplementary-material
Aguilos, M., Hérault, B., Burban, B., Wagner, F., and Bonal, D. (2018). What drives long-term variations in carbon flux and balance in a tropical rainforest in French Guiana? Agric. For. Meteorol. 253–254, 114–123. doi: 10.1016/j.agrformet.2018.02.009
Ahrends, A., Hollingsworth, P. M., Ziegler, A. D., Fox, J. M., Chen, H., Su, Y., et al. (2015). Current trends of rubber plantation expansion may threaten biodiversity and livelihoods. Glob. Environ. Change 34, 48–58. doi: 10.1016/j.gloenvcha.2015.06.002
Ameye, M., Wertin, T. M., Bauweraerts, I., McGuire, M. A., Teskey, R. O., Steppe, K., et al. (2012). The effect of induced heat waves on Pinus taeda and Quercus rubra seedlings in ambient and elevated CO2 atmospheres. New Phytol. 196, 448–461. doi: 10.1111/j.1469-8137.2012.04267.x
Baldocchi, D. (2003). Assessing the eddy covariance technique for evaluating carbon dioxide exchange rates of ecosystems: past, present and future. Glob. Change Biol. 9, 479–492. doi: 10.1046/j.1365-2486.2003.00629.x
Baldocchi, D. (2014). Measuring fluxes of trace gases and energy between ecosystems and the atmosphere – the state and future of the eddy covariance method. Glob. Change Biol. 20, 3600–3609. doi: 10.1111/gcb.12649
Bauweraerts, I., Wertin, T. M., Ameye, M., McGuire, M. A., Teskey, R. O., Steppe, K., et al. (2013). The effect of heat waves, elevated [CO2] and low soil water availability on northern red oak (Quercus rubra L.) seedlings. Glob. Change Biol. 19, 517–528. doi: 10.1111/gcb.12044
Berry, J., and Bjorkman, O. (1980). Photosynthetic response and adaptation to temperature in higher plants. Annu. Rev. Plant Phys. 31, 491–543. doi: 10.1146/annurev.pp.31.060180.002423
Bonan, G. B. (2008). Forests and climate change: forcings, feedbacks, and the climate benefits of forests. Science 320, 1444–1449. doi: 10.1126/science.1155121
Cai, W., He, N., Li, M., Xu, L., Wang, L., Zhu, J., et al. (2021). Carbon sequestration of chinese forests from 2010–2060: spatiotemporal dynamics and its regulatory strategies. Sci. Bull. 67, 836–843. doi: 10.1016/j.scib.2021.12.012
Chayawat, C., Satakhun, D., Kasemsap, P., Sathornkich, J., and Phattaralerphong, J. (2019). Environmental controls on net CO2 exchange over a young rubber plantation in Northeastern Thailand. ScienceAsia 45, 50–59. doi: 10.2306/scienceasia1513-1874.2019.45.050
Chen, B., Wu, Z., Yang, C., Qi, D., Li, X., Lan, G., et al. (2015). Monthly dynamics of leaf area index of rubber plantation in Danzhou, Hainan Island, China. Chin. J. Trop. Agric. 35, 1–6.+11. doi: 10.3969/j.issn.1009-2196.2015.11.001
Chen, H., Lu, W., Yan, G., Yang, S., and Lin, G. (2014). Typhoons exert significant but differential impacts on net ecosystem carbon exchange of subtropical mangrove forests in China. Biogeosciences 11, 5323–5333. doi: 10.5194/bg-11-5323-2014
Chen, S., Jiang, H., Cai, Z., Zhou, X., and Peng, C. (2018). The response of the net primary production of Moso bamboo forest to the on and off-year management: a case study in Anji County, Zhejiang, China. Forest Ecol. Manag. 409, 1–7. doi: 10.1016/j.foreco.2017.11.008
Cui, W., Xiong, Q., Zheng, Y., Zhao, J., Nie, T., Wu, L., et al. (2022). A Study on the vulnerability of the gross primary production of rubber plantations to regional short-term flash drought over Hainan Island. Forests 13, 893. doi: 10.3390/f13060893
Dalmagro, H. J., de Souza, P. J., Engelbrehct, M. M., de Arruda, P. H. Z., Sallo, F. d. S., Vourlitis, G. L., et al. (2022). Net carbon dioxide exchange in a hyperseasonal cattle pasture in the northern Pantanal wetland of Brazil. Agric. For. Meteorol. 324, 109099. doi: 10.1016/j.agrformet.2022.109099
De Boeck, H. J., Dreesen, F. E., Janssens, I. A., and Nijs, I. (2011). Whole-system responses of experimental plant communities to climate extremes imposed in different seasons. New Phytol. 189, 806–817. doi: 10.1111/j.1469-8137.2010.03515.x
Doughty, C. E., Metcalfe, D. B., Girardin, C. A. J., Amézquita, F. F., Cabrera, D. G., Huasco, W. H., et al. (2015). Drought impact on forest carbon dynamics and fluxes in Amazonia. Nature 519, 78–82. doi: 10.1038/nature14213
Fang, J., Yu, G., Liu, L., Hu, S., and Chapin, F. S. (2018). Climate change, human impacts, and carbon sequestration in China. Proc. Natl. Acad. Sci. U.S.A. 115, 4015–4020. doi: 10.1073/pnas.1700304115
Gao, J., Zhang, Y., Song, Q., Lin, Y., Zhou, R., Dong, Y. X., et al. (2019). Stand age-related effects on soil respiration in rubber plantations (Hevea brasiliensis) in Southwest China. Eur. J. Soil. Sci. 70, 1221–1233. doi: 10.1111/ejss.12854
Gong, T., Lei, H., Yang, D., Yang, H., Liu, Y., Duan, L., et al. (2018). Assessing impacts of extreme water and temperature conditions on carbon fluxes in two desert shrublands. J. Hydroelectr. Eng. 37, 32–46. doi: 10.11660/slfdxb.20180204
Granier, A., Reichstein, M., Bréda, N., Janssens, I. A., Falge, E., Ciais, P., et al. (2007). Evidence for soil water control on carbon and water dynamics in European forests during the extremely dry year: 2003. Agric. For. Meteorol. 143, 123–145. doi: 10.1016/j.agrformet.2006.12.004
Han, C., Li, Y., Dong, X., Zhao, C., and An, L. (2022). Pinus tabulaeformis forests have higher carbon sequestration potential than Larix principis-rupprechtii forests in a dryland mountain ecosystem, northwest China. Forests 13, 739. doi: 10.3390/f13050739
He, J., Wen, S., Luo, P., Zhang, H., and Wang, X. (2015). Influence of typhoon Rammasun on Hevea brasiliensis in Leizhou Peninsula. Guangdong Agri. Sci. 42, 80–85. doi: 10.16768/j.issn.1004-874x.2015.24.058
He, K., and Huang, Z. (1987). Rubber in the Northern Part of Tropical Area. Guangzhou: Guangdong Science and Technology Press.
Howell, T., and Dusek, D. A. (1995). Comparison of vapor-pressure-deficit calculation methods: southern high plains. J. Irrig. Drain. Eng. 121, 191–198. doi: 10.1061/(ASCE)0733-9437(1995)121:2(191)
Huang, H., Yang, Z., Wang, C., Zhang, J., Zhang, Y., Zhang, M., et al. (2019). Evaluation of typhoon disaster risk for Hevea brasiliensis in Hainan island. J. Meteorol. Environ. 35, 130–136. doi: 10.3969/j.issn.1673-503X.2019.05.017
IPCC (2021). Climate Change 2021: The Physical Science Basis. Contribution of Working Group I to the Sixth Assessment Report of the Intergovernmental Panel on Climate Change. New York, NY: Cambridge University Press.
Jordan, G. B. (2012). Hurricane disturbance and recovery of energy balance, CO2 fluxes and canopy structure in a mangrove forest of the Florida Everglades. Agric. For. Meteorol. 153, 54–66. doi: 10.1016/j.agrformet.2011.07.022
Kljun, N., Calanca, P., Rotach, M. W., and Schmid, H. P. (2015). A simple two-dimensional parameterisation for flux footprint prediction (FFP). Geosci. Model Dev. 8, 3695–3713. doi: 10.5194/gmd-8-3695-2015
Lan, G., Wu, Z., Chen, B., and Xie, G. (2017). Species diversity in a naturally managed rubber plantation in Hainan Island, South China. Trop. Conserv. Sci. 10, 1–7. doi: 10.1177/1940082917712427
Li, G., Kou, W., Wu, Z., Zhang, X., Yun, C., Ma, J., et al. (2023a). Spatio-temporal changes of rubber plantations in Hainan Island over the past 30 years. J. Nanjing Forestry Univ. 47, 189–198. doi: 10.12302/j.issn.1000-2006.202109041
Li, G., Wu, C., Chen, Y., Huang, C., Zhao, Y., Wang, Y., et al. (2023b). Increasing temperature regulates the advance of peak photosynthesis timing in the boreal ecosystem. Sci. Total Environ. 882, 163587. doi: 10.1016/j.scitotenv.2023.163587
Lin, C., Gentine, P., Frankenberg, C., Zhou, S., Kennedy, D., Li, X., et al. (2019). Evaluation and mechanism exploration of the diurnal hysteresis of ecosystem fluxes. Agric. For. Meteorol. 278, 107642. doi: 10.1016/j.agrformet.2019.107642
Lin, H., Tsai, J., Tada, K., Matsumoto, H., Chiu, C., Nakayama, K., et al. (2022). The impacts of the hydraulic retention effect and typhoon disturbance on the carbon flux in shallow subtropical mountain lakes. Sci. Total. Environ. 803, 150044. doi: 10.1016/j.scitotenv.2021.150044
Lin, Y., Grace, J., Zhao, W., Dong, Y., Zhang, X., Zhou, L., et al. (2018). Water-use efficiency and its relationship with environmental and biological factors in a rubber plantation. J. Hydrol. 563, 273–282. doi: 10.1016/j.jhydrol.2018.05.026
Lin, Y., Li, Y., Zheng, B., Yin, X., Wang, L., He, J., et al. (2019). Evolution of sedimentary organic matter in a small river estuary after the typhoon process: a case study of Quanzhou Bay. Sci. Total. Environ. 686, 290–300. doi: 10.1016/j.scitotenv.2019.05.452
Liu, J., Wu, Z., Yang, S., and Yang, C. (2022). Sensitivity analysis of Biome-BGC for gross primary production of a rubber plantation ecosystem: a case study of Hainan Island, China. Int. J. Env. Res. Public Health 19, 14068. doi: 10.3390/ijerph192114068
Liu, S., Cai, D., Tian, G., and Gan, Y. (2020). Zoning of typhoon disaster risks in rubber tree planting area of China. Guangdong Agri. Sci. 47, 134–140. doi: 10.16768/j.issn.1004-874X.2020.09.018
Lu, G., Wang, W., Deng, M., and Cai, Q. (2015). Spatial and temporal distribution characteristics of typhoon precipitation in Hainan. Trans. Atmos. Sci. 38, 710–715. doi: 10.13878/j.cnki.dqkxxb.20141230001
Mau, A., Reed, S., Wood, T., and Cavaleri, M. (2018). Temperate and tropical forest canopies are already functioning beyond their thermal thresholds for photosynthesis. Forests 9, 47. doi: 10.3390/f9010047
Moinet, G. Y. K., Cieraad, E., Turnbull, M. H., and Whitehead, D. (2017). Effects of irrigation and addition of nitrogen fertiliser on net ecosystem carbon balance for a grassland. Sci. Total. Environ. 579, 1715–1725. doi: 10.1016/j.scitotenv.2016.11.199
Nemani, R. R., Keeling, C. D., Hashimoto, H., Jolly, W. M., Piper, S. C., Tucker, C. J., et al. (2003). Climate-driven increases in global terrestrial net primary production from 1982 to 1999. Science 300, 1560–1563. doi: 10.1126/science.1082750
Niu, S., Luo, Y., Fei, S., Montagnani, L., Bohrer, G. I. L., Janssens, I. A., et al. (2011). Seasonal hysteresis of net ecosystem exchange in response to temperature change: patterns and causes. Glob. Change Biol. 17, 3102–3114. doi: 10.1111/j.1365-2486.2011.02459.x
Pang, J., Li, H., Tang, X., and Geng, J. (2019). Carbon dynamics and environmental controls of a hilly tea plantation in Southeast China. Ecol. Evol. 9, 9723–9735. doi: 10.1002/ece3.5504
Qin, W., Wang, L., Zhang, M., Niu, Z., Luo, M., Lin, A., et al. (2019). First effort at constructing a high-density photosynthetically active radiation dataset during 1961–2014 in China. J. Climate 32, 2761–2780. doi: 10.1175/JCLI-D-18-0590.1
Reichstein, M., Ciais, P., Papale, D., Valentini, R., Running, S., Viovy, N., et al. (2007). Reduction of ecosystem productivity and respiration during the European summer 2003 climate anomaly: a joint flux tower, remote sensing and modelling analysis. Glob. Change Biol. 13, 634–651. doi: 10.1111/j.1365-2486.2006.01224.x
Reichstein, M., Falge, E., Baldocchi, D., Papale, D., Aubinet, M., Berbigier, P., et al. (2005). On the separation of net ecosystem exchange into assimilation and ecosystem respiration: review and improved algorithm. Glob. Change Biol. 11, 1424–1439. doi: 10.1111/j.1365-2486.2005.001002.x
Rodda, S. R., Thumaty, K. C., Praveen, M. S. S., Jha, C. S., and Dadhwal, V. K. (2021). Multi-year eddy covariance measurements of net ecosystem exchange in tropical dry deciduous forest of India. Agric. For. Meteorol. 301–302, 108351. doi: 10.1016/j.agrformet.2021.108351
Satakhun, D., Chayawat, C., Sathornkich, J., Phattaralerphong, J., Chantuma, P., Thaler, P., et al. (2019). Carbon sequestration potential of rubber-tree plantation in Thailand. IOP Conf. Ser. Mater. Sci. Eng. 526, 012036. doi: 10.1088/1757-899X/526/1/012036
Singh, A. K., Liu, W., Zakari, S., Wu, J., Yang, B., Jiang, X., et al. (2021). A global review of rubber plantations: Impacts on ecosystem functions, mitigations, future directions, and policies for sustainable cultivation. Sci. Total. Environ. 796, 148948. doi: 10.1016/j.scitotenv.2021.148948
Song, Q., Tan, Z., Zhang, Y., Sha, L., Deng, X., Deng, Y., et al. (2014). Do the rubber plantations in tropical China act as large carbon sinks? iForest 7, 42–47. doi: 10.3832/ifor0891-007
Song, X., Chen, X., Zhou, G., Jiang, H., and Peng, C. (2017). Observed high and persistent carbon uptake by Moso bamboo forests and its response to environmental drivers. Agric. For. Meteorol. 247, 467–475. doi: 10.1016/j.agrformet.2017.09.001
Sun, M., Mo, W., Xie, M., Chen, Y., and Pan, L. (2021). Characteristics of net ecosystem carbon exchange and its influence factors over the Mangrove in Guangxi. J. Ecol. Rural. Environ. 37, 909–916. doi: 10.19741/j.issn.1673-4831.2020.0779
Tan, Z., Li, Z., Ding, M., Xie, Y., and Liu, Z. (2022). Spatio-temporal variation characteristics of photosynthetic active radiation in Guangxi during 1961 to 2020. J. Meteorol. Res. Appl. 43, 7–12. doi: 10.19849/j.cnki.CN45-1356/P.2022.4.02
Tan, Z., Zhang, Y., Song, Q., Liu, W., Deng, X., Tang, J., et al. (2011). Rubber plantations act as water pumps in tropical China. Geophys. Res. Lett. 38, L24406. doi: 10.1029/2011GL050006
Tang, X., Xiao, J., Ma, M., Yang, H., Li, X., Ding, Z., et al. (2022). Satellite evidence for China's leading role in restoring vegetation productivity over global karst ecosystems. For. Ecol. Manag. 507, 120000. doi: 10.1016/j.foreco.2021.120000
Wang, C., Sardans, J., Tong, C., Peñuelas, J., and Wang, W. (2021). Typhoon-induced increases in porewater nutrient concentrations and CO2 and CH4 emissions associated with salinity and carbon intrusion in a subtropical tidal wetland in China: a mesocosm study. Geoderma 384, 114800. doi: 10.1016/j.geoderma.2020.114800
Wang, X., Blanken, P., Kasemsap, P., Petchprayoon, P., Thaler, P., Nouvellon, Y., et al. (2022). Carbon and water cycling in two rubber plantations and a natural forest in mainland southeast Asia. J. Geophys. Res-Biogeosci. 127, e2022JG006840.. doi: 10.1029/2022JG006840
Wu, S., Xing, C., and Zhu, J. (2022). Analysis of climate characteristics in Hainan Island. J. Trop. Biol. 13, 315–323. doi: 10.15886/j.cnki.rdswxb.2022.04.001
Wu, Z., Chen, B., Yang, C., Tao, Z., Xie, G., Zhou, Z., et al. (2012). Distribution of footprint and fluxes source area of rubber plantation in Hainan Island. J. Trop. Biol. 3, 42–50. doi: 10.15886/j.cnki.rdswxb.2012.01.014
Wu, Z., Chen, J., Lan, G., Chen, B., Xie, G., Zhou, Z., et al. (2013). Quality assessment of turbulence data in rubber plantation ecosystem. Chinese J. Trop. Crops. 34, 2075–2082. doi: 10.3969/j.issn.1000-2561.2013.11.001
Wu, Z., Tao, Z., Lan, G., Wang, J., Xie, G., Zhou, Z., et al. (2014). The net ecosystem carbon exchange and its environmental factors in a tropical rubber plantation ecosystem in Hainan Island. Chinese J. Trop. Crops. 35, 2099–2108. doi: 10.3969/j.issn.1000-2561.2014.11.001
Wutzler, T., Lucas-Moffat, A., Migliavacca, M., Knauer, J., Sickel, K., Šigut, L., et al. (2018). Basic and extensible post-processing of eddy covariance flux data with REddyProc. Biogeosciences 15, 5015–5030. doi: 10.5194/bg-15-5015-2018
Xiang, Z., Wang, J, and Wang, W. (2020). Study on high temperature constraints on urban ecosystem carbon fluxes in a subtropical city. Ecol. Environ. Sci. 29, 1810–1821. doi: 10.16258/j.cnki.1674-5906.2020.09.013
Xie, G., Wang, J., and Lin, W. (2013). Understory plants in rubber planting area in China (Hainan volumes). Beijing: China Agricultural Science and Technology Press.
Xing, C., Zhang, J., and Wu, S. (2017). Climatic characteristics of high temperature days and heatwaves: Hainan Island in recent 50 years. Chin. Agri. Sci. Bull. 33, 107–112. doi: 10.11924/j.issn.1000-6850.casb16070015
Yang, S., Yang, C., Gong, Y., Zhang, J., Song, B., Wu, Z., et al. (2022). Phenological characteristics of net ecosystem carbon exchange in hainan rubber forest ecosystem. Chin. J. Trop. Crops. 43, 1288–1296. doi: 10.3969/j.issn.1000-2561.2022.06.022
Yu, H., Qi, D., Zhang, Y., Sha, L., Liu, Y., Zhou, W., et al. (2021). (2021). An observation dataset of carbon and water fluxes in Xishuangbanna rubber plantations from 2010 to 2014. China Sci. Data 6, 92–103. doi: 10.11922/csdata.2020.0090.zh
Zhang, T., Xu, X., Jiang, H., Qiao, S., Guan, M., Huang, Y., et al. (2022). Widespread decline in winds promoted the growth of vegetation. Sci. Total. Environ. 825, 153682. doi: 10.1016/j.scitotenv.2022.153682
Zhang, X., Wu, Z., Yang, C, and Guan, L. (2016). Energy balance research of the rubber plantation in Hainan Island. J. Northwest For. Univ. 31, 77–85. doi: 10.3969/j.issn.1001-7461.2016.02.14
Zhao, Y., Goldberg, S., Xu, J., and Harrison, R. (2018). Spatial and seasonal variation in soil respiration along a slope in a rubber plantation and a natural forest in Xishuangbanna, Southwest China. J. MT. Sci. Engl. 15, 695–707. doi: 10.1007/s11629-017-4478-9
Keywords: carbon fluxes, rubber plantation, environmental factors, extreme climate events, phenology
Citation: Yang S, Wu Z, Yang C, Song B, Liu J, Chen B, Lan G, Sun R and Zhang J (2023) Responses of carbon exchange characteristics to meteorological factors, phenology, and extreme events in a rubber plantation of Danzhou, Hainan: evidence based on multi-year data. Front. Ecol. Evol. 11:1194147. doi: 10.3389/fevo.2023.1194147
Received: 26 March 2023; Accepted: 29 May 2023;
Published: 20 June 2023.
Edited by:
Xuguang Tang, Southwest University, ChinaReviewed by:
Luca Vitale, National Research Council (CNR), ItalyCopyright © 2023 Yang, Wu, Yang, Song, Liu, Chen, Lan, Sun and Zhang. This is an open-access article distributed under the terms of the Creative Commons Attribution License (CC BY). The use, distribution or reproduction in other forums is permitted, provided the original author(s) and the copyright owner(s) are credited and that the original publication in this journal is cited, in accordance with accepted academic practice. No use, distribution or reproduction is permitted which does not comply with these terms.
*Correspondence: Zhixiang Wu, emhpeGlhbmd3dUBjYXRhcy5jbg==
Disclaimer: All claims expressed in this article are solely those of the authors and do not necessarily represent those of their affiliated organizations, or those of the publisher, the editors and the reviewers. Any product that may be evaluated in this article or claim that may be made by its manufacturer is not guaranteed or endorsed by the publisher.
Research integrity at Frontiers
Learn more about the work of our research integrity team to safeguard the quality of each article we publish.