 Xiuzhi Chen
 Xiaoli Ren
 Honglin He1,2,4
 Li Zhang
94% of researchers rate our articles as excellent or good
Learn more about the work of our research integrity team to safeguard the quality of each article we publish.
Find out more
ORIGINAL RESEARCH article
Front. Ecol. Evol., 31 May 2023
Sec. Population, Community, and Ecosystem Dynamics
Volume 11 - 2023 | https://doi.org/10.3389/fevo.2023.1193607
This article is part of the Research TopicThe Effects of Climate Change and Anthropogenic Activities on Patterns, Structures and Functions of Terrestrial EcosystemsView all 18 articles
Ecosystem maximum photosynthetic rate (Amax) is an important ecosystem functional property, as it is critical for ecosystem productivity modeling. However, little is known about the mechanisms that regulate the seasonal variation of Amax in grasslands, one of the dominant vegetation types worldwide. In this study, we analyzed the seasonal variability of Amax of grassland sites across the globe and its environmental drivers. We found that grassland Amax had strong seasonal variations, which were influenced by the climate and agricultural management, such as grass cutting and grazing. Second, the seasonal variation of Amax at all arid grasslands [mean annual vapor pressure deficit (VPD) > 10 hPa] was driven more by changes in canopy physiological property (i.e., maximum photosynthetic rate per leaf area Amaxa) than canopy structural property (i.e., leaf area, presented by LAI), because Amaxa had stronger temporal variability than LAI in these ecosystems. Third, temperature and VPD were the most influential factors for the seasonal variability of Amax and LAI, but environmental variables only explained a small proportion of the seasonal variation of Amaxa, which was probably because Amaxa was more related to plant traits. Our findings provide new ideas for better parameterizations of Amax in terrestrial ecosystem models.
Amax refers to ecosystem light-saturated CO2 assimilation rates and represents the potential of an ecosystem’s photosynthetic capacity. It is an important ecosystem functional property (Reichstein et al., 2014), determining ecosystem carbon assimilation. Seasonal variations in Amax are critical in determining the seasonality and magnitude of gross primary productivity (GPP) in terrestrial ecosystem modeling (Wilson et al., 2001; Medvigy et al., 2013). Therefore, understanding the seasonal variability of Amax and its drivers is vital for improving the understanding of the variability of GPP and the impact of climate change on the terrestrial ecosystem carbon cycle (Luo and Schuur, 2020).
Many studies have shown that Amax has strong seasonal variability in many ecosystem types (Hollinger et al., 1999; Zhang et al., 2006; Polley et al., 2010). Evidence suggests that environmental factors, such as light, temperature, and water, impact the seasonal variations of Amax (Zhang et al., 2006; Polley et al., 2010; Ryan et al., 2017). For example, water stress can directly affect stomatal conductance and the availability of the CO2 substrate and thus reduce plant photosynthetic capacity (Reich et al., 2018). Leaves can adjust their photosynthetic rates to acclimate or adapt to changes in air temperature and solar radiation on intermediate to long-term timescales (Way and Yamori, 2014; Luo and Keenan, 2020). These environmental variables impact vegetation photosynthetic capacity through two different mechanisms. One is through influencing the canopy’s physiological properties (i.e., the maximum photosynthesis rate per leaf area Amaxa) (Joswig et al., 2021), and the other is through affecting the canopy’s structural properties (i.e., leaf area) (Hu et al., 2018; Li et al., 2019). Nevertheless, little literature has investigated to what extent the two mechanisms contribute to Amax.
Grasslands cover approximately 20–30% of the global land area (O’Mara, 2012), and have a great impact on the inter-annual variations in the global terrestrial carbon cycle (Poulter et al., 2014; Ahlström et al., 2015), thus it is important to understand grassland photosynthetic processes. However, knowledge of the mechanisms behind the seasonal variations in Amax of grassland ecosystems is limited. Therefore, in this study, we investigated the seasonal variations of grassland Amax. First, we derived the time series of Amax from flux measurements for 15 grassland sites in the FLUXNET 2015 dataset and analyzed its seasonal variations. Second, Amax was decomposed into leaf area index (LAI) and Amaxa (Amax = LAI × Amaxa), and their relative contributions to the variations of Amax were quantified. Third, we investigated the effect of environmental variables on the seasonal variations of Amax, Amaxa, and LAI.
Half-hourly eddy covariance (EC) flux data were used in this study to estimate the Amax of global grasslands. Data were retrieved from the FLUXNET 2015 Tier 1 dataset.1 Intotal, 15 EC flux sites were analyzed in this study. These sites were selected based on the data availability (i.e., sites with more than 60% of Amaxa data over the available years). Meteorological data measured alongside the flux data were also used, including soil water content (SWC), vapor pressure deficit (VPD), air temperature (Ta), and solar shortwave radiation (Rad). Detailed information for the sites used in this study is listed in Table 1.
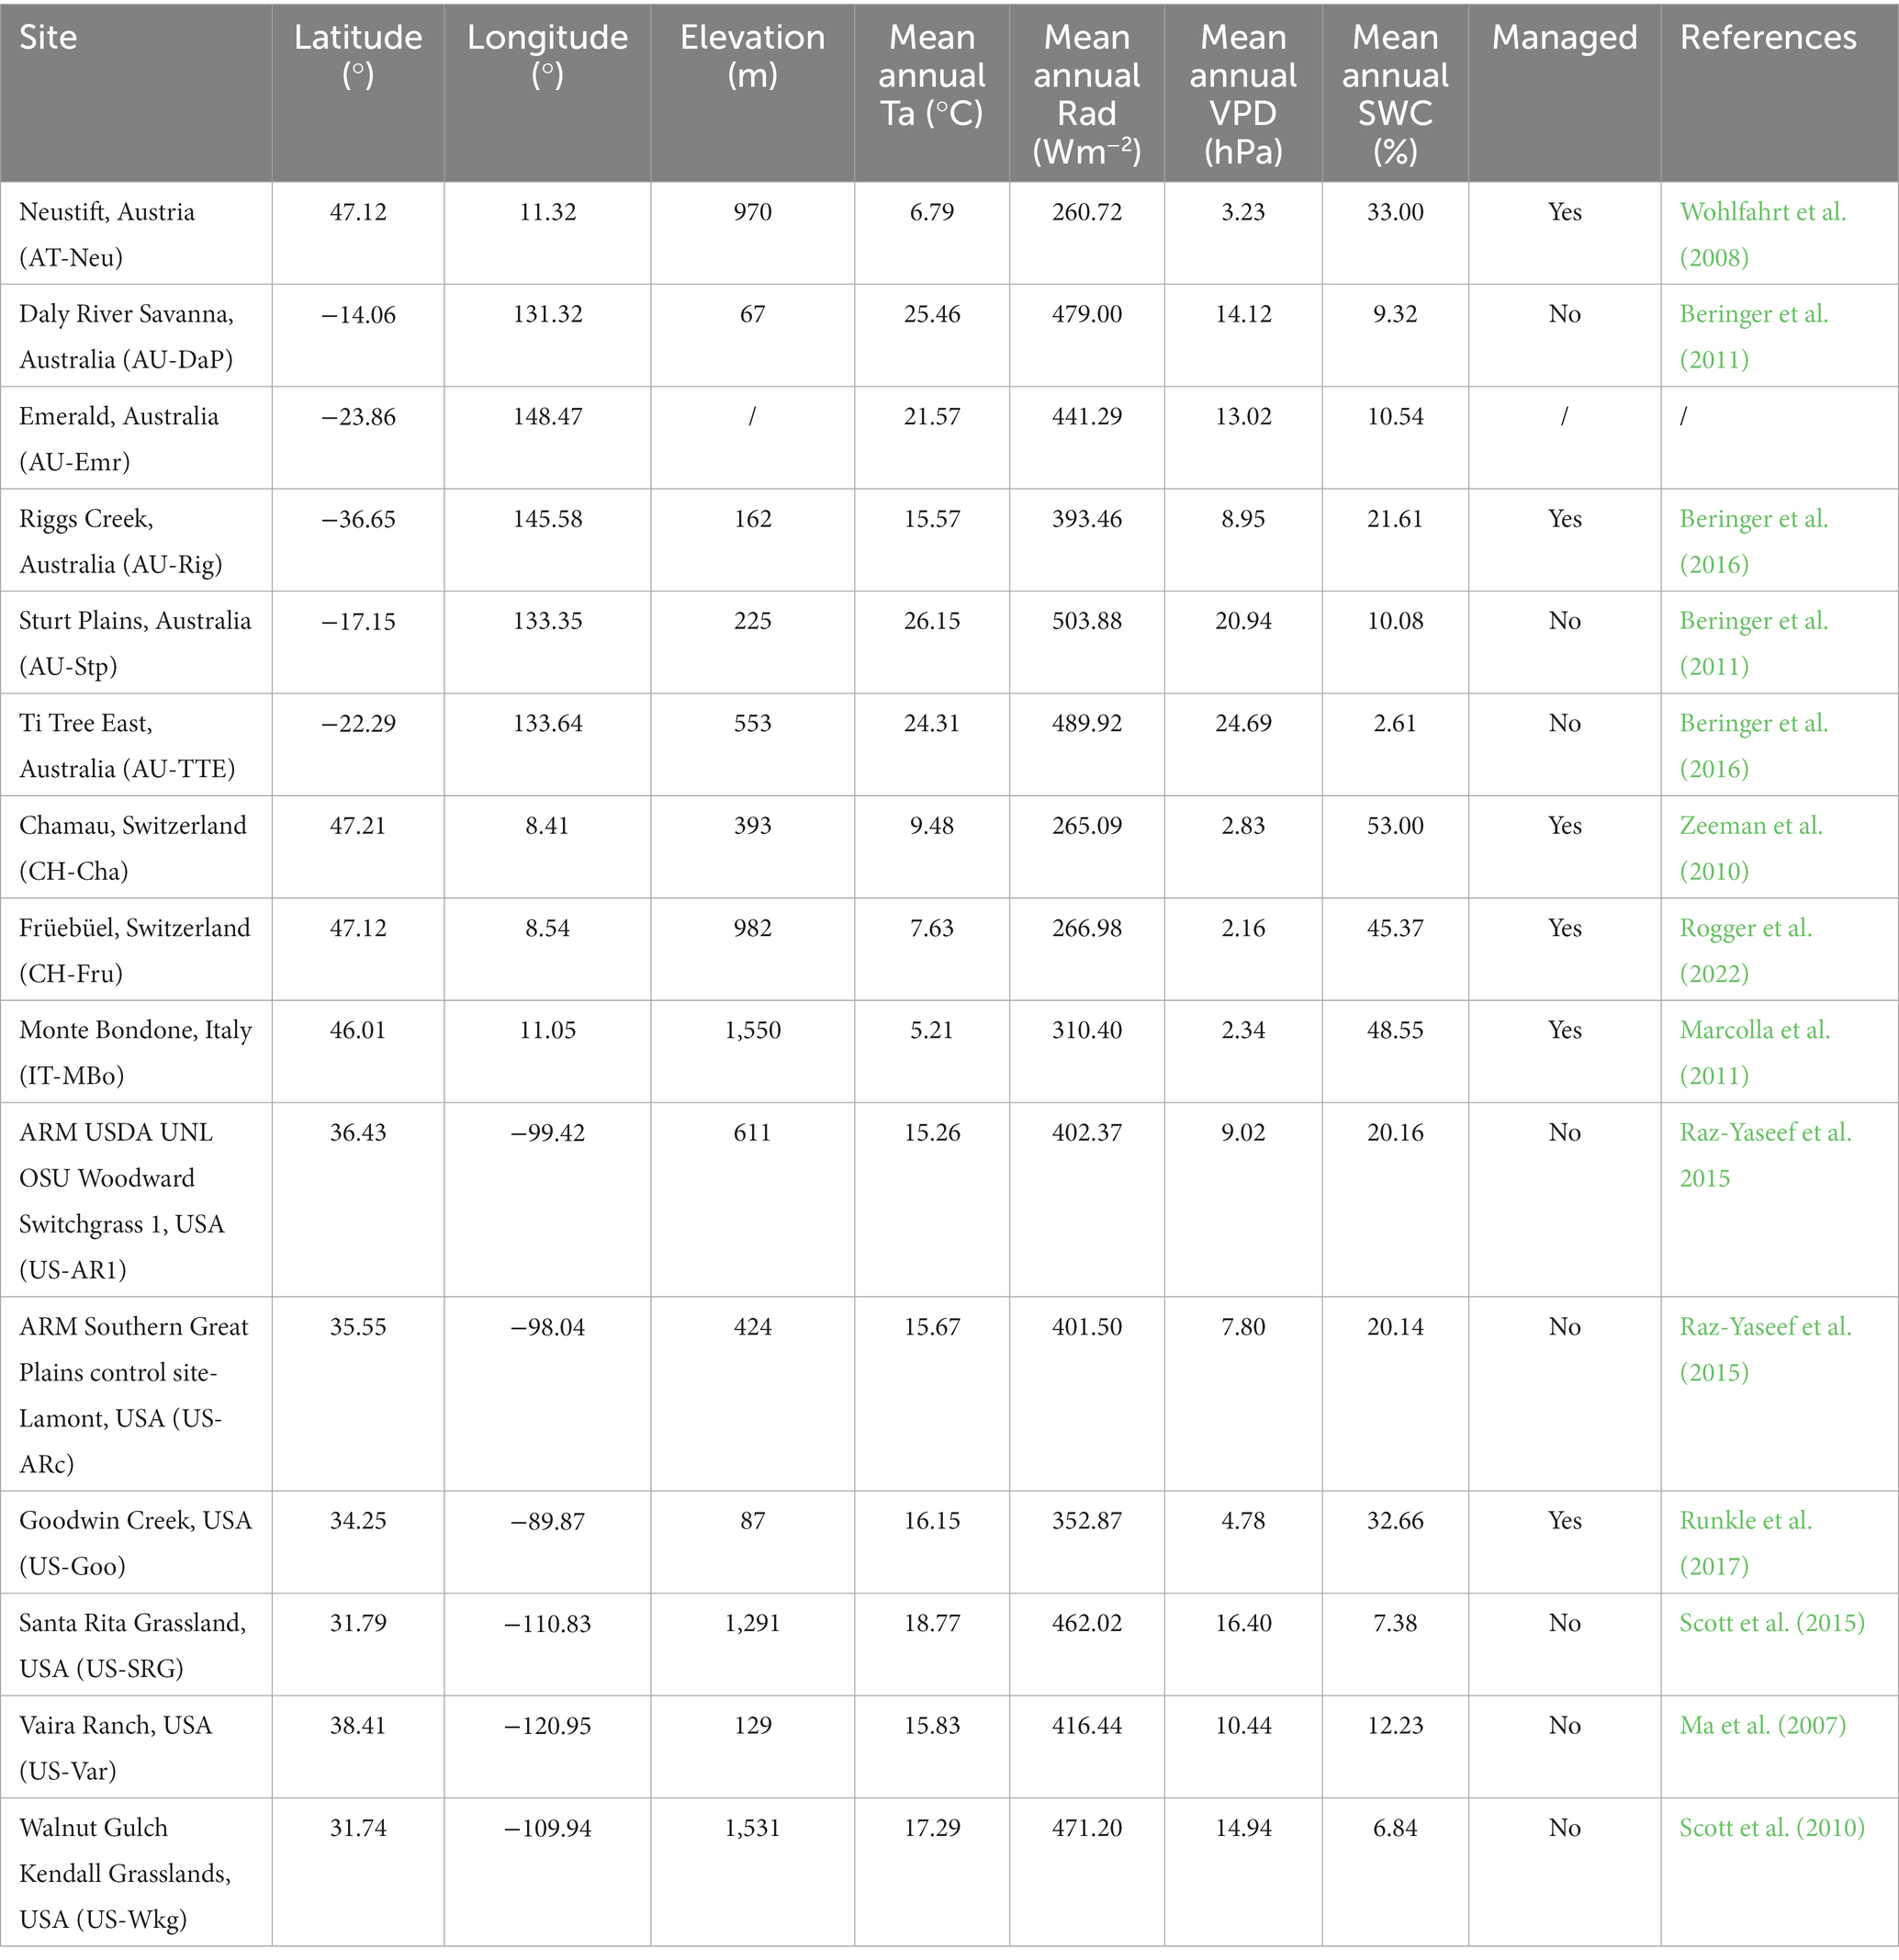
Table 1. Grasslands used in this study.
Leaf area index data (LAI) were extracted from the moderate resolution imaging spectroradiometer (MODIS) Leaf Area Index/FPAR Products version 6.1 (MOD15A2H v061). This product was an 8-day composite dataset with a spatial resolution of 500 m. We filtered out those data points where significant clouds or snow were present, or where the data quality was poor according to the quality flags (FparLai_QC and FparExtra_QC) provided by this dataset. The average LAI of pixels within a 500 m radius around the flux tower was used to represent the LAI of the site, because Chu et al., 2021 suggested that target areas with a smaller radial distance from the flux tower tend to be less biased in representing the land surface characteristics as covered by the flux footprint climatology. Then, the LAI time series were smoothed using the Savitzky–Golay (SG) filter, which has widely been used to remove the noises in MODIS LAI data (Zhu et al., 2016; Huang et al., 2021).
Normalized difference vegetation index (NDVI) data were downloaded from the MODIS C6 (MOD13C1) which had a resolution of 16-day and 500 m. The average NDVI of pixels that are within a 500 m radius around the flux tower was used to represent the NDVI of the site. To match the temporal resolution of LAI, we interpolated the NDVI time series to the LAI dates using linear interpolation.
We used the daytime flux partitioning method to derive the parameters of photosynthesis and respiration. The daytime flux partitioning method uses a light response curve to fit the flux of CO2. We followed the method proposed by Lasslop et al. (2010), with a small modification of separately estimating day-time and night-time reference respiration rates to account for light inhibition of leaf respiration (Keenan et al., 2019):
where α (μmol C J−1) is the canopy-scale quantum yields; β (μmol C m−2 s−1) is canopy light-saturated CO2 assimilation rate; Rg (W m−2) is incoming shortwave radiation; and Fr (μmol C m−2 s−1) is the ecosystem respiration term. Parameter β is estimated as an exponentially decreasing function of VPD, to account for the effect of VPD on apparent photosynthesis:
where β0 and k are fitted parameters and VPD0 is set to 10 hPa, as in Lasslop et al., (2010). β0 is the canopy light-saturated CO2 assimilation rate after removing the influence of VPD, which is equivalent to Amax.
Ecosystem respiration Fr is described by the Lloyd and Taylor model as
where Rref (μmol C m−2 s−1) is the reference respiration rate at the reference temperature (Tref = 15°C) and E0 (°C) is the temperature sensitivity. Tair is the air temperature and the parameter T0 (°C) is set to a constant of −46.02°C following Lloyd and Taylor (1994).
To get the seasonal variations of the parameters in the above model, we fitted the equations above to a dynamic window of 2–14 days of Fc depending on the availability of flux measurements, and assumed that every day in the same time window has the same daily parameters. We retrieved the time series of all parameters in the above model (i.e., α, β0, k, Rref, and E0) for each site by implementing Equations (1)–(3) using the REddyProc R package.2 The estimated Amax time series were smoothed with a nonparametric method for estimating regression surfaces (LOESS).
The light-saturated photosynthetic rate per unit leaf area (Amaxa) was calculated as the ratio of Amax to LAI. The unit of Amax is μmol m−2 ground area s−1 and the unit of Amaxa is μmol m−2 leaf area s−1. Then, the reason why the ratio of Amax to LAI is Amaxa is demonstrated in Equation (4):
We used linear regression coefficients to quantify the environmental control on the seasonal variations in Amax, Amaxa, and LAI. Environmental variables included air temperature (Ta), solar radiation (Rad), SWC, VPD, and day length (Dlen). Day length was defined as the number of hours with Rad >4 W m−2 each day. The effects of other environmental factors were also analyzed, but the other environmental factors did not show significant effects on Amax, Amaxa, or LAI. For Amaxa, we also added NDVI into the independent variables, because environmental variables had little explanatory power for Amaxa.
Data used for the seasonal analysis were integrated for every adjacent and non-overlapped eight-day window. Because the time series were multiyear, we divided the 8-day time series each year by the annual mean of that year to remove the inter-annual variations in the variables (Baldocchi et al., 2021). To make the regression coefficients of different variables comparable, we applied z-score standardization to the normalized time series before we conducted the linear regression.
The log–log scaling slope analysis was used to quantify the relative contribution of Amaxa and LAI to variations in Amax because Amaxa and LAI are related to Amax in a multiplicative manner (i.e., Amax = Amaxa × LAI) (Renton and Poorter, 2011). The relative contributions of Amaxa and LAI can be calculated as the regression coefficient of log(Amax) in the following equations:
where aAmaxa, aLAI, bAmaxa, and bLAI are coefficients of the linear regression between Amax and Amaxa and LAI, in which bAmaxa and bLAI represent the relative contribution of Amaxa and LAI to the variations of Amax. bAmaxa + bLAI will always equal 1. If bAmaxa is close to 1 and bLAI is close to 0, then Amaxa is largely responsible for variations in Amax, whereas if bAmaxa is close to 0 and bLAI is close to 1, then LAI is largely responsible for variations in Amax. If bAmaxa and bLAI are both close to 0.5, then Amaxa and LAI are similarly responsible. More information about the derivation and effectiveness of this method can be found in Renton and Poorter (2011).
The seasonal dynamics of Amax, Amaxa, and LAI and their multiyear averages for each site are shown in Figure 1 and Table 2, respectively. Amax had strong seasonal variations, mainly showing unimodal curves over the season. Amax at North Hemisphere sites usually exhibited a cyclical character each year, but some grasslands in Australia had variable temporal patterns of Amax, which were different for each year, such as at AU-Emr, AU-Stp, and AU-TTE. The seasonal pattern of Amaxa varied substantially among sites. CH-Cha and IT-MBo did not exhibit any clear seasonal trend in Amaxa, while Amaxa at other sites had strong seasonal variations, and often had a similar trend with Amax over the growing season. LAI also varied a lot over the season.
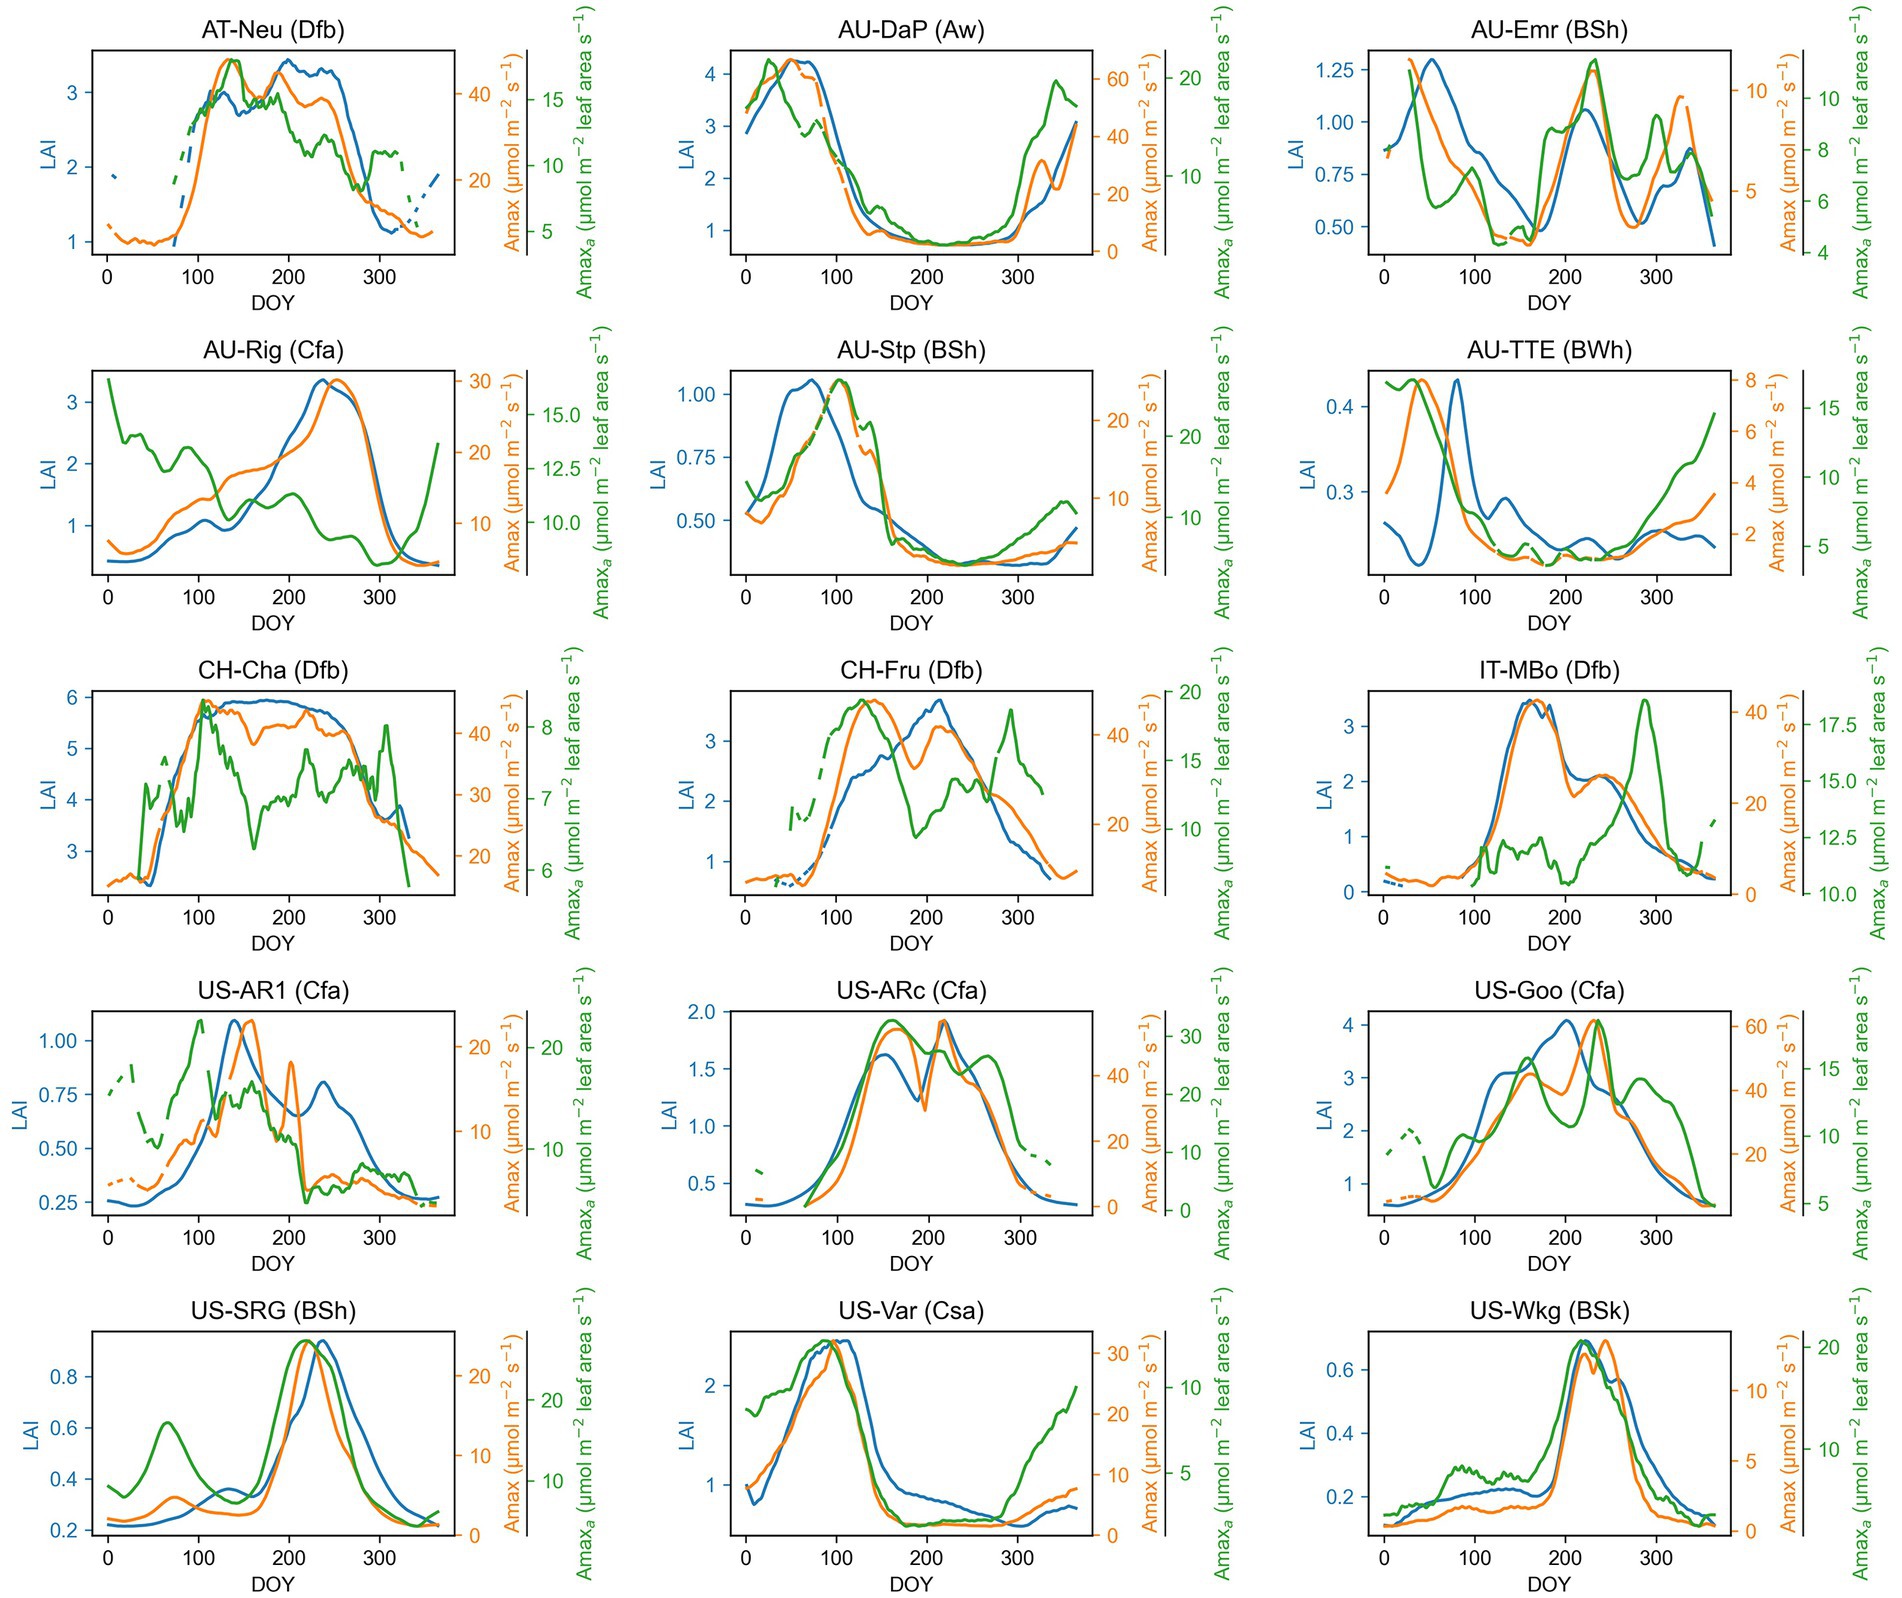
Figure 1. Seasonal patterns of maximum photosynthetic capacity (Amax), maximum photosynthetic capacity per leaf area (Amaxa), and leaf area index (LAI) for each grassland site. The time series presented in the graph are smoothed with a nonparametric method for estimating regression surfaces (LOESS). The abbreviation after each site name is the Köppen-Geiger climate classification dataset (Beck et al., 2018). Aw, Tropical, savannah; BSh, Arid, steppe, hot; BSk, Arid, steppe, cold; BWh, Arid, desert, hot; Cfa, Temperate, no dry season, hot summer; Csa, Temperate, dry summer, hot summer; Dfb, Cold, no dry season, warm summer.
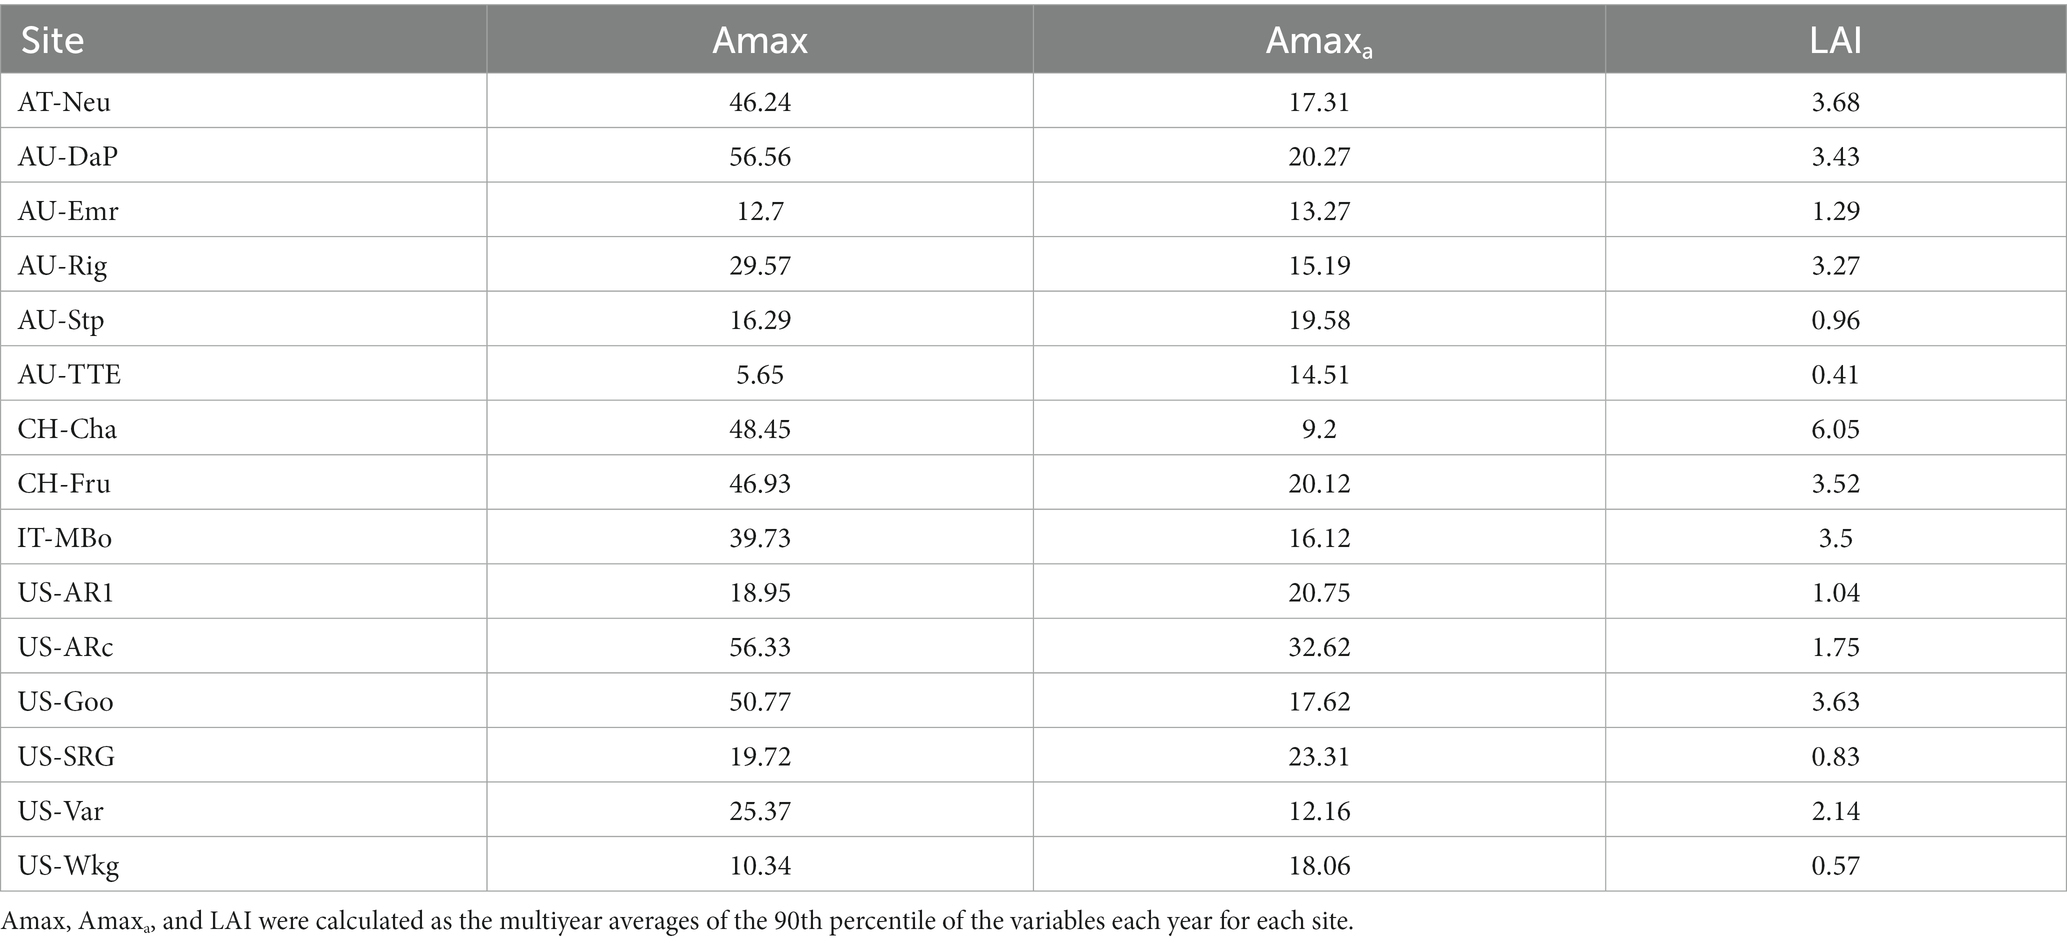
Table 2. Ecosystem maximum photosynthetic capacity (Amax), maximum photosynthetic capacity per leaf area (Amaxa), and leaf area index (LAI) for each grassland.
The climate influenced the seasonal patterns of Amax, Amaxa, and LAI. In grasslands located in no dry season climate according to Köppen-Geiger climate classification (e.g., AT-Neu, CH-Cha, CH-Fru, IT-MBo, US-AR1, US-ARc, and US-Goo), Amax, Amaxa, and LAI were higher in higher temperature and radiation season. In contrast, in arid or dry summer sites, the seasonal pattern of Amax, Amaxa, and LAI was driven more by water availability (Figure 2). For example, at the US-SRG, US-Var, and US-Wkg sites, Amax was significantly greater during higher water availability periods, but lower in high temperature and radiation periods because of the associated low water availability.
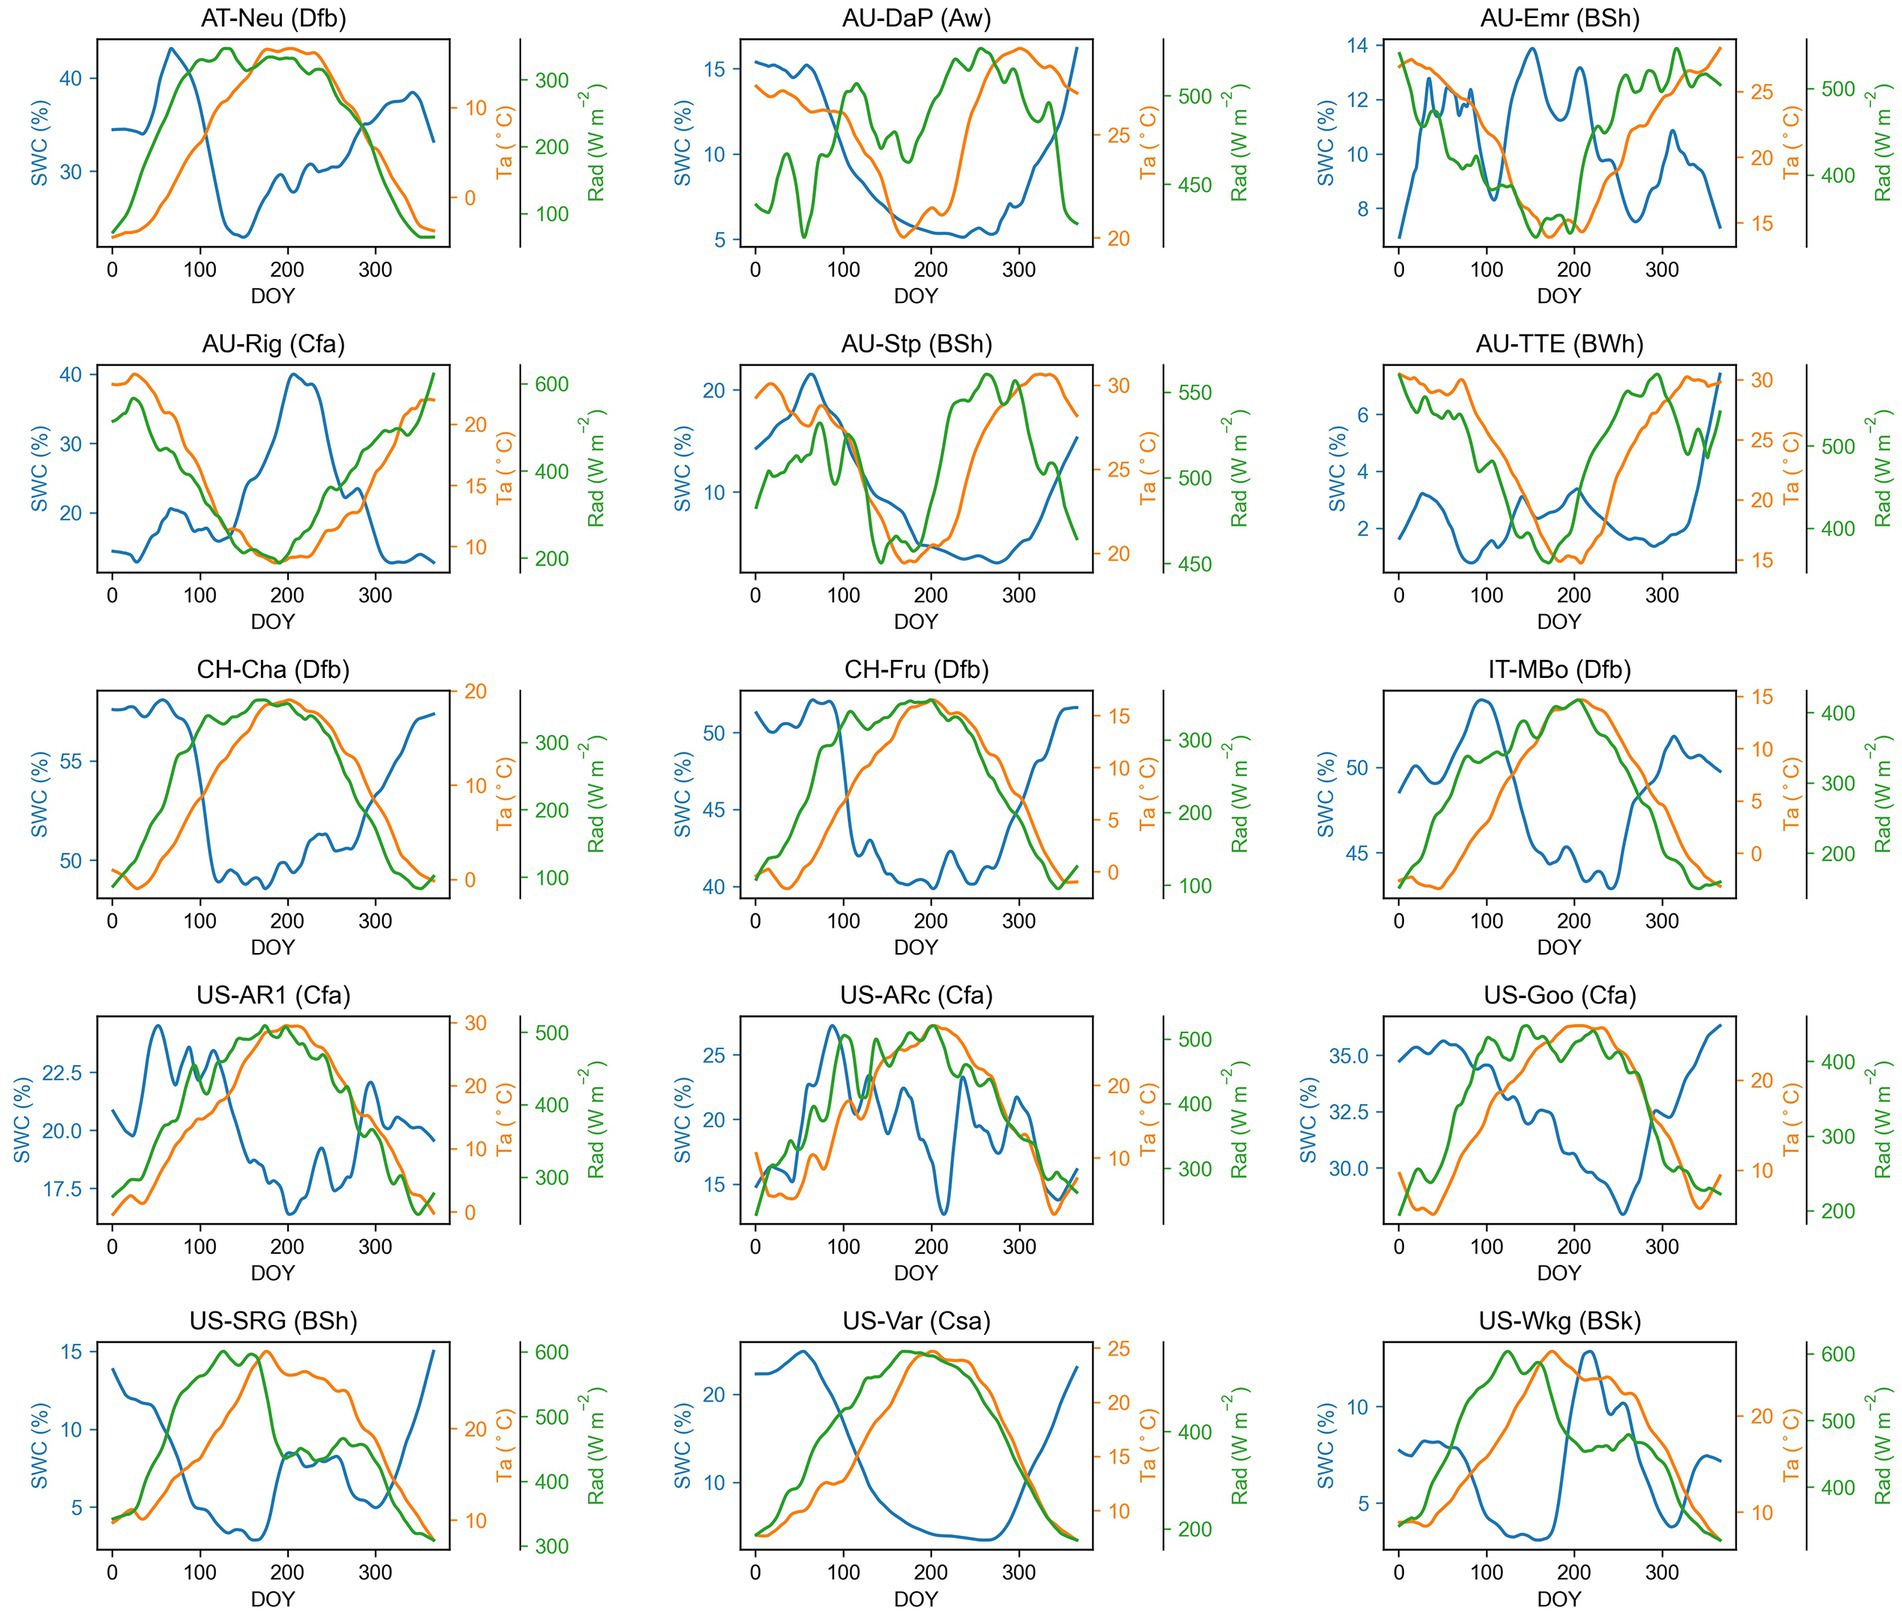
Figure 2. Seasonal patterns of air temperature (Ta), solar radiation (Rad), and soil water content (SWC) for each grassland site. The time series presented in the graph are smoothed with a nonparametric method for estimating regression surfaces (LOESS). The abbreviation after each site name is the Köppen-Geiger climate classification dataset (Beck et al., 2018). Aw, Tropical, savannah; BSh, Arid, steppe, hot; BSk, Arid, steppe, cold; BWh, Arid, desert, hot; Cfa, Temperate, no dry season, hot summer; Csa, Temperate, dry summer, hot summer; Dfb, Cold, no dry season, warm summer.
In addition to climate, agricultural management practices also impacted the seasonal variation of Amax, Amaxa, and LAI. At sites under intensive management practices (i.e., AT-Neu, CH-Cha, CH-Fru, IT-MBo, US-Goo), the unimodal curve of Amax and LAI changed by grass cutting and grazing, which can reduce Amax and LAI. As shown in the seasonal patterns of Amax at these sites, Amax decreased after each cutting or grazing event and later gradually recovered, which added fluctuation into the unimodal seasonal pattern of Amax (Figure 1). For example, at the AT-Neu site, the meadow was cut three times a year, the three cuts taking place between DOY 153 ~ 167, DOY 204 ~ 224, and DOY 264 ~ 301 (Wohlfahrt et al., 2008). We can observe decreases and recovery of Amax and Amaxa around the three cutting periods in our estimated Amax and Amaxa time series (Figure 1). After each cutting, the grassland could not recover to the same level of Amax as before cutting. Therefore, Amax was decreasing with each of the three cuttings. A similar pattern was also observed in IT-MBo, CH-Cha, and CH-Fru.
Amaxa and LAI jointly influenced the seasonal variations of Amax (bAmaxa and bLAI ≠ 0) at all sites (Table 3). bLAI > 0.5 at all managed sites, except CH-Cha, meaning that LAI contributed more to the seasonal variations in Amax than Amaxa at these sites, which might be because cutting and grazing caused more changes in LAI than in Amaxa.

Table 3. Relative contribution of Amaxa and LAI to the seasonal variation in Amax.
We investigated the effect of air dryness on the relative contribution of LAI to Amax, and we found that bLAI < 0.5 and bAmaxa > 0.5 in all arid grasslands (mean annual VPD > 10 hPa), which indicated that Amaxa had more influence on Amax than LAI in these sites. In comparison, among moist grassland sites (mean annual VPD < 10 hPa), there were LAI-driven sites and Amaxa-driven sites (Figure 3).
To explain the difference between arid and moist grasslands in the relative contribution of LAI and Amaxa to Amax, we further investigated the relationship of bAmaxa with the relative magnitude of the seasonal variability of Amaxa and LAI and the relationship of mean annual VPD and SWC with the seasonal variability of Amaxa and LAI (Figure 4). We found that at sites where CVAmaxa > CVLAI, Amaxa contributed more to the seasonal variations of Amax than LAI (bAmaxa > 0.5), and bAmaxa < 0.5 at sites where CVAmaxa < CVLAI (Figure 4). Sites with CVAmaxa > CVLAI tended to have higher mean annual VPD (Figure 4A). Therefore, Amaxa dominated the seasonal variation of Amax at sites with higher mean annual VPD. Mean annual SWC did not show any correlation with the relative magnitude of CVAmaxa and CVLAI, but grasslands with higher mean annual SWC had lower absolute CVAmaxa (Figure 4B).
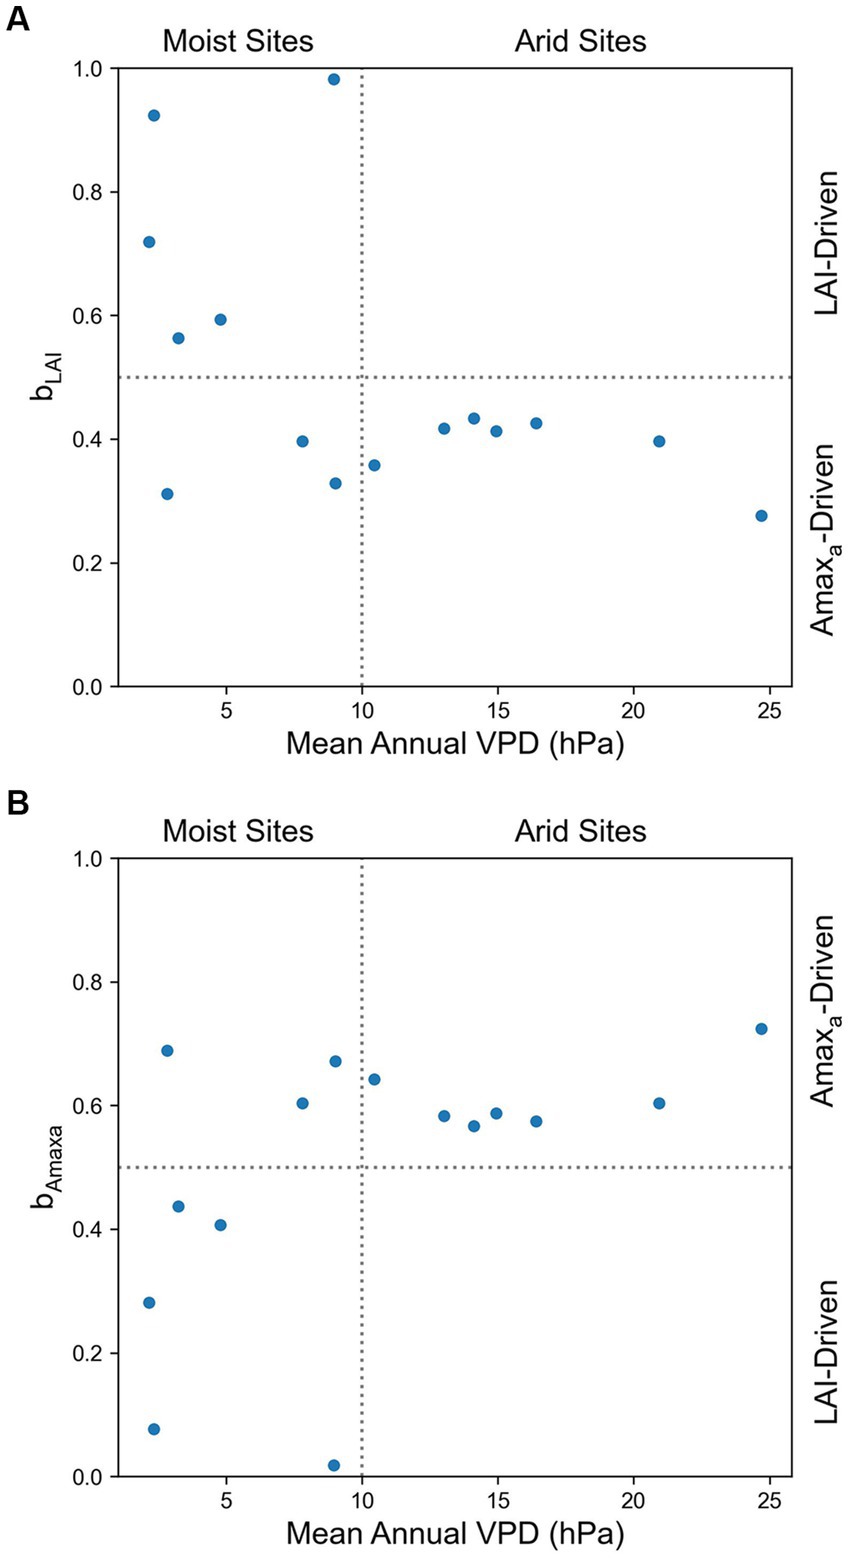
Figure 3. Effects of mean annual VPD on the relative contribution of (A) LAI (bLAI) and (B) Amaxa (bAmaxa) to the seasonal variation of Amax. bLAI + bAmaxa = 1.
Among the environmental variables, air temperature (Ta) showed strong control effects for the seasonal variations of Amaxa, LAI, and Amax (Table 4), with Ta having the largest absolute regression coefficient with them in most sites. Air dryness (VPD) also greatly influenced the seasonal variations of Amaxa, LAI, and Amax, especially for grasslands with a mean annual VPD > 10 hPa. It was consistently negatively associated with them at all sites. However, SWC, representing soil water condition, had a much smaller impact on Amaxa, LAI, and Amax. It positively correlated with them at all arid sites, but negatively correlated with them at some moist sites. Solar radiation and photoperiod were positively correlated with Amaxa, LAI, and Amax at many sites.
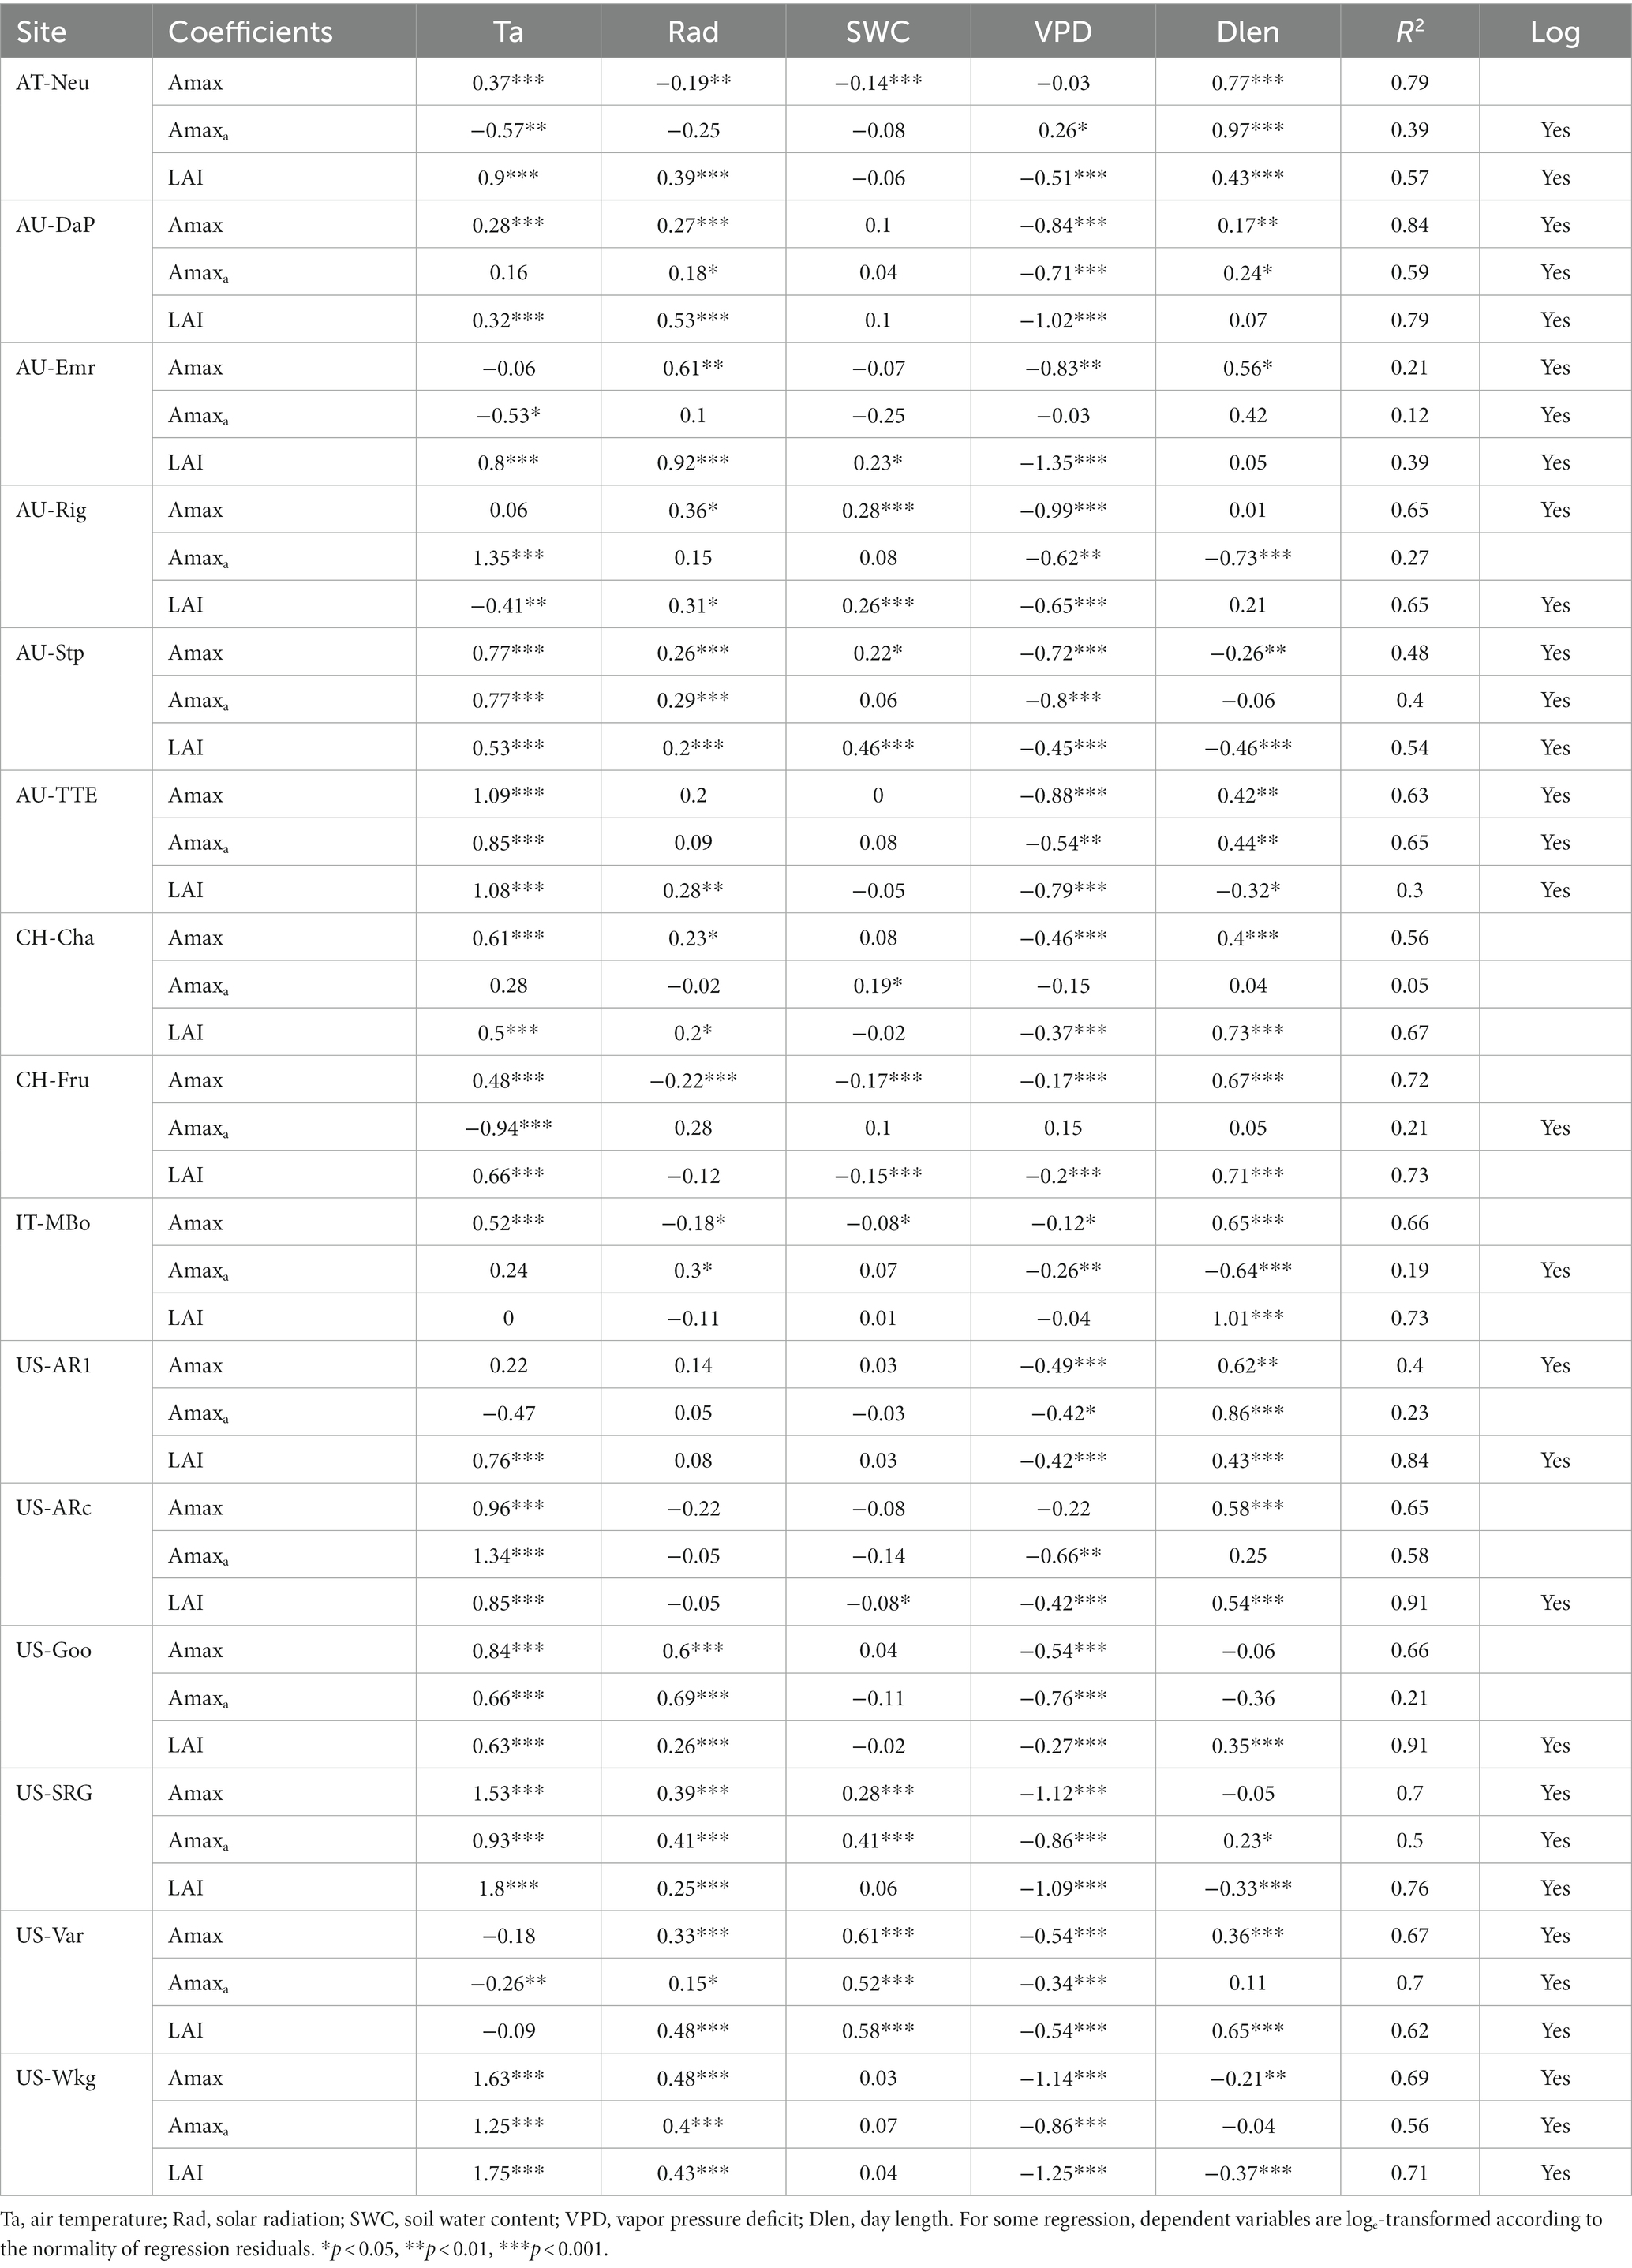
Table 4. Results (regression coefficients) of linear regression analysis with 8-day average Amax, Amaxa, and LAI as dependent and 8-day average Ta, Rad, SWC, VPD, and Dlen as independent variables.
Environmental variables explained on average 38, 70, and 62% of the seasonal variations in Amaxa, LAI, and Amax, respectively, which suggested environmental variables had a greater impact on LAI than on Amaxa. Therefore, environmental factors affected the seasonal variations of Amax mainly through its impact on LAI rather than through its impact on Amaxa.
Environmental variables had little explanatory power for Amaxa, except a few arid grasslands (i.e., AU-DaP, AU-TTE, US-Var, US-Wkg) where environmental factors can account for over 50% variance of Amaxa. The low average R2 across sites suggested that environmental factors could affect Amaxa, but were not the main drivers for the seasonal variations of Amaxa. We further investigated whether vegetation greenness (represented by NDVI) was better correlated with Amaxa and found that the average R2 for Amaxa with NDVI as one of the independent variables was 0.44, which was slightly greater than without NDVI. Coefficients of NDVI for Amaxa were significant at 11 of the 15 sites. These results suggested that the seasonal variations of Amaxa cannot be well explained by classical environmental factors, but may be more correlated with variations in plant traits such as pigment contents.
Our results suggested that Amaxa and LAI jointly determined the seasonal dynamics of Amax. The seasonal variation of Amax at all arid grasslands (mean annual VPD > 10 hPa) was driven more by changes in Amaxa than LAI, but the drivers of Amax for the moist grasslands (mean annual VPD < 10 hPa) were bimodal in that some sites were Amaxa-driven and others LAI-driven. The relative contribution of Amaxa and LAI to Amax was related to the relative magnitude of the temporal variability (CV) of Amaxa and LAI, which in turn, was influenced by mean annual VPD.
Annual air dryness influenced the relative magnitude of CVAmaxa and CVLAI from two aspects. On one hand, mean annual VPD was negatively correlated with LAI (the correlation coefficient between them was-0.77, p < 0.001), suggesting that drier grasslands tended to have lower LAI, and hence the magnitude of temporal variation in LAI would be smaller. On the other hand, VPD could affect leaf photosynthetic capacity directly by its control on leaf stomatal conductance (Fu et al., 2022), and indirectly by its impact on leaf traits. Moreover, environmental variables explained a large proportion of the variance in Amaxa in arid grasslands (Table 4) compared with wetter grasslands, which also suggested Amaxa in arid grasslands were more sensitive to changes in the environment. Therefore, lesser LAI and greater sensitivity of Amaxa to environmental variables in arid grasslands resulted in a greater contribution of Amaxa to Amax.
At the seasonal scale, air temperature and air dryness were the driving factors for the variation in Amax. Other studies also identified the two factors as the most important factors to regulate grassland C fluxes (Polley et al., 2010; Scott et al., 2015; Wang et al., 2019). We also found that VPD was more correlated with Amax than SWC at the seasonal scale, which was also observed in previous studies (Ryan et al., 2017; Fu et al., 2022). The possible reason for this higher correlation of VPD and Amax at the seasonal scale could be related to the non-linear relationship between SWC and Amax, as suggested by previous studies (Xu and Zhou, 2011; Fu et al., 2022). Xu and Zhou (2011) found that the Amax of two grass species was enhanced under moderate soil moisture with reductions under both severe water deficit and excessive water conditions. Fu et al. (2022) suggested that Amax was also non-linearly correlated with soil moisture at the ecosystem scale, while VPD was consistently negatively related to Amax.
The environmental factors used in our study can explain the variances in LAI better than Amax and Amaxa. The explanatory power (R2) of linear regression can be impacted by intensive management practices or other irregular natural events, such as fire and extreme temperatures (Moore et al., 2016). For some sites, such as AT-Neu, IT-MBo, CH-Cha, and CH-Fru, previous studies at these sites have demonstrated that management practices, like cutting, grazing, and fertilization, can obscure the response of photosynthesis to environmental variables (Wohlfahrt et al., 2008; Zeeman et al., 2010; Marcolla et al., 2011; Rogger et al., 2022).
In our study, environmental variables only explained a small proportion of variance in Amaxa on the 8-day scale, much less than that of Amax and LAI, which is probably because canopy photosynthetic capacity per leaf area (Amaxa) was controlled more by leaf traits, such as nitrogen (N) and chlorophyll (Chl) content, than by environmental factors, compared with Amax and LAI. According to its definition in our study, Amaxa is the average of the maximum photosynthetic rate per leaf area of individual plants in the ecosystem, or more precisely, all plants within the footprint of the flux tower, a variable independent of the ecosystem structure embedded in LAI and intrinsically related to individual plants. Reichstein et al. (2014) have summarized that environmental variables can account for only a fraction of the temporal and spatial variance of flux-derived ecosystem functional properties (EFP), e.g., seasonal carbon-use efficiency and light-saturated gross primary production (similar to Amax), and suggested that a substantial part of the variation in EFP would be explained by plant traits. Furthermore, Feng and Dietze (2013) examined the relationship between the seasonal variation of Amax and leaf traits on 25 grassland species. They found that leaf N and Chl content significantly correlated with leaf Amax in both mass-and area-based manner. Therefore, we thought that the large unexplained variance in Amaxa was related to plant traits.
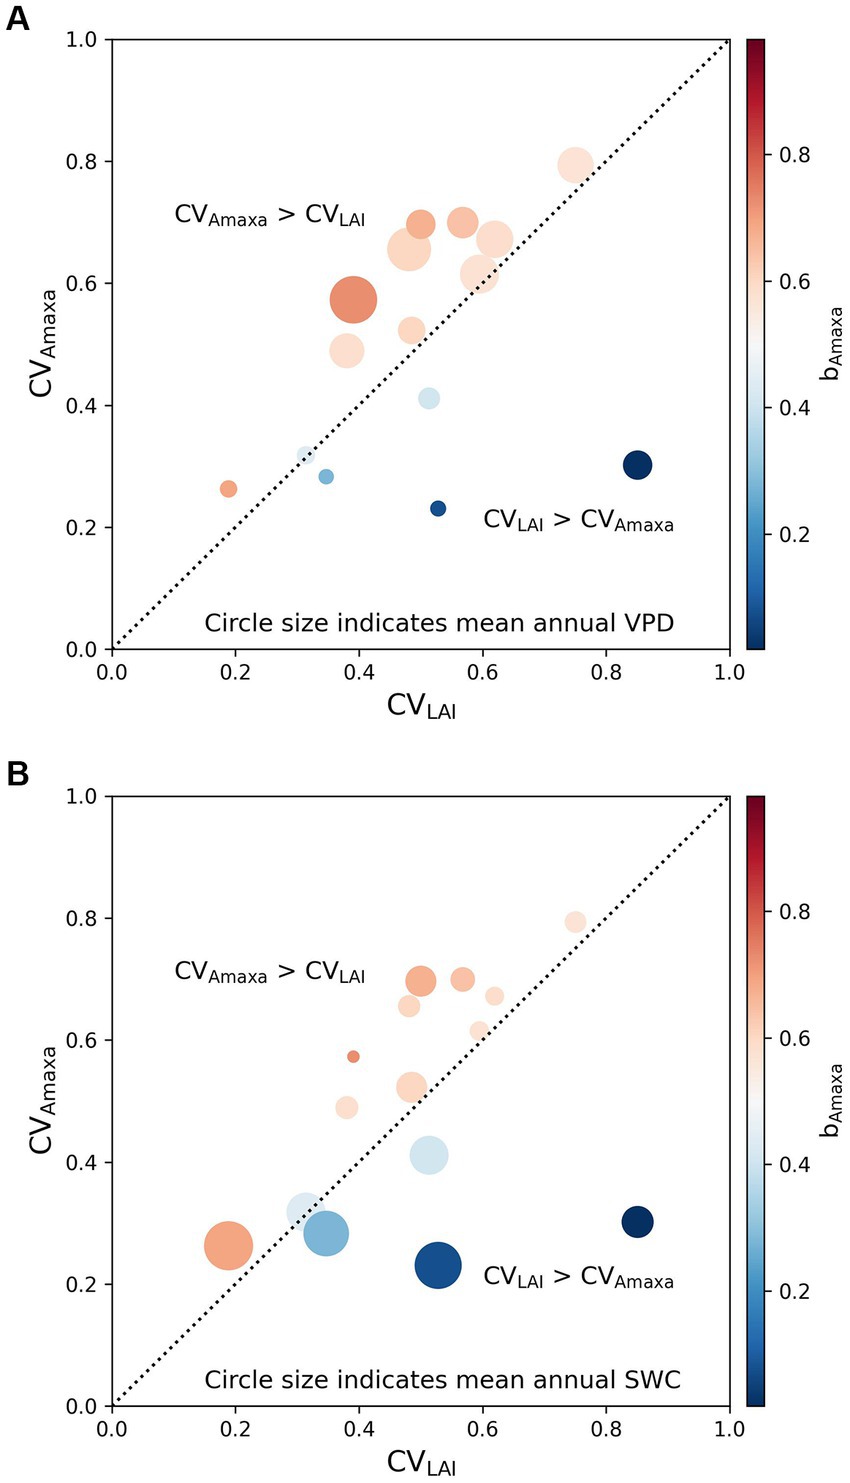
Figure 4. Effects of the relative magnitude of the temporal variability of Amaxa (CVAmaxa) and LAI (CVLAI) on the contribution of Amaxa to Amax (bAmaxa) with circle size indicates (A) mean annual VPD and (B) mean annual SWC. The color indicates the contribution of Amaxa to Amax (bAmaxa). bAmaxa > 0.5 represents the seasonal variation of Amax is driven more by Amaxa, while bAmaxa < 0.5 represents the seasonal variation of Amax is driven more by LAI. The black dotted line is a 1:1 line.
There are still some uncertainties in our estimation and analysis. The LAI data and Amax estimates used in this study had some uncertainty, which could propagate into Amaxa. To reduce the uncertainty of LAI, we tested whether the radius we used to extract LAI from the MODIS LAI dataset could have impacted the temporal dynamics of LAI. We extracted the average LAI of pixels within a 250, 500, 1,000, and 3,000 m radius centered at the flux tower. We found that these buffer sizes did not have much impact on the temporal dynamics in LAI. Then we assessed the influence of the uncertainty of the LAI dataset on Amaxa. Following He et al. (2014), we calculated the relative uncertainty in Amaxa induced by the uncertainty in LAI, which was expressed as the standard deviation for each LAI observation provided by the MODIS LAI dataset. The result (Table 5) showed that on average, the uncertainty in LAI could introduce 27.28% of uncertainty in Amaxa.
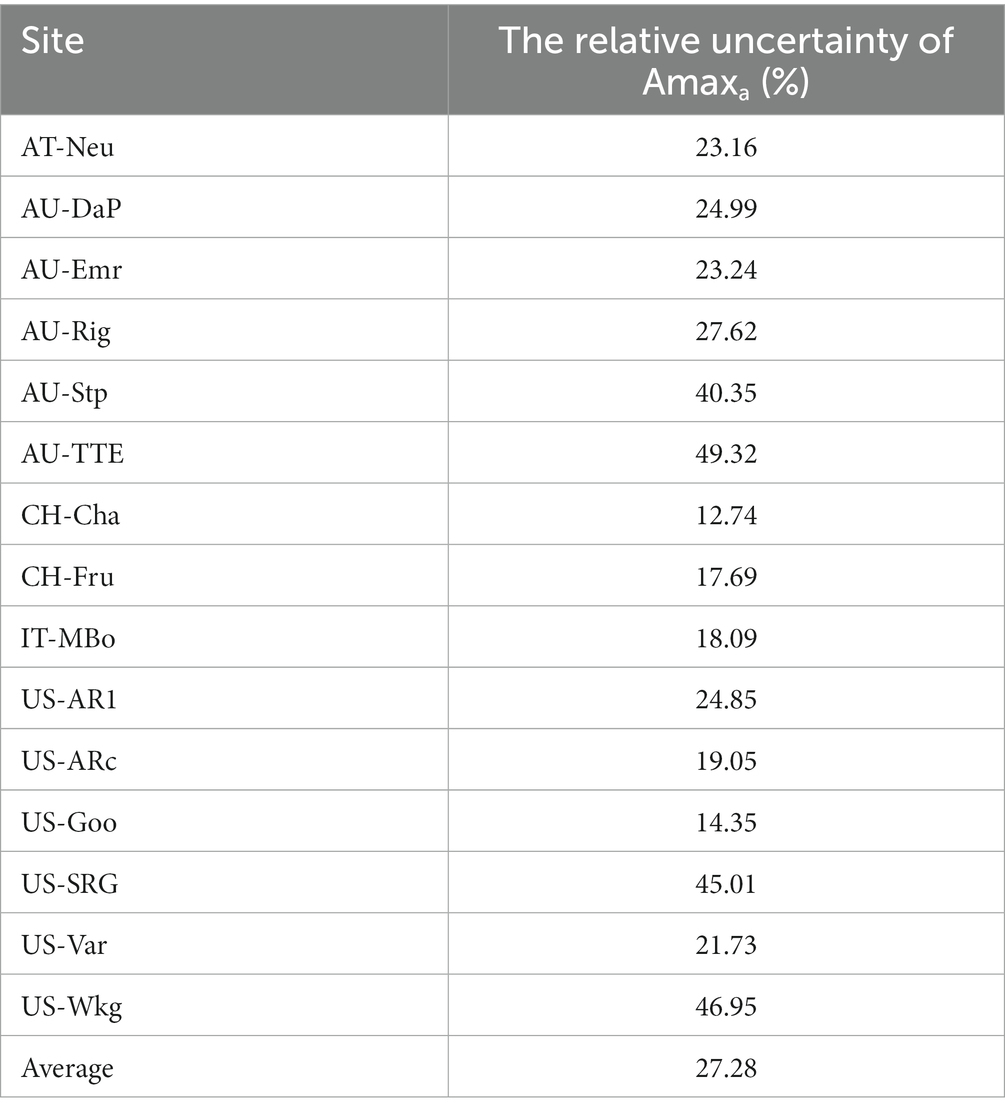
Table 5. The uncertainty in Amaxa induced by the uncertainty in LAI.
The uncertainty of Amax estimates was assessed by the fitting quality flag provided by the REddyProc package. The results were shown in Figure 5. On average, each site had 52% of the Amax estimates that were of good quality, 48% of moderate quality, and no bad quality estimates.
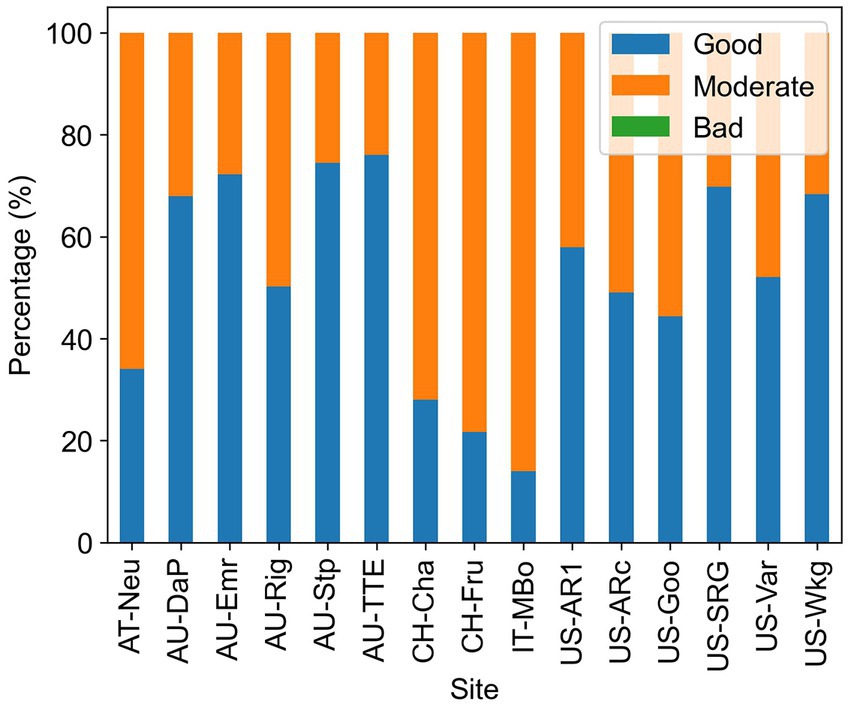
Figure 5. Percentage of the different qualities of the Amax estimates. High quality means all parameters in the fitted curve are within a reasonable range, moderate quality means the light response curve is fitted but some of the parameters are out of the reasonable range, and low quality means the light response curve cannot be well constrained using available data in 2 weeks.
The original contributions presented in the study are included in the article/supplementary material, further inquiries can be directed to the corresponding author.
XC: conceptualization, methodology, formal analysis, and writing (original draft). XR: conceptualization and editing. HH: conceptualization. LZ and YL: editing. All authors contributed to the article and approved the submitted version.
This work was supported by the National Natural Science Foundation of China (No. 42030509) and the Special Project on National Science and Technology Basic Resources Investigation of China (No. 2021FY100705).
The authors declare that the research was conducted in the absence of any commercial or financial relationships that could be construed as a potential conflict of interest.
All claims expressed in this article are solely those of the authors and do not necessarily represent those of their affiliated organizations, or those of the publisher, the editors and the reviewers. Any product that may be evaluated in this article, or claim that may be made by its manufacturer, is not guaranteed or endorsed by the publisher.
Ahlström, A., Raupach, M. R., Schurgers, G., Smith, B., Arneth, A., Jung, M., et al. (2015). The dominant role of semi-arid ecosystems in the trend and variability of the land CO2 sink. Sci. 348, 895–899. doi: 10.1126/science.aaa1668
Baldocchi, D., Ma, S., and Verfaillie, J. (2021). On the inter-and intra-annual variability of ecosystem evapotranspiration and water use efficiency of an oak savanna and annual grassland subjected to booms and busts in rainfall. Glob. Chang. Biol. 27, 359–375. doi: 10.1111/gcb.15414
Beck, H. E., Zimmermann, N. E., McVicar, T. R., Vergopolan, N., Berg, A., and Wood, E. F. (2018). Present and future Koppen-Geiger climate classification maps at 1-km resolution. Sci. Data 5:180214. doi: 10.1038/sdata.2018.214
Beringer, J., Hutley, L. B., Hacker, J. M., Neininger, B., and Paw U, K. T. (2011). Patterns and processes of carbon, water and energy cycles across northern Australian landscapes: from point to region. Agric. For. Meteorol. 151, 1409–1416. doi: 10.1016/j.agrformet.2011.05.003
Beringer, J., Hutley, L. B., McHugh, I., Arndt, S. K., Campbell, D., Cleugh, H. A., et al. (2016). An introduction to the Australian and New Zealand flux tower network – OzFlux. Biogeosciences 13, 5895–5916. doi: 10.5194/bg-13-5895-2016
Chu, H., Luo, X., Ouyang, Z., Chan, W. S., Dengel, S., Biraud, S. C., et al. (2021). Representativeness of Eddy-Covariance flux footprints for areas surrounding AmeriFlux sites. Agric. For. Meteorol. 301-302:108350. doi: 10.1016/j.agrformet.2021.108350
Feng, X., and Dietze, M. (2013). Scale dependence in the effects of leaf ecophysiological traits on photosynthesis: Bayesian parameterization of photosynthesis models. New Phytol. 200, 1132–1144. doi: 10.1111/nph.12454
Fu, Z., Ciais, P., Prentice, I. C., Gentine, P., Makowski, D., Bastos, A., et al. (2022). Atmospheric dryness reduces photosynthesis along a large range of soil water deficits. Nat. Commun. 13:989. doi: 10.1038/s41467-022-28652-7
He, H., Liu, M., Xiao, X., Ren, X., Zhang, L., Sun, X., et al. (2014). Large-scale estimation and uncertainty analysis of gross primary production in Tibetan alpine grasslands. J. Geophys. Res. Biogeo. 119, 466–486. doi: 10.1002/2013jg002449
Hollinger, D. Y., Goltz, S. M., Davidson, E. A., Lee, J. T., Tu, K., and Valentine, H. T. (1999). Seasonal patterns and environmental control of carbon dioxide and water vapour exchange in an ecotonal boreal forest. Glob. Chang. Biol. 5, 891–902. doi: 10.1046/j.1365-2486.1999.00281.x
Huang, A., Shen, R., Di, W., and Han, H. (2021). A methodology to reconstruct LAI time series data based on generative adversarial network and improved Savitzky-Golay filter. Int. J. Appl. Earth Obs. Geoinf. 105:102633. doi: 10.1016/j.jag.2021.102633
Hu, Z., Shi, H., Cheng, K., Wang, Y. P., Piao, S., Li, Y., et al. (2018). Joint structural and physiological control on the interannual variation in productivity in a temperate grassland: A data-model comparison. Glob. Chang. Biol. 24, 2965–2979. doi: 10.1111/gcb.14274
Joswig, J. S., Wirth, C., Schuman, M. C., Kattge, J., Reu, B., Wright, I. J., et al. (2021). Climatic and soil factors explain the two-dimensional spectrum of global plant trait variation. Nat. Ecol. Evol. 6, 36–50. doi: 10.1038/s41559-021-01616-8
Keenan, T. F., Migliavacca, M., Papale, D., Baldocchi, D., Reichstein, M., Torn, M., et al. (2019). Widespread inhibition of daytime ecosystem respiration. Nat. Ecol. Evol. 3, 407–415. doi: 10.1038/s41559-019-0809-2
Lasslop, G., Reichstein, M., Papale, D., Richardson, A. D., Arneth, A., Barr, A., et al. (2010). Separation of net ecosystem exchange into assimilation and respiration using a light response curve approach: critical issues and global evaluation. Glob. Chang. Biol. 16, 187–208. doi: 10.1111/j.1365-2486.2009.02041.x
Li, F., Peng, Y., Zhang, D., Yang, G., Fang, K., Wang, G., et al. (2019). Leaf Area Rather Than Photosynthetic Rate Determines the Response of Ecosystem Productivity to Experimental Warming in an Alpine Steppe. J. Geophys. Res. Biogeosci. 124, 2277–2287. doi: 10.1029/2019jg005193
Lloyd, J., and Taylor, J. A. (1994). On the temperature dependence of soil respiration. Funct. Ecol. 8, 315–323. doi: 10.2307/2389824
Luo, X., and Keenan, T. F. (2020). Global evidence for the acclimation of ecosystem photosynthesis to light. Nat. Ecol. Evol. 4, 1351–1357. doi: 10.1038/s41559-020-1258-7
Luo, Y., and Schuur, E. A. G. (2020). Model parameterization to represent processes at unresolved scales and changing properties of evolving systems. Glob. Chang. Biol. 26, 1109–1117. doi: 10.1111/gcb.14939
Ma, S., Baldocchi, D. D., Xu, L., and Hehn, T. (2007). Inter-annual variability in carbon dioxide exchange of an oak/grass savanna and open grassland in California. Agric. For. Meteorol. 147, 157–171. doi: 10.1016/j.agrformet.2007.07.008
Marcolla, B., Cescatti, A., Manca, G., Zorer, R., Cavagna, M., Fiora, A., et al. (2011). Climatic controls and ecosystem responses drive the inter-annual variability of the net ecosystem exchange of an alpine meadow. Agric. For. Meteorol. 151, 1233–1243. doi: 10.1016/j.agrformet.2011.04.015
Medvigy, D., Jeong, S.-J., Clark, K. L., Skowronski, N. S., and Schäfer, K. V. R. (2013). Effects of seasonal variation of photosynthetic capacity on the carbon fluxes of a temperate deciduous forest. J. Geophysical Res. Biogeosci. 118, 1703–1714. doi: 10.1002/2013jg002421
Moore, C. E., Brown, T., Keenan, T. F., Duursma, R. A., van Dijk, A. I. J. M., Beringer, J., et al. (2016). Reviews and syntheses: Australian vegetation phenology: new insights from satellite remote sensing and digital repeat photography. Biogeosciences 13, 5085–5102. doi: 10.5194/bg-13-5085-2016
O’Mara, F. P. (2012). The role of grasslands in food security and climate change. Ann. Bot. 110, 1263–1270. doi: 10.1093/aob/mcs209
Polley, H. W., Emmerich, W., Bradford, J. A., Sims, P. L., Johnson, D. A., Saliendra, N. Z., et al. (2010). Physiological and environmental regulation of interannual variability in CO2 exchange on rangelands in the western United States. Glob. Chang. Biol. 16, 990–1002. doi: 10.1111/j.1365-2486.2009.01966.x
Poulter, B., Frank, D., Ciais, P., Myneni, R. B., Andela, N., Bi, J., et al. (2014). Contribution of semi-arid ecosystems to interannual variability of the global carbon cycle. Nat. 509, 600–603. doi: 10.1038/nature13376
Raz-Yaseef, N., Billesbach, D. P., Fischer, M. L., Biraud, S. C., Gunter, S. A., Bradford, J. A., et al. (2015). Vulnerability of crops and native grasses to summer drying in the U.S. southern Great Plains. Agric. Ecosyst. Environ. 213, 209–218. doi: 10.1016/j.agee.2015.07.021
Reich, P. B., Sendall, K. M., Stefanski, A., Rich, R. L., Hobbie, S. E., and Montgomery, R. A. (2018). Effects of climate warming on photosynthesis in boreal tree species depend on soil moisture. Nat. 562, 263–267. doi: 10.1038/s41586-018-0582-4
Reichstein, M., Bahn, M., Mahecha, M. D., Kattge, J., and Baldocchi, D. D. (2014). Linking plant and ecosystem functional biogeography. Proc. Natl. Acad. Sci. U. S. A. 111, 13697–13702. doi: 10.1073/pnas.1216065111
Renton, M., and Poorter, H. (2011). Using log-log scaling slope analysis for determining the contributions to variability in biological variables such as leaf mass per area: why it works, when it works and how it can be extended. New Phytol. 190, 5–8. doi: 10.1111/j.1469-8137.2010.03629.x
Rogger, J., Hörtnagl, L., Buchmann, N., and Eugster, W. (2022). Carbon dioxide fluxes of a mountain grassland: drivers, anomalies and annual budgets. Agric. For. Meteorol. 314:108801. doi: 10.1016/j.agrformet.2021.108801
Runkle, B. R. K., Rigby, J. R., Reba, M. L., Anapalli, S. S., Bhattacharjee, J., Krauss, K. W., et al. (2017). Delta-flux: an Eddy covariance network for a climate-smart lower Mississippi Basin. Agric. Environ. Lett. 2:ael2017.01.0003. doi: 10.2134/ael2017.01.0003
Ryan, E. M., Ogle, K., Peltier, D., Walker, A. P., De Kauwe, M. G., Medlyn, B. E., et al. (2017). Gross primary production responses to warming, elevated CO(2), and irrigation: quantifying the drivers of ecosystem physiology in a semiarid grassland. Glob. Chang. Biol. 23, 3092–3106. doi: 10.1111/gcb.13602
Scott, R. L., Biederman, J. A., Hamerlynck, E. P., and Barron-Gafford, G. A. (2015). The carbon balance pivot point of southwestern U.S. semiarid ecosystems: insights from the 21st century drought. J. Geophys. Res. Biogeosci. 120, 2612–2624. doi: 10.1002/2015jg003181
Scott, R. L., Hamerlynck, E. P., Jenerette, G. D., Moran, M. S., and Barron-Gafford, G. A. (2010). Carbon dioxide exchange in a semidesert grassland through drought-induced vegetation change. J. Geophys. Res. 115:G03026. doi: 10.1029/2010JG001348
Wang, N., Quesada, B., Xia, L., Butterbach-Bahl, K., Goodale, C. L., and Kiese, R. (2019). Effects of climate warming on carbon fluxes in grasslands-a global meta-analysis. Glob. Chang. Biol. 25, 1839–1851. doi: 10.1111/gcb.14603
Way, D. A., and Yamori, W. (2014). Thermal acclimation of photosynthesis: on the importance of adjusting our definitions and accounting for thermal acclimation of respiration. Photosynth. Res. 119, 89–100. doi: 10.1007/s11120-013-9873-7
Wilson, K. B., Baldocchi, D. D., and Hanson, P. J. (2001). Leaf age affects the seasonal pattern of photosynthetic capacity and net ecosystem exchange of carbon in a deciduous forest. Plant Cell Environ. 24, 571–583. doi: 10.1046/j.0016-8025.2001.00706.x
Wohlfahrt, G., Hammerle, A., Haslwanter, A., Bahn, M., Tappeiner, U., and Cernusca, A. (2008). Seasonal and inter-annual variability of the net ecosystem CO(2) exchange of a temperate mountain grassland: effects of climate and management. J. Geophys. Res. Atmos. 113:D08110. doi: 10.1029/2007jd009286
Xu, Z., and Zhou, G. (2011). Responses of photosynthetic capacity to soil moisture gradient in perennial rhizome grass and perennial bunchgrass. BMC Plant Biol. 11:21. doi: 10.1186/1471-2229-11-21
Zhang, L.-M., Yu, G.-R., Sun, X.-M., Wen, X.-F., Ren, C.-Y., Fu, Y.-L., et al. (2006). Seasonal variations of ecosystem apparent quantum yield (α) and maximum photosynthesis rate (Pmax) of different forest ecosystems in China. Agricul. Forest Meteorology 137, 176–187. doi: 10.1016/j.agrformet.2006.02.006
Zeeman, M. J., Hiller, R., Gilgen, A. K., Michna, P., Plüss, P., Buchmann, N., et al. (2010). Management and climate impacts on net CO2 fluxes and carbon budgets of three grasslands along an elevational gradient in Switzerland. Agric. For. Meteorol. 150, 519–530. doi: 10.1016/j.agrformet.2010.01.011
Keywords: maximum photosynthetic capacity (Amax), grasslands, LAI, soil moisture, vapor pressure deficit
Citation: Chen X, Ren X, He H, Zhang L and Lv Y (2023) Seasonal variation of ecosystem photosynthetic capacity and its environmental drivers in global grasslands. Front. Ecol. Evol. 11:1193607. doi: 10.3389/fevo.2023.1193607
Edited by:
Cuicui Jiao, Sichuan University of Science and Engineering, ChinaReviewed by:
Min Liu, East China Normal University, ChinaCopyright © 2023 Chen, Ren, He, Zhang and Lv. This is an open-access article distributed under the terms of the Creative Commons Attribution License (CC BY). The use, distribution or reproduction in other forums is permitted, provided the original author(s) and the copyright owner(s) are credited and that the original publication in this journal is cited, in accordance with accepted academic practice. No use, distribution or reproduction is permitted which does not comply with these terms.
*Correspondence: Xiaoli Ren, cmVueGxAaWdzbnJyLmFjLmNu
Disclaimer: All claims expressed in this article are solely those of the authors and do not necessarily represent those of their affiliated organizations, or those of the publisher, the editors and the reviewers. Any product that may be evaluated in this article or claim that may be made by its manufacturer is not guaranteed or endorsed by the publisher.
Research integrity at Frontiers
Learn more about the work of our research integrity team to safeguard the quality of each article we publish.