 Rui Jiang
 Jingfeng Liu
 Weigang Liu2
95% of researchers rate our articles as excellent or good
Learn more about the work of our research integrity team to safeguard the quality of each article we publish.
Find out more
ORIGINAL RESEARCH article
Front. Ecol. Evol. , 23 August 2023
Sec. Environmental Informatics and Remote Sensing
Volume 11 - 2023 | https://doi.org/10.3389/fevo.2023.1193059
Introduction: As a vital component of the ecosystem of the Qinghai-Tibet Plateau, alpine wetlands coexist with their vulnerability, sensitivity, and abundant biodiversity, propelling the material cycle and energy flux of the entire plateau ecosystem. In recent decades, climate change and human activities have significantly altered the regional landscape. Monitoring and assessing changes in the alpine wetlands on the Qinghai-Tibet Plateau requires the efficient and accurate collection of long-term information.
Methods: Here, we interpreted the remote sensing data of the first meander of the Yellow River of alpine wetlands from 1990 to 2020 based on Google Earth Engine (GEE) platform, using geographic information system (GIS) and landscape pattern index to analyze the spatial and temporal evolution of wetland landscape patterns, and the primary drivers of changes in wetland area were explored by GeoDetector.
Results: Our result showed that most wetland areas were found in regions with gradients less than 12° and elevations between 3315 and 3600 m. From 1990 to 2010, the area of alpine wetland in the study area decreased by 25.43%. During the period between 2010 and 2020 to the 1990s, the wetland area decreased by 322.9 km2. Conversion to and from grassland was the primary form of wetland transfer out and in, respectively. The overall migration of the wetland centroid in the study area was to the southwest between 1990 and 2010 and to the north between 2010 and 2020. The geometry of the wetland landscape was relatively simple, the landscape was relatively intact, and patches retained a high level of agglomeration and connectivity. However, their level of agglomeration and connectivity was disrupted. A quantitative analysis of the factor detector in GeoDetector revealed that the DEM, slope, and evaporation were the most important driving factors influencing the change of wetland area, with socioeconomic development also influencing changes in the wetland area to a lesser extent.
Discussion: Using interaction detectors, it was discovered that the interaction of various driving factors could better explain the long-term variations in wetland areas, with a greater degree of explanation than that of each driving factor alone.
Wetlands are areas where the soil is frequently or excessively saturated with water and where plant life is active throughout the growing season. They cover at least 6% of the Earth’s surface and are one of the most important and threatened ecosystems on the planet. Wetlands are indispensable for regulating water flows, hydrological and biogeochemical cycles, and climate change (Junk et al., 2013; Maleki et al., 2021). In addition, they provide vital ecosystem functions (Wondie, 2018). Alpine wetlands are a distinct type of wetland ecosystem that regulates the local climate and are one of the most important biological water sources on the Qinghai-Tibet Plateau (Li W. et al., 2020). However, the degradation and contraction of alpine wetland habitats on the Qinghai-Tibet Plateau is becoming increasingly severe (Hou et al., 2020).
The Zoige Alpine Wetland is located on the eastern edge of the Qinghai-Tibet Plateau. It is the most representative alpine wetland on the Qinghai-Tibet Plateau in terms of its apparent characteristics (Zhao and Song, 2004). The numerous lakes and wetland swamps dispersed across the territory comprise the entire water system of the Yellow River’s upper reaches. There has been a steady decline in the environmental quality of the Yellow River’s key water supply regions since the 1980s. Approximately 80% of the natural grasslands have been degraded to varying degrees, wetland landscapes have shrunk, areas affected by desertification have continued to expand, and soil erosion has intensified (Liang et al., 2009; Fu et al., 2012; Li et al., 2013; Yue et al., 2018; Fei et al., 2019; Che et al., 2022). Studies of the dual response of wetland landscape changes to the natural environment and human productivity in high-altitude ecologically sensitive areas have become a popular topic in this field, particularly as global warming and human activities intensify (Shen et al., 2014; Li et al., 2021). When considering the primary factors of wetland degradation, climate change is the most important factor over a small-scale spatiotemporal range, particularly for remote river sources and high-altitude regions (Wang et al., 2020; Zhang et al., 2021; Zhang B. et al., 2022). Wetland ecosystems do not simply respond to natural changes and the impact of human activities and the interaction between various natural factors must also be considered. With increasing economic development, human activities further aggravate the degradation of wetlands through population growth, animal husbandry, and tourism (Yan and Wu, 2005; Bai et al., 2013; Dong et al., 2020; Yan et al., 2022).
Due to its broad coverage, real-time information collection, convenient acquisition, and strong periodicity, remote sensing has progressively evolved into an effective tool for ecological research (Roughgarden et al., 1991; Li J. et al., 2020; Chen et al., 2023). It also provides novel monitoring techniques and technical assistance for wetland resources (Bwangoy et al., 2010; Amani et al., 2021; Fekri et al., 2021). The identification and extraction of wetland information is the basis of wetland change analysis and wetland ecosystem protection. Studies of wetland change rely on long-term data accumulation, with the aim of obtaining accurate and quantitative wetland location information at both the temporal and spatial scales. Due to the wetland distribution accuracy requirements in wetland research, there is an urgent need for improvements in wetland remote sensing information extraction technology. Traditionally, the monitoring of changes in wetlands through remote sensing has been largely based on visual interpretation (Bai et al., 2013; Mabwoga and Thukral, 2014; Shen et al., 2019a). In recent years, new remote sensing classification algorithms, such as the simple and effective spatial-spectral (SESS) (Sun et al., 2021), decision-tree (DT) (Berhane et al., 2018), object-based image analysis (OBIA) (Zhou et al., 2021), artificial neural network (ANN) (Saha et al., 2021) and support vector machine(SVM) methods (Sadeghi et al., 2012), have been used in wetland information extraction applications. Although most classification methods have a high degree of accuracy, they suffer from drawbacks such as complex preprocessing and performance limitations, as well as being time-consuming and labor-intensive. The Google Earth Engine is a remote sensing-based platform for global geospatial analysis. Due to its high computing capacity and advantages in online data processing and visual analysis, it has been widely applied in several fields, including land cover and land use classification, hydrology, urban planning, natural disaster prediction, and climate change assessments (Amani et al., 2020; Barboza Castillo et al., 2020; Liu et al., 2020; Yang et al., 2021; Yan et al., 2022).
The alpine wetland at the first meander of the Yellow River is essential for climate regulation and regional ecological environment improvement in both the upper reaches of the Yellow River and the entire Qinghai-Tibet Plateau, and is directly linked to the economic growth and sustainable development of the Yellow River Basin. The degradation of the alpine habitat in the first meander of the Yellow River is the consequence of a combination of natural and anthropogenic factors. Previous studies have investigated the primary mechanism of wetland degradation due to natural and human factors, but these studies have primarily focused on natural factors. There have been relatively few quantitative studies of the driving forces of wetland degradation, particularly the quantitative identification of driving forces under the influence of climate change and human activities. This study focused on the first meander of the Yellow River and explored the changing characteristics and driving forces of the alpine wetland from 1990 to 2020.
The Yellow River surrounds Maqu County from the south, north and east. As it flows through the Maqu grassland, it forms the first meander of the Yellow River. The upper sections of the Yellow River are one of the most important ecological water conservation zones in China (Chu et al., 2014). The main stream of the Yellow River flows through the Maqu grassland with a diameter of 433 km and a drainage area of 10,190 km2, accounting for 59% of the area of the Yellow River basin in Gansu Province. The water supply accounts for 58.7% of the total runoff in the source area of the Yellow River (Zhang T. et al., 2022). Based on a hydrological analysis. Using digital elevation model (DEM) data with a resolution of 30 m and taking the Yellow River into and out of Maqu County as the control points, the small watershed of Maqu where the Yellow River is located was extracted as the study area. The Yellow River control basin of Maqu is located in the eastern extension of the Qinghai-Tibet Plateau (32°16’-34°51’N, 100°76’-103°41’E), at the junction of Gansu, Qinghai, and Sichuan provinces. Administratively it is under the jurisdiction of Maqu County, Luqu County, Aba County, and Henan Mongolian Autonomous County. The total area is 30,000 km2, with an elevation of 3315−4984 m, and the terrain is high in the northwest and low in the southeast (Figure 1). The Yellow River originates from Qinghai and becomes a river in Maqu (Li et al., 2012). The district is an important area for water conservation in the upper levels of the Yellow River. This area has a dry and cold plateau continental alpine humid climate with long winters and brief summers. It has an average annual temperature of 2.15°C (Zhang et al., 2011). It is a moist region as a result of the average annual precipitation of 680.52 mm, which is concentrated from July to September when 80% of the annual precipitation is received (Zhang B. et al., 2022). Resources for plants and animals are plentiful, with the vegetation mainly being plateau shrub meadow and swamp vegetation (Zhang et al., 2007). It is the largest alpine swamp wetland in China and contains the Gansu Yellow River Shouqu Nature Reserve and Zoige National Wetland Park.
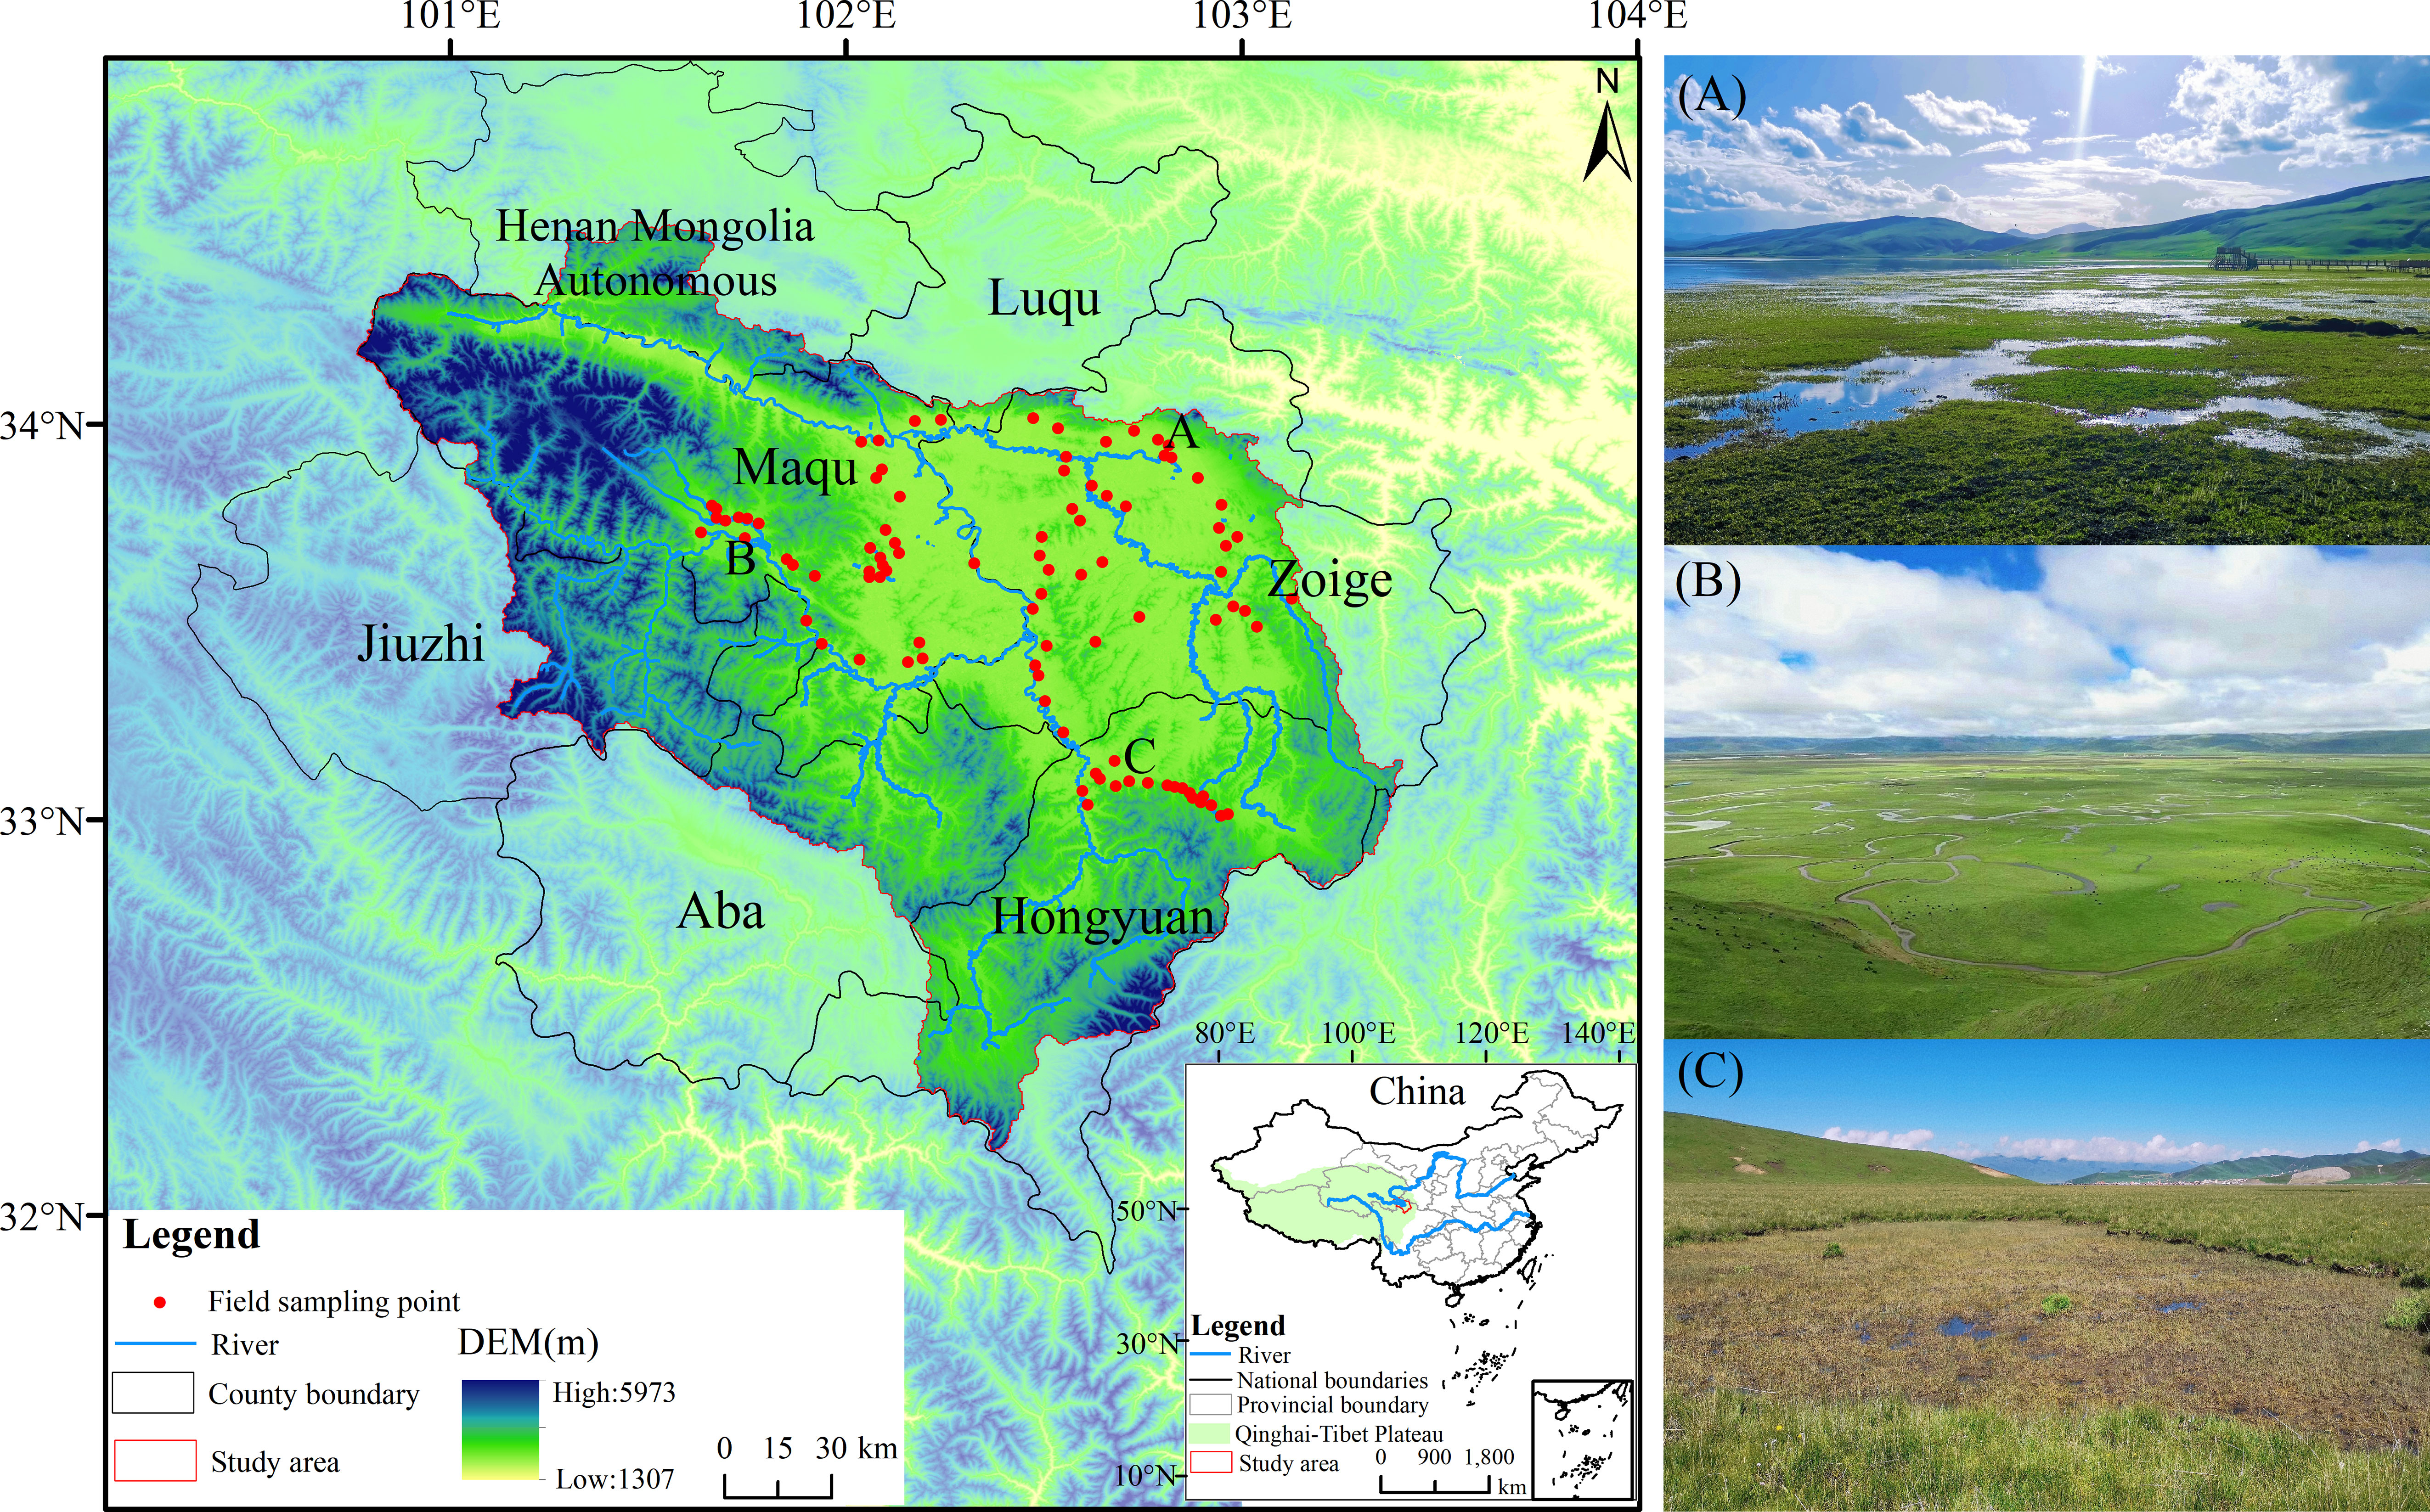
Figure 1 Schematic diagram of study area location.
This study mainly uses remote sensing data, land use data and driving factor data. The driving factors mainly include topographic factors, meteorological factors and socioeconomic factors. The data sets and data source information used in this study are shown in Table 1.
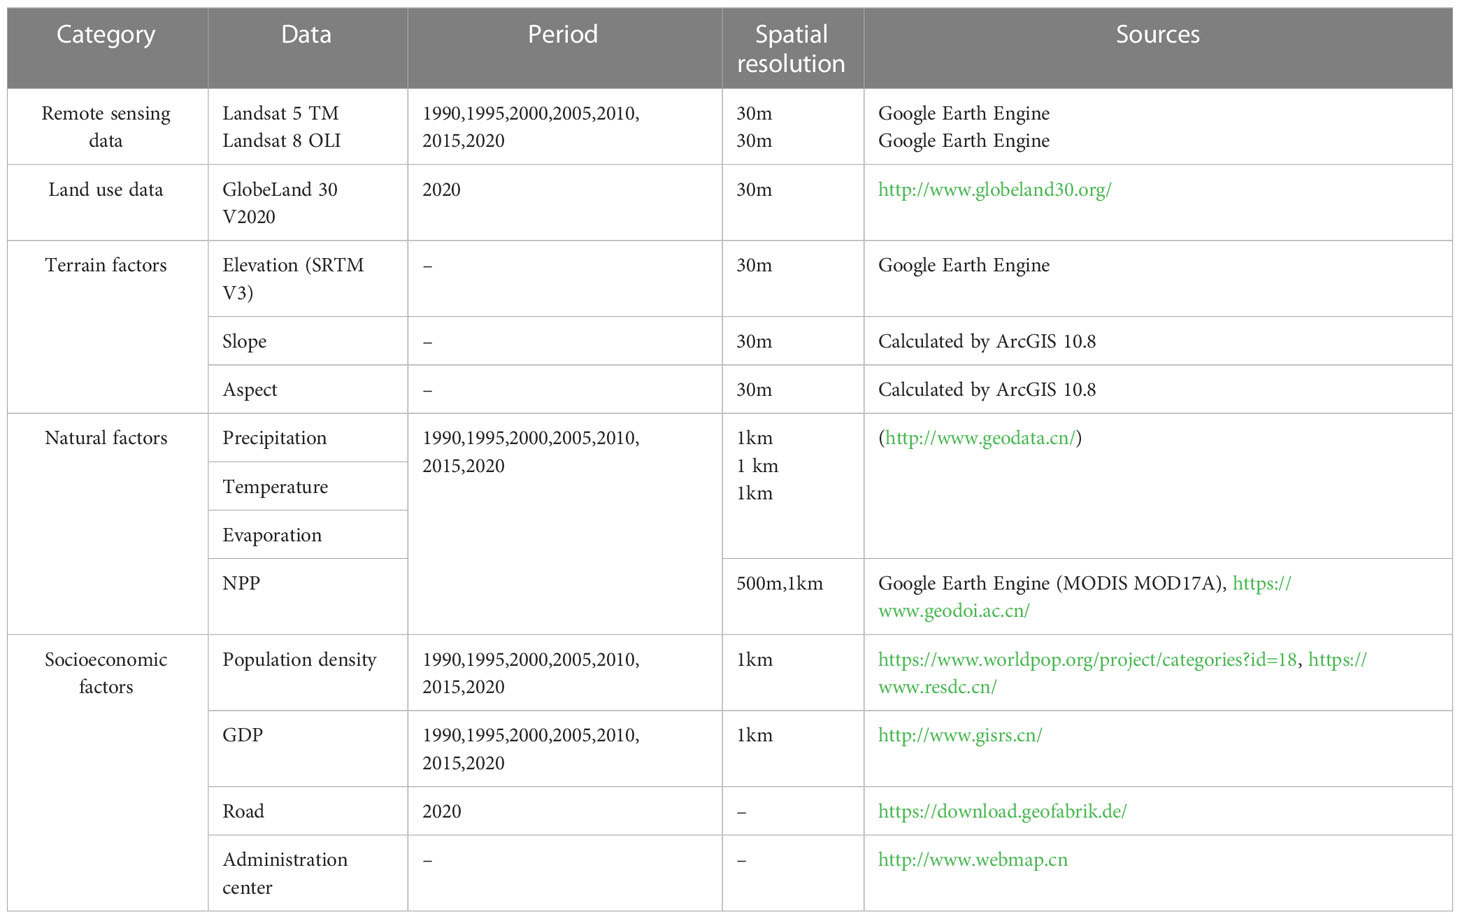
Table 1 Information on datasets and data sources used in this study.
Based on the GEE platform, Landsat TM/OLI satellite images for seven time periods from 1990 to 2020 were selected, and the 1989 images were finally chosen as a replacement due to the high image cloud coverage in the 1990 study period. The vegetation in the region is withered in winter and spring, precipitation is scarce and the remote sensing images are monotonous in color and low in brightness, which is not conducive to feature identification and classification, while summer and autumn are the best seasons for remote sensing monitoring of wetlands due to the high temperature, abundant precipitation, and the best growth of wetland vegetation. Therefore, based on the built-in function set of the GEE platform, remote sensing data was selected from June to September to realize preprocessing operations such as rapid data screening, image cloud masking, splicing, and cropping, and 4, 3, 2 and 5, 4, 3 band combinations were used for TM and OLI data respectively.
In this study, we acquire land cover findings for the study region from 1990 to 2020 based on the GEE platform, and then assess the extent, distribution, and variations of alpine wetland. Finally, we explored the driving factors for the area change of alpine wetlands (Figure 2).
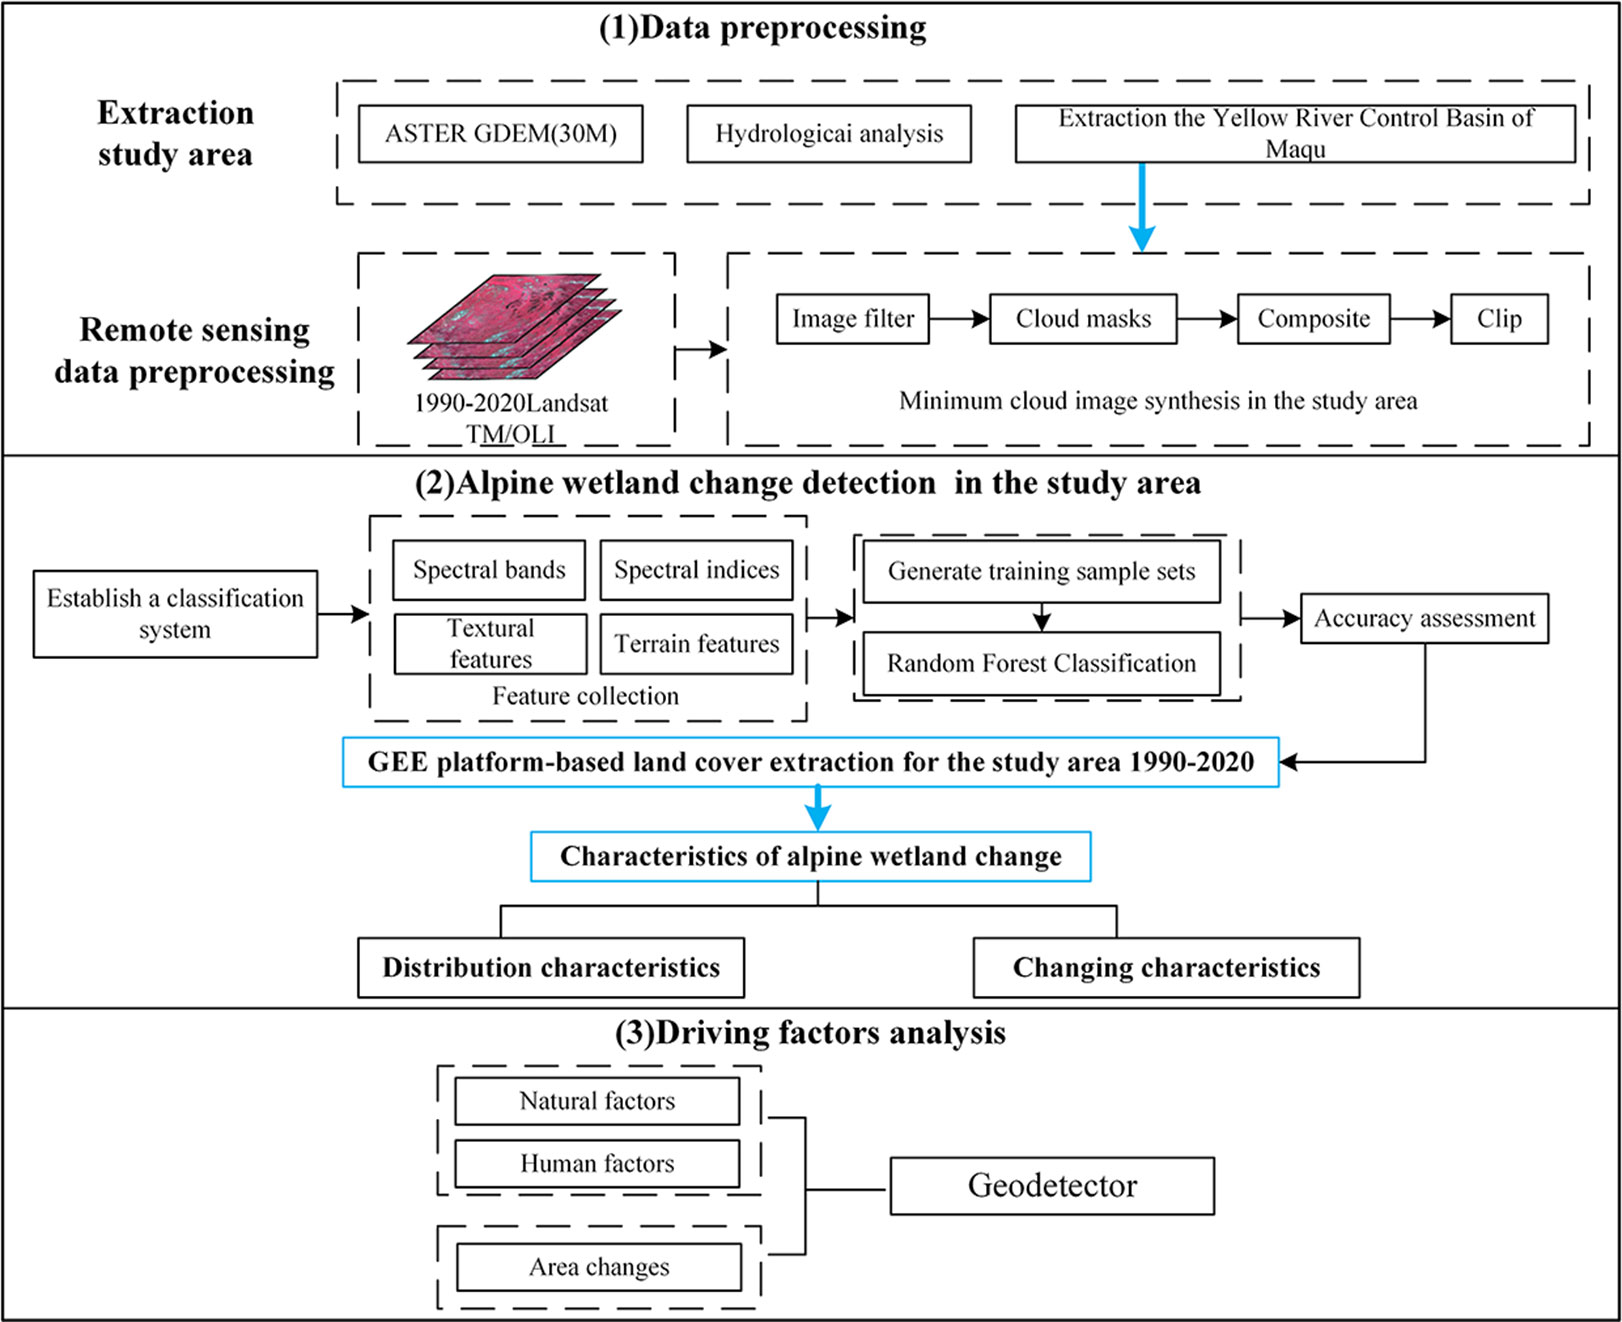
Figure 2 Flow chart for the analysis of this study.
The land cover classification system for remote sensing in the study area was established with reference to the classification standards of wetlands in the international Convention on Wetlands and the domestic National Wetland Resources Survey and Monitoring Technical Regulations. The wetland types in the study area were mainly swamp wetland, wet meadow, and swamp meadow. In this study, the three wetland types were grouped together, and together with the total area of all water bodies were defined as the area of wetlands in the study area. The other landscape categories in the study area were forest, grassland, bare land, and construction land, and samples were selected and generated from the Landsat series of images using the GEE platform to create a training sample set.
The classification features used for wetland information extraction mainly included spectral indices, texture features, and terrain data. First, the spectral bands of the image were selected from the red, green, blue, near infrared, and short-wave infrared bands that were similar to the spectral bands of Landsat 8/OLI and Landsat 5/TM. The vegetation and water body indices were more stable than the single bands when reflecting land cover types. Combining vegetation and water body indices for classification can improve the accuracy of image classification to a certain extent. The normalised difference water index (McFeeters, 1996), improved normalised difference water index (Xu, 2006), the normalised difference vegetation index (Tucker, 1979), normalized building index (Li and Chen, 2018), the land surface water index (Özelkan, 2020), and the enhanced vegetation index were selected (Huete et al., 2002).
Texture features are an important attribute of remotely sensed images and are an important basis for identifying different feature types (Wan et al., 2018). The Gray-Level Co-occurrence Matrix (GLCM) is a classical statistical method used to analyse texture features of images (Haralick et al., 1973). The study area has a complicated topography, and the wetlands are mostly located in plains with flat terrain and gentle slopes. The classification features also incorporate auxiliary classification feature data related to topographic factors. All characteristic variables are described in Table 2.
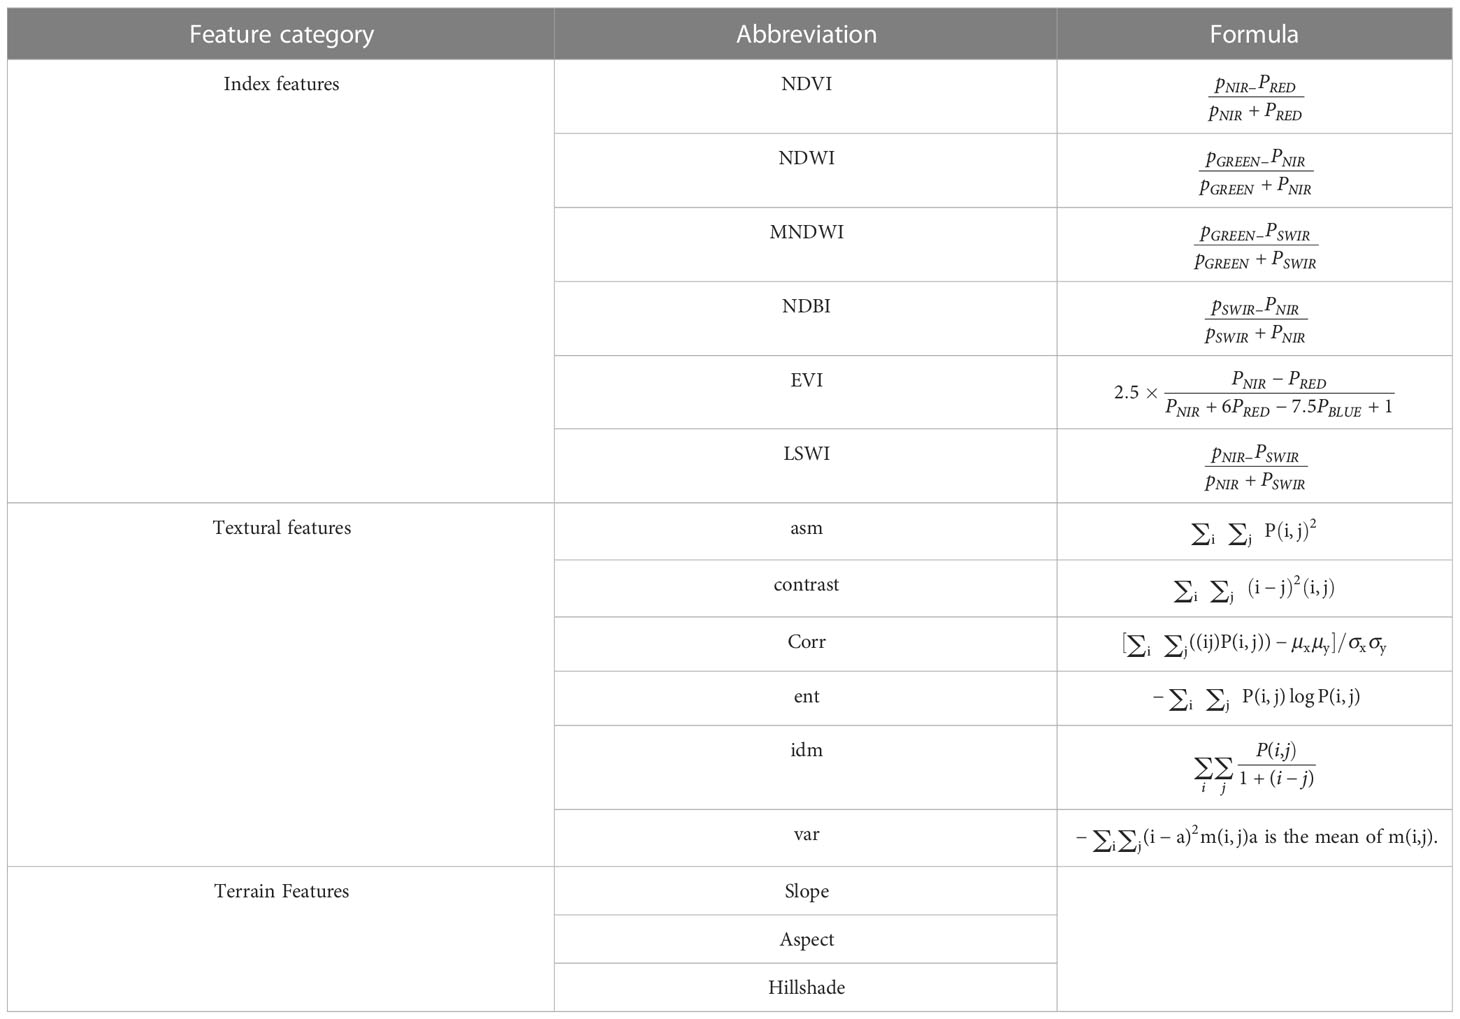
Table 2 The formula of each classification feature variable.
The Random Forest (RF) algorithm was used to classify remote sensing images in this study. The RF is an algorithm for machine learning proposed by Leo Breiman in 2001 (Breiman, 2001a). The advantages of this method are its speed, effectiveness, and stability compared to alternative algorithms and its classification accuracy is also high (Breiman, 2001b; Rodriguez-Galiano et al., 2012; Ye et al., 2021). The RF is an integrated learning model based on the decision tree as the basic classifier. It includes several trained decision trees. When the samples to be classified are input, multiple trees are used to train the samples and the output of the tree is voted on. The number of decision trees in this study is 50, and each node has five attributes to choose from. The final classification model can be expressed as:
In the formula, H (x) is the random forest model, Cj is the category j mark, T is the number of decision trees, and hi is the i th decision tree.
To evaluate the accuracy of the classification results, 80% of the sample data are chosen as training samples, while 20% of the samples are chosen as verification data. The confusion matrix of the classification results, kappa coefficient, overall accuracy (OA), producer accuracy (PA) and user accuracy (UA) were calculated to evaluate the accuracy of the classification results. The specific formula is as follows:
(1) Kappa Coefficient
Po is the total sample classification accuracy, ai is the true number of samples in class i, bi is the predicted value of the sample, n is the total number of samples.
(2) Overall accuracy (OA)
Nr is the number of correctly classified samples, and Na is the total number of samples.
(3) Producer Accuracy (PA)
Nir is the number of samples that are correctly classified as class i, and Nia is the number of real reference samples of class i.
(4) User accuracy (UA)
Nir is the number of samples that are correctly classified into class i, and Nia is the number of samples that are classified into class i.
The land use transition matrix was derived through a system analysis using a quantitative description of the system state and state transfer (Yang et al., 2020). The land use transition matrix reflected the quantitative characteristics of the changes in area of each land use class following transitions in the region (Huang et al., 2021). The formula is as follows:
where: S denotes the area; Sij denotes the area where land use type i at the beginning is transferred to land use type j at the end; i, j (i, j=1, 2,…, n) indicates the kind of land use at the start and the conclusion of the research period.
The centroid is essential when characterizing the spatial distribution of geographical elements. Using ArcGIS 10.8 software, the wetlands were weighted by area to obtain the centroid of wetlands in each year and the dynamic migration trend of the distribution. If the wetland developed in a balanced manner in all spatial dimensions, its centroid remained basically unchanged; if it increased or decreased significantly in a certain direction, its centroid shifted significantly (Zhou et al., 2020; He et al., 2023). Following is the formula:
Where Xt and Yt indicate, in turn, the latitude and longitude of the distribution centre for a certain land use category in year t, Cti represents the area of the type of the i-th community; Xt and Yt denote the latitude and longitude coordinates of the geometric centre of the i-th cell respectively.
In the related discipline of landscape ecology, the landscape index is a frequently employed quantitative research method for analyzing the evolution of landscape patterns (Liu et al., 2014; Mu et al., 2021; Yang et al., 2022). This study selects the Patch Cohesion Index (COHESION), Patch Density (PD), Landscape Shape Index (LSI) and Shannon’s Diversity Index (SHDI), with the conceptual and ecological significance of their related indices as shown in Table 3:
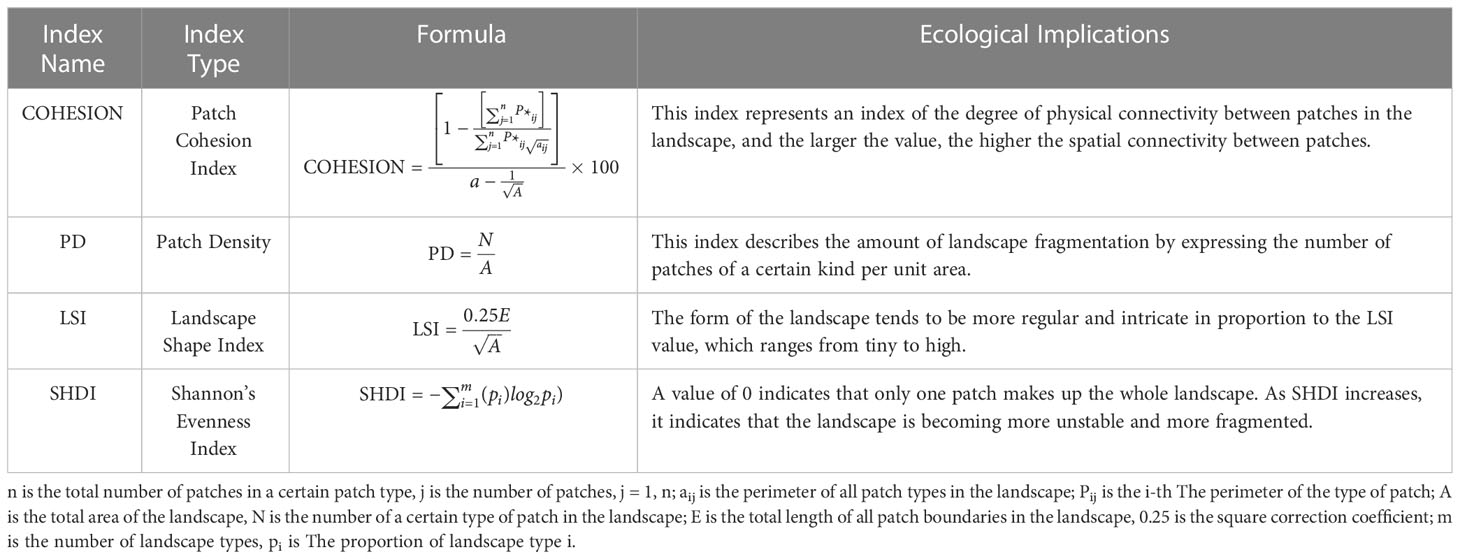
Table 3 Types, formulae and ecological significance of landscape pattern indexes.
Geodetector is a statistical method used to study spatial heterogeneity among data and to reveal the driving forces of spatial distributions. It is widely used in the analysis of the mechanisms that drive different land uses (Zhu et al., 2020). In this study, to analyze the factors that cause changes in wetland areas, we primarily employed factor probes and interaction probes in geographic probes. Among them, one-way detection was used to detect the strength of the explanatory power of a factor X on variable Y. The value q was denoted by q∈[0, 1], and the magnitude of the value was autocorrelated with the strength of the explanatory power of X on Y (Huo and Sun, 2021). The q value is calculated as follows:
where L is the stratification of variable Y or factor X, Nh and N represent the number of cells in a given stratum and the whole area, and σ2 are the sum of variances in a particular stratum and the whole region, respectively, and SSW and SST are the sum of variances within a stratum and the total variance in the whole region, respectively.
The primary objective of the interaction detection was to determine if the driving forces and the interaction’s intensity interacted, i.e., the change in the explanatory power of the variable Y after the combination of different factors X. The principle was to calculate the values of q(X1) and q(X2) separately from q(X1∩X2) and determine the mode of interaction by comparing the magnitude of the values (Wang et al., 2022). The interaction relationship among the driving factors is shown in Table 4.
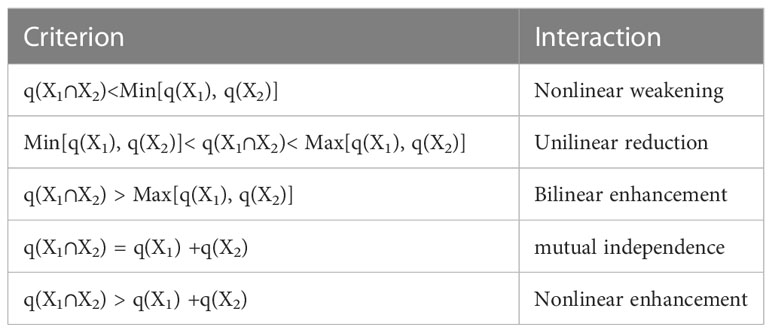
Table 4 Types of interactions.
Based on Google Earth high-resolution images and 96 data points from a field survey conducted in the study area in June 2023 (Figure 1), the accuracy of the sample set was selected, compared, supplemented, and verified and its OA, Kappa coefficient, UA, and PA were calculated (Figure 3) . The results showed that the average OA value of the seven-period classification results was 86.83% (81.25%-91.37%), the average kappa coefficient was 0.83 (0.79-0.89), the average PA value was 84.33%, and the average UA value was 85.18. The average classification accuracy of each category was higher than 77%, and the classification accuracy of water bodies and wetlands was relatively stable and high. These results show that the remote sensing classification results had a high degree of accuracy and met the requirements of follow-up research.
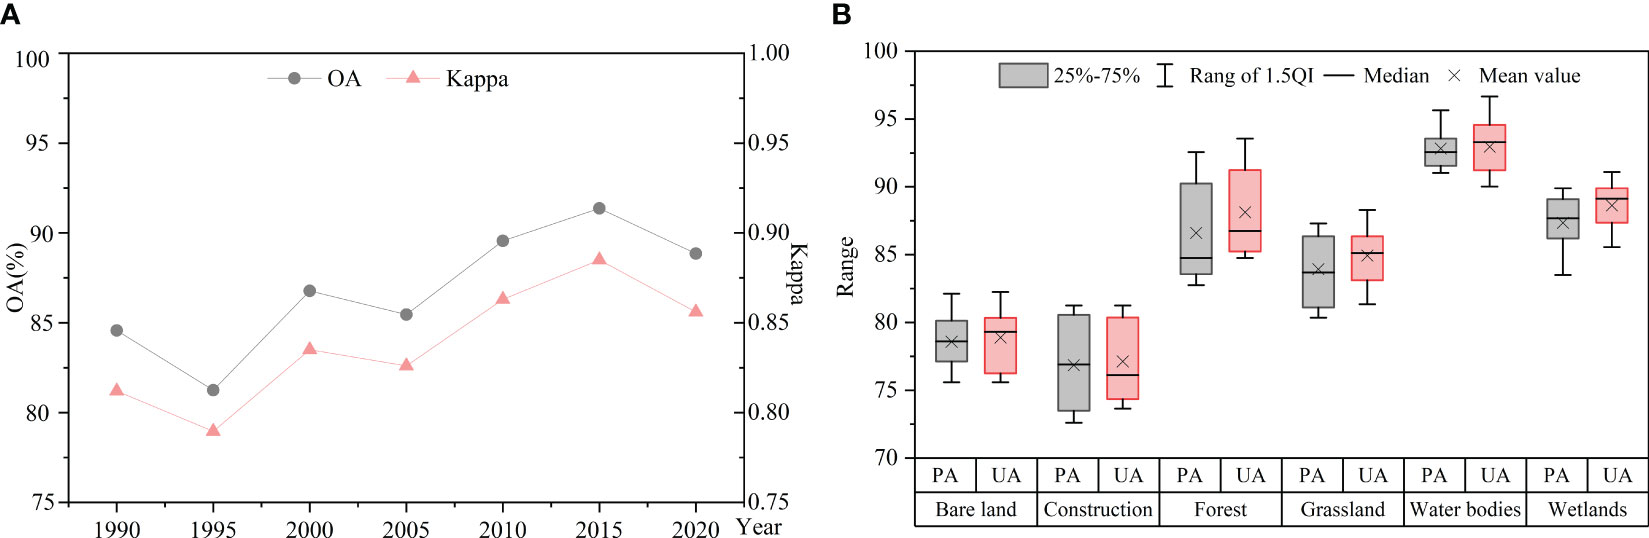
Figure 3 The accuracy of classification results. (A) OA and kappa coefficient, (B) PA and UA.
Additionally, we selected the GlobeLand30 V2020 data product for a comparison with the classification results from our research and further assessed their accuracy (Figure 4). For 2020, we selected three typical wetland areas (A, B, and C) and evaluated the 2020 classification outcomes by visually assessing how well the outcomes matched the growing season images. The visual check revealed that the geographic distribution of our categorization outcomes was uniform. Overall, the classification results were shown to have a good degree of accuracy and satisfied the demands of the wetland analysis.
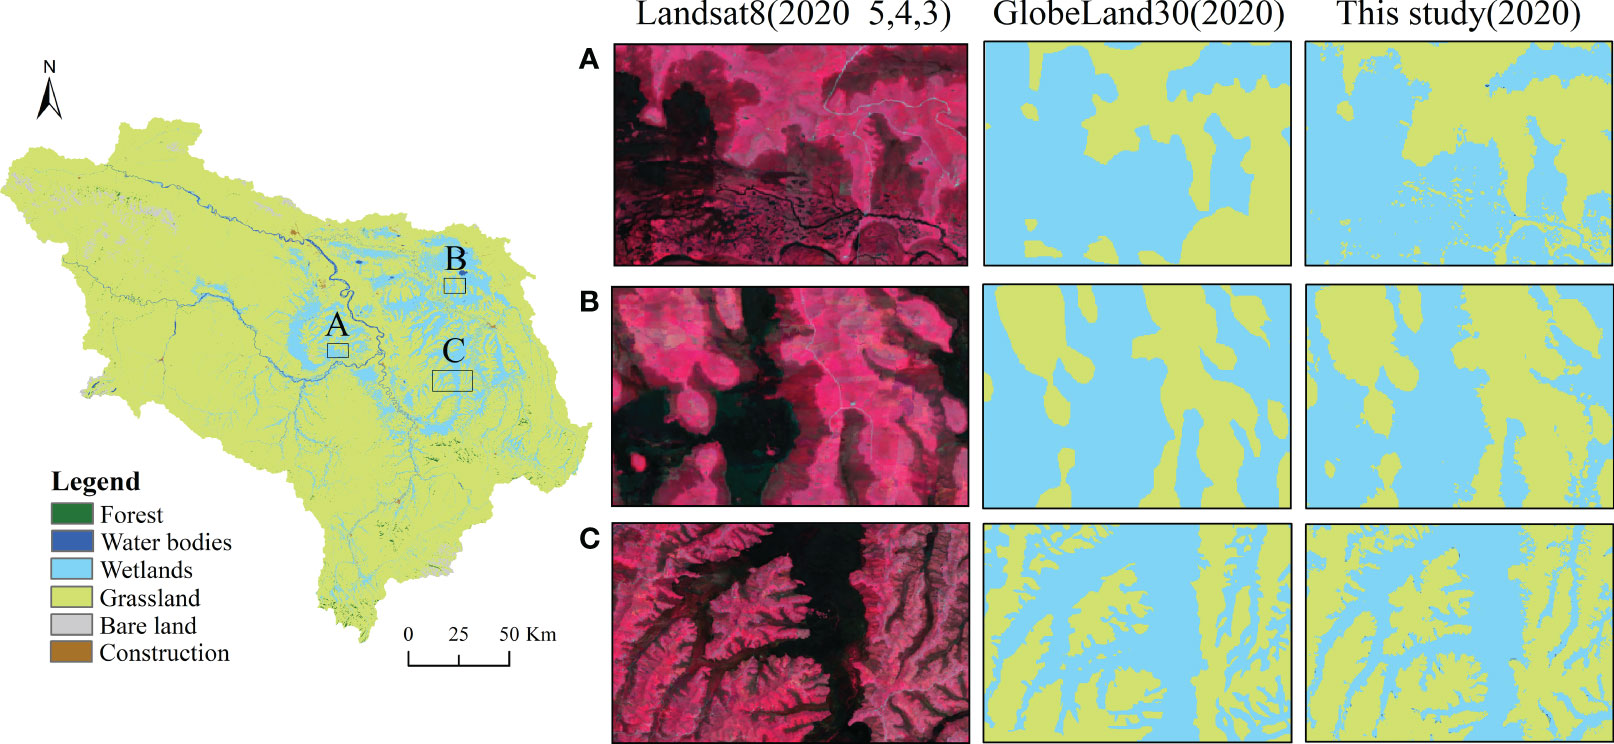
Figure 4 Comparison of classification results (A, B, and C are three wetland areas; the left is the Landsat 8 image of the growing season, the middle is the GlobeLand30 product in 2020; the right is the classification result of this study in 2020.).
A statistical analysis of the wetland information extracted from the seven time periods in the study area showed that the wetland area and its spatial distribution had clearly changed from 1990 to 2020 (Figure 5). Between 1990 and 2010, the area of alpine wetlands declined, but from 2010 to 2020 it grew steadily. The wetland area was largest in 1990, accounting for 14.4% of the study area’s overall size, The wetland area decreased from 4349.15 km2 in 1990 to 3242.94 km2 in 2010, i.e., a total reduction of 1106.21 km2 (25.43%) in 20 years. The wetland area then increased from 3242.94 km2 in 2010 to 4023.16 km2 in 2020, i.e., a total increase of 783.22 km2 in 10 years, but compared with 1990, the wetland area had still decreased by 322.99 km2.
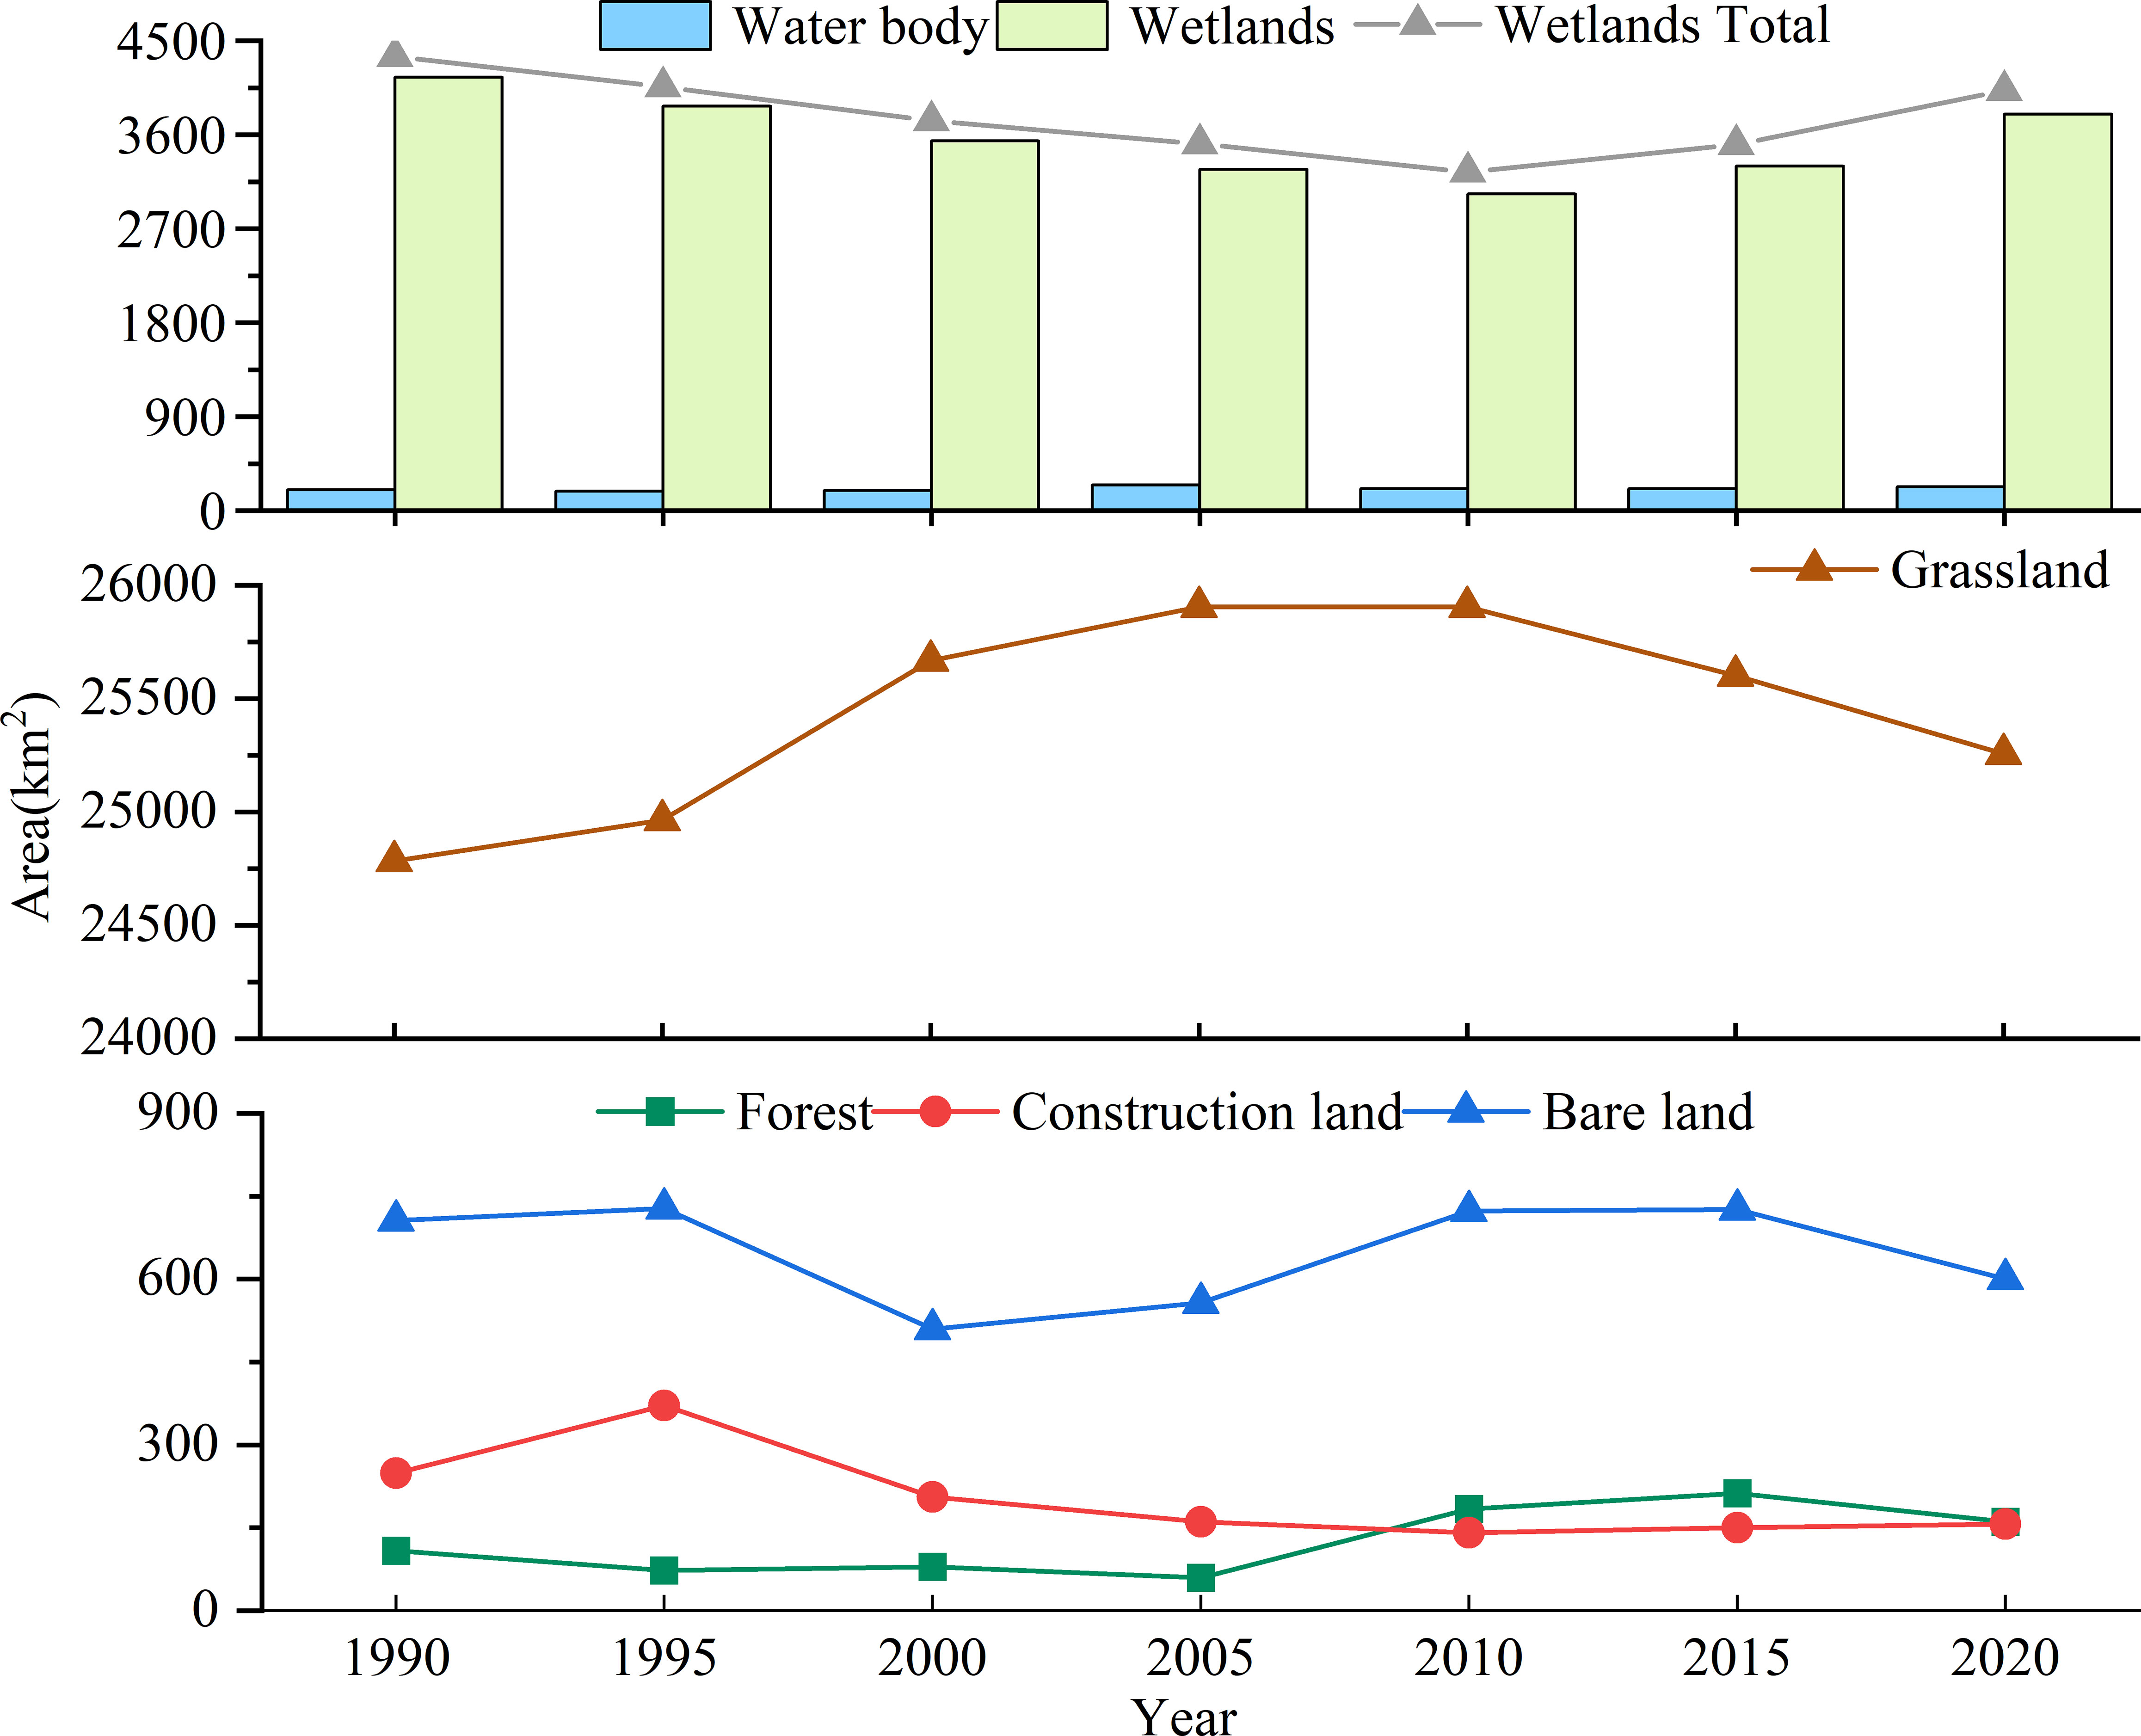
Figure 5 Changes in wetland landscape type area in the study area from 1990 to 2020.
Alpine wetlands were widely distributed in the study area, and mainly consisted of swamp wetlands along rivers and lakes. The Yellow River flows over the Maqu grassland and has many tributaries, including the Heihe and Baihe rivers. Figure 6 shows the geographical distribution of wetlands in the research region. Lake wetlands were mainly distributed on both sides of the Baihe River in the eastern part of the study area and were relatively concentrated and scattered in other areas of the study area. From the perspective of administrative divisions, lake wetlands were mainly distributed in Zoige County and Hongyuan County. Geographically, the wetlands were mainly distributed in the central and eastern parts of the study area, the central wetlands were mainly distributed in the first meander of the Yellow River of the Maqu grassland, and the eastern wetlands were mainly distributed on both sides of the Heihe and Baihe Rivers. From the perspective of administrative divisions, the wetland area was largest, and the proportion of wetlands was highest in Zoige County. Most wetlands in the study region were river wetlands and marsh wetlands, with some scattered lake wetlands.
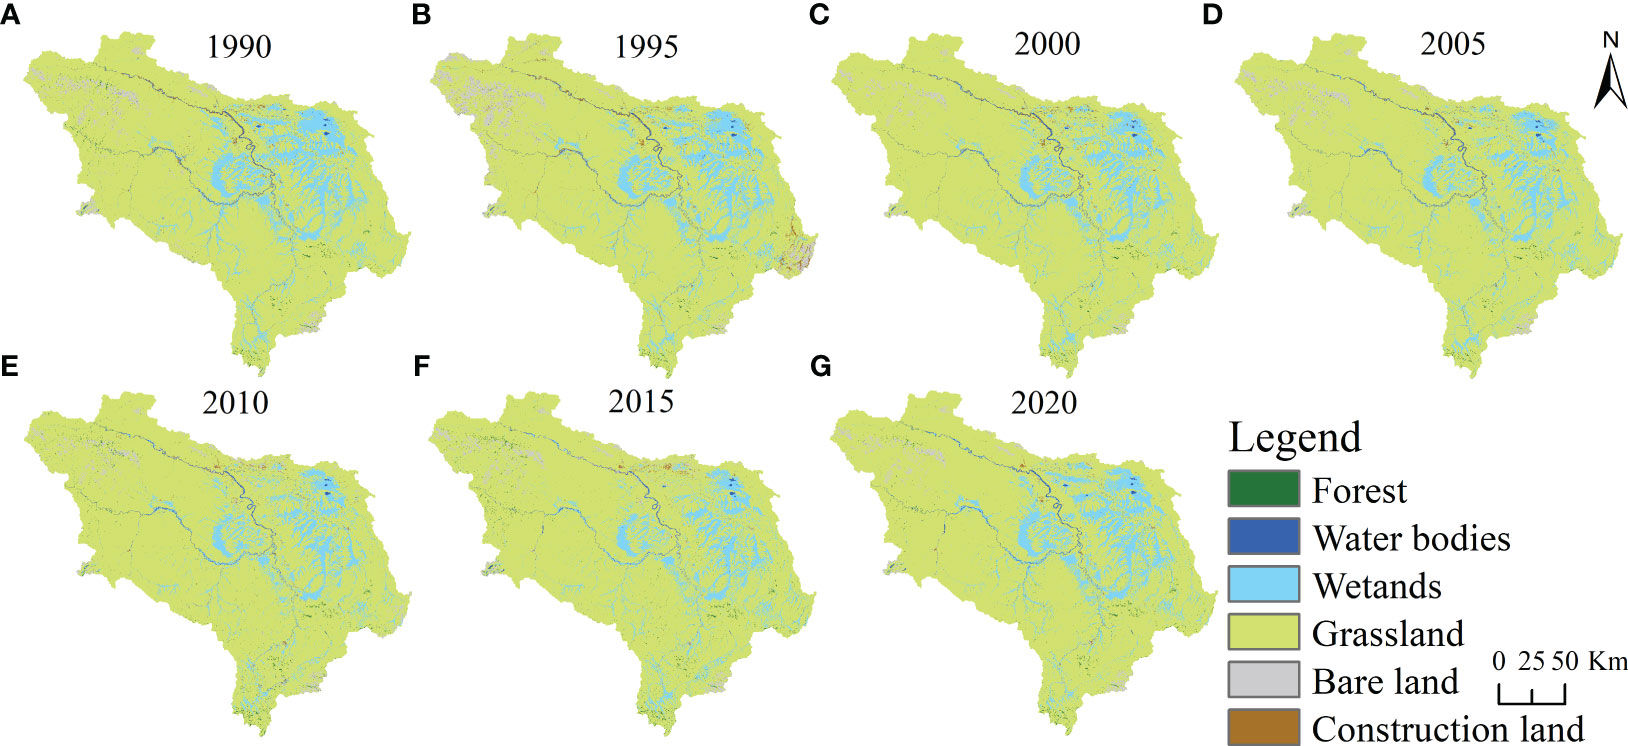
Figure 6 Distribution of wetlands in the study area from 1990 to 2020. (A), 1990 (B), 1995 (C), 2000 (D), 2005 (E), 2010 (F), 2015 (G), 2020.
The upkeep and growth of wetlands depends heavily on water, which is generally located in areas with gentle topography, good waterlogging conditions, and poor drainage (Gao et al., 2012). Based on the elevation and slope data, the elevation and slope of the study area were divided into six grades. To determine how wetlands were distributed vertically, wetland distribution data, elevation data, and slope data from the seven time periods were overlaid (Figure 7). The results showed that wetlands were mostly found in regions with slopes of< 12°, 95.79−98.41% of wetlands were distributed in areas with slopes< 12° and 1.32−3.91% of wetlands were distributed in areas with slopes of 12–24°, while areas with a slope > 24° had almost no wetlands. Wetlands were concentrated in areas with elevations between 3315−3600 m, where they accounted for 89.6−95.49% of the total area. At elevations between 3600−3900 m, there was a small wetland distribution and they accounted for only 4.3−9.31% of the total area. There was almost no wetland area at 3900−4800 m, and there was no wetland distribution above 4800 m.
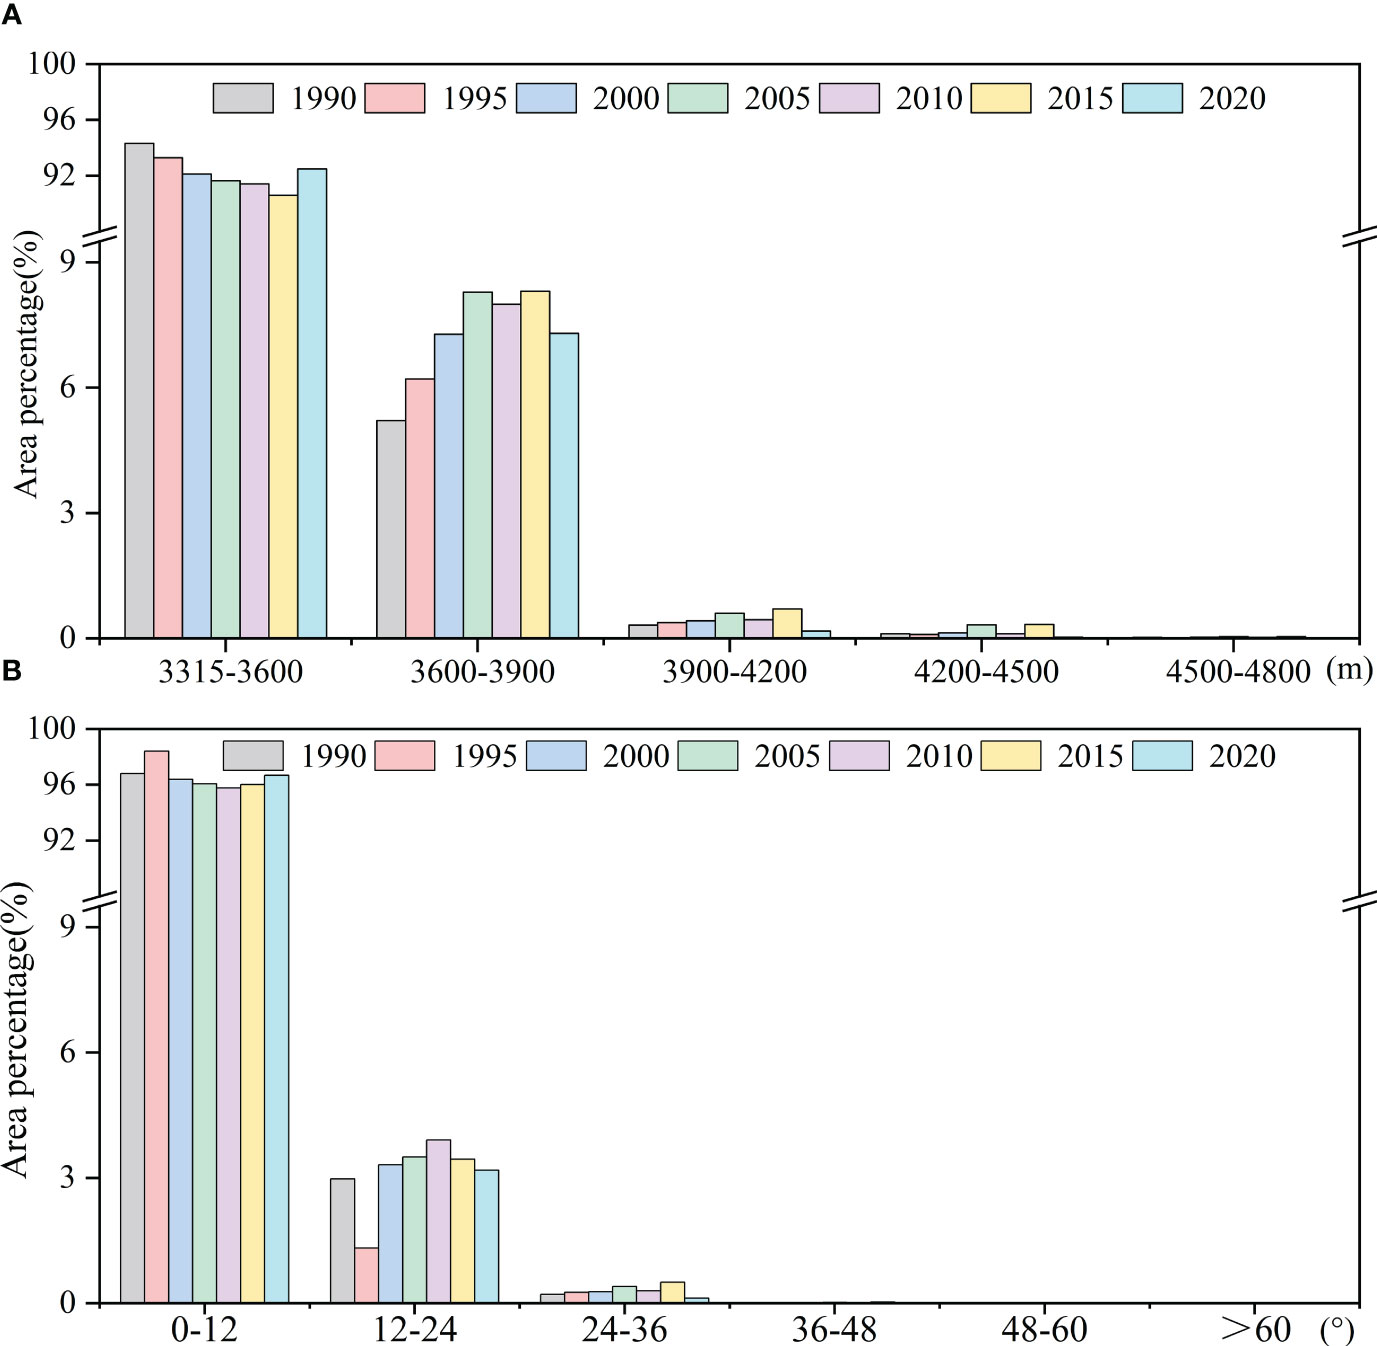
Figure 7 Wetland distribution and changing topographical features. (A) Elevation (B) Slope.
The spatial distribution of the increase and decrease of alpine wetland in the six time periods is shown in Figure 8. In the study area, the wetland area declined from 1990 to 2010. The areas with relatively obvious shrinkage were mainly distributed in the border areas around the wetlands of Maqu County and Zoige County. The decline was mainly concentrated in the northern and eastern regions of the study area, with a particularly serious loss in the northern region. The areas of wetland loss in the Heihe and Baihe wetlands were relatively large and concentrated, whereas the loss areas of other areas were relatively small and distributed at the edge of the wetlands. From 2010 to 2020, wetlands in some areas were lost, but a small number of non-wetland areas were converted to wetlands. The areas with increased wetland cover were mainly distributed in the northern areas of the Maqu and Zoige wetlands. The distribution of the increase and decrease in the study area was uneven, but the area of decrease significantly reduced over the study period, with the environmental system of the Gannan alpine wetland gradually recovering during this period.
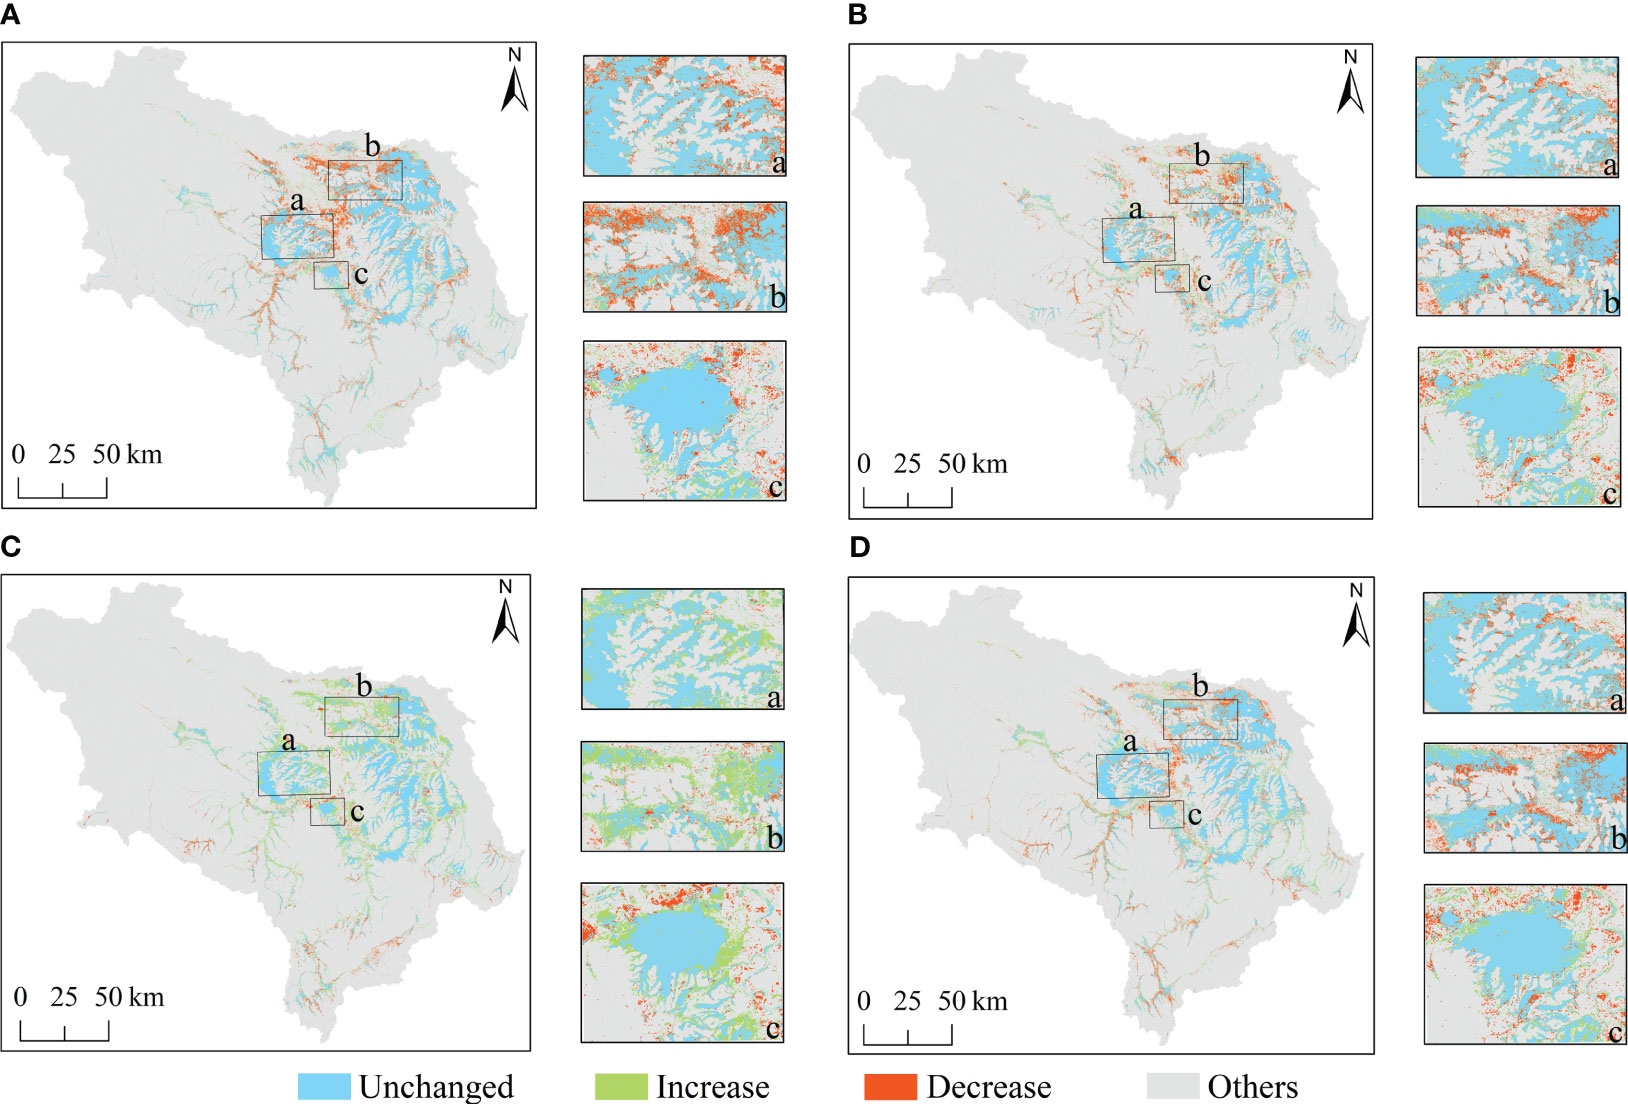
Figure 8 Spatial pattern of wetland changes (A), 1990-2000 (B), 2000-2010 (C), 2010-2020 (D), 1990-2020.
From the land use transfer map (Figure 9), the reduction of wetlands from 1990 to 2010 mainly occurred through the transfer to grassland, with the largest transfer occurring during 1990−2000. The transfer rate slowed down during 2000−2010 in the Gannan alpine wetland. From 2010 to 2020, the area of wetland in the study area increased, and the transferred-in area was larger than the transferred-out area. Overall, the dynamic change between wetlands and grasslands was most pronounced during 1990−2020, with 780.63 km2 of wetlands transferred to other land use types, of which 92.98% was converted to grasslands and 3.7% was converted to construction land and bare land. Of the areas converted into wetlands, 78.96% were converted from grassland and 20.12% from construction land and water bodies. The increase in the area of construction land was mainly due to conversion from grassland, while some construction land was also converted to grassland. Bare land and grassland were frequently converted to each other, with the conversion of bare land to grassland being more common and accounting for an area of 328.94 km2. The area of grassland converted to bare land was only 104.58 km2. The area of forest and water bodies that were converted to other land uses was low, with conversions between forest and grassland being more common.
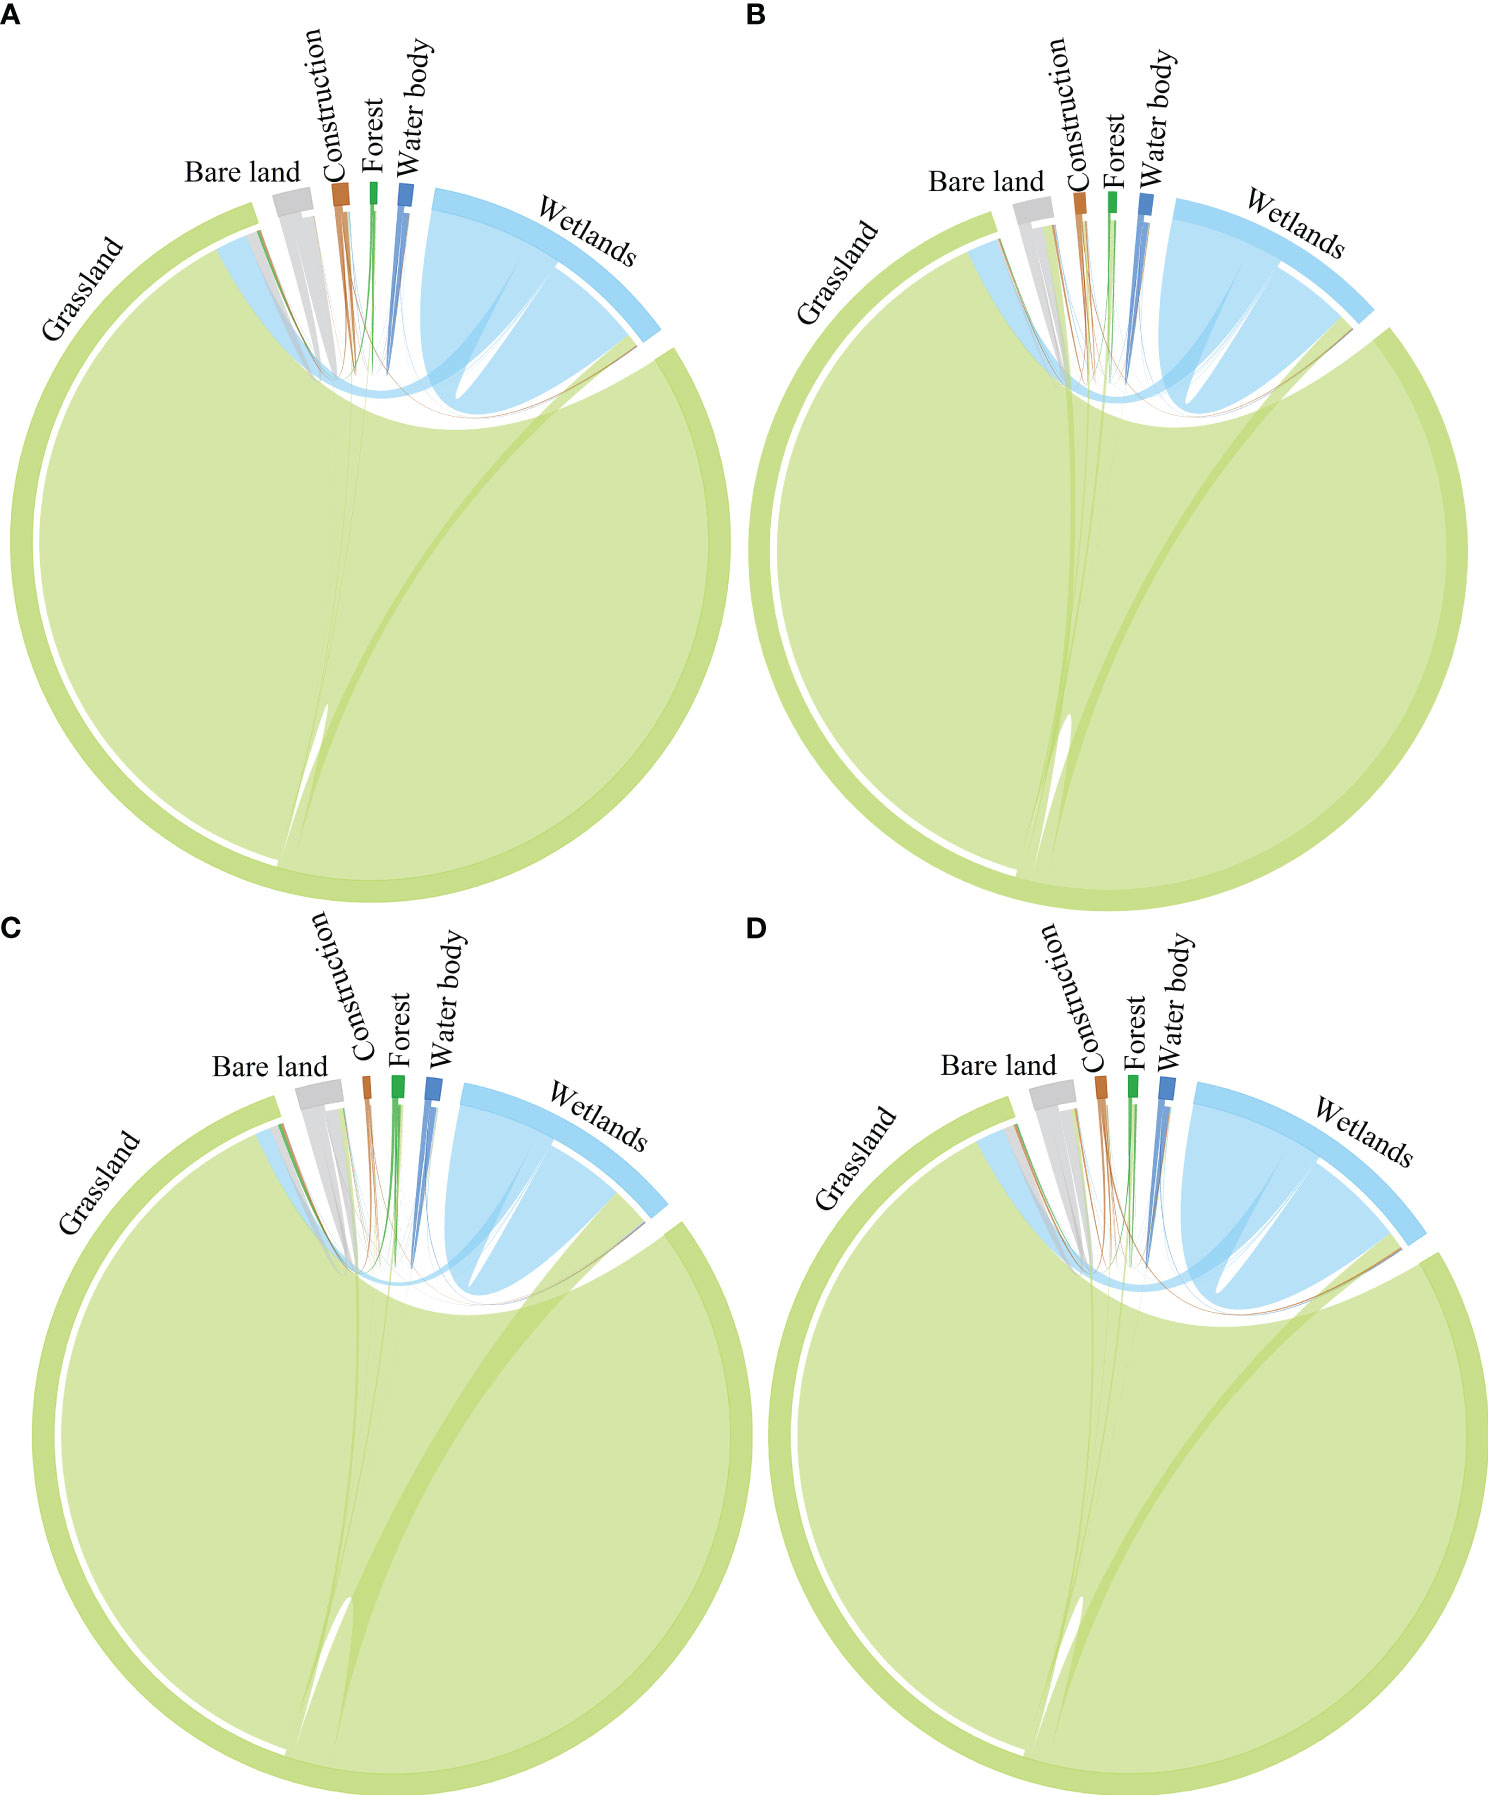
Figure 9 Land use transfer map (A), 1990-2000 (B), 2000-2010 (C), 2010-2020 (D), 1990-2020.
The migration of wetland core in the study area in 7 typical years (Figure 10) shows that: the wetland centroid moved 4.85 km to west by south from 1990 to 1995. The wetland centroid moved to south by west 6.34 km from 1995 to 2000. The wetland centroid moved to south by east 6.72 km from 2000 to 2005. The wetland centroid moved to south by east 4.04 km from 2005 to 2010.The wetland centroid moved to north by west 0.77 km from 2010 to 2015 and the wetland centroid moved to north by east 5.21 km from 2015 to 2020.
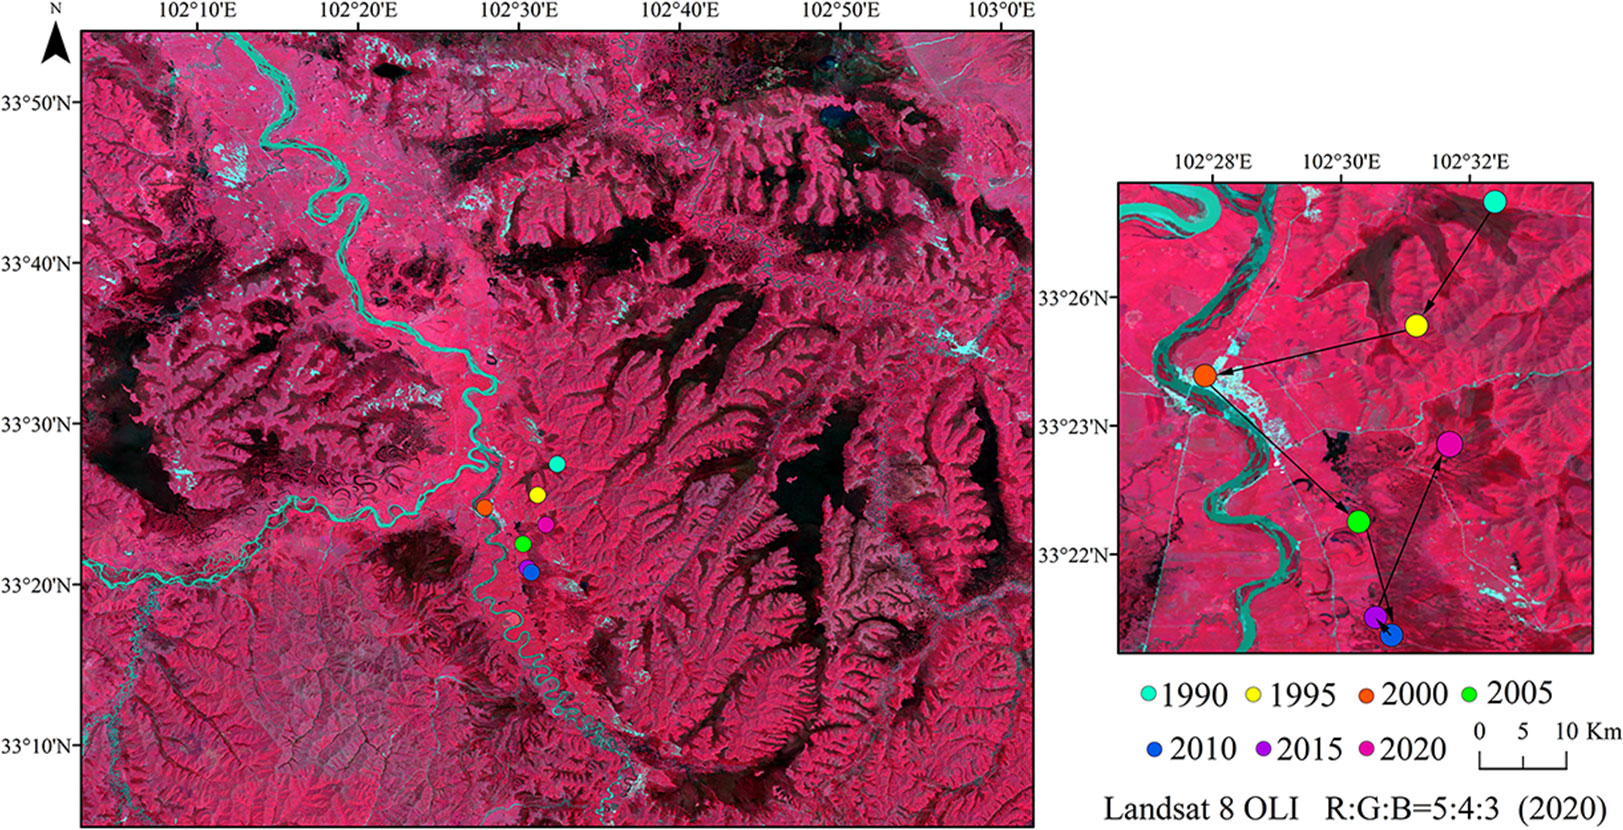
Figure 10 The centroid change of wetland patch area from 1990 to 2020.
The centroid of the wetland in the whole area shifted from 1990 to 2010, and indicated that the northeast was more severely impacted than the southwest during this time. The northeastern portion of the study area had a much lower wetland area because of extensive drainage ditch excavation during the 1990s, which caused the centroid of the wetland to migrate to the southwest. Several wetland restoration initiatives have been conducted in recent years, during which drainage ditches in Zoige County were filled in. Wetlands in the northern portion of the research area were recovered. The wetland centroid in the whole area migrated to the northeast between 2010 and 2020.
The landscape pattern index at the landscape level can reflect the area’s overall landscape characteristics on a larger geographical scale. Four indices were used to analyze the evolution of the landscape pattern of the alpine wetlands (Figure 11). PD first decreased, then increased, and then decreased again during 1990 to 2020, with a maximum in 2015, indicating that the fragmentation degree of the wetland landscape displayed a decreasing-increasing-decreasing trend. The COHESION value was high indicating that the landscape was relatively intact, with high levels of agglomeration and connectivity between patches. The dominant patches in the landscape had a good connectivity, but they fluctuated and decreased over time, suggesting that their level of agglomeration and connectivity was gradually being undermined to some extent. Except for 2005 and 2015, the LSI values were relatively large, and the LSI values were relatively large, and the LSI values in other time periods were small and did not fluctuate, indicating that the fluctuation of the wetland shape decreased, the geometry of the wetland was simplified, and the degree of patch irregularity gradually decreased.
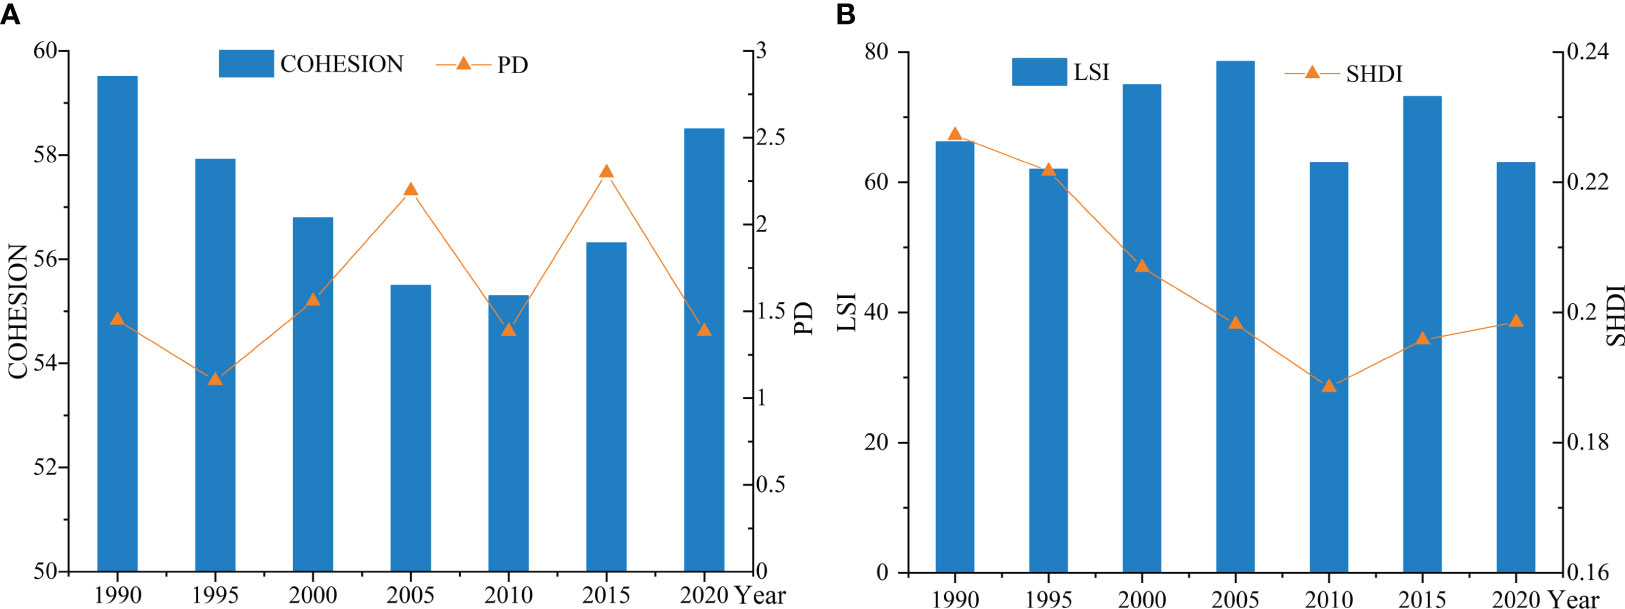
Figure 11 Landscape index of wetlands in the study area. (A), COHESION and PD (B), LSI and SHDI.
The quantity of landscape variation is determined by the number of patch types and the regularity of their distribution within an area. With an increase in the diversity index, the composition of landscape structure tends to be complex. From 1990 to 2020, the SHDI value in the study area displayed a fluctuating downward trend. In 2015, the SHDI value in the study area increased slightly, but was still lower than in 1990–2005, demonstrating that the degree of landscape fragmentation was steadily reducing at this stage, and the wetland landscape in the study area was evolving in a balanced direction.
The drivers selected for this study were X1 (Slope), X2 (Aspect), X3 (DEM), X4 (the distance from the road), X5 (the distance from the administration center), X6 (GDP), X7 (NPP), X8 (Population density), X9 (Temperature), X10 (Precipitation), X11 (Evaporation) (Figure 12).
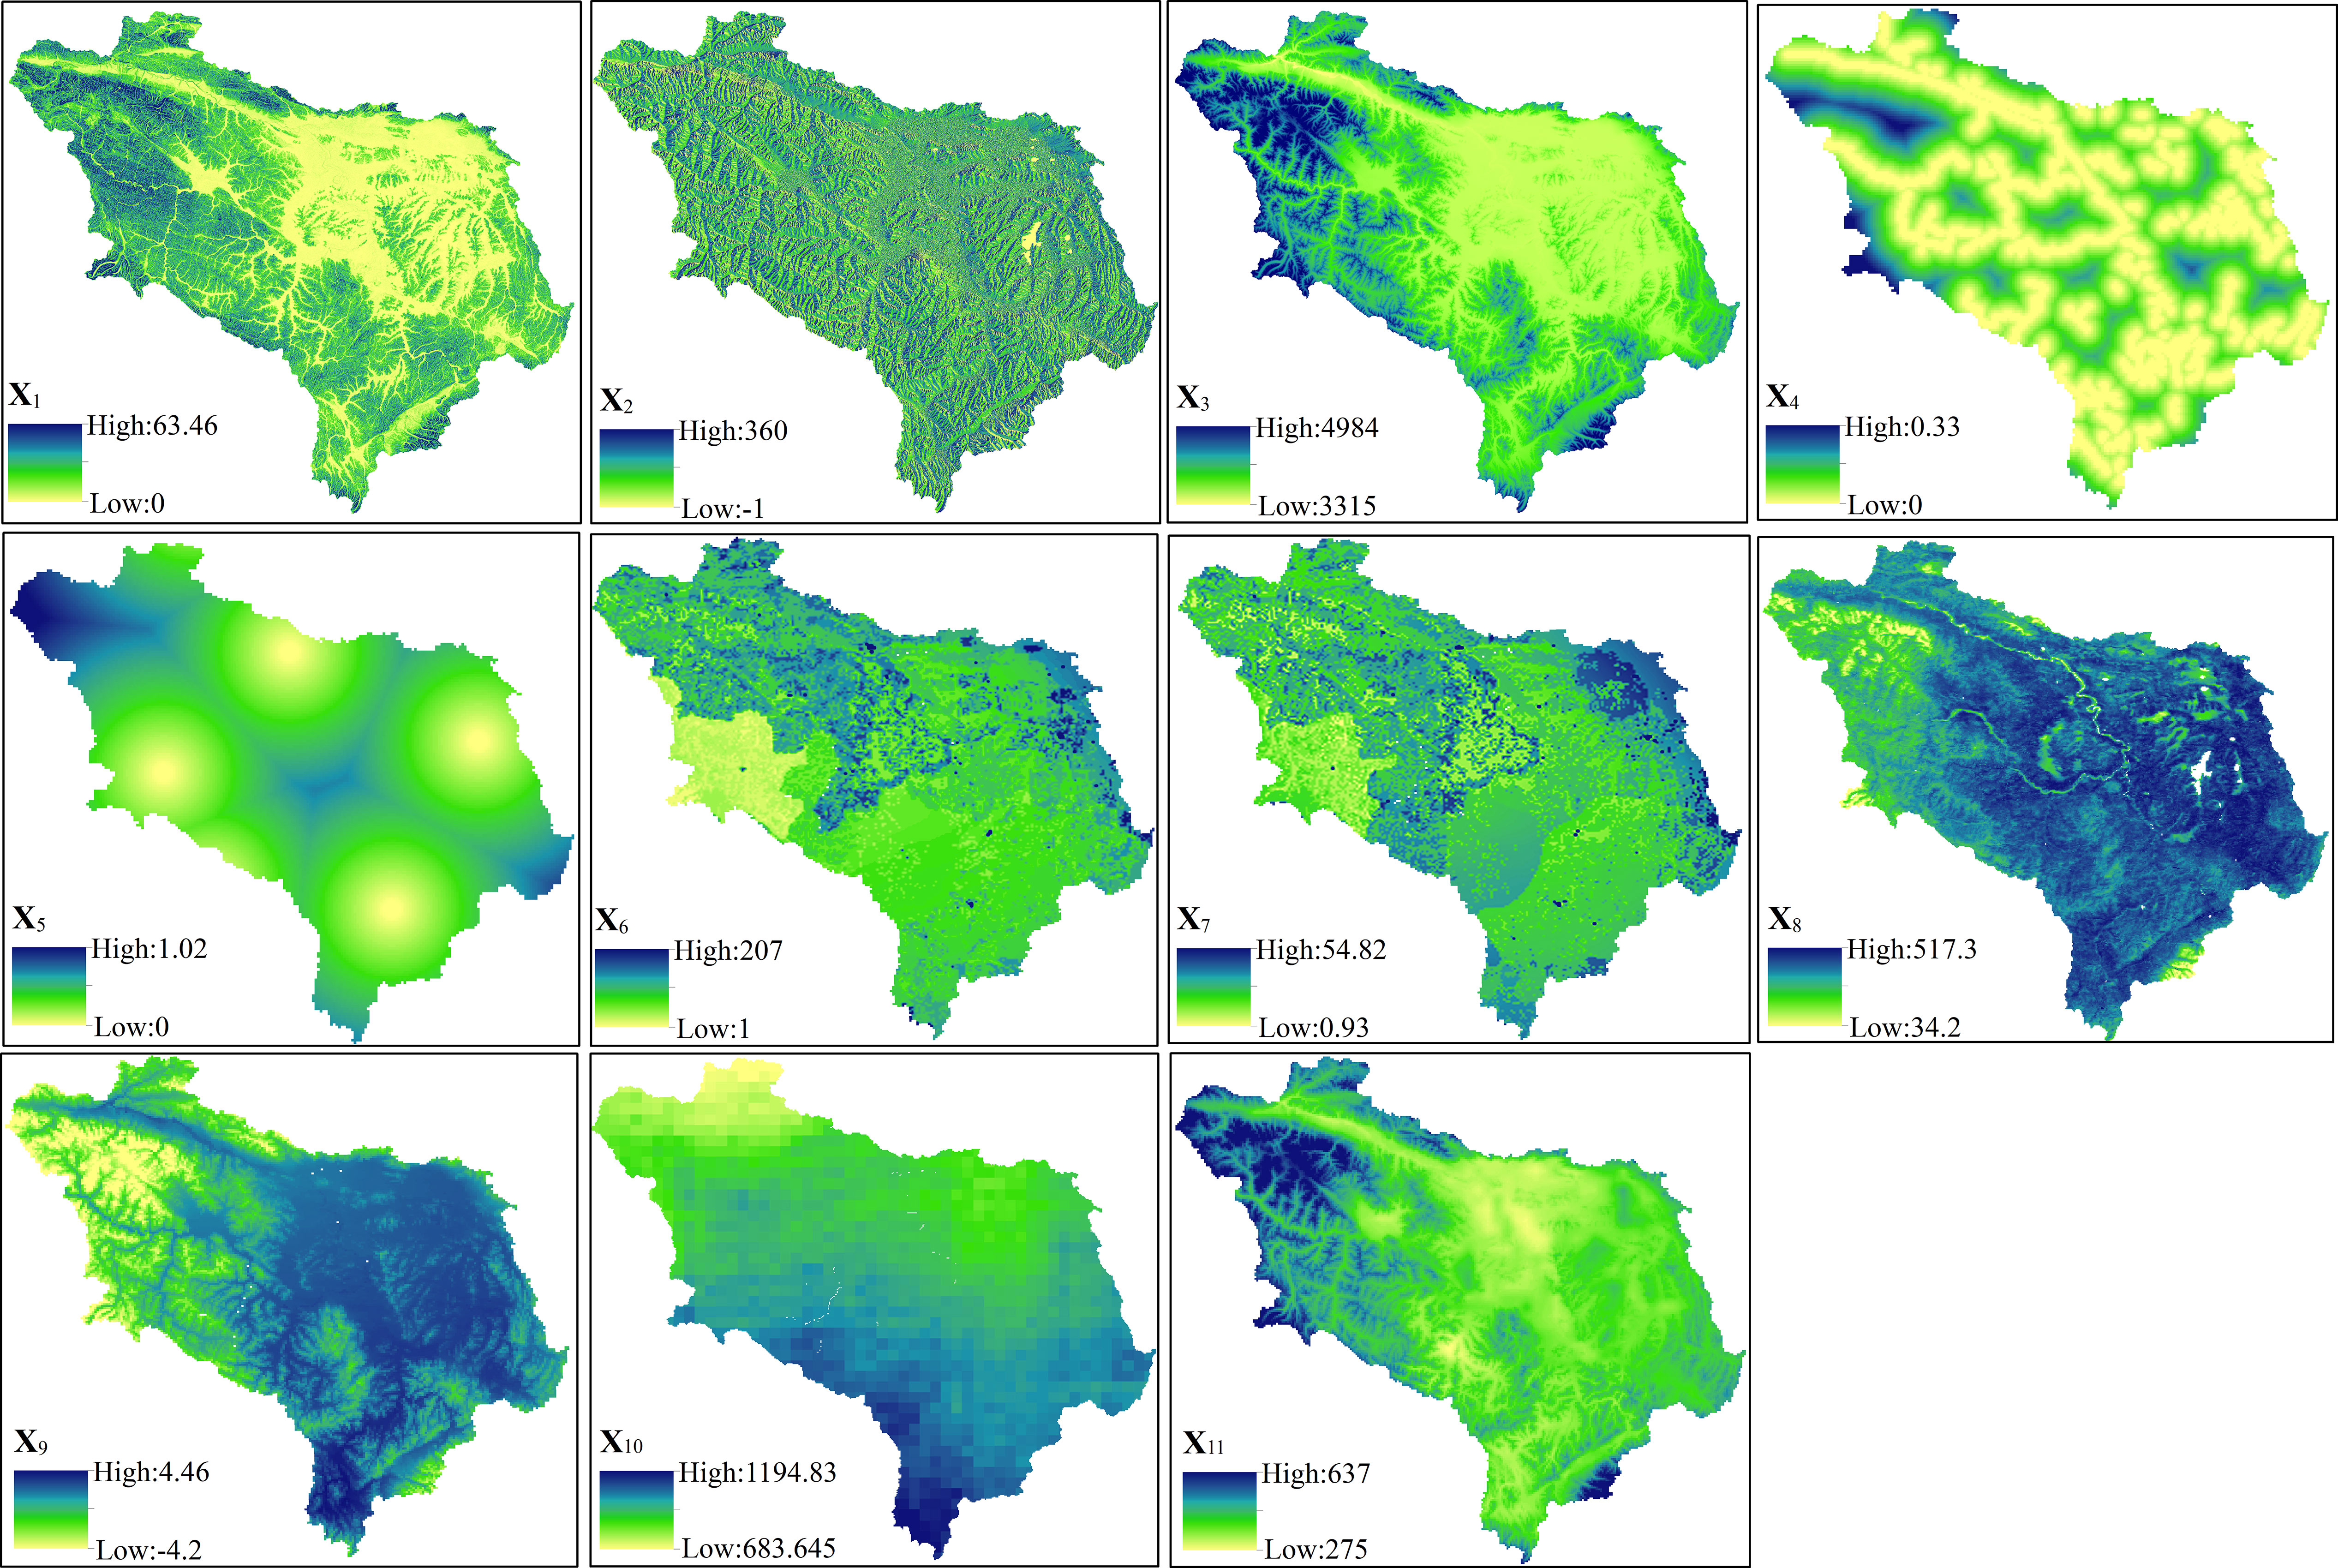
Figure 12 Drivers of wetland area change.
Based on the GeoDetector analysis of each driver (Figure 13), the single-factor detector revealed that evaporation was the main factor in 1990 (q-value of 0.24), the dominant factor was NPP in 2005 (q-value of 0.52), and the DEM had the greatest influence on changes in wetland area in all the remaining years with q-values of 0.53, 0.49, 0.65, 0.56, and 0.72, respectively. From the different q-values of each factor in different years it was determined that X3 (0.51) > X1 (0.48) > X11 (0.42) > X7 (0.29) > X9 (0.27) > X10 (0.22) > X4 (0.14) > X8 (0.12) > X5 (0.1) > X6 (0.09) > X2 (0.07), further indicating that the DEM was the main driver of changes in wetland area. This indicated that natural factors had a significant influence on the spatial and temporal evolution of wetlands. The explanatory power of socio-economic and locational factors was smaller, but with economic development, the driving force of population density and distance from roads was further strengthened. The q-value of the distance from the administration center and GDP did not change significantly and its explanatory power was weak.
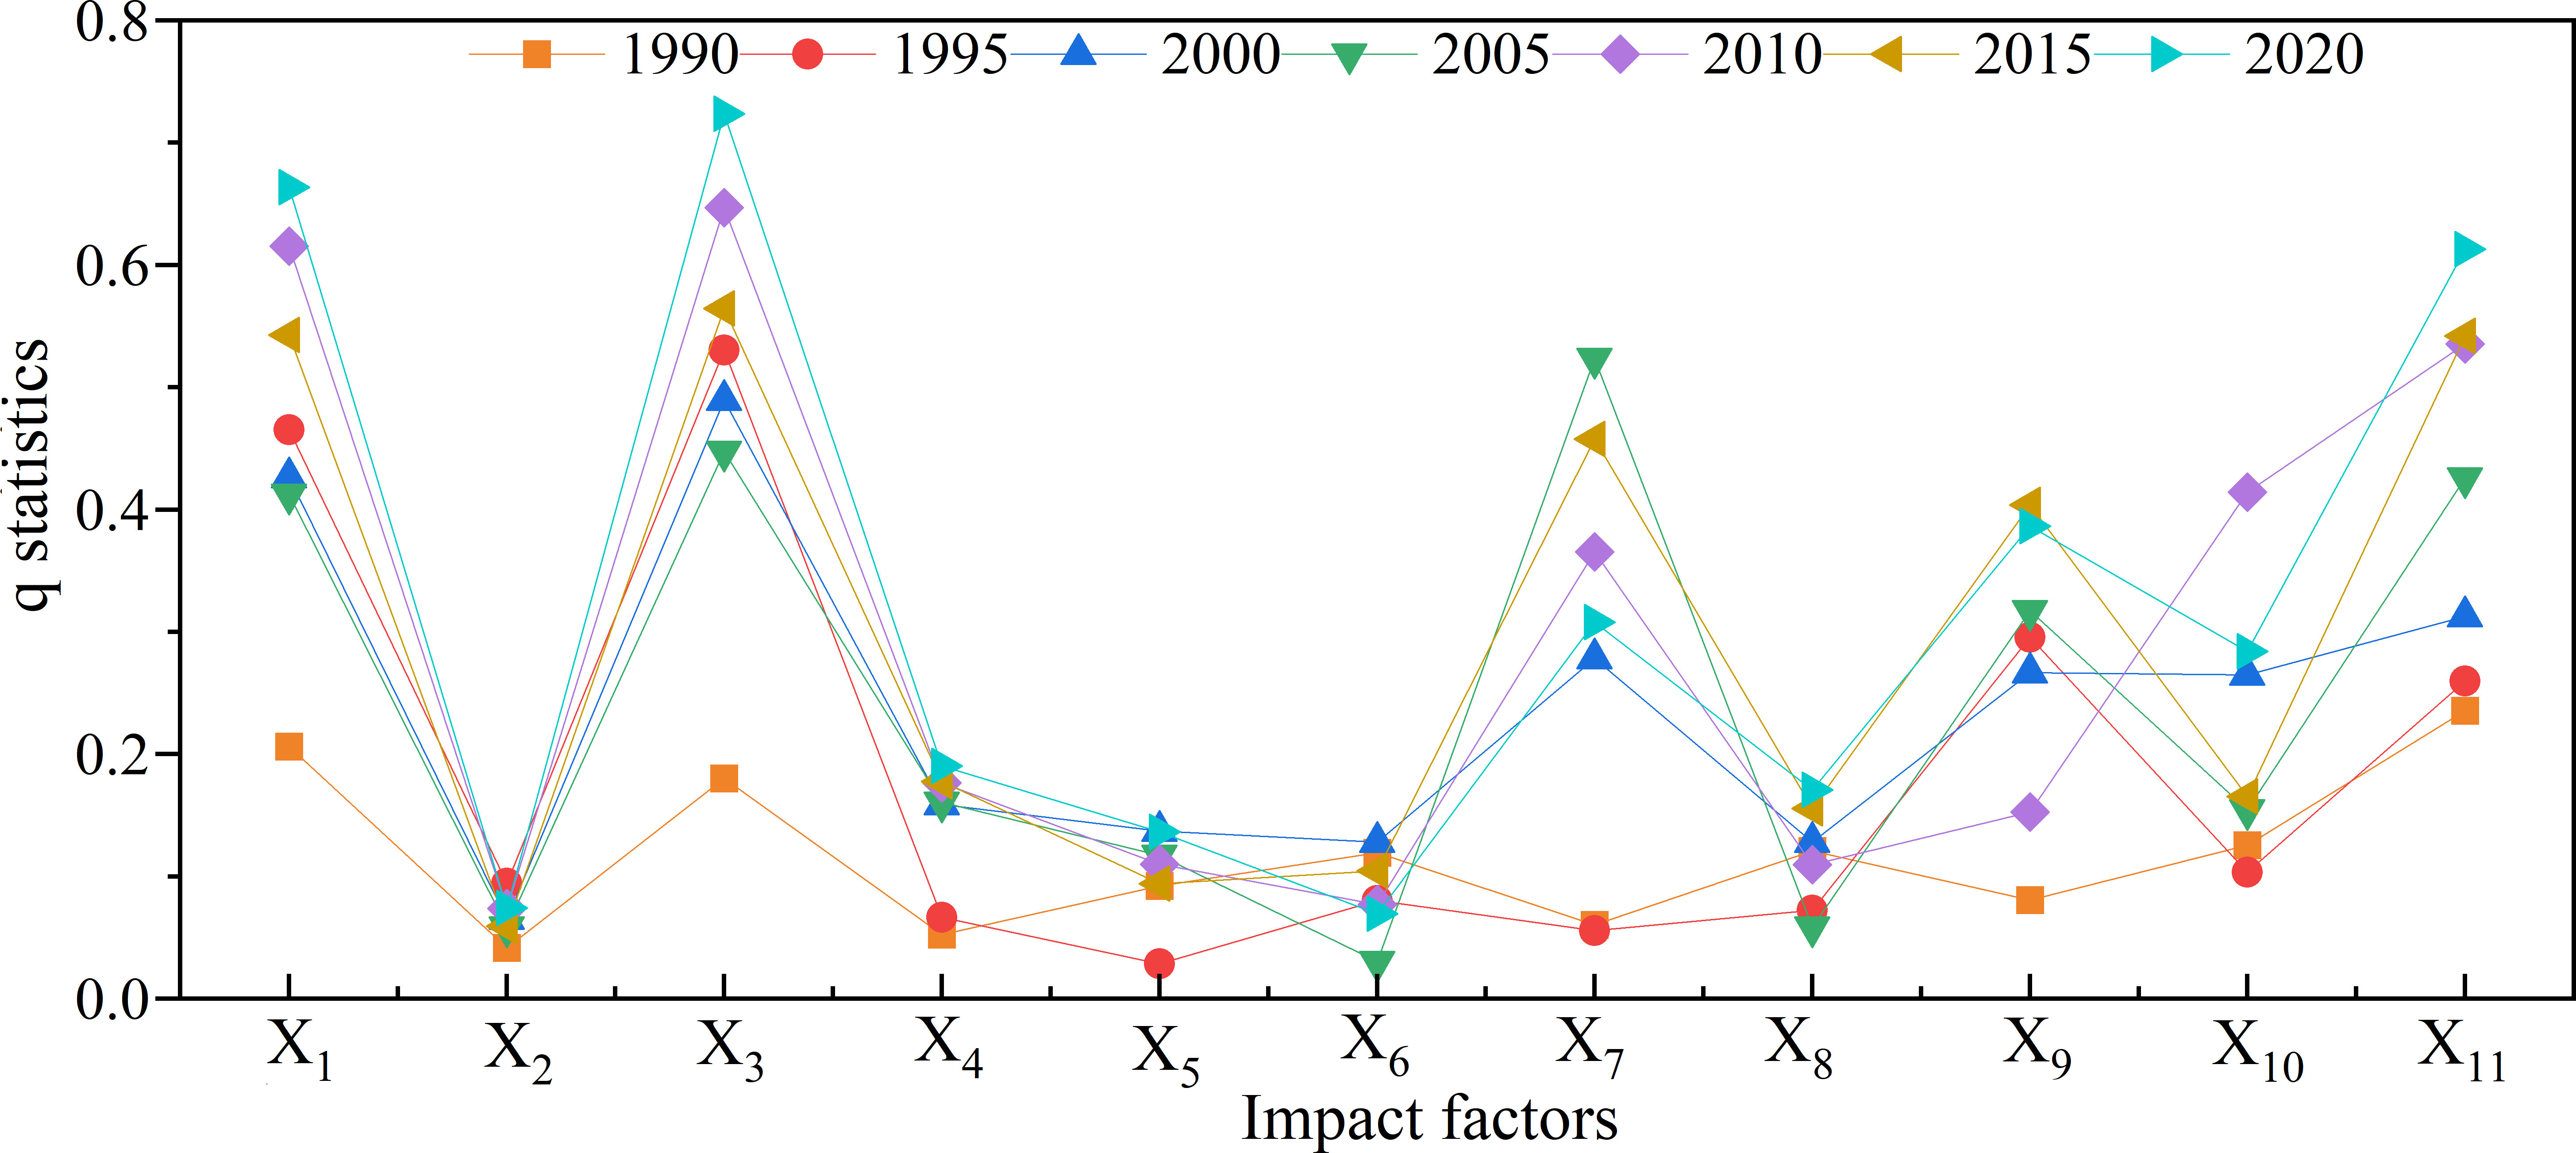
Figure 13 Variation of q value of detection factors in 1990-2020.
The interaction results showed that the influence of the two-factor interactions was significantly higher than that of a single factor, and the interactions between the main drivers of wetland change in the research region from 1990 to 2020 were largely two-factor enhanced and non-linear enhanced, with no independent interactions and non-linear weaker factors (Figure 14). The interaction between X10 (Precipitation) and X8 (Population density) was the strongest interaction in 1990, reaching 0.819. The interaction between X8 (Population density) and X1 (Slope) was the strongest interaction in 1995. In 2000, the interaction between X11 (Evaporation) and X1 (Slope) was the strongest interaction, reaching 0.706. The interaction between X8 (Population density) and X1 (Slope) fluctuated from 2005 to 2020, but still had a high explanatory power, with the highest explanatory power of 0.816 in 2005. From 2010, the interaction between X7 (NPP) and X1 (Slope) gradually strengthened and had the highest explanatory power, exceeding 0.8. The interaction between X11 (Evaporation) and X1 (Slope) had a high explanatory power in all years and gradually strengthened, reaching 0.838 in 2020. The single factors of X7 (NPP) and X11 (Evaporation) did not significantly drive the distribution of wetlands in the study area, but when combined with X1 (Slope), they had a strong explanatory power of the change in wetland area. This indicated that these factors did not affect the change in wetland area independently but had a stronger influence when combined with other factors. Additionally, the distance from the administration center and GDP, which had less explanatory power, also had a stronger influence when combined with other factors. The interaction between socioeconomic factors and natural factors had a significantly greater explanatory power than the interaction between socioeconomic factors, indicating that natural factors and socioeconomic factors both promoted the spatial and temporal evolution of wetlands in the study area.
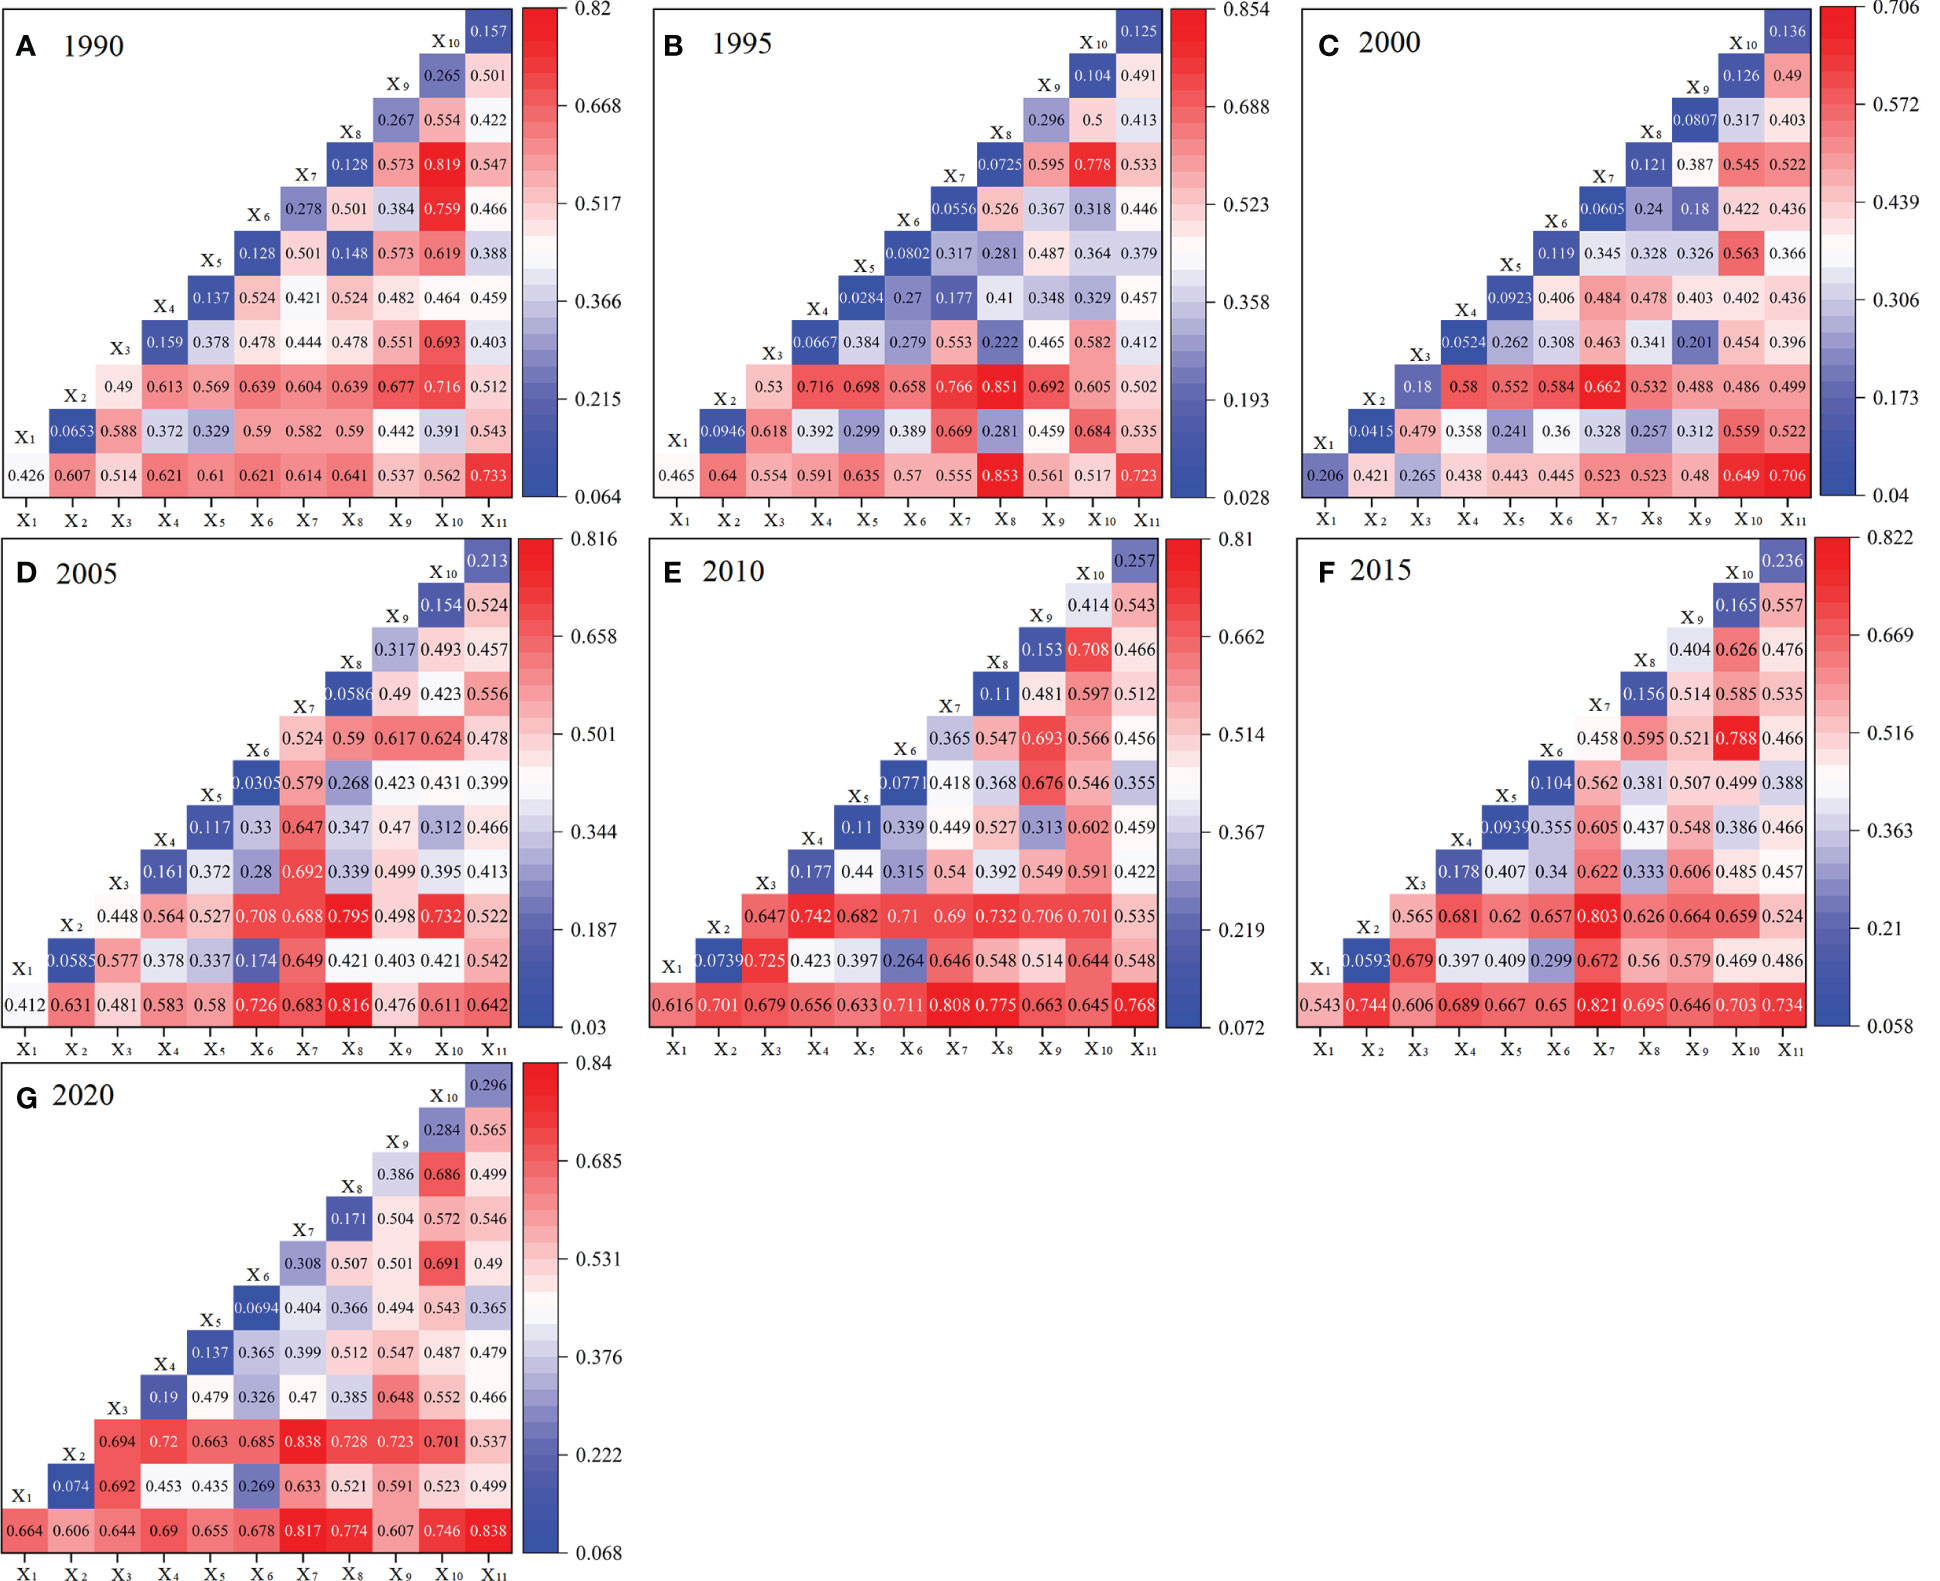
Figure 14 Interaction detection map of drivers of wetland area change. (A), 1990 (B), 1995 (C), 2000 (D), 2005 (E), 2010 (F), 2015 (G), 2020.
In the extraction of wetland information, it is extremely difficult to obtain long time-series data for wetlands and their changes, and the traditional analysis of remote sensing images faces several challenges and limitations. Therefore, previous studies have also focused on small-scale short time-series. In recent years, with its tremendous computational capabilities, the GEE platform has progressively become an indispensable cloud processing tool. Based on the GEE platform, this study generated a classification map of the first meander of the Yellow River alpine wetlands, and analyzed changes in the past 31 years, including changes in the wetland area, space, and landscape The study confirmed the superiority and feasibility of the GEE platform for monitoring the dynamic evolution of wetland ecosystems over a long time-series. The study area can be considered a microcosm of the Yellow River source area, both in terms of wetland ecology and the regional socioeconomics. This situation is particularly striking in terms of wetland ecological management. Based on the land use statistics, we found that 2010 was a turning point in the change of wetland area. A large area of the first meander of the Yellow River alpine wetland was lost after the 1990s due to the combination of natural factors such as climate warming and wetting, and human factors such as overgrazing. Additionally, the water level in hundreds of lakes in the first meander of the Yellow River dropped significantly, the surface runoff dropped sharply, and the wetland area significantly declined. The alpine wetland in the first meander of the Yellow River has faced serious ecological restoration issues. From 2010 to 2020, the area of alpine wetlands increased annually, but compared with the 1990s, the wetland shrinkage was still severe. These results were consistent with those of other studies that investigated changes in the wetland landscape of key counties within the region (Shen et al., 2019b; Li W. et al., 2020; Zhang et al., 2021).
In terms of natural drivers, the study area was a typical high-altitude ecologically fragile zone, with poor ecological stability and a strong sensitivity to climate change. Climatic factors have played an important role in wetland change over time. There was a steady upward trend in temperature in the study area over the 31-year study period and a large inter-annual variation, and the annual average temperature growth trend was significantly higher from 2002 to 2020 than from 1990 to 2002. Precipitation basically maintained a steady upward trend, with wetlands in the study area relying mainly on precipitation recharge. A continued increase in precipitation will promote the expansion of wetland areas. The warm and wet background of the Qinghai-Tibet Plateau has led to an overall trend of increasing surface evapotranspiration on the plateau, with annual evaporation fluctuating and increasing over a period of 31 years. There was a steady increase before the watershed year of 2006 when evaporation reached 303.12 mm, which was related to the substantial decrease in wetland area from 1990 to 2010. From 2010 to 2020, the annual average temperature increase trend slowed, and precipitation increased, resulting in relatively low evaporation. The main method of water consumption in alpine wetlands is evapotranspiration. As the temperature rises more heat is generated, making the climatic conditions in the study area more favorable for the growth of mesophytic plants, due to the increase in evapotranspiration. Mesophytic plants gradually became the dominant species and the number of wetland plants decreased, resulting in the gradual degradation of grassland in wetlands. The increase in wind speed and the decrease in relative humidity directly caused an increase in evapotranspiration in the wetland environment, The increase in wind speed and the decrease in relative humidity directly caused an increase in evaporation from the wetland environment, but also increased transpiration from the wetland vegetation, thus causing a decrease in the moisture content of the wetland and triggering a wetland retreat. Zhang et al. (2016) showed that the warming and drying of Zoige Plateau led to the degradation of wetlands, while the degradation of wetlands subsequently intensified the warming and wetting of the climate. The results of our study were consistent with this pattern. GeoDetector further showed that evaporation was the main factor leading to changes in the alpine wetland landscape in the study area. This was basically consistent with the conclusions obtained from the correlation analyses of Zhang B. et al. (2022) and Li W. et al. (2020), with both studies investigating the driving forces of marsh wetland evolution in Maqu County.
The GeoDetector analysis revealed that the changes in wetland area in the study area between 1990 and 2020 were more responsive to climatic factors than social drivers. This does not mean that the effects of social factors, such as the development of animal husbandry, were not important, but only that the impact of population and socioeconomic development on wetlands in alpine regions was less important than the ecological effects of changes in climatic factors. Because of the region’s unique topography and climate, large livestock and their by-products, such as yaks and Tibetan sheep, have become an important source of income for farmers and herders. The rapid increase in population in the region between 1990 and 2020, and the high demand for yaks and their related produce by human society, led herders to expand their farming activities. Both Zoige and Hongyuan counties have overgrazing problems, with the rate of overgrazing in Zoige County increasing every year. In the 1990s, to develop the local economy and increase the livestock capacity of the study area, 700 km of drainage ditches were dug in the area, causing the water level to drop by about 50% throughout the marsh area. This unregulated dredging and draining overwhelmed swamps and grasslands. Once the soil was damaged, the accumulated water quickly infiltrated, the wetlands dried up and decreased in size, and the water conservation capacity of the study area weakened accordingly. From 2005 to 2018, and especially between 2010 and 2018, various government departments approved and implemented a series of ecological projects for the conservation, construction, and restoration of wetlands. In recent years, Zoige County has effectively maintained the wetland environment and ecosystem by planting grass and restoring wetness, controlling sand to return wetness, filling ditches, exterminating rodents, and conducting both wetland ecological benefit compensation projects and wetland ecological resource management and protection projects. Since the start of the drainage ditch filling project in 2004, the Zoige grassland has gradually become one of the world’s largest wetland restoration projects. The government of Maqu County has carried out several key ecological construction and environmental protection projects, such as the return of pasture to grass and the protection and restoration of wetlands, which have contributed to the efficient development of natural resource protection in the upper reaches of the Yellow River. The natural environment of Maqu County has been significantly improved, and the ability of Maqu grassland to supply water to the Yellow River has been enhanced, further realizing the sustainable development of the ecological environment and social economy. Since 2005, under the active promotion of local governments, experts, and researchers, environmental protection work in Maqu Wetland has received widespread attention across the country. The “Plan for the Protection and Construction of the Important Water Supply Ecological Function Zones in the Upper Yellow River in Gannan” was included in the national “Eleventh Five-Year Plan”, from 2006 to 2010, the plan focused on grasslands and swamps, with the aim of controlling the rapid deterioration of the natural environment from 2011 to 2020, conserving water, attempting to restore and improve the resource supply capacity of the Yellow River Basin, and gradually embarking on economic and social development through the establishment of an ecological virtuous circle.
In the context of global climate change, comprehensive and effective monitoring of alpine wetlands is of great research significance and academic value. This study used a hydrological analysis method to extract the control basin of the first meander of the Yellow River, but it only considered the evolution of the wetland landscape from a macro perspective. In future research, the landscape of the study area will be further refined, the mechanisms of wetland change and shrinkage, and the feedback mechanism between hydrology and wetland change will be investigated. This will reveal the hydrological connectivity between wetlands and rivers and provide a more accurate basis for the planning and environmental management of the upper Yellow River and the protection and restoration of wetlands.
In summary, the GEE platform could effectively extract wetland information. We analyzed the spatial and temporal evolution characteristics of wetlands by combining GIS technology, the centroid model, and the landscape pattern index. Additionally, we effectively explored the driving factors of changes in wetland area using GeoDetector. The results showed that alpine wetlands are generally distributed on slopes< 12° and at elevations between 3315 and 3600 m. From 1990 to 2010, wetland landscapes displayed a serious shrinking trend. The wetland area displayed a slow growth trend from 2010 to 2020, but compared with the 1990s, the overall reduction of wetland area remained severe. The main type of wetland transfers out and in was through conversion to and from grassland, respectively. The wetland centroid migrated to the southwest from 1990 to 2010, and to the north from 2010 to 2020. The wetland landscape geometry was relatively simple. The landscape was relatively intact, and the patches retained a high degree of agglomeration and connectivity with each other, but the level of agglomeration and connectivity was damaged to some extent. Finally, a quantitative analysis using the GeoDetector factor detector found that the DEM, slope, and evaporation were the most important drivers affecting changes in wetland area, and socio-economic development also affected changes in wetland area but to a lesser extent than climatic factors. Through the interaction detector, it was found that the interaction of different drivers could better explain the long-term change of wetland area than the action of each influencing factor alone.
The raw data supporting the conclusions of this article will be made available by the authors, without undue reservation.
All authors listed have made a substantial, direct, and intellectual contribution to the work and approved it for publication.
This study is supported by The Second Tibetan Plateau Scientific Expedition and Research Program (STEP, 2019QZKK0106) and Gansu Province 2023 Postgraduate "Innovation Star" Project (2023CXZX-358).
The authors declare that the research was conducted in the absence of any commercial or financial relationships that could be construed as a potential conflict of interest.
All claims expressed in this article are solely those of the authors and do not necessarily represent those of their affiliated organizations, or those of the publisher, the editors and the reviewers. Any product that may be evaluated in this article, or claim that may be made by its manufacturer, is not guaranteed or endorsed by the publisher.
Amani M., Ghorbanian A., Ahmadi S. A., Kakooei M., Moghimi A., Mirmazloumi S.M., et al. (2020). Google earth engine cloud computing platform for remote sensing big data applications: A comprehensive review. IEEE J. Select. Topics Appl. Earth Observ. Remote Sens. 13, 5326–5350. doi: 10.1109/jstars.2020.3021052
Amani M., Mahdavi S., Kakooei M., Ghorbanian A., Brisco B., DeLancey E. R., et al. (2021). Wetland change analysis in Alberta, Canada using four decades of landsat imagery. IEEE J. Select. Topics Appl. Earth Observ. Remote Sens. 14, 10314–10335. doi: 10.1109/JSTARS.2021.3110460
Bai J.-H., Lu Q.-Q., Wang J.-J., Qing-Qing Z., Ouyang H., Deng W., et al. (2013). Landscape pattern evolution processes of alpine wetlands and their driving factors in the Zoige Plateau of China. J. Mountain Sci. 10, 54–67. doi: 10.1007/s11629-013-2572-1
Barboza Castillo E., Cayo E. Y.T., de Almeida C. M., López R. S., Briceño N. B.R., López J. O. S., et al. (2020). Monitoring wildfires in the northeastern Peruvian amazon using landsat-8 and sentinel-2 imagery in the GEE platform. ISPRS Int. J. Geo Inform. 9 (10), 564. doi: 10.3390/ijgi9100564
Berhane T. M., Lane C. R., Wu Q., Autrey B. C., Anenkhonov O. A., Chepinoga V. V., et al. (2018). Decision-tree, rule-based, and random forest classification of high-resolution multispectral imagery for wetland mapping and inventory. Remote Sens. 10 (4), 580. doi: 10.3390/rs10040580
Breiman L. (2001b). Statistical modeling: The two cultures (with comments and a rejoinder by the author). Stat. Sci. 16 (3), 199–231. doi: 10.1214/ss/1009213726
Bwangoy J.-R. B., Hansen M. C., Roy D. P., Grandi G. D., Justice C. O. (2010). Wetland mapping in the Congo Basin using optical and radar remotely sensed data and derived topographical indices. Remote Sens. Environ. 114 (1), 73–86. doi: 10.1016/j.rse.2009.08.004
Che X., Jiao L., Qin H., Jingjing W. (2022). Impacts of climate and land use/cover change on water yield services in the upper yellow river basin in Maqu county. Sustainability 14 (16), 10363. doi: 10.3390/su141610363
Chen C., Liang J., Yang G., Sun W. (2023). Spatio-temporal distribution of harmful algal blooms and their correlations with marine hydrological elements in offshore areas, China. Ocean Coast. Manage. 238, 106554. doi: 10.1016/j.ocecoaman.2023.106554
Chu L., Huang C., Liu G., Liu Q., Zhao J. (2014). Analysis on vegetation changes of Maqu alpine wetlands in the Yellow River source region. Land Surface Remote Sens. II. 9260, 926020. doi: 10.1117/12.2068521
Dong L., Yang W., Zhang K., Zhen S., Cheng X., Wu L. (2020). Study of marsh wetland landscape pattern evolution on the Zoigê Plateau due to natural/human dual-effects. PeerJ 8, e9904. doi: 10.7717/peerj.9904
Fei Y., Wang J. Y., Wang. Z. G. (2019). Dynamic changes of land desertification in Zoige Plateau. J. Arid Land Resour. Environ. 33, 146–152. doi: 10.13448/j.cnki.jalre.2019.240
Fekri E., Latifi H., Amani M., Zobeidinezhad A. (2021). A training sample migration method for wetland mapping and monitoring using sentinel data in google earth engine. Remote Sens. 13 (20), 4169. doi: 10.3390/rs13204169
Fu L., Bo T., Du G., Zheng X. (2012). Modeling the responses of grassland vegetation coverage to grazing disturbance in an alpine meadow. Ecol. Model. 247, 221–232. doi: 10.1016/j.ecolmodel.2012.08.027
Gao J., Li X., Brierley G. (2012). Topographic influence on wetland distribution and change in Maduo County, Qinghai-Tibet Plateau, China. J. Mountain Sci. 9, 362–371. doi: 10.1007/s11629-009-2263-0
Haralick R. M., Shanmugam K., Dinstein I. H. (1973). Textural features for image classification. IEEE Trans. Systems Man Cybernetics 6), 610–621. doi: 10.1109/TSMC.1973.4309314
He X. H., Si J. H., Zhu L., Zhou D. M., Zhao C. Y., Jia B., et al. (2023). Modeling habitat suitability of Hippophae rhamnoides L. using MaxEnt under climate change in China: A case study of H. r. sinensis and H. r. turkestanica. Front. For. Glob. Change 5, 1095784. doi: 10.3389/ffgc.2022.1095784
Hou M., Ge J., Gao J., Meng B., Li Y., Yin J., et al. (2020). Ecological risk assessment and impact factor analysis of alpine wetland ecosystem based on LUCC and boosted regression tree on the Zoige Plateau, China. Remote Sens. 12 (3), 368. doi: 10.3390/rs12030368
Huang H., Zhou Y., Qian M., Zeng Z. (2021). Land use transition and driving forces in Chinese Loess Plateau: A case study from Pu County, Shanxi Province. Land 10 (1), 67. doi: 10.3390/land10010067
Huete A., Didan K., Miura T., Rodriguez E.P., Gao X., Ferreira L. G. (2002). Overview of the radiometric and biophysical performance of the MODIS vegetation indices. Remote Sens. Environ. 83 (1-2), 195–213. doi: 10.1016/S0034-4257(02)00096-2
Huo H., Sun C. (2021). Spatiotemporal variation and influencing factors of vegetation dynamics based on Geodetector: A case study of the northwestern Yunnan Plateau, China. Ecol. Indic. 130, 108005. doi: 10.1016/j.ecolind.2021.108005
Junk W. J., An S., Finlayson C. M., Gopal B., Květ J., Mitchell S. A. (2013). Current state of knowledge regarding the world’s wetlands and their future under global climate change: a synthesis. Aquat. Sci. 75, 151–167. doi: 10.1007/s00027-012-0278-z
Li K., Chen Y. (2018). A Genetic Algorithm-based urban cluster automatic threshold method by combining VIIRS DNB, NDVI, and NDBI to monitor urbanization. Remote Sens. 10 (2), 277. doi: 10.3390/rs10020277
Li X.-L., Gao J., Brierley G., Qiao Y.-M., Zhang J., Yang. Y.-W. (2013). Rangeland degradation on the Qinghai-Tibet plateau: Implications for rehabilitation. Land Degrad. Dev. 24 (1), 72–80. doi: 10.1002/ldr.1108
Li Z., Lyu S., Chen H., Ao Y., Zhao L., Wang S., et al. (2021). Changes in climate and snow cover and their synergistic influence on spring runoff in the source region of the Yellow River. Sci. Total Environ. 799, 149503. doi: 10.1016/j.scitotenv.2021.149503
Li J., Pei Y., Zhao S., Xiao R., Sang X., Zhang C. (2020). A review of remote sensing for environmental monitoring in China. Remote Sens. 12 (7), 1130. doi: 10.3390/rs12071130
Li L., Shen H., Dai S., Xiao J., Shi X. (2012). Response of runoff to climate change and its future tendency in the source region of Yellow River. J. Geogr. Sci. 22 (3), 431–440. doi: 10.1007/s11442-012-0937-y
Li W., Xue P., Liu C., Yan H., Zhu G., Cao Y. (2020). Monitoring and landscape dynamic analysis of alpine wetland area based on multiple algorithms: A case study of Zoige plateau. Sensors 20 (24), 7315. doi: 10.3390/s20247315
Liang T., Cui X., Feng Q. S., Wang Y., Wen Tao X. (2009). Remotely sensed dynamics monitoring of grassland aboveground biomass and carrying capacity during 2001-2008 in Gannan pastoral area. Acta Prataculturae Sin. 18 (6), 12–22. doi: 10.3321/j.issn:1004-5759.2009.06.002
Liu D., Chen N., Zhang X., Wang C., Du W. (2020). Annual large-scale urban land mapping based on Landsat time series in Google Earth Engine and OpenStreetMap data: A case study in the middle Yangtze River basin. ISPRS J. Photogramm. Remote Sens. 159, 337–351. doi: 10.1016/j.isprsjprs.2019.11.021
Liu G., Zhang L., Zhang Q., Musyimi Z., Jiang Q. (2014). Spatio–temporal dynamics of wetland landscape patterns based on remote sensing in Yellow River Delta, China. Wetlands 34, 787–801. doi: 10.1007/s13157-014-0542-1
Mabwoga S. O., Thukral A. K. (2014). Characterization of change in the Harike wetland, a Ramsar site in India, using landsat satellite data. SpringerPlus 3 (1), 1–11. doi: 10.1186/2193-1801-3-576
Maleki S., Rahdari V., Baghdadi N., Pahlevanravi A. (2021). Where are greater climate change adaptation measures needed in a wetland? Wetlands 41 (6), 74. doi: 10.1007/s13157-021-01471-0
McFeeters S. K. (1996). The use of the NorMalized Difference Water Index (NDWI) in the delineation of open water features. Int. J. Remote Sens. 17 (7), 1425–1432. doi: 10.1080/01431169608948714
Mu Y., Li X., Liang C., Li P., Guo Y., Liang F., et al. (2021). Rapid landscape assessment for conservation effectiveness of wetland national nature reserves across the Chinese mainland. Global Ecol. Conserv. 31, e01842. doi: 10.1016/j.gecco.2021.e01842
Özelkan E. (2020). Water body detection analysis using NDWI indices derived from landsat-8 OLI. Polish J. Environ. Stud. 29 (2), 1759–1769. doi: 10.15244/pjoes/110447
Rodriguez-Galiano V. F., Ghimire B., Rogan J., Chica-Olmo M., Rigol-Sanchez J. P. (2012). An assessment of the effectiveness of a random forest classifier for land-cover classification. ISPRS J. Photogramm. Remote Sens. 67, 93–104. doi: 10.1016/j.isprsjprs.2011.11.002
Roughgarden J., Running S. W., Matson P. A. (1991). What does remote sensing do for ecology? Ecology 72 (6), 1918–1922. doi: 10.2307/1941546
Sadeghi R., Zarkami R., Sabetraftar K., Van Damme P. (2012). Use of support vector machines (SVMs) to predict distribution of an invasive water fern Azolla filiculoides (Lam.) in Anzali wetland, southern Caspian Sea, Iran. Ecol. Model. 244, 117–126. doi: 10.1016/j.ecolmodel.2012.06.029
Saha T. K., Pal S., Sarkar R. (2021). Prediction of wetland area and depth using linear regression model and artificial neural network based cellular automata. Ecol. Inf. 62, 101272. doi: 10.1016/j.ecoinf.2021.101272
Shen G., Yang X., Jin Y., Luo S., Xu B., Zhou Q. (2019a). Land use changes in the Zoige Plateau based on the object-oriented method and their effects on landscape patterns. Remote Sens. 12 (1), 14. doi: 10.3390/rs12010014
Shen G., Yang X., Jin Y., Xu B., Qingbo Z. (2019b). Remote sensing and evaluation of the wetland ecological degradation process of the Zoige Plateau Wetland in China. Ecol. Indic. 104, 48–58. doi: 10.1016/j.ecolind.2019.04.063
Shen M., Zhang G., Cong N., Wang S., Kong W., Piao S. (2014). Increasing altitudinal gradient of spring vegetation phenology during the last decade on the Qinghai–Tibetan Plateau. Agric. For. Meteorol. 189, 71–80. doi: 10.1016/j.agrformet.2014.01.003
Sun W., Liu K., Ren G., Liu W., Yang G., Meng X., et al. (2021). A simple and effective spectral-spatial method for mapping large-scale coastal wetlands using China ZY1-02D satellite hyperspectral images. Int. J. Appl. Earth Observ. Geoinform. 104, 102572. doi: 10.1016/j.jag.2021.102572
Tucker C. J. (1979). Red and photographic infrared linear combinations for monitoring vegetation. Remote Sens. Environ. 8 (2), 127–150. doi: 10.1016/0034-4257(79)90013-0
Wan L., Zhang H., Wang T., Li G., Lin H. (2018). Mangrove species discrimination from very high resolution imagery using gaussian markov random field model. Wetlands 38, 861–874. doi: 10.1007/s13157-017-0925-1
Wang R., He M., Niu Z. (2020). Responses of alpine wetlands to climate changes on the Qinghai-Tibetan Plateau based on remote sensing. Chin. Geogr. Sci. 30, 189–201. doi: 10.1007/s11769-020-1107-2
Wang G., Li X., Zhao K., Li Y., Sun X. (2022). Quantifying the spatio-temporal variations and impacts of factors on vegetation water use efficiency using STL decomposition and geodetector method. Remote Sens. 14 (23), 5926. doi: 10.3390/rs14235926
Wondie A. (2018). Ecological conditions and ecosystem services of wetlands in the Lake Tana Area, Ethiopia. Ecohydrol. Hydrobiol. 18 (2), 231–244. doi: 10.1016/j.ecohyd.2018.02.002
Xu H. (2006). Modification of norMalised difference water index (NDWI) to enhance open water features in remotely sensed imagery. Int. J. Remote Sens. 27 (14), 3025–3033. doi: 10.1080/01431160600589179
Yan W., Wang Y., Chaudhary P., Ju P., Zhu Q., Kang X., et al. (2022). Effects of climate change and human activities on net primary production of wetlands on the Zoige Plateau from 1990 to 2015. Global Ecol. Conserv. 35, e02052. doi: 10.1016/j.gecco.2022.e02052
Yan Z., Wu N. (2005). Rangeland privatization and its impacts on the Zoige wetlands on the Eastern Tibetan Plateau. J. Mountain Sci. 2, 105–115. doi: 10.1007/BF02918326
Yang Y., Bao W., Li Y., Wang Y., Chen Z. (2020). Land use transition and its eco-environmental effects in the Beijing–Tianjin–Hebei urban agglomeration: A production–living–ecological perspective. Land 9 (9), 285. doi: 10.3390/land9090285
Yang Y., Yang D., Wang X., Zhang Z., Nawaz Z. (2021). Testing accuracy of land cover classification algorithms in the qilian mountains based on gee cloud platform. Remote Sens. 13 (24), 5064. doi: 10.3390/rs13245064
Yang H., Zhong X., Deng S., Nie S. (2022). Impact of LUCC on landscape pattern in the Yangtze River Basin during 2001–2019. Ecol. Inf. 69, 101631. doi: 10.1016/j.ecoinf.2022.101631
Ye J., Hu Y., Zhen L., Wang H., Zhang Y. (2021). Analysis on Land-Use Change and its driving mechanism in Xilingol, China, during 2000–2020 using the google earth engine. Remote Sens. 13 (24), 5134. doi: 10.3390/rs13245134
Yue D.-X., Zeng J.-J., Yang C., Zou M.-L., Li K., Chen G.-G., et al. (2018). Ecological risk assessment of the Gannan Plateau, northeastern Tibetan Plateau. J. Mountain Sci. 15 (6), 1254–1267. doi: 10.1007/s11629-017-4466-0
Zhang X., Fu S., Hu Z., Zhou J., Zhang X. (2021). Changes detection and object-oriented classification of major wetland cover types in response to driving forces in Zoige county, Eastern Qinghai–Tibetan plateau. IEEE J. Select. Topics Appl. Earth Observ. Remote Sens. 14, 9297–9305. doi: 10.1109/jstars.2021.3104223
Zhang T., Li D., Lu X. (2022). Response of runoff components to climate change in the source-region of the Yellow River on the Tibetan plateau. Hydrol. Processes 36 (6), e14633. doi: 10.1002/hyp.14633
Zhang B., Niu Z., Zhang D., Huo X. (2022). Dynamic changes and driving forces of alpine wetlands on the Qinghai–Tibetan Plateau based on long-term time series satellite data: a case study in the Gansu Maqu wetlands. Remote Sens. 14 (17), 4147. doi: 10.3390/rs14174147
Zhang X., Sun S., Yong S., Zhou Z., Wang R. (2007). Vegetation map of the people’s republic of China (1: 1000000). Geol. Publ. House.
Zhang Y., Wang G., Wang Y. (2011). Changes in alpine wetland ecosystems of the Qinghai–Tibetan plateau from 1967 to 2004. Environ. Monit. Assess. 180, 189–199. doi: 10.1007/s10661-010-1781-0
Zhang W., Yi Y., Song K., Kimball J. S., Lu Q. (2016). Hydrological response of alpine wetlands to climate warming in the eastern Tibetan Plateau. Remote Sens. 8 (4), 336. doi: 10.3390/rs8040336
Zhao Q. G., Song J. (2004). Wetland utilization and protection in China.” In. Wetlands Ecosyst. Asia, (Elsevier). 1, 27–34. doi: 10.1016/B978-044451691-6/50005-3
Zhou Y., Liu T., Duan L., Wang Y., Li X., Li. M. (2020). Driving force analysis and landscape pattern evolution in the upstream valley of Xilin River Basin. Arid Zone Res. 37 (3), 580–590. doi: 10.13866/j.azr.2020.03.05
Zhou R., Yang C., Li E., Cai X., Yang J., Xia Y. (2021). Object-based wetland vegetation classification using multi-feature selection of unoccupied aerial vehicle RGB imagery. Remote Sens. 13 (23), 4910. doi: 10.3390/rs13234910
Keywords: Google Earth Engine, alpine wetlands, long-term time series, wetland change, driving factor
Citation: Jiang R, Liu J, Liu W, Zhang D and Hu W (2023) Changes and driving forces analysis of alpine wetlands in the first meander of the Yellow River based on long-term time series remote sensing data. Front. Ecol. Evol. 11:1193059. doi: 10.3389/fevo.2023.1193059
Received: 24 March 2023; Accepted: 02 August 2023;
Published: 23 August 2023.
Edited by:
Shuisen Chen, Guangzhou Institute of Geography, ChinaReviewed by:
Guangliang Zhang, Beijing Normal University, ChinaCopyright © 2023 Jiang, Liu, Liu, Zhang and Hu. This is an open-access article distributed under the terms of the Creative Commons Attribution License (CC BY). The use, distribution or reproduction in other forums is permitted, provided the original author(s) and the copyright owner(s) are credited and that the original publication in this journal is cited, in accordance with accepted academic practice. No use, distribution or reproduction is permitted which does not comply with these terms.
*Correspondence: Jingfeng Liu, bGl1amluZ2Zlbmc3NzMyQDEyNi5jb20=
Disclaimer: All claims expressed in this article are solely those of the authors and do not necessarily represent those of their affiliated organizations, or those of the publisher, the editors and the reviewers. Any product that may be evaluated in this article or claim that may be made by its manufacturer is not guaranteed or endorsed by the publisher.
Research integrity at Frontiers
Learn more about the work of our research integrity team to safeguard the quality of each article we publish.