
94% of researchers rate our articles as excellent or good
Learn more about the work of our research integrity team to safeguard the quality of each article we publish.
Find out more
ORIGINAL RESEARCH article
Front. Ecol. Evol. , 04 July 2023
Sec. Evolutionary and Population Genetics
Volume 11 - 2023 | https://doi.org/10.3389/fevo.2023.1190549
This article is part of the Research Topic Biodiversity of Sensory Systems in Chordates View all 3 articles
 Neil D. Clarke1
 John S. Taylor2*
Introduction: Opsins are a large and sequence-diverse family of light-responsive G-protein coupled receptors involved in vision, circadian rhythm, and other processes. Numerous subfamilies have been defined based on sequence similarity, cell-type localization, signal transduction mechanism, or biological function, but there is no consensus classification system.
Methods: We used multiple hidden Markov models (HMMs) to identify opsins in the UniProt Reference Proteomes database. Opsin-specific HMMs were also used in an annotation procedure that represents sequences as a vector of HMM scores and assess the similarity of these vectors to those of annotated sequences. UniProt Reference Proteomes are built from genome sequences, allowing us to make meaningful comparisons of the number of opsins in each of the 260 species available at the time of the survey in absolute terms and relative to a larger superfamily of which opsins are a member.
Results: More than 2,000 opsins were retrieved from 262 species (all metazoans).
Discussion: Merging opsin counts into higher order taxa paints a broad view of the taxonomic distribution of opsins, and of opsin subfamilies, annotated according to three different schemes.
Retinylidene proteins are 7-helix transmembrane proteins that detect light via a covalently linked chromophore, typically 11-cis retinal (Spudich et al., 2000). The ligand-bound forms of retinylidene proteins are sometimes referred to generically as rhodopsins, in common with the name that is used more specifically for the visual receptors found in mammalian rod cells. The apo-form of these proteins, and their sequences, are called opsins. Two classes of opsins exist. The extent to which they differ from one another, e.g., in sequenceand structure, indicates that they are not homologous (Spudich et al., 2000; Oakley and Speiser, 2015). Type 1 opsins are found in archaea and bacteria where they act as light-powered ion pumps and as sensory proteins (Oesterhelt, 1976; Spudich, 2006; Engelhard et al., 2018). As sensory proteins, some act through protein–protein interactions while others are ion channels, opening or closing in a light-dependent manner. Type II opsins, on the other hand, are found only in animals where they have roles in phototropism, circadian rhythm entrainment, and vision (Terakita, 2005). Except for some that act as enzymes to re-isomerize retinal after its dissociation from rhodopsin, all of the Type-II opsins are G-protein coupled receptors (GPCRs). The subject of our analysis here is the diversity and taxonomic distribution of Type II opsins, hereafter “opsins”.
Light provides valuable information to an organism. Perhaps the most obvious way that it can be used is to form an image of an organism’s surroundings. Image formation occurs when an array of light-sensing cells is connected neuronally, with some kind of processing to convert those signals into an internal representation of the outside world. There are many ways light can be used, though, that do not require image formation. The intensity of light, or the relative intensities at different wavelengths, can tell an organism which direction to go in to find food, for example, or when it should hide, or flee. Integrated over longer periods, light can entrain circadian rhythms and, over longer periods still, signal seasonal changes that are relevant to the organism’s life cycle. Given the number of ways in which light information might be used it is not surprising that that opsins have been found in a variety of tissues and a great diversity of vertebrate and invertebrate species (Pennisi, 2013; Porter, 2016). Melanopsin, for example, was first discovered in the skin of frogs where it mediates light-dependent skin color changes (Provencio et al., 1998). Subsequently, homologs were shown to be expressed in the retinal ganglia of many vertebrates (i.e., in intrinsically photosensitive Retinal Ganglion Cells or ipRGCs), where they have an essential role in circadian rhythm entrainment (Provencio et al., 2000). Pinopsins have a similar function in circadian rhythm, and were first found in the pineal glands of birds (Okano et al., 1994). The functions of other opsin families are less clear. Neuropsin, as its name suggests, is found in a variety of neuronal tissues including eye, brain, and spinal cord (Tarttelin et al., 2003). In retina, neuropsin seems to function in a retinal-specific circadian entrainment mechanism that is independent of that of the organism as a whole, but what it is doing in other neuronal tissues is a mystery (Buhr et al., 2015). Even more enigmatically, it is expressed at high levels in testis (Tarttelin et al., 2003). The “teleost multi-tissue” opsins (TMT), discovered in fish but found in other vertebrates, are localized to a variety of neuronal and non-neuronal tissues, where they seem to be involved in “peripheral” circadian clock mechanisms (Moutsaki et al., 2003).
As is clear from the few examples cited above, some opsin families are named for the tissue in which they were first found. Others are named on the basis of the cell type in which the opsin was originally found (e.g., c-opsins for ciliary cells and r-opsins for rhabodmeric cells) or the type of G-protein that is used in signal transduction (e.g., Gt, Gq, and Go opsins) (Terakita, 2005). Different names are sometimes used to emphasize different aspects of their evolutionary history, phylogenetic distribution, history of discovery, biological function, the cell-type in which they are found, or the signal transduction pathway through which they operate. Determining whether these terms are synonymous with one another, or are subsets or supersets of each other, or are entirely disjoint, can be challenging.
As the number of homologous sequences continues to grow, the relationships among families should become clearer and better supported. However, aligning new sequences with old, and re-clustering those sequences, can be time-consuming. Furthermore, the results can be sensitive to the selection of sequences and the tree-construction method. An alternative to repeated re-clustering is to use hidden Markov models (HMMs) to essentially “freeze” the representation of a subfamily. Starting from an alignment of family members, HMMs infer position-specific substitution scores for each of the twenty amino acids, using the observed frequency with which each amino acid is found at a given position to modify “prior” expectations for substitution based on a generic substitution matrix (Eddy, 1998). HMMs also model position-specific insertion and deletion probabilities and their lengths. In practical terms, an HMM is a description of an existing alignment to which all other sequences can be subsequently scored and aligned in a consistent and reproducible way.
Databases of HMMs are widely used in genome annotations and matches to HMMs are included in the output of BLAST searches run at the NCBI web site. One of the best known HMM databases was Pfam, with nearly 18,000 HMMs in release 32.0 (El-Gebali et al., 2019). Although Pfam merged with InterPro (https://www.ebi.ac.uk/interpro/) in late 2022, Pfam HMMs were retained. A significant match of a sequence to a Pfam HMM is strong evidence that the sequence (or the portion of the sequence that aligns to the HMM) has essentially the same structure as the aligned sequences that were used to construct the HMM. It is generally reasonable to infer, as well, that the function is related in some way. With what specificity function can be inferred, though, and with what confidence, depends greatly on how similar in function the sequences were that had been used to construct the HMM in the first place.
UniProt Reference Proteomes are protein coding sequences derived from genome sequences (UniProt Consortium, 2019). The use of genome sequences to infer the protein-coding complement of a species makes the enumeration of homologs more consistent than if the sequences were obtained from RNA-seq analysis or, much less useful yet, targeted cloning or PCR amplification. The UniProt Reference Proteomes were selected from the larger UniProt Knowledge Database with an eye towards reducing redundancy while maintaining a diverse sampling of organisms. At the time of this survey, the UniProt Reference Proteome represented nearly 1,400 eukaryote species and 24 million sequences. In short, the UniProt Reference Proteomes are a standard, independently maintained set of (nearly) complete proteomes, phylogenetically-diverse and pre-analyzed using 18,000 HMMs. Here, we describe our use of Pfam, the UniProt Reference Proteomes, and a set of opsin-specific HMMs that we constructed to identify more than 2,000 opsins and characterize their phylogenetic distribution. For brevity, we refer to the UniProt Reference Proteome sequences found in Pfam release 32.0 as “UniProt sequences”, and to the opsin sequences we extracted from this set as “UniProt opsins”.
We began our analysis with seventeen opsin sequences that span the diversity of subfamilies depicted in the opsin tree of Terakita (2005). All seventeen opsins were determined by Pfam to be significant matches to the 7tm_1 (PF0001) HMM. With a trivial exception, none showed a significant match to any other Pfam HMM. The sole exception to the exclusive matching of opsins to 7tm_1 was bovine rhodopsin, which, matches a second HMM (Rhodopsin_N, PF10413) over 37 amino acids in a region N-terminal to the domain matched by 7tm_1. Importantly, of the thousands of HMMs that are not matched by the opsin sequences, 44 occur in the Pfam GPCR-A “clan” (now referred to as an InterPro “set”), and thus have “specificities” related to 7tm_1. GPCR-A is named for the fact that most of its members, if not all, recognize families of G-protein coupled receptors (GPCRs). The sensitivity of the 7tm_1 HMM to all seventeen opsins tested, and the absence of significant matches to any other HMM in the GPCR-A clan, suggests that specific recognition by 7tm_1 might be a shared characteristic of opsin sequences. However, the converse is not true: recognition by 7tm_1 does not mean that a sequence is an opsin. The 7tm_1 HMM was derived from an alignment of “rhodopsin-like receptors”, a large and diverse group of GPCRs, with an estimated 19 subfamilies of distinct ligand specificity (Joost and Methner, 2002). Opsins are only one of these subfamilies.
Our first task was to construct one or more HMMs that would be capable of distinguishing opsins from non-opsins among 7tm_1 hits. We began with the seventeen opsin sequences mentioned above. Each was used as a query in a high-stringency PSI-BLAST search, progressively relaxing stringency, if required, in order to obtain 250 homologs (Methods). Additional steps produced sequence alignments that were used to construct HMMs (Methods). The seventeen HMMs that result were used to score UniProt Reference Proteome sequences that the Pfam database had indicated were significantly matched by 7tm_1, and with a higher score than to any other HMM of the same clan (GPCR-A). In order to restrict our analysis to the highest-confidence sequences, we filtered the Pfam 7tm_1 sequence set to remove short matches to the 7tm_1 HMM, which we were concerned might be pseudogenes, errors in genome assembly, or errors in inferring protein coding sequences in those genomes. Specifically, we removed from the sequence set all sequences that, when aligned to the 7tm_1 HMM, aligned at fewer than 200 positions. This left us with 45,003 sequences, of which 2,421 scored higher with at least one of the seventeen opsin HMMs than with 7tm_1.
The UniProt opsin sequences are associated with NCBI taxonomic identification numbers for the species from which they came and, from that number, the identification numbers and names for higher-level taxonomic classifications can be extracted (Methods). The 2,421 opsin sequences came from 262 species, all of them animals (Kingdom Metazoa). An additional 29 Metazoan species in UniProt possessed 7tm_1 sequences, but no detectable opsins. Altogether, there were 291 UniProt Metazoan species with an average of 155 7tm_1 sequences and an average of 8.3 opsins.
Figure 1 shows the distribution of opsins across Phyla, plus, for Arthropods and Chordates, individual Classes. The number of opsins per species was as low as zero for Chilopoda (millipedes and centipedes) and Appendicularia (tunicates). Both Classes, however, were represented by single species in the UniProt set. Whether the absence of opsins in these species is representative of their taxa, or, perhaps, the genomes of these species are less well determined and annotated than many of the species in UniProt, is impossible to determine from these data. The rest of the taxa ranged from 0.4 opsins per species (Phylum Nematoda; 65 species) to 38.3 (Class Actinopteri; 15 species).
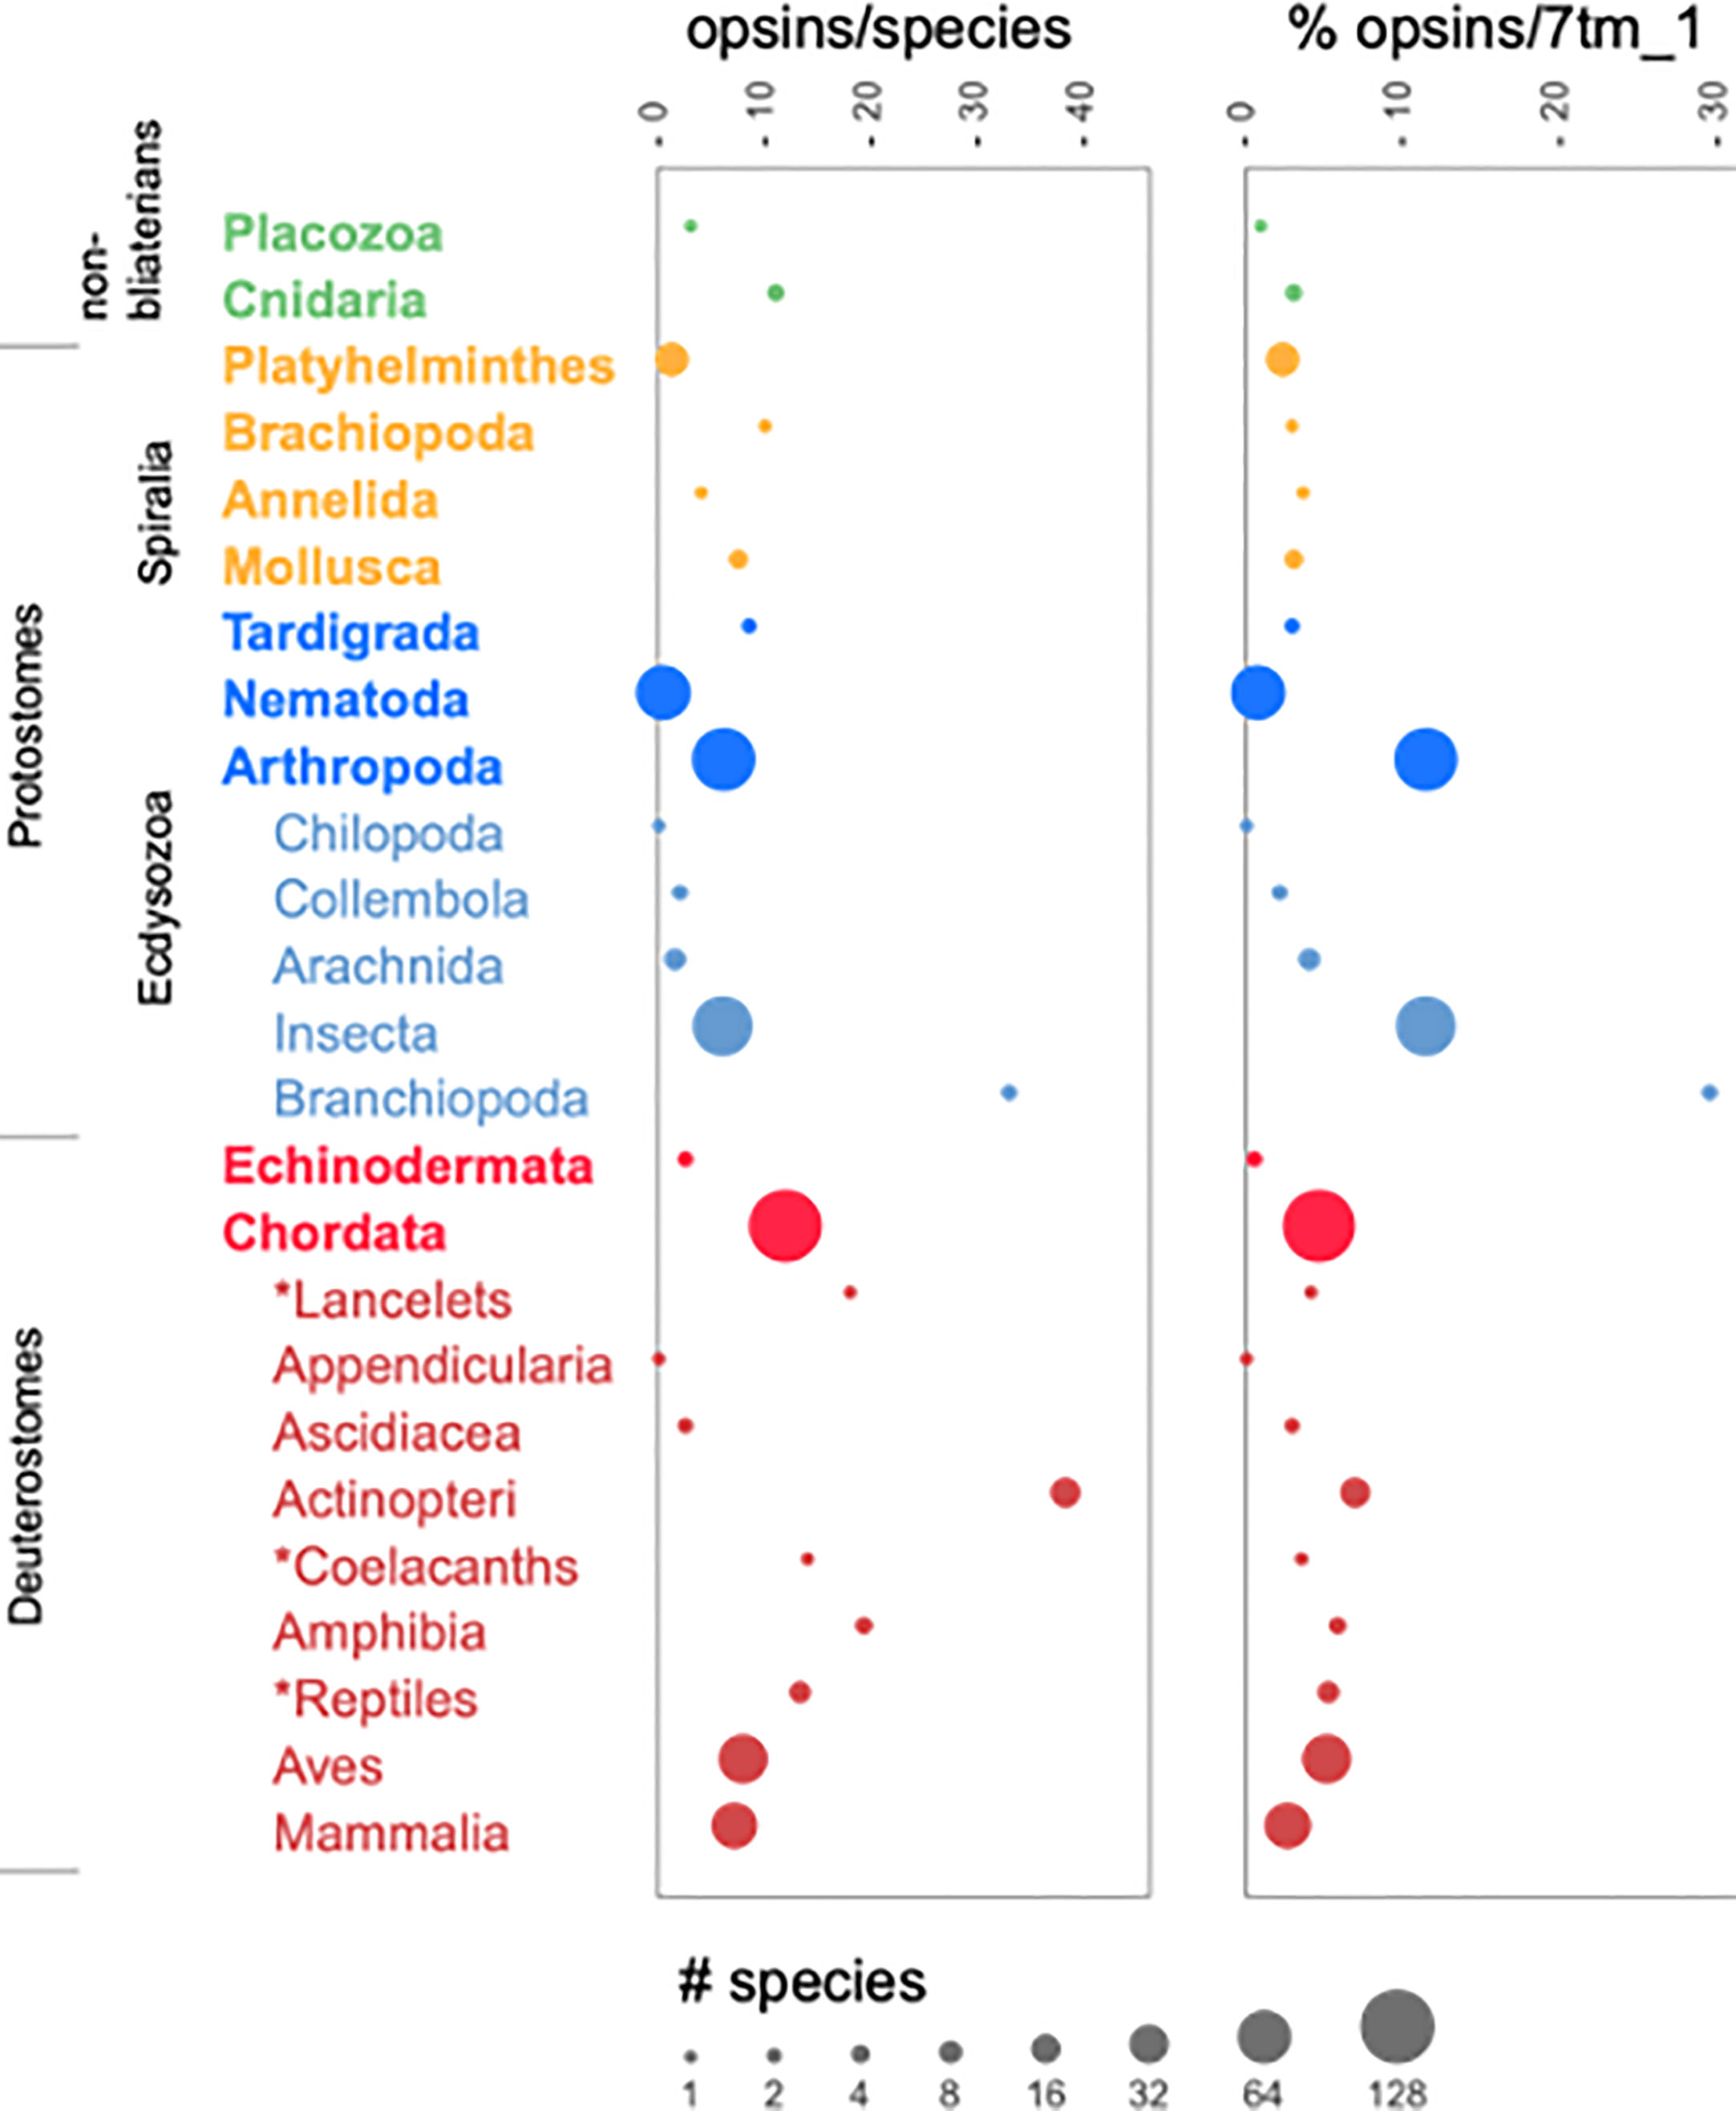
Figure 1 Opsin numbers by taxonomic rank. For each taxon, the number of species found in the UniProt sequence set is related to the area of the circle, as indicated by the key. The plot on the left shows the average numbers of opsins per species; the one on the right shows the number of opsins normalized to the number of 7tm_1 sequences in the taxon. The names of phyla are shown in bold. For Arthropoda and Chordata, Classes within those phyla are shown as well, indented and unbolded. The asterisks identify clades that do not have formal Class names in the NCBI taxonomy. All taxa for which 7tm_1 sequences were found are included. The names written vertically are for groups of phyla that are referred to in the text or in other figures.
The expansion of opsins in fish, due in part to a genome duplication event in the common ancestor of teleosts, is well documented (Beaudry et al., 2017). As a way to correct for whole-genome duplications, we normalized the number of opsins in a taxon to the total number of 7tm_1-matching sequences. Even with this correction, Actinopteri had more opsins than other chordate Classes: 6.9% of Actinopteri 7tm_1 sequences were opsins compared to 3.8% of 7tm_1 sequences from non-Actinopteri chordates. This suggests that opsins diverged adaptively and were thus retained preferentially relative to other 7tm_1 sequences, which were surely duplicated to the same extent but then lost.
While Actinopteri had the highest fraction of opsins among Classes of chordates (6.9% of all 7tm_1 sequences), the Phylum Arthropoda had an even higher percentage (11.4%). This value is dominated by the Insecta, which comprised 80 of the 91 Arthropod species in the UniProt sequence set. Three of the other Arthropod classes (Chilopoda, Collembola, and Arachnida) had a combined total of 9 species and average a much lower 2.9% opsins per 7tm_1 sequence. The remaining Class of Arthropods were the Branchiopoda (not to be confused with the Phylum Brachiopoda), represented by two species of a single genus, Daphnia. Although they are members of the same genus, D. pulex and D. magna are thought to have diverged 200 million years ago (Colbourne and Hebert, 1996). Both species have exceptionally large numbers of opsins (Brandon et al., 2017). In our analysis, D. pulex had 41 opsins out of 131 7tm_1 sequences (31%), and D. magna had 25 out of 94 (27%). These numbers are close to, but a bit lower than, the 48 and 32 opsins, respectively, that have been reported elsewhere (Brandon et al., 2017). Presumably the criteria we used to define opsins were more stringent. The new result is that we are able to compare directly the number of opsins in Daphnia to the number in other Classes of Arthropods and to other Phyla, using precisely these same criteria, substantiating the claim that Daphnia have an extraordinarily large number of opsins. Although many fish species, and some Amphibia, have comparable or larger numbers of opsins in absolute terms, only some species of mosquitos (Family: Culcidiae) have opsin percentages, relative to the number of 7tm_1 sequences, that are close to Daphnia. For the Culcidiae as a whole the average value is 16%, but for some species it is on the order of 20–30%.
In summary, most high-level taxonomic groups of animals have an average of 3–10 opsin sequences per species, but there are groups that have more and others that have fewer. The wide range of opsin counts is apparent even when normalizing to the total number of rhodopsin-family GPCR sequences found in each species.
The opsin HMMs described thus far were constructed for the purpose of identifying putative opsins from amongst the broader set of 7tm_1-matched sequences in the Pfam database. In principle these same HMMs could be used to assign opsin sequences to different classes. However, using these HMMs for annotation would bias the annotations to the particular choices we made regarding the seed sequences used in the initial PSI-BLAST searches. We decided, instead, to construct a new set of HMMs through an iterative process that used the UniProt opsin sequences themselves.
The process is described in detail in Methods, but briefly we aligned all opsin sequences to the 7tm_1 HMM, and clustered the sequences in this alignment. Well-supported clusters of at least ten members were used to create a set of 37 “provisional” HMMs. These HMMs were then filtered, clustered, and merged, to produce a final set of 13 sequence alignments and the HMMs that correspond to those alignments (Sequence alignments and HMMs are available in Supplementary Materials – alignedSeqs.for.HMM.build and opsinAnnotationHMMs). By virtue of the way they were constructed, this final set of thirteen HMMs can be expected to represent the diversity of opsins in our sequence set in a more uniform manner than the seventeen HMMs constructed initially.
The final set of thirteen HMMs may also be more specific for opsins. Of the 2,421 sequences that met the criterion of being an opsin with the original set of 17 HMMs (a higher score for at least one of these HMMs compared to 7tm_1), 256 fail to meet this criterion with the final 13-HMM set. While rejected based upon whole-alignment bit-scores, these sequences are suspect by other criteria as well. First, 106 of them constitute the complete membership of two clusters that, among the 37 clusters described above, were the most extreme outliers. Unlike the sequences in every other cluster, the sequences in those two clusters were not well aligned at a position conserved in most other opsins that corresponds to the retinal-linked K296 of bovine rhodopsin. While a group of opsins with glutamic acid at position 296 have recently been described in insects, apart from the K296E substitution, these “gluopsins” are very similar to other opsins (Gühmann et al., 2022). This was not the case for the 256 sequences that were rejected here based upon their opsin vs 7tm_1 bit-scores. Second, of the remaining 150 sequences, none are members of any of the other 35 well-supported clusters described above. While these sequences may be authentic opsins, it seems likely that they were false positives in the initial screen. In any case, the remaining 2,165 sequences constitute a higher-confidence opsin set and was used for all subsequent analyses. These sequences, as well as the 256 that were rejected by the final set of HMMs, are available as Supplementary Material.
For each of the 2,165 opsins, “bit-scores” were obtained using the thirteen new opsin HMMs (Supplementary Material). These bit-score values were converted into an “opsin HMM profile” as described (Methods; Supplementary Material). The profile is essentially a representation of the opsin sequence itself, but of greatly reduced dimensionality, using HMMs to capture the key distinguishing features of opsin sub-families. In addition, for each of the three opsin classification publications we used to guide annotation of our opsin sequences (Terakita, 2005; Ramirez et al., 2016; Beaudry et al., 2017), we took all sets of sequences that had been given the same annotation, represented those sequences as a 13-element opsin HMM profile as described, and then averaged those profiles across the sequences that shared an annotation. The result is a single, averaged opsin HMM profile for each annotated subfamily in each of three published opsin classification publications. In some cases, sequences that were assigned related but distinct annotations had profiles that were very similar. In such cases, we merged the sequence sets, constructed a consensus “annotation HMM profile” from the merged sequences, and gave the profile a name that reflected the annotations of the sequences sets from which it was derived. For example, the Opn4-1 and Opn4-2 sequences of Beaudry et al. (2017), also called Opn4x and Opn4m genes, were not distinguishable with our HMMs. These sequences were therefore merged and the HMM profile that was created from the this sequence set was called “Opn4-[1,2]”. In total, the nineteen annotations of Beaudry et al. were consolidated into ten (Figure 2B). For the annotations of Ramirez et al. (2016), the issue was not the similarity of HMM profiles with the same annotation, but the existence of distinct HMM profiles among sequences with the same annotation. In these cases, we split the sequence sets defined by these workers into multiple groups based on how they clustered according to their HMM profiles (Methods). In the most extreme case, sequences collectively annotated as “canonical c-opsin” were split into seven groups. Each subset of sequences was represented by its own averaged HMM profile, with each subset retaining the annotation given to it by Ramirez et al. (2016). In this way, the nine opsin groups defined by Ramirez et al. are represented by 21 HMM profiles (Figure 2D). Along with the ten HMM profiles for the sequences annotated by Beaudry et al., and twelve for those of Terakita (Figure 2C), this gave a total of 43 phylogeny-derived annotation HMM profiles that can be used to label the UniProt opsin sequence. Profiles from the three classification schemes can resemble one another, of course.
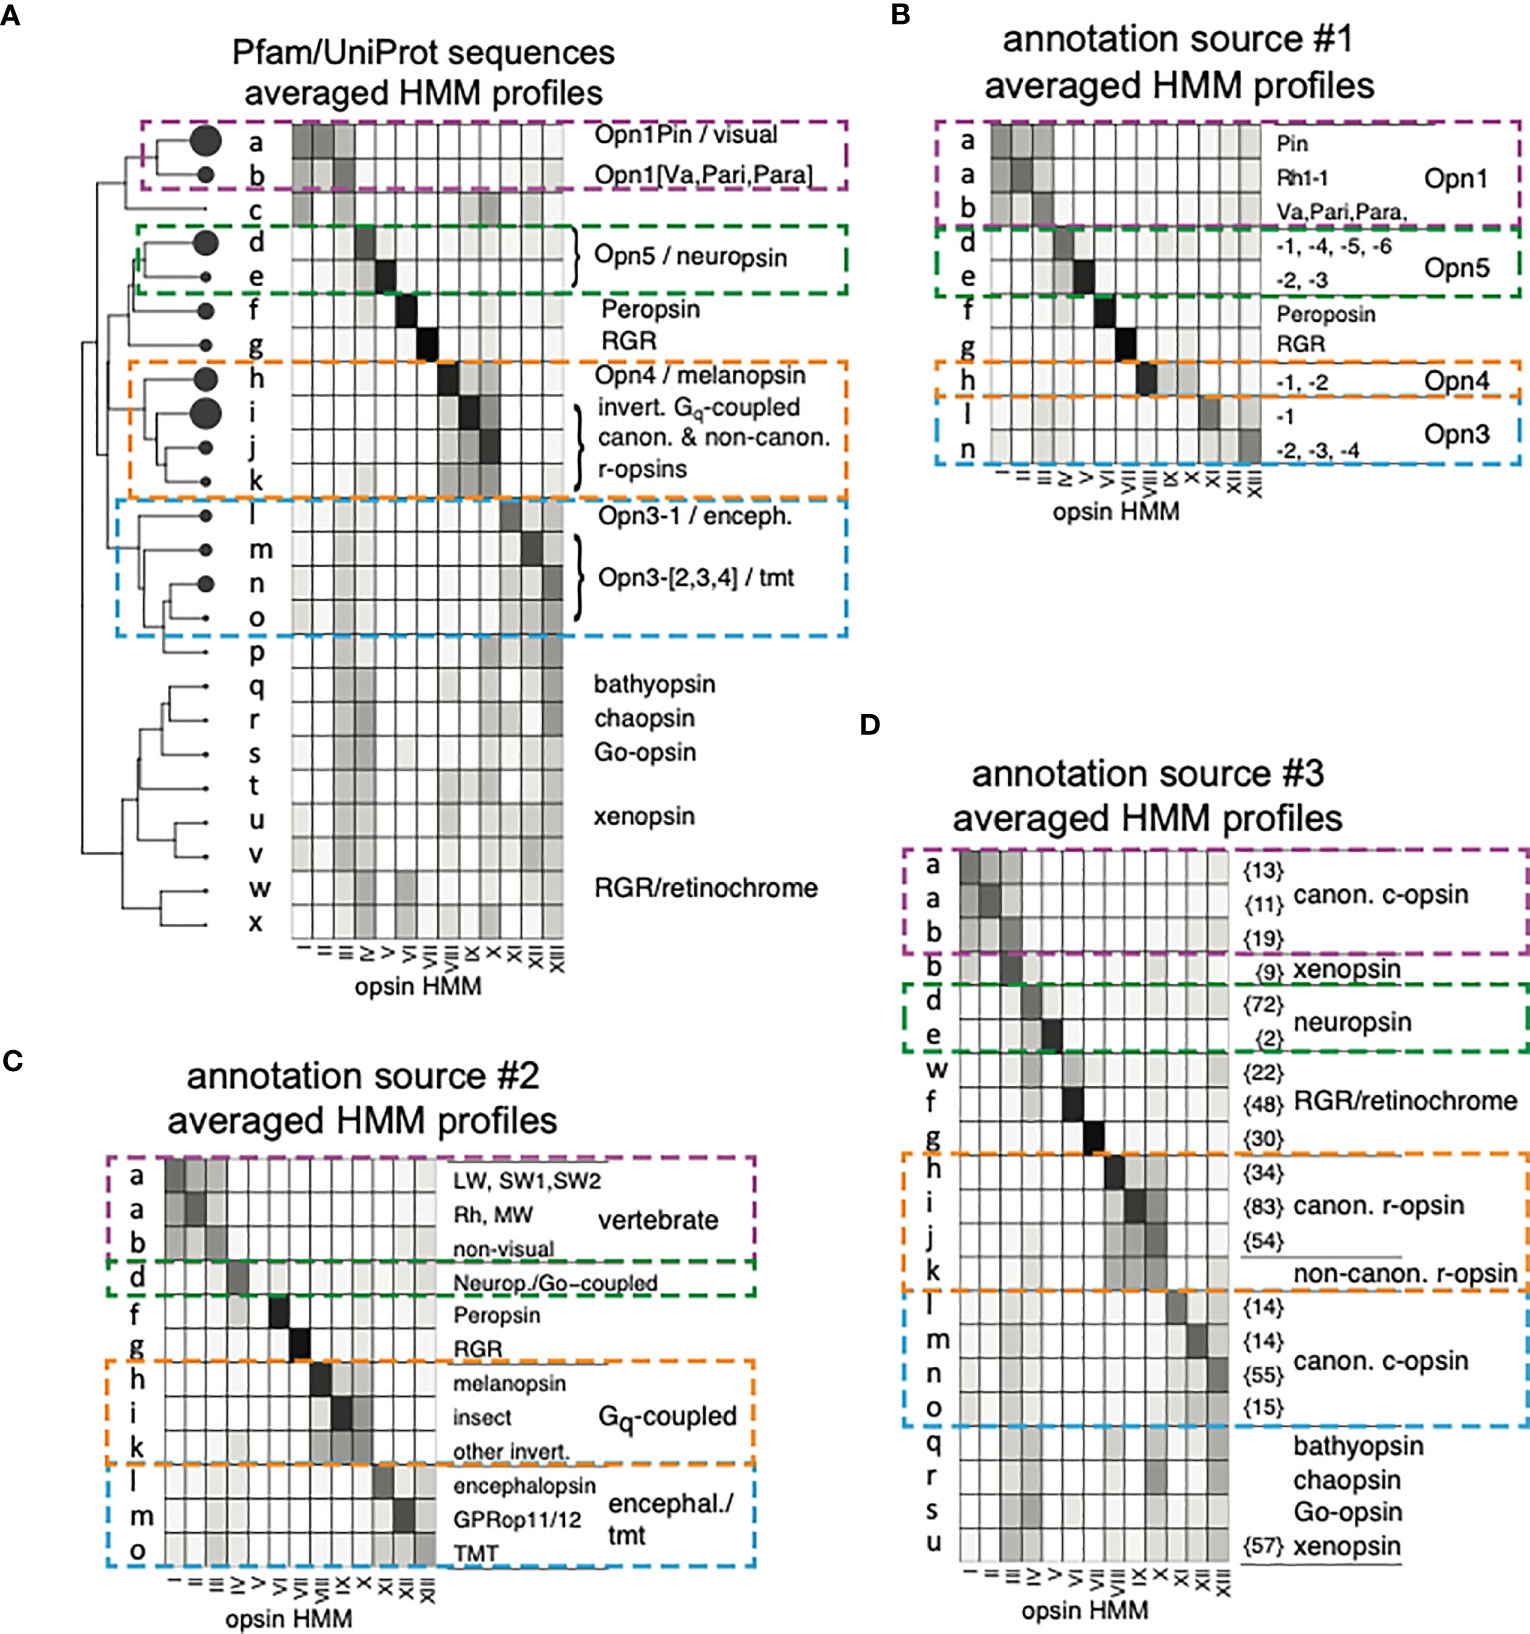
Figure 2 Opsin HMM profiles and their clusters. (A) Dendrogram of opsins clustered by HMM bit-score profiles and a heat map of averaged bit-score profiles for the sequences in each cluster. The circles at the terminal nodes of the dendrogram are proportional in area to the number of sequences in the cluster, with a range if 1 to 435. Lower-case letters denote the sequence clusters (nodes). Bit-score profiles for individual sequences were calculated as described in Methods, and then normalized to the sum of its thirteen values before averaging. Annotations are abstracted from the those shown in (B–D). Four sub-trees are delineated by colored, dashed lines to facilitate comparison of annotations with the heat maps and annotations of the reference sequences in (B–D). (B) Average bit-score profiles for each of ten sets of annotated sequences obtained from Beaudry et al. (2017). Cluster labels reflect the cluster of UniProt opsin sequences in panel A into which the indicated annotation profile clustered. As illustrated by the two annotations profiles labeled “a”, more than one annotation profile from the same source can map to the same UniProt cluster. (C) Same as (B), except the bit-score profiles are for representative sequences that correspond to the annotations of Terakita (2005). (D) Same as for (A, B) except that the heat maps and annotations are derived from the sequences and annotations of Ramirez et al. (2016). Prior to clustering with the UniProt sequences, sequences with the same annotations but distinct HMM profiles were split into different sets (Methods). The number of sequences in each of these sets is indicated by the numbers in curly brackets.
The 43 phylogeny-derived annotation HMM profiles were clustered along with the HMM profiles of the 2,165 individual UniProt opsins (Methods). The dendrogram of HMM profiles was cut to produce a set of clusters, with the height of the cut (the number of clusters) based on the criterion that no cluster was allowed to contain more than one distinct annotation. In other words, any one cluster can contain no more than one of the ten annotation HMM profiles that were derived from the phylogeny of Beaudry et al. Similarly, a cluster can contain no more than one of the twelve annotation HMM profiles derived by Terakita. However, a cluster that contains one of the annotation HMM profiles derived from Terakita can also contain one of the profiles derived from Beaudry et al. For some of the nine clades delimited by Ramirez et al., there is more than one annotation HMM profile. Therefore, for the profiles derived from the sequences of Ramirez et al., more than one profile is allowed in a cluster, but only if the profiles share the same annotation. In order to ensure that annotations are resolved into different clusters as described, we found that a minimum of twenty-four clusters was required, labeled alphabetically (Figure 2A). Of these, nineteen have annotations from at least one of the three sources. Five clusters, labeled c, p, t, v, and x in Figure 2A, have no annotation, but these contain only 24 of the 2,165 opsins. In all cases, these profiles resemble other profiles for which there are annotations, so annotations could be assigned based on the “nearest” labeled cluster. Unless otherwise noted, references below the clustering of sequences should be understood to mean the clustering of opsin HMM profiles that are derived from those sequences.
Having assigned the 2,165 opsin sequences to one of 24 clusters and attached annotations to 99% of the sequences as a consequence of that clustering, we next asked how the different classes of opsin are distributed phylogenetically. Taxonomic assignments were made based on the NCBI species ID number associated with the UniProt sequences, using the NCBI taxonomic hierarchy to infer most of the higher-level taxa (Methods). In some cases, taxon names that are unassigned in the NCBI taxonomy, or clade names that do not correspond to standard taxonomic ranks, were added as needed (Methods). For example, Figure 3 shows data for four groups, one of which (Chordata) is a phylum assigned by the NCBI taxonomy. The other three are higher order groups of phyla. Two of these groups are clades of invertebrates: the Spiralia (with sequences from the phyla Mollusca, Annelida, and Platyhelminthes) and the Ecdysozoa (with sequences from the Arthropoda, Nematoda, and Tardigrada). The remaining group, which we refer to as “non-bilaterians”, consists of 36 sequences from three species of Cnidaria (anemones and corals) and one Placozoa. A lone Porifera (sponge) species was also deemed to have an opsin sequence in the initial screen against 17 HMM, but this sequence was among the 256 rejected by the final set of HMMs.

Figure 3 Distribution of opsin clusters among four high-level taxonomic groups. The dendrogram and node circles are as in Figure 2A. Cluster labels and annotations are shown only for those clusters that inherit annotations from published classifications, as shown in Figure 2. The heat map shows the percentage of each taxonomic group’s opsin sequences that cluster into each of the 24 clusters; black is 100% and white is 0%. Lower-case letters denote the sequence clusters (nodes).
Excluded from Figure 3 are the Echinodermata, which, along with the Chordates, comprise the Deuterostomes. There are only five opsins among the two UniProt echinoderms with 7tm_1 hits, and all of them are in just one of the species (Strongylocentrotus purpuratus, the purple sea urchin; Apostichopus japonicus, a sea cucumber, has none). Given the small number of opsins, and their odd distribution, including the Echinodermata in Figure 3 was deemed uninformative at best, and perhaps misleading. We do refer to the sea urchin opsins below, however, where they seem to inform our understanding of opsin evolution.
Many of the opsins in the non-bilaterian group cluster with sequences to which Ramirez et al. (2016) gave the names xenopsin (cluster u), bathyopsin (q), and chaopsin (r). The novelty of these names derives from Ramirez et al.’s use of sequences that were intentionally weighted towards early-diverging species. The large number of such sequences in their work resulted in well-supported sequence clusters that did not include members of well-characterized opsin families, thus necessitating the new names. In our analysis, about 40% of the non-bilaterian opsins fall into clusters u, q, or r (14/36). In contrast, only 4% of Spiralia sequences are found in these clusters (3/67), none of the Ecdysozoa sequences, and only 1 sequence out of 1,464 in the Chordata. Clusters u, q, and r were part of a larger group of six that includes yet another annotated cluster (s; Go-opsin) that derives its name from the Ramirez classification (Figures 2A, D). This group of six clusters also includes two that are unannotated (t and v). All six of the clusters have average HMM-profiles that are very similar, characterized by multiple HMMs with similar scores, and sharing, in particular, similarly high scores for opsin HMMs III, IV, and XIII Figure 2A). If we consider these six clusters to be a single group, 58% of non-bilaterian sequences are in this group, as are 22% of Spiralia sequences. In the single Echinoderm species that has opsins, two of the five are in this group. For Ecdysozoa and Chordata, however, the fractions are 0.8% and 0.2%, respectively.
The Opn3 sequences of Beaudry et al. are restricted to clusters l (Opn3-1) and n (Opn3-[2,3,4]) but are connected to sequences in clusters m and o by the similarities of their HMM profiles and by their shared annotations as “encephalopsin/tmt” sequences (Terakita, 2005; clusters l,m,o) and as “classical c-opsins” (Ramirez et al., 2016; clusters l,m,n,o). Encephalopsin-like sequences (clusters l,m,n,o) constitute 11–14% of the opsins in Ecdysozoa, Chordata, and non-bilaterians, but are almost completely absent from Spiralia (1 sequence out of 67). An expanded view of the phylogenetic distribution of these sequences is shown in Figure 4A, focusing on their distribution among Classes of Chordata. Among the Chordata species that have UniProt opsins is a lancelet, Branchiostoma floridae. Lancelets, also known as Amphioxus, are invertebrate chordates. Lacking a backbone, but having a notochord, they are thought to resemble the common ancestor of Chordates. Of the eighteen opsins in lancelets, four are in cluster o, and none in the other three clusters that comprise the broader, encephalopsin-like group. This is apparently the ancestral state of the Deuterostomes as the only Echinodermata sequence in the [l,m,n,o] group maps to cluster o, as well. Along with cluster m, cluster o is also where the sequences of non-bilaterians and Protostomes are found. It is only among vertebrates (here, Chordata minus lancelets) that we find what might be called true encephalopsins (cluster l; Opn3-1) and their paralogs (cluster n; Opn3-[2,3,4]). The distribution of Opn3-1 and Opn3-[2,3,4] sequences shifts, within the vertebrates, from being predominantly Opn3-[2,3,4]-like in fish and amphibians, roughly equal in number in reptiles and birds, and exclusively Opn3-1 in mammals.
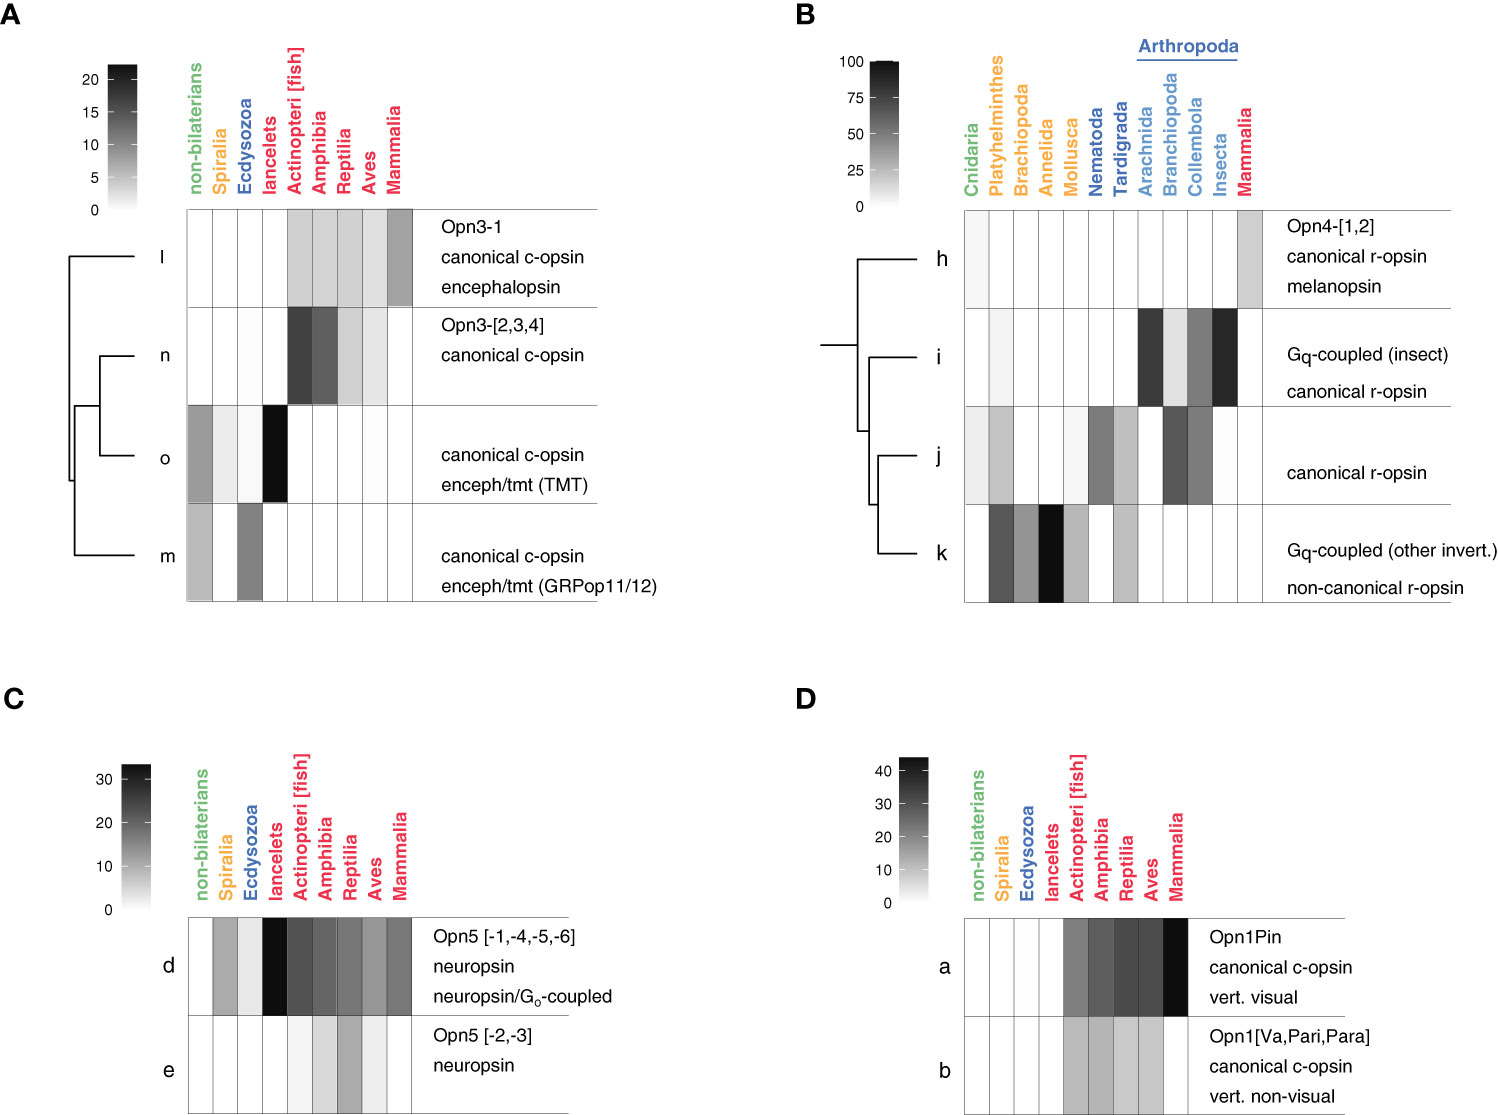
Figure 4 Higher resolution taxonomic distribution for groups of opsins. Heatmaps show the fraction of a taxonomic group’s opsins that fall into the indicated clusters. A key in each panel maps heat map color to the percentage of a taxonomic group’s opsins. Each annotation block has three lines, up to two of which may be blank. The first, second, and third lines of each annotation block are based on annotations in Figures 2B–D, respectively. Lower-case letters denote the sequence clusters (nodes). (A) Opn3/encephalopsin-like family. (B) Opn4/melanopsin-like family. (C) Opn5/neuropsin-like family. (D) Opn1/vertebrate opsin family.
Some features of the Opn1-like sequence distribution (clusters a and b) are similar to what we see in Opn3 (Figures 4A, D). Based on the annotation of sequences by Terakita (2005), cluster a sequences are considered “vertebrate visual opsins” and cluster b sequences “vertebrate non-visual opsins”, The word “vertebrate” in these annotations is validated by the taxonomic distribution of the sequences in these clusters: all sequences come from chordates but none are lancelets, the one non-vertebrate chordate in our set.
There are 138 mammalian sequences in cluster a but none in cluster b. Although cluster b is annotated as “vertebrate non-visual opsins”, the lack of mammalian sequences in this cluster does not mean that mammals lack non-visual opsins. There are several, more distantly related families of non-visual opsins, and mammals have these in some abundance. Among the 44 mammalian species that were represented in the UniProt set at the time of this survey, there were 24 Opn3-1/encephalopsin sequences (cluster l), 40 peropsins (f), 54 neuropsin/Opn5 sequences (d), and 55 melanopsin/Opn4 sequences (h). What mammals do seem to lack are the non-visual opsins found in cluster b, which are annotated by Beaudry et al. (2017) as Opn1Va (vertebrate ancient), Opn1Pari (parietopsin), and Opn1Para (parapinopsin).
Of the four groups of non-visual mammalian opsins mentioned above, we have discussed already the distribution of encephalopsins (Opn3-1 family and paralogs). Of the remainder, peropsins are perhaps the simplest in their taxonomic distribution. They are almost exclusively found in Chordata, including lancelets, and (with variations that could be due to sampling issues, or rare exceptions) they are more or less uniformly distributed, with one gene per species. The sole exceptions to the Chordate-specificity of peropsin are two species of Nematoda that appear to have peropsin-like sequences. Conceivably these are artifacts, either of sequencing or our classification scheme, because Nematodes, in general, lack opsins. In our own analysis, 19 of the 27 Nematode species lack any opsin sequence at all, and the eight that do have one have a median number of just 1.5.
The neuropsin/Opn5 distribution is also rather simple, at least at the taxonomic levels shown in Figures 3, 4C, and at the sequence-family resolution that we have adopted for this group. Six subfamilies of Opn5 were identified by Beaudry et al. (2017), (each with tetrapod and teleost orthologs), while Ramirez et al. (2016) annotated a single group of sequences as “neuropsin”. In our analysis, we found that two HMM profiles (clusters d and e) are sufficient to represent all of these sequences reasonably well, splitting the neuropsin annotation of Ramirez et al. and consolidate the Opn5 annotations of Beaudry et al. Cluster d sequences are absent in the non-bilaterians but are found in each of the bilaterian clades, indicating that these opsins were present in the common ancestor of bilaterians. However, neuropsins constitute far less of the opsin repertoire in Spiralia and Ecdysozoa than they do in Chordata, and inspection of their numbers at lower taxonomic levels suggest the frequent loss of these sequences in different clades. Among the Chordata, most of the vertebrate Classes have examples of neuropsin sequences in cluster d (Opn5-2/Opn5-3 type sequences) as well as cluster e. Cluster d sequences are missing from mammals, however.
The final group of clusters we consider, [h,i,k,l], are annotated as melanopsin (h), Opn4 (h), Gq-coupled opsins (h, i, k), canonical r-opsins (clusters h,i,j), and non-canonical r-opsins (k) (Figure 2). Clusters h,i, and k seem to correspond quite closely to the high-level taxonomic groups of Chordata, Ecdysozoa, and Spiralia, respectively, while cluster j is more widely distributed, with sequence representation from non-bilaterians, Ecdysozoa, and Spiralia (Figure 3), Cluster h, the melanopsins, contains 248 sequences, all but one of which is from a chordate. Most are thought to be involved in circadian rhythm entrainment. In contrast, sequences in cluster i are visual opsins and come almost entirely from Ecdysozoa. Similarly, cluster k sequences are also visual opsins, mostly from Spiralia.
Given the importance of sequences in the i, j, and k clusters to Protostome vision, we decided to look more closely at the taxonomic distribution of these sequences, breaking down the distribution by phylum and, within the Arthropoda, by Order (Figure 4B). The very high-level taxonomic divisions used in Figure 3 suggest a fairly clean distinction between the sequences found in Spiralia and those in Ecdysozoa, but the lower level view of Figure 4B reveals a different picture. Cluster i sequences are not so much Ecdysozoa sequences, it turns out, as they are Arthropoda sequences, because neither of the two non-Arthropoda phyla (Nematoda and Tardigrada) have sequences in cluster i. One of them (Tardigrada; with eight opsins from two species, representing two Families) actually has half its [h,i,j,k] sequences in cluster k, a cluster that is much more characteristic of Spiralia phyla (Figure 3). Even within the Arthropods, two of the Orders (Collembola and Branchiopoda) have half or more of their [h,i,j,k] sequences outside of cluster i. Of greater significance, both functionally and in terms of HMM profile clustering, is the divergence between the [i,j,k] group of Protostome visual opsins and the non-visual melanopsins found in chordates (cluster h). Thus, the diversity represented by clusters h, I, j, and k (OPN4 diversity) is defined by differences in taxa to a greater extent than is the case for other groups of opsins.
We have described here a systematic analysis of opsin classes and their phylogenetic distribution. The analysis has relied on three standard, publicly available, actively maintained resources: HMMs and the HMMER software to build and use them; UniProt Reference Proteomes, and the NCBI taxonomic hierarchy. As sequence numbers continue to grow, these tools can be used to maintain a consistent classification scheme without requiring the repeated alignment and clustering of new sequences with old. One simply needs to score unaligned sequences with the opsin HMMs, and with the Pfam 7tm_1 HMM, and compare those scores tothe 43 annotation profiles to find the one most similar. Alternatively, as average bit-scores for different opsin profile/annotation profile-containing clusters were often considerably higher for a particular HMM, the new HMMs can themselves guide opsin annotation revisions. HMM-delimited opsin groups include: i) Chordate OPN1 opsins (with vertebrate visual opsins best described by HMMs I and II, and the OPN1 non-visual opsins best described by HMM III); ii) OPN5a_neuropsins (HMM IV); iii) OPN5b_neuropsins (HMM V); iv) Peropsins (HMM VI); v) RGR opsins (HMM VII); vi) Chordate OPN4 opsins (HMM XIII); vii) Protostome OPN4 opsins (with ecdysozoan visual opsins best described by HMM IX, and spiralian visual opsins best described by HMM X; viii) Chordate OPN3 encephalopsins (HMM XI); ix) Invertebrate OPN3 encephalopsins (HMM XII), and x) Chordate OPN3 multi-tissue opsins (HMM XIII). The clusters containing opsin profiles and an annotation profile not clearly associated with a particular HMM (e.g., the bathyopsins, chaopsins, and xenopsins) often had comparatively few sequences. An HMM-based annotation approach will likely be possible following the expansion these datasets
While an HMM-based approach is straightforward, it is admittedly not as familiar a method as collecting representative sequences, aligning them, performing a phylogenetic reconstruction, and assigning annotations based on the co-clustering of new sequences with previously annotated ones. There are advantages to the HMM profile method, though, that can compensate for the lack of familiarity. The first is that it is trivial to add new classification schemes and annotations as our understanding of the family grows. One simply scores a set of sequences that share the new annotation using the opsin and 7tm_1 HMMs and construct the averaged HMM profile for those sequences. The new annotation profiles can be added to the 43 we currently have (there is no need to delete or edit them), and everything else remains the same. A second advantage is that, unlike methods that rely on the alignment and re-clustering of new sequences with old ones, one is guaranteed with HMM profiles to get the same result for a given sequence, regardless how many new sequences are analyzed, what their relationships are to each other, and how they relate to the 2,165 sequences already in hand.
It is important to acknowledge, though, that the independence of the method from the number and nature of new sequences is because our 13 HMM profiles have essentially frozen our representation of opsin diversity based on the UniProt opsins available at the time of our survey. As the UniProt Reference Proteomes grow, and especially as under-represented taxa get filled in, the distribution of opsins will change and it will be worth re-building the set of HMMs that represent that diversity.
We had three reasons for using the UniProt Reference Proteomes. First, the Pfam database had already run all ~18,000 HMMs run against all ~19,000 UniProt Reference Proteomes, making it easy to extract ~55,000 high quality opsin candidates (7tm_1 hits, with better scores to 7tm_1 than to any other GPCR-specific HMM). Second, the UniProt Reference Proteomes cover a broad swath of the diversity of life. There are gaps and unevenness in coverage, of course, but that is because there are gaps and unevenness in the selection of organisms for genome sequencing projects. And the fact that the proteomes are derived from genome sequences is the third reason we chose to use this dataset. Using genome-derived sequence sets permits stronger conclusions about the number and distribution of opsins than can be made if we were to use sequences from other sources.
Limiting ourselves to genome-derived sequences, though, does mean that we have omitted sequences of interest. Future surveys could include RNA-seq transcriptomes, especially if these are obtained from multiple related species, from different tissues, and/or from different developmental stages. Certainly, RNA-seq data has been used to infer the expansion or loss of numerous sequence families, even if confidence in the data from any one species is lower than it is for genome sequences (Goh et al., 2019). An example of a missing clade that could be usefully added with RNA-seq data is the Order Odonata (dragonflies and damselflies, mostly). At the time of our search there were no Odonata proteomes in the UniProt Reference Proteome, but there is RNA-seq data from adult and larval eyes of eleven dragonfly Families (twelve species) (Futahashi et al., 2015). Remarkably, Futahashi et al. (2015) found between 15 and 33 opsin genes per species, more than what we found in any of the 80 Insecta species in the UniProt set (mean = 6).
Finally, we have made considerable use of the NCBI taxonomic hierarchy. It is important to recognize that taxonomic classifications are often disputed, and that NCBI, in any case, is not a primary source of phylogenetic information. Nevertheless, the use of NCBI taxon names allowed us to enumerate sequence numbers for different groups of organisms without having to make independent (and ill-informed) decisions about taxonomy.
We identified seventeen representative sub-trees in the opsin tree of Terakita (2005), and for each obtained from sequence databases a representative sequence based on name. These sequences were used separately as queries in a PSI-BLAST search using an E-value threshold of zero (Altschul et al., 1997). If iterations of PSI-BLAST converged before 250 sequences were obtained, the threshold was relaxed successively to 1E-200, 1E-150, and so on until at least 250 sequences were found; this number was deemed sufficiently large to obtain sequences different enough to be useful in constructing HMMs without adding sequences diverged so far from the original sequence that all 17 HMMs became generic opsin-like HMMs. The top 250 sequences were aligned using the Cobalt service at NCBI and downloaded. The alignment was inspected visually. Sequences that were clearly fragments, or which had regions that were obviously different from the other sequences (due, for example, to a frame-shifted DNA sequence) were deleted. Additionally, sequences were trimmed so that none had extensions beyond the aligned regions The sequences were re-aligned with Muscle 3.8.31 (Edgar, 2004). The resulting sequence alignments were used to construct an initial set of HMMs, using the default parameters of hmmbuild in HMMER 3.1b2 (Eddy, 2011).
The Pfam database was recently merged with the InterPro database. Pfam HMMs have been retained and can be employed at InterPro. Pfam “clans” are referred to as InterPro “sets”, but otherwise, the Methods, as described below, are also transferable. Sequences were retrieved from the pfamseq table of the Pfam database that had significant matches to the 7tm_1 HMM, and which scored better with 7tm_1 than with any other HMM in the GPCR-A clan. The latter criterion is met by requiring the “in_full” value in the pfamA_reg_full_significant table to be 1. Retrieved sequences were aligned against the 7tm_1 HMM using hmmalign. The aligned sequences use upper-case letters at positions that align to the HMM, lower case letters for insertions, and dots for deletions with respect to HMM match positions. Sequences with fewer than 200 match positions (upper case letters) were removed from consideration. The remaining sequences, unaligned and ungapped, were run against each of the opsin HMMs using hmmsearch -T 0 (HMMER 3.1b2) (Eddy, 2011). Bit scores for the best domain in each sequence (in the event there is more than one) were extracted from each of the HMMER output files and compared. Sequences for which at least one opsin HMM produced higher bit scores than 7tm_1 are considered to be putative opsins. The same procedure was used for the final set of thirteen HMMs.
An iterative process of clustering, HMM constructions, and re-clustering was used to develop a set of thirteen HMMs that capture the bulk of the diversity in the UniProt opsin set. The 2,421 opsin sequences were first aligned to the 7tm_1 HMM using hmmalign (HMMER 3.1b2). For this first step only, amino acids in positions that correspond to insertions with respect to the HMM were removed so that pairwise distance calculations would be restricted to shared residue positions, as defined by the 7tm_1 HMM. Distance calculations and clustering were performed using the R package phangorn (2.5.5). Specifically, dist.ml was used to calculate distances (using the “LG” amino acid substitution model) and upgma for clustering (method=“average”). Bootstrap values were obtained using bootstrap.phyData. Clusters with at least 95% support were considered well-supported; nearly all of these had 100% support. As there were a small number of outlier sequences, nearly all of the sequences fall into a very large, well-supported cluster, but such a cluster is not especially useful. More useful is to identify subclusters that are well supported, non-overlapping, and sufficiently large in number that much of the diversity of the family is captured. To this end, we began an iterative selection procedure with a well-supported cluster that represented about ~10% of the all sequences. Having selected this cluster, its sub-clusters are removed from further consideration. Also removed from further consideration in this process are the super-clusters for which this cluster is a subset. In each iteration of the procedure, the largest, well-supported, intact cluster that remained on the tree was identified and added to the list of clusters. This process continued until all remaining clusters had fewer than ten members. At that point, 37 well-supported clusters had been identified from the original dendrogram of 2,421 sequences. In total, these 37 well supported clusters contained 1,910 sequences (~79% of the total).
Sequences in each cluster were aligned to one another using Muscle. These sequences were first trimmed at their N- and C- termini so as not to extend beyond the bounds of their alignment to the 7tm_1 HMM. However, insertions with respect to the 7tm_1 model were retained. HMMs were constructed from the sequence alignments using hmmbuild (default parameters). Each HMM was then used to score the 2,421 full-length opsin sequences. The 2,421 “bit-scores” are a kind of profile of the specificity of each HMM: HMMs that are tuned to the same class of opsin will have correlated bit scores over the set of 2,421 sequences. Clustering of the bit-score profiles for HMMs can therefore be used to cluster the sequences that were used to create the HMMs in the first place. The profiles, consisting of 37 bit-scores, were clustered using the R function hclust, and the clusters inspected. Four were outliers from the rest and from each other; inspection of the sequence alignments suggested problems in two cases with the alignments that had been used to construct the HMMs; we decided to omit all four clusters from the final iteration of HMM constructions. Of the remaining 33 profiles, eight were sufficiently different to be retained as distinct representations of opsin specificity. The remaining 25 were merged into five sets, subject to the constraint that no set should represent more than 300 sequences. The sequences used to construct the individual HMMs were combined and re-aligned using Muscle. Along with the eight alignments that remained unmerged, this left a total of thirteen alignments, ranging in size from 35 to 234 sequences. Total sequence membership was 1,700. These thirteen alignments were used to construct the final set of opsin-specific HMMs. As described in the text, 256 of the 2,421 sequences that were originally identified as possible opsins, based on a higher score with one of the seventeen provisional opsin HMMs than with 7tm_1, did not yield a higher score with any of the thirteen final HMMs than with 7tm_1. These 256 were discarded for subsequent analyses, yielding a final set of opsin sequences containing 2,165 members.
Each opsin sequence was scored with the thirteen opsin HMMs and with the 7tm_1 HMM. From the bit-scores obtained, a vector of thirteen values was calculated for each sequence. The values were obtained by subtracting the bit-score obtained with the 7tm_1 HMM from the bit-scores for each of the opsin HMMs. For opsin HMMs with bit-scores below that of 7tm_1, this difference value was set to zero. Values for the thirteen HMMs were then normalized to the highest value for that sequence. The result, for every opsin sequence, is a vector of 13 values based on the scores obtained with 13 different opsin HMMs. We refer to these vectors as opsin-HMM profiles. We added to the set of 2,165 opsin-HMM profiles an additional 43 opsin-HMM profiles derived from sequences and their annotations given in one of three published opsin classification papers. Details on the construction of these 43 annotated opsin-HMM profiles is given in the next section. The combined set of 2,208 opsin-HMM profiles were clustered using the R function hclust (default parameters). The resulting dendrogram was cut at the minimum height necessary to have all nine opsin classes defined by Ramirez et fall into different clusters, as described in the text. This required 24 clusters which are labeled a-w throughout the manuscript.
HMM profiles were used to represent sets of annotated sequences from each of three published classifications. To construct these profiles, we first constructed opsin-HMM profiles for individual sequences that share an annotation in each of these publications. The individual opsin-HMM profiles were then averaged to produce a single profile for a given annotation. The procedure for identifying sequences to include in the annotation profiles, and for producing the final profiles, differed slightly for the three published classifications. (i) Beaudry et al. (2017) discerned, among vertebrate sequences, 19 opsin classes. They also provided an alignment with sequence names that reference the class into which the sequence was assigned. We selected two sequences from each class, constructed opsin HMM bit-score profiles for all 38 sequences, clustered the profiles, and visualized them with heat maps. Some of the 19 opsin classes identified by Beaudry et al. have similar opsin-HMM profiles. Subjectively, we discerned ten clusters with clearly distinguishable patterns. The profiles for sequences in each of these clusters were averaged to produce the annotation profiles shown in Figure 2B. (ii) Terakita (2005) presented a tree with 42 sequences, vertebrate and invertebrat. The tree is annotated with seven major groups, one of which is divided further into six sub-groups. Other clusters use distinctive names for sequences in different sub-clusters, implicitly adding additional levels of annotation. Terakita did not provide sequences, but the names and species identifications on the tree are sufficient to obtain from NCBI sequences that are likely to be very similar, if not identical. Opsin-HMM profiles were calculated for these sequences, clustered, and visualized in a heat map as described above for the Beaudry et al. sequences. The diversity of the 42 sequences is well represented by twelve clusters (Figure 2C). (iii) Ramirez et al. (2016) collected more than 700 opsin sequences, with special attention paid to sequences from under-represented phyla. They identified nine opsin classes, and provided all sequence alignments and opsin class assignments. For each class, we calculated the opsin-HMM profile for all sequences in the class, clustered the profiles, and visualized them using heatmaps. Four of the sequence sets were homogeneous in terms of their opsin-HMM profiles, while five were best understood as mixtures of distinct profiles. Those that clearly included sequences with different opsin-HMM profiles were divided subjectively on the basis of their opsin-HMM clusters. The number of such clusters ranged from two, for sequences annotated as “xenopsin”, to seven, for sequences annotated as “canonical c-opsin”. In total, there are 21 sequence sets that are either different by the criteria of Ramirez et al., or which are grouped together by Ramirez et al. but are distinguishable by our opsin-HMM profile criterion. For each of these 21 sequences sets, average opsin-HMM profiles were constructed as described above. Their heatmaps, and the annotations inherited from Ramirez et al., are shown in Figure 2D. In total, the ten annotation profiles derived from Beaudry et al.’s sequences and classification, the twelve derived from Terakita, and the twenty-one from Ramirez et al., yielded 43 annotation profiles. There is of course some redundancy in this set.
The UniProt sequences include, as part of the sequence name, the NCBI taxonomic identification number for the species (Sayers et al., 2009). Names for the higher taxonomic ranks of that species are specified by the NCBI taxonomic hierarchy and were retrieved with the help of the R package CHNOSZ. For a small number of species, the NCBI hierarchy did not provide names at the level of Class. For example, the six reptiles in the UniProt set (alligators, lizards, snakes, and turtles) have associated Order names (Crocodylia, Squamata, and Testudines) but no Class name. Presumably, “Reptilia” is not used in the NCBI hierarchy because it is not a monophyletic group, Crocodylia being more closely related to birds (Aves) than to other ‘reptiles”. However, because we wished to visualize opsin distributions at the Class level, we added to any sequence lacking a Class name a name that seemed reasonable to us. In addition to Reptiles, this was done for the single Coelacanth species and the single lancelet species.
The original contributions presented in the study are included in the article/Supplementary Material. Further inquiries can be directed to the corresponding author.
NC generated opsin sequence alignments and HMMs. NC and JT wrote the manuscript. All authors contributed to the article and approved the submitted version.
NSERC (Canada) Discovery Grant to JT: RGPIN 2019-05609.
The authors declare that the research was conducted in the absence of any commercial or financial relationships that could be construed as a potential conflict of interest.
All claims expressed in this article are solely those of the authors and do not necessarily represent those of their affiliated organizations, or those of the publisher, the editors and the reviewers. Any product that may be evaluated in this article, or claim that may be made by its manufacturer, is not guaranteed or endorsed by the publisher.
The Supplementary Material for this article can be found online at: https://www.frontiersin.org/articles/10.3389/fevo.2023.1190549/full#supplementary-material
Altschul S. F., Madden T. L., Schäffer A. A., Zhang J., Zhang Z., Miller W., et al. (1997). Gapped BLAST and PSI-BLAST: a new generation of protein database search programs. Nucleic Acids Res. 25, 3389–3402. doi: 10.1093/nar/25.17.3389
Beaudry F. E. G., Iwanicki T. W., Mariluz B. R. Z., Darnet S., Brinkmann H., Schneider P., et al. (2017). The non-visual opsins: eighteen in the ancestor of vertebrates, astonishing increase in ray-finned fish, and loss in amniotes. J. Exp. Zoolog. B. Mol. Dev. Evol. 328, 685–696. doi: 10.1002/jez.b.22773
Brandon C. S., Greenwold M. J., Dudycha J. L. (2017). Ancient and recent duplications support functional diversity of daphnia opsins. J. Mol. Evol. 84, 12–28. doi: 10.1007/s00239-016-9777-1
Buhr E. D., Yue W. W. S., Ren X., Jiang Z., Liao H.-W. R., Mei X., et al. (2015). Neuropsin (OPN5)-mediated photoentrainment of local circadian oscillators in mammalian retina and cornea. Proc. Natl. Acad. Sci. 112, 13093–13098. doi: 10.1073/pnas.1516259112
Colbourne J. K., Hebert P. D. N. (1996). The systematics of north American daphnia (Crustacea: anomopoda): a molecular phylogenetic approach. Philos. Trans. R. Soc Lond. B. Biol. Sci. 351, 349–360. doi: 10.1098/rstb.1996.0028
Eddy S. R. (1998). Profile hidden Markov models. Bioinformatics 14, 755–763. doi: 10.1093/bioinformatics/14.9.755
Eddy S. R. (2011). Accelerated profile HMM searches. PloS Comput. Biol. 7, e1002195. doi: 10.1371/journal.pcbi.1002195
Edgar R. C. (2004). MUSCLE: multiple sequence alignment with high accuracy and high throughput. Nucleic Acids Res. 32, 1792–1797. doi: 10.1093/nar/gkh340
El-Gebali S., Mistry J., Bateman A., Eddy S. R., Luciani A., Potter S. C., et al. (2019). The pfam protein families database in 2019. Nucleic Acids Res. 47, D427–D432. doi: 10.1093/nar/gky995
Engelhard C., Chizhov I., Siebert F., Engelhard M. (2018). Microbial halorhodopsins: light-driven chloride pumps. Chem. Rev. 118, 10629–10645. doi: 10.1021/acs.chemrev.7b00715
Futahashi R., Kawahara-Miki R., Kinoshita M., Yoshitake K., Yajima S., Arikawa K., et al. (2015). Extraordinary diversity of visual opsin genes in dragonflies. Proc. Natl. Acad. Sci. 112, E1247–E1256. doi: 10.1073/pnas.1424670112
Goh F. Q. Y., Jeyakani J., Tipthara P., Cazenave-Gassiot A., Ghosh R., Bogard N., et al. (2019). Gains and losses of metabolic function inferred from a phylotranscriptomic analysis of algae. Sci. Rep. 9, 10482. doi: 10.1038/s41598-019-46869-3
Gühmann M., Porter M. L., Bok M. J. (2022). The gluopsins: opsins without the retinal binding lysine. Cells 11 (15), 2441. doi: 10.3390/cells11152441
Joost P., Methner A. (2002). Phylogenetic analysis of 277 human G-protein-coupled receptors as a tool for the prediction of orphan receptor ligands. Genome Biol. 3, RESEARCH0063. doi: 10.1186/gb-2002-3-11-research0063
Moutsaki P., Whitmore D., Bellingham J., Sakamoto K., David-Gray Z. K., Foster R. G. (2003). Teleost multiple tissue (tmt) opsin: a candidate photopigment regulating the peripheral clocks of zebrafish? Brain Res. Mol. Brain Res. 112, 135–145. doi: 10.1016/S0169-328X(03)00059-7
Oakley T. H., Speiser D. I. (2015). How complexity originates: the evolution of animal eyes. Annu. Rev. Ecol. Evol. Syst. 46, 237–260.
Oesterhelt D. (1976). Bacteriorhodopsin as an example of a light-driven proton pump. Angew. Chem. Int. Ed. Engl. 15, 17–24. doi: 10.1002/anie.197600171
Okano T., Yoshizawa T., Fukada Y. (1994). Pinopsin is a chicken pineal photoreceptive molecule. Nature 372, 94–97. doi: 10.1038/372094a0
Pennisi E. (2013). Opsins: not just for eyes. Science 339, 754–755. doi: 10.1126/science.339.6121.754
Porter M. L. (2016). Beyond the eye: molecular evolution of extraocular photoreception. Integr. Comp. Biol. 56, 842–852. doi: 10.1093/icb/icw052
Provencio I., Jiang G., De Grip W. J., Hayes W. P., Rollag M. D. (1998). Melanopsin: an opsin in melanophores, brain, and eye. Proc. Natl. Acad. Sci. 95, 340–345. doi: 10.1073/pnas.95.1.340
Provencio I., Rodriguez I. R., Jiang G., Hayes W. P., Moreira E. F., Rollag M. D. (2000). A novel human opsin in the inner retina. J. Neurosci. 20, 600–605. doi: 10.1523/JNEUROSCI.20-02-00600.2000
Ramirez M. D., Pairett A. N., Pankey M. S., Serb J. M., Speiser D. I., Swafford A. J., et al. (2016). The last common ancestor of most bilaterian animals possessed at least nine opsins. Genome Biol. Evol. 8, 3640–3652. doi: 10.1093/gbe/evw248
Sayers E. W., Barrett T., Benson D. A., Bryant S. H., Canese K., Chetvernin V., et al. (2009). Database resources of the national center for biotechnology information. Nucleic Acids Res. 37, D5–15. doi: 10.1093/nar/gkp382
Spudich J. L. (2006). The multitalented microbial sensory rhodopsins. Trends Microbiol. 14 (11), 480–487. doi: 10.1016/j.tim.2006.09.005
Spudich J. L., Yang C.-S., Jung K.-H., Spudich E. N. (2000). Retinylidene proteins: structures and functions from archaea to humans. Annu. Rev. Cell Dev. Biol. 16, 365–392. doi: 10.1146/annurev.cellbio.16.1.365
Tarttelin E. E., Bellingham J., Hankins M. W., Foster R. G., Lucas R. J. (2003). Neuropsin (Opn5): a novel opsin identified in mammalian neural tissue. FEBS Lett. 554, 410–416. doi: 10.1016/S0014-5793(03)01212-2
Keywords: opsins, HMMs, UniProt, Reference Proteomes, taxonomic distribution opsins
Citation: Clarke ND and Taylor JS (2023) Taxonomic distribution of opsin families inferred from UniProt Reference Proteomes and a suite of opsin-specific hidden Markov models. Front. Ecol. Evol. 11:1190549. doi: 10.3389/fevo.2023.1190549
Received: 21 March 2023; Accepted: 12 June 2023;
Published: 04 July 2023.
Edited by:
Richard John Edwards, University of New South Wales, AustraliaReviewed by:
Hongjiu Zhang, Chinese Academy of Sciences (CAS), ChinaCopyright © 2023 Clarke and Taylor. This is an open-access article distributed under the terms of the Creative Commons Attribution License (CC BY). The use, distribution or reproduction in other forums is permitted, provided the original author(s) and the copyright owner(s) are credited and that the original publication in this journal is cited, in accordance with accepted academic practice. No use, distribution or reproduction is permitted which does not comply with these terms.
*Correspondence: John S. Taylor, dGF5bG9yanNAdXZpYy5jYQ==
Disclaimer: All claims expressed in this article are solely those of the authors and do not necessarily represent those of their affiliated organizations, or those of the publisher, the editors and the reviewers. Any product that may be evaluated in this article or claim that may be made by its manufacturer is not guaranteed or endorsed by the publisher.
Research integrity at Frontiers
Learn more about the work of our research integrity team to safeguard the quality of each article we publish.