 Ning Niu
 Chao Wang2,3*
 He Jin
95% of researchers rate our articles as excellent or good
Learn more about the work of our research integrity team to safeguard the quality of each article we publish.
Find out more
ORIGINAL RESEARCH article
Front. Ecol. Evol. , 15 June 2023
Sec. Interdisciplinary Climate Studies
Volume 11 - 2023 | https://doi.org/10.3389/fevo.2023.1186686
This article is part of the Research Topic Interplay between Climate Change, Land Use Change, and Human Health: Opportunities and Challenges View all 7 articles
Introduction: The development of specialized villages (SVs) is of great importance for rural revitalization.
Methods: This study integrated SVs, terrain, resource, traffic, market, and economy data to characterize the development of SVs from 2017 to 2021 and explore its influence factors by the Random Forest Regression model in Henan, China.
Results: The sustainably developed SVs were mainly distributed in the plain and the transition zone of mountain-hilly, mountain-plain, and hilly-plain, showing a spatially aggregated polycentric characteristic; the market is the key factor for the development of SVs in the transition zone of mountain-hill or mountain-plain, and the traffic factor mainly influences SVs in the plain and the transition zone of hill-plain; compared to the factors influencing the formation of SVs, the influence of terrain and traffic factors on the development of SVs was decreasing, and the influence of market and economic factors was showing an increasing trend.
Discussion: The results of this study can provide practical strategies for the development of SVs in the under-developed areas of interior.
With rapid urbanization after the industrial revolution, rural areas in most countries have different degrees of decline (Measham and Fleming, 2014). Agricultural specialization has been measured in developed countries to solve the issue of declining income. For example, the One Village One Product project of Japan, the scale agriculture of United States (Lsao, 1992; Kang, 2002; Boody et al., 2005). Similarly, in China, specialized villages (SVs) are the primary form of agricultural specialization. At the end of 2016, there were 60,473 SVs in China; SVs with vegetables, coarse cereal, and fruit were the main industries in their agricultural development, and there are 2,398 SVs with economic income of more than $15 million (Marac, 2017). In short, SVs play an essential role in the rural economy and revitalization. Therefore, evaluating and characterizing the development of SVs could benefit farmers and stakeholders, providing a reference for implementing rural revitalization strategies.
SVs are defined as most rural households that engage in one or more interrelated agricultural produce or service activities (Li et al., 2013). SVs of China have some unique characteristics to agricultural specialization in developed countries. The former concentrates on producing primitive agricultural items, such as raw vegetables, coarse cereals, and fruits (Li et al., 2018). Whereas, the latter usually takes the form of some estates, including the production and sale of fine wine, rural cooperatives of cheese production, and stores selling agricultural products in urban residential areas (Kettl, 2015; Kasabov, 2016; Mussina et al., 2019). Many studies focused on traffic cost, market transaction cost, technological resource, market price increase, and agricultural policy on the specialization in developed countries (De Roest et al., 2017), part of the reason being that developed countries have excellent industrial and agricultural foundation that could provide strong support for rural development. However, due to the differences in national conditions and development basis, the successful experience in developed countries is challenging to solve the rural decline issue in China.
The unique characteristics of SVs in China have attracted the attention of relevant scholars. Existing studies mainly focused on the spatial pattern of SVs, the spatial aggregation and diffusion of SVs, the natural environment, and the social economy on the formation of SVs (Li et al., 2009; Wu et al., 2013; Qiao et al., 2016; Yang et al., 2022). For example, Li et al. (2012) concluded three factors in the formation of SVs: (1) rural households with an entrepreneurial spirit that determine the lifespan of SVs; (2) the environment (e.g., traffic, resource endowment, and historical tradition) that determine the types of SVs; and (3) the policies and markets that determine the number and scales of SVs. Cao et al. (2020) applied SVs' data in China to analyze the terrain, resource endowment, traffic, market demand, and economy of SVs at the national and agricultural regionalization scales; the finding verified the conclusion of Li et al. (2012).
The formation mechanisms of SVs in China and other developing countries have been well studied as shown above. However, the development mechanisms of SVs in China are rarely explored. In many cases, the SVs' formation factors do not necessarily drive their development. The constant and development driver factors for SVs are still unclear and should be identified. As a result, our study aims to fill the gaps and find the key factors influencing the development of SVs. Through a case study in Henan Province, China, our study attempts to answer three crucial questions: (1) What areas are conducive to the development of SVs? (2) What are the key factors that influence the development of SVs? (3) How do the factors that influence the formation of SVs change in their subsequent development? The answers to these critical questions will help identify relevant policies for the development of SVs.
We selected Henan as the study area, a predominantly agricultural province in central China with an agricultural production value of 463.540 billion RMB and a per capita gross product of 56,388 RMB in 2020, ranking 3rd and 17th in China (Wang et al., 2019), respectively. The agricultural economy plays a vital role in the economic development of Henan. The agricultural production model in Henan Province mainly presents a government-led public agricultural production model, an intrinsic expansion model led by farmer specialization, an external pull model of leading agricultural industrialized enterprises, a market-driven and new agricultural service organization model of agricultural products, and an innovative development model of traditional service organizations (Luo et al., 2020). Most of the Henan Province is located in the warm temperate zone, and the south straddles the subtropical zone, which is a continental monsoon climate transitioning from the northern subtropical zone to the warm temperate zone, and also has the characteristics of transitioning from the plains to the hilly mountain climate from east to west (Figure 1), with four distinct seasons, rain and heat at the same time, complex and diverse and frequent meteorological disasters (Cai et al., 2021). The average annual temperature of the province from south to north is 10.5–16.7°C, the average annual precipitation is 407.7–1,295.8 mm, the most rainfall is from June to August, the average annual sunshine is 1,285.7–2,292.9 h, the annual frost-free period is 201–285 days, which is suitable for a variety of crops (Zhang et al., 2023). Therefore, Henan, a province typically underdeveloped, was selected to analyze the key influencing factors in the development of SVs.
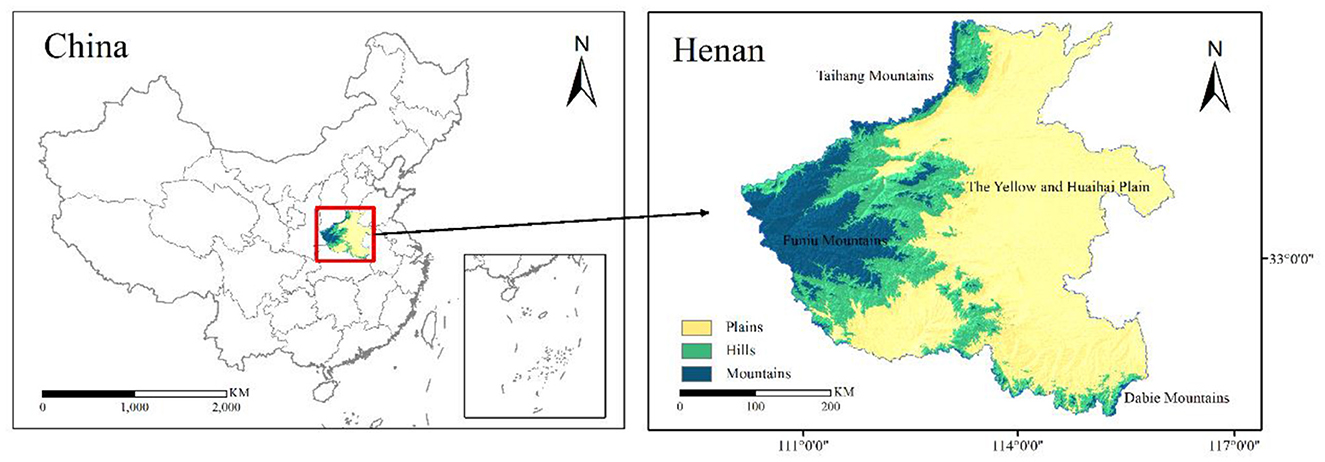
Figure 1. Study area: Henan Province in China.
The research workflow is shown in Figure 2. It consists of two parts, characterization and evaluation of the development of SVs. The development of SVs, given their multifaceted nature, is challenging to characterize directly. However, it could be reflected through various so-called SVs' attributes. Whether they are entirely or partially attributable to the development of SVs, these properties collectively provide an opportunity to evaluate the development of SVs. Therefore, we fuse multiple data to characterize the development of SVs. Three attributes, leading industry output ratio, employment rate, and average household income, were selected to construct the SVs' development index (Figure 2). The characterization was derived from various data sources, providing a more comprehensive proxy of SVs for the development of SVs than variables that only describe one aspect. In the second stage, we aimed to identify which factors contribute significantly to the development of SVs. Various factors may affect the development of SVs, including terrain, resources, location, market, and economy. Our goal is to determine which factors are most important in development.
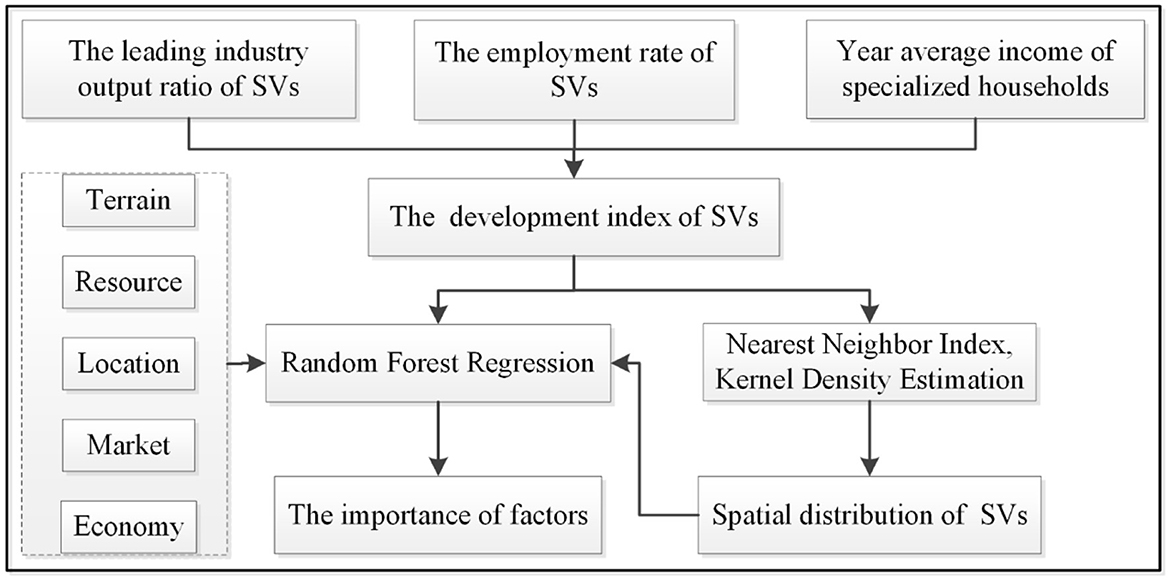
Figure 2. Research workflow of our study.
The SVs' data from 2017 to 2021 in Henan province (Henan Province Department of Agriculture and Rural Affairs) included SVs' names, the number of working adults, the leading industry, the output value of the leading industry, the gross output value of SVs, specialized household number, total household number, and the annual average income of specialized households. A total of 1,047 SVs (2017–2021) were used as our study objects for 5 years. Then, we used the SVs' names to extract their geographic locations from Baidu Maps (one of the largest online map service providers in China). The spatial distribution of SVs is shown in Figure 3.
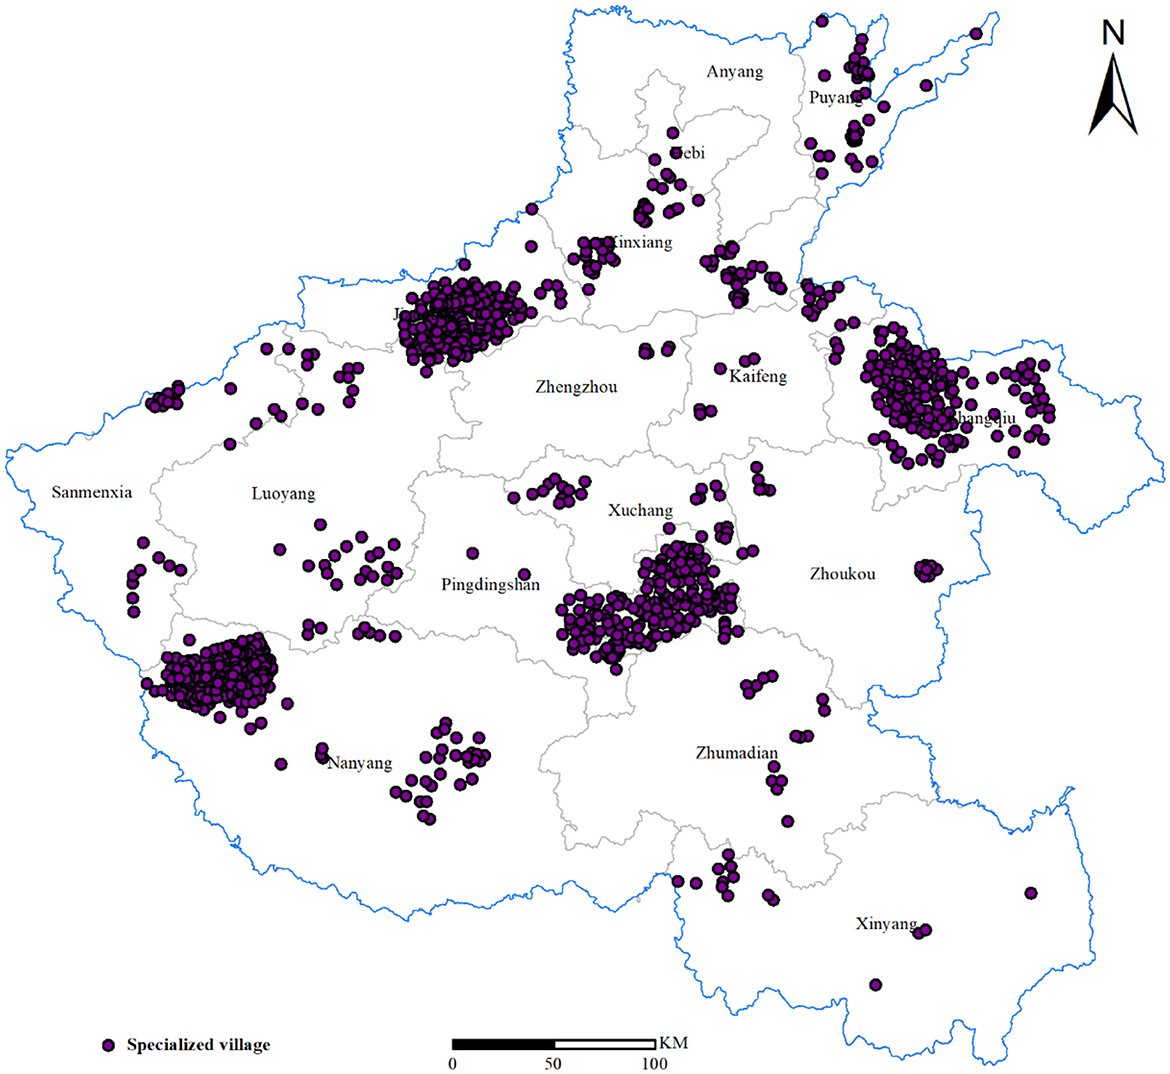
Figure 3. Spatial distribution of SVs from 2017 to 2021 in Henan.
The characterization of SVs' development was extracted as a common factor that underlies a set of SVs' attributes, which were carefully selected because the sustainability of SVs is not only defined by the leading industry output ratio of SVs (Chidumu, 2007) but also by the employment rate of SVs and the yearly average income of specialized households (Niu et al., 2021). As a result, the leading industry output ratio of SVs, the employment rate of SVs, and the average household income of SVs were selected as SVs' attributes to extract the development index of SVs.
Principal component analysis (PCA) is used to construct the index of development of SVs. PCA is a state-of-the-art approach for studying the common underlying factors of change and covariation observed in various properties (Wold et al., 1987). This approach has been widely used in health and food studies (Granato et al., 2018; Garcia-Larsen et al., 2019). This study conducted PCA using standardized SVs' attributes as an input and the principal axis factor method as a factor extraction method. Representatives of SVs' were extracted as common factors with the highest eigenvalues (Table 1) and are referred to as the development index of SVs.
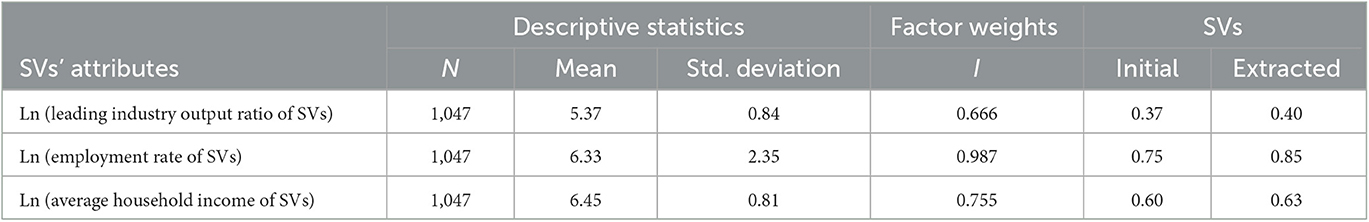
Table 1. Solution of PCA and descriptive statistics of SVs' attributes.
In evaluating SVs' development, the most critical step is to select the influencing factors. By referring to relevant studies (Li et al., 2012; Cao et al., 2020), we constructed a system of indicators affecting the development of SVs from five aspects: terrain, resources, traffic, market, and economy (Table 2).
(1) Terrain factors. This study used elevation and slope. In general, the more elevation and slope, the more difficult it will be for some crops to grow and unable to form competitive industries, which is not conducive to the development of SVs. In contrast, the growth of some crops requires relatively higher elevation and slope.
(2) Resource factors. The study area has a temperate continental climate, and precipitation is mainly concentrated in summer, while there is less precipitation in spring during the growing period of these crops (including cash crops). Then, if the SV is close to water bodies such as lakes and rivers, the chances of these crops (including cash crops) being irrigated will be increased, which, in turn, will affect the development of SVs. Thus, adequate water resources and fertile land are critical to the development of SVs.
(3) Traffic factors. Road network (county and township roads, provincial roads, and national roads) density and traffic accessibility indicated the traffic factors. The closer SVs are to the road network, the lower the traffic cost of agricultural products, and the easier it is to form an SV. If the opposite is the case, it is not conducive to the development of SVs.
(4) Market factors. Market size, consumption capacity, and urbanization level expressed the market factors. The larger the market size and the higher the consumption level, the more the villages help the development of SVs.
(5) Economic factors. This study utilized the county's gross domestic product and the number of agriculture-related enterprises to reflect the economic foundation. The higher the economic development level, the more agriculture-related enterprises. Consequently, the more agricultural capital invested, the more vital willingness to upgrade production technology, creating a financial base and technical support for the development of SVs.
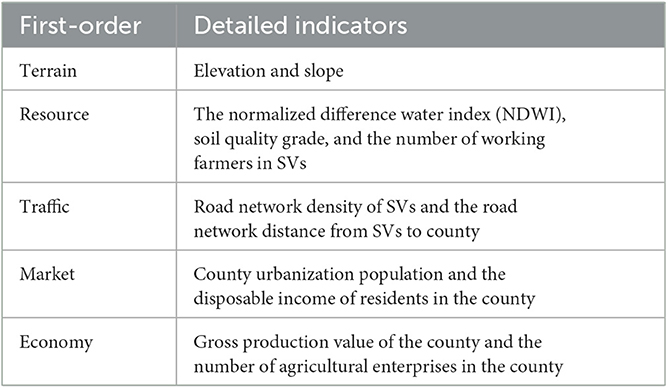
Table 2. Index system of factors in the development of SVs.
SVs' development was measured to capture the effects of the underlying development of SVs from multiple perspectives (Table 1). The leading industry output ratio of SVs was evaluated by the output value of the leading industry and the gross output value of SVs from Henan SVs' data. The leading industry output ratio of SVs is calculated by Equation (1).
where OR is the leading industry output ratio of SVs, and OLand OS refer to the output value of the leading industry and the gross output value of SVs.
The employment rate of SVs was evaluated using the specialized household number and total household number of SVs from Henan SVs' data. This rate was calculated as Equation (2).
where ER is the employment rate of SVs, and Ns and N are the specialized household number and the total household number of SVs.
The normalized yearly average income of specialized households was measured by Equation (3) and the annual average income of specialized households from Henan SVs' data.
where I is the normalized year average income of specialized households, and Imin and Imax are the minimum and maximum values of the year average income of specialized households.
The elevation and slope values of SVs were calculated using the zonal statistics tool in ArcGIS 10.7 and SRTM DEM 30 m data (Resource and Environment Data Cloud Platform of Chinese Academy of Sciences).
The annual average normalized difference water index (NDWI, Equation 4) reflected SVs' water conditions. The soil quality grade of SVs was acquired from the soil quality data of Henan (http://globalchange.bnu.edu.cn/). The number of working adults in SVs was from 2017 to 2021 in Henan Province.
where GREENband3 and NIRband5 are bands of the Landsat 8 image.
We selected the density of road networks (the national road, the provincial road, and the country road) to measure the locational transport conditions of SVs. The road network length per square mile was calculated.
We retrieved three pieces of data—urban population, disposable income, and the number of agricultural enterprises for each county from the county's statistical yearbook.
An average nearest neighbor (ANN) analysis could be utilized to identify whether a spatial distribution of features is clustered, dispersed, or random, and calculate the degree of clustered, dispersed, or random distribution at a macroscopic level (Bansal and Ardell, 1972). Thus, we used the ANN analysis to determine the degree of clustering in the SVs' development in the study area. The nearest neighbor ratio (NNR) was used to quantify the ANN and was calculated as the observed average distance by the expected average distance for a hypothetical randomly distributed dataset (see Equation 5). If NNR < 1 with a p-value of < 0.05, the development of SVs is significantly clustered; if NNR > 1 with a p-value < 0.05, the development of SVs is significantly dispersed; and if NNR = 1, the development of SVs is randomly distributed.
where NNR is the nearest neighbor ratio; Dn is the mean of the observed distance between each unit and its nearest neighbors; DR is the mean of the expected distance between a unit and its nearest neighbors in a random distribution; di is the distance between a SVi and its nearest neighbors; n is the number of SVs in the study area, and A is the size of the study area.
A kernel density estimation (KDE) is used in probability theory to estimate the unknown density function. It is a non-parametric density estimator depending on the structure of all data points (Sheather and Jones, 1991). In this study, we use the KDE to visualize the spatial accumulation pattern of SVs, as well as to quantify the spatial accumulation degree of SVs at a smaller spatial scale. The KDE tool in ArcGIS 10.7 uses a kernel function to smooth the data within its bandwidth at each data point. The calculation is centered on a specific point, where the KDE value is highest and decreases with increasing distance from the outward. The KDE value is the development index of a SV in this study.
The equations (Equations 6–8) are shown below.
where is the kernel density value of an estimated point (x, y); h represents a kernel bandwidth; n is the number of SVs within a certain bandwidth range; SVDIi is the development index of SVs i, di, (x, y) is the distance between SVs i and other SVs (x, y); K is a density function that describes how the distribution of SVs i changes with di, (x, y).
The random forest regression (RFR) model is a natural non-linear statistical method based on incidental sampling learning and feature selection (Liaw and Wiener, 2002). RFR has been used in analyzing PM2.5 concentration (Liu et al., 2018), simulating the dynamic distribution of the population (Ye et al., 2019), and others. Compared with multiple linear regression and logistic regression models, RFR has several advantages, including having a high model accuracy, reporting variable importance, and avoiding overfitting. RFR is particularly suitable for tackling complex geographic problems (Ye et al., 2019). To facilitate the understanding of the RFR algorithm, we briefly introduce its processes below.
(1) Use the SVs' data for 2017–2021 as the original samples Q, through a Bootstrap resample technique, n training samples are obtained, and n regression trees are generated. See Equation (9) below.
where h(x) is the regression tree and θn is an independent and identically distributed random variable.
(2) During regression trees' growth, each splitting node randomly selects y variables as the subset of the current node. Note that general practice is to select one-third of the total variables; but, in our study, y was set to 1 for simplification purposes. It is also worth noting that pruning is not required in each splitting process.
(3) In each bootstrap resampling, the unchosen sample proportion is close to 1/e, ~0.37, which is called out-of-bag (OOB) error and could be used in the internal error estimation. Based on OOB errors, we could obtain the importance of different influencing factors in SVs' development in a defined time frame (e.g., 5 years in our case). We enter xp (p = 1, 2, 3, 4) as input data, and the importance of the qth tree Iq is calculated by Equation (10) below.
where xp is the development index of SVs in 2017–021, QOOB is the number of out-of-bag data samples, is a qth sample value in the OOB data, is an estimated value of qth sample in the OOB data after randomly permutating variables, and I(•) is a discriminant function.
(4) The importance score of variable xp in the random forest is calculated in this step using Equation (11).
Our study performed the RFR in R 4.0.5, to explore the influence of 11 variables under five categories (e.g., terrain, resource, traffic, market, and economy) on the development of SVs. We went through a certain process to select key variables in the RFR model: (1) the frequency occurrence of each factor was counted and sorted from high to low and (2) the variable with the highest frequency was selected as the critical one. Meanwhile, we applied root mean square error (RMSE) and coefficient of determination (R2) to evaluate the model performance (see Equations 12, 13). A larger R2 and smaller RMSE mean a higher model accuracy.
where yi represents the actual value, ŷi is the predicted value of RFR, is the average value of the sample, and n is the number of samples.
In the analysis of the spatial clustering distribution of the development of SVs, the nearest neighbor index of the development of SVs is 0.36, which is < 1; the Z-value is −52.44, which is less than the Z-value under the significance of 0.01. Thus, we consider that the distribution of SVs shows spatial clustering. The average distance between the development of SVs is 24.11 KM, which indicates that the diffusion of agricultural technology is constrained by geographical proximity and cognitive proximity, which is the main reason for the clustering of specialized agricultural villages in specific regions.
The results of kernel density analysis indicate that the development of SVs was mainly distributed in Regions 1–4 (Figure 4). Region 1 was in the mountain-plain transition zone, with 315 SVs in this region, where the leading industries were vegetable, edible mushroom, and horticultural crops. Region 2 was in the plain area, with 85 SVs, where the main industries were cereal cultivation, bean, oil seed, and potato cultivation. Region 3 was in the mountain-hill transition zone, where vegetables, edible mushrooms, and horticultural crops were the dominant industries in 491 SVs. Region 4 was the transition zone of the hilly plain, where the leading industries of 156 SVs were cotton, linen, sugar, tobacco, and fruit. We used the Jenks natural break method to classify the kernel density estimation result into five zones: low, medium-low, medium, medium-high, and high (Figure 4). The number of cities in each zone from low to high represented 43.56, 12.54, 8.54, 19.57, and 15.79% of the total cities in the study area, respectively. The density of development SVs was not evenly distributed, showing a density ranking: West > Central > East. The high-density values were mainly distributed in the Taihang Mountain plain and Funiu Mountain (Figures 1, 4); e.g., the high-density values were mainly distributed in the Taihang Mountain plain and Funiu Mountain (Figure 4).
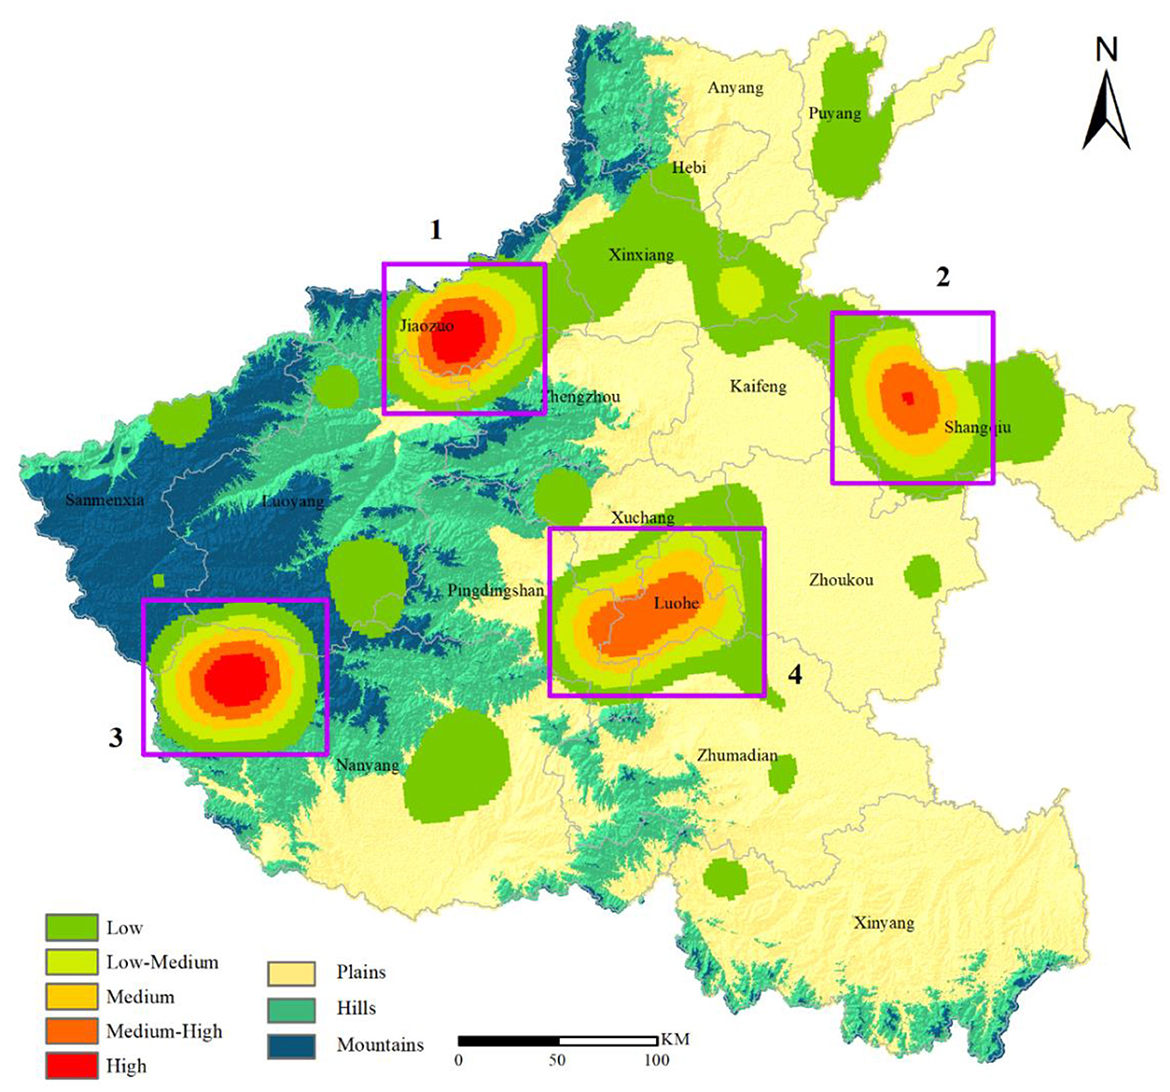
Figure 4. Results of the kernel density analysis of the development index of SVs in 2017–2021.
In this study, we selected 11 variables in five categories—terrain, resource, traffic, market, and economy. Then, we used a random forest regression model to quantify the influence of different factors on the development of SVs to discover the key influencing factors. The RMSE of the random forest regression model was < 0.05. The coefficient of determination (R2) value was more than 0.61. According to the importance of influencing factors calculated by the random forest regression model, the development of SVs is strongly influenced by traffic, market, and economic factors rather than terrain and resource factors (Figure 5). With the change in time, the influence of market and economic factors on the development of SVs gradually increased, and the importance of terrain and resource factors decreased to some extent (Figure 5).
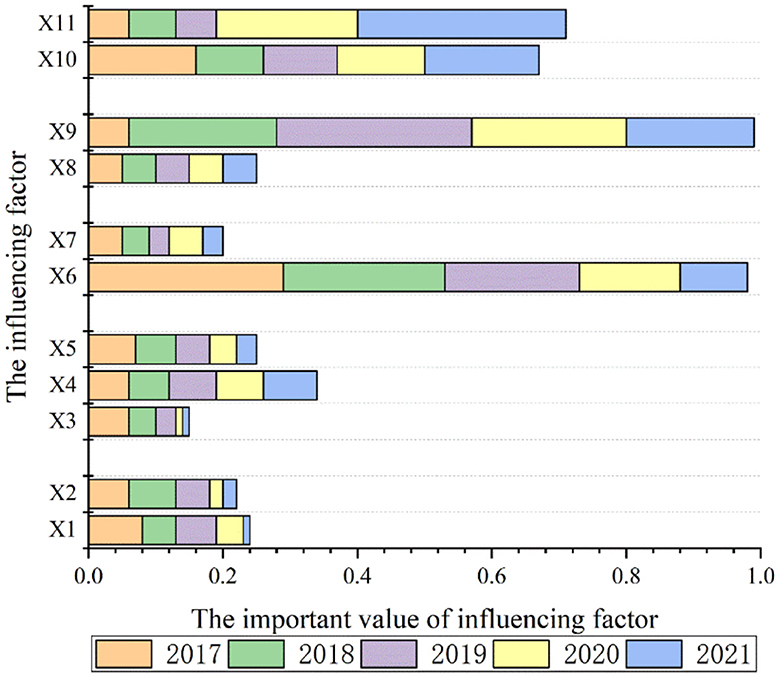
Figure 5. Importance of influencing factors of SVs.
From the importance ranking of each influencing factor of SVs in Region 1 of Figure 4, the key influencing factor in the development of SVs is the market (the disposable income of residents in the county; Figure 6A; Table 3). The importance of traffic factors in SVs showed a decreasing trend from 2017 to 2021, while the volume of the market and economic factors showed an increasing trend year by year.
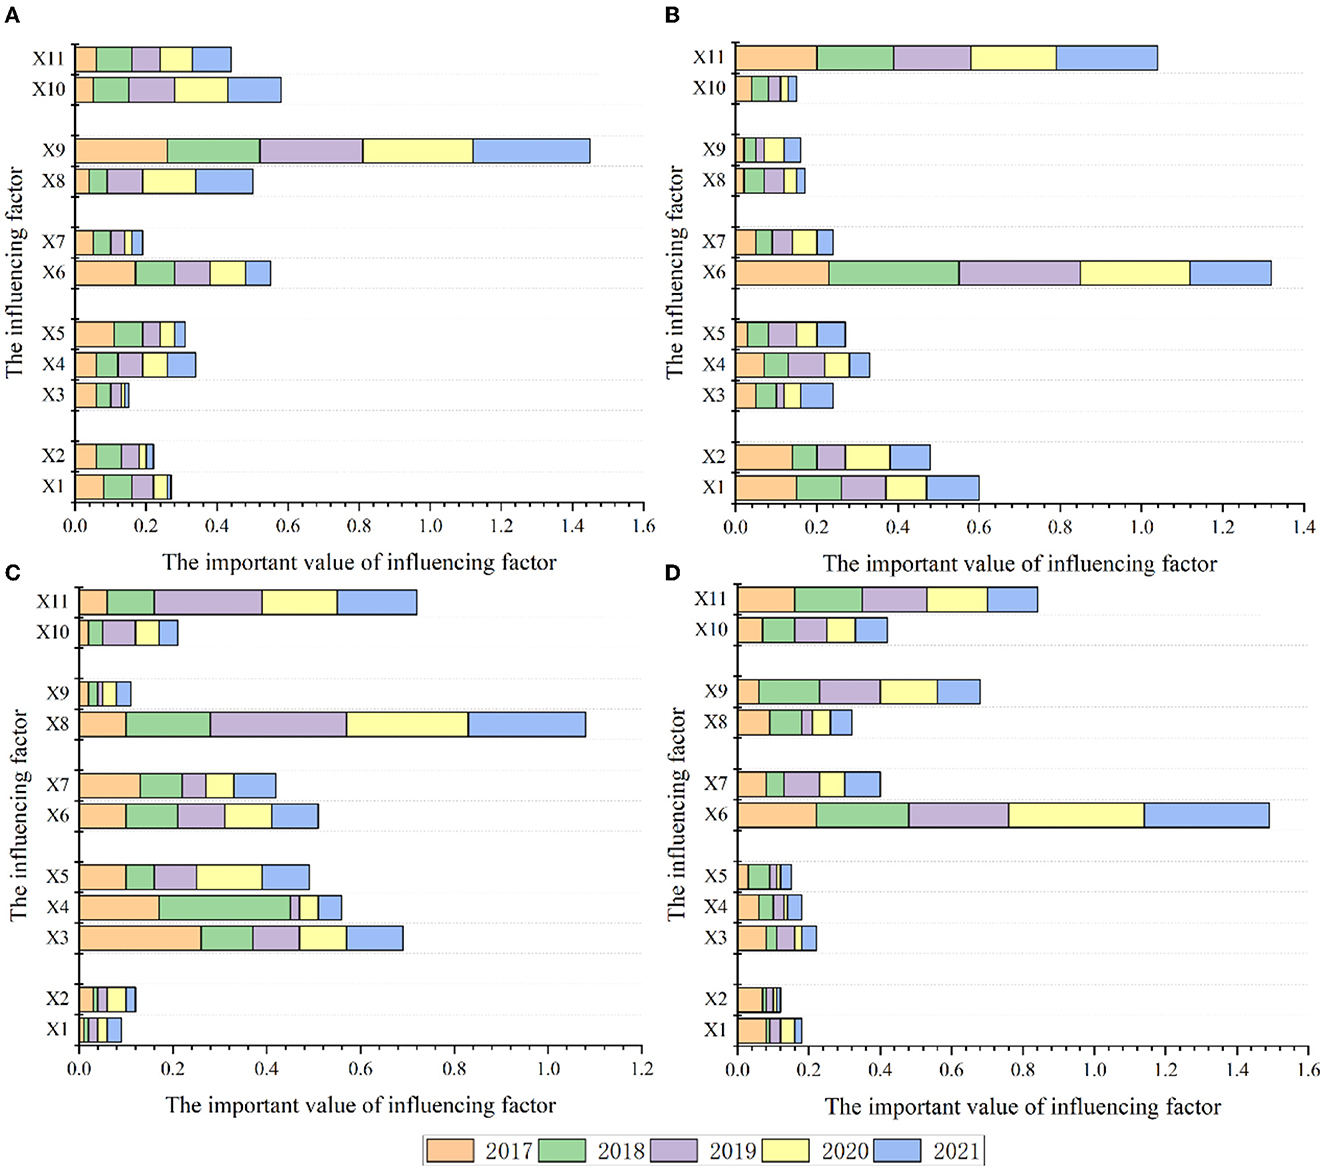
Figure 6. Importance of influencing factors of SVs in Region 1 (A), Region 2 (B), Region 3 (C), and Region 4 (D).
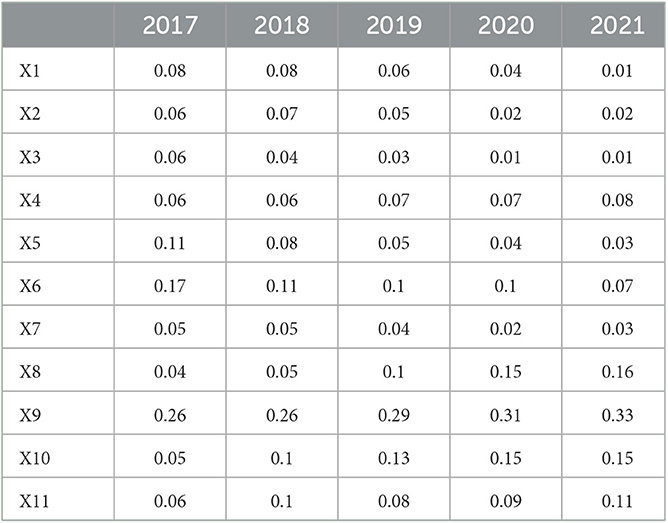
Table 3. Importance of influencing factors of SVs in Region 1.
In Region 2 of Figure 4, SVs' most influencing factor from 2017 to 2021 was traffic (road network density of SVs; Figure 6B; Table 4). The importance of the traffic factor on SVs showed a decreasing trend. In contrast, the importance of economic factors continued to increase.
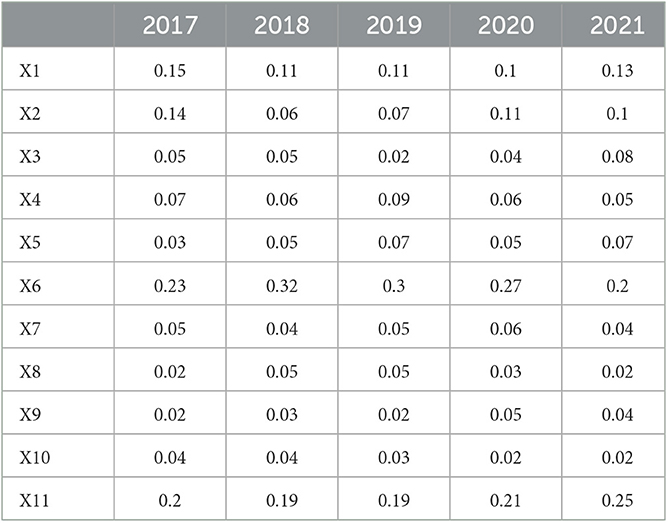
Table 4. Importance of influencing factors of SVs in Region 2.
In Region 3 of Figure 4, the most influencing factor of SVs' development in 2017 and 2018 was the resource factor (NDWI, soil quality; Figure 6C; Table 5). From 2019 to 2021, the market factor (county urbanization population) with importance values of 0.29, 0.26, and 0.25, respectively. The key influencing factor for the development of SVs is the market. The change in the importance of the influencing factors may be related to the accelerated urbanization in China; as more farmers migrate to cities, the importance of the market factor shows an increase after 2019.
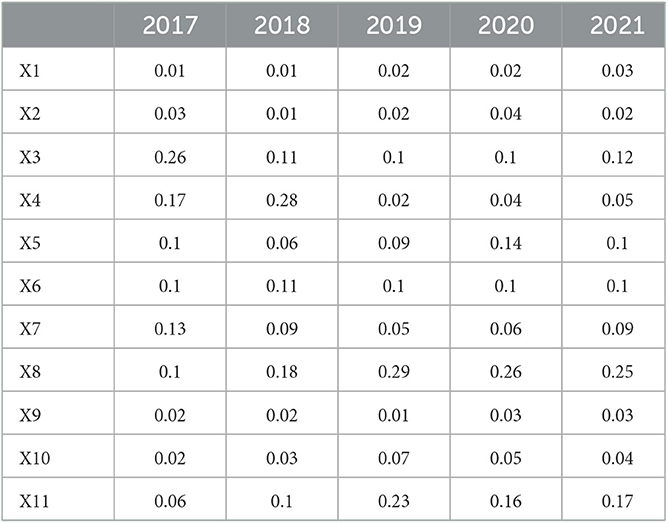
Table 5. Importance of influencing factors of SVs in Region 3.
In Region 4 of Figure 4, according to the importance of the influence factors of SVs, the important value of the traffic factor (road network density of SVs; Figure 6D; Table 6) is the highest among all factors. Its importance values are 0.22, 0.26, 0.28, 0.38, and 0.35, respectively. Therefore, the traffic factor mainly influences SVs' development in Region 4.
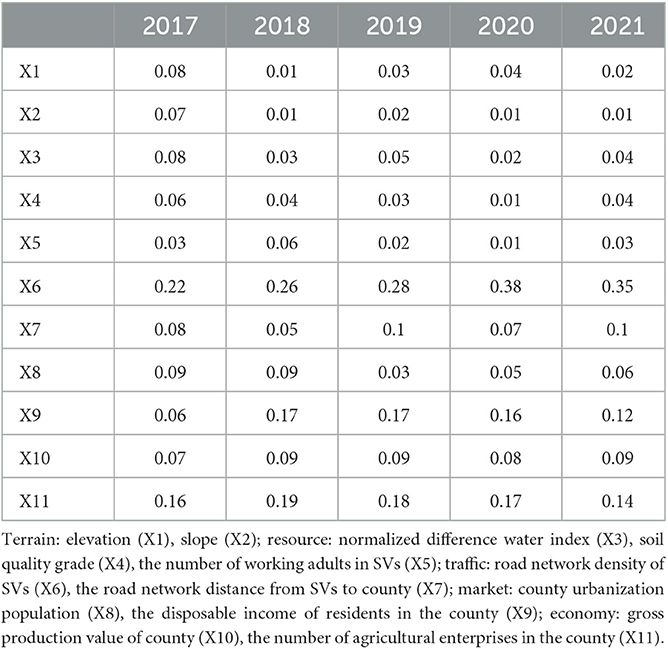
Table 6. Importance of influencing factors of SVs in Region 4.
Most sustainably developed SVs are mainly distributed on the mountain-plain (Regions 1 and 3) and hilly-plain (Region 4) transition zones, displaying a polycentric clustering pattern. Qiao et al. (2016) found two main agglomeration regions of SVs in Henan Province: Taihang Mountain foothill agglomeration (Region 1) and Pingdingshan–Luohe agglomeration (Region 4). Our study further verifies that the transition zone is the main clustering area of SVs, both during their formation and development. Regions 1 and 3 had a much higher density of development SVs than other regions, forming a unique core-periphery spatial structure and a well-known agro-industrial cluster (e.g., Jiaozuo agricultural cluster and Nanyang ecological agricultural park). The transition zone of mountain-plain (Regions 1 and 3) and hilly-plain (Region 4), with relatively more fertile soils and advanced irrigation techniques, has extremely superior natural conditions and are the origins of high-quality agricultural products in Henan for many years. Many sophisticated agricultural technologies were applied in these local areas, laying a solid foundation for the development of SVs. However, these SVs are generally far from the economic center and far from the market. So much so that, SVs in the process of experiencing the formation to the development, the influence of terrain and traffic factors on the development of SVs was decreasing, and the influence of market and economic factors was showing an increasing trend.
Previous studies used a specific time (or cross-section data) to explore the influencing factors of SVs. For example, Cao et al. (2020) found that the market factors only influenced SVs in Henan. In contrast, our study found that SVs' development in Henan is mainly influenced by market and transportation factors. The difference between the findings might be that the previous study focused on a certain point in the development process and revealed the development pattern at a time point. In comparison, our study is at a more macroscopic time scale and can discover the main drivers in SVs' development in a time frame. This difference in the time dimension will likely lead to the two studies' conclusions.
A study on the factors influencing the formation of SVs by Li et al. (2012) revealed that resource and traffic played fundamental roles in the formation of SVs. However, our study found that the importance of resource and traffic factors was declining during 2015–2020. The volume of the market and economic factors increased in the same period. This trend is most apparent in Region 3, which demands the formation's resources and traffic. With the continuous improvement of Henan's ecological environment and rural transportation network, the constraints of resources and traffic on the development of SVs in Region 3 are gradually eliminated. At the same time, the importance of market and economic factors continues to increase.
As per our analysis, the development of SVs in Henan and other similar underdeveloped areas can be promoted in the following ways: (1) Local government can focus on SVs in the mountain-plain and hilly-plain transition zones, give more financial and technical support to these SVs, help them explore the high-value agricultural products to promote the prosperity of rural industries and to increase the income of farmers. (2) The development of SVs in the transition zone of mountain-hilly or mountain-plain is mainly influenced by market factors. Based on the characteristics of agricultural products (such as production conditions and market prospects), the authorities can take measures, e.g., enriching agricultural product variety, improving agricultural product quality, and establishing high-level agricultural products trading markets, creating an integrated service system for the marketing of agricultural products. (3) Traffic factor is the key factor of the development of SVs in the plain and the transition zone of the hilly plain. These SVs should pay attention to the layout along the traffic routes and carry out the construction of roads and other infrastructures to improve the traffic accessibility of SVs.
This study used the data of SVs in Henan from 2017 to 2021 and constructed the development index of SVs to evaluate the development of SVs in Henan. Then, we utilized the random forest regression model to explore the influence of terrain, resource, traffic, market, and economy on the development of SVs. The study found that: (1) the sustainably developed SVs were mainly distributed in the plain and the transition zone of mountain-hilly, mountain-plain, and hilly-plain, showing a spatially aggregated polycentric characteristic; (2) market is the key factor of the development of SVs in the transition zone of mountain-hilly or mountain-plain, and the traffic factor mainly influences SVs in the plain and the transition zone of hilly-plain; (3) compared with the influencing factors on the formation of SVs, the influence of terrain and traffic factors on the development of SVs was decreasing, and the influence of market and economic factors was showing an increasing trend. These findings can further enrich the study of SVs and provide decision support to authorities in formulating the development strategies for SVs in underdeveloped regions.
In the study, the market and economic factors are at the county scale, this is indeed a limitation, China is a large national market, we only considered the local market, so in future studies, add more data to understand the marketing of local agricultural products, so as to reduce the influence on the results of the study at different scales. The development of SVs is often subject to the combined effects of multiple factors such as rural elites, rural self-development ability, and government policies. However, it is challenging to find measurement indicators reflecting the rural elites' knowledge, pastoral self-development capability, and government policies, which are the limitations of this study. Therefore, in future study, we would try to introduce new measures to represent these factors to reveal more influencing factors to the development of SVs, providing better decision support for the implementation of rural revitalization strategies in undeveloped regions.
The datasets presented in this study can be found in online repositories. This data can be found here: https://doi.org/10.6084/m9.figshare.18866726.v2.
NN: data curation, writing—original draft, software analysis, conceptualization, project administration, and writing—editing. CW: funding acquisition. HJ: charting. All authors contributed to the article and approved the submitted version.
This study was funded by the National Natural Science Foundation of China (Grant No. 42001337) and the Major Research Focus Project of Henan Academy of Sciences (Grant No. 210101007).
The authors declare that the research was conducted in the absence of any commercial or financial relationships that could be construed as a potential conflict of interest.
All claims expressed in this article are solely those of the authors and do not necessarily represent those of their affiliated organizations, or those of the publisher, the editors and the reviewers. Any product that may be evaluated in this article, or claim that may be made by its manufacturer, is not guaranteed or endorsed by the publisher.
Bansal, P., and Ardell, A. (1972). Average nearest-neighbor distances between uniformly distributed finite particles. Metallography 5, 97–111. doi: 10.1016/0026-0800(72)90048-1
Boody, G., Vondracek, B., Andow, D. A., Krinke, M., Westra, J., Zimmerman, J., et al. (2005). Multifunctional agriculture in the United States. BioScience 55, 27–38. doi: 10.1641/0006-3568(2005)055[0027:MAITUS]2.0.CO;2
Cai, Y., Cheng, X., Ma, L., Mao, R., Breitenbach, S. F., Zhang, H., et al. (2021). Holocene variability of East Asian summer monsoon as viewed from the speleothem δ18O records in central China. Earth Planetary Sci. Lett. 558, 116758. doi: 10.1016/j.epsl.2021.116758
Cao, Z., Liu, Y., Li, Y., and Wang, Y. (2020). Spatial pattern and its influencing factors of specialized villages and towns in China. Acta Geograp. Sinica 75, 1647–1666.
Chidumu, J. I. (2007). The impact of “One Village One Product (OVOP)” on household income–implications on food security: the case of Bvumbwe Operation Area, Thyolo District, Malawi (No. 634-2016-41521). Available online at: https://ageconsearch.umn.edu/record/93993
De Roest, K., Ferrari, P., and Knickel, K. (2017). Specialisation and economies of scale or diversification and economies of scope? Assessing different agricultural development pathways. J. Rural Stud. 59, 222–231. doi: 10.1016/j.jrurstud.2017.04.013
Garcia-Larsen, V., Morton, V., Norat, T., Moreira, A., Potts, J. F., Reeves, T., et al. (2019). Dietary patterns derived from principal component analysis (PCA) and risk of colorectal cancer: a systematic review and meta-analysis. Eur. J. Clin. Nutr. 73, 366–386. doi: 10.1038/s41430-018-0234-7
Granato, D., Santos, J. S., Escher, G. B., Ferreira, B. L., and Maggio, R. M. (2018). Use of principal component analysis (PCA) and hierarchical cluster analysis (HCA) for multivariate association between bioactive compounds and functional properties in foods: a critical perspective. Trends Food Sci. Technol. 72, 83–90. doi: 10.1016/j.tifs.2017.12.006
Kang, D. C. (2002). Bad loans to good friends: money politics and the developmental state in South Korea. Int. Org. 56, 177–207. doi: 10.1162/002081802753485179
Kasabov, E. (2016). Investigating difficulties and failure in early-stage rural cooperatives through a social capital lens. Eur. Urban Reg. Stud. 23, 895–916. doi: 10.1177/0969776415587121
Kettl, D. F. (2015). The job of government: interweaving public functions and private hands. Public Admin. Rev. 75, 219–229. doi: 10.1111/puar.12336
Li, X., Luo, Q., and Fan, X. (2009). A study on the formation and evolution of specialized rural villages. China Soft Sci. 24, 71–80.
Li, X., Luo, Q., and Yang, H. (2013). The type formation of specialized villages. Econ. Geogr. 7, 1–8.
Li, X., Ye, X., Zhou, X., Zheng, C., Leipnik, M., Lou, F., et al. (2018). Specialized villages in inland China: spatial and developmental issues. Sustainability 10, 2994. doi: 10.3390/su10092994
Li, X., Zhou, X., Zheng, C., and Scott, R. (2012). Development of specialized villages in various environments of less developed China. Acta Geogr. Sinica 67, 783–792.
Liaw, A., and Wiener, M. (2002). Classification and regression by Random Forest. R News 2, 18–22. Available online at: https://cogns.northwestern.edu/cbmg/LiawAndWiener2002.pdf
Liu, Y., Cao, G., Zhao, N., Mulligan, K., and Ye, X. (2018). Improve ground-level PM2, 5. concentration mapping using a random forests-based geostatistical approach. Environ. Pollut. 235, 272–282. doi: 10.1016/j.envpol.2017.12.070
Lsao, F. (1992). Lessons from abroad in rural community revitalization: the one village, one product movement in Japan. Comm. Dev. J. 27, 10–20. doi: 10.1093/oxfordjournals.cdj.a038571
Luo, D., Ye, L., and Sun, D. (2020). Risk evaluation of agricultural drought disaster using a grey cloud clustering model in Henan province, China. Int. J. Disaster Risk Reduct. 49, 101759. doi: 10.1016/j.ijdrr.2020.101759
Marac (2017). Reply to Recommendation No. 3421 of the Fifth Session of the Twelfth National People's Congress. Available online at: http://www.moa.gov.cn/gk/jyta/201710/t20171017_5842497.htm,2017-10-18 (accessed June 1, 2023).
Measham, T. G., and Fleming, D. A. (2014). Impacts of unconventional gas development on rural community decline. J. Rural Stud. 36, 376–385. doi: 10.1016/j.jrurstud.2014.04.003
Mussina, K., Dulatbekova, Z., Baimbetova, A., Podsukhina, O., and Lemanowicz, M. (2019). The current state and prospects for the development of Akmola region as a tourism destination. J. Environ. Manag. Tourism 10, 1934–1946. doi: 10.14505//jemt.v10.8(40).23
Niu, N., Li, X., and Li, L. (2021). Exploring the spatio-temporal dynamics of development of specialized agricultural villages in the underdeveloped region of China. Land 10, 698. doi: 10.3390/land10070698
Qiao, J., Lee, J., and Ye, X. (2016). Spatiotemporal evolution of specialized villages and rural development: a case study of Henan province, China. Annal. Am. Assoc. Geograp. 106, 57–75. doi: 10.1080/00045608.2015.1086951
Sheather, S. J., and Jones, M. C. (1991). A reliable data-based bandwidth selection method for kernel density estimation. J. R. Statist. Soc. Series 53, 683–690. doi: 10.1111/j.2517-6161.1991.tb01857.x
Wang, Y., Hu, X., Jin, G., Hou, Z., Ning, J., Zhang, Z., et al. (2019). Rapid prediction of chlorophylls and carotenoids content in tea leaves under different levels of nitrogen application based on hyperspectral imaging. J. Sci. Food Agricul. 99, 1997–2004. doi: 10.1002/jsfa.9399
Wold, S., Esbensen, K., and Geladi, P. (1987). Principal component analysis. Chemom. Intellig. Lab. Syst. 2, 37–52. doi: 10.1016/0169-7439(87)80084-9
Wu, N., Li, E., and Li, X. (2013). Spatial distribution of specialized vegetable cultivation villages and its influencing factors: a case study of capsicum plantation in Zhecheng County, Henan Province. Geograp. Res. 32, 1303.
Yang, R., Zhang, X., and Xu, Q. (2022). Spatial distribution characteristics and influencing factors of agricultural specialized villages in Guangdong Province, China. Chin. Geograp. Sci. 32, 1013–1034. doi: 10.1007/s11769-022-1317-x
Ye, T., Zhao, N., Yang, X., Ouyang, Z., Liu, X., Chen, Q., et al. (2019). Improved population mapping for China using remotely sensed and points-of-interest data within a random forests model. Sci. Total Environ. 658, 936–946. doi: 10.1016/j.scitotenv.2018.12.276
Keywords: specialized villages, random forest regression, influencing factors, spatial patterns of evolution, China
Citation: Niu N, Wang C and Jin H (2023) Untangling the spatial patterns of evolution of specialized villages and influencing factors. Front. Ecol. Evol. 11:1186686. doi: 10.3389/fevo.2023.1186686
Received: 15 March 2023; Accepted: 22 May 2023;
Published: 15 June 2023.
Edited by:
Nallapaneni Manoj Kumar, City University of Hong Kong, Hong Kong SAR, ChinaReviewed by:
Biplov Bhandari, University of Alabama in Huntsville, United StatesCopyright © 2023 Niu, Wang and Jin. This is an open-access article distributed under the terms of the Creative Commons Attribution License (CC BY). The use, distribution or reproduction in other forums is permitted, provided the original author(s) and the copyright owner(s) are credited and that the original publication in this journal is cited, in accordance with accepted academic practice. No use, distribution or reproduction is permitted which does not comply with these terms.
*Correspondence: Chao Wang, d2FuZ2NoYW9AaWdzLWhhcy5jbg==; He Jin, aGppbjFAdXNmLmVkdQ==
Disclaimer: All claims expressed in this article are solely those of the authors and do not necessarily represent those of their affiliated organizations, or those of the publisher, the editors and the reviewers. Any product that may be evaluated in this article or claim that may be made by its manufacturer is not guaranteed or endorsed by the publisher.
Research integrity at Frontiers
Learn more about the work of our research integrity team to safeguard the quality of each article we publish.