 Shu Quan
 Maojuan Li2†
 Tianqi Li
95% of researchers rate our articles as excellent or good
Learn more about the work of our research integrity team to safeguard the quality of each article we publish.
Find out more
ORIGINAL RESEARCH article
Front. Ecol. Evol. , 11 August 2023
Sec. Interdisciplinary Climate Studies
Volume 11 - 2023 | https://doi.org/10.3389/fevo.2023.1185249
This article is part of the Research Topic Nature-based Solutions for Urban Resilience and Human Health View all 10 articles
Urban cold island effects have become increasingly relevant with accelerating climate change. However, the relationship between such effects and their causal variables remains unclear. In the present study, we analyzed the relationship between blue-green space variables and land surface temperature (LST) and park cooling intensity (PCI) in central Zhengzhou City using a random forest regression model. Cool urban areas corresponded to the location of blue-green spaces. The average temperatures of these spaces were 2 °C and 1 °C lower than those of the built-up areas and the full study region, respectively. Blue-green spaces also had a maximum temperature that was 8 °C lower than those of the built-up areas and the study region. The three primary variables determining LST were blue space proportion and area and vegetation cover, whereas the three variables determining PCI were blue-green space width, vegetation cover, and patch density. At a width of 140 m, blue-green spaces caused a PCI peak, which further improved at 310 m. The proportion of blue space had a stepwise effect on PCI. A vegetation coverage of 56% represented the lower threshold of LST and the higher threshold of PCI. These results reflect a nonlinear relationship between blue-green variables and urban cold islands. In conclusion, the study provides data that could inform the efficient use of blue-green spaces in urban construction and renewal.
The urban heat island effect has become one of the most pressing ecological and environmental challenges globally, due to the rapid acceleration of global urbanization (Yu et al., 2019b; Liang et al., 2020; Ren et al., 2021). Urban parks formed by landscapes including bodies of water and green vegetation are effective ways to alleviate the urban heat island effect and improve local thermal environments (Santamouris et al., 2011; Sun et al., 2012; Gunawardena et al., 2017). These parks are known as “urban cold islands (UCIs)” and have attracted widespread attention for their potential in enhancing the UCI effect and mitigate increasingly strong urban heat island effects.
Promoting the UCI effect is key in developing sustainable, resilient, and adaptive urban ecosystems (Kong et al., 2014a; Yu et al., 2021; Çevik Değerli and Çetin, 2022). Blue-green spaces in cities serve as efficient heat regulation mechanisms, improving the urban thermal environment and thereby mitigating the urban heat island effect. Specifically, urban green spaces provide cooler outdoor environments via direct shading during the day and evapotranspiration at night (Fan et al., 2019; Yu et al., 2023), while urban blue spaces decrease air temperatures through their high evaporation rates and specific thermal capacitance (Huanchun et al., 2020; Xi et al., 2023). By enhancing vegetation coverage and integrating water bodies, these spaces can lower the surface temperatures of buildings and roads, reduce heat radiation, and generate cooler climatic conditions, which can contribute to more enjoyable outdoor environments for urban residents (Cetin, 2020; Adiguzel et al., 2022). Additionally, blue-green spaces fulfill vital ecological functions such as improving urban air quality, absorbing carbon dioxide, purifying water bodies, enhancing biodiversity, and providing habitat and ecosystem services (Bozdogan Sert et al., 2021; Zeren Cetin et al., 2023a; Zeren Cetin et al., 2023b). They also help address water resource issues, mitigate flood risks, and enhance urban resilience (Yumino et al., 2015; Zhao et al., 2021; Adigüzel and Çeti̇n, 2022). Considering these benefits, a more in-depth understanding of the variables that influence the cooling effects of blue-green spaces and their function could offer crucial insights into further mitigating the urban heat island phenomenon.
A strong correlation exists between blue-green spatial patterns and land surface temperature (LST) (Sun and Chen, 2017; Xue et al., 2019; Lan et al., 2022), with the degree of cooling being dependent on the size, shape, connectivity, and complexity of blue-green spaces (Gunawardena et al., 2017). For example, the size and distribution of urban green spaces considerably influence their ability to alleviate the heat island effect (Huanchun et al., 2020). Moreover, many landscape indicators, such as landscape shape index and patch density, have been widely used to reveal the relationship between the geometric properties of blue-green space and the UCI effect. The patch density and average patch size of vegetation play a key role in its cooling capacity (Lu et al., 2012; Kong et al., 2014b). Additionally, surface UCI intensity is negatively correlated with patch density and the average patch shape of the green space (Gao et al., 2022). Although these studies explain the relationship between variables and surface temperature, there is less discussion of the case of urban parks with both water and green space. To date, there is no academic consensus on how to improve the urban thermal environment through UCIs.
Cities are complex nonlinear open systems with high levels of uncertainty (Gallopín, 2020; Padovan et al., 2022). To simplify the research process, most studies on the UCI effect currently rely on linear models for analysis (Li et al., 2019; Xue et al., 2019; Liu et al., 2021). However, these models are inappropriate when variables are cross-correlated, and their use can lead to misleading results (Belgiu and Drăguţ, 2016; He et al., 2022). For example, Guha and Govil (2021) and Ullah et al. (2023) found that LST decreases with an increasing normalized difference vegetation index in green areas. Jaganmohan et al. (2016) discovered that small, intricately shaped green spaces have a negative impact on cooling, whereas green space areas larger than 5.6 hectares have a positive effect. However, larger blue-green spaces do not necessarily lead to better UCI effects. According to Cheng et al. (2015), large parks are not more advantageous than small parks in terms of lowering surrounding temperatures. Other studies support this finding, indicating that park size has a threshold in terms of cooling efficiency (Yu et al., 2020; Kraemer and Kabisch, 2022; Li et al., 2022). Once the threshold is exceeded, the cooling efficiency of urban parks will significantly decrease, which has implications for urban park planning and management. In addition, these models are highly sensitive to outliers and may not accurately represent the complex relationships between various factors (Sharma et al., 2011; Mohammad and Pradhan, 2021; Xiao et al., 2022a). Due to these limitations, traditional linear models often struggle to accurately describe UCI phenomena. Therefore, identifying an efficient and accurate nonlinear model is crucial for studying the UCI effect.
The random forest regression (RFR) model, an ensemble learning method based on decision trees, has been widely recognized as a powerful tool for studying the UCI effect (Wang et al., 2022a; Xiang et al., 2023). This model is specifically designed to analyze complex interactions among nonlinear and multi-dimensional independent variables. For instance, exploring the elements that influence the UCI effect during day/night using RFR models tend to lead to more in-depth results (Oukawa et al., 2022), and RFR exhibits good performance at different cooling distance scales (Wang et al., 2022b). Compared to traditional linear regression models, the RFR model offers several advantages. First, it does not require feature scaling or transformation, and can handle independent variables with different scales and units, allowing for more convenient and efficient processing of multi-dimensional data (Mishra et al., 2020). Additionally, the RFR model can capture nonlinear relationships between independent variables and the target variable (Fan et al., 2023), including nonlinear relationships and higher-order interactions, making it suitable for modeling complex relationships (Hatami Bahman Beiglou et al., 2021). Specifically, the RFR model has significant advantages in quantifying the threshold sizes of different landscape types (while accounting for the effects of landscape composition and configuration) to optimize the cooling efficiency of blue-green spaces. This is crucial for decision-makers and actionable urban park planning.
Improving knowledge on how to optimize the spatial configuration of cities to enhance UCI effect remains a prerequisite for creating sustainable cities. The present study aimed to investigate the impact of urban blue-green spaces on the UCI effect in Zhengzhou using remote sensing satellite images. After deriving surface temperature with atmospheric correction, we employed an RFR model to analyze the mechanisms influencing the UCI effect. Our study had the following aims: (1) to examine the spatial distribution of urban blue-green spaces and its influence on the UCI effect, and (2) to investigate the nonlinear relationship between LST and the variables related to urban blue-green spaces. The results of our study can expand our scientific understanding of the nonlinear influences of blue-green space characteristics on LST and PCI and provide a scientific basis for formulating sustainable and resilient urban parks and rational planning of the spatial layout of urban spaces.
This study was conducted in Zhengzhou City (112°42’E–114°14’E, 34°16–34°58’N), in Henan Province, central China. The region has a temperate and semi-humid continental climate with an average summer temperature of 19–30 °C. Zhengzhou is an important emerging city in Asia with a diversity of blue-green spaces. However, rapid urbanization and climate change have generated thermal environment problems in Zhengzhou. In June 2022, the city reached a historic maximum temperature of 42.3°C, highlighting the urgent need for research on how to improve living conditions and mitigate the impacts of increasingly frequent extreme urban heat events.
Remote sensing data were obtained from Landsat-8 OLI/TIRS satellite images on July 16, 2020, with good imaging quality, clear ground features, and no clouds and/or band stripe. The spatial resolution was 30 m. To mitigate the impact of atmospheric conditions on the quality of remote sensing images, the multi-spectral bands underwent radiometric calibration and atmospheric correction.
Urban surface types were categorized into blue, green, and built-up areas using a supervised classification approach. The analysis was ultimately performed on 114 well-developed urban blue and green spaces in the central part of the city, with reference to the high-definition images of HSPA-2 (Figure 1). Data processing was performed using ENVI 5.3 and ArcGIS 10.8.
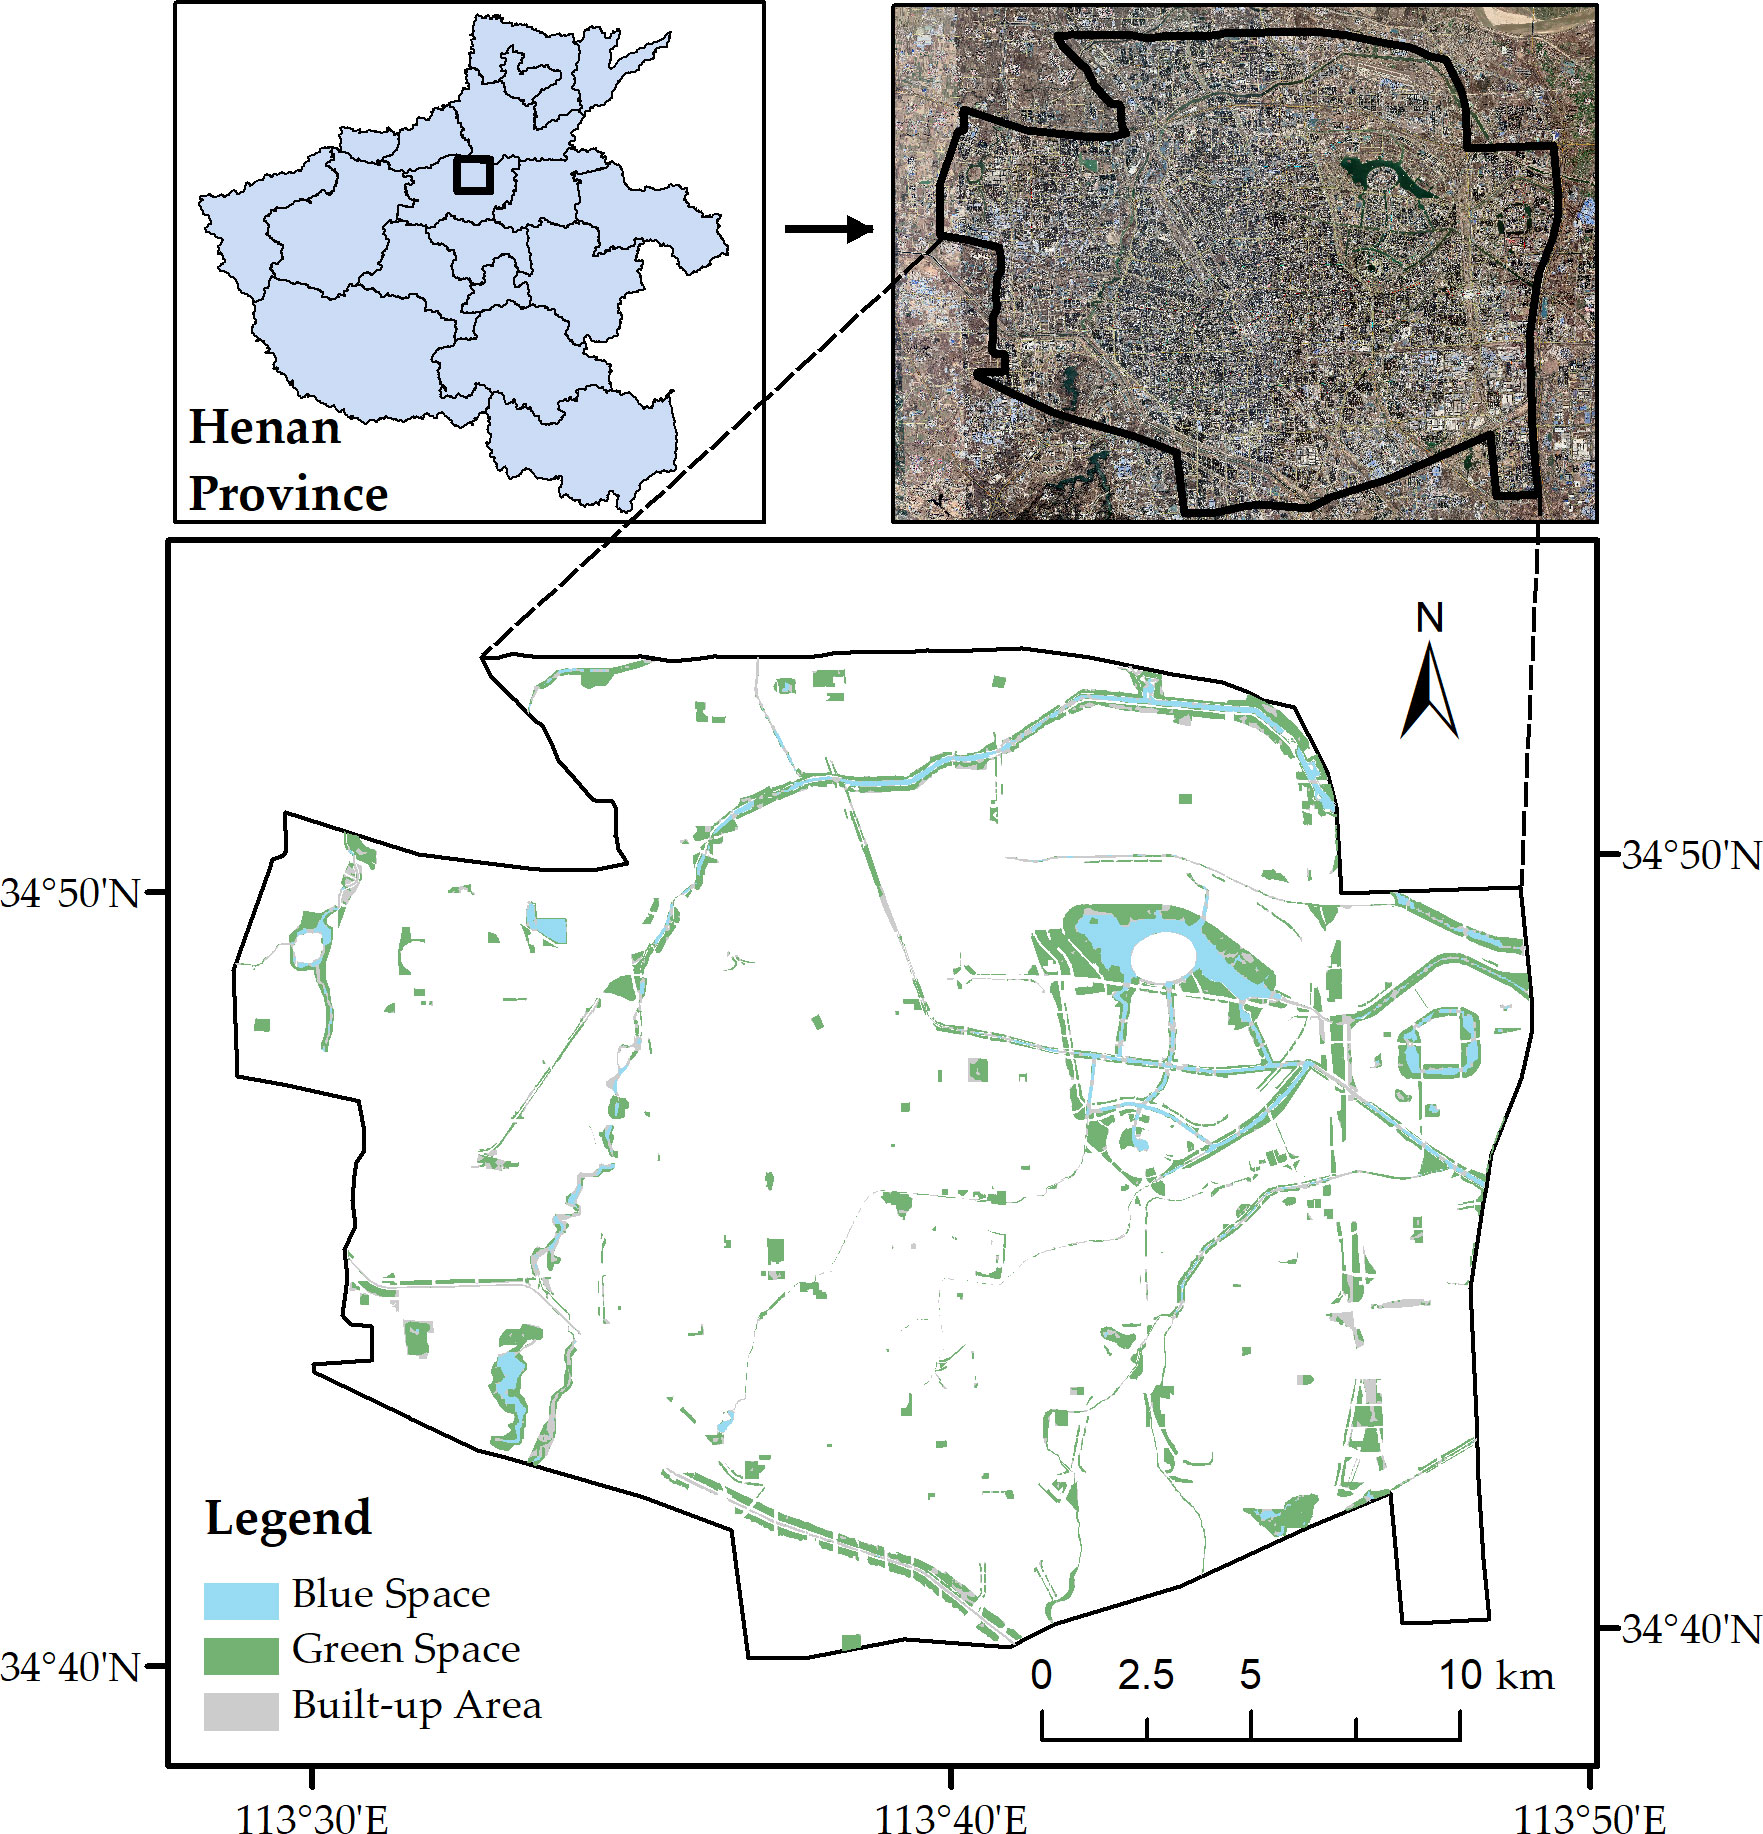
Figure 1 Distribution of blue and green spaces in central Zhengzhou during 2020.
This study adopted an atmospheric correction method to retrieve the LST of built-up areas in Zhengzhou. First, the atmospheric influence on surface thermal radiation was estimated. This atmospheric influence was then subtracted from the total thermal radiation observed by satellite sensors, yielding surface thermal radiation intensity, which was subsequently converted into a corresponding surface temperature using the following equations (Chibuike et al., 2018):
where is surface specific emissivity, is surface true temperature, is blackbody thermal radiation brightness, is atmospheric transmittance, is atmospheric upward radiation brightness, is atmospheric downward radiation energy, is thermal infrared radiation brightness. and are coefficients, with .
To comprehensively evaluate the influence of urban blue-green spaces on UCI, variable selection was conducted based on three aspects.
First, variables were selected based on existing research on the relationship between urban green-blue spaces and UHI. Previous studies have shown that the cooling effect of UCI is related to the vegetation coverage of the urban blue-green space (Alavipanah et al., 2015) as well as its geometric attributes, such as width (Peng et al., 2021), water body area (Xue et al., 2019; Liu et al., 2022), and proportion (Sun and Chen, 2017). This ensures that the chosen variables are correlated and can accurately analyze this relationship.
Second, the variables were divided into three categories to provide a more detailed understanding of the different aspects of urban green-blue spaces and avoid oversimplification, in order to reflect the complexity of urban green-blue spaces.
Third, the selected variables cover different aspects of urban green-blue space, such as area, width, density, and coverage, all of which affect UCI. This selection of variables is supported by existing research and rational reasoning, providing a comprehensive and detailed approach to studying the relationship between urban green-blue space and UCI.
As a result, this study selected blue-green space area and width, patch and edge density, percentage of blue and green space, blue and green space area, and fractional vegetation cover as variables with strong influence on UCI (see Table 1 for abbreviations and categories). Variable values were calculated using the satellite images and the following equations (Figure 2).
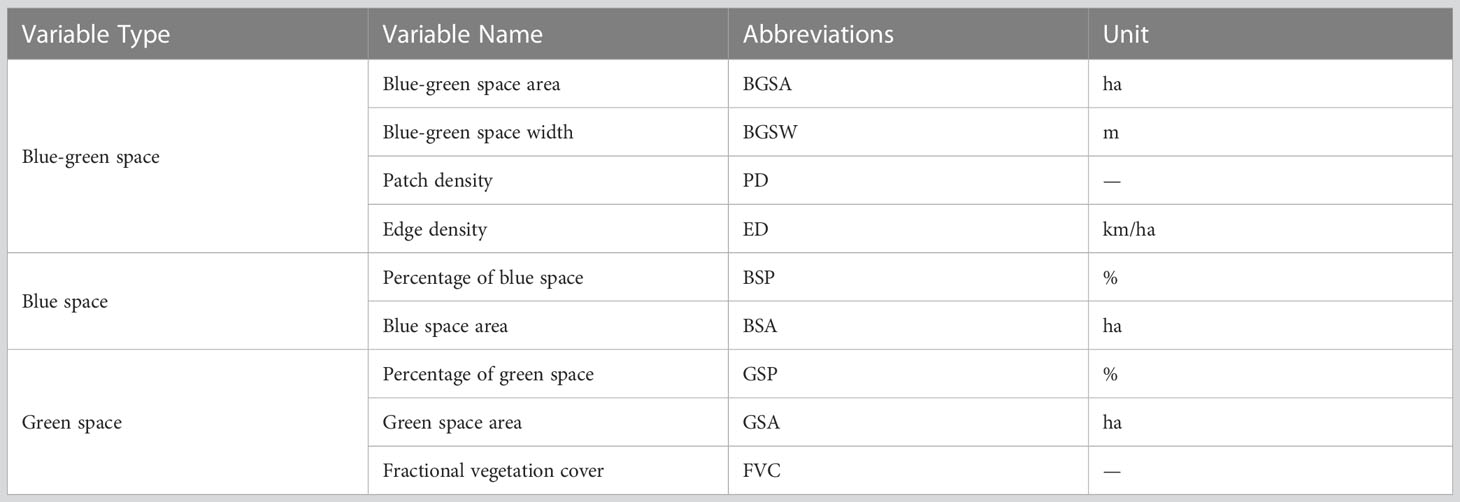
Table 1 Selection of variables with a strong relationship to UCI.

Figure 2 Variable measurements in central Zhengzhou. (A) BGSA (ha); (B) BGSW (m); (C) PD; (D) ED (km/ha); (E) BSP (%); (F) BSA (ha); (G) GSP (%); (H) GSA (ha); and (I) FVC (%). See Table 1 for definitions of variable abbreviations.
Patch density (PD) is the degree of landscape fragmentation and reflects an area’s spatial complexity. It is calculated using the following formula:
where is the number of patches in blue-green space and is the total area of blue-green space i.
Edge density (ED) reflects the degree of blue-green spatial fragmentation, meaning that the larger the value, the higher the fragmentation. It is calculated using the following formula:
where Ei is the total boundary of blue-green space and is the total area of blue-green space .
Park cooling intensity (PCI) was also used to evaluate the cooling effect of urban blue-green spaces. This variable is determined based on the difference between a given temperature range inside and outside the blue-green space. It is calculated using the following equation (Cao et al., 2010; Chibuike et al., 2018):
where denotes average surface temperature within a certain range outside the boundary of the blue-green space and denotes LST within the blue-green space. The 500 m surrounding the blue-green spaces of central Zhengzhou were selected as the cooling areas for PCI, as per previous studies (Cao et al., 2010; Chibuike et al., 2018; Huanchun et al., 2020).
The RF model is a machine-learning algorithm that can process large amounts of data quickly and accurately (Sharma et al., 2011). The RFR algorithm is formed by integrating multiple decision tree models (Breiman, 2001), as follows:
where is the result of the RF combination model and is the single-tree regression model.
Using the “Random Forest” package in R, the relationship between UCI variables and surface temperature was evaluated. Variable importance was assessed with two measures: percentage increase in mean squared error (%IncMSE) and increased node purity (IncNodePurity) (Gao et al., 2022; Oukawa et al., 2022; Wang et al., 2022b). The %IncMSE reflects a given variable’s contribution to the prediction accuracy of the target variable, whereas IncNodePurity measures the difference in the root sum of squared errors before and after the variable’s split, as determined by the Gini index. Partial dependence plots were used to reveal complex dependence patterns among independent variables.
Urban parks with blue-green space area (BGSA) > 100 ha were predominantly situated on the outskirts of Zhengzhou City, such as Longhu Park in the northeast and Riverside Park on the periphery (Figure 2A). Urban parks with BGSA< 30 ha were mainly located in the older Zhengzhou City center. Urban parks with BGSA > 134 ha had an average of 21% of blue space (BSP), indicating that larger BGSA also tended to contain more blue space (Figure 2E). The distributions of PD and ED were similar; both were higher in long or sprawling riverfront parks along the urban periphery (Figures 2C, D).
Our analysis demonstrated that the urban thermal environment and the spatial patterns of urban blue-green spaces were highly correlated (Figure 3). Built-up areas had higher temperatures than the urban blue-green spaces (Table 2). Furthermore, average temperatures were higher in the southeastern and western parts of Zhengzhou, with dense residential areas, but lower in the northeastern part, which contains large parks. The highest temperature (51°C) was recorded in a built-up area, whereas the lowest temperature (27°C) was recorded in a blue-green space. Overall, average temperatures in the blue-green spaces were 2°C lower than the average in built-up areas and 1°C lower than the average in the entire study area. The maximum temperature in blue-green spaces was 8°C lower than in the built-up areas and the entire study area.
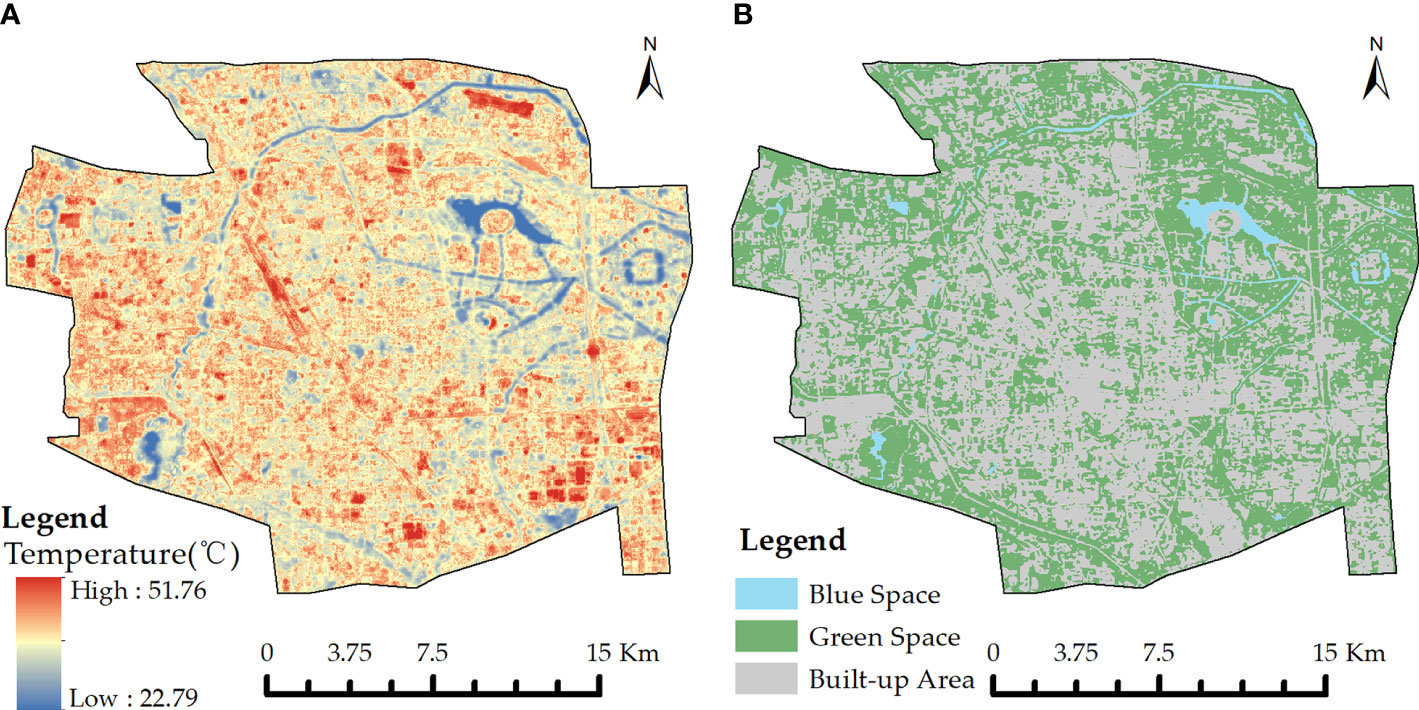
Figure 3 Inversion results of surface temperature in central Zhengzhou during 2020 (A) and spatial distribution of blue and green spaces (B).
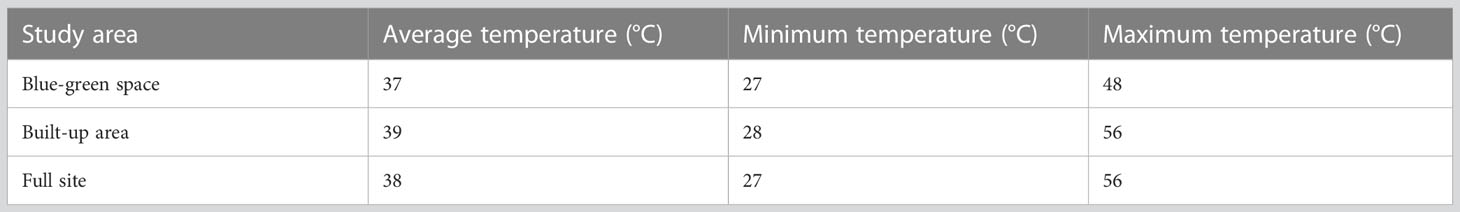
Table 2 Urban thermal environment during 2020 in Zhengzhou.
Our regression models were constructed using LST and PCI as dependent variables and blue-green spatial metrics as independent variables. We used root mean square error (RMSE), mean absolute error (MAE), and R-squared (R2) to quantify the accuracy of each regression model. The RMSE, MAE, and R2 were 0.767, 0.643, and 0.752, respectively, for LST. The RMSE, MAE, and R2 were 0.742, 0.641, and 0.673, respectively, for PCI. R2 is the squared correlation between observed and predicted values. The MAE is the mean absolute difference between observed and predicted values, whereas RMSE is the deviation between observed and predicted values; the former metric is less sensitive to outliers than the latter. A higher R2, in combination with lower RMSE and MAE, indicates greater model accuracy.
In terms of %IncMSE, the top five variables affecting LST were BSP, fractional vegetation cover (FVC), blue space area (BSA), BGSA, and PD (Figure 4). In terms of IncNodePurity, the top five variables affecting LST were BSP, FVC, BSA, BGSA, and ED. Thus, BSP, FVC, and BSA were the three key factors influencing LST.
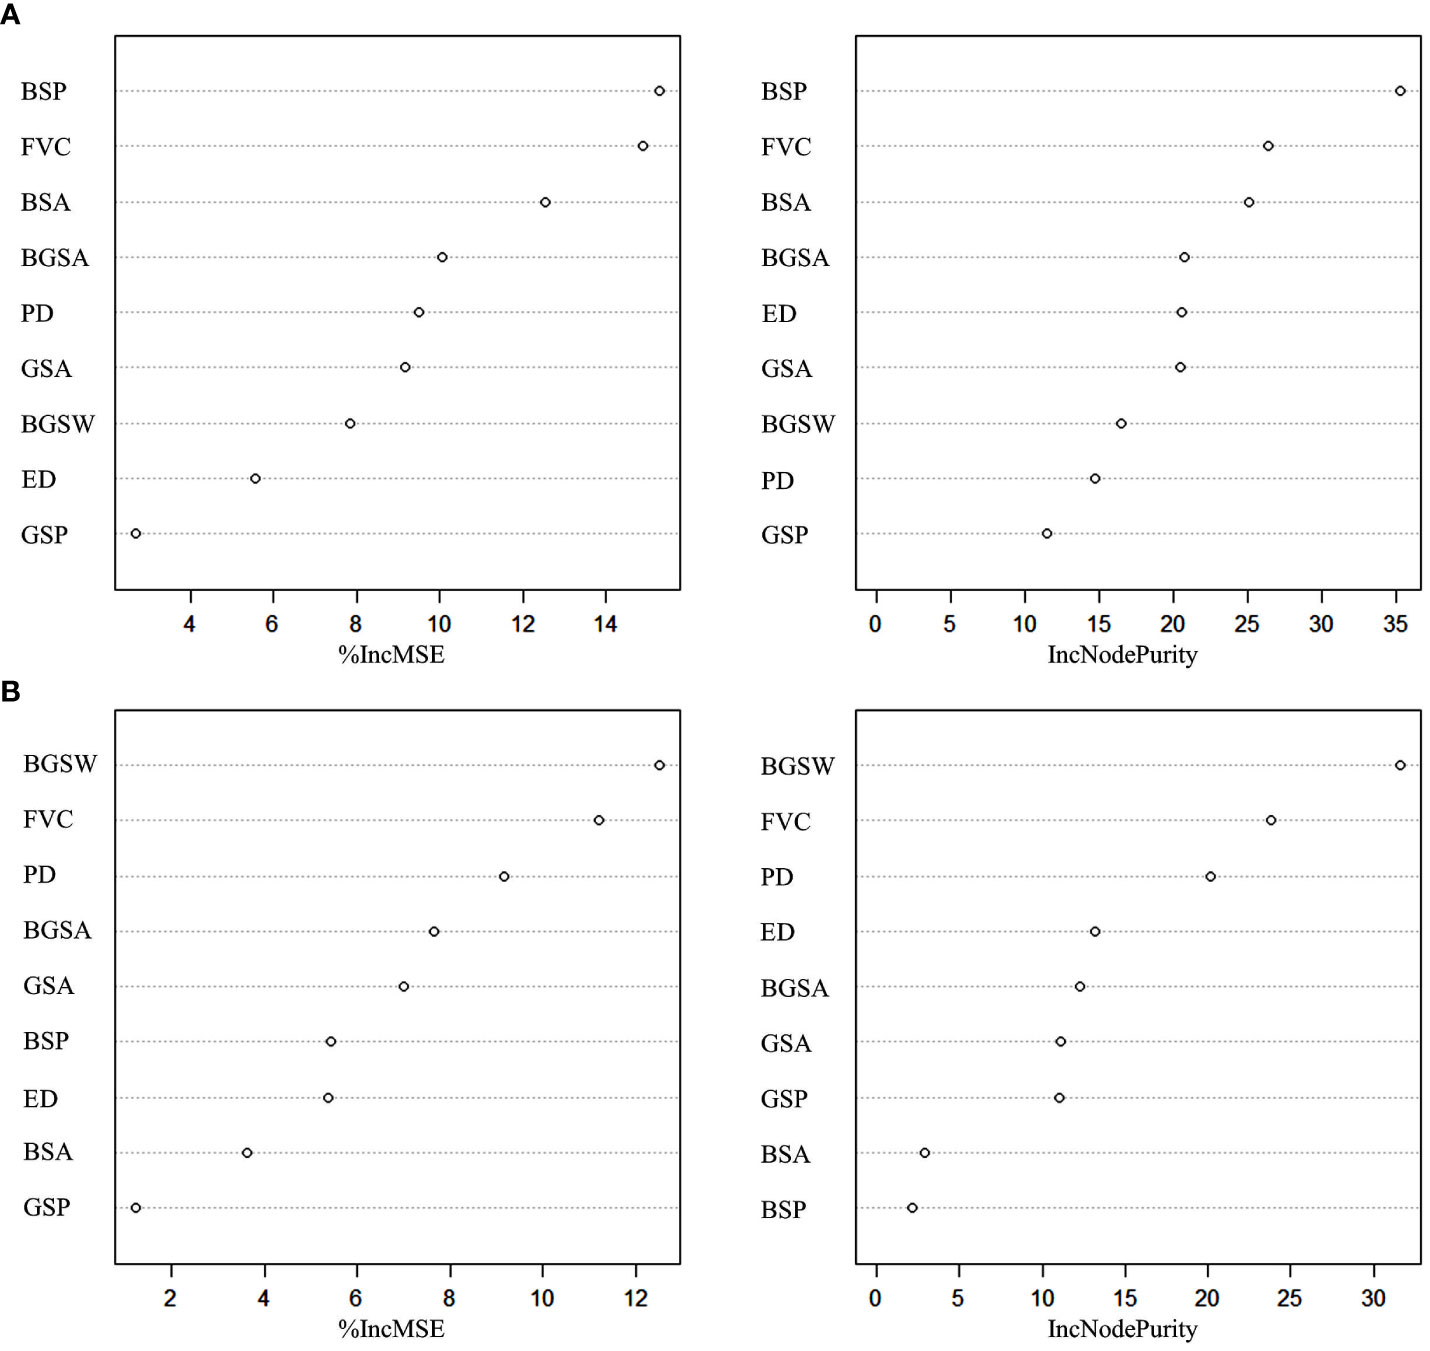
Figure 4 Importance ranking of blue-green space variables in influencing LST (A) and PCI (B) based on percentage increase in mean squared error (%IncMSE) and increased node purity (IncNodePurity).
In terms of %IncMSE, the top five variables affecting PCI were blue-green space width (BGSW), FVC, PD, BGSA, and green space area (GSA). In terms of IncNodePurity, the top five variables were BGSW, FVC, PD, ED, and BGSA. Therefore, the three most important variables for determining PCI were BGSW, PD, and FVC.
Partial dependence plots indicate that LST was negatively correlated with BGSA, BGSW, PD, BSP, BSA, GSA, percentage of green space (GSP), and FVC, but positively correlated with ED (Figure 5).
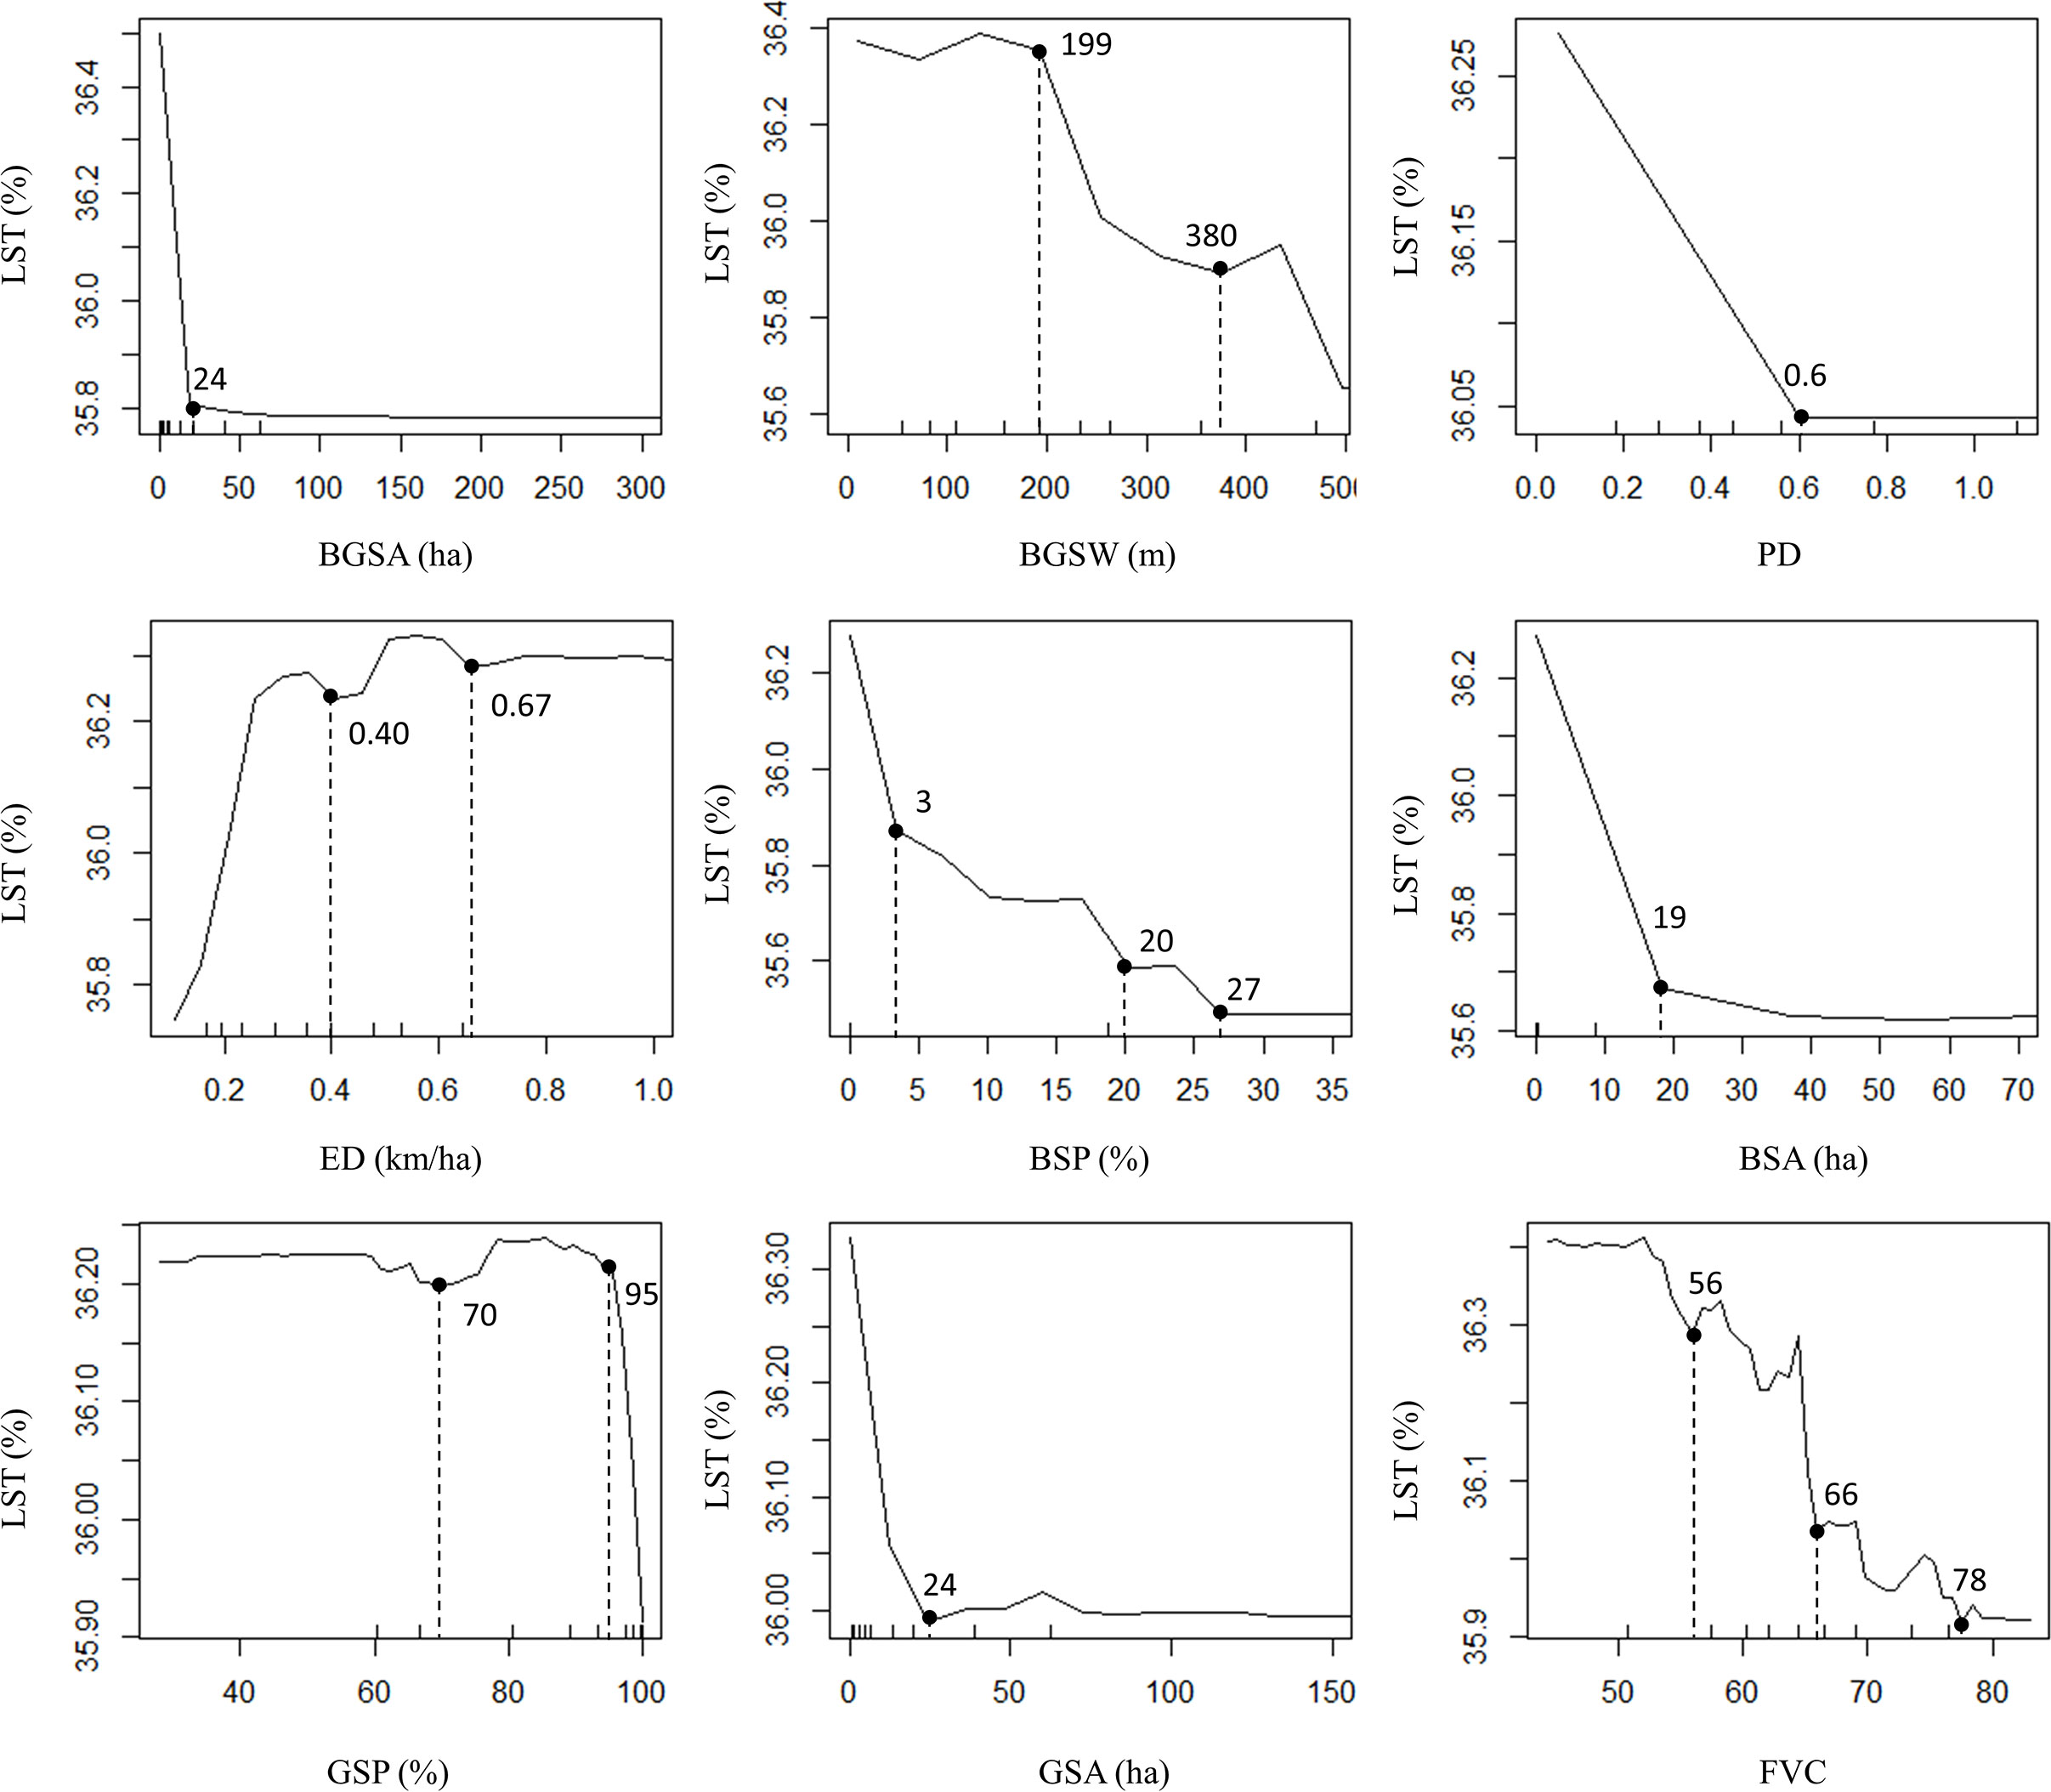
Figure 5 Bias dependence analysis for LST.
Among these variables, LST peaked at 36.37 °C when BGSA was close to 0 ha, decreased when BGSA reached 24 ha, but did not considerably change beyond that size. Therefore, increasing BGSA has diminishing returns for urban LST past a certain threshold value. Similarly, the thresholds for BSA and GSA were 19 ha and 24 ha, respectively, beyond which they had no significant effect on LST. This result suggests that urban blue-green spaces can be effective even when maintained at a scale that balances the needs of other urban sites. Next, BSP exhibited a step-like pattern, first causing a considerable cooling effect at 0–3%, then cooling further at 20–27% before stabilizing. Thus, the presence of blue space lowered the surface temperature. Green space also lowered temperatures, but exhibited a different trend; at 70%, GSP exhibited a small cooling effect, whereas, at 95%, LST decreased rapidly. This may be attributed to an interaction between green space density and microclimate regulation.
Our results also suggest that fragmenting and simplifying blue-green spaces can improve LST. We observed that LST decreased as PD increased, but only after PD was less than 0.6. This result indicates that some degree of landscape fragmentation is conducive to lowering LST; however, after a given threshold, fragmentation will not substantially alter LST. In contrast, when ED was between 0.2–0.3, LST rose rapidly, indicating that simplifying the shape of blue-green spaces is conducive to maintaining a lower LST. Subsequently, LST showed a slight decrease when ED was 0.40 and 0.67. Finally, FVC exhibited a stepwise effect, causing a decrease in LST at 56%, 66%, and 78%, although the final change in LST was less apparent.
Partial dependence plots revealed that PCI was positively dependent on BGSA, BGSW, PD, BSP, BSA, GSA, and FVC, but negatively dependent on ED (Figure 6). The threshold values for BGSA, BSA, and GSA were 24 ha, 19 ha, and 25 ha, respectively; BGSW caused a small peak in PCI at 140 m and a higher peak at 310 m. Additionally, PCI remained high, with small fluctuations, at BSP = 4%. When the GSP was below 61%, PCI was consistently low, whereas, at other percentages, PCI oscillated considerably, resulting in higher PCI when GSP was between 61% and 88%.

Figure 6 Bias dependence analysis for PCI.
Similar to the LST results, the threshold for PD was 0.6, with PCI being the lowest at this value. For ED, PCI was highest at 0.10 and the second-highest at 0.45. As ED increased, PCI exhibited low to moderate levels of fluctuation. Lastly, FVC again caused a stepwise effect; PCI rose slightly at 56% and then rapidly at 73%, then stabilized when FVC reached a high value of 79%.
Our findings suggest that the distribution of urban blue-green spaces and UCI is highly correlated with urban development paths in Zhengzhou City. This study conducted a comprehensive examination of hotspot and coldspot distributions of urban LST using the ArcGIS spatial hotspot analysis tool. The results were categorized into three distinct categories: spatial aggregation greater than zero (hotspot), spatial aggregation equal to zero (random), and spatial aggregation less than zero (cold spot).
The central downtown area of Zhengzhou City exhibited a considerably higher temperature than the rest of the city (Figure 7). This concentration of heat is linked with the high concentration of urban development aimed at addressing housing shortages in the older downtown region. The prioritization of buildings over public blue-green spaces has resulted in a pronounced heat island effect (Yu et al., 2019a; Saha et al., 2021; Xue et al., 2022). Conversely, the low-temperature center was in the northeast, corresponding to Zhengdong New Area, which has comprehensive environmental construction and features numerous large urban parks that regulate the local climate (Kwak et al., 2020).
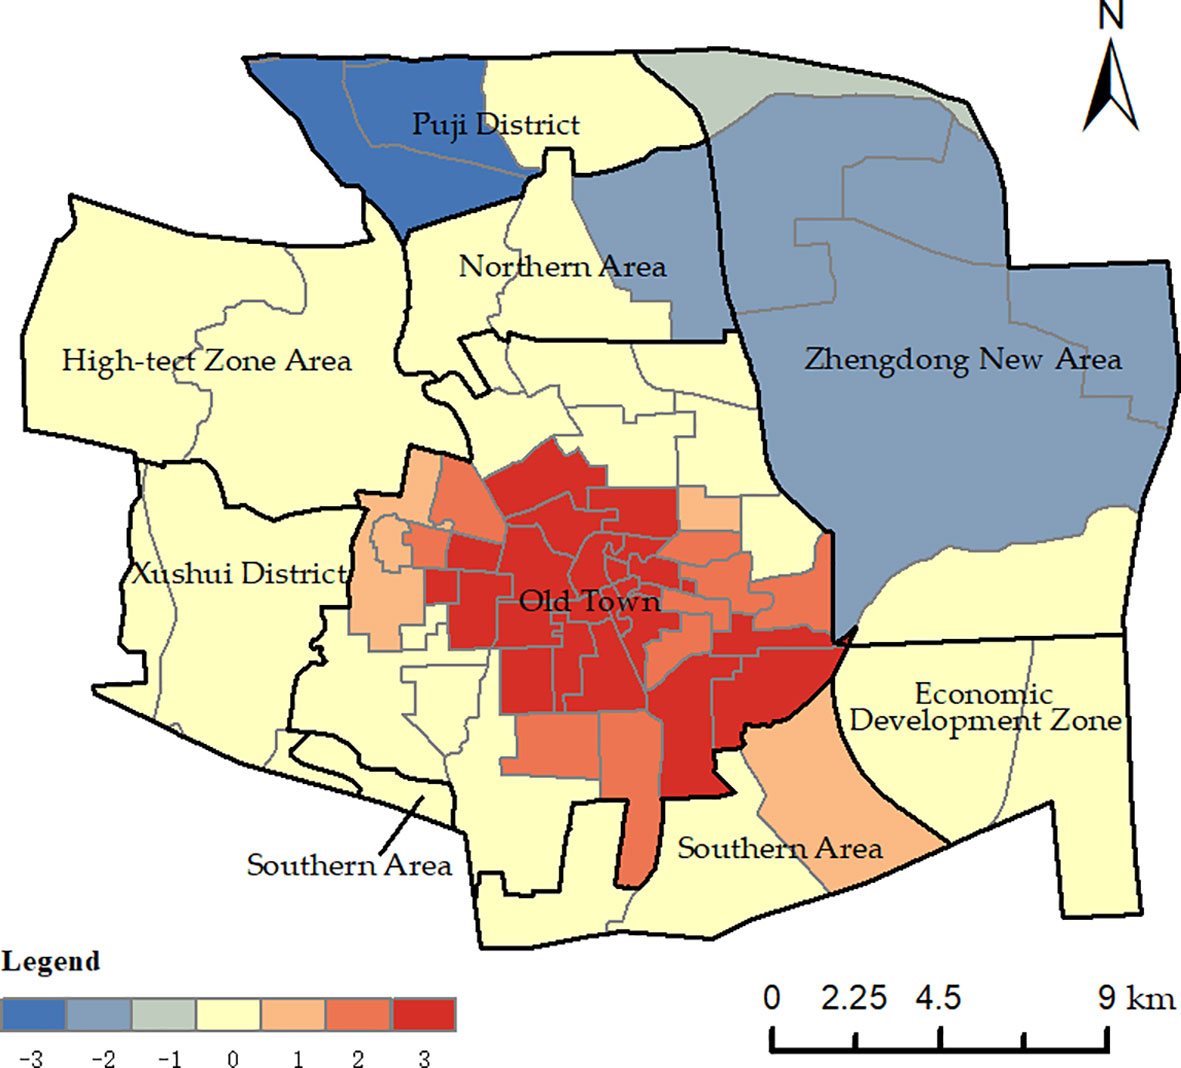
Figure 7 Coldspot/hotspot analysis of LST in Zhengzhou.
Urban planning is the main driving force behind the blue and green spatial patterns of cities. Effective urban planning that produces a reasonable blue-green spatial layout can considerably influence the thermal environment of cities (Lemoine-Rodríguez et al., 2022; Wu et al., 2022; Chang et al., 2023). To create a balanced urban thermal environment, it is necessary reconsider current urban planning strategies and prioritize a more comprehensive approach to blue and green infrastructure development. These improvements should include increasing the proportion of blue-green spaces to alleviate high temperatures in the old city center (Liu et al., 2023; Qi et al., 2023; Zhu and Yuan, 2023). In general, plans for urban renewal should take blue-green spaces in the downtown area into consideration, prioritizing a decentralized arrangement that increases the proportion of such spaces in high-temperature regions.
Table 3 displays the error and fitting performance of the RFR model vs. other models in studying the UCI effect. Representative regression models were selected, including nonlinear (i.e., RFR, Back Propagation Neural Network Regression (BP Neural Network Regression), XGBoost Regression, and Decision Tree Regression) and linear (i.e., Multiple Linear Regression (MLR), Ridge Regression, Lasso Regression, and Partial Least Squares Regression (PLS Regression)) models (Lach et al., 2021; Lin et al., 2022; Xiao et al., 2022b; Wang et al., 2023).
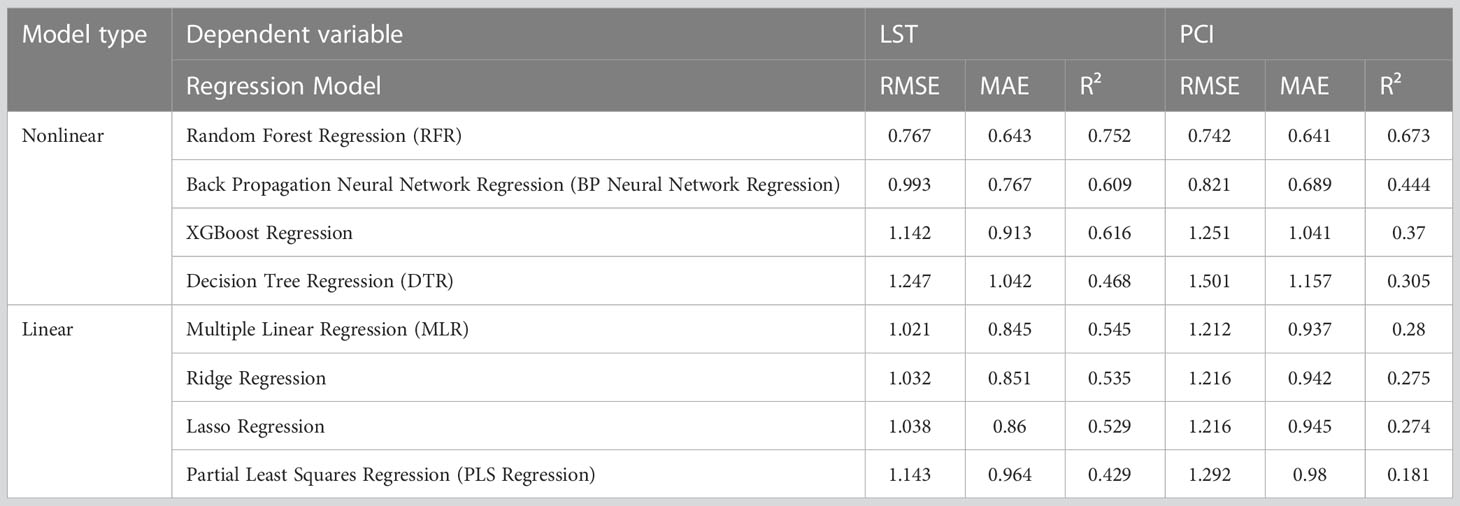
Table 3 Comparison of various regression models.
The nonlinear regression models performed better overall. Among the nonlinear regression models, RFR had the best performance with the lowest RMSE and MAE values, and the highest R² value, indicating more accurate prediction and the strongest correlation with the dependent variable. RFR has advantages such as its capacity to handle high-dimensional data and identify the most important features, model complex nonlinear relationships, and its strong resistance to overfitting (Al-Aghbary et al., 2022; Qi et al., 2022). BP Neural Network Regression and XGBoost Regression also performed well, possibly because these models can automatically learn high-order relationships between features, making them for suitable for complex nonlinear problems. In contrast, linear regression models such as MLR, Ridge Regression, Lasso Regression, and PLS Regression performed relatively poorly, possibly because they did not consider the interactions between features or effectively screen or reduce these features.
The three most important variables that influenced urban LST were BSP, FVC, and BSA. Blue space had a greater impact on LST than green space. Our findings are in line with previous research using correlations (Xue et al., 2019), RF models (Wang et al., 2022b), and logit fitting models (Feng and Shi, 2012), all confirming that the proportion and area of water bodies affect park LST markedly more than green spaces. Water has a greater heat capacity than impermeable surfaces, lowering temperatures in summer and elevating the intensity of UCIs (Wang et al., 2019b; Yang et al., 2020; Zhou et al., 2022).
In urban parks, green spaces are often larger in area than blue spaces. Thus, FVC in green spaces also plays an important role in influencing the UCI effect (Wiens et al., 1993; Algretawee, 2022). Transpiration is the main mechanism underlying the surface cooling effect of urban vegetation (Wang et al., 2019a; Al-Saadi et al., 2020). Several prior studies have demonstrated the impact of vegetation cover specifically. Wang et al. (2020) used ordinary least squares linear regression and determined that the percentage of trees accounted for 40.3% of the mean LST variation. Additionally, vegetation cooling efficiency was found to be highly correlated with FVC (Yang et al., 2022b).
Notably, the spatial resolution of remote sensing images may affect green area estimation. Green area pixels may contain a small number of other land types, resulting in a mixed signal when analyzing remote sensing images. As a result, when considering green areas, the influence of FVC on the UCI effect is greater than the influence of other variables, such as GSA.
The three most important variables that determine PCI were BGSW, FVC, and PD. Parks with narrower BGSW tended to have a longer border with the adjacent urban environment, allowing for more exchange of cold air. This effect then decreases the temperature difference between cold islands and the surrounding region, reflecting a lower PCI.
Similarly, the role of PD in determining PCI can be attributed to landscape fragmentation. As PD increases, landscape fragmentation increases, resulting in a more complex patch shape that limits local ecological circulation and airflow exchange (Luck and Wu, 2002). However, energy flow is accelerated between the park and its surrounding thermal environment, thus decreasing the temperature difference and PCI.
The effect of FVC on PCI is based on a different mechanism. Green space generates a local microclimate of heat-energy exchange with air through photosynthesis and transpiration (Lu et al., 2012). Moreover, the tree canopy emits long-wave cold radiation to the surrounding environment, lowering the temperature of adjacent areas, which increases the temperature difference and PCI (Berry et al., 2013). A dense tree canopy would also impair airflow exchange between the park microclimate and the surrounding environment, further intensifying PCI.
Existing linear regression models are limited in their capacity to accurately depict the complexity of the UCI effect and account for correlations between influencing variables. Multiple studies using linear regression models have identified multicollinearity when investigating UCI. For example, a previous study reported correlation coefficients ranging from 0.105 to 0.214 (Cai et al., 2018). Partial correlation analyses (Peng et al., 2021) and Pearson’s coefficients (Peng et al., 2016) yielded a maximum correlation of 0.6. In the present study, our RF algorithm obtained an R2 value of 0.85, indicating that multiple variables jointly regulate the cooling effect of blue-green spaces. Multicollinearity constraints thus hamper the accuracy of linear models (Logan et al., 2020; Lu et al., 2021).
Fortunately, the RFR model eliminates variable autocorrelation. Our RF-based analysis revealed that the effects of individual variables on LST and PCI were not linearly correlated. Instead, the effects changed or ceased to be important after a critical threshold. Before this threshold, variables had a direct relationship with the UCI effect. Similarly, previous research on park parcels and the UCI effect showed that beyond a given size threshold, land plots can form a relatively independent internal space, creating a microclimate and maintaining a stable regional ecology and airflow exchange (Geng et al., 2022; Yang et al., 2022a). As a result, their effect becomes nonlinear.
The findings of the present study indicate that urban green-blue spaces effectively regulate surface air temperatures. With an increase in the surface area of these spaces, the marginal cooling effect becomes more pronounced. Therefore, an increasing global population will further exacerbate the strain on urban land resources that are needed to provide housing and ecosystem services. In future blue-green space management in cities, the threshold values we identified could be used to determine the shape and size of green-blue spaces that would optimize their UCI effect; specific factors to consider are maintaining a certain scale and ratio of blue space, increasing FVC, and forming regularly shaped plots.
In the context of escalating urbanization and climate change, our study of the spatial characteristics of urban thermal environments offers crucial insights. By investigating the nonlinear relationships between the UCI effect and its causal variables, we identified key factors that influence the cooling effects of blue-green spaces in urban areas.
Our study suggests that the distribution of UCIs follows urban developmental paths influenced by urban planning, and is closely related to the distribution of urban blue-green spaces. Central downtown areas have a pronounced heat island effect due to the prioritization of buildings over public blue-green spaces. To create a balanced urban thermal environment, cities must prioritize a more comprehensive approach to blue and green infrastructure development.
Our study identified several key factors that determine the cooling effects of blue-green spaces in urban areas, including BGSA, BSA, GSA, BSP, and GSP, which determine how effectively these spaces can mitigate the urban heat island effect. The nonlinear relationships between these variables highlight the importance of maintaining an optimal spatial area and appropriate proportions of blue-green spaces to maximize their cooling effects and improve the urban thermal environment. We should also avoid excessive fragmentation and simplification of blue-green spaces to maintain their integrity and connectivity. Urban planning should consider these nonlinear relationships when designing urban blue-green spaces on limited urban land. We can apply these strategies when constructing and renewing urban blue-green spaces to create cooler urban areas and mitigate the impacts of climate change. Our study provides data that may inform more optimized use of blue-green spaces in urban development.
In conclusion, our study provides valuable insights into the efficient use of blue-green spaces in urban construction and renewal to mitigate the urban heat island effect and improve urban thermal environments. By optimizing blue-green space variables such as area, proportion, and vegetation cover, urban planners can effectively create cool urban areas and reduce the negative impacts of climate change. By incorporating our insights into urban planning and promoting the development of sustainable green infrastructure, cities worldwide can mitigate the urban heat island effect to improve quality of life for their urban inhabitants.
The original contributions presented in the study are included in the article/supplementary material. Further inquiries can be directed to the corresponding author.
Conceptualization, SQ; Data curation, SQ; Formal analysis, SQ; Funding acquisition, MJL and TL; Investigation, MHL and HL; Methodology, SQ; Project administration, TL; Resources, YC; Supervision, MJL, TL and YC; Validation, SQ; Visualization, SQ; Writing – original draft, SQ; Writing – review & editing, TL. All authors have read and agreed to the published version of the manuscript.
This research was funded by the National Major Project of High-Resolution Earth Observation System (Grant Number 80-Y50G19-9001-22/23), the National Key Research and Development Program (2021YFE0106700), and by Natural Science Foundation of Henan (212300410126). The funders had no role in the design of the study; in the collection, analyses, or interpretation of data; in the writing of the manuscript; or in the decision to publish the results.
We are grateful to the editor and reviewers for their valuable comments and suggestions.
The authors declare that the research was conducted in the absence of any commercial or financial relationships that could be construed as a potential conflict of interest.
All claims expressed in this article are solely those of the authors and do not necessarily represent those of their affiliated organizations, or those of the publisher, the editors and the reviewers. Any product that may be evaluated in this article, or claim that may be made by its manufacturer, is not guaranteed or endorsed by the publisher.
Adiguzel F., Bozdogan Sert E., Dinc Y., Cetin M., Gungor S., Yuka P., et al. (2022). Determining the relationships between climatic elements and thermal comfort and tourism activities using the tourism climate index for urban planning: a case study of Izmir Province. Theor. Appl. Climatol 147, 1105–1120. doi: 10.1007/s00704-021-03874-9
Adigüzel A. D., Çeti̇n İ.Z. (2022). Urbanization models suitable for thermal-bioclimatic comfort levels. KUJES 8, 78–89. doi: 10.55385/kastamonujes.1114057
Al-Aghbary M., Sobh M., Gerhards C. (2022). A geothermal heat flow model of Africa based on random forest regression. Front. Earth Sci. 10. doi: 10.3389/feart.2022.981899
Alavipanah S., Wegmann M., Qureshi S., Weng Q., Koellner T. (2015). The role of vegetation in mitigating urban land surface temperatures: a case study of munich, Germany during the warm season. Sustainability 7, 4689–4706. doi: 10.3390/su7044689
Algretawee H. (2022). The effect of graduated urban park size on park cooling island and distance relative to land surface temperature (LST). Urban Clim 45, 101255. doi: 10.1016/j.uclim.2022.101255
Al-Saadi L. M., Jaber S. H., Al-Jiboori M. H. (2020). Variation of urban vegetation cover and its impact on minimum and maximum heat islands. Urban Clim 34, 100707. doi: 10.gq9nr9
Belgiu M., Drăguţ L. (2016). Random forest in remote sensing: A review of applications and future directions. ISPRS J. Photogramm. Remote Sens. 114, 24–31. doi: 10.1016/j.isprsjprs.2016.01.011
Berry R., Livesley S. J., Aye L. (2013). Tree canopy shade impacts on solar irradiance received by building walls and their surface temperature. Build Environ. 69, 91–100. doi: 10.1016/j.buildenv.2013.07.009
Bozdogan Sert E., Kaya E., Adiguzel F., Cetin M., Gungor S., Zeren Cetin I., et al. (2021). Effect of the surface temperature of surface materials on thermal comfort: a case study of Iskenderun (Hatay, Turkey). Theor. Appl. Climatol 144, 103–113. doi: 10.1007/s00704-021-03524-0
Cai Z., Han G., Chen M. (2018). Do water bodies play an important role in the relationship between urban form and land surface temperature? Sustain. Cities Soc 39, 487–498. doi: 10.1016/j.scs.2018.02.033
Cao X., Onishi A., Chen J., Imura H. (2010). Quantifying the cool island intensity of urban parks using ASTER and IKONOS data. Landsc Urban Plan 96, 224–231. doi: 10.1016/j.landurbplan.2010.03.008
Cetin M. (2020). Climate comfort depending on different altitudes and land use in the urban areas in Kahramanmaras City. Air Qual Atmos Health 13, 991–999. doi: 10.1007/s11869-020-00858-y
Çevik Değerli B., Çetin M. (2022). Using the remote sensing method to simulate the land change in the year 2030. TURJAF 10, 2453–2466. doi: 10.24925/turjaf.v10i12.2453-2466.5555
Chang S., Zhao J., Jia M., Mao D., Wang Z., Hou B. (2023). Land use change and hotspot identification in harbin–changchun urban agglomeration in China from 1990 to 2020. ISPRS Int. J. Geoinf 12, 80. doi: 10.3390/ijgi12020080
Cheng X., Wei B., Chen G., Li J., Song C. (2015). Influence of park size and its surrounding urban landscape patterns on the park cooling effect. J. Urban Plan Dev. 141, A4014002. doi: 10.1061/(ASCE)UP.1943-5444.0000256
Chibuike E. M., Ibukun A. O., Abbas A., Kunda J. J. (2018). Assessment of green parks cooling effect on Abuja urban microclimate using geospatial techniques. RSASE 11, 11–21. doi: 10.1016/j.rsase.2018.04.006
Fan K., Dhammapala R., Harrington K., Lamb B., Lee Y. (2023). Machine learning-based ozone and PM2.5 forecasting: Application to multiple AQS sites in the Pacific Northwest. Front. Big Data 6. doi: 10.3389/fdata.2023.1124148
Fan H., Yu Z., Yang G., Liu T. Y., Liu T. Y., Hung C. H., et al. (2019). How to cool hot-humid (Asian) cities with urban trees? An optimal landscape size perspective. Agric. For Meteorol 265, 338–348. doi: 10.1016/j.agrformet.2018.11.027
Feng X., Shi H. (2012). Research on the cooling effect of Xi’an parks in summer based on remote sensing. Sheng Tai Xue Bao 32, 7355–7363. doi: 10.5846/stxb201112261976
Gallopín G. C. (2020). Cities, sustainability, and complex dissipative systems. A perspective. Front. Sustain. Cities 2. doi: 10.3389/frsc.2020.523491
Gao Z., Zaitchik B. F., Hou Y., Chen W. (2022). Toward park design optimization to mitigate the urban heat Island: Assessment of the cooling effect in five U.S. cities. Sustain. Cities Soc 81, 103870. doi: 10.1016/j.scs.2022.103870
Geng X., Yu Z., Zhang D., Li C., Yuan Y., Wang X. (2022). The influence of local background climate on the dominant factors and threshold-size of the cooling effect of urban parks. Sci. Total Environ. 823, 153806. doi: 10.1016/j.scitotenv.2022.153806
Guha S., Govil H. (2021). A long-term monthly analytical study on the relationship of LST with norMalized difference spectral indices. Eur. J. Remote. Sens 54, 487–512. doi: 10.1080/22797254.2021.1965496
Gunawardena K. R., Wells M. J., Kershaw T. (2017). Utilising green and bluespace to mitigate urban heat island intensity. Sci. Total Environ. 584–585, 1040–1055. doi: 10.1016/j.scitotenv.2017.01.158
Hatami Bahman Beiglou P., Luo L., Tan P.-N., Pei L. (2021). Automated analysis of the US drought monitor maps with machine learning and multiple drought indicators. Front. Big Data 4. doi: 10.3389/fdata.2021.750536
He W., Meng H., Han J., Zhou G., Zheng H., Zhang S. (2022). Spatiotemporal PM2.5 estimations in China from 2015 to 2020 using an improved gradient boosting decision tree. Chemosphere 296, 134003. doi: 10.1016/j.chemosphere.2022.134003
Huanchun H., Hailin Y., Xin D., Cui H., Zhifeng L., Wei L., et al. (2020). Analyzing the influencing factors of urban thermal field intensity using big-data-based GIS. Sustain. Cities Soc 55, 102024. doi: 10.1016/j.scs.2020.102024
Jaganmohan M., Knapp S., Buchmann C. M., Schwarz N. (2016). The bigger, the better? The influence of urban green space design on cooling effects for residential areas. J. Environ. Qual 45, 134–145. doi: 10.2134/jeq2015.01.0062
Kong F., Yin H., James P., Hutyra L. R., He H. S. (2014a). Effects of spatial pattern of greenspace on urban cooling in a large metropolitan area of eastern China. Landsc Urban Plan 128, 35–47. doi: 10.1016/j.landurbplan.2014.04.018
Kong F., Yin H., Wang C., Cavan G., James P. (2014b). A satellite image-based analysis of factors contributing to the green-space cool island intensity on a city scale. Urban For Urban Green 13, 846–853. doi: 10.1016/j.ufug.2014.09.009
Kraemer R., Kabisch N. (2022). Parks under stress: air temperature regulation of urban green spaces under conditions of drought and summer heat. Front. Environ. Sci. 10. doi: 10.3389/fenvs.2022.849965
Kwak Y., Park C., Deal B. (2020). Discerning the success of sustainable planning: A comparative analysis of urban heat island dynamics in Korean new towns. Sustain. Cities Soc 61, 102341. doi: 10.1016/j.scs.2020.102341
Lach J., Wiecha S., Śliż D., Price S., Zaborski M., Cieśliński I., et al. (2021). HR max prediction based on age, body composition, fitness level, testing modality and sex in physically active population. Front. Physiol. 12. doi: 10.3389/fphys.2021.695950
Lan X., Li W., Tang J., Shakoor A., Zhao F., Fan J. (2022). Spatiotemporal variation of climate of different flanks and elevations of the Qinling–Daba mountains in China during 1969–2018. Sci. Rep. 12. doi: 10.1038/s41598-022-10819-3
Lemoine-Rodríguez R., Inostroza L., Zepp H. (2022). Does urban climate follow urban form? Analysing intraurban lst trajectories versus urban form trends in 3 cities with different background climates. Sci. Total Environ. 830, 154570. doi: 10.1016/j.scitotenv.2022.154570
Li C., Lu L., Fu Z., Sun R., Pan L., Han L., et al. (2022). Diverse cooling effects of green space on urban heat island in tropical megacities. Front. Environ. Sci. 10. doi: 10.3389/fenvs.2022.1073914
Li L., Yu T., Zhao L., Zhan Y., Zheng F., Zhang Y., et al. (2019). Characteristics and trend analysis of the relationship between land surface temperature and nighttime light intensity levels over China. Infrared Phys. Technol. 97, 381–390. doi: 10.1016/j.infrared.2019.01.018
Liang Z., Wang Y., Huang J., Wei F., Wu S., Shen J., et al. (2020). Seasonal and diurnal variations in the relationships between urban form and the urban heat island effect. Energies 13. doi: 10.3390/en13225909
Lin S., Wu Y., Fang Y. (2022). Comparison of regression and machine learning methods in depression forecasting among home-based elderly Chinese: A community based study. Front. Psychiatry 12. doi: 10.3389/fpsyt.2021.764806
Liu S., Shi K., Wu Y., Cui Y. (2023). Suburban greening and suburbanization changing surface urban heat island intensity in China. Build Environ. 228, 109906. doi: 10.1016/j.buildenv.2022.109906
Liu Y., Xu X., Wang F., Qiao Z., An H., Han D., et al. (2022). Exploring the cooling effect of urban parks based on the ECOSTRESS land surface temperature. Front. Ecol. Evol. 10. doi: 10.3389/fevo.2022.1031517
Liu Y., Xu Y., Weng F., Zhang F., Shu W. (2021). Impacts of urban spatial layout and scale on local climate: A case study in Beijing. Sustain. Cities Soc 68, 102767. doi: 10.1016/j.scs.2021.102767
Logan T. M., Zaitchik B., Guikema S., Nisbet A. (2020). Night and day: The influence and relative importance of urban characteristics on remotely sensed land surface temperature. Remote Sens Environ. 247, 111861. doi: 10.1016/j.rse.2020.111861
Lu J., Li C., Yang Y., Zhang X., Jin M. (2012). Quantitative evaluation of urban park cool island factors in mountain city. J. Cent. South Univ. Technol. 19, 1657–1662. doi: 10.1007/s11771-012-1189-9
Lu Y., Yue W., Liu Y., Huang Y. (2021). Investigating the spatiotemporal non-stationary relationships between urban spatial form and land surface temperature: A case study of Wuhan, China. Sustain. Cities Soc 72, 103070. doi: 10.1016/j.scs.2021.103070
Luck M., Wu J. (2002). A gradient analysis of urban landscape pattern: a case study from the Phoenix metropolitan region, Arizona, USA. Landsc Ecol. 17, 327–339. doi: 10.1023/A:1020512723753
Mishra U., Gautam S., Riley W. J., Hoffman F. M. (2020). Ensemble machine learning approach improves predicted spatial variation of surface soil organic carbon stocks in data-limited northern circumpolar region. Front. Big Data 3. doi: 10.3389/fdata.2020.528441
Mohammad A. S., Pradhan M. R. (2021). Machine learning with big data analytics for cloud security. Comput. Electr. Eng. 96, 107527. doi: 10.1016/j.compeleceng.2021.107527
Oukawa G. Y., Krecl P., Targino A. C. (2022). Fine-scale modeling of the urban heat island: A comparison of multiple linear regression and random forest approaches. Sci. Total Environ. 815, 152836. doi: 10.1016/j.scitotenv.2021.152836
Padovan D., Cristiano S., Gonella F. (2022). Strategies of socio-ecological transition for a sustainable urban metabolism. Front. Sustain. Cities 4. doi: 10.3389/frsc.2022.875912
Peng J., Dan Y., Qiao R., Liu Y., Dong J., Wu J. (2021). How to quantify the cooling effect of urban parks? Linking maximum and accumulation perspectives. Remote Sens Environ. 252, 112135. doi: 10.1016/j.rse.2020.112135
Peng J., Xie P., Liu Y., Ma J. (2016). Urban thermal environment dynamics and associated landscape pattern factors: A case study in the Beijing metropolitan region. Remote Sens Environ. 173, 145–155. doi: 10.1016/j.rse.2015.11.027
Qi J., Ding L., Lim S. (2023). Application of a decision-making framework for multi-objective optimisation of urban heat mitigation strategies. Urban Clim 47, 101372. doi: 10.1016/j.uclim.2022.101372
Qi J., Lei J., Li N., Huang D., Liu H., Zhou K., et al. (2022). Machine learning models to predict in-hospital mortality in septic patients with diabetes. Front. Endocrinol. 13. doi: 10.3389/fendo.2022.1034251
Ren T., Zhou W., Wang J. (2021). Beyond intensity of urban heat island effect: A continental scale analysis on land surface temperature in major Chinese cities. Sci. Total Environ. 791, 148334. doi: 10.1016/j.scitotenv.2021.148334
Saha S., Saha A., Das M., Saha A., Sarkar R., Das A. (2021). Analyzing spatial relationship between land use/land cover (LULC) and land surface temperature (LST) of three urban agglomerations (UAs) of Eastern India. RSASE 22, 100507. doi: 10.1016/j.rsase.2021.100507
Santamouris M., Synnefa A., Karlessi T. (2011). Using advanced cool materials in the urban built environment to mitigate heat islands and improve thermal comfort conditions. Sol Energy 85, 3085–3102. doi: 10.1016/j.solener.2010.12.023
Sharma A., Kumar R., Varadwaj P. K., Ahmad A., Ashraf G. M. (2011). A comparative study of support vector machine, artificial neural network and Bayesian classifier for mutagenicity prediction. Interdiscip Sci. Comput. Life Sci. 3, 232. doi: 10.1007/s12539-011-0102-9
Sun R., Chen L. (2017). Effects of green space dynamics on urban heat islands: Mitigation and diversification. Ecosyst. Serv. 23, 38–46. doi: 10.1016/j.ecoser.2016.11.011
Sun R., Chen A., Chen L., Lü Y. (2012). Cooling effects of wetlands in an urban region: The case of Beijing. Ecol. Indic 20, 57–64. doi: 10.1016/j.ecolind.2012.02.006
Ullah W., Ahmad K., Ullah S., Tahir A. A., Javed M. F., Nazir A., et al. (2023). Analysis of the relationship among land surface temperature (LST), land use land cover (LULC), and norMalized difference vegetation index (NDVI) with topographic elements in the lower Himalayan region. Heliyon 9, e13322. doi: 10.1016/j.heliyon.2023.e13322
Wang M., Mao D., Wang Y., Song K., Yan H., Jia M., et al. (2022a). Annual wetland mapping in metropolis by temporal sample migration and random forest classification with time series landsat data and google earth engine. Remote Sens. 14. doi: 10.3390/rs14133191
Wang J., Tian G., Tao Y., Lu C. (2023). Prediction of Chongqing’s grain output based on support vector machine. Front. Sustain. Food Syst. 7. doi: 10.3389/fsufs.2023.1015016
Wang C., Wang Z.-H., Wang C., Myint S. W. (2019a). Environmental cooling provided by urban trees under extreme heat and cold waves in U.S. cities. Remote Sens Environ. 227, 28–43. doi: 10.1016/j.rse.2019.03.024
Wang C., Wang Z.-H., Yang J. (2019b). Urban water capacity: Irrigation for heat mitigation. Comput. Environ. Urban Syst. 78, 101397. doi: 10.1016/j.compenvurbsys.2019.101397
Wang Q., Wang X., Zhou Y., Liu D., Wang H. (2022b). The dominant factors and influence of urban characteristics on land surface temperature using random forest algorithm. Sustain. Cities Soc 79, 103722. doi: 10.1016/j.scs.2022.103722
Wang J., Zhou W., Jiao M., Zheng Z., Ren T., Zhang Q. (2020). Significant effects of ecological context on urban trees’ cooling efficiency. ISPRS J. Photogramm. Remote Sens. 159, 78–89. doi: 10.1016/j.isprsjprs.2019.11.001
Wiens J., Stenseth N. C., VANHORNE B., Ims R. (1993). Ecological mechanisms and landscape ecology. OIKOS 66, 369–380. doi: 10.2307/3544931
Wu P., Zhong K., Wang L., Xu J., Liang Y., Hu H., et al. (2022). Influence of underlying surface change caused by urban renewal on land surface temperatures in Central Guangzhou. Build Environ. 215, 108985. doi: 10.1016/j.buildenv.2022.108985
Xi M., Zhang W., Li W., Liu H., Zheng H. (2023). Distinguishing dominant drivers on LST dynamics in the qinling-daba mountains in central China from 2000 to 2020. Remote Sens. 15, 878. doi: 10.3390/rs15040878
Xiang H., Xi Y., Mao D., Mahdianpari M., Zhang J., Wang M., et al. (2023). Mapping potential wetlands by a new framework method using random forest algorithm and big Earth data: A case study in China’s Yangtze River Basin. Glob. Ecol. Conserv. 42, e02397. doi: 10.1016/j.gecco.2023.e02397
Xiao H. H., Yang W. K., Hu J., Zhang Y. P., Jing L. J., Chen Z. Y. (2022a). Significance and methodology: Preprocessing the big data for machine learning on TBM performance. Sustain. Cities Soc 7, 680–701. doi: 10.1016/j.undsp.2021.12.003
Xiao L., Zhong M., Zha D. (2022b). Runoff forecasting using machine-learning methods: case study in the middle reaches of Xijiang river. Front. Big Data 4. doi: 10.3389/fdata.2021.752406
Xue X., He T., Xu L., Tong C., Ye Y., Liu H., et al. (2022). Quantifying the spatial pattern of urban heat islands and the associated cooling effect of blue–green landscapes using multisource remote sensing data. Sci. Total Environ. 843, 156829. doi: 10.1016/j.scitotenv.2022.156829
Xue Z., Hou G., Zhang Z., Lyu X., Jiang M., Zou Y., et al. (2019). Quantifying the cooling-effects of urban and peri-urban wetlands using remote sensing data: Case study of cities of Northeast China. Landsc Urban Plan 182, 92–100. doi: 10.1016/j.landurbplan.2018.10.015
Yang J., Guo R., Li D., Wang X., Li F. (2022a). Interval-thresholding effect of cooling and recreational services of urban parks in metropolises. Sustain. Cities Soc 79, 103684. doi: 10.1016/j.scs.2022.103684
Yang J., Shi Q., Menenti M., Xie Y., Wu Z., Xu Y., et al. (2022b). Characterizing the thermal effects of vegetation on urban surface temperature. Urban Clim 44, 101204. doi: 10.1016/j.uclim.2022.101204
Yang G., Yu Z., Jørgensen G., Vejre H. (2020). How can urban blue-green space be planned for climate adaption in high-latitude cities? A seasonal perspective. Sustain. Cities Soc 53, 101932. doi: 10.1016/j.scs.2019.101932
Yu Z., Ma W., Hu S., Yao X., Yang G., Yu Z., et al. (2023). A simple but actionable metric for assessing inequity in resident greenspace exposure. Ecol. Indic. 153, 110423. doi: 10.1016/j.ecolind.2023.110423
Yu Z., Yang G., Zuo S., Jørgensen G., Koga M., Vejre H. (2020). Critical review on the cooling effect of urban blue-green space: A threshold-size perspective. Urban Forestry Urban Greening 49, 126630. doi: 10.1016/j.ufug.2020.126630
Yu Z., Yao Y., Yang G., Wang X., Vejre H. (2019a). Spatiotemporal patterns and characteristics of remotely sensed region heat islands during the rapid urbanizatio-2015) of Southern China. Sci. Total Environ. 674, 242–254. doi: 10.1016/j.scitotenv.2019.04.088
Yu Z., Yao Y., Yang G., Wang X., Vejre H. (2019b). Strong contribution of rapid urbanization and urban agglomeration development to regional thermal environment dynamics and evolution. For. Ecol. Manage. 446, 214–225. doi: 10.1016/j.foreco.2019.05.046
Yu Z., Zhang J., Yang G. (2021). How to build a heat network to alleviate surface heat island effect? Sustain. Cities Soc 74, 103135. doi: 10.1016/j.scs.2021.103135
Yumino S., Uchida T., Sasaki K., Kobayashi H., Mochida A. (2015). Total assessment for various environmentally conscious techniques from three perspectives: Mitigation of global warming, mitigation of UHIs, and adaptation to urban warming. Sustain. Cities Soc 19, 236–249. doi: 10.1016/j.scs.2015.05.010
Zeren Cetin I., Varol T., Ozel H. B. (2023a). A geographic information systems and remote sensing-based approach to assess urban micro-climate change and its impact on human health in Bartin, Turkey. Environ. Monit Assess. 195, 540. doi: 10.1007/s10661-023-11105-z
Zeren Cetin I., Varol T., Ozel H. B., Sevik H. (2023b). The effects of climate on land use/cover: a case study in Turkey by using remote sensing data. Environ. Sci. pollut. Res. 30, 5688–5699. doi: 10.1007/s11356-022-22566-z
Zhao F., Lan X., Li W., Zhu W., Li T. (2021). Influence of land use change on the surface albedo and climate change in the qinling-daba mountains. Sustainability 13, 10153. doi: 10.3390/su131810153
Zhou X., Zhang S., Liu Y., Zhou Q., Wu B., Gao Y., et al. (2022). Impact of urban morphology on the microclimatic regulation of water bodies on waterfront in summer: A case study of Wuhan. Build Environ. 226, 109720. doi: 10.gq9mq8
Keywords: climate change, land surface temperature, nonlinear relationships, random forest regression, urban cold island effect, Zhengzhou City
Citation: Quan S, Li M, Li T, Liu H, Cui Y and Liu M (2023) Nonlinear effects of blue-green space variables on urban cold islands in Zhengzhou analyzed with random forest regression. Front. Ecol. Evol. 11:1185249. doi: 10.3389/fevo.2023.1185249
Received: 13 March 2023; Accepted: 21 July 2023;
Published: 11 August 2023.
Edited by:
Zhaowu Yu, Fudan University, ChinaReviewed by:
Mingming Jia, Chinese Academy of Sciences, ChinaCopyright © 2023 Quan, Li, Li, Liu, Cui and Liu. This is an open-access article distributed under the terms of the Creative Commons Attribution License (CC BY). The use, distribution or reproduction in other forums is permitted, provided the original author(s) and the copyright owner(s) are credited and that the original publication in this journal is cited, in accordance with accepted academic practice. No use, distribution or reproduction is permitted which does not comply with these terms.
*Correspondence: Tianqi Li, dGlhbnFpX2xpQGhlbnUuZWR1LmNu
†These authors share first authorship
Disclaimer: All claims expressed in this article are solely those of the authors and do not necessarily represent those of their affiliated organizations, or those of the publisher, the editors and the reviewers. Any product that may be evaluated in this article or claim that may be made by its manufacturer is not guaranteed or endorsed by the publisher.
Research integrity at Frontiers
Learn more about the work of our research integrity team to safeguard the quality of each article we publish.