 Xiaomeng Cheng
 Yaping Zhang1†
 Wenbin Nie
94% of researchers rate our articles as excellent or good
Learn more about the work of our research integrity team to safeguard the quality of each article we publish.
Find out more
ORIGINAL RESEARCH article
Front. Ecol. Evol., 11 May 2023
Sec. Environmental Informatics and Remote Sensing
Volume 11 - 2023 | https://doi.org/10.3389/fevo.2023.1184273
This article is part of the Research TopicAdvances in GIS and Remote Sensing the Landscape Pattern of Land Cover on Urban Climate and Urban EcologyView all 11 articles
Landscape ecological risk reflects the impact of human activities or natural hazards on landscape patterns, functions, and processes in a region. The scientific assessment of its evolutionary trends can play an essential role in maintaining and improving regional human wellbeing. This study focused on the Fuchunjiang River Basin in the suburbs of Hangzhou, a large city in China with a high degree of landscape heterogeneity and rapid economic growth. Based on land use data from 1990 to 2020, an ecological risk assessment model and geodetector tools were combined to study the spatiotemporal variation characteristics and influencing factors of landscape ecological risk in the basin. The results showed the following: (1) from 1990 to 2020, the landscape pattern of various land use types showed a general trend of an increasing degree of agglomeration and decreasing loss index; (2) the spatial distribution pattern of landscape ecological risk was “high in the northwest and low in the southeast.” From basin to township scales, landscape ecological risk showed a decreasing trend on long time scales, although the changes were relatively drastic in short time periods; (3) GDP, human interference, area of urban and rural residential land, area of arable land transferred in, and area of arable land transferred out were the dominant influencing factors of landscape ecological risk; (4) the coupling between landscape ecological risk and GDP in 2020 exhibited an inverted “U” shaped relationship, indicating that the environmental Kuznets curve (EKC) may have the same applicability in the ecological risk management; (5) according to the main functions of different risk agglomerations, targeted ecological risk management strategies were proposed. In short, this study carried out the landscape ecological risk assessment at the township scale for the first time, quantitatively analyzed the relationship between economic development and ecological risk, and proposed targeted risk prevention strategies, which are instructive for other basin areas that are experiencing rapid urbanization in the world.
Landscape sustainability is an integrated representation of the capacity of ecosystems to provide services and goods that are critical to maintaining and improving human wellbeing on a global scale (Riggs et al., 2021; Wu, 2022). In the past decades, the dramatic increase in human disturbance has posed various threats to natural ecosystems, such as habitat fragmentation, biodiversity loss, disruption of energy and material flow, and reduction of service provisioning capacity, which hinder the development of landscape sustainability globally (Baffoe and Matsuda, 2018; Bhattachan et al., 2018; Bryan et al., 2018; Frazier et al., 2019; Cui H. et al., 2022). For this, many efforts have been made in many countries worldwide. For example, Europe proposed the “European Landscape Convention” as early as 2000 to promote the conservation, management and planning of landscapes in the form of legislation, and to organize countries to cooperate on landscape issues, thus promoting the development of landscape sustainability and landscape governance (Pătru-Stupariu and Nita, 2022). However, there are still many regions in the world that are undergoing or about to undergo rapid urbanization, and they urgently need to promote economic development transformation through intensive exploitation of land resources (Bamrungkhul and Tanaka, 2022; Benti et al., 2022), which will continuously exacerbate the evolution of landscape patterns and the increase of various ecological risks in the region (Bryan et al., 2018; Xie et al., 2020). It is foreseeable that the conflict between human living space and ecological protection will become more intense. Therefore, it is imperative to select suitable indicators to quantitatively identify the current environment quality in rapidly urbanizing areas and propose targeted control measures.
Ecological risk refers to the potential damage to ecosystem structure and function when an area is subjected to external stress (Wang et al., 2021; Ran et al., 2022). As a vital indicator of characterizing environmental change, ecological risk assessment plays an important role in indicating the sustainable supply capacity, health status and management level of ecosystem services and is widely used in assessing ecosystem security and predicting future benefits (Levine et al., 2019; Nepal et al., 2020; Zhang D. et al., 2022), thus providing a comprehensive characterization of regional landscape sustainability (Xu et al., 2021). The origins of ecological risk assessment can be traced back to the 1970s (Barnthouse et al., 1987; Xie et al., 2021). Traditional ecological risk assessment focused on assessing the potential adverse impacts of microscopic factors, such as chemical contaminants, on the ecosystem and human health in a small geographic area (Diggle, 1995; Landis, 2003; Raitano et al., 2018). With climate change and the expansion of human activities, many regional crises and challenges have arisen (Lal et al., 2021), making the scope of ecological risk sources expand and gradually shifting from a single chemical pollution factor to multiple factors, such as climate, biology, natural disasters, and anthropogenic stresses (Peng et al., 2015), and the traditional risk assessment framework is no longer applicable. Therefore, to reasonably address multi-scale and multi-source compound ecological risks (Hunsaker et al., 1990; Wang et al., 2020), the concept of landscape ecological risk was proposed. It was defined as a comprehensive reflection of the possible adverse effects of human activities or natural disasters on the landscape’s compositions, structures, functions, and processes based on the perspective of landscape patterns (Mo et al., 2017; Jin et al., 2019; Hou et al., 2020; Zhang et al., 2020).
Landscape ecological risk assessment includes two evaluation methods based on risk source-sink and landscape patterns (Jin et al., 2019; Hou et al., 2020). The rapid development of remote sensing technology has led to the widespread application of landscape pattern-based evaluation methods in current research (Hou et al., 2020). With the advantages of multi-scale, high resolution, dynamic monitoring, and wide observation range (Feng et al., 2022), remote sensing data can rapidly and accurately characterize regional landscape patterns, thus revealing the dynamic response of landscape patterns to comprehensive risks (Jin et al., 2019). Thus, this method can achieve comprehensive characterization and spatiotemporal differentiated expression of multisource risks without relying on large amounts of actual measurement data (Peng et al., 2015). Currently, many scholars have used this method to conduct numerous studies on landscape ecological risk at multiple scales, mainly including countries (Zhang X. et al., 2022), urban agglomerations (Li Z. et al., 2020), plateaus (Hou et al., 2020), basins (Lin et al., 2020), lakes (Xie et al., 2021), and other administrative and geographical units. Among them, basins are the most fundamental ecosystem management unit with unique geographic and socioeconomic characteristics (Bai et al., 2016) and are an important object for landscape ecological risk research. Research on landscape ecological risk in basins has mainly focused on urban agglomerations and special terrain areas, such as deserts and plateaus (Xue et al., 2019; Cui B. et al., 2022). Fewer studies have focused on the suburban areas of large cities, which are geographically special; this type of area is characterized by active urbanization, rapid changes in land use structure, and the significant evolution from a suburban agricultural landscape into a combined urban and suburban landscape (Tokarczyk-Dorociak et al., 2018). Also, suburban areas are located within the ecological buffer zone of large cities and have crucial ecological barrier functions. Therefore, it is essential to explore the evolution of landscape ecological risk in the basins of suburban areas of large cities for the development of landscape sustainability.
The Fuchunjiang River Basin is found in Hangzhou City, Zhejiang Province, one of the most developed cities in China, and has experienced rapid economic development since 2000, with a clear decreasing gradient distribution of economic levels within the basin from northeast to southwest. The region covers a wide variety of topographical features, with high landscape heterogeneity and the coexistence of urban and rural landscapes. It exhibits typical suburban regional characteristics, making it an ideal subject of study. After years of industrial development and unsustainable land use, a series of water problems (Kong et al., 2021; Yuan et al., 2023), such as high consumption, low use efficiency, and pollution have emerged in the basin, thus triggering the deterioration of the ecological environment and leading to frequent ecological problems, such as the reduction of biodiversity, shrinkage of wetland areas, and increase of landscape fragmentation, which seriously threaten the ecological security of the Fuchunjiang River Basin. As an essential ecological conservation corridor in the upstream waters of Hangzhou city, the Fuchunjiang River provides ecosystem services such as water cleanup and soil and water conservation for the downstream areas. Therefore, the conflict between urban development and ecological protection is particularly prominent in this area.
In summary, the theoretical framework and research methods of landscape ecological risk assessment have become increasingly mature, and fruitful research results have been achieved for comprehensive regional risk assessment on large-scale areas. Although previous large-scale risk assessments supported the formulation of risk management policies in theory, it was often challenging to apply the theoretical results in practice due to the lack of specific policy operation units. Therefore, this research aims to construct an ecological risk assessment model based on landscape patterns, selects the smallest administrative unit in China’s three-level administrative divisions (townships) as the research unit, and considers the Fuchunjiang River Basin as a case study to implement landscape ecological risk assessment and the influencing factor analysis of the basin in the suburban areas of large cities, with the intention of answering the following three questions: (1) How are the various types of land use in the Fuchunjiang River Basin changing as the economy develops? What is the impact on landscape patterns? (2) Does the comprehensive ecological risk in the Fuchunjiang River Basin increase or decrease over time? What are the characteristics of spatial distribution? (3) What are the dominant influencing factors on landscape ecological risk? How will these factors affect changes in landscape ecological risk? Investigating the above issues can not only be an inspiration for ecological assessment and policy-making in other regions that are experiencing rapid urbanization in the world, but also provide a model case for exploring the quantitative relationship between economic development and ecological conservation in regions that are in the late stage of development.
The Fuchunjiang River is in the Yangtze River Delta of China—Hangzhou city, Zhejiang province, flowing from southwest to northeast through Jiande, Tonglu, Fuyang, Xiaoshan, and other districts and counties. The river section is 110 km long and is the main channel of the Qiantangjiang River (Figure 1). The Fuchunjiang River Basin is located between 29.4°–30.2°N and 119.4°–120.3°E, with a basin area of 4,524 km2; it involves many townships in Hangzhou. The topography of the basin is complex and dominated by mountains and hills, which account for approximately 68% of the total area. The hills and mountains in the southwest are undulating, while the terrain in the northeast is low-lying, forming a general topography surrounded by plains and mountains with the Fuchunjiang River as the axis. The land type is dominated by forest land, which accounts for about 70% of the total area of the study area and is mainly distributed in the southeastern part of the basin with high elevation, followed by arable land and urban and rural residential land, accounting for about 20 and 5% of the total area and distributing along the river. The main climate type is subtropical monsoon climate, with an annual average temperature of approximately 16.5°C and annual total precipitation of approximately 1,550 mm. In 2020, the GDP and total population of the Fuchunjiang River Basin were US$48.88 billion and 1.84 million, respectively. With the increasing economic radiation effect of the Hangzhou Bay Area, the Fuchunjiang River Basin has shown remarkable economic vitality and population clustering effects.
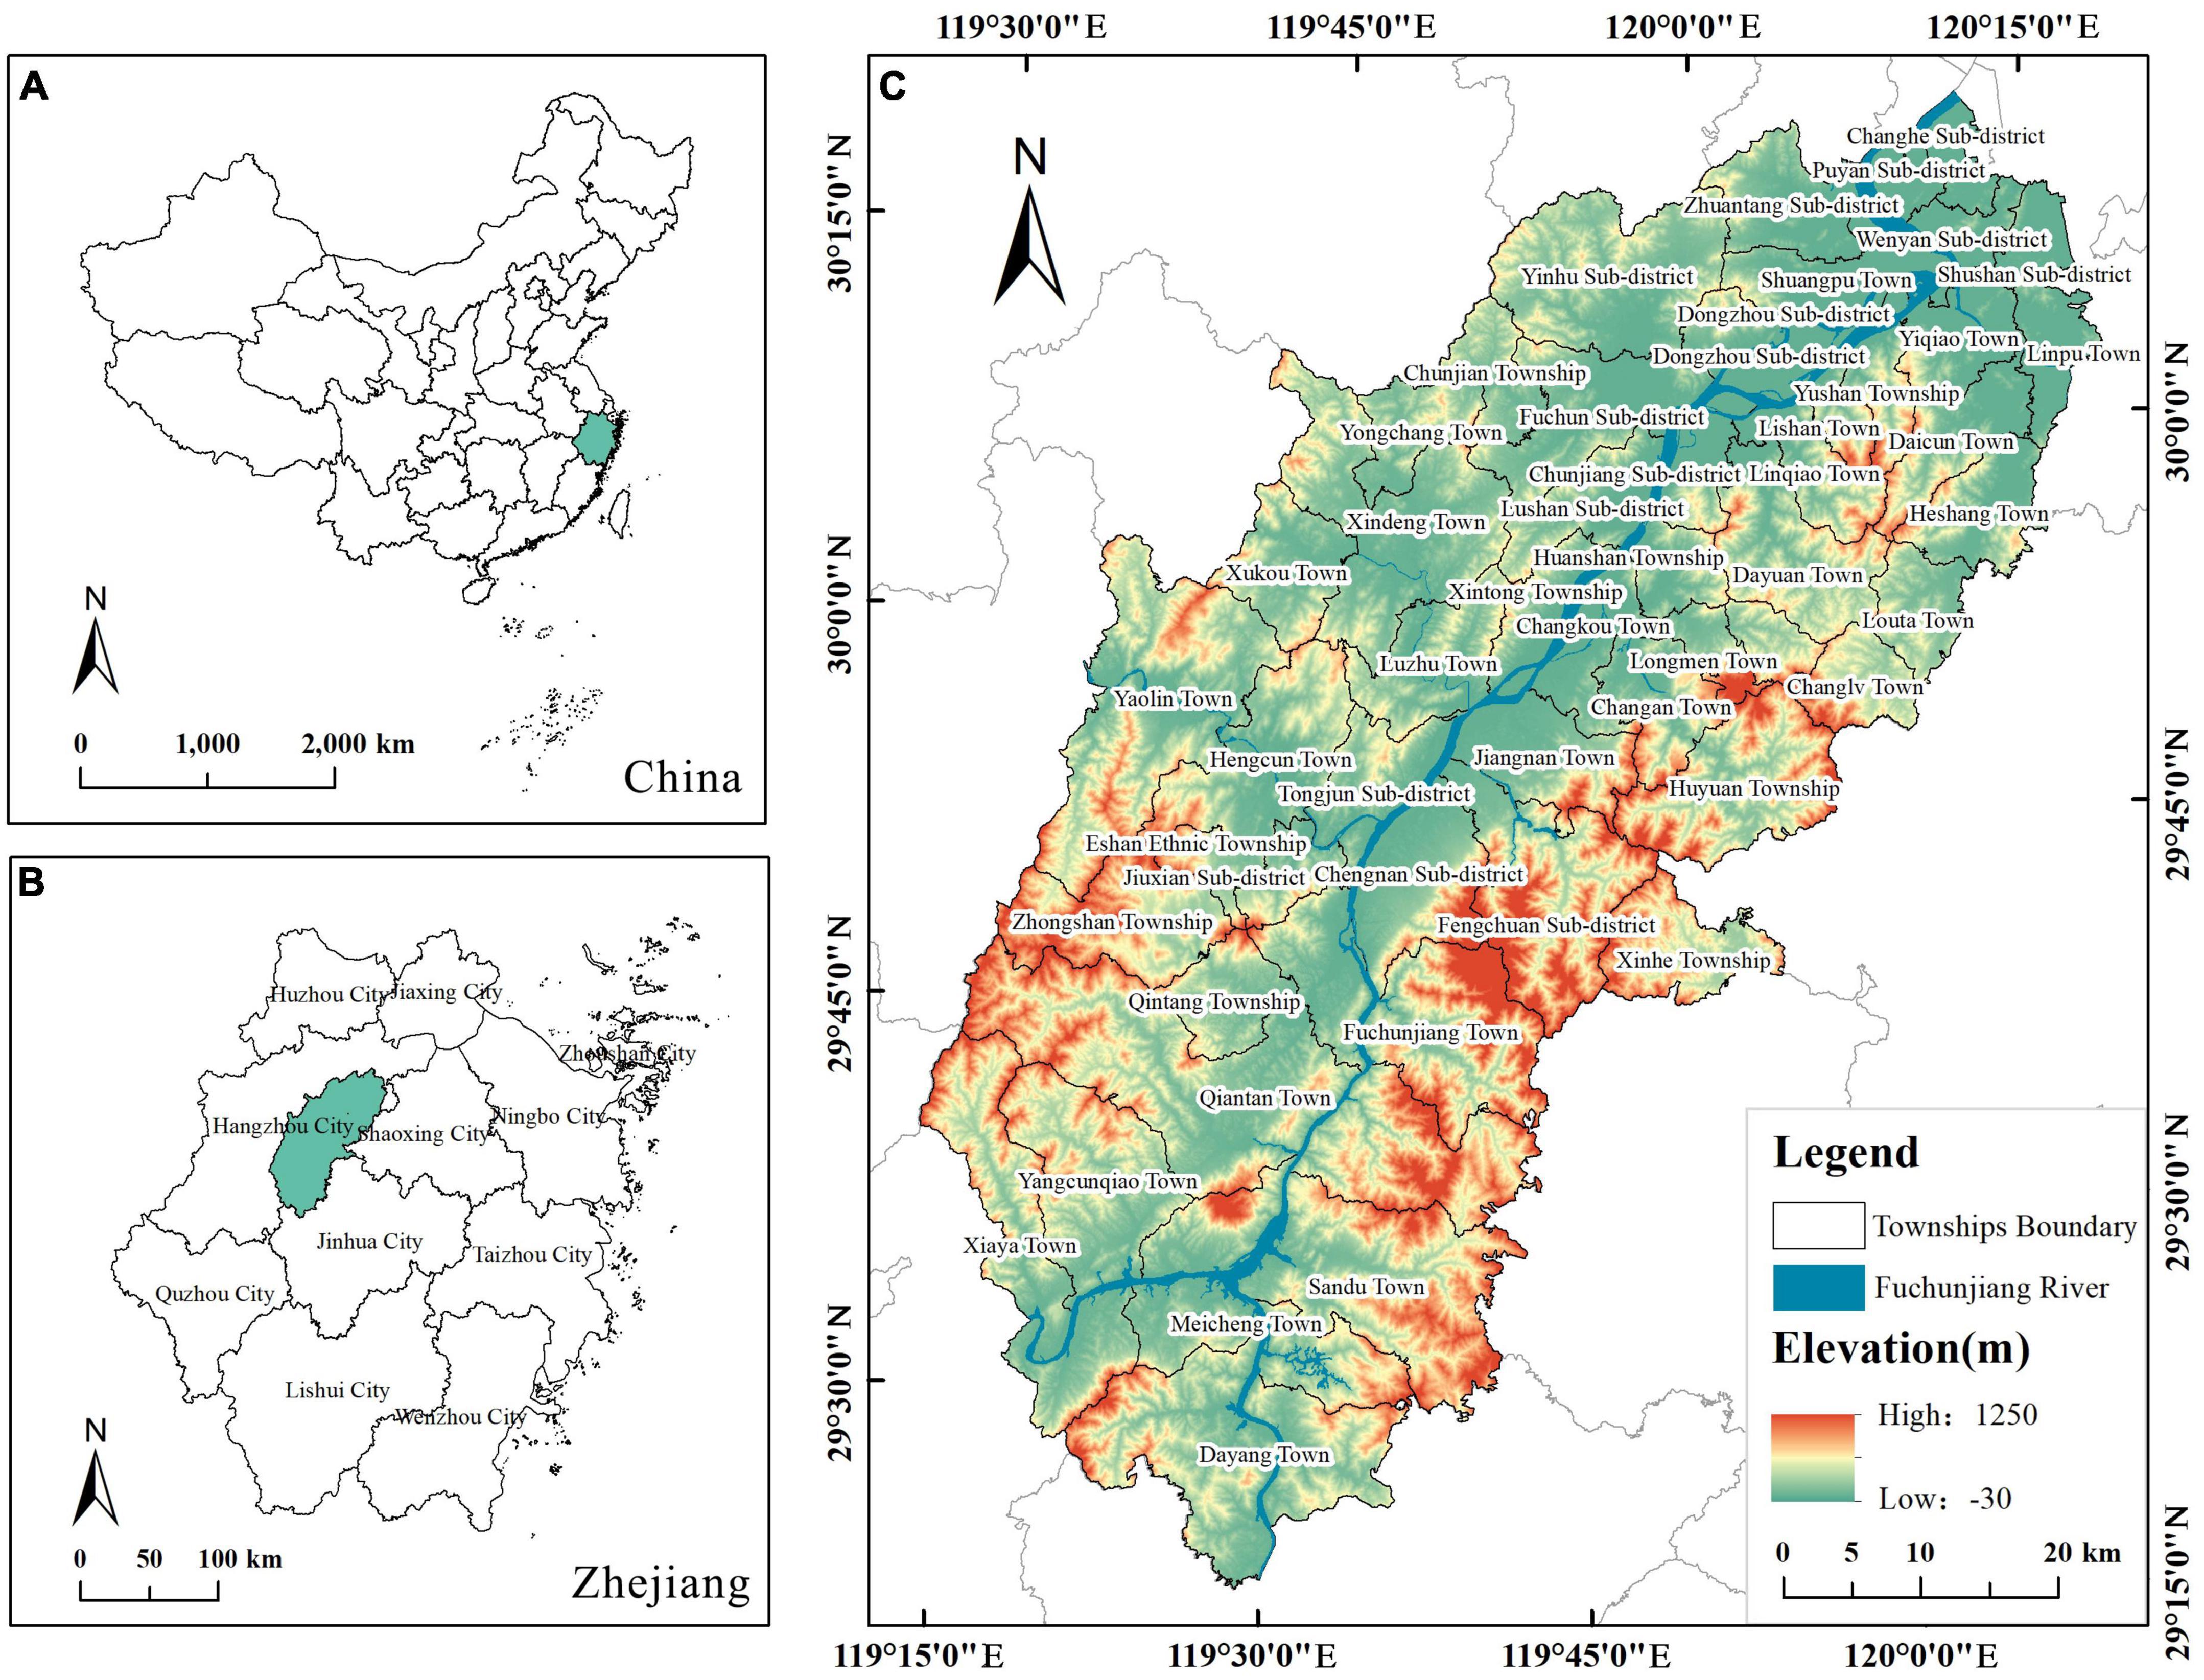
Figure 1. Location of the study area. Note: (A) Administrative division of China. (B) Administrative division of Zhejiang. (C) Elevation and township boundary of the Fuchunjiang River Basin.
The data used in this study included three main categories: land-use data, geographic data, and influencing factor data.
The land-use data were obtained from the Resource and Environment Science and Data Center of Chinese Academy of Sciences,1 including the spatial distribution data of land use/cover remote sensing monitoring in China in 1990, 2000, 2010, and 2020 with a spatial resolution of 30 m. The dataset was based on Landsat images, with an overall accuracy above 92%. According to the “China Remote Sensing Monitoring Land Use/Cover Classification System” and the actual situation of the study area, land use in the study area was classified into seven types: arable land, forestland, grassland, waters, urban and rural residential land, other construction lands, and unused land. The specific spatial distribution is shown in Figure 2.
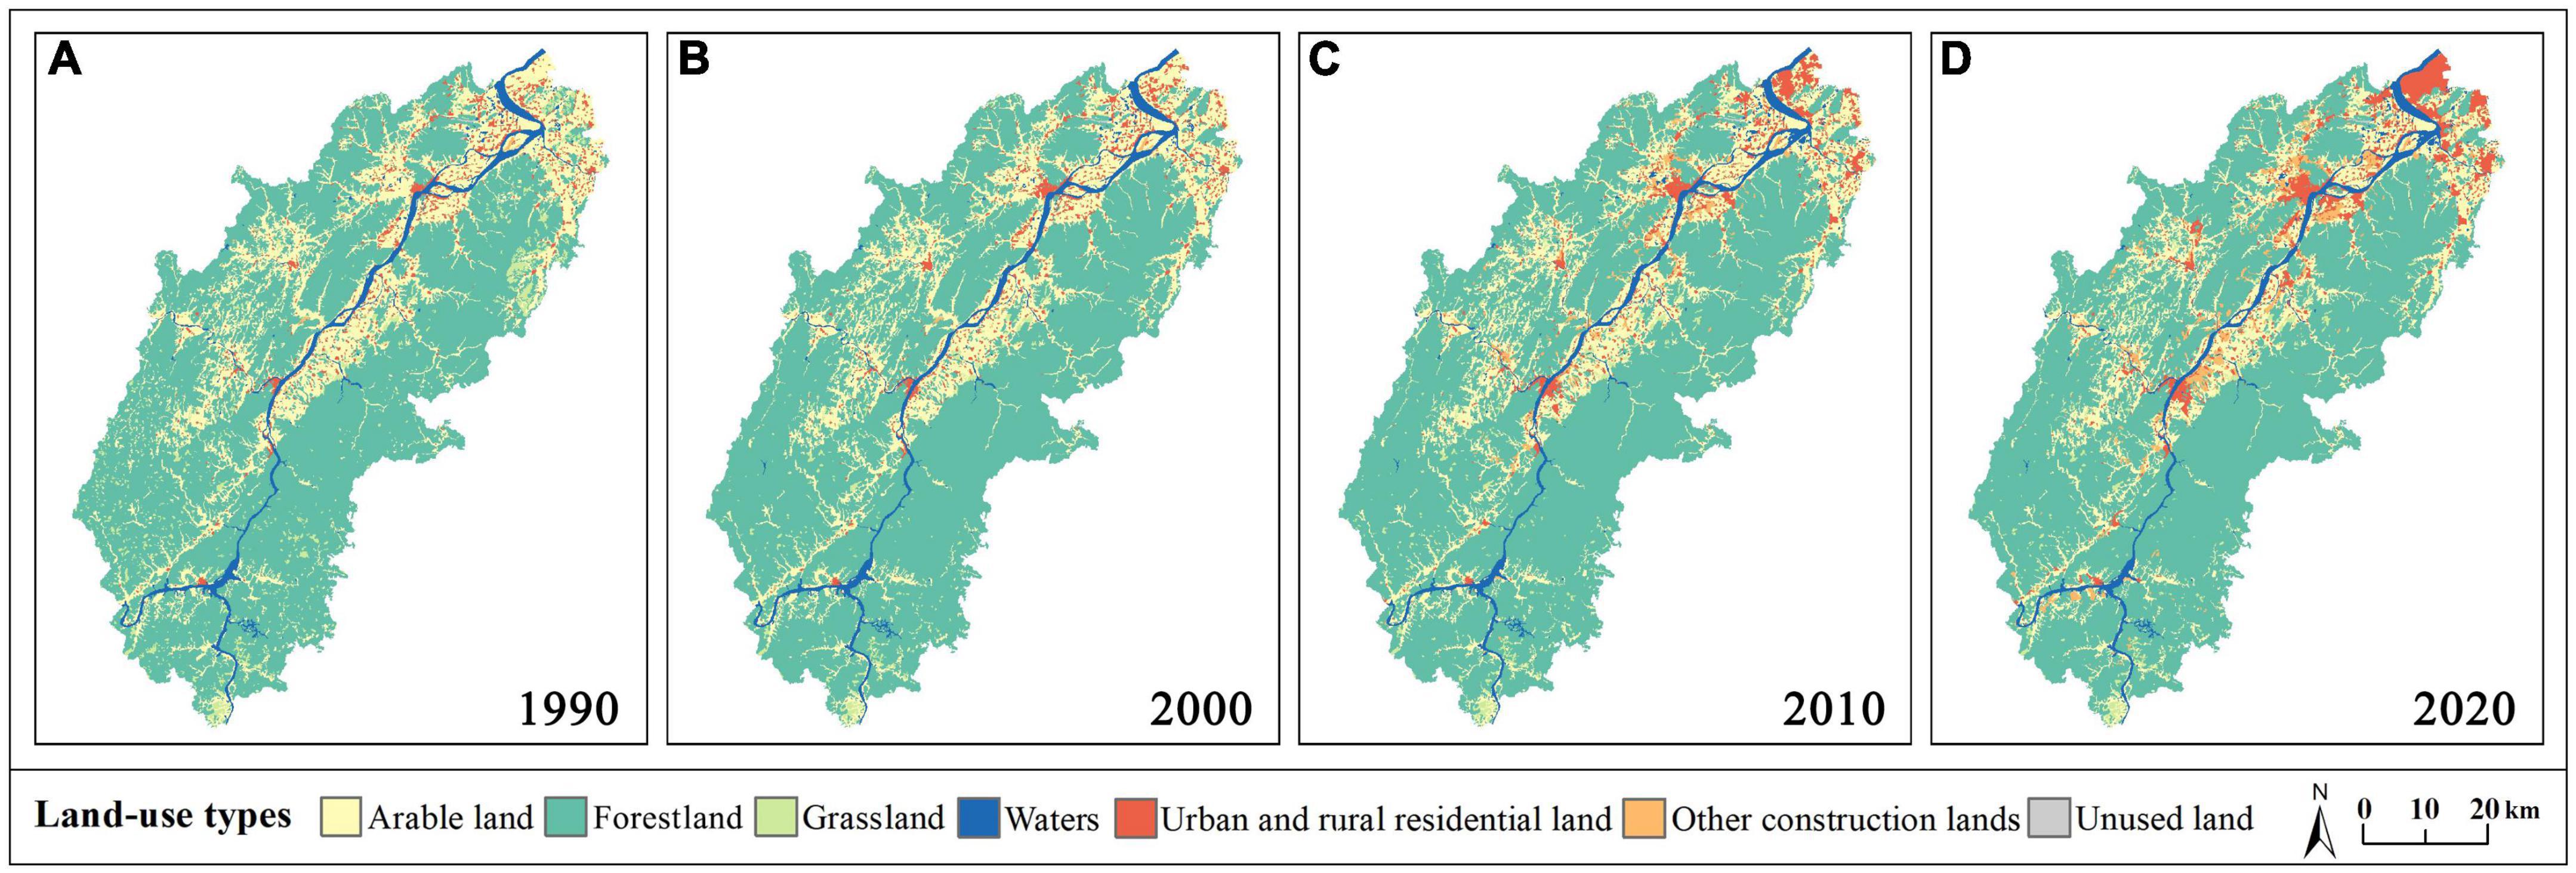
Figure 2. Classification map of land use in the Fuchunjiang River Basin for (A) 1990, (B) 2000, (C) 2010, and (D) 2020.
The geographic data mainly included administrative boundaries2 and river data.3
The influencing factor dataset contained four main categories: topography data, climate data, accessibility data, and socioeconomic data, which were used to analyze the dominant driving factors and changing trends in landscape ecological risk for 2000, 2010, and 2020. Details and sources of the dataset are shown in Table 1. Among them, the DEM and township government location data slightly differed in year correspondence because of small changes and little data information. Only the years in Table 1 were selected for analysis.

Table 1. Influencing factor dataset details and sources.
As an intuitive feedback of human disturbance on regional ecosystems, LUCC has been demonstrated to be closely related to the spatiotemporal evolution of landscape ecological risk (Chen C. et al., 2019; Jiang et al., 2020). Therefore, this article establishes the relationship between LUCC and ecological risk using landscape patterns as a medium, and the spatiotemporal dynamic evaluation system of landscape ecological risk is proposed as follows: firstly, based on land use data, spatial analysis and landscape pattern index method are used to identify the overall characteristics of dynamic changes of regional land use and landscape pattern; secondly, taking townships as the minimum assessment unit, a landscape ecological risk evaluation model is constructed based on the obtained landscape pattern index values to evaluate the spatial differences, temporal changes, transfer characteristics and change rate situation of landscape ecological risk in the study area, and combined with spatial autocorrelation model to analyze the spatial clustering characteristics of landscape ecological risk; finally, based on the influencing factors dataset, the dominant influencing factors of dynamic changes in landscape ecological risk are analyzed from both static and dynamic levels with the help of Geodetector model. The general framework of the study is shown in Figure 3.
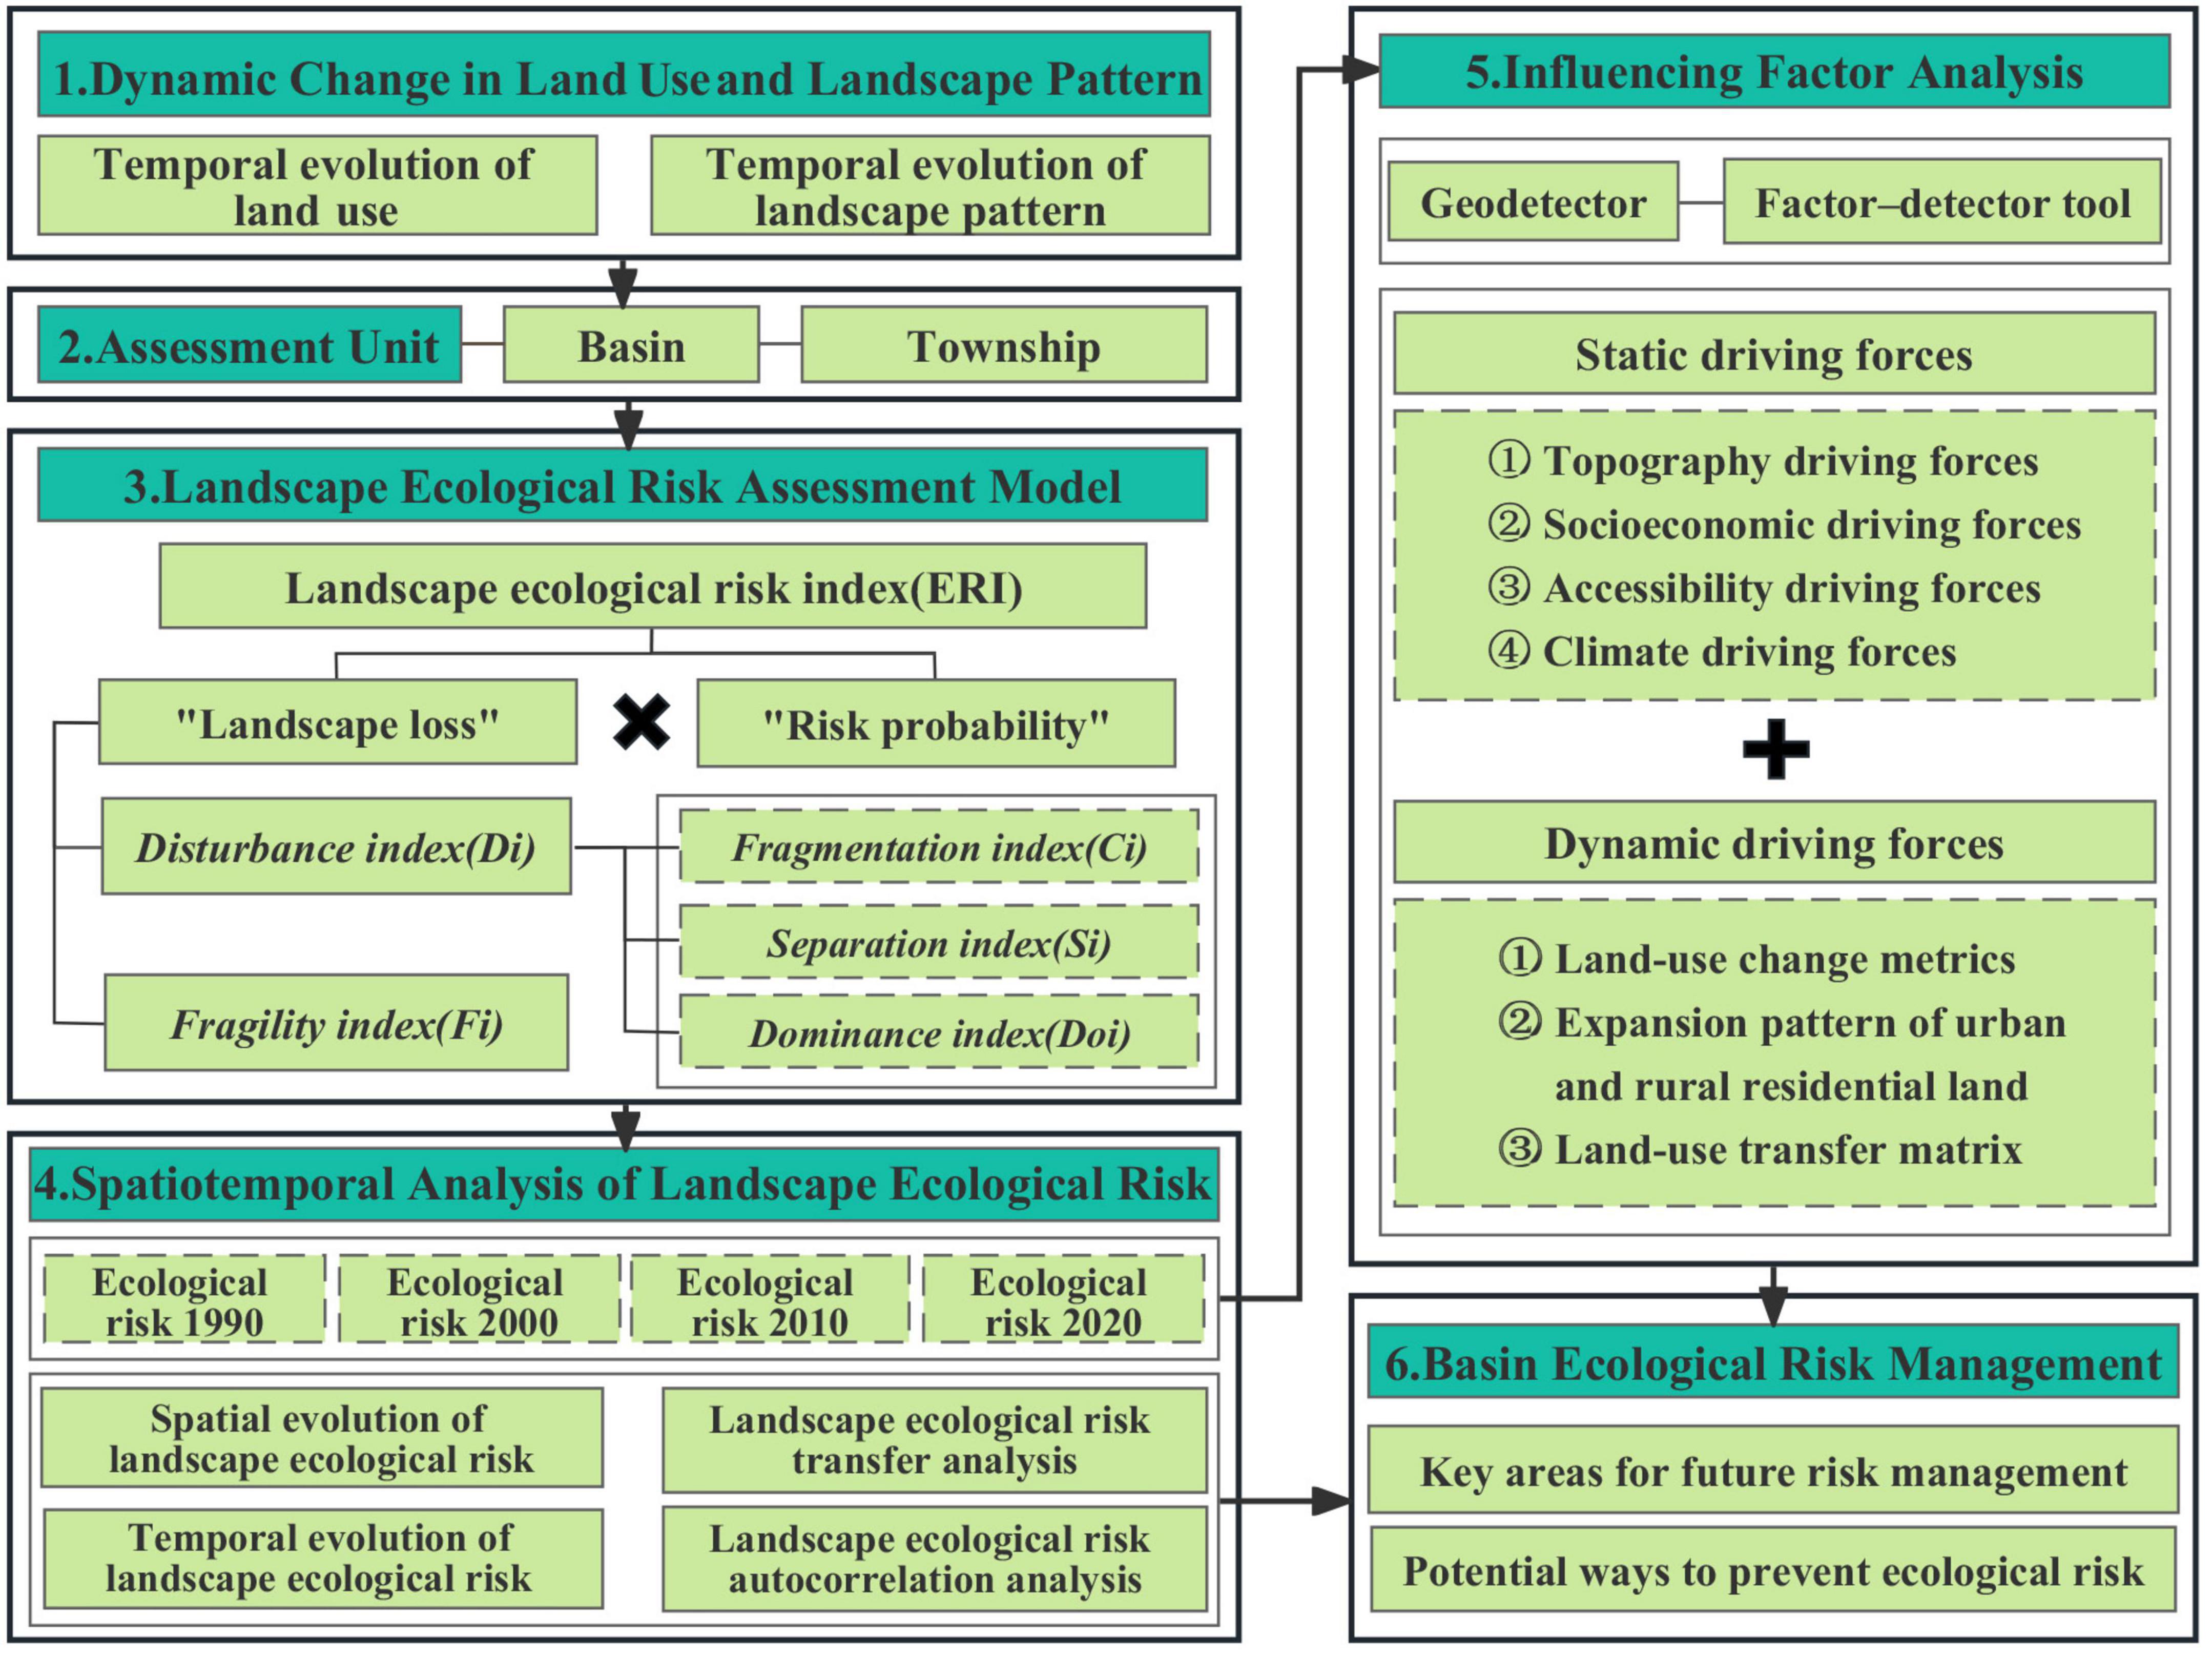
Figure 3. Research framework.
Based on previous research results, in this article, landscape fragmentation, separation, and dominance indexes were selected to build the landscape disturbance index and were then combined with the fragility index normalized by expert assignment to characterize the landscape loss index (Lin et al., 2019; Xue et al., 2019). The “loss and probability multiplication” model was constructed to calculate each township’s landscape ecological risk index (ERI) in the Fuchunjiang River Basin. The specific calculation formula and ecological significance are shown in Table 2.
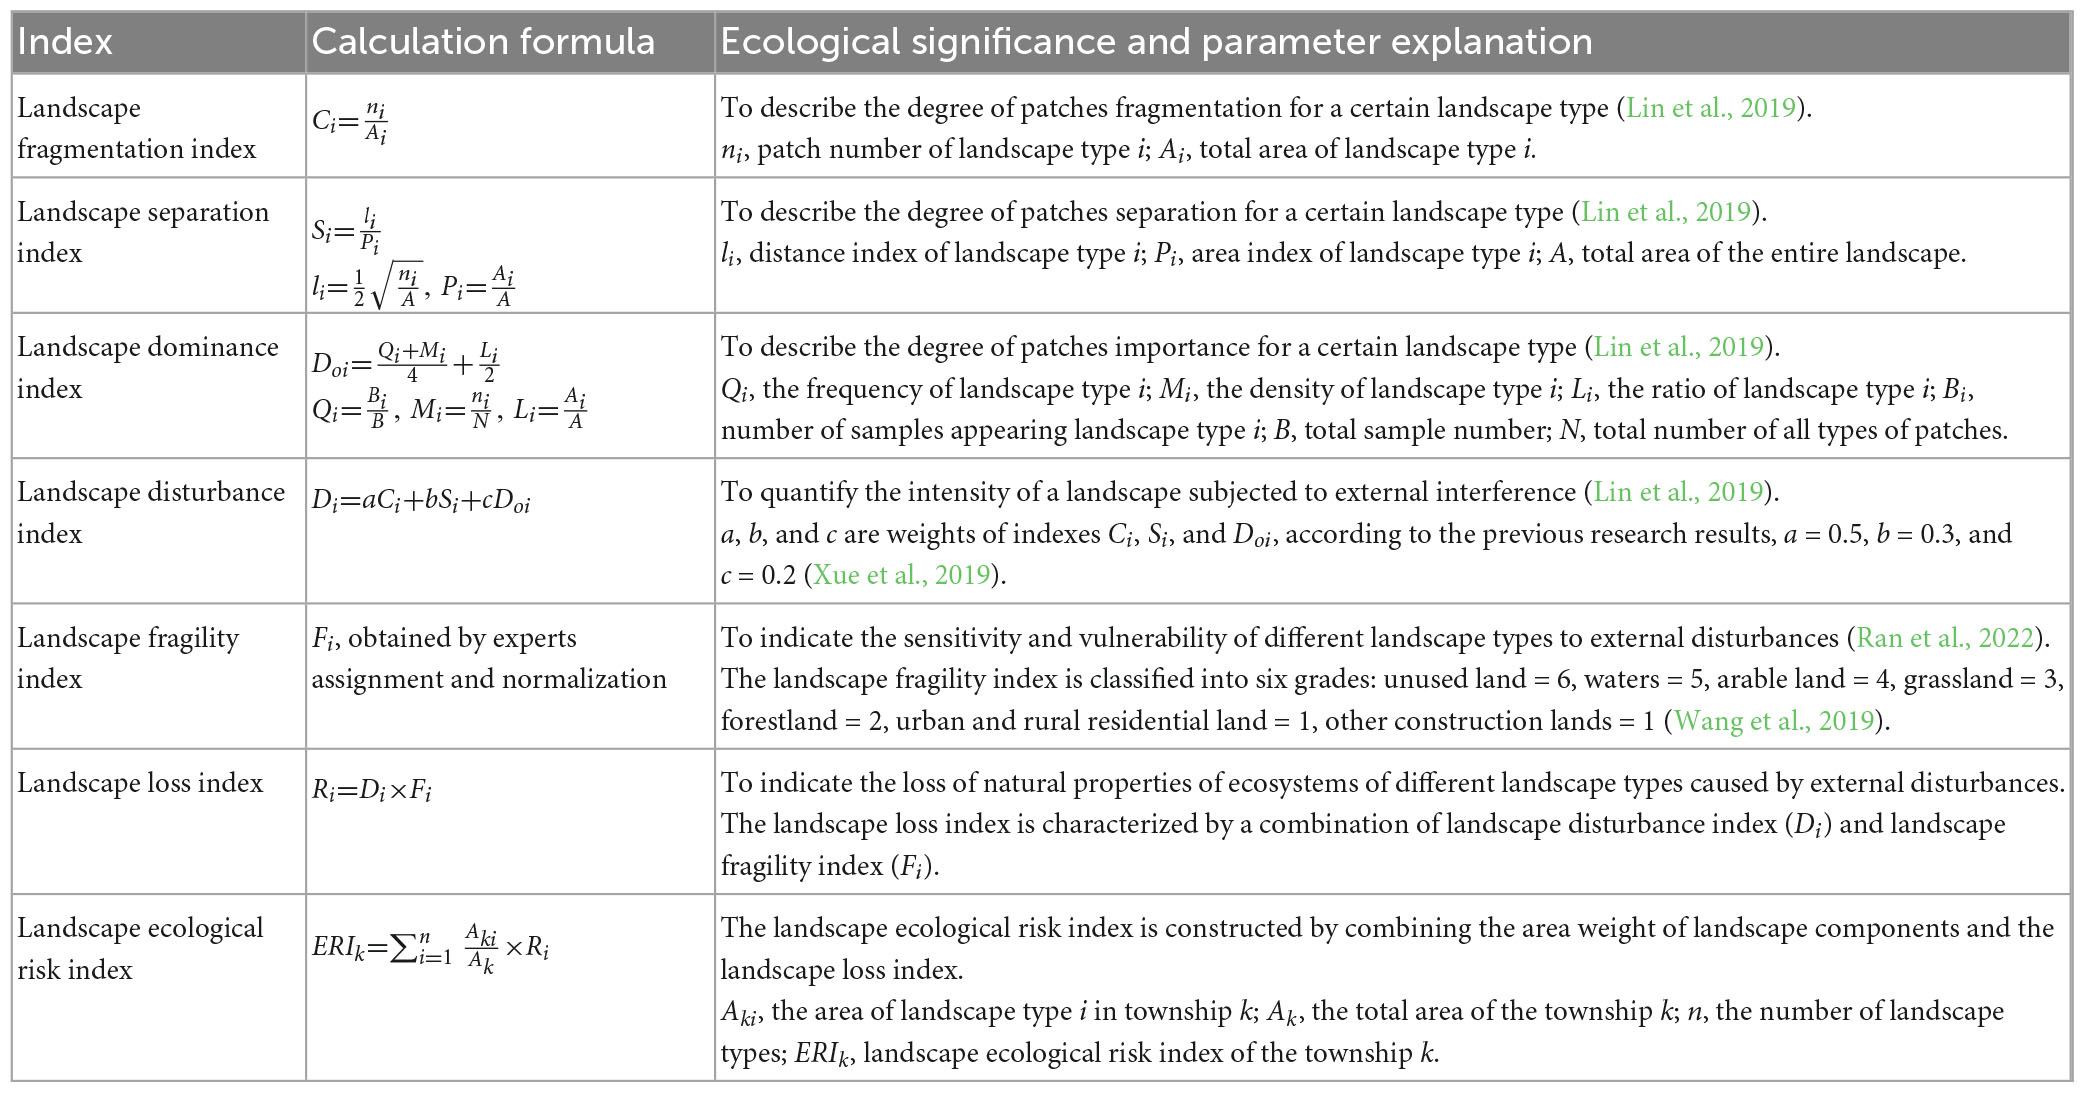
Table 2. Formula for the landscape ecological risk index and its ecological significance.
According to the calculation formula of the landscape ecological risk, the landscape ERI of each township was obtained and divided into five classes according to equal intervals (Xu et al., 2021): low ecological risk area (ERI < 0.007), sub-low ecological risk area (0.007 ≤ ERI < 0.009), medium ecological risk area (0.009 ≤ ERI < 0.011), sub-high ecological risk area (0.011 ≤ ERI < 0.013), and high ecological risk area (ERI ≥ 0.013).
Exploratory spatial data were used to analyze the spatial distribution pattern of landscape ecological risk in the Fuchunjiang River Basin (Zhao et al., 2018). The Global Moran’s I index was used to determine whether there were clustering or dispersion characteristics of landscape ecological risk. The calculation formulas are as follows:
where Xi and Xj are the attribute values of spatial units i and j, Wij is the spatial weight matrix, which indicates the proximity of each spatial unit, and n is the number of risk units. The Global Moran’s I index is between [−1, 1]. An index greater than 0 indicates a positive spatial correlation, and the risk values show clustering characteristics; an index less than 0 indicates a negative spatial correlation, and the risk values show dispersal characteristics; an index equal to 0 indicates no spatial correlation, and the risk values are randomly distributed.
For the specific spatial distribution of high-value or low-value clusters, global spatial autocorrelation cannot be used for further analysis, so the Hot Spot Analysis tool (Getis-Ord Gi*) was chosen to identify spatial clusters with statistically significant high values (hot spots) and low values (cold spots). The results can generate maps of hot spot and cold spot distribution to show the spatial correlation and distribution.
The geodetector is a set of statistical methods for detecting spatial differentiation and revealing the driving forces behind it (Wang and Xu, 2017). Referring to previous research results, combined with the actual situation of the Fuchunjiang River Basin, 12 static influencing factors were selected from four categories of topography, socioeconomic, accessibility, and climate: elevation, slope, aspect, NDVI maximum, GDP, population density, area of urban and rural residential land, human interference, the distance of each township from the Fuchunjiang River, the distance of each township from Hangzhou city, annual average temperature, and annual total precipitation. Thirteen dynamic influencing factors were selected from three categories of land-use change metrics, expansion pattern of urban and rural residential land and land-use transfer matrix: dynamic attitude of urban and rural residential land area, patch number of in-fill expansion mode, patch number of marginal expansion mode, patch number of enclave expansion mode, patch area of in-fill expansion mode, patch area of marginal expansion mode, patch area of enclave expansion mode, area of arable land transferred out, area of arable land transferred in, area of urban and rural residential land transferred out, area of urban and rural residential land transferred in, area of other construction lands transferred out, and area of other construction lands transferred in. These 25 influencing factors were input as variable X, and the landscape ecological risk value and its dynamic attitude were used as attribute Y of the static and dynamic influencing factors, respectively, to explore the dominant driving factors of landscape ecological risk changes. The specific formula is as follows:
where q is the detection value of the ecological risk influencing factors, denotes the discrete variance of Y, h is the number of variable X, Nh denotes the township unit, N is the total number of township units, and σ2 is the total regional variance. q is between [0, 1], and the larger the value of q is, the stronger the explanatory power of the independent variable X on attribute Y. The value of q indicates the proportion of landscape ecological risk explained by the influencing factors.
The concept of land-use dynamic attitude was introduced to study the dynamic impact of the magnitude of changes in urban and rural residential land on the landscape ecological risk, and its expression is as follows (Zhou, 2022):
where K is the area dynamic attitude of urban and rural residential land in the study period, Ua and Ub are the areas of the urban and rural residential land at the beginning and end of the study period, respectively, and T is the difference between the years of the study period.
The concept of the multi-order adjacency index was introduced to investigate the dynamic influence of the number and area of patches of various expansion patterns of urban and rural residential land on the landscape ecological risk (Liu et al., 2018). This index was used to describe the expansion of urban and rural residential land by defining the degree of adjacency of the spatial relationship between old and new patches, setting the buffer distance, and quantifying the patch expansion characteristics using the multi-order buffer method. Its calculation formula is as follows:
where MAI is the multi-order adjacency index of the new patches; N is the number of buffers made for the new patches; A0 is the area of the N-th buffer (the outermost buffer); and Ai is the area of the part of the N-th buffer intersecting with the original patch. When the value of MAI is between [0, 0.5), the expansion mode of urban and rural residential land is in-fill expansion; when the value is between [0.5, 1), it is marginal expansion; when the value is greater than 1, it is enclave expansion.
The land-use transfer matrix model was introduced to investigate the dynamic influence of the area transferred in and out of a certain land-use type on the landscape ecological risk and to characterize the dynamic process of the interconversion between the area of each land type at the beginning and the end of a period in a certain region (Zhou, 2022). Its mathematical form is as follows:
where S represents the area; n is the number of land use types; and i and j are the land use types at the beginning and end of the study, respectively. Each row in the matrix represents the transferred-out information of a certain land type, and each column represents the transferred-in information of a certain land type. In this article, ArcGIS10.6 software was used to cross-analyze data of land use types in different periods and establish each period’s land-use transfer matrix.
The land use types in the Fuchunjiang River Basin that changed from 1990 to 2020 accounted for 12.64% of the total area (Table 3). During the period, the area of arable land decreased by 216.18 km2, and the grassland area decreased by 69.66 km2. The area of these two land types decreased by 21.83 and 49.55%, respectively. The area of urban and rural residential land increased by 89.11%, while the number of patches showed a slight decrease, indicating that as the urban and rural settlement clusters expanded, the area of patches increased, and the edges gradually merged. The growth of other construction lands was as high as 1,415.59%, and the number of patches also increased by 526%, especially between 2000 and 2010. The area and number of patches increased by 845.29 and 462.79%, respectively, which was mainly related to the “Industrial Development” strategy proposed by Hangzhou in 2000. During this period, the rapid development and dominance of industrial manufacturing in the townships led to a dramatic expansion in the area and the number of patches. Forestland was the dominant landscape in the study area and has remained relatively stable over the past 30 years, and waters and unused land also remained unchanged.
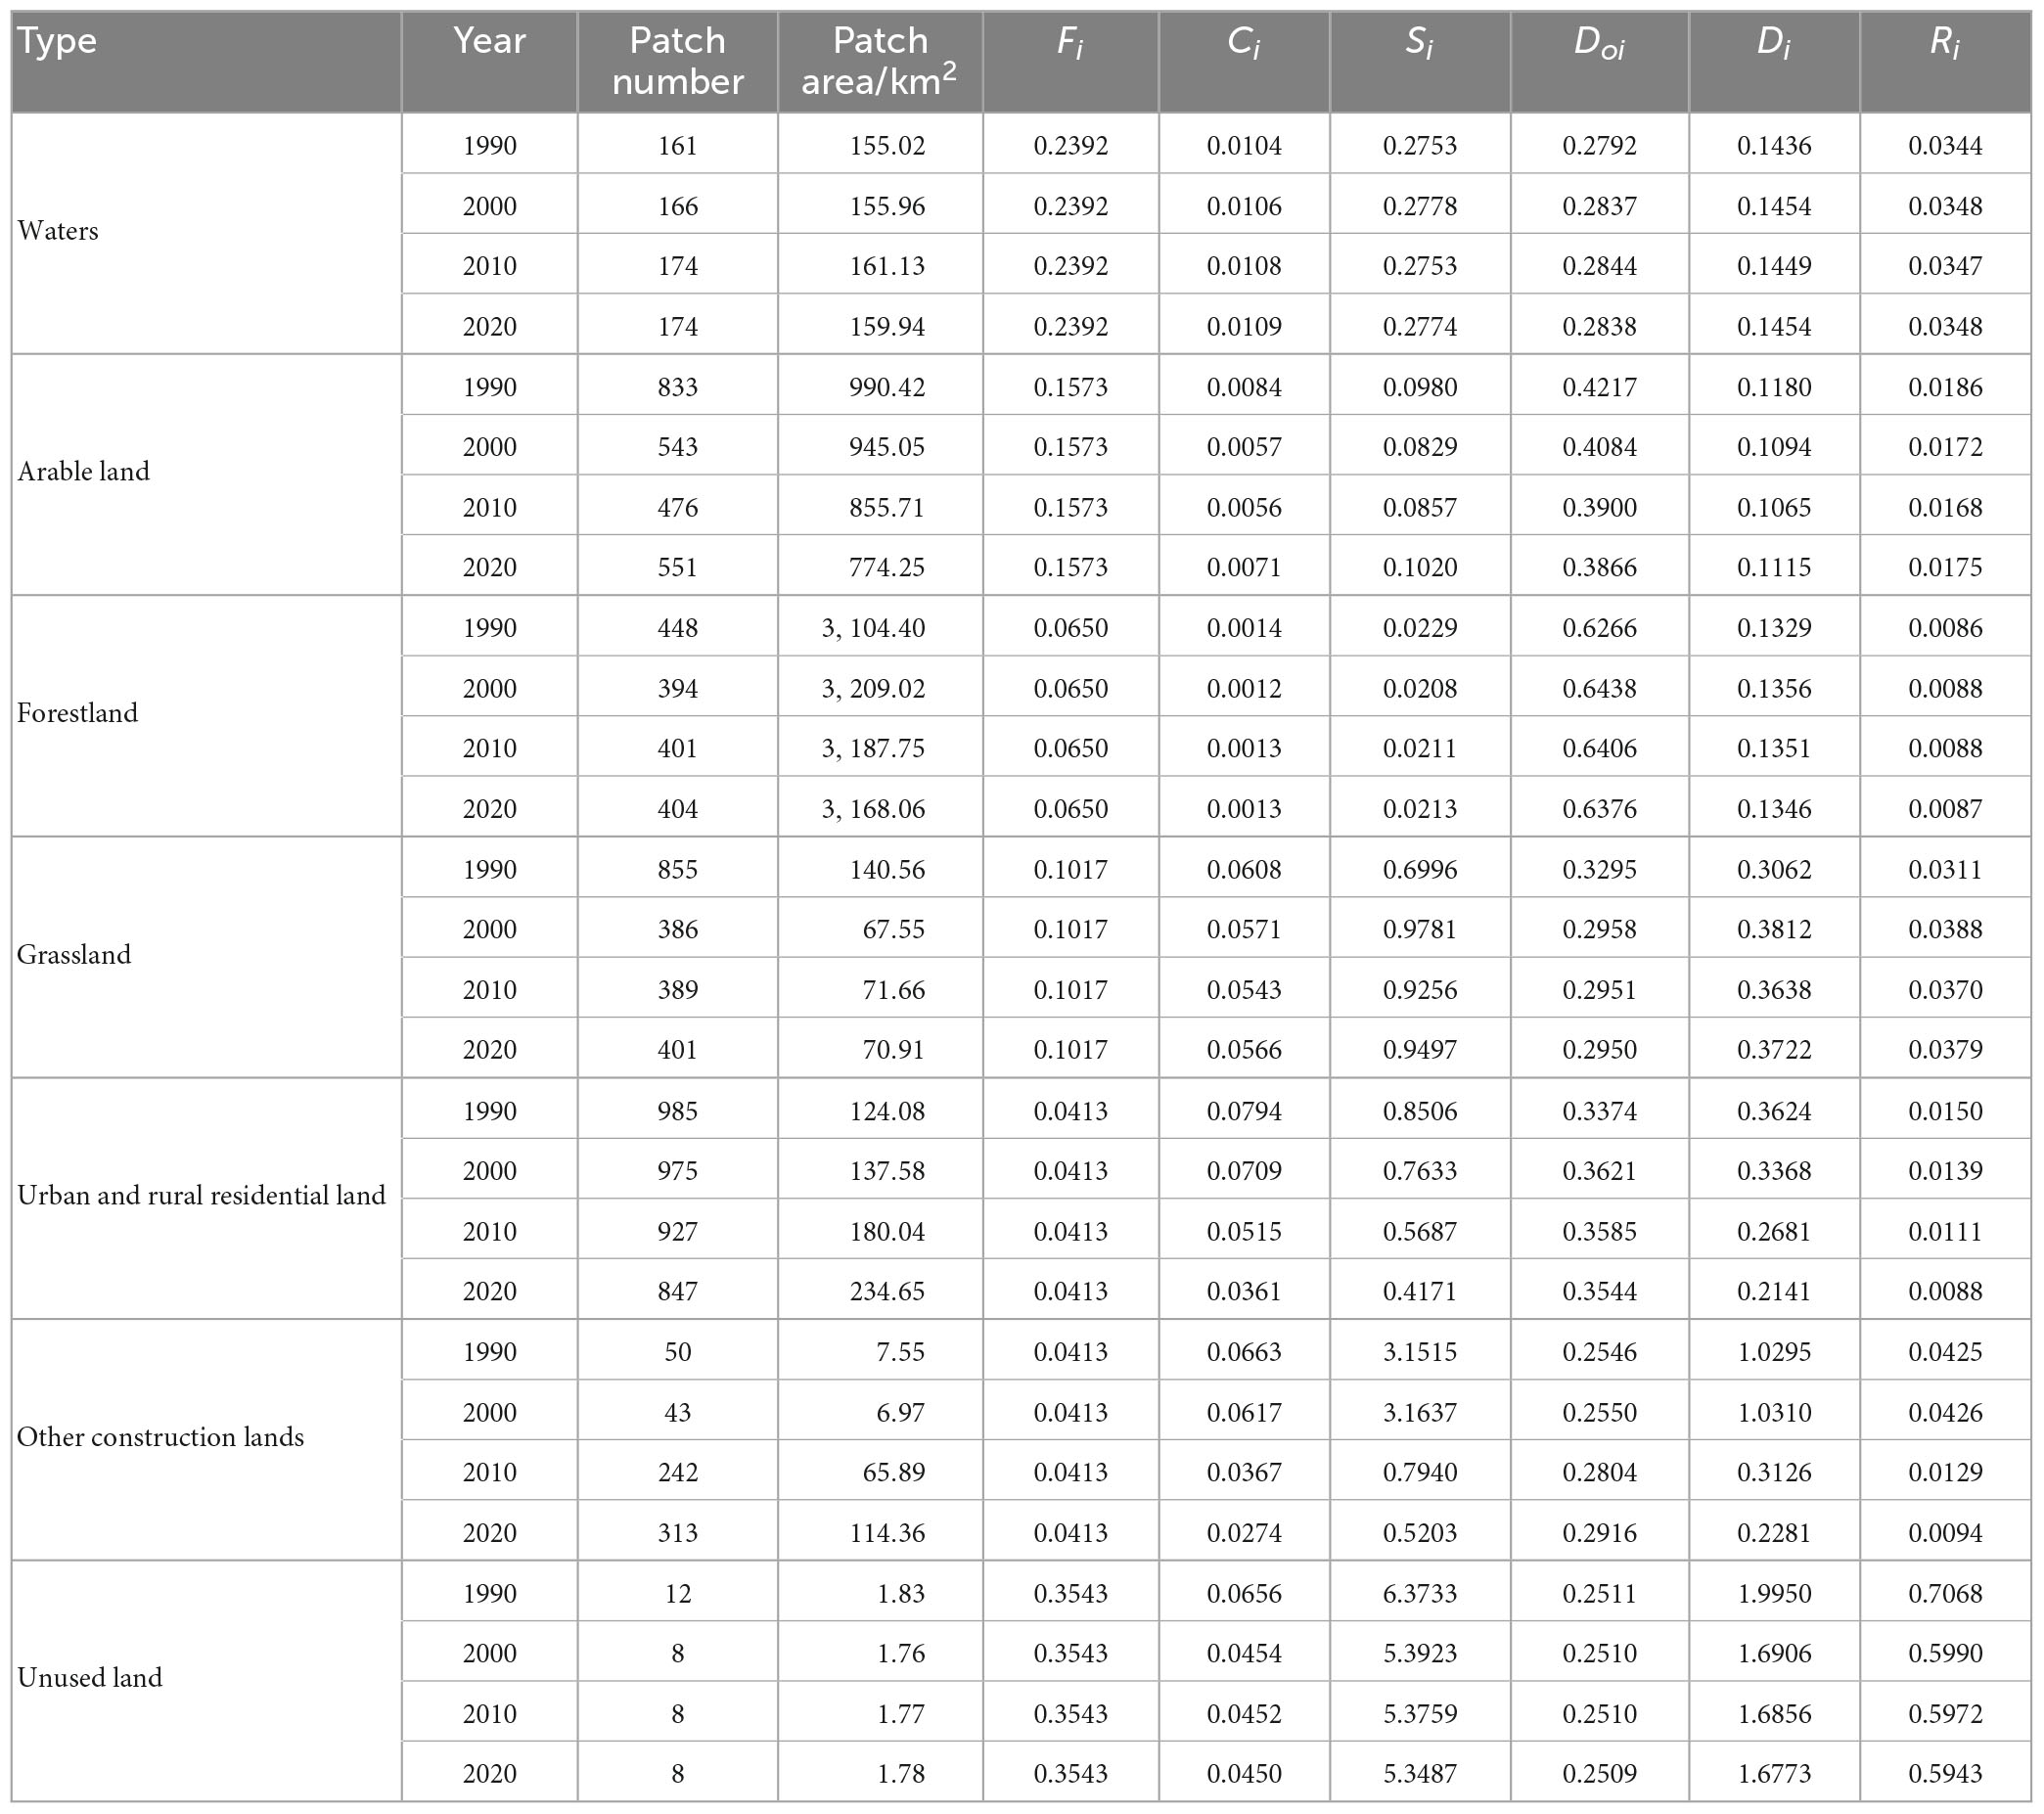
Table 3. Landscape pattern indexes of various land use types in the Fuchunjiang River Basin from 1990 to 2020.
The changes in land-use structure and function caused significant changes in the landscape pattern of the Fuchunjiang River Basin. Overall, the dynamic responses of landscape pattern indexes in various land types to land-use changes during the study period showed strong consistency. The fragmentation, separation, and dominance indexes of urban and rural residential land patches gradually declined, and the loss index also maintained the same decreasing trend, from 0.015 to 0.009, with a total decrease of 40.92%. The fragmentation and separation index of other construction lands exhibited a decreasing trend, and the dominance index increased slightly, among which the separation index dropped sharply from 3.16 to 0.79 between 2000 and 2010, with a drop of 74.90%, which directly led to a significant decrease in the disturbance and loss index, decreasing from 1.03 to 0.31 and 0.04 to 0.01, respectively. The changing trend of the landscape pattern in grassland was the same as that of arable land patches, with the fragmentation and dominance index decreasing and the separation index increasing, reflecting the decrease in arable land patches and the increase in grassland patches in terms of the loss index. The landscape pattern indexes of unused land showed a slight downward trend, while the landscape pattern indexes of waters and forestland patches remained stable. In general, the fragmentation and separation index of multiple types of land patches had an obvious downward trend, and the degree of agglomeration increased. The loss degree from highest to lowest was as follows: unused land > grassland > waters > other construction lands > arable land > urban and rural residential land > forestland. The results indicated that the loss of unused land was the greatest and forestland was the most stable when subjected to human disturbance.
The spatial distribution of landscape ecological risk in the Fuchunjiang River Basin varied greatly, showing a spatial pattern of “high in the northwest and low in the southeast” (Figure 4). High-risk townships were mainly concentrated in the downstream areas of the Fuchunjiang River Basin, including Wenyan Subdistrict, Changhe Subdistrict, and Shuangpu Town, where the landscape was dominated by construction lands such as settlements and industrial gathering areas, with dense cities, a vibrant economy, and high land-use intensity. The sub-high ecological risk areas were distributed along the periphery of the high-risk areas and the middle reaches of the Fuchunjiang River, including subdistricts such as Shushan, Zhuantang, and Puyan and towns such as Yiqiao, Linpu, and Hengcun, with the landscape type still dominated by construction land. The low ecological risk areas were mainly distributed in the eastern part of the study area bordering Shaoxing city, including Changlv Town, Huyuan Township, Xinhe Township, Dayuan Township, and other townships, where there were many mountains with forestland and grassland as the main landscape types, and the degree of human interference was low. The sub-low ecological risk areas were mainly distributed in the southern part of the study area, adjacent to the Jiande and Chun’an areas. The medium-risk townships were concentrated in the northwest block of Fuyang and Tonglu, where the terrain was relatively flat, and the arable land area was large and wide-ranging.
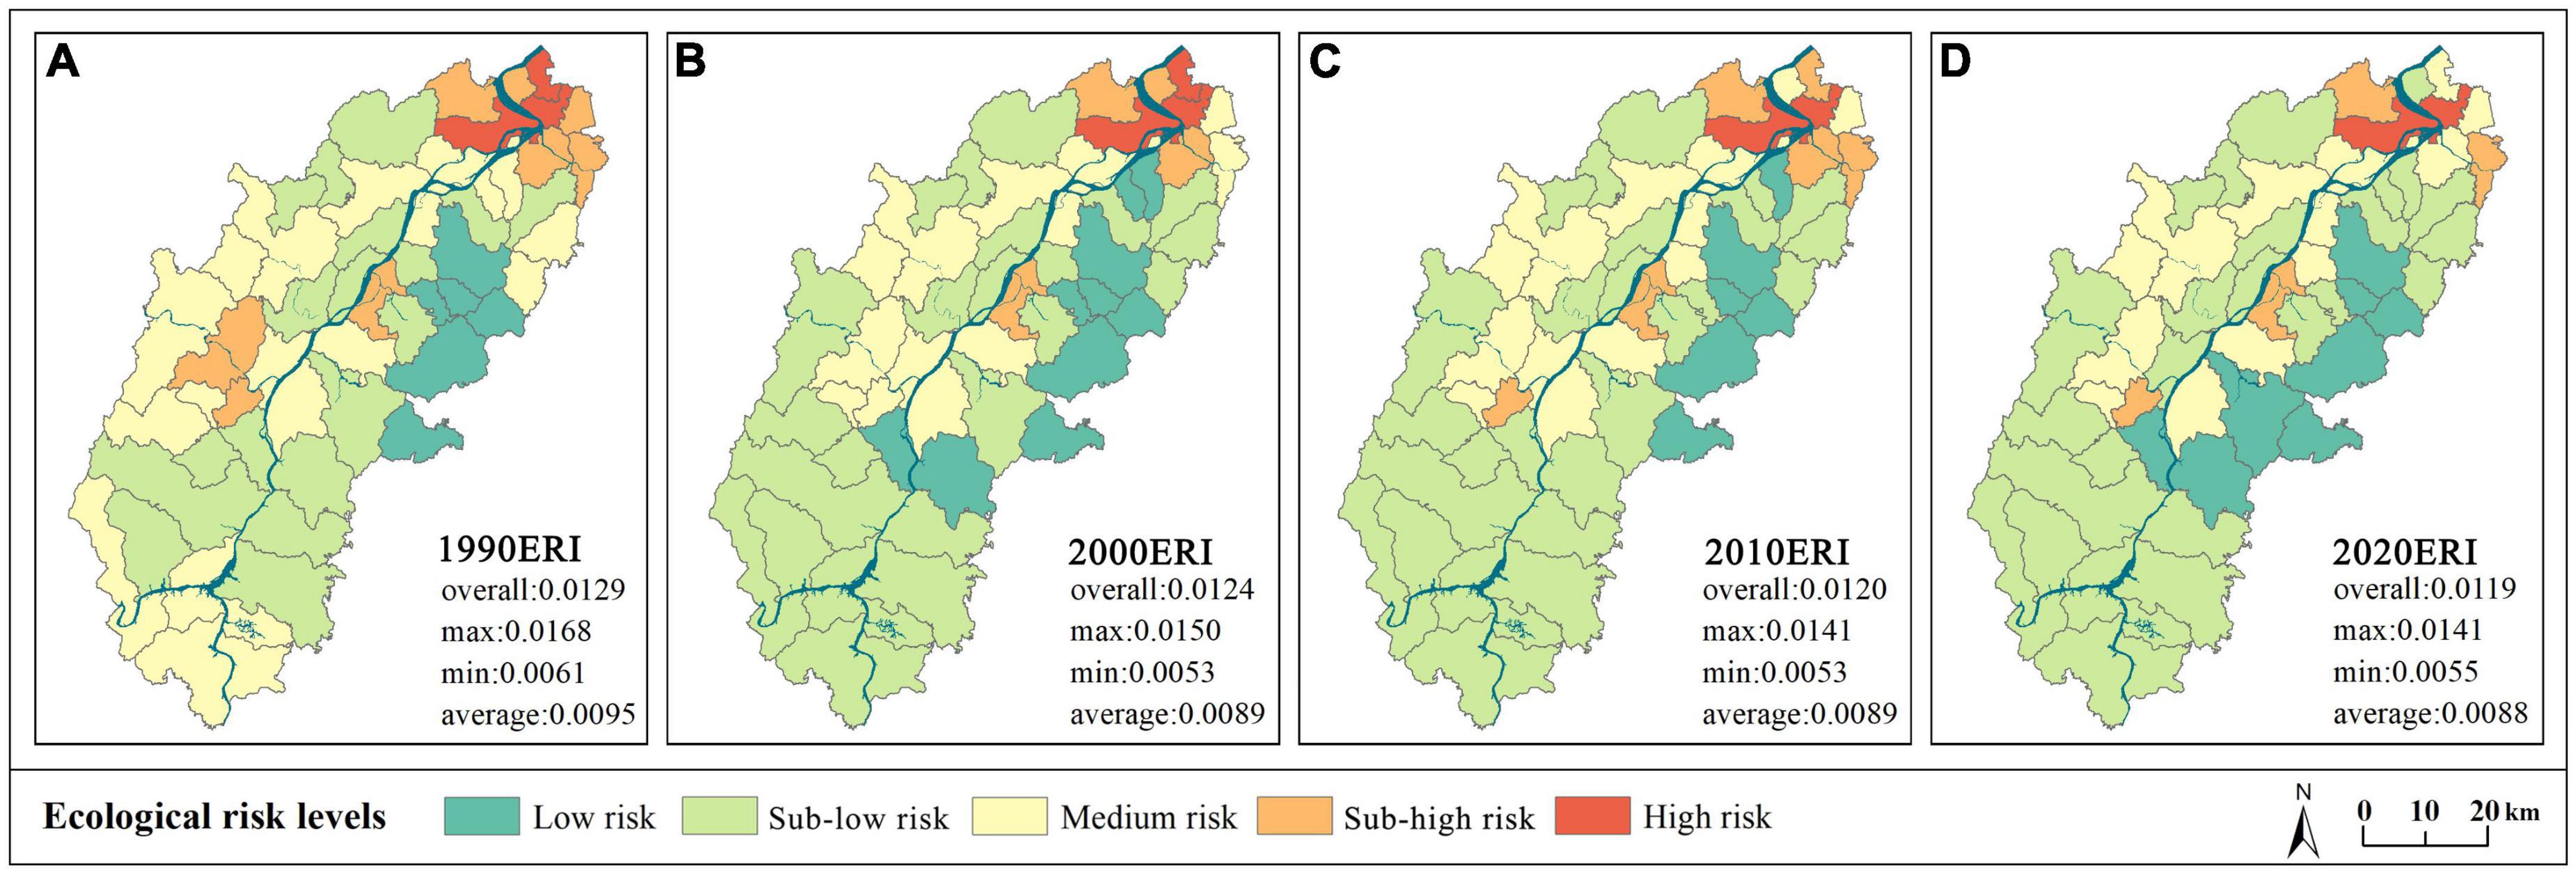
Figure 4. Spatiotemporal variation characteristics of landscape ecological risk in the Fuchunjiang River Basin for (A) 1990, (B) 2000, (C) 2010, and (D) 2020. Note: ERI is the abbreviation of the landscape ecological risk index (1990ERI means the landscape ecological risk value in 1990); overall represents the overall landscape ecological risk value of the Fuchunjiang River Basin; max represents the maximum value of landscape ecological risk among 51 townships; min represents the minimum value of landscape ecological risk among 51 townships; average is the average value of landscape ecological risk among 51 townships.
From 1990 to 2020, the landscape ecological risk in the Fuchunjiang River Basin generally showed a downward trend. The 4-year landscape ecological risk values were 0.0129, 0.0124, 0.0120, and 0.0119, with an overall decrease of 7.75%. At the same time, the annual maximum and average values of the landscape ERI of the 51 townships also gradually decreased (Figure 4). As seen in Figure 5, the area proportion of regions with landscape ecological risk levels from low to high was approximately 10, 59, 21, 7, and 3% during the study period, and the sub-low and medium ecological risk areas were always dominant. Except for 1990, when the area of the medium ecological risk areas accounted for the highest percentage (39.44%), the rest of the years were dominated by the sub-low ecological risk areas, which accounted for more than 55% of the total area, and the number of townships was the largest, increasing from 16 to 25; the area and number of townships in sub-high and high ecological risk areas gradually decreased, and the area proportion stabilized below 10%. A comparison of three periods revealed that the area of ecological risk areas at all levels changed significantly during the period from 1990 to 2000, except for the high ecological risk areas. The area of low and sub-low ecological risk areas increased by 62.24 and 45.01%, respectively, while the area of medium and sub-high ecological risk areas decreased by 45.66 and 51.04%. Overall, due to the changes in landscape pattern, the area of low and sub-low ecological risk areas continued to increase, which led to a significant decrease in regional landscape ecological risk and a gradual improvement in habitat quality and ecological safety.
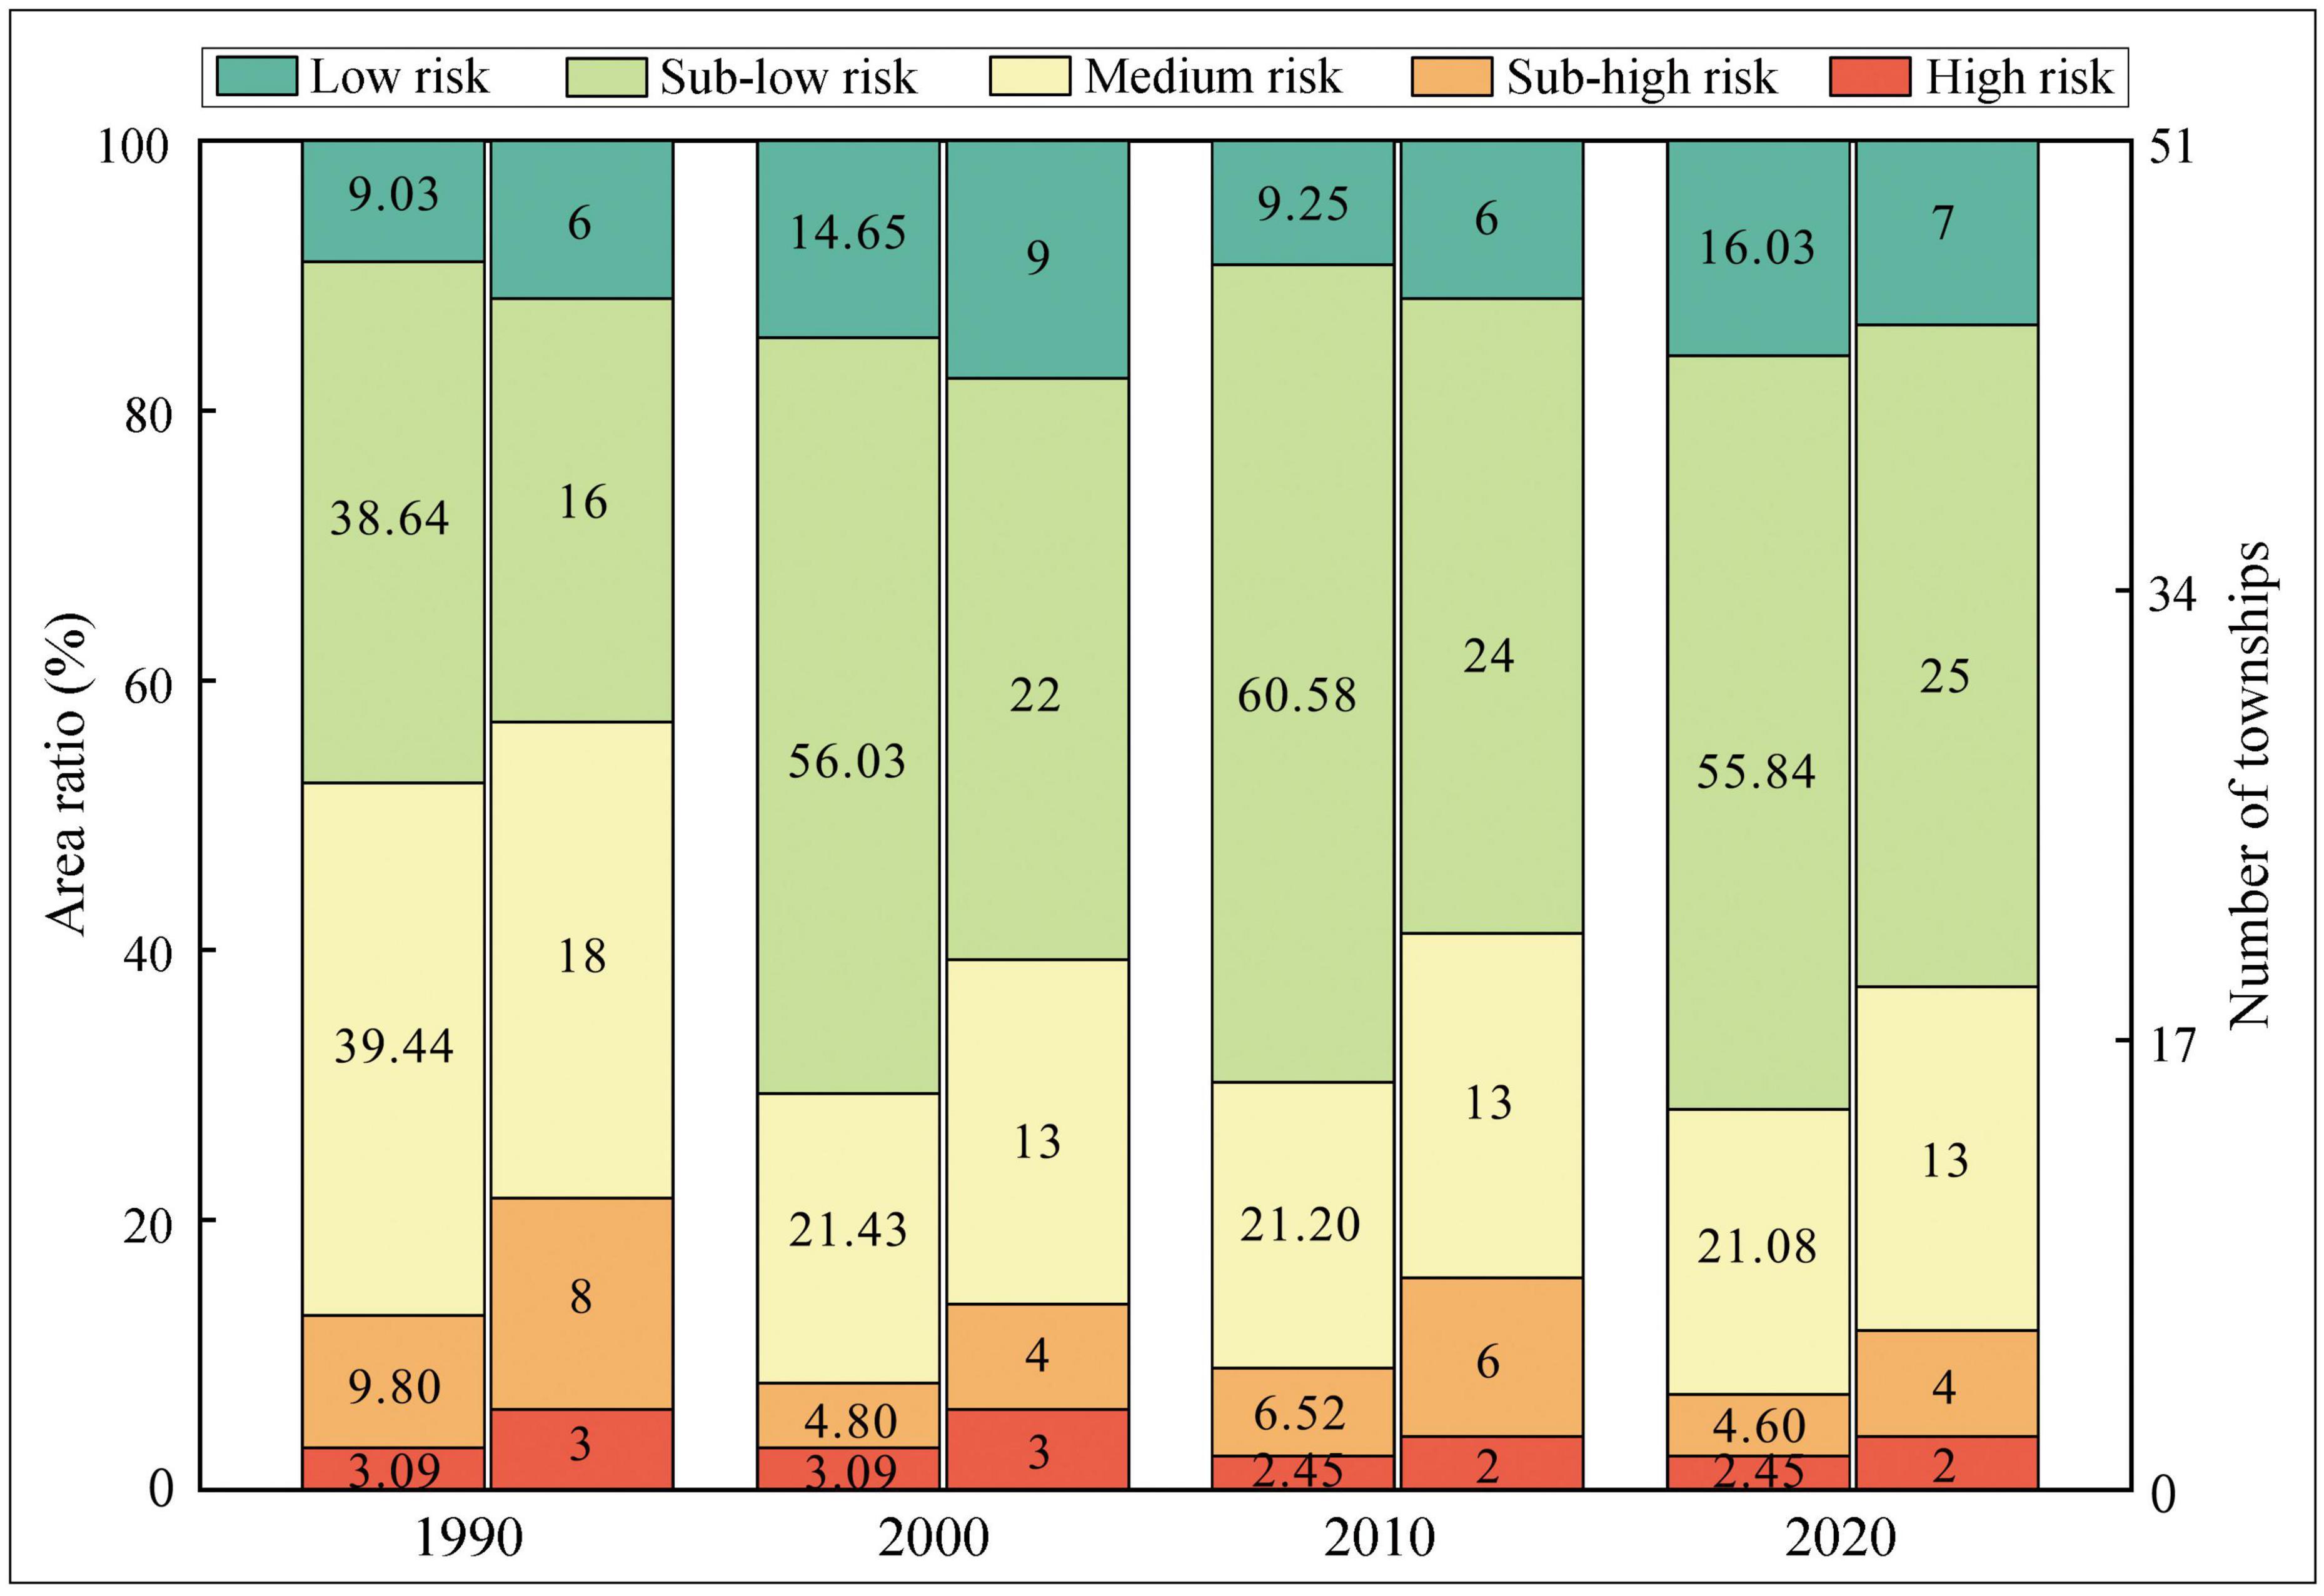
Figure 5. The area ratio and the number of townships in various levels of landscape ecological risk areas in the Fuchunjiang River Basin from 1990 to 2020. The data in the left column of each year are the area ratio in various levels of landscape ecological risk areas, and the data in the right column of each year are the number of townships in various levels of landscape ecological risk areas.
From 1990 to 2020, the ecological risk level of each township in the Fuchunjiang River Basin mainly shifted from high-risk to low-risk levels, with a total shift of 2,039.29 km2, accounting for 83.72% of the total transferred area (Figure 6A). Divided into three stages, from 1990 to 2000, the ecological risk level of 14 townships changed, and the landscape ecological risk level decreased in all of them. The number of townships that shifted ecological risk levels from sub-high to medium, medium to sub-low, medium to low, and sub-low to low was 4, 7, 2, and 1, respectively, with a total shift of 1,460.45 km2. From 2000 to 2010, there were 6 townships with elevated ecological risk levels, among which 2, 1, and 3 townships shifted ecological risk levels from medium to sub-high, sub-low to medium, and low to sub-low, respectively, with a total shift of 359.44 km2. There were 2 townships with decreased risk levels; Changhe Subdistrict changed from high to sub-high risk, and Linpu Town changed from sub-high to medium risk. From 2010 to 2020, there was only one township (Yushan Township) with elevated ecological risk levels, changing from low to sub-low risk. There were 6 townships with decreased risk levels; two changed from sub-high to medium, two changed from medium to sub-low, and two changed from sub-low to low risk, with a total shift of 522.95 km2. In terms of spatial distribution (Figure 6B), from 1990 to 2020, the areas with frequent changes in ecological risk levels were mainly distributed in the townships along the Fuchunjiang River and close to the center of Hangzhou, primarily shifting from the high-risk level to the low-risk level. It is indicated that the comprehensive ecological risk in the Fuchunjiang River Basin was alleviated, and the pressure on the ecological environment caused by human activities gradually improved.
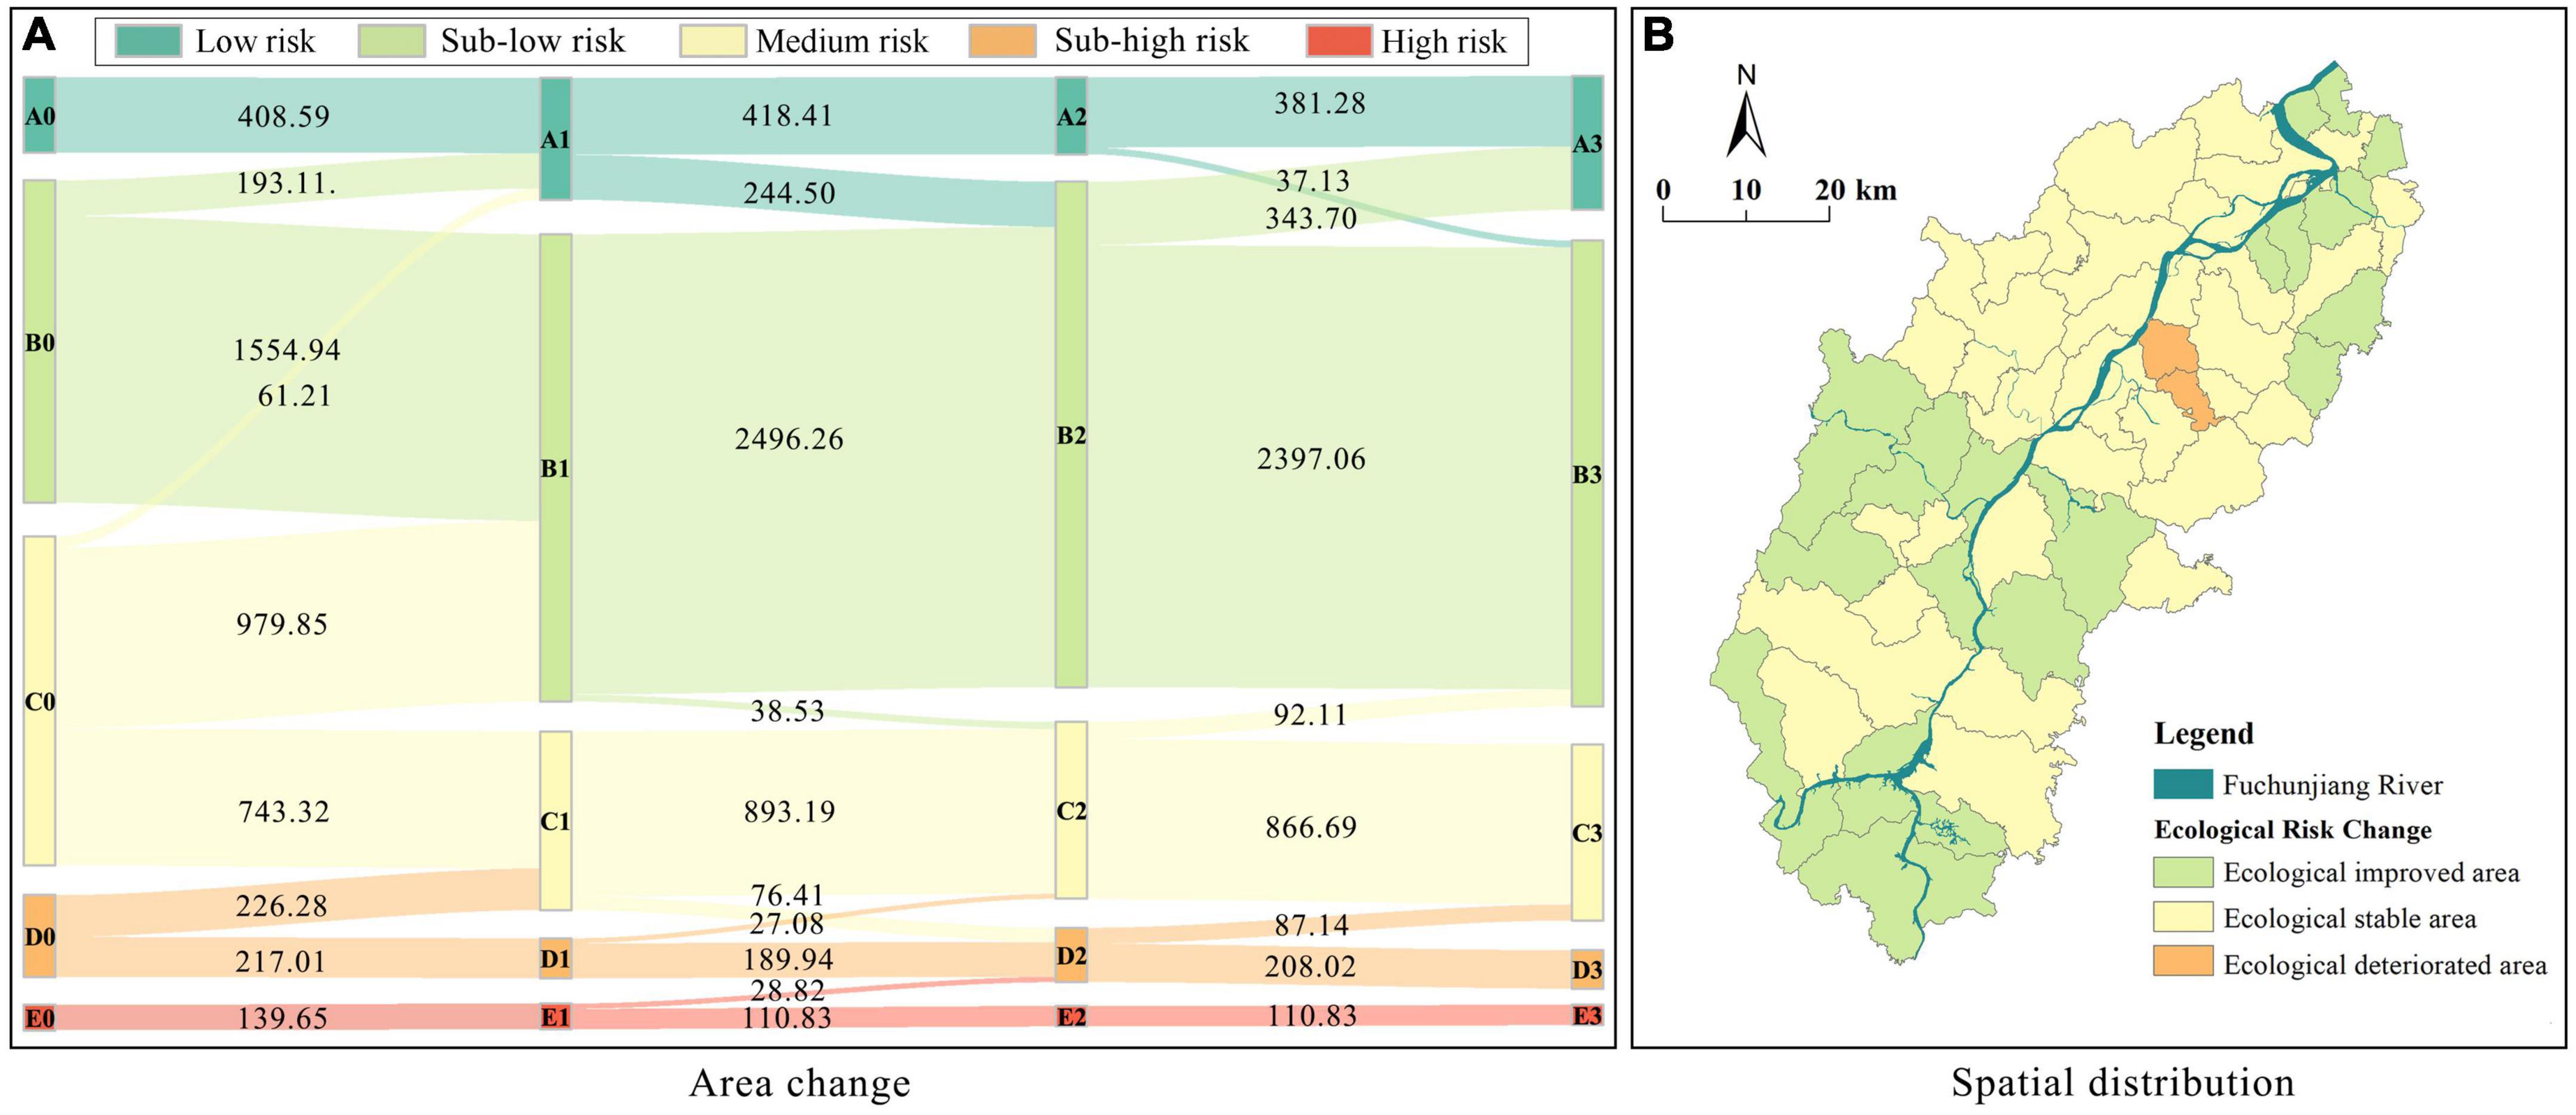
Figure 6. Area change and spatial distribution of landscape ecological risk shift areas in the Fuchunjiang River Basin from 1990 to 2020. (A) Area change. (B) Spatial distribution. A, B, C, D, and E represent low risk area, sub-low risk area, medium risk area, sub-high risk area, and high risk area, respectively. 0, 1, 2, and 3 represent 1990, 2000, 2010, and 2020, respectively, and the area unit in the figure is km2.
After analyzing the comprehensive transfer of ecological risk across townships over a 30-year period, the magnitude of change in landscape ecological risk was further explored over three time intervals (Figure 7). From 1990 to 2000, the change rate of risk in the study area was between 0 and −28.09%, with only two townships having a slightly elevated risk, both with growth rates below 1%. From 2000 to 2010, the number of townships with rising ecological risk increased significantly, mainly concentrated on the south bank of the Fuchunjiang River, and the risk grew at a faster rate, with the highest growth rate of 15.05%. From 2010 to 2020, the block with elevated risk shifted southward, forming two clusters in the north and south, but the growth rate decreased compared to the previous period, and the decline in risk became greater. In general, the growth rate of landscape ecological risk in the three stages showed a trend of increasing and then decreasing. The groups with high growth rates gradually moved south from the north, and the number of townships gradually increased.
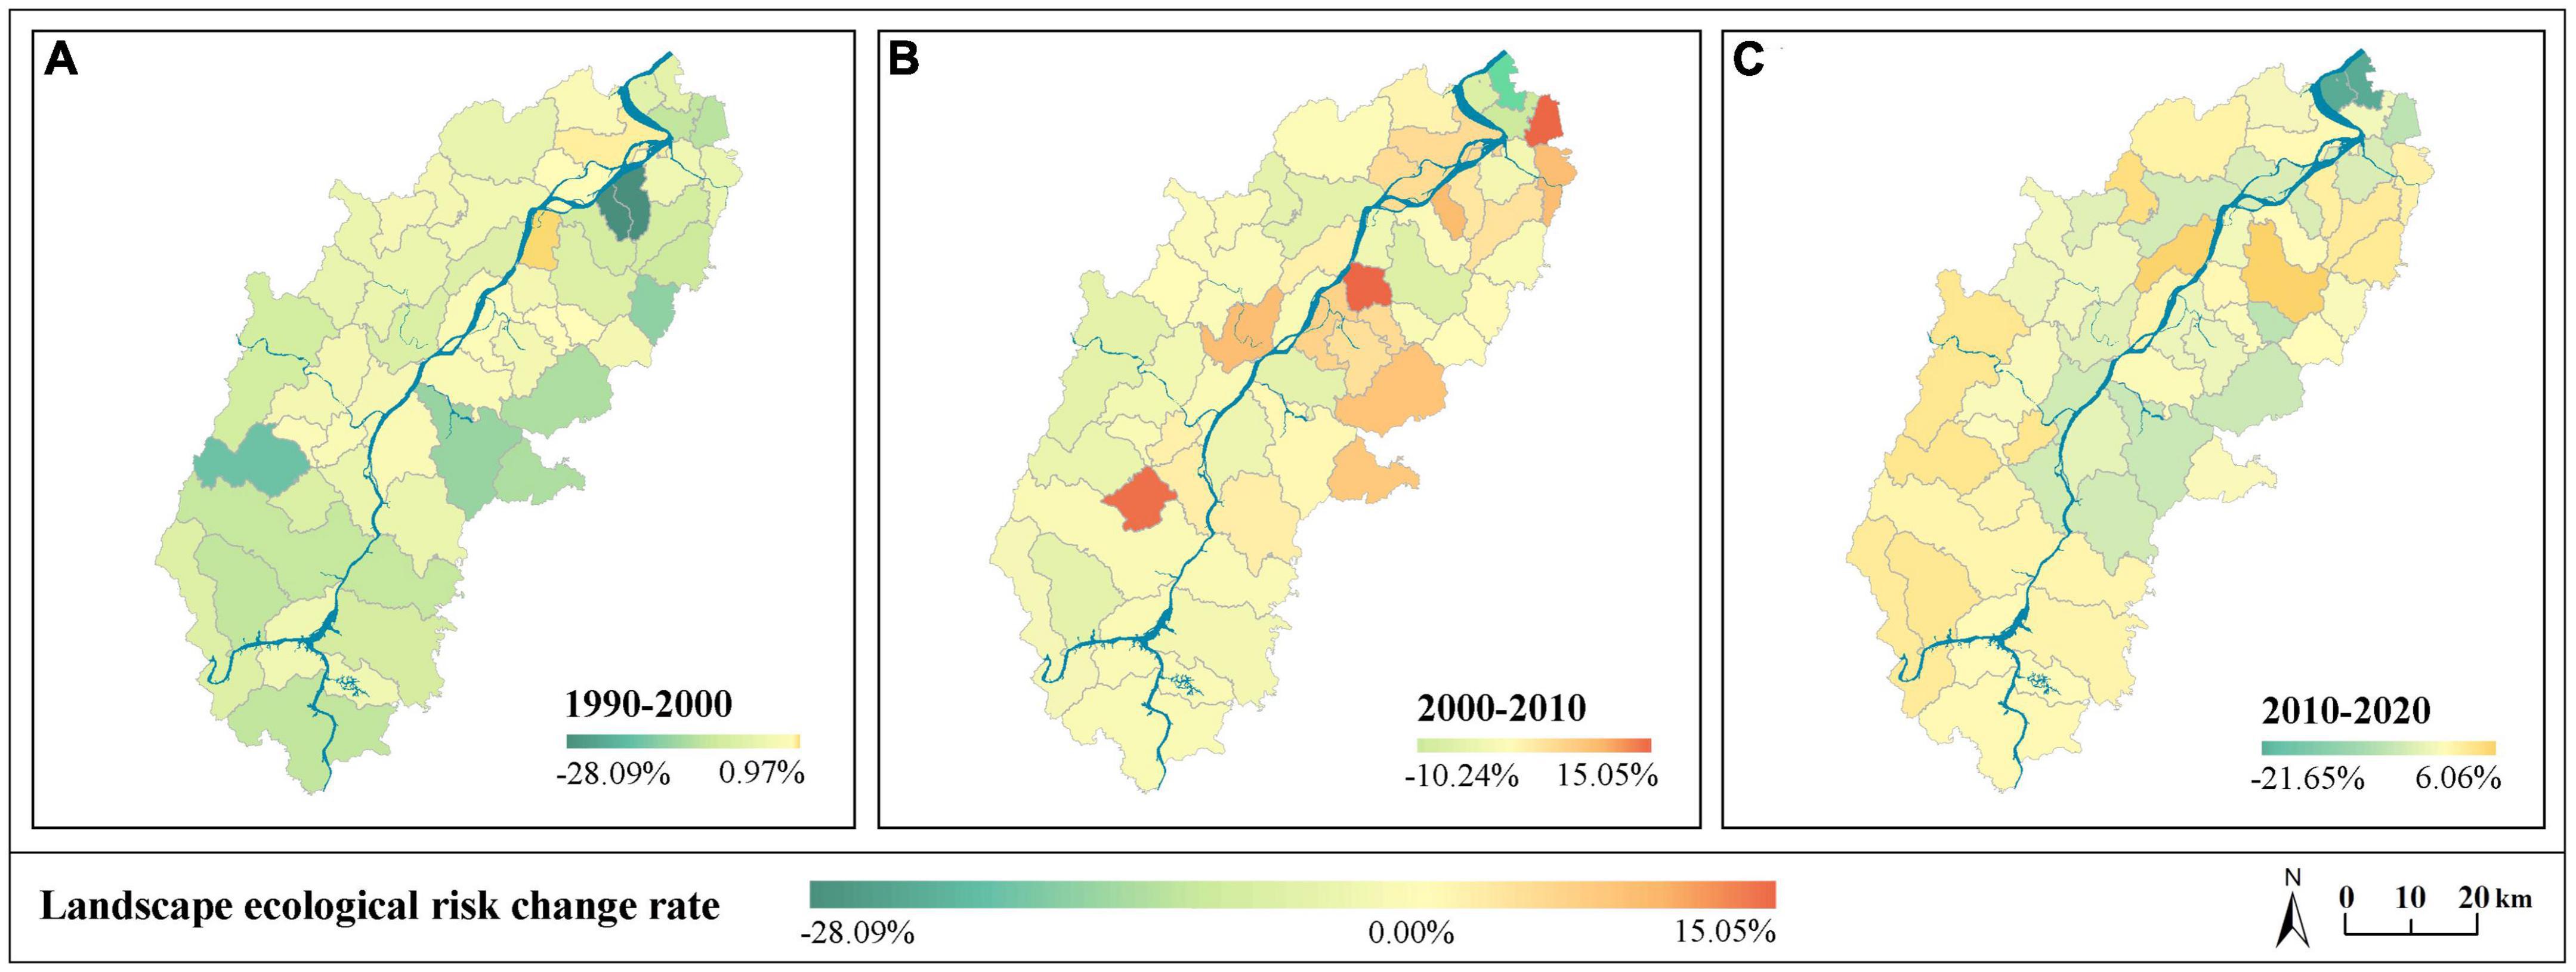
Figure 7. Change rate and spatial distribution of landscape ecological risk in the Fuchunjiang River Basin for (A) 1990–2000, (B) 2000–2010, and (C) 2010–2020.
Based on the spatial distribution of the landscape ERI in each township, the Global Moran’s I of landscape ecological risk in the Fuchunjiang River Basin from 1990 to 2020 was 0.5542, 0.5033, 0.4672, and 0.3561, respectively, and the Z scores were all greater than 1.96. During the study period, the landscape ERI in the Fuchunjiang River Basin showed significant spatial autocorrelation, i.e., townships with high or low landscape ecological risk values were clustered.
The Hot Spot Analysis (Getis-Ord Gi*) tool was used to further analyze the landscape ecological risk aggregation characteristics of the study area, which were divided into four categories according to the Z score: cold spot (Z score < −1.96), sub-cold spot: (−1.96 ≤ Z score < 0), sub-hot spot: (0 < Z score ≤ 1.96), and hot spot: (Z score > 1.96). Overall, the Fuchunjiang River was used as a dividing line to separate the cold and hot spot areas. The northern area of the Fuchunjiang River was dominated by hot spots and sub-hot spots, while the southern bank of the river was dominated by cold spots and sub-cold spots, which exhibited strong consistency with the spatial pattern of risk levels (Figure 8). The hot spot areas were mainly found in the more populous and economically developed northern area, with towns and subdistricts such as Wenyan, Zhuantang, and Shuangpu as the core to form a group. The sub-hot spot areas were mainly distributed in the northwest, located in the territory of Fuyang and Tonglu. The cold spot areas were distributed in the eastern area with high altitude and mainly forestland, with Shangguan, Huyuan, Changlv, and other townships as the core; the sub-cold spot areas were mainly located in the southern part within the Jiande area.
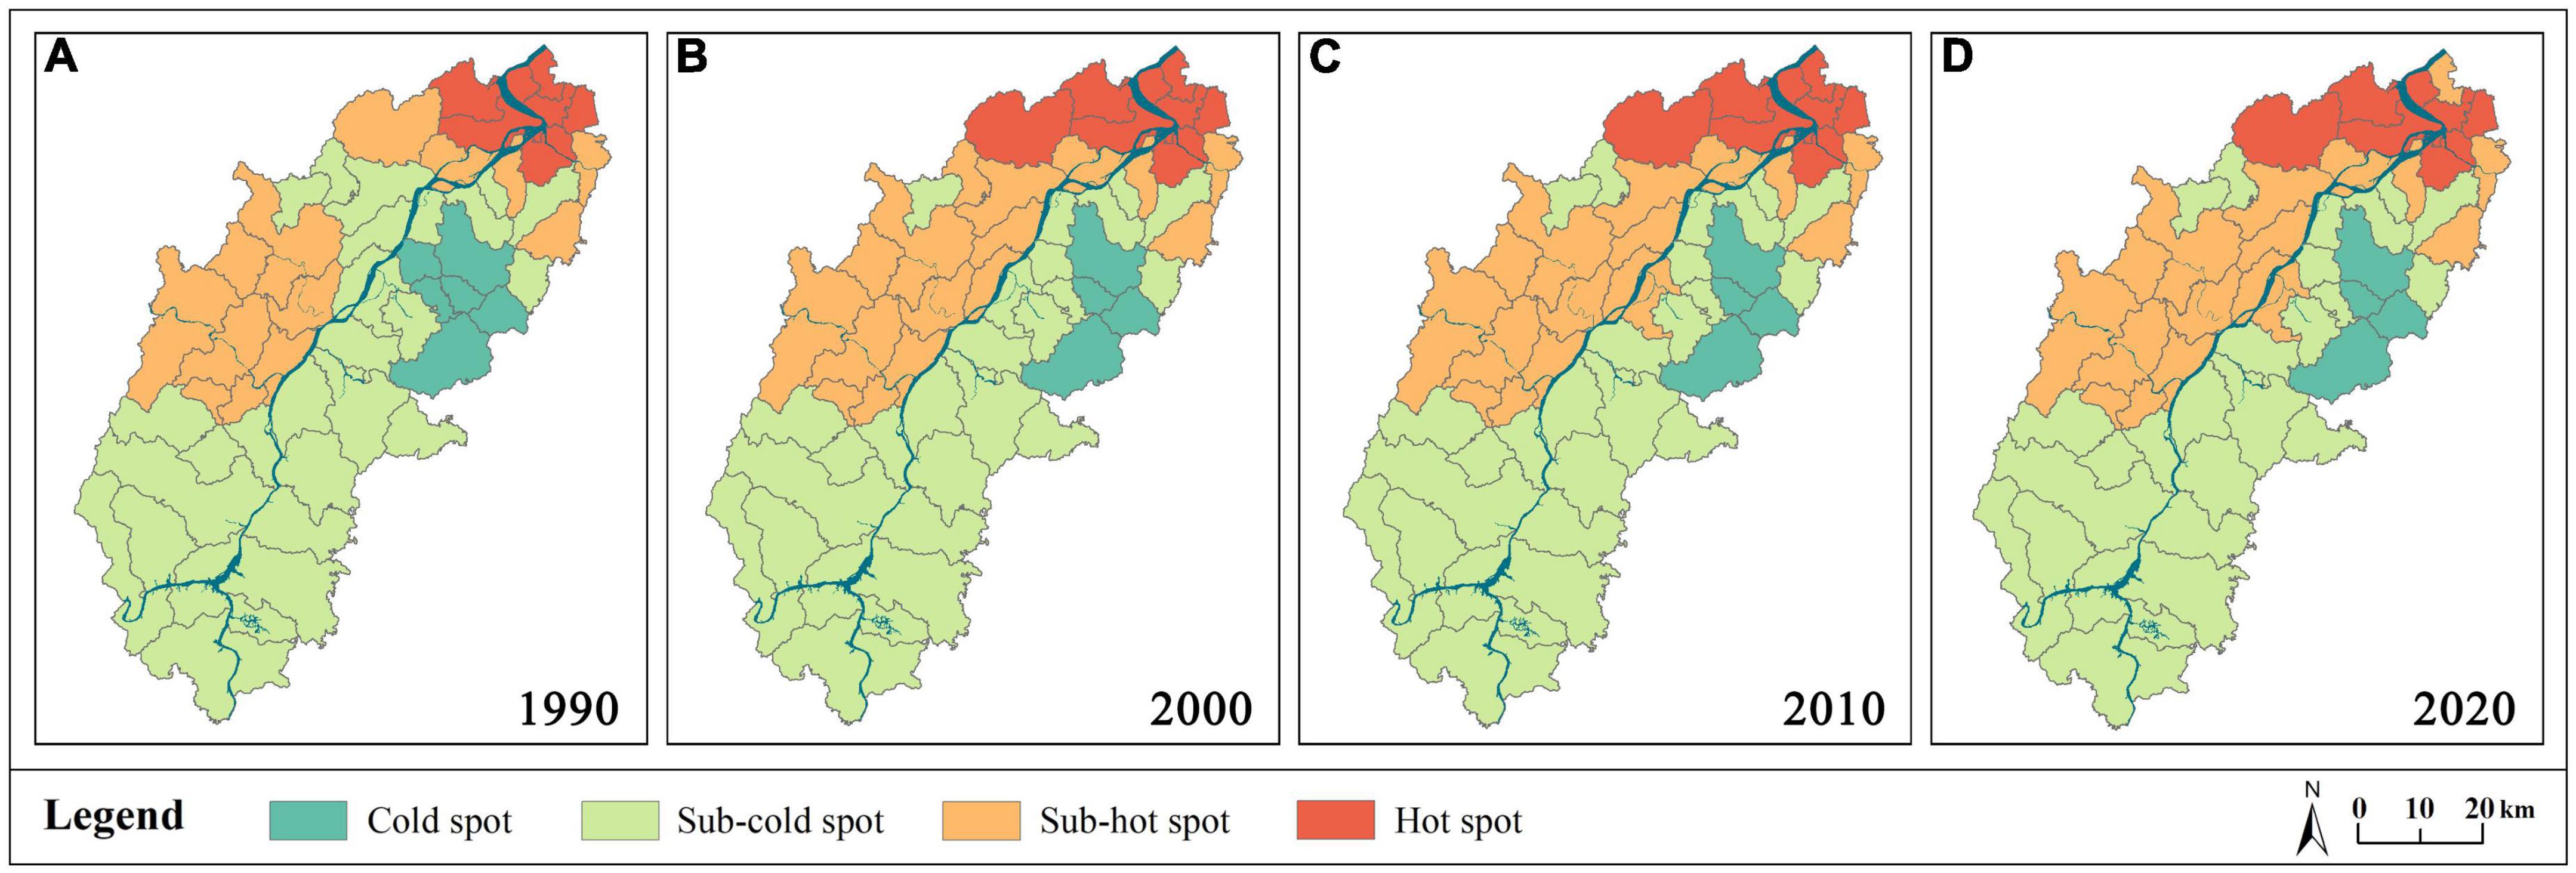
Figure 8. Spatial distribution of hot spots and cold spots in landscape ecological risk in the Fuchunjiang River Basin for (A) 1990, (B) 2000, (C) 2010, and (D) 2020.
Based on the results of previous studies and the field situation of the Fuchunjiang River Basin, a total of 12 static indicators in four categories of topography, socioeconomic, accessibility, and climate were selected to explore the main influencing factors of landscape ecological risk in 3 years, 2000, 2010, and 2020. The factor-detector tool of the geodetector was used to obtain the detection power (q-value) corresponding to each factor. The results showed that the explanatory power of each static influencing factor was from high to low: X8 > X7 > X10 > X5 > X9 > X11 > X1 > X12 > X2 > X4 > X6 > X3 (Figure 9A). The q-values of the human interference factor and the area of urban and rural residential land factor were both above 0.5, with average q-values of 0.74 and 0.55, respectively, which had a significant influence. Overall, the explanatory power of socioeconomic and accessibility factors was significantly higher than that of topography and climate factors. Among all the influencing factors, the explanatory power of human interference increased year by year. Except for the four factors of aspect, NDVI maximum, GDP, and the distance of each township from Hangzhou city, whose influence fluctuated upward with the year, all the other factors showed a decreasing trend. The explanatory power of the annual average temperature and total precipitation factors declined the fastest, decreasing by 63.89 and 26.43%, respectively, indicating that climate factors were becoming less influential on the landscape ecological risk.
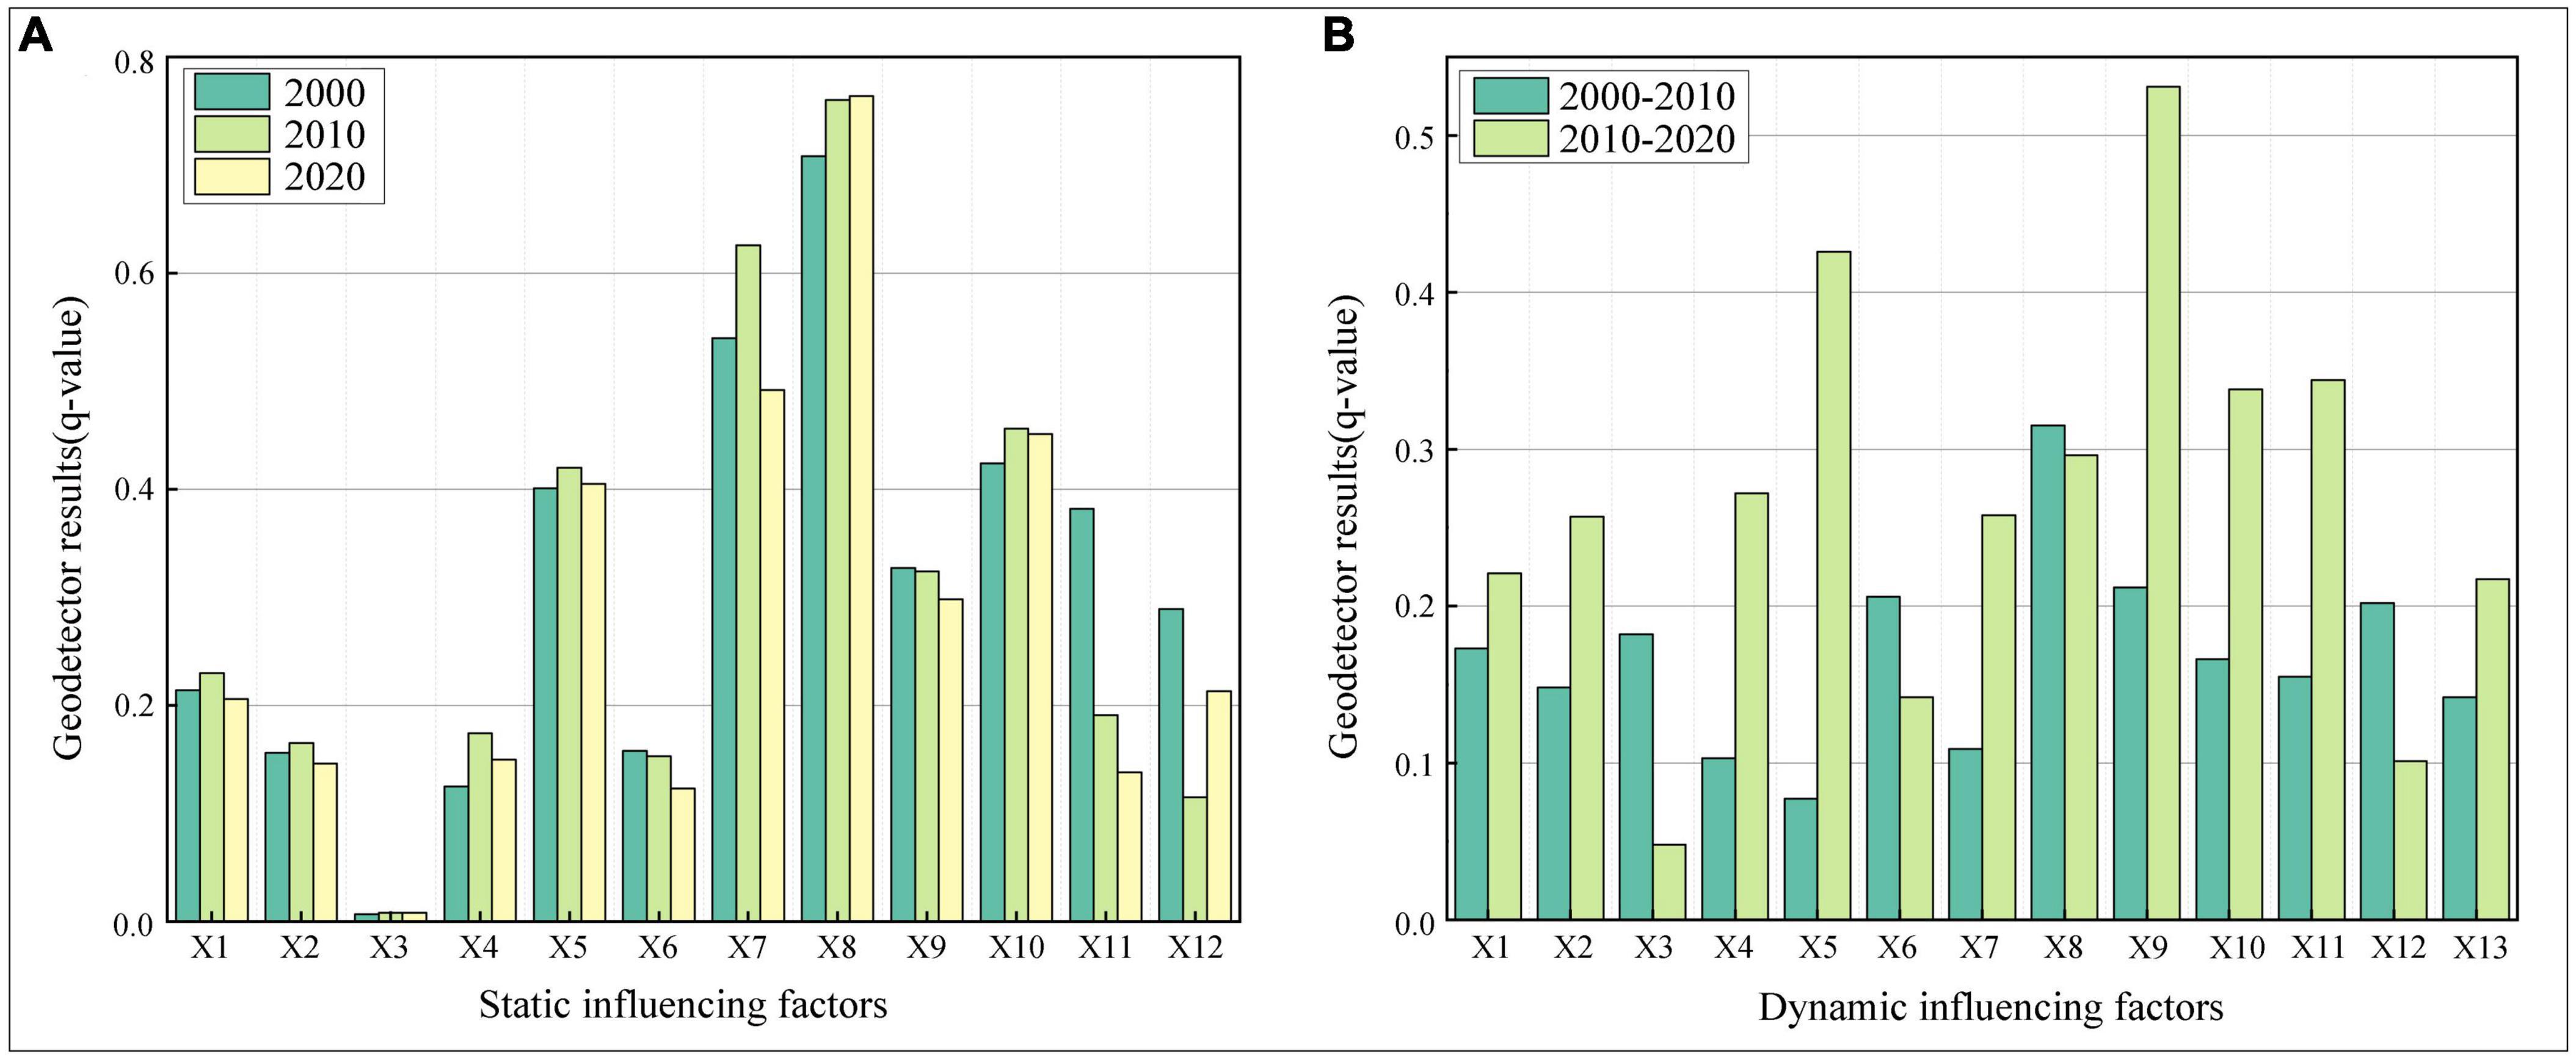
Figure 9. Geodetector results of static and dynamic influencing factors of landscape ecological risk in the Fuchunjiang River Basin from 2000 to 2020. (A) X1 elevation; X2, slope; X3, aspect; X4, NDVI maximum; X5, GDP; X6, population density; X7, area of urban and rural residential land; X8, human interference; X9, the distance of each township from the Fuchunjiang River; X10, the distance of each township from Hangzhou city; X11, annual average temperature; X12, annual total precipitation. (B) X1, dynamic attitude of urban and rural residential land area; X2, patch number of in-fill expansion mode; X3, patch number of marginal expansion mode; X4, patch number of enclave expansion mode; X5, patch area of in-fill expansion mode; X6, patch area of marginal expansion mode; X7, patch area of enclave expansion mode; X8, area of arable land transferred out; X9, area of arable land transferred in; X10, area of urban and rural residential land transferred out; X11, area of urban and rural residential land transferred in; X12, area of other construction lands transferred out; X13, area of other construction lands transferred in.
From the situation of urban and rural residential land expansion and land use transfer, a total of 13 dynamic indicators in three categories of land-use change metrics, expansion pattern of urban and rural residential land, and land-use transfer matrix were selected. The dynamic attitude of landscape ecological risk was considered the dependent variable, and two periods (from 2000 to 2010 and from 2010 to 2020) were defined for factor influence detection to obtain the corresponding q values. The results showed that the explanatory power of each dynamic influencing factor was in descending order: X9 > X8 > X10 > X5 > X11 > X2 > X1 > X4 > X7 > X13 > X6 > X12 > X3 (Figure 9B). The two factors of the area of arable land transferred out and the area of arable land transferred in were dominant, and the average explanatory power was above 0.3. Except for the factors of patch number of marginal expansion mode of urban and rural residential land, patch area of marginal expansion mode of urban and rural residential land, and the area of other construction lands transferred out which showed a decreasing trend, the explanatory power of all the other factors increased. The patch area of in-fill expansion mode of urban and rural residential land grew the fastest with a growth rate of 457.05%. In general, the influence of the land-use transfer matrix factors was generally more significant than that of the expansion pattern of urban and rural residential land and the land-use change metrics factors.
Shifts in landscape structure and function are often caused by LUCC, and landscape ecological risk is mainly generated based on the evolution of landscape patterns (Jiang et al., 2021). Therefore, this article constructs a close correlation between LUCC and landscape ecological risk using landscape pattern as a medium, and provides a theoretical approach for ecological risk assessment. It can be seen that the heterogeneity of land use largely determines the spatial heterogeneity of landscape ecological risk (Chen C. et al., 2019; Jiang et al., 2020).
The spatial distribution of landscape ecological risk in the Fuchunjiang River Basin from 1990 to 2020 showed significant heterogeneity, forming a spatial pattern of “high in the northwest and low in the southeast.” The townships with high risk were mainly concentrated in the northwestern part of the study area, which was the downstream region of the Fuchunjiang River Basin, while the townships with low risk were distributed in the southeastern region (Figure 4). The spatial differences in landscape ecological risk between the northwest and southeast were mainly related to the economic development, policy guidance, and natural attributes of the suburban areas of Hangzhou city (Karimian et al., 2022). Compared with the southeast, the northwest part, which was closer to the central area of Hangzhou, was an area of concentrated population and developed economy, where high-intensity industrial activities and accelerating urbanization put great pressure on the regional ecosystems and increased the local ecological risk (Karimian et al., 2022). This result was generally consistent with the previous study’s results (Zhou et al., 2022). In contrast, the southeastern part of the study area had significantly less human disturbance to the environment due to the overall high elevation (Figure 1). There were several national forest parks in and around the area, such as Qiandao Lake, Dachishan, and the Fuchunjiang River, with high vegetation coverage (Figure 2). These factors were conducive to maintaining the natural landscape and ecological vitality (Lu et al., 2020), and thus, the ecological risk in the region was generally low. The spatial autocorrelation analysis results of ecological risk also showed the same distribution characteristics: The Fuchunjiang River was a dividing line to separate the cold and hot spot areas. The northern area of the Fuchunjiang River was dominated by hot spots and sub-hot spots, while the southern bank of the river was dominated by cold spots and sub-cold spots (Figure 8). This suggested that the distribution of regional geographical elements would affect the spatial heterogeneity of ecological risks (Lin et al., 2019); for example, the Fuchunjiang River as a natural geographical barrier objectively limited the spread of ecological risks from the north to the south bank. In conclusion, the spatial heterogeneity characteristics of landscape ecological risk in the Fuchunjiang River Basin were also corroborated by many previous studies on the ecological environment assessment in the Hangzhou area (Li et al., 2021; Zhang et al., 2023). It is the spatial heterogeneity of landscape ecological risk in the study area that requires decision makers to develop targeted management strategies for different blocks (Lu et al., 2020) to reduce risks in the area or prevent new risks from arising.
From 1990 to 2020, the evolution of ecological risk in the Fuchunjiang River Basin over time showed a trend of “changes dramatically in short time scales and declines in long time scales” at both the basin and township scales. At the basin level, with the reduction in medium, sub-high and high risk areas (from 52.33 to 28.14%, Figure 5), the overall landscape ecological risk of the Fuchunjiang River Basin showed a downward trend during the study period, with an overall decrease of 7.75%. By stage, the magnitude of the decrease in the overall ecological risk became progressively smaller in the three time intervals, especially between 2010 and 2020, in which it remained almost constant (only 0.83%). This time-scale feature was consistent with the study of Guo et al. (2022). Combined with studies of Zhou et al. (2022) and Fu et al. (2022) on environmental optimization and policy protection in the Hangzhou area, it can be seen that this phenomenon was mainly attributed to the fact that after 2000, under the interaction of the urbanization process and ecological protection policies in Hangzhou, the disturbance and restoration of the ecosystems tended to balance and gradually reached a stable state (Ma et al., 2019). From the township perspective, the landscape ecological risk maintained a decreasing trend generally during the study period. There were 17 townships with declining ecological risk levels, accounting for 37.88% of the total area of the study area, while there were only 2 townships whose ecological risk levels increased, accounting for 1.46% of the total area of the study area (Figure 6). On this basis, further analysis of the change rate in landscape ecological risk in each township during the three time periods (Figure 7) revealed that more than 40% of the townships had increasing ecological risk in two time periods from 2000 to 2010 and 2010 to 2020, with a maximum growth rate of 15.05%. This result was in agreement with the study of Shen et al. (2023) on the plateau scale. It is likely that the averaging effect at long-time scales (DeFries et al., 2010) made changes in landscape ecological risk at short-time scales appear relatively drastic. Overall, there was a decreasing trend in landscape ecological risk at both the basin and township levels over long time scales. This finding was inextricably linked to the “three rivers and two banks” ecological landscape protection and construction project implemented by the Hangzhou Government (Wang, 2014): Since 2010, the Hangzhou Government has invested approximately US$445 million in this project, completing 58 km2 of forest-nurturing projects and 204 km of forest ecological landscape green belts, as well as a series of water pollution remediation and greenway construction projects, which have contributed significantly to the environmental improvement of the Fuchunjiang River Basin. However, studies on ecological risk in areas of plateau and opencast coal mine have shown a rising trend in landscape ecological risk with economic development (Xu et al., 2021; Li et al., 2022), differing significantly from the results of this study, which might be more related to economic inputs. The improvement of ecological risks requires significant government investment. Thus, in the process of ecological risk control, many regions face a trade-off between improving ecological risks and economic investment.
Among the static impact factors, socioeconomic factors were considered the dominant influencing factors on the landscape ecological risk in the Fuchunjiang River Basin (Figure 9A), especially the human interference and GDP factors, with strong explanatory power. This result has been corroborated by a large number of studies (Ai et al., 2022; Karimian et al., 2022; Shi et al., 2022). However, this study found that natural factors such as topography and climate had less influence on ecological risks in the study area and exhibited a decreasing trend, which was quite different from the results of some studies for particular topographic areas (Hou et al., 2020; Wang et al., 2021). A primary reason was that in rapidly urbanizing areas, the active socioeconomic factors had a greater impact on landscape ecological risk than natural factors. It can be seen that the dominant driving factors of landscape ecological risk could change significantly with changes in the study area’s location, social environment, and other factors. Among the dynamic impact factors, the influence of land use transfer factors was generally greater than that of other factors (Figure 9B). The transfer intensity of arable land and urban and rural residential land, as areas with frequent human activities, had the greatest impact on landscape ecological risk, which further confirmed the findings of Zhang S. et al. (2022) and Li W. et al. (2020). Accurate identification of the dominant influencing factors of landscape ecological risk was the basis for carrying out targeted risk management, making it possible to prevent and control ecological risks.
To explore the association between economic development and ecological risk, the representative socioeconomic factor GDP was selected for coupling analysis with landscape ecological risk (Figure 10). The average value of landscape ecological risk in 2000 and 2010 fluctuated upward with the increase in the GDP of townships, indicating that the ecological environment was damaged to a deeper extent with socioeconomic development. The average value of landscape ecological risk in 2020 showed an inverted U-shaped relationship with the GDP of townships. The landscape ecological risk gradually increased with the increase of GDP at the beginning; after the discrete value of GDP reached 17 (US$29.2 million–122.7 million/km2), the increase of GDP led to a decrease of ecological risk, which confirmed that the environmental Kuznets curve (EKC) might have the same applicability in ecological risk management. However, the GDP of townships in 2000 and 2010 had not yet reached the tipping point, so their landscape ecological risks were still in a state of fluctuating increase. The figure shows that the landscape ecological risk corresponding to the same discrete value of GDP decreased as the year increased, and the area enclosed by the inverted “U” curve also decreased, which was similar to the results of empirical studies of the Kuznets curve between environmental pollution and economic development at the micro level (Chen X. et al., 2019; Yu et al., 2022). This could be due to the rapid development of the social economy promoting the change in urban industrial structure, and the unit output of the service and high-tech industries had less impact on the environment (Hamann et al., 2015). At the same time, comparing the study of the “economy-ecology” relationship by Leal and Marques (2022) and Yuan et al. (2022), it can be seen that the early experience of environmental problems management, the development of new technology, and the role of government policy guidance will also make environmental restoration costs lower and time shorter in the context of rapid economic development.
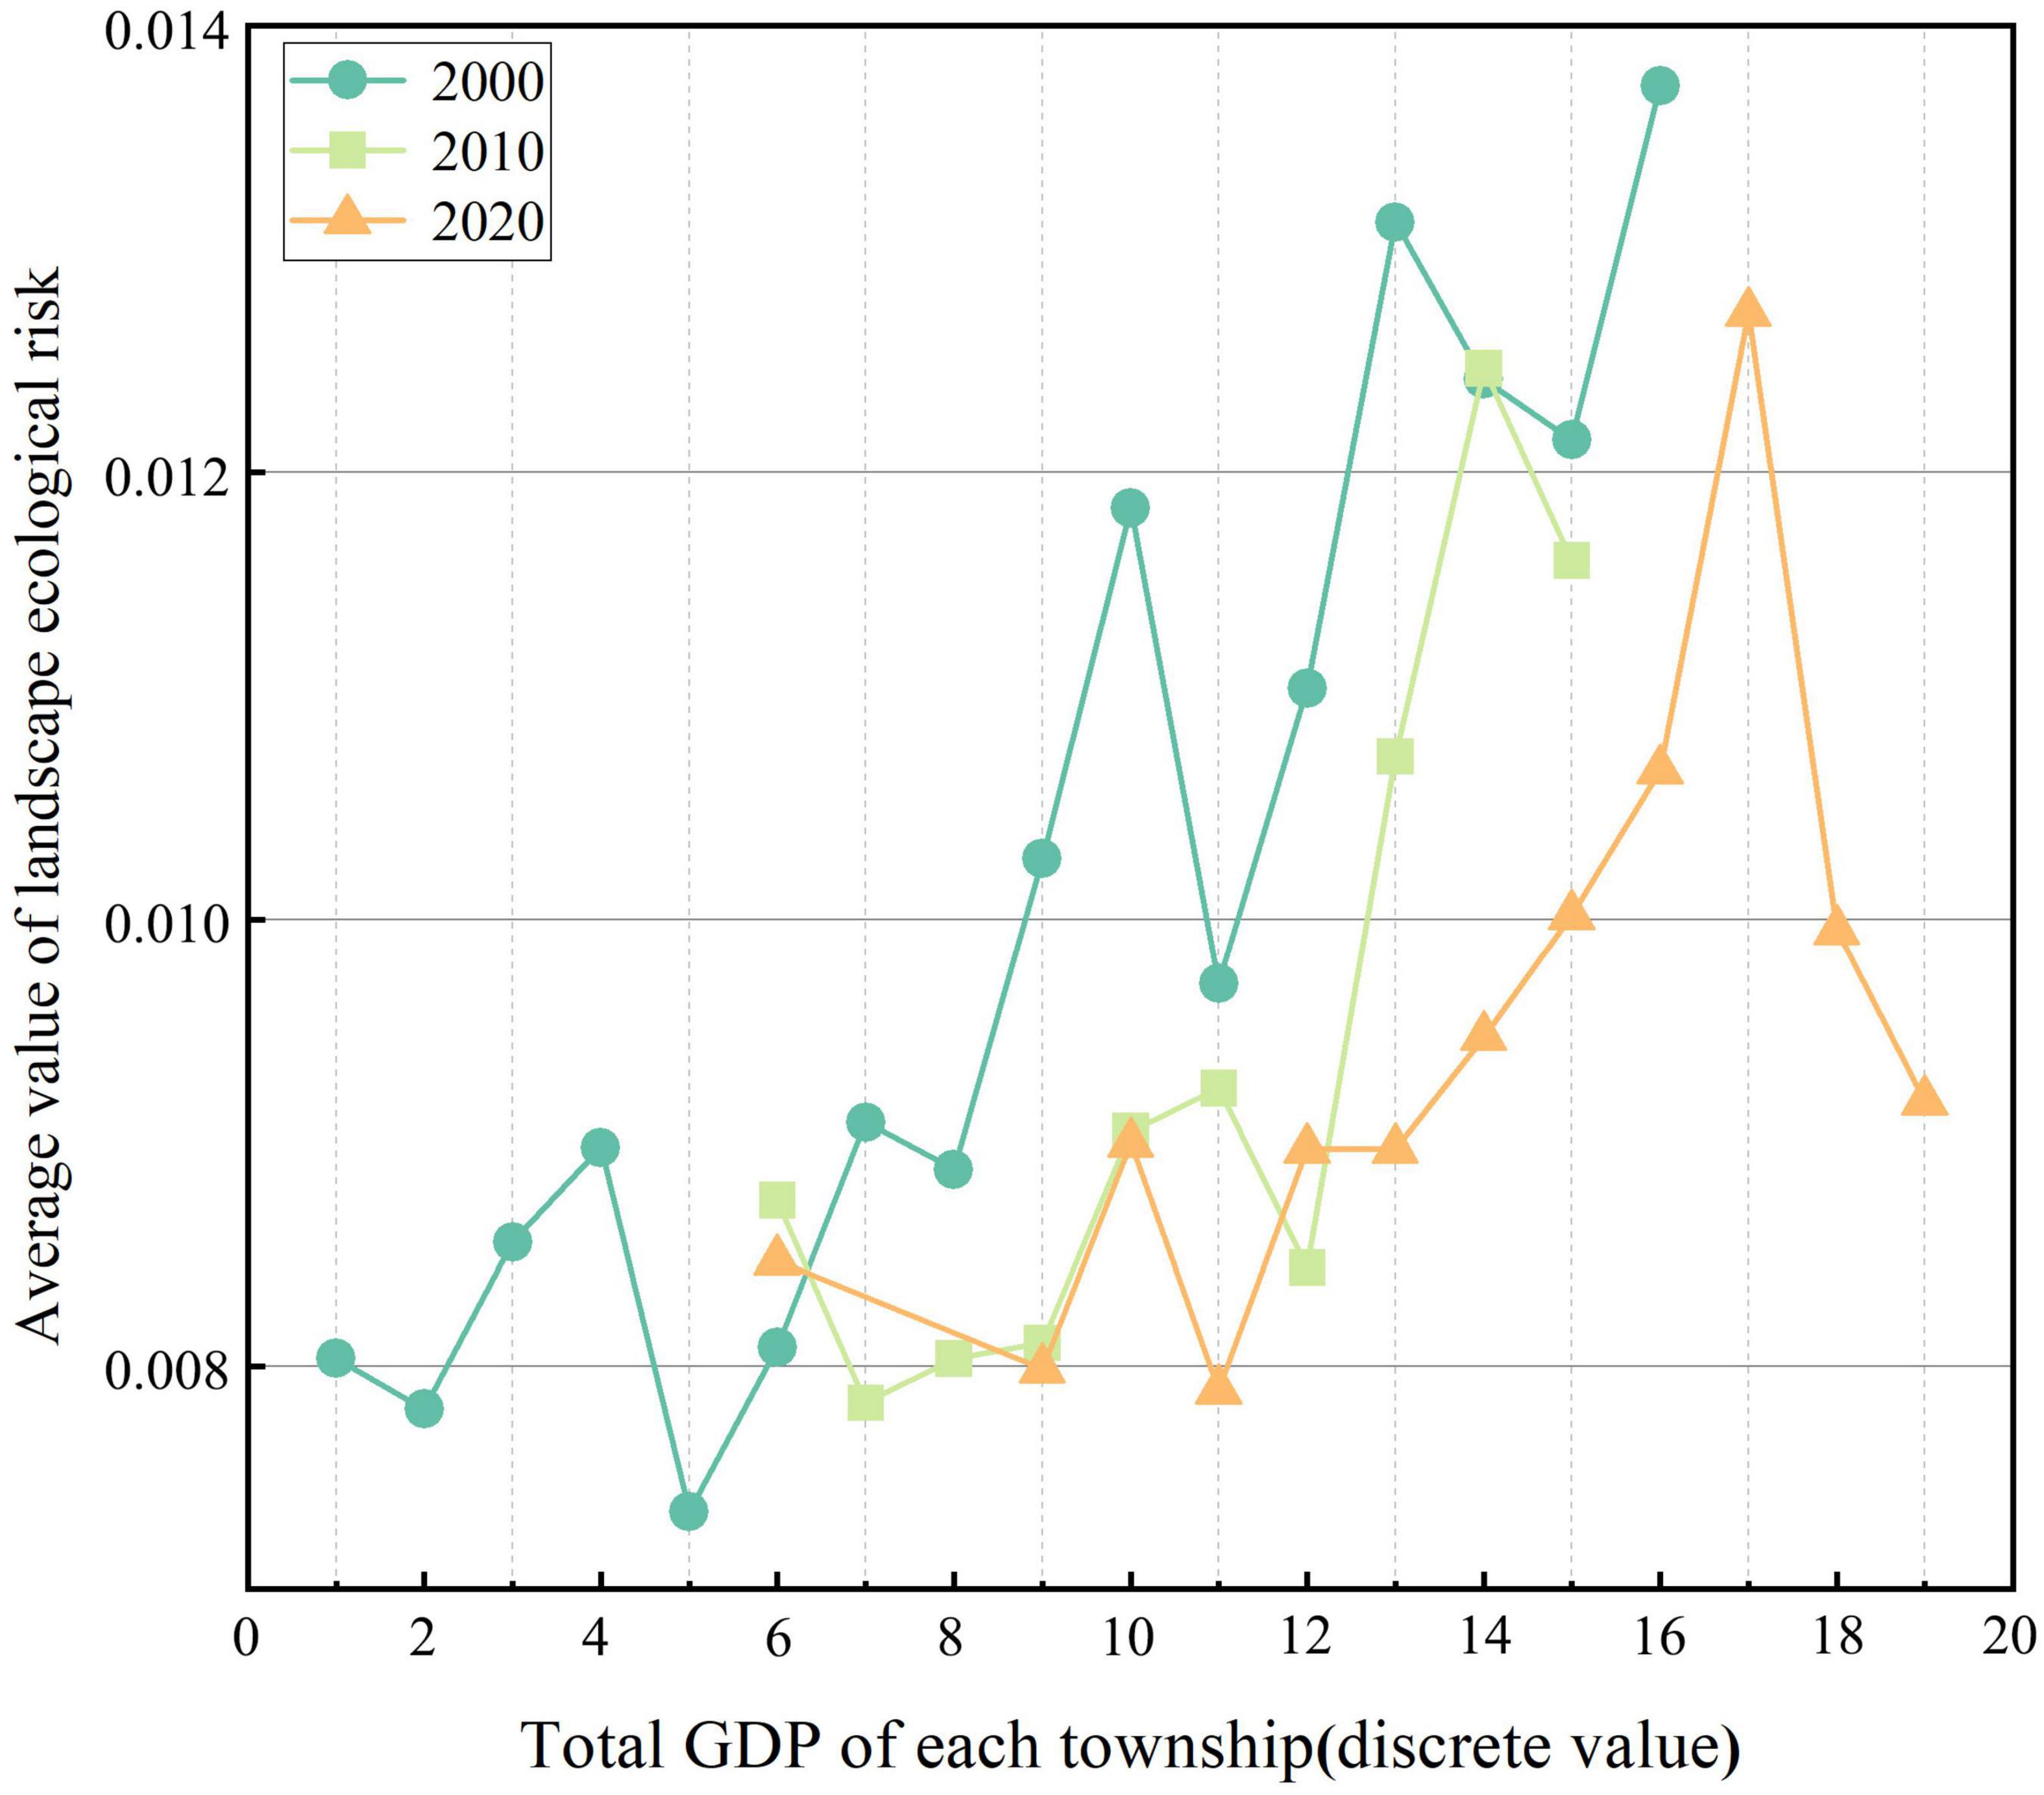
Figure 10. Coupling relationship between the average value of landscape ecological risk and the GDP of townships.
Many processes and functions of ecosystems are scale dependent, and in this study, landscape ecological risk was also found to be scale-dependent at the spatial level. During the period from 2000 to 2020, some townships experienced a significant increase in landscape ecological risk (Figure 7), but the overall ecological risk of the basin remained on a downward trend (Figure 4). This means that the increase in ecological risk in local small-scale areas did not definitely lead to the reduction in overall large-scale regional ecological safety. Similar results have been verified in studies on ecosystem services. Ecosystem services for which trade-offs exist at small scales behave synergistically on larger spatial scales (Yang et al., 2015).
In this context, while designating the overall management and control scheme of the basin, it is also indispensable to implement differentiated ecological risk management according to the main functions of different agglomerations. Therefore, to scientifically maintain the ecological security in the suburban areas of Hangzhou city, the Fuchunjiang River Basin was divided into key control area, strict control area, and general control area of landscape ecological risk (Figure 11) based on the findings of this study. The following control strategies are proposed according to the divided blocks:
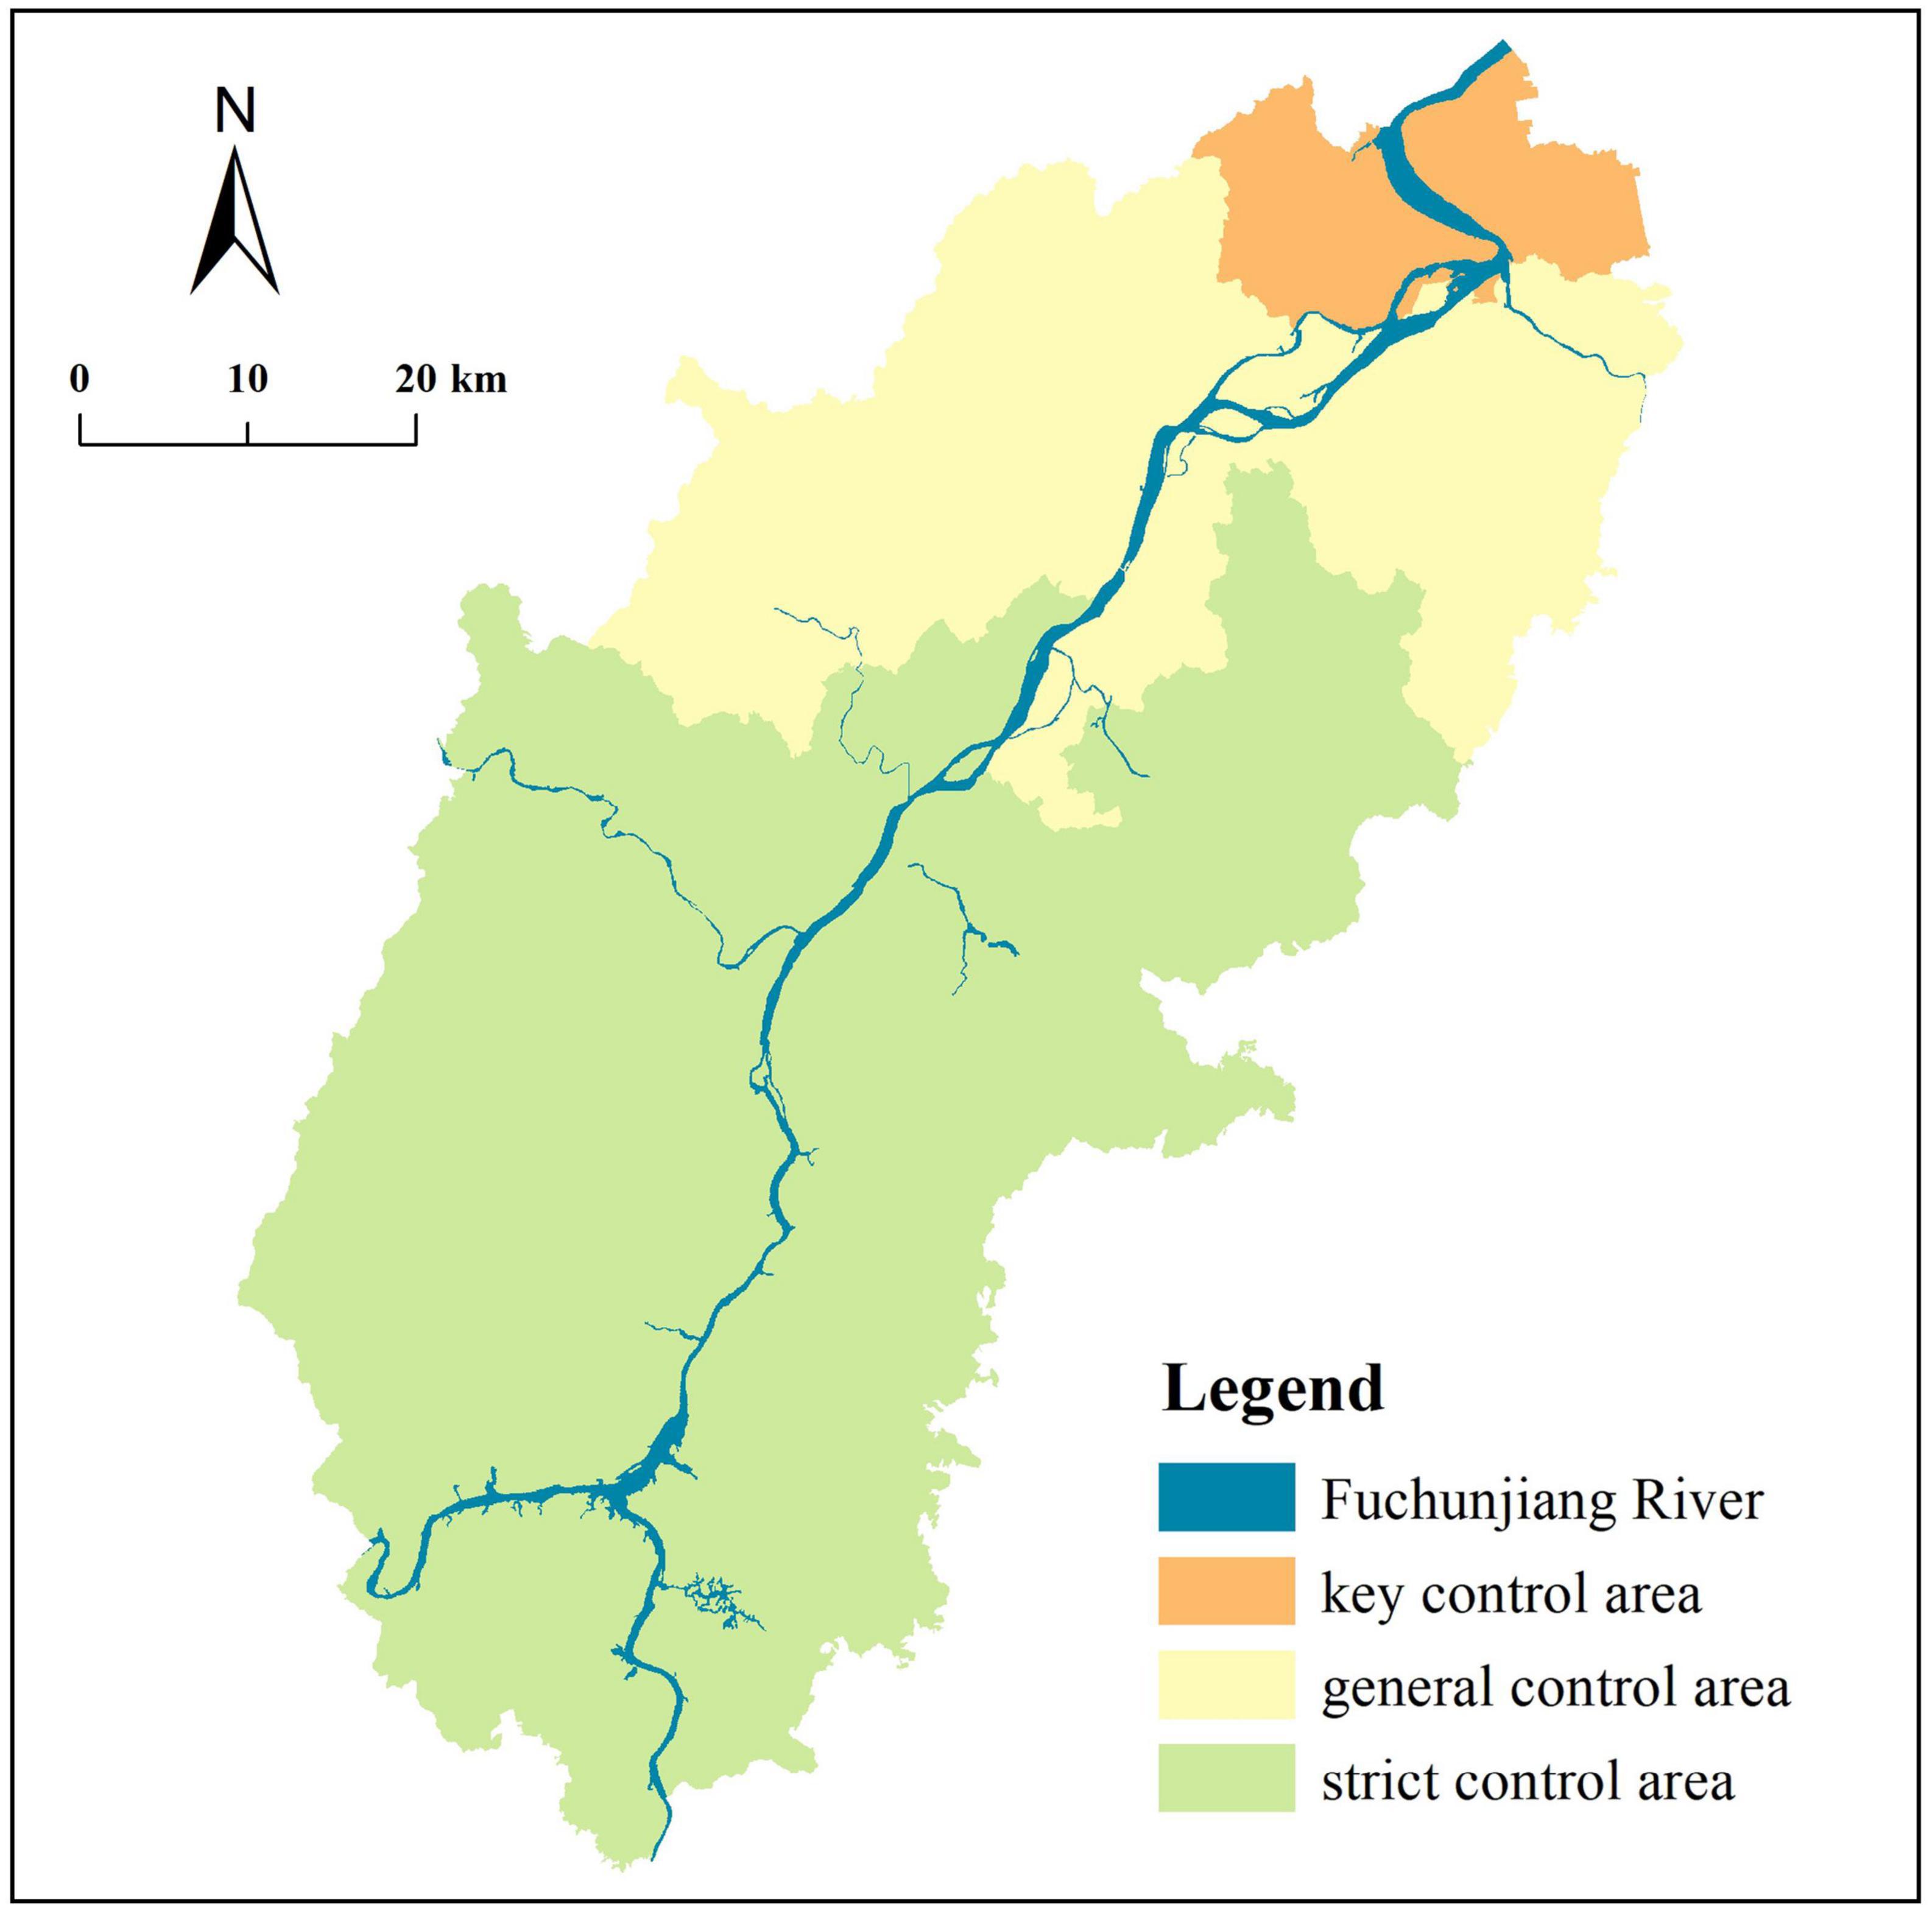
Figure 11. Zoning control map of landscape ecological risk in the Fuchunjiang River Basin.
This area mainly contains sub-high and high ecological risk areas, which is in the downstream areas of the Fuchunjiang River Basin with a dense economy and population and undertakes a crucial regional development function. If conventional control methods such as strict land use restrictions are still used to reduce regional ecological risks (Liang et al., 2022), it will inevitably reduce the living space for human beings. Therefore, compared to the studies of Ran et al. (2022) and Lu et al. (2020), such regions should adopt economic tools such as promoting benign iterations of industrial structure and increasing ecological compensation investment for ecological restoration, while land control should still be aimed at ensuring the living space necessary for the growing population, optimizing the land use structure, increasing infrastructure development, and significantly improving human welfare.
This area is mainly located in the southeastern part of the study area and contains sub-low and low ecological risk areas, with an excellent natural substrate and low human disturbance. Wang et al. (2021) pointed out that such areas were key areas for controlling ecological security and stability. Therefore, such regions need managers to change the development mindset, incorporate risk prevention and control into regional development planning, and play a vital role in safeguarding the overall stability of landscape ecological risk in the Fuchunjiang River Basin by reasonably delineating ecological protection red lines, strictly limiting human activities in ecological conservation areas (Melnykovych et al., 2018), and regulating regional development and construction (Karimian et al., 2022).
This area mainly contains the medium ecological risk areas in the middle reaches of the basin, which is strongly radiated by Hangzhou’s economy and has frequent risk transitions (Cui et al., 2018). Appropriate policy guidance and financial support (Zhang et al., 2020) can be provided to strengthen the optimization and integration of construction land, restore the damaged ecological environment, improve ecosystem stability, and avoid the transformation from medium risk to high risk.
The spatial and temporal evolutionary characteristics and the dominant influencing factors of landscape ecological risk in the Fuchunjiang River Basin on long time scales were explored in this study. The results can not only be an inspiration for ecological assessment and policy-making in other regions that are experiencing rapid urbanization in the world, but also provide a model case for exploring the quantitative relationship between economic development and ecological conservation in regions that are in the late-stage of development. However, limited by the methodology and data availability, this study still had some limitations.
First, due to the difficulty of obtaining the early data of impact factors, only data after 2000 were included for analysis, and the correspondence between the year of data and the year of study needs to be further improved.
Second, the scale of this study is relatively singular. At the temporal level, only 4 years were selected for analysis, with a long time span; at the spatial level, the township was considered as the smallest assessment unit, and no multi-scale spatial validation was performed. It cannot be assumed that the results would remain stable after cross-scale deduction. Therefore, follow-up should continue to strengthen comprehensive multi-scale research to enhance the scientific validity of the results (Li W. et al., 2020).
Third, there is less research on EKC based on ecological risk. This article only makes a preliminary exploration of EKC between landscape ecological risk and GDP, and further theoretical or practical verification should be strengthened in the future to explore the applicability of EKC in the field of ecological risk.
Fourth, a detailed analysis of landscape ecological risk for the period from 1990 to 2020 was explored in this study. However, to better apply the assessment results to decision-making and local management, land use simulations can also be conducted by combining FLUS, PLUS, and CLUE-S models to carry out landscape ecological risk prediction studies in the future (Gao et al., 2022).
Fifth, although landscape ecological risk assessment methods based on landscape patterns have been widely used, their evaluation endpoints are still unclear (Gong et al., 2021), creating a challenge for implementing the assessment results at the specific decision-making level. Therefore, using an analytical approach that overlays ecosystem service with landscape ecological risk, introducing ecosystem services as an evaluation endpoint into ecological risk assessment will be the focus of subsequent research (Munns et al., 2016), which can provide effective interactive spatial information for adaptive landscape management, thus providing a more solid theoretical and methodological basis for improving human wellbeing.
Based on the land use data of the Fuchunjiang River Basin for four periods from 1990 to 2020, a study on the spatiotemporal variation pattern of landscape ecological risk and its influencing factors of the basin in the suburban area of large cities was carried out, with the following conclusions:
(1) During the study period, the area of various land use types changed considerably and the landscape pattern showed a general trend of increasing agglomeration degree and decreasing loss index.
(2) The landscape ecological risk in the Fuchunjiang River Basin showed a spatial pattern of “high in the northwest and low in the southeast,” with high and low values clustering on the north and south sides of the Fuchunjiang River, respectively. During the study period, the overall landscape ecological risk of the basin declined continuously, but the magnitude of the decrease became smaller in three time intervals; the ecological risk level of townships mainly shifted from high-risk to low-risk levels, but more than 40% of townships were of increased risk during 2000–2020. It can be seen that rapid economic development has contributed to the reduction of landscape ecological risk in the basin, and the ecological environment has been restored with economic inputs to some extent. Thus, in the process of ecological risk control, many regions face a trade-off between improving ecological risks and economic investment.
(3) Among all the influencing factors, socioeconomic and land use transfer category factors had the strongest explanatory power on landscape ecological risk and its changes. GDP, human interference, area of urban and rural residential land, area of arable land transferred in, and area of arable land transferred out were the dominant influencing factors. Accurate identification of the dominant influencing factors of landscape ecological risk is the basis for carrying out targeted risk management, making it possible to prevent and control ecological risks.
(4) Coupling landscape ecological risk with GDP, it can be found that the relationship between landscape ecological risk and GDP in 2020 presented as an inverted U-shaped curve. The landscape ecological risk gradually increased with the increase in GDP at the beginning, and after reaching a tipping point, increases in GDP led to decreases in ecological risk. This result suggests that the EKC might have the same applicability in ecological risk management. Therefore, it is theoretically possible to manage ecological risks within the safety boundary through appropriate management policies.
(5) According to the main functions of different ecological risk gathering areas, the Fuchunjiang River Basin was divided into key control area, strict control area and general control area, and targeted risk control strategies were proposed in each area. This can be connected with the subsequent territorial spatial planning and help to clarify the development direction and the core focus of ecological management in the Fuchunjiang River Basin in the future.
The raw data supporting the conclusions of this article will be made available by the authors, without undue reservation.
XC and YZ contributed to the conceptualization, methodology, and writing—original draft. GY and WN processed and analyzed the data. YW and JW conducted the investigation and preliminary analysis. BX edited and revised the manuscript, and provided project management support. All authors contributed to manuscript revision, read, and approved the submitted version.
This research was financially supported by the Zhejiang Province Key Research and Development Project under Grant No. 2019C02023.
The authors declare that the research was conducted in the absence of any commercial or financial relationships that could be construed as a potential conflict of interest.
All claims expressed in this article are solely those of the authors and do not necessarily represent those of their affiliated organizations, or those of the publisher, the editors and the reviewers. Any product that may be evaluated in this article, or claim that may be made by its manufacturer, is not guaranteed or endorsed by the publisher.
Ai, J., Yu, K., Zeng, Z., Yang, L., Liu, Y., and Liu, J. (2022). Assessing the dynamic landscape ecological risk and its driving forces in an island city based on optimal spatial scales: Haitan Island, China. Ecol. Indic. 137:108771. doi: 10.1016/j.ecolind.2022.108771
Baffoe, G., and Matsuda, H. (2018). A perception based estimation of the ecological impacts of livelihood activities: The case of rural Ghana. Ecol. Indic. 93, 424–433. doi: 10.1016/j.ecolind.2018.04.074
Bai, Y., Jiang, B., Alatalo, J. M., Zhuang, C., Wang, X., Cui, L., et al. (2016). Impacts of land management on ecosystem service delivery in the Baiyangdian river basin. Environ. Earth Sci. 75:258. doi: 10.1007/s12665-015-4831-7
Bamrungkhul, S., and Tanaka, T. (2022). The assessment of land suitability for urban development in the anticipated rapid urbanization area from the Belt and Road Initiative: A case study of Nong Khai City, Thailand. Sustain. Cities Soc. 83:103988. doi: 10.1016/j.scs.2022.103988
Barnthouse, L. W., Suter Ii, G. W., Rosen, A. E., and Beauchamp, J. J. (1987). Estimating responses of fish populations to toxic contaminants. Environ. Toxicol. Chem. 6, 811–824. doi: 10.1002/etc.5620061010
Benti, S., Terefe, H., and Callo-Concha, D. (2022). Implications of overlooked drivers in Ethiopia’s urbanization: Curbing the curse of spontaneous urban development for future emerging towns. Heliyon 8:e10997. doi: 10.1016/j.heliyon.2022.e10997
Bhattachan, A., Emanuel, R. E., Ardón, M., Bernhardt, E. S., Anderson, S. M., Stillwagon, M. G., et al. (2018). Evaluating the effects of land-use change and future climate change on vulnerability of coastal landscapes to saltwater intrusion. Elementa 6:62. doi: 10.1525/elementa.316
Bryan, B. A., Gao, L., Ye, Y., Sun, X., Connor, J. D., Crossman, N. D., et al. (2018). China’s response to a national land-system sustainability emergency. Nature 559, 193–204. doi: 10.1038/s41586-018-0280-2
Chen, C., Park, T., Wang, X., Piao, S., Xu, B., Chaturvedi, R. K., et al. (2019). China and India lead in greening of the world through land-use management. Nat. Sustain. 2, 122–129. doi: 10.1038/s41893-019-0220-7
Chen, X., Huang, B., and Lin, C. T. (2019). Environmental awareness and environmental Kuznets curve. Econ. Model. 77, 2–11. doi: 10.1016/j.econmod.2019.02.003
Cui, B., Zhang, Y., Wang, Z., Gu, C., Liu, L., Wei, B., et al. (2022). Ecological risk assessment of transboundary region based on land-cover change: A case study of Gandaki River Basin, Himalayas. Land 11:638. doi: 10.3390/land11050638
Cui, H., Wagg, C., Wang, X., Liu, Z., Liu, K., Chen, S., et al. (2022). The loss of above- and belowground biodiversity in degraded grasslands drives the decline of ecosystem multifunctionality. Appl. Soil Ecol. 172:104370. doi: 10.1016/j.apsoil.2021.104370
Cui, L., Zhao, Y., Liu, J., Han, L., Ao, Y., and Yin, S. (2018). Landscape ecological risk assessment in Qinling Mountain. Geol. J. 53, 342–351. doi: 10.1002/gj.3115
DeFries, R., Rovero, F., Wright, P., Ahumada, J., Andelman, S., Brandon, K., et al. (2010). From plot to landscape scale: Linking tropical biodiversity measurements across spatial scales. Front. Ecol. Environ. 8:153–160. doi: 10.1890/080104
Diggle, G. (1995). Science and judgement in risk assessment. Occup. Environ. Med. 52, 784–784. doi: 10.1136/oem.52.11.784-a
Feng, L., You, Y., Liao, W., Pang, J., Hu, R., and Feng, L. (2022). Multi-scale change monitoring of water environment using cloud computing in optimal resolution remote sensing images. Energy Rep. 8, 13610–13620. doi: 10.1016/j.egyr.2022.09.134
Frazier, A. E., Bryan, B. A., Buyantuev, A., Chen, L., Echeverria, C., Jia, P., et al. (2019). Ecological civilization: Perspectives from landscape ecology and landscape sustainability science. Landsc. Ecol. 34, 1–8. doi: 10.1007/s10980-019-00772-4
Fu, L., Ren, Y., Lu, L., and Chen, H. (2022). Relationship between ecosystem services and rural residential well-being in the Xin’an river Basin, China. Ecol. Indicat. 140:108997. doi: 10.1016/j.ecolind.2022.108997
Gao, L., Tao, F., Liu, R., Wang, Z., Leng, H., and Zhou, T. (2022). Multi-scenario simulation and ecological risk analysis of land use based on the PLUS model: A case study of Nanjing. Sustain. Cities Soc. 85:104055. doi: 10.1016/j.scs.2022.104055
Gong, J., Cao, E., Xie, Y., Xu, C., Li, H., and Yan, L. (2021). Integrating ecosystem services and landscape ecological risk into adaptive management: Insights from a western mountain-basin area China. J. Environ. Manag. 281:111817. doi: 10.1016/j.jenvman.2020.111817
Guo, H., Cai, Y., Li, B., Tang, Y., Qi, Z., Huang, Y., et al. (2022). An integrated modeling approach for ecological risks assessment under multiple scenarios in Guangzhou, China. Ecol. Indicat. 142:109270. doi: 10.1016/j.ecolind.2022.109270
Hamann, M., Biggs, R., and Reyers, B. (2015). Mapping social–ecological systems: Identifying ‘green-loop’ and ‘red-loop’ dynamics based on characteristic bundles of ecosystem service use. Glob. Environ. Change 34, 218–226. doi: 10.1016/j.gloenvcha.2015.07.008
Hou, M., Ge, J., Gao, J., Meng, B., Li, Y., Yin, J., et al. (2020). Ecological risk assessment and impact factor analysis of alpine wetland ecosystem based on LUCC and boosted regression tree on the Zoige Plateau, China. Remote Sens. 12:368. doi: 10.3390/rs12030368
Hunsaker, C. T., Graham, R. L., Suter, G. W., O’Neill, R. V., Barnthouse, L. W., and Gardner, R. H. (1990). Assessing ecological risk on a regional scale. Environ. Manag. 14, 325–332. doi: 10.1007/BF02394200
Jiang, S., Meng, J., and Zhu, L. (2020). Spatial and temporal analyses of potential land use conflict under the constraints of water resources in the middle reaches of the Heihe River. Land Use Policy 97:104773. doi: 10.1016/j.landusepol.2020.104773
Jiang, S., Meng, J., Zhu, L., and Cheng, H. (2021). Spatial-temporal pattern of land use conflict in China and its multilevel driving mechanisms. Sci. Total Environ. 801:149697. doi: 10.1016/j.scitotenv.2021.149697
Jin, X., Jin, Y., and Mao, X. (2019). Ecological risk assessment of cities on the Tibetan Plateau based on land use/land cover changes – Case study of Delingha City. Ecol. Indicat. 101, 185–191. doi: 10.1016/j.ecolind.2018.12.050
Karimian, H., Zou, W., Chen, Y., Xia, J., and Wang, Z. (2022). Landscape ecological risk assessment and driving factor analysis in Dongjiang river watershed. Chemosphere 307:135835. doi: 10.1016/j.chemosphere.2022.135835
Kong, Y., He, W., Yuan, L., Zhang, Z., Gao, X., Zhao, Y., et al. (2021). Decoupling economic growth from water consumption in the Yangtze River Economic Belt, China. Ecol. Indicat. 123:107344. doi: 10.1016/j.ecolind.2021.107344
Lal, P., Shekhar, A., and Kumar, A. (2021). Quantifying temperature and precipitation change caused by land cover change: A case study of India using the WRF model. Front. Environ. Sci. 9:766328. doi: 10.3389/fenvs.2021.766328
Landis, W. G. (2003). Twenty years before and hence; Ecological risk assessment at multiple scales with multiple stressors and multiple endpoints. Hum. Ecol. Risk Assess. 9, 1317–1326. doi: 10.1080/10807030390248500
Leal, P. H., and Marques, A. C. (2022). The evolution of the environmental Kuznets curve hypothesis assessment: A literature review under a critical analysis perspective. Heliyon 8:e11521. doi: 10.1016/j.heliyon.2022.e11521
Levine, S. L., Giddings, J., Valenti, T., Cobb, G. P., Carley, D. S., and McConnell, L. L. (2019). Overcoming challenges of incorporating higher tier data in ecological risk assessments and risk management of pesticides in the United States: Findings and recommendations from the 2017 workshop on regulation and innovation in agriculture. Integr. Environ. Assess. Manag. 15, 714–725. doi: 10.1002/ieam.4173
Li, C., Zhang, J., Philbin, S. P., Yang, X., Dong, Z., Hong, J., et al. (2022). Evaluating the impact of highway construction projects on landscape ecological risks in high altitude plateaus. Sci. Rep. 12:5170. doi: 10.1038/s41598-022-08788-8
Li, W., Wang, Y., Xie, S., Sun, R., and Cheng, X. (2020). Impacts of landscape multifunctionality change on landscape ecological risk in a megacity, China: A case study of Beijing. Ecol. Indic. 117:106681. doi: 10.1016/j.ecolind.2020.106681
Li, Z., Jiang, W., Wang, W., Chen, Z., Ling, Z., and Lv, J. (2020). Ecological risk assessment of the wetlands in Beijing-Tianjin-Hebei urban agglomeration. Ecol. Indic. 117:106677. doi: 10.1016/j.ecolind.2020.106677
Li, X., Guo, J., and Qi, S. (2021). Forestland landscape change induced spatiotemporal dynamics of subtropical urban forest ecosystem services value in forested region of China: A case of Hangzhou city. Environ. Res. 193:110618. doi: 10.1016/j.envres.2020.110618
Liang, T., Yang, F., Huang, D., Luo, Y., Wu, Y., and Wen, C. (2022). Land-use transformation and landscape ecological risk assessment in the three gorges reservoir region based on the “production–living–ecological space” perspective. Land 11:1234. doi: 10.3390/land11081234
Lin, Y., Hu, X., Zheng, X., Hou, X., Zhang, Z., Zhou, X., et al. (2019). Spatial variations in the relationships between road network and landscape ecological risks in the highest forest coverage region of China. Ecol. Indic. 96, 392–403. doi: 10.1016/j.ecolind.2018.09.016
Lin, Z., Peng, S., Pu, S., Ma, X., and Zhou, Y. (2020). Landscape ecological risk assessment of Dianchi Lake basin based on land use change. IOP Conf. Ser. 730:012033. doi: 10.1088/1757-899x/730/1/012033
Liu, J., Jiao, L., Dong, T., Xu, G., Zhang, B., and Yang, L. (2018). A novel measure approach of expansion process of urban landscape: Multi-order adjacency index. Sci. Geogr. Sin. 38, 1741–1749. doi: 10.13249/j.cnki.sgs.2018.11.001
Lu, S., Tang, X., Guan, X., Qin, F., Liu, X., and Zhang, D. (2020). The assessment of forest ecological security and its determining indicators: A case study of the Yangtze River Economic Belt in China. J. Environ. Manag. 258:110048. doi: 10.1016/j.jenvman.2019.110048
Ma, L., Bo, J., Li, X., Fang, F., and Cheng, W. (2019). Identifying key landscape pattern indices influencing the ecological security of inland river basin: The middle and lower reaches of Shule River Basin as an example. Sci. Total Environ. 674, 424–438. doi: 10.1016/j.scitotenv.2019.04.107
Melnykovych, M., Nijnik, M., Soloviy, I., Nijnik, A., Sarkki, S., and Bihun, Y. (2018). Social-ecological innovation in remote mountain areas: Adaptive responses of forest-dependent communities to the challenges of a changing world. Sci. Total Environ. 613-614, 894–906. doi: 10.1016/j.scitotenv.2017.07.065
Mo, W., Wang, Y., Zhang, Y., and Zhuang, D. (2017). Impacts of road network expansion on landscape ecological risk in a megacity, China: A case study of Beijing. Sci. Total Environ. 574, 1000–1011. doi: 10.1016/j.scitotenv.2016.09.048
Munns, W. R., Rea, A. W., Suter Ii, G. W., Martin, L., Blake-Hedges, L., Crk, T., et al. (2016). Ecosystem services as assessment endpoints for ecological risk assessment. Integr. Environ. Assess. Manag. 12, 522–528. doi: 10.1002/ieam.1707
Nepal, P., Khanal, N. R., Zhang, Y., Paudel, B., and Liu, L. (2020). Land use policies in Nepal: An overview. Land Degrad. Dev. 31, 2203–2212. doi: 10.1002/ldr.3621
Pătru-Stupariu, I., and Nita, A. (2022). Impacts of the European landscape convention on interdisciplinary and transdisciplinary research. Landsc. Ecol. 37, 1211–1225. doi: 10.1007/s10980-021-01390-9
Peng, J., Dang, W., Liu, Y., Zong, M., and Hu, X. (2015). Review on landscape ecological risk assessment. Acta Geogr. Sin. 70, 664–677. doi: 10.11821/DLXB201504013
Raitano, G., Goi, D., Pieri, V., Passoni, A., Mattiussi, M., Lutman, A., et al. (2018). (Eco)toxicological maps: A new risk assessment method integrating traditional and in silico tools and its application in the Ledra River (Italy). Environ. Int. 119, 275–286. doi: 10.1016/j.envint.2018.06.035
Ran, P., Hu, S., Frazier, A. E., Qu, S., Yu, D., and Tong, L. (2022). Exploring changes in landscape ecological risk in the Yangtze River Economic Belt from a spatiotemporal perspective. Ecol. Indic. 137:108744. doi: 10.1016/j.ecolind.2022.108744
Riggs, R. A., Achdiawan, R., Adiwinata, A., Boedhihartono, A. K., Kastanya, A., Langston, J. D., et al. (2021). Governing the landscape: Potential and challenges of integrated approaches to landscape sustainability in Indonesia. Landsc. Ecol. 36, 2409–2426. doi: 10.1007/s10980-021-01255-1
Shen, W., Zhang, J., Wang, K., and Zhang, Z. (2023). Identifying the spatio-temporal dynamics of regional ecological risk based on Google Earth Engine: A case study from Loess Plateau, China. Sci. Total Environ. 873:162346. doi: 10.1016/j.scitotenv.2023.162346
Shi, Y., Feng, C. C., Yu, Q., Han, R., and Guo, L. (2022). Contradiction or coordination? The spatiotemporal relationship between landscape ecological risks and urbanization from coupling perspectives in China. J. Clean. Prod. 363:132557. doi: 10.1016/j.jclepro.2022.132557
Tokarczyk-Dorociak, K., Kazak, J., and Szewrański, S. (2018). The impact of a large city on land use in suburban area – the case of Wrocław (Poland). J. Ecol. Eng. 19, 89–98. doi: 10.12911/22998993/81783
Wang, B., Ding, M., Li, S., Liu, L., and Ai, J. (2020). Assessment of landscape ecological risk for a cross-border basin: A case study of the Koshi River Basin, central Himalayas. Ecol. Indic. 117:106621. doi: 10.1016/j.ecolind.2020.106621
Wang, F., Ye, C., Hua, J., and Li, X. (2019). Coupling relationship between urban spatial expansion and landscape ecological risk in Nanchang City. Acta Ecol. Sin. 39, 1248–1262. doi: 10.5846/stxb201811082426
Wang, H., Liu, X., Zhao, C., Chang, Y., Liu, Y., and Zang, F. (2021). Spatial-temporal pattern analysis of landscape ecological risk assessment based on land use/land cover change in baishuijiang national nature reserve in Gansu Province, China. Ecol. Indic. 124:107454. doi: 10.1016/j.ecolind.2021.107454
Wang, X. (2014). Promote the resonance of ecological economy and ecological environment at the same frequency. Hangzhou: Zhejiang Today.
Wu, J. (2022). A new frontier for landscape ecology and sustainability: Introducing the world’s first atlas of urban agglomerations. Landsc. Ecol. 37, 1721–1728. doi: 10.1007/s10980-022-01475-z
Xie, H., He, Y., Choi, Y., Chen, Q., and Cheng, H. (2020). Warning of negative effects of land-use changes on ecological security based on GIS. Sci. Total Environ. 704:135427. doi: 10.1016/j.scitotenv.2019.135427
Xie, H., Wen, J., Chen, Q., and Wu, Q. (2021). Evaluating the landscape ecological risk based on GIS: A case-study in the Poyang Lake region of China. Land Degrad. Dev. 32, 2762–2774. doi: 10.1002/ldr.3951
Xu, W., Wang, J., Zhang, M., and Li, S. (2021). Construction of landscape ecological network based on landscape ecological risk assessment in a large-scale opencast coal mine area. J. Clean. Prod. 286:11. doi: 10.1016/j.jclepro.2020.125523
Xue, L., Zhu, B., Wu, Y., Wei, G., Liao, S., Yang, C., et al. (2019). Dynamic projection of ecological risk in the Manas River basin based on terrain gradients. Sci. Total Environ. 653, 283–293. doi: 10.1016/j.scitotenv.2018.10.382
Yang, G., Ge, Y., Xue, H., Yang, W., Shi, Y., Peng, C., et al. (2015). Using ecosystem service bundles to detect trade-offs and synergies across urban–rural complexes. Landsc. Urban Plann. 136, 110–121. doi: 10.1016/j.landurbplan.2014.12.006
Yu, Y., Duan, C., Li, S., Peng, C., Yang, J., Yan, K., et al. (2022). Relationship between environmental pollution and economic development in late-developing regions shows an inverted V. Sci. Total Environ. 838:156295. doi: 10.1016/j.scitotenv.2022.156295
Yuan, L., Li, R., He, W., Wu, X., Kong, Y., Degefu, D. M., et al. (2022). Coordination of the industrial-ecological economy in the Yangtze River Economic Belt, China. Front. Environ. Sci. 10:882221. doi: 10.3389/fenvs.2022.882221
Yuan, L., Yang, D., Wu, X., He, W., Kong, Y., Ramsey, T. S., et al. (2023). Development of multidimensional water poverty in the Yangtze River Economic Belt, China. J. Environ. Manag. 325:116608. doi: 10.1016/j.jenvman.2022.116608
Zhang, D., Jing, P., Sun, P., Ren, H., and Ai, Z. (2022). The non-significant correlation between landscape ecological risk and ecosystem services in Xi’an Metropolitan Area, China. Ecol. Ind. 141:109118. doi: 10.1016/j.ecolind.2022.109118
Zhang, S., Zhong, Q., Cheng, D., Xu, C., Chang, Y., Lin, Y., et al. (2022). Landscape ecological risk projection based on the PLUS model under the localized shared socioeconomic pathways in the Fujian Delta region. Ecol. Indic. 136:108642. doi: 10.1016/j.ecolind.2022.108642
Zhang, X., Yao, L., Luo, J., and Liang, W. (2022). Exploring changes in land use and landscape ecological risk in key regions of the Belt and Road Initiative Countries. Land 11:940. doi: 10.3390/land11060940
Zhang, H., Liu, Y., Li, X., Feng, R., Gong, Y., Jiang, Y., et al. (2023). Combing remote sensing information entropy and machine learning for ecological environment assessment of Hefei-Nanjing-Hangzhou region, China. J. Environ. Manag. 325:116533. doi: 10.1016/j.jenvman.2022.116533
Zhang, W., Chang, W. J., Zhu, Z. C., and Hui, Z. (2020). Landscape ecological risk assessment of Chinese coastal cities based on land use change. Appl. Geogr. 117:102174. doi: 10.1016/j.apgeog.2020.102174
Zhao, X., Wang, W., and Wan, W. (2018). Regional differences in the health status of Chinese residents: 2003–2013. J. Geogr. Sci. 28, 741–758. doi: 10.1007/s11442-018-1502-0
Zhou, K. (2022). Study on wetland landscape pattern evolution in the Dongping Lake. Appl. Water Sci. 12:200. doi: 10.1007/s13201-022-01721-4
Keywords: landscape ecological risk, LUCC, landscape pattern, spatiotemporal evolution, influencing factor, environmental Kuznets curve, risk management, landscape sustainability
Citation: Cheng X, Zhang Y, Yang G, Nie W, Wang Y, Wang J and Xu B (2023) Landscape ecological risk assessment and influencing factor analysis of basins in suburban areas of large cities – A case study of the Fuchunjiang River Basin, China. Front. Ecol. Evol. 11:1184273. doi: 10.3389/fevo.2023.1184273
Received: 11 March 2023; Accepted: 17 April 2023;
Published: 11 May 2023.
Edited by:
Pedzisai Kowe, Midlands State University, ZimbabweReviewed by:
Andreea Nita, University of Bucharest, RomaniaCopyright © 2023 Cheng, Zhang, Yang, Nie, Wang, Wang and Xu. This is an open-access article distributed under the terms of the Creative Commons Attribution License (CC BY). The use, distribution or reproduction in other forums is permitted, provided the original author(s) and the copyright owner(s) are credited and that the original publication in this journal is cited, in accordance with accepted academic practice. No use, distribution or reproduction is permitted which does not comply with these terms.
*Correspondence: Bin Xu, MjAwMTAwNTFAemFmdS5lZHUuY24=
†These authors have contributed equally to this work and share first authorship
Disclaimer: All claims expressed in this article are solely those of the authors and do not necessarily represent those of their affiliated organizations, or those of the publisher, the editors and the reviewers. Any product that may be evaluated in this article or claim that may be made by its manufacturer is not guaranteed or endorsed by the publisher.
Research integrity at Frontiers
Learn more about the work of our research integrity team to safeguard the quality of each article we publish.