 Lingjuan Tai
 Fen Lu
 Lin Huang
- School of Tourism, Kunming University, Kunming, Yunnan, China
Introduction: Improving the development efficiency of human–earth systems is a practical requirement for achieving high-quality regional development.
Methods: The article designs a data envelopment analysis (DEA) model under the constraints of coordinated development degree from the perspective of the interaction of natural, economic and social systems to evaluate the development efficiency of human–earth systems and uses GA-BP neural network model for the prediction of the development efficiency of the human–earth system of each geographical unit from 2018 to 2025 based on the panel data of the 8 ethnic autonomous prefectures in Yunnan Province form 1995 to 2017.
Results: The study found that from 1995 to 2017, the coordination degree and the coordinated development degree of the human–earth system in Yunnan minority areas were on the rise, but mainly manifested in the coordination of low development degree, and the average comprehensive efficiency value of input and output showed a downward trend. The prediction results for 2018–2025 showed that the human–earth system in Yunnan minority areas will be at a low efficient coordinated development level, and the coordinated development degree will show a downward trend. The development degree of natural subsystems in many ethnic minority areas showed negative growth and was negatively correlated with the development degree of economic and social subsystems. In 2025, except Honghe and Banna, the other six regions will be inefficient regions. Among these six inefficient regions, only Wenshan has input redundancy in the natural subsystem, but the phenomenon of input redundancy in the economic subsystem and insufficient output in the natural subsystem is common, indicating that industrial pollution has been controlled to a certain extent in most regions, but the economic investment mode and resource recycling efficiency need to be optimized and improved.
Discussion: Our results could enrich the content of human–earth system characteristics in typical regions, and also provide theoretical support for regional coordinated development in China.
1 Introduction
The human–earth system is a dynamic system formed by the interconnection and interaction between humans and the earth, and is the core of geographical research (Wu, 1991; Lu, 2003; Hasibagen et al., 2013). Since the mid-20th century, the scale of social and economic production has been expanding with the increase in human demand for material goods (Ellis et al., 2019). The strong impact of human activities on the earth system has led to frequent environmental events such as ecological damage, sharp reduction in resource stocks and land degradation (Wang and Liu, 2018; Diffenbaugh and Burke, 2019; Hansen et al., 2019; Wang et al., 2020; Perovi et al., 2021), and a dysfunctional coupling of the human–earth system (Bi, 2004), The development of the human–earth system is gradually entering the Anthropocene stage (Sitzinger et al., 2015). In 2010, IGBP released a statement of support for IPCC, calling for further strengthening of integrated research in the fields of natural sciences, social sciences, and policies, to seeking solutions to mitigate climate change (Seitzinger et al., 2015). The harmonious development of human–earth systems has become a key issue for social and economic development today (Liu, 2020; Wu, 1991), the research on its theory and practical application is of great significance in promoting regional coordination and sustainable development (Liu and Qu, 2022).
The study of spatiotemporal patterns of human–earth systems and sustainable development in typical regions is an important paradigm in the study of human–earth relations (Fan, 2018). Yunnan is located in the southwestern of China and is an important ecological security barrier for China and even Southeast Asia, as well as an important gene bank for biological species resources. Its ecological security plays a very important role in the protection of water sources around the Pearl River, the ecological management of the middle and upper reaches of the Yangtze River, and the ecological management of other countries in East and Southeast Asia. Over the last few years, with the continuous development of reform and opening up, policies have been continuously tilted to the western and ethnic areas, and Yunnan minority areas have accelerated their development. According to the “Yunnan Provincial Statistical Yearbook” (2013–2022), since 2012, the economy of Yunnan Province has been growing rapidly. The total economic volume has increased from 1.1 trillion RMB in 2012 to 2.71 trillion RMB in 2021, with an AAGR of 8.7%. The average annual economic growth in ethnic autonomous places is 9.5%, higher than the provincial average. However, the rapid economic accumulation has not reversed the imbalance between the economic, social and natural environment and their carrying capacities. The human–earth relationship in some minority areas in Yunnan has deteriorated sharply, gradually evolving into a high-level coupled area with lagging economic and social development, fragile ecological environment and frequent natural disasters (Yang et al., 2020). Under the background of consolidating and extending the achievements of poverty alleviation, continuing to drive the development of poverty-eradication areas and the comprehensive revitalization of rural areas, Yunnan should not only seek its own development, but also shoulder the responsibility of protecting national ecological security.
Therefore, scientific evaluation of the development and evolution trend of the human–earth system in Yunnan minority areas, effective identification of the main obstacles to its development, and adoption of corresponding comprehensive and systematic response measures have significant theoretical value and practical significance for promoting the high-quality development of Yunnan minority areas, and that is a useful addition to the coordination theory of human–terrestrial systems.
With the maturation of the theoretical basis of human–earth systems, information technology and econometric analysis models, the issue of coordinated development of human–earth systems has gradually become the focus of research in geography, economics, sociology, environmental studies and ecology (Hudak, 1999; Cao and Xie, 2009; Shen and Liu, 2010; Rajaram and Das, 2011; Evans et al., 2013; Yu et al., 2021), scholars have conducted extensive theoretical and empirical research on it in terms of philosophical thinking, structural models, evolutionary processes, influence mechanisms, and optimal regulation (Ye, 2001; Mayes and Pini, 2010; Aspinall and Staiano, 2019; Qiu et al., 2021). And as the core of sustainable development of human society (Giddings et al., 2002; Fang et al., 2020), the issue of harmonious development between humans and the earth has been continuously sublimated, the theoretical system has been improved, and research methods have gradually developed towards multi-perspective, multi-scale and systematic quantitative analysis (Laniak et al., 2013; Nielsen et al., 2020; Wang et al., 2021). Solow analyzes the optimal proportion and utilization mode of natural resource exploitation based on neoclassical growth model (Solow, 1974). Cumberland, Daly and Leontief made quantitative analysis on the relationship between natural resources and environment and human economic production activities through input–output model (Cumberland, 1966; Robert, 1968; Wassily, 1974). Romer and Lucas introduced natural environment and natural resources into the production function as endogenous factors of economic growth, and studied the relationship between natural resource consumption, ecological environment degradation and sustainable economic development based on the endogenous growth model (Romer, 1989; Robert and Lucas, 1999). Grossman and Krueger proposed the Environmental Kuznets Curve Model (EKC) based on the empirical analysis of the number of panels in developed countries (Grossman and Krueger, 1995; Galeotti et al., 2006). When scholars verified the EKC curve based on panel data of different countries and regions, they obtained various forms of EKC, such as “inverted U”, “U”, “N”(Sarkodie and Strezov, 2019; Fang et al., 2021). The coupling theory in physics is also widely used in the field of ecological economics to discuss various nonlinear relationships between economic development and environmental change, urbanization and ecological change, land use and social and economic development, and ecology and economy (Barbera et al., 2010; Yang and Goodrich, 2014; Lin and Wang, 2016; Li et al., 2021; Wang and Grant, 2021; Weng et al., 2021). Liang, Yao and Huang established the coordination degree model of composite system based on the order parameter principle and servitude principle of synergetic, and used it in the empirical research on the coordinated development of urbanization and ecological environment, regional economic development, and the coordinated development of ecology and economy (Huang et al., 2018; Liang et al., 2019; Yao et al., 2022). Yang, Wen and Ren based on the theory of minimizing dispersion coefficient, established the coordination degree model of minimizing dispersion coefficient, and quantitatively measured the coordination between natural environment and economic development by using the coefficient of variation method (Yang, 1994; Wen, 2019; Ren et al., 2021). Zeng and Gai thought that the coordination of the system was a fuzzy concept. Therefore, the membership degree in fuzzy mathematics was used to describe the coordinated development index of the system (Zeng et al., 2010; Gai et al., 2018). In the human–earth system, there are various direct feedback effects between human activities and the geographical environment, as well as within each other. The interaction between humans and the earth is fully reflected in the input–output process, which is the most basic two-way interaction process in the human–earth system (Wu, 2008). Peng constructed an energy water coupling network accounting framework based on system input–output and ecological network analysis methods from the perspective of socio-economic networks, and conducted quantitative research on the coupling relationship between energy water resources in Hubei Province in 2007 and 2012 (Peng et al., 2018).
Previous studies have made useful explorations on regional coordinated development, but the social dimension has always been neglected in the design of the indicators system and most of them are the evaluation of individual subsystem or the analysis of the interrelationship between natural subsystem and economic subsystem. At the same time, the existing studies mostly focus on evaluating the results of regional coordinated development – the level of regionally coordinated development, and do not pay enough attention to its process – the efficiency issue. Therefore, this paper defines the coordinated development of the human–earth system as a sustainable development state in which the natural, economic and social subsystems cooperate properly and mutually promote each other for the purpose of maximizing the overall system efficiency. Around the connotation of this definition, the indicators of the social subsystem are included in the measurement system, DEA method is used to study the comprehensive efficiency of the system under the constraint of coordinated development degree, and GA-BP (Genetic algorithms–Back propagation) neural network model is used to forecast the future development trend of the human–earth system in Yunnan minority areas, which is a useful supplement and improvement to the theory of human–earth system coordination.
2 Human–earth system configuration in Yunnan minority areas
Yunnan is a multi-ethnic province. According to the 2020 Chinese Census, there are 52 ethnic minorities in the province, and the ethnic minority population makes up 33.4% of the province’s total population. Among them, 25 ethnic minorities have a population of 6,000 or more, with a share of more than 80% of the total population of this ethnic group in China. From the natural concept, Yunnan minority areas refer to ethnic minority gathering areas, while from the perspective of administrative division, they refer to ethnic minority autonomous regions, prefectures, counties, townships and other ethnic autonomous regions. The ethnic minority areas in Yunnan studied in this paper refer to the eight ethnic minority autonomous regions designated by the state from the perspective of prefecture-level administrative units, namely Chuxiong Yi Autonomous Prefecture, Honghe Hani and Yi Autonomous Prefecture, Wenshan Zhuang and Miao Autonomous Prefecture, Xishuangbanna Dai Autonomous Prefecture, Dali Bai Autonomous Prefecture, Dehong Dai and Jingpo Autonomous Prefecture Nujiang Lisu Autonomous Prefecture and Diqing Tibetan Autonomous Prefecture (hereinafter referred to as Chuxiong, Honghe, Wenshan, Banna, Dali, Dehong, Nujiang and Diqing) (see Figure 1).
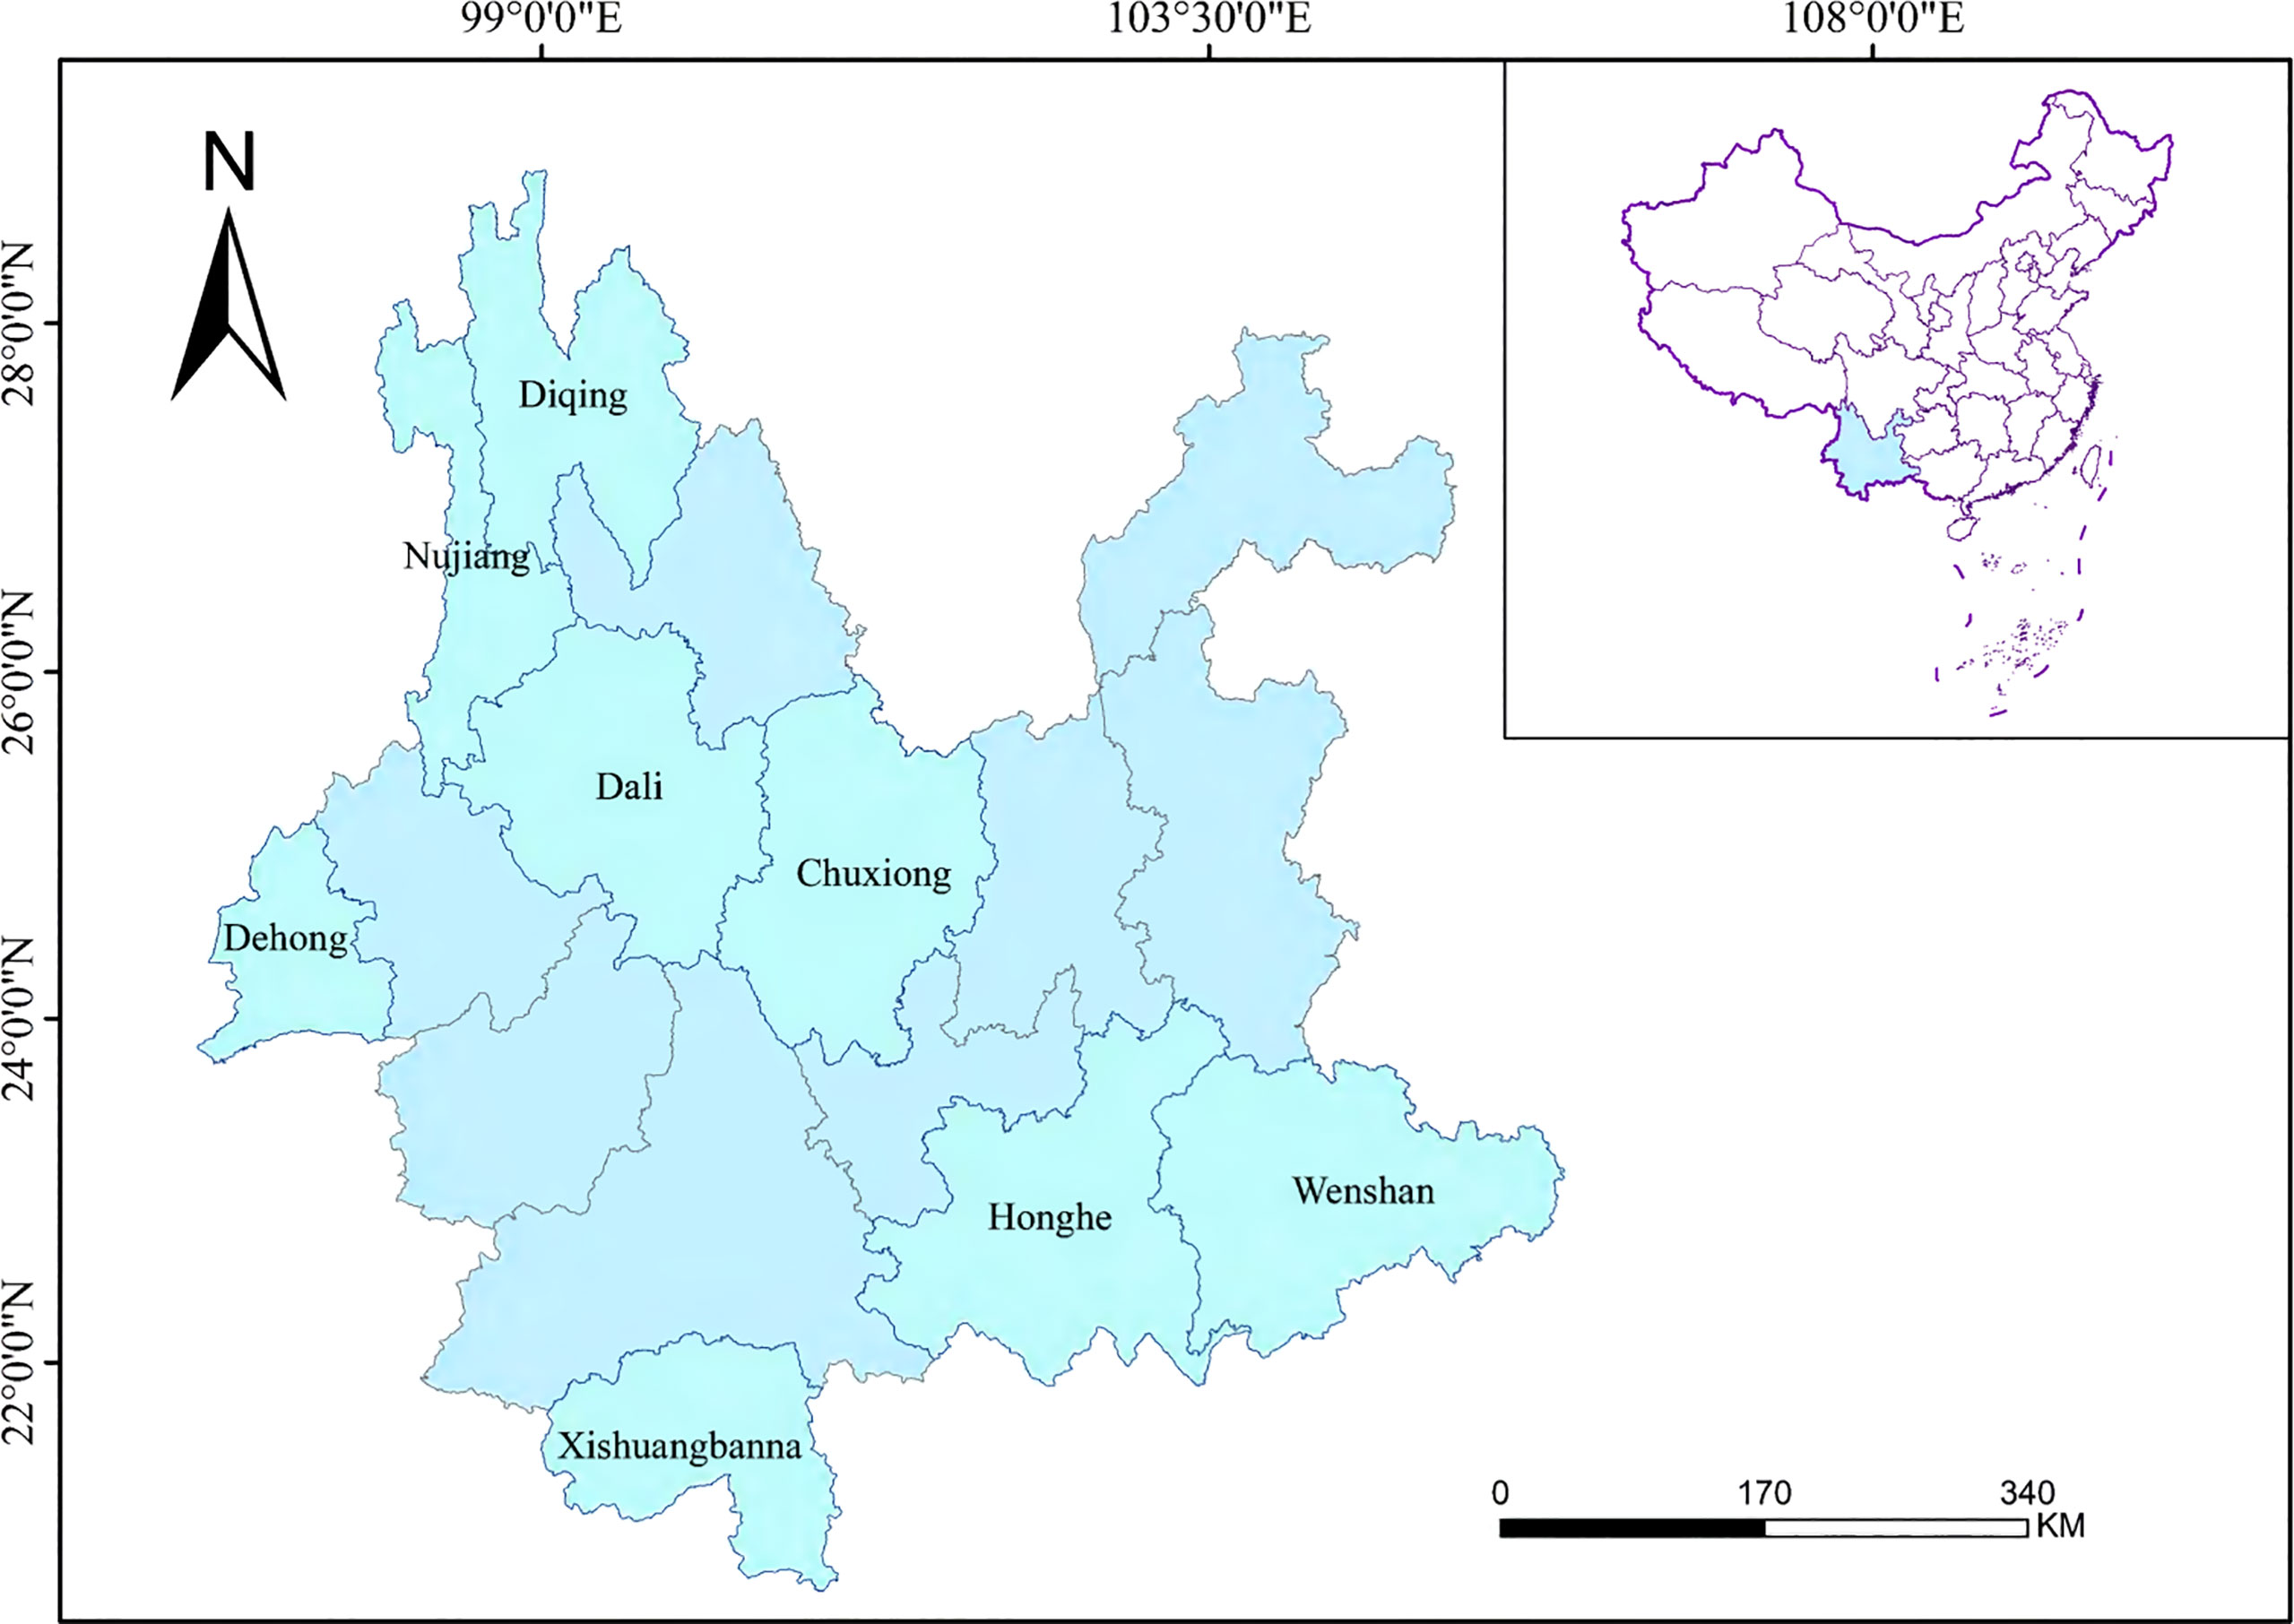
Figure 1 Distribution diagram of Yunnan minority autonomous prefecture.
Coordination refers to a benign cycle state and its process in which the subsystems or system elements cooperate and promote each other (Zeng and Gu, 2000). Development means the expansion process of a system or its components from small to large, simple to complex, low-level to high-level, and from disorder to order (Zeng et al., 2000). According to the standards of efficiency and balance, Cai (1997) divided the regional coordinated development into three modes: efficiency priority and balance, balance priority and efficiency, and efficiency and balance. Wei (2008) put forward an unbalanced and coordinated development strategy aiming at efficiency based on his understanding of the current situation of regional economic development in China. On the basis of the above, this study proposes the NES-E configuration of the human–earth system (see Figure 2), in which the human–earth system in Yunnan minority areas is defined as a complex system consists of three subsystems of natural (N), economic (E) and social (S) within the regional scope of Yunnan ethnic minority autonomous prefecture, and with efficiency (E) as its coordinated development goal. The coordinated development of the human–earth system means reaching a sustainable development state in which the natural, economic and social subsystems cooperate properly and promote each other with the aim of maximizing the overall efficiency of the system. The natural subsystem is not only a bearing place of human production and domestic wastes, but also a space for human survival and development. The economic subsystem provides material guarantee for the development of other subsystems in the process of material production and reproduction. As the main body of the system, people have strong initiative and control, and play a major role in regulating the development of the human–earth system. The quality of the social subsystem is the most important factor to promote the coordinated development of the human–earth system. The natural, economic and social subsystems are closely intertwined to form a multi-layer interactive NES-E coordination mechanism.
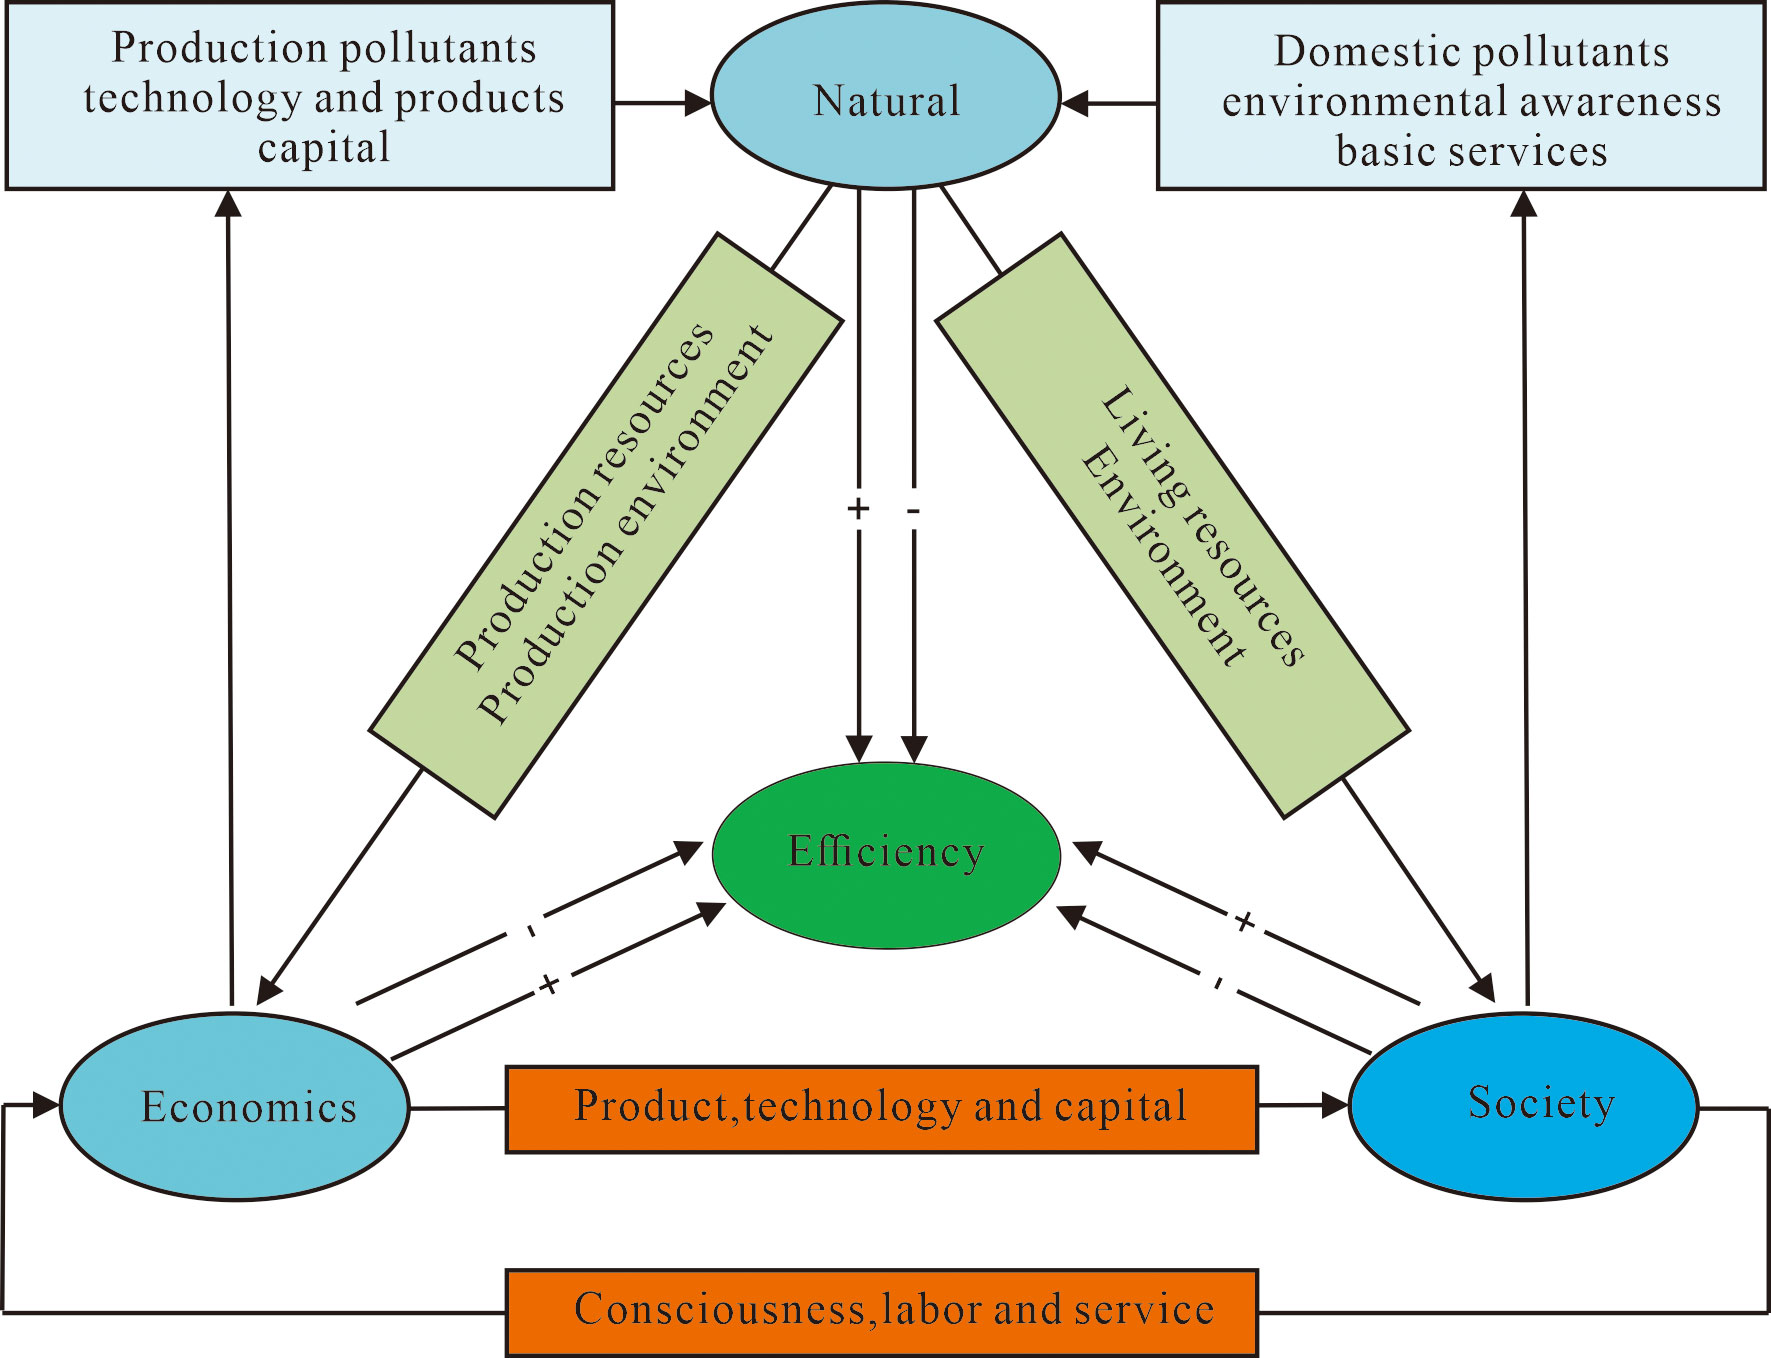
Figure 2 NES-E configuration of the human–earth system.
3 Evaluation model of human–earth system development in Yunnan minority areas
3.1 Index system and weight
In the evolution process of the human–earth system, there are a large number of influencing factors, from which the decisive variables must be identified and a complete and scientific measurement index system must be established to truly reflect the interplay between subsystems and the internal components of each system. Drawing on the experience of measurement index system framework construction at home and abroad (Hardi et al., 1997; Luo and Zeng, 1999), and combining the actual situation of Yunnan minority areas, this paper constructs an index system for evaluating the level of coordinated development of human–earth systems in Yunnan minority areas from the 5 levels of target, system, state, variable and element (see Figure 3).
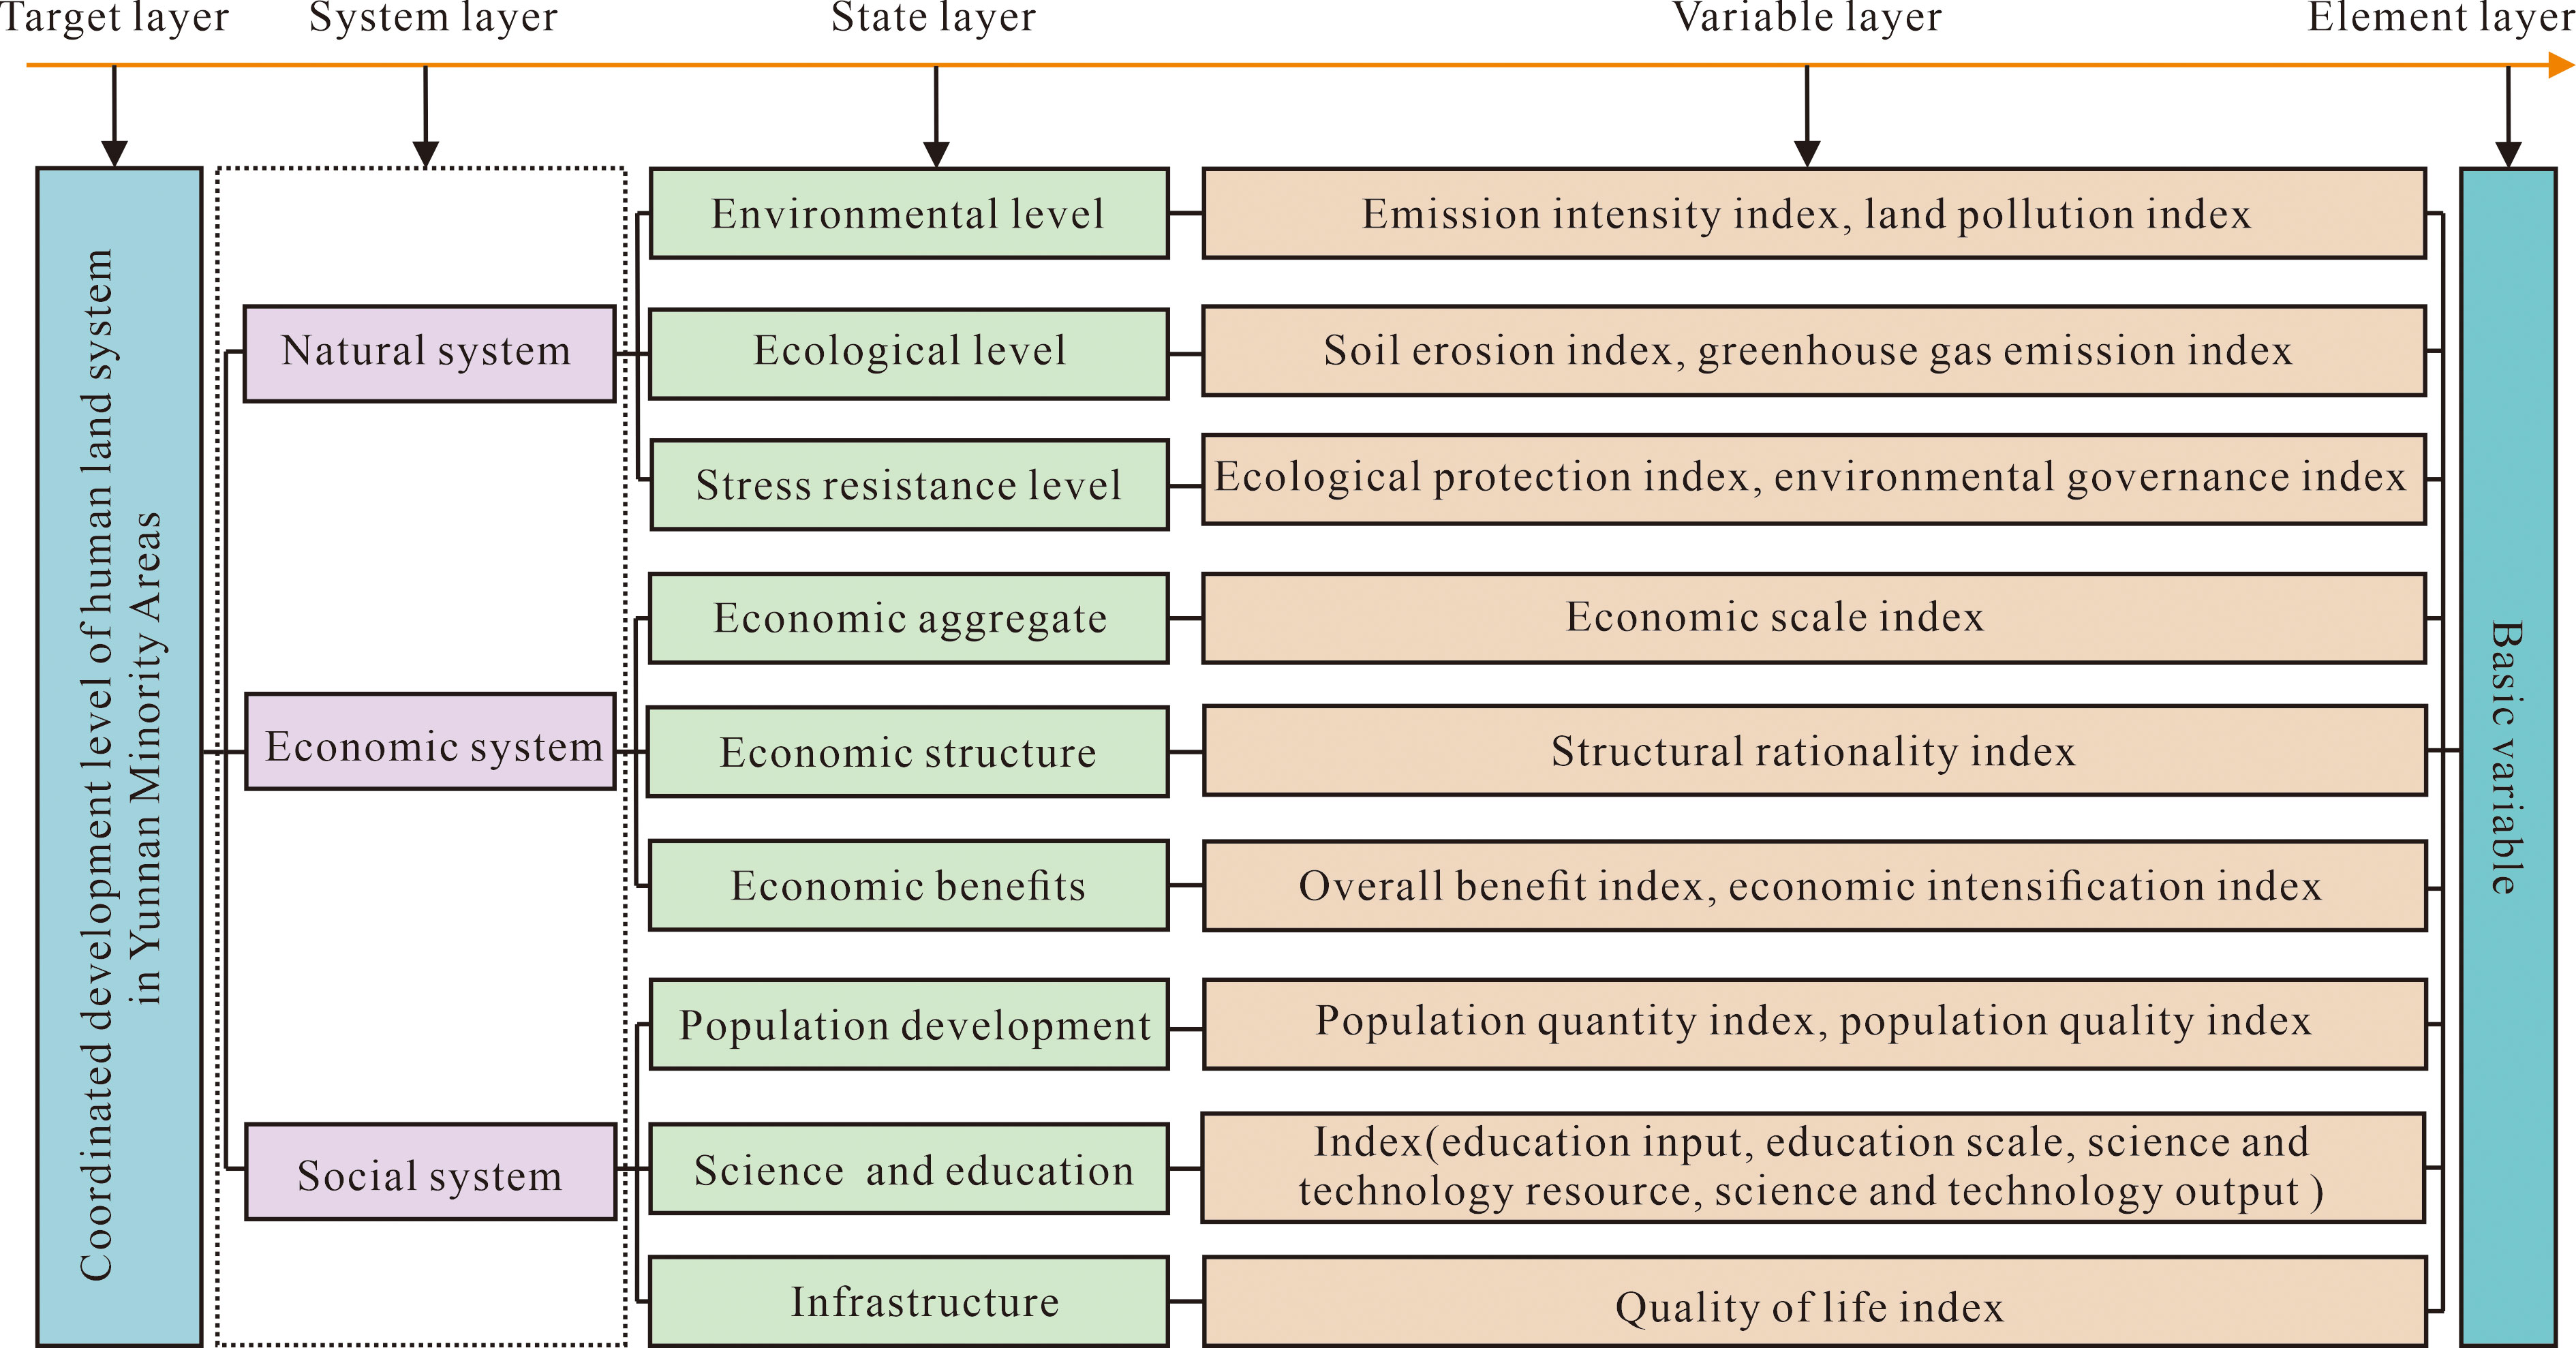
Figure 3 Framework of coordinated development measurement index system.
According to the definition of the meaning and objective of the coordinated development of human–earth system in Yunnan minority areas and previous research results (Li et al., 2019; Fu et al., 2021; Li et al., 2021; Li et al., 2022; Liu et al., 2022), this paper follows the principles of integrity and systematization, representativeness and independence, availability and feasibility, and selects 16 indicators from the natural subsystem, economic subsystem and social subsystem to construct a measurement indicator system for measuring the coordinated development level of the human–earth system in Yunnan minority areas. Those 16 basic indices are classified as positive (+) and negative (−) indices, in accordance with the action direction of each evaluation index on the whole system (see Table 1).
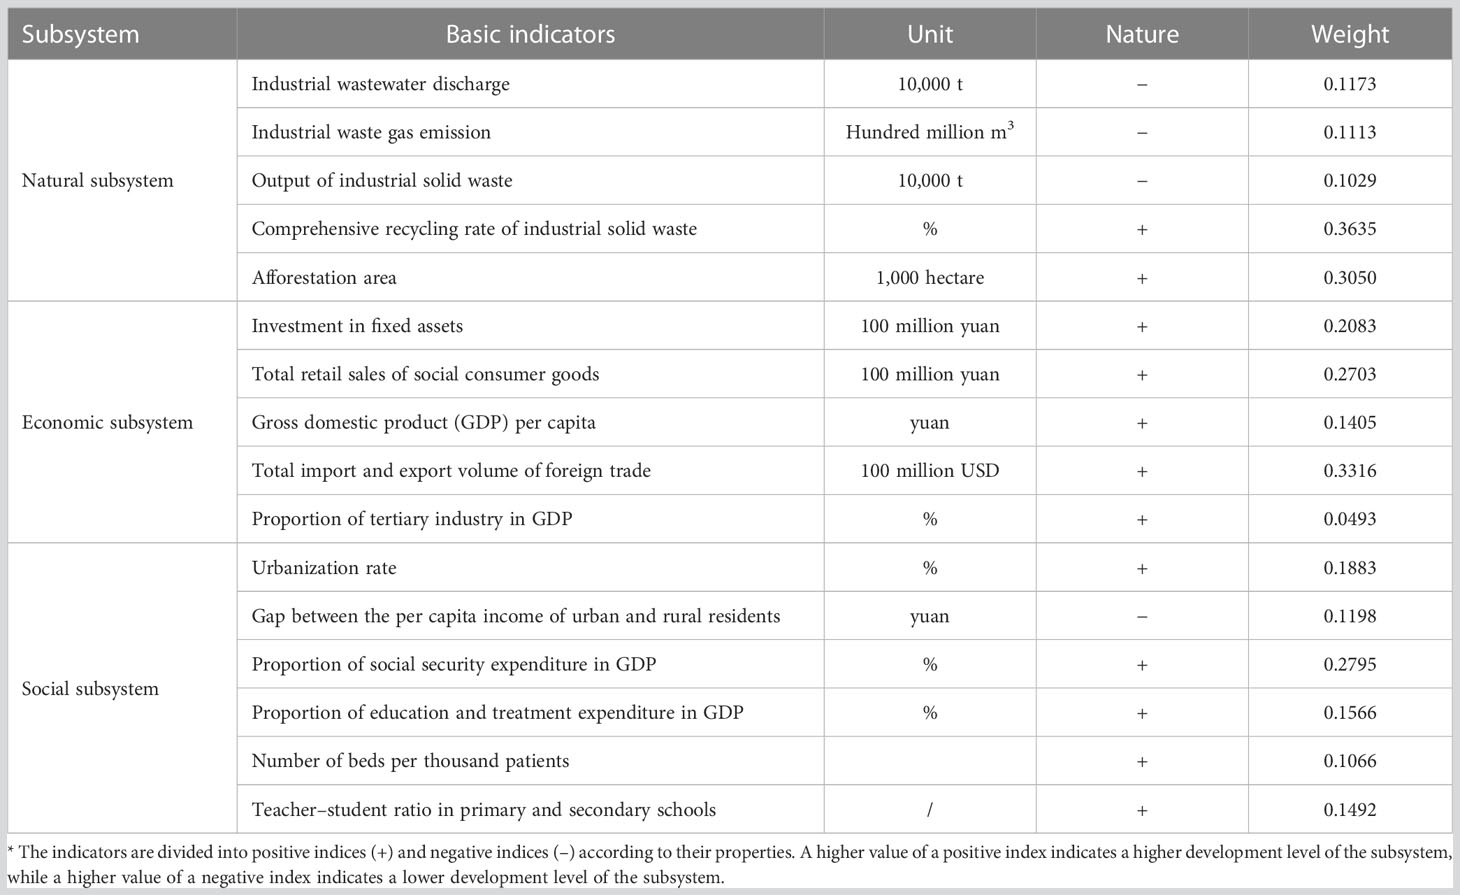
Table 1 Measurement index system and weight of coordinated development of the human–earth system in Yunnan minority areas.
To make the calculated value of the coordinated development indicator interpretable and to facilitate the calculation of the entropy weight of the following indicators, all standardized values are set between 0.01 and 1. The piecewise function method is used to standardize the positive and negative indices data respectively.
If there are l indexes, m regions and n years, xijkis the index value of the index i in the year k of region j, x’ijk is the normalized value of corresponding indicator data, i =1,2,…,l; j =1,2,…,m; k =1,2,…,n.The positive indices can be normalized by the following functions,
The negative indices can be normalized by the following functions,
Where, x̄i is the average value of all samples of the index i, max{xi} and min{xi} are the maxima and minima values of all samples in the index system, respectively. In order to avoid meaningless value when taking logarithm in the process of calculating entropy, the coordinates of the values after extreme value standardization should be translated by 0.01.
In the process of coordinated development of the human–earth system, all subsystems are considered equally important. Therefore, the weight of each subsystem is 1/3. Substituting data from the Yunnan Statistical Yearbook (1996–2018), the index weights were calculated as shown in Table 1.
3.2 Measurement model design of coordinated development
The method of synthetic measure is adopted in this paper. The degree of development and the degree of coordination are integrated, and the degree of coordination is used to express the coordination status at a certain level of development. The DEA efficiency model of coordination development under the constraint of the degree of coordination development is established. The level of coordinated development of regional the human–earth system is measured from the perspective of comprehensive efficiency of system development.
(1) Subsystem development degree model. The index data in the coordinated development measurement index system established in this paper are all equidistant scale measurements. After addition and subtraction, the calculation results are still meaningful (Luce, 1986). Therefore, the weighted arithmetic average method is used to establish the development degree measurement model.
Assuming that x1,x2,…,xl are the indicators representing the coordination degree of natural subsystem, y1,y2,…,yl are the indicators representing the coordination degree of natural subsystem, and z1,z2,…,zl are the indicators representing the coordination degree of natural subsystem, xl,ym,zn>0, the functions f(x),g(y),h(z) are the development degree of natural subsystem, economic subsystem and social subsystem respectively, then,
where ai,bi,ci are the undetermined weights of each indicator in the natural, economic and social subsystems, respectively, and are the values of the system indicator data after standardization.
(2) Coordination model. Based on the coordination degree model of minimizing the deviation coefficient, the coordination among the three subsystems of nature, economy and society in the regional human–earth system is calculated.
The mathematical model for measuring the cooperative scheduling among the three subsystems of the regional human–earth system is as follows,
where k is the adjustment coefficient, and k>2 generally. The coordination degree of the human–earth system can be reflected in the value C. In the calculation model, 0≤C≤1. When C=1, the system is in optimal coordination. A smaller coordination degree C means a lower coordination degree of the system.
(3) Coordinated development model. According to the concept of coordinated development mentioned above, the index measuring the level of coordinated development of economy, society and environment is called the degree of coordinated development, which is expressed by D. The calculation formula is as follows,
where D is the coordinated development degree, C is the coordinated development degree, T is the development degree of the whole system, f(x), g(y), h(z) are the development degree of natural subsystem, economic subsystem and social subsystem respectively, and α, β, γ are the weights of the three subsystems.
(4) Efficiency measurement model of coordinated development. Suppose there are s decision-making units DUM, and decision-making unit r is recorded as DUMr, 1⩽r ⩽s. Each DUM has m inputs and n outputs. The xri is the input index r of decision unit i, (i = 1,2,…m). The yrj is the output index r of decision unit j, (j=1,2,…n). Taking the coordination degree as one of the input indicators indicates that the efficiency of system development is measured under the given coordination level. Select output oriented C2R model,
where θ represents the efficiency value of DUM and refers to the effective utilization degree of input relative to output; λr is the weight of decision unit DUMr; s+ and s− are relaxation variables.
a. When θ = 1 and , the input elements of the measure unit are considered to cooperate optimally, indicating that among the n measurement objects, output y0 based on the input x0 is the best.
b. When θ = 1 and , , the input elements of the measure unit are considered weakly effective, meaning that input x0 can be reduced while the original output y0 remains unchanged, or the output can be improved when the input x0 remains unchanged.
c. If θ < 1 and , , the coordination among the input elements of the measure unit is considered invalid, meaning that the input can be reduced to θ·x0 while the original output y0 remains unchanged.
4 Prediction model for the coordinated development of the human–earth system in ethnic minority areas in Yunnan
BP (back propagation) neural network is a multi-layer feed-forward network, which can well fit the nonlinear relationship between independent variables and dependent variables (Li and Xu, 2019). A BP neural network is composed of input layer, implicit layer, and output layer, each layer consisting of several neurons, with fully connected neurons between the layers and no connections between neurons within the layers. The input information is forward propagated to the output layer, and after calculating the error between the actual output and the desired output, the weights and thresholds of each connection are corrected by the method of gradient descent to reduce the mean square error value to achieve the desired target. BP neural networks can fit non-linear mappings of inputs and outputs and can realize self-learning with simple structure. But it has the disadvantage of being slow to train and prone to falling into local minima, which can be improved by evolutionary algorithms (Aye et al., 2015).
Genetic Algorithm (GA) is a stochastic global search for optimal solutions developed with reference to the evolutionary laws of living organisms, imitating the mechanisms of natural selection and genetics. The genetic algorithm optimization neural network (GA-BP) can obtain better initial weights and thresholds, make the network training escape from local minimum, and increase the convergence rate (Liu et al., 2013).
Assuming that the input layers, hidden layers and output layers have n,p and m neurons respectively. The input layer is,
The output layer is,
The activation function is Tansig function. Then, using genetic algorithm, the weights and thresholds of BP neural network are taken as the initial community, and the next generation community is get as the individual fitness through genetic action. The weights and thresholds are adjusted and optimized through selection, crossover and mutation operations, until the learning error of individual fitness value is less than the specified value, and the optimal weight and threshold obtained are used as the initial weight and threshold to train the network. Finally, the neural network is trained, and the mean square error after each iterating cycle is calculated. The iteration stops, as the error between the network output and the desired output reaches a preset error convergence value, and optimal weights sequence of the network is obtained. Corresponding to a trained simulation network, the network is used for the simulation and the prediction of the test samples, and the prediction results are obtained.
5 Research on the development situation of the human–earth system in Yunnan minority areas
5.1 Evaluation of the development degree of the human–earth system
According to formulae (1) and (2), the development degree development indicators from 1995 to 2017 are standardized. Combined with the weight calculation results, the linear weighting model of formula (3) is adopted to measure the development degree of natural, economic and social subsystems, the result is shown in Figure 4.
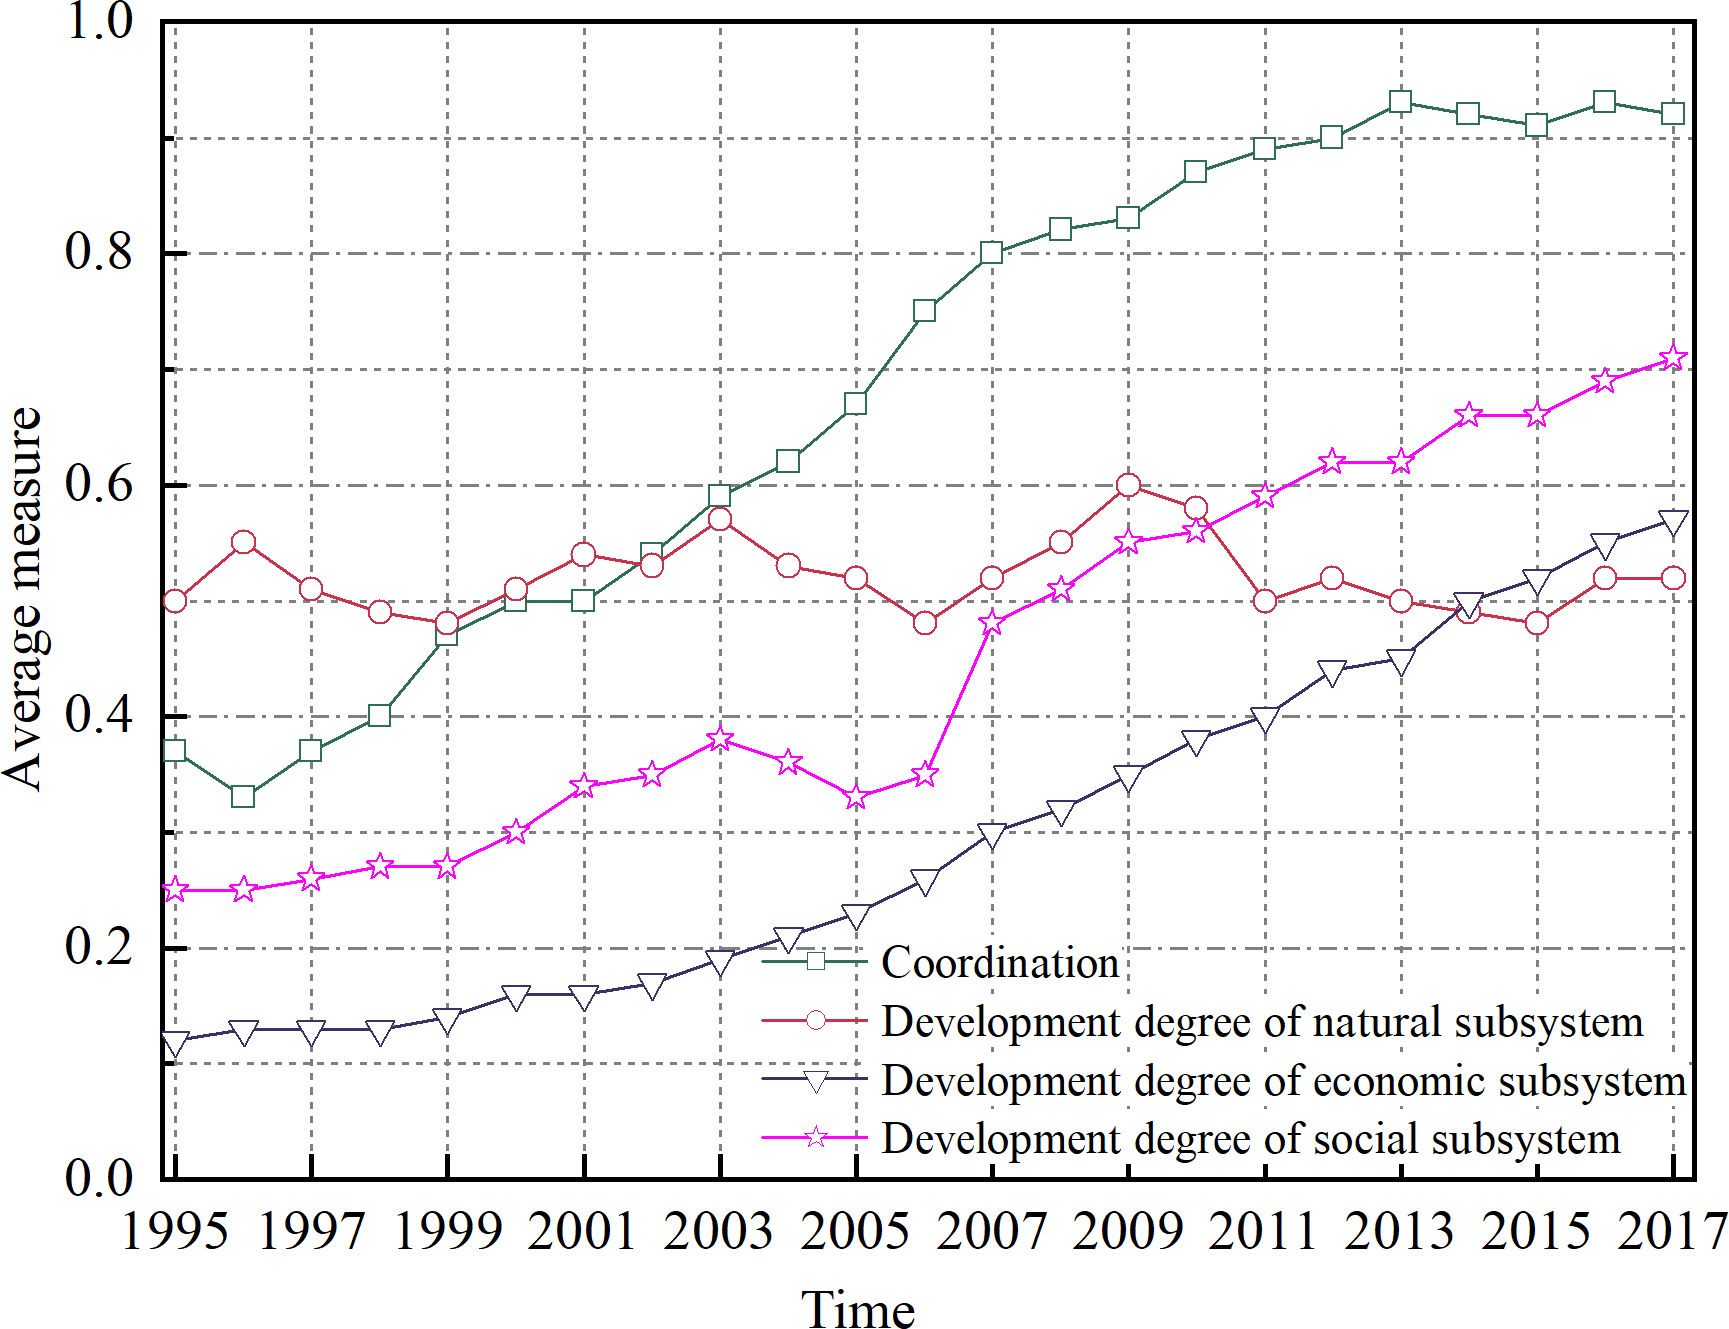
Figure 4 Coordination evolution trend of the human–earth system in Yunnan minority areas (1995–2017).
The average assessment value of the natural subsystem development degree in Yunnan minority areas fluctuates between 0.46 and 0.6. For a long time, resource development and export had been the mainstream of economic development in southwest China. The development of industry, mining and agriculture in Yunnan minority areas had been accelerating, but the awareness of saving energy, reducing emission and protecting environmental was weak, and the comprehensive waste utilization capacity in some areas was low. Before 2000, the average comprehensive utilization rate of solid waste in Yunnan minority areas was only about 30%. The extensive mode of production has caused great impact to the ecological environment in minority areas, and the ecological sustainable development has been greatly challenged. In 2007, the 17th Party Congress put forward the goal of building an ecological civilization, and the Yunnan government actively implemented the spirit of the 17th Congress and clarified the goals and tasks of building an ecological civilization in Yunnan. In 2009, Yunnan issued the decision to build a “forest Yunnan” to promote the work of forest rehabilitation from slope agriculture. At the same time, the “Outline of the Plan for the Construction of Ecological Civilization in Yunnan (2009–2020)” was promulgated to promote the construction of ecological civilization in Yunnan from the perspectives of awareness, behavior and system. Under the guidance of this series of policies, the management and cultivation on forests in most Yunnan minority areas have been strengthened, and the utilization rate of waste has continued to grow. In 2007, the comprehensive utilization rate of solid waste in Chuxiong, Banna and Dehong reached about 60%. However, the emissions of “three wastes” in minority areas are still increasing every year as the development of industrial production. Although there was no significant change in the development degree of natural subsystems in Yunnan minority areas in 2017 compared with 1995, the pressure on resources and environment will remain high with the increase in the demand for resources due to the development of industrialization in the future.
The development degree of the economic subsystem continued to rise, with an average growth rate of about 7%. The weight value of the total foreign trade import and export volume of Yunnan minority areas has a higher weight value in the economic subsystem indicators, so it has a greater impact on the development degree. The data of economic subsystem indicators from 1995 to 1998 show that the total foreign trade import and export volume of Yunnan minority areas decreased, and other indicators developed slowly, so the value of the economic subsystem development degree had reduced. In January 1999, the Notice of the Ministry of Foreign Trade and Economic Cooperation and the General Administration of Customs on Supplementary Provisions for Further Development of Border Trade was implemented officially, which further promoted the development of import and export trade in Yunnan and other border areas, and also played a positive role in driving the economic construction of Yunnan. Since 1999, the measured value of the development degree of the economic subsystem in Yunnan minority areas has been rising steadily, and the strategy of West China development and the promotion of the bridgehead construction have accelerated its speed. In 2017, the total retail trade of consumer products, investment in fixed assets and GDP per capita in Yunnan minority areas increased by 15.77%, 73.6% and 13.37% respectively compared with 2007.The proportion of the tertiary industry in GDP rose from 29.6 in 1995 to 47.14 in 2017, indicating that the economic structure of various regions is undergoing significant changes. Since 2007, the growth rate of economic subsystem development in Yunnan minority areas has been further accelerated, and the average growth rate of the measured value of economic subsystem development has also increased from 0.69 in 1996–2006 to 0.77.
The average growth rate of the development degree of the social subsystem is about 5%, which is slower than that of the economic subsystem. From 1995 to 2017, the urbanization of ethnic minority areas in Yunnan has developed steadily, with an average growth rate of about 5%, which is basically consistent with the urbanization rate of the whole province. The gap of urbanization rate between ethnic minority areas and the whole province is basically maintained at 5%. In 1997 and 1999, the government of Yunnan Province improved the registered residence management measures for many times, relaxed the permission conditions for rural residents to settle in urban areas, so that more residents can settle in cities and enjoy the benefits of urbanization development. Driven by the fast-growing economic situation, the living standards of residents continue to improve, and the incomes of residents both in urban and rural have continued to increase. The per-capita net income of rural dwellers in these eight minority areas increased from 770.75 RMB in 1995 to 9407.88 RMB in 2017, with a nominal growth rate of 11.21%. In 2017, the per-capita net income of rural dwellers in Chuxiong, Honghe, Banna and Dali exceeded 10,000 RMB.The work on social security in Yunnan minority areas started late, the social security system was weak, and the financial expenditure of local governments on social security was unstable. For example, in 2005 and 2006, social security and employment expenditure as a share of GDP generally decreased in minority areas, so the level of development of the social subsystem was low.
5.2 Evaluation of the coordination degree of the human–earth system
From 1995 to 2017, the coordination degree of the human–earth system in Yunnan minority areas gradually evolved in an orderly direction. From 1995 to 2003, the overall development degree of natural subsystems in Yunnan minority areas changed slightly, and the coordination degree of the human–earth system was mainly affected by the economic and social subsystems, which was continuously optimized with the socio-economic development. 2004 to 2008, although the development of natural subsystem and social subsystem fell back and then increased again, the development speed of economic subsystem accelerated, and the coordination degree still showed a good growth trend. From 2009 to 2017, the development degree of economic and social subsystems in Yunnan minority areas continued to grow, but the development degree of natural subsystems has gradually declined since 2010, so the growth rate of coordination degree slowed down during this period, and even declined in 2015 and 2017.
5.3 Evaluation of the coordinated development degree of the human–earth system
The value of coordinated development degree of the human–earth system in Yunnan minority areas lies between 0.30 and 0.75, while the value of coordinated dispatching degree lies between 0.33 and 0.92, which is obviously higher than that of coordinated development degree. From 1995 to 2005, the growth rate of coordination degree is higher than that of coordinated development degree, and the gap between them had been increasing. Since 2006, the coordination degree has gradually become stable, but the coordinated development degree has turned into a relatively gentle growth trend. It shows that the development degree of natural, economic and social subsystems in the human–earth system of Yunnan minority areas is constantly converging but reflects a low level of synchronization. The coordinated development of the human–earth system needs to be realized from the aspects of enhancing economic strength, improving social development level, and controlling fluctuations and declining trends in the quality of the natural environment, as shown in Figure 5.
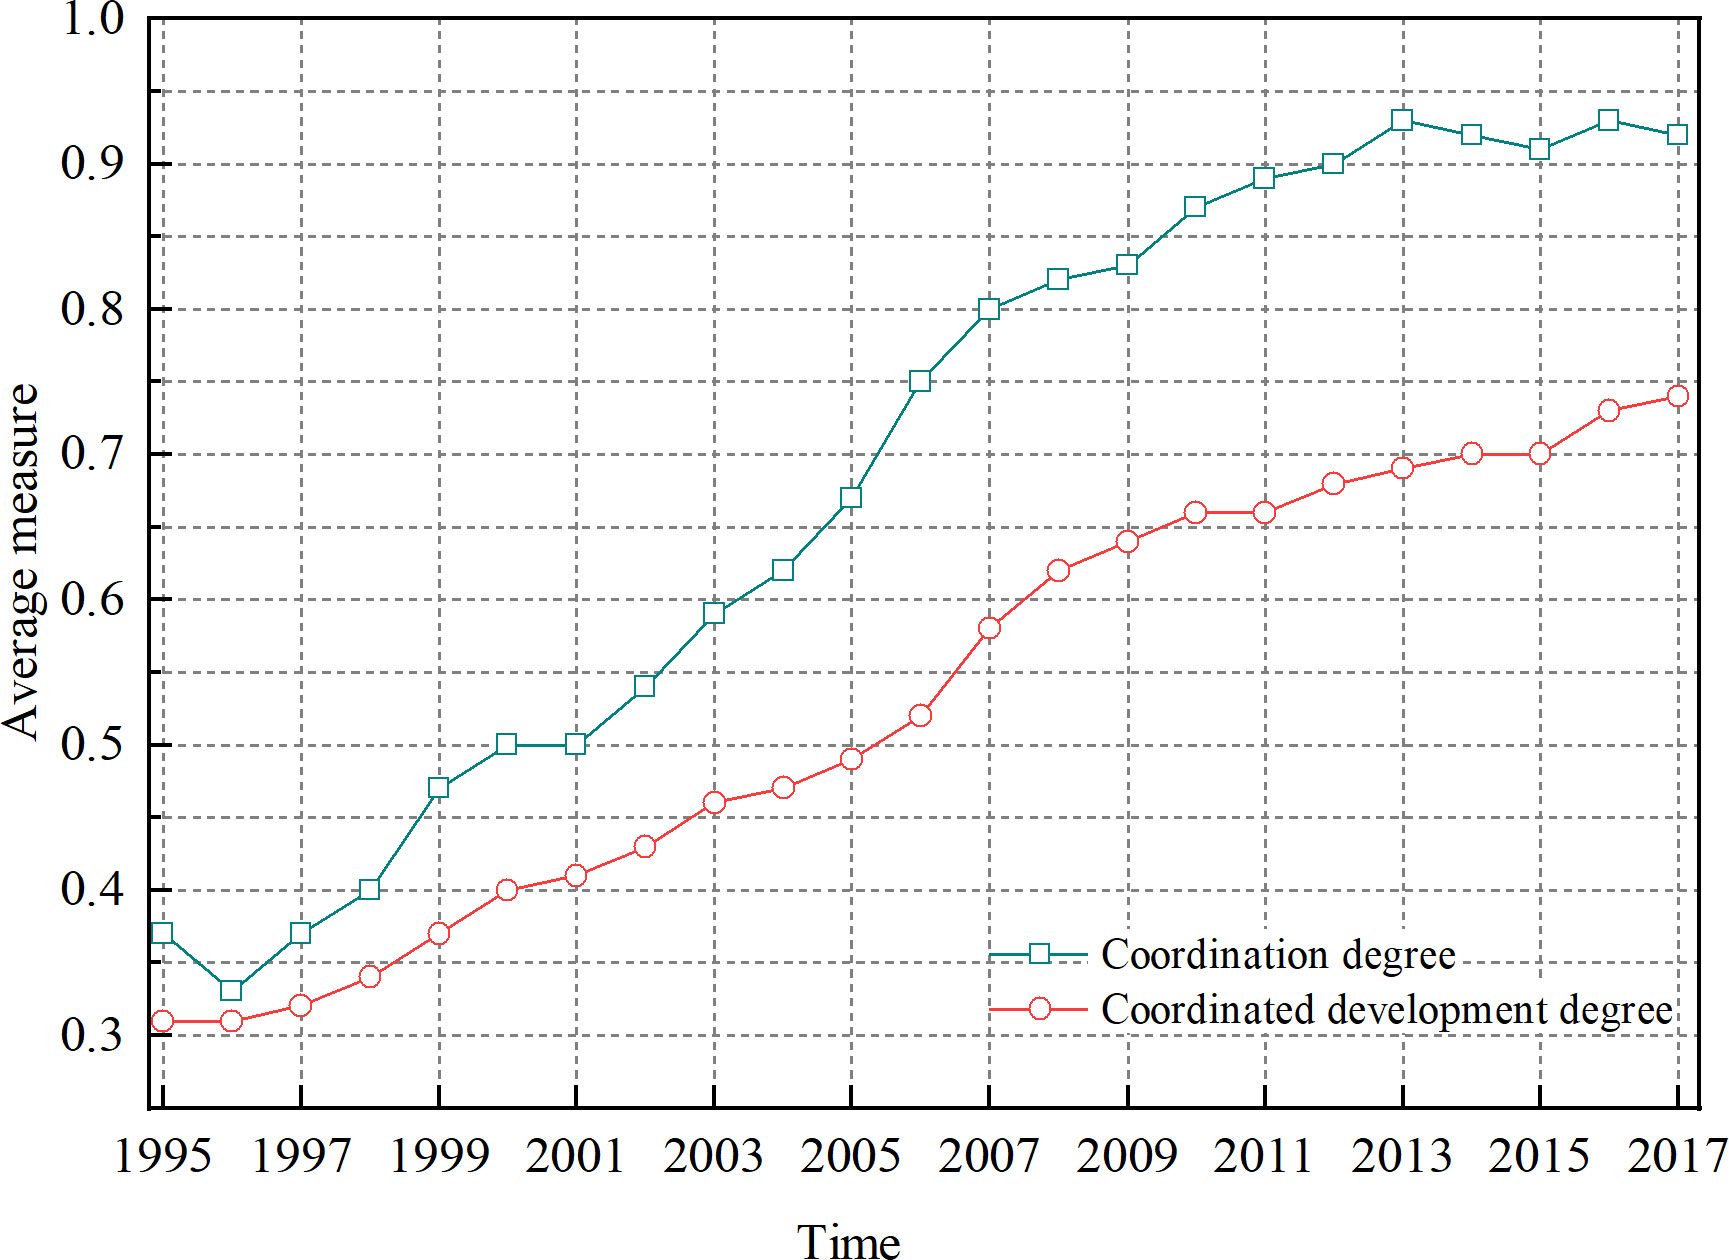
Figure 5 Coordinated development trend of the human–earth system in Yunnan minority areas (1995–2017).
5.4 Evaluation of the coordinated development efficiency of the human–earth system
Based on the measurement and analysis of the coordinated development degrees, with the natural year as the decision-making unit, we selected the input and output indicators reflecting the development of the regional human–earth system from 1995 to 2017 to calculate the development efficiency of the human–earth system.
The input variables include natural environment input (In–N), economic input (In–E) and social capital input (In–S). The degree of the In–N is characterized by the environmental pollution indicator, which is the average value of industrial wastewater discharge, industrial waste gas emission and the output of the industrial solid waste. It reflects the loss of the natural subsystem. The degree of the In–E is represented by the fixed assets investment and reflects the input of the economic subsystem. The degree of the In–S is characterized by the average value of the proportion of social security expenditure in GDP and the proportion of education and treatment expenditure in GDP, reflecting the investment of the social subsystem. The output variables include natural output (Out–N), economic output (Out–E) and social output (Out–S). The degree of the Out–N is characterized by the comprehensive utilization efficiency of industrial solid waste, reflecting the output of the natural subsystem. The degree of the Out–E is represented by GDP per capita, reflecting the output of the economic subsystem. The degree of the Out–S is represented by the urbanization rate and reflects the output of the social subsystem. In addition, the coordinated development degree is regarded as the output indicator, meaning that the rigid constraint of the coordinated development degree must be met in the evolutionary process of the human–earth system.
We used MATLAB to measure the comprehensive efficiency (θ) of the development of the human–earth system. The calculation results are shown in Figure 6.
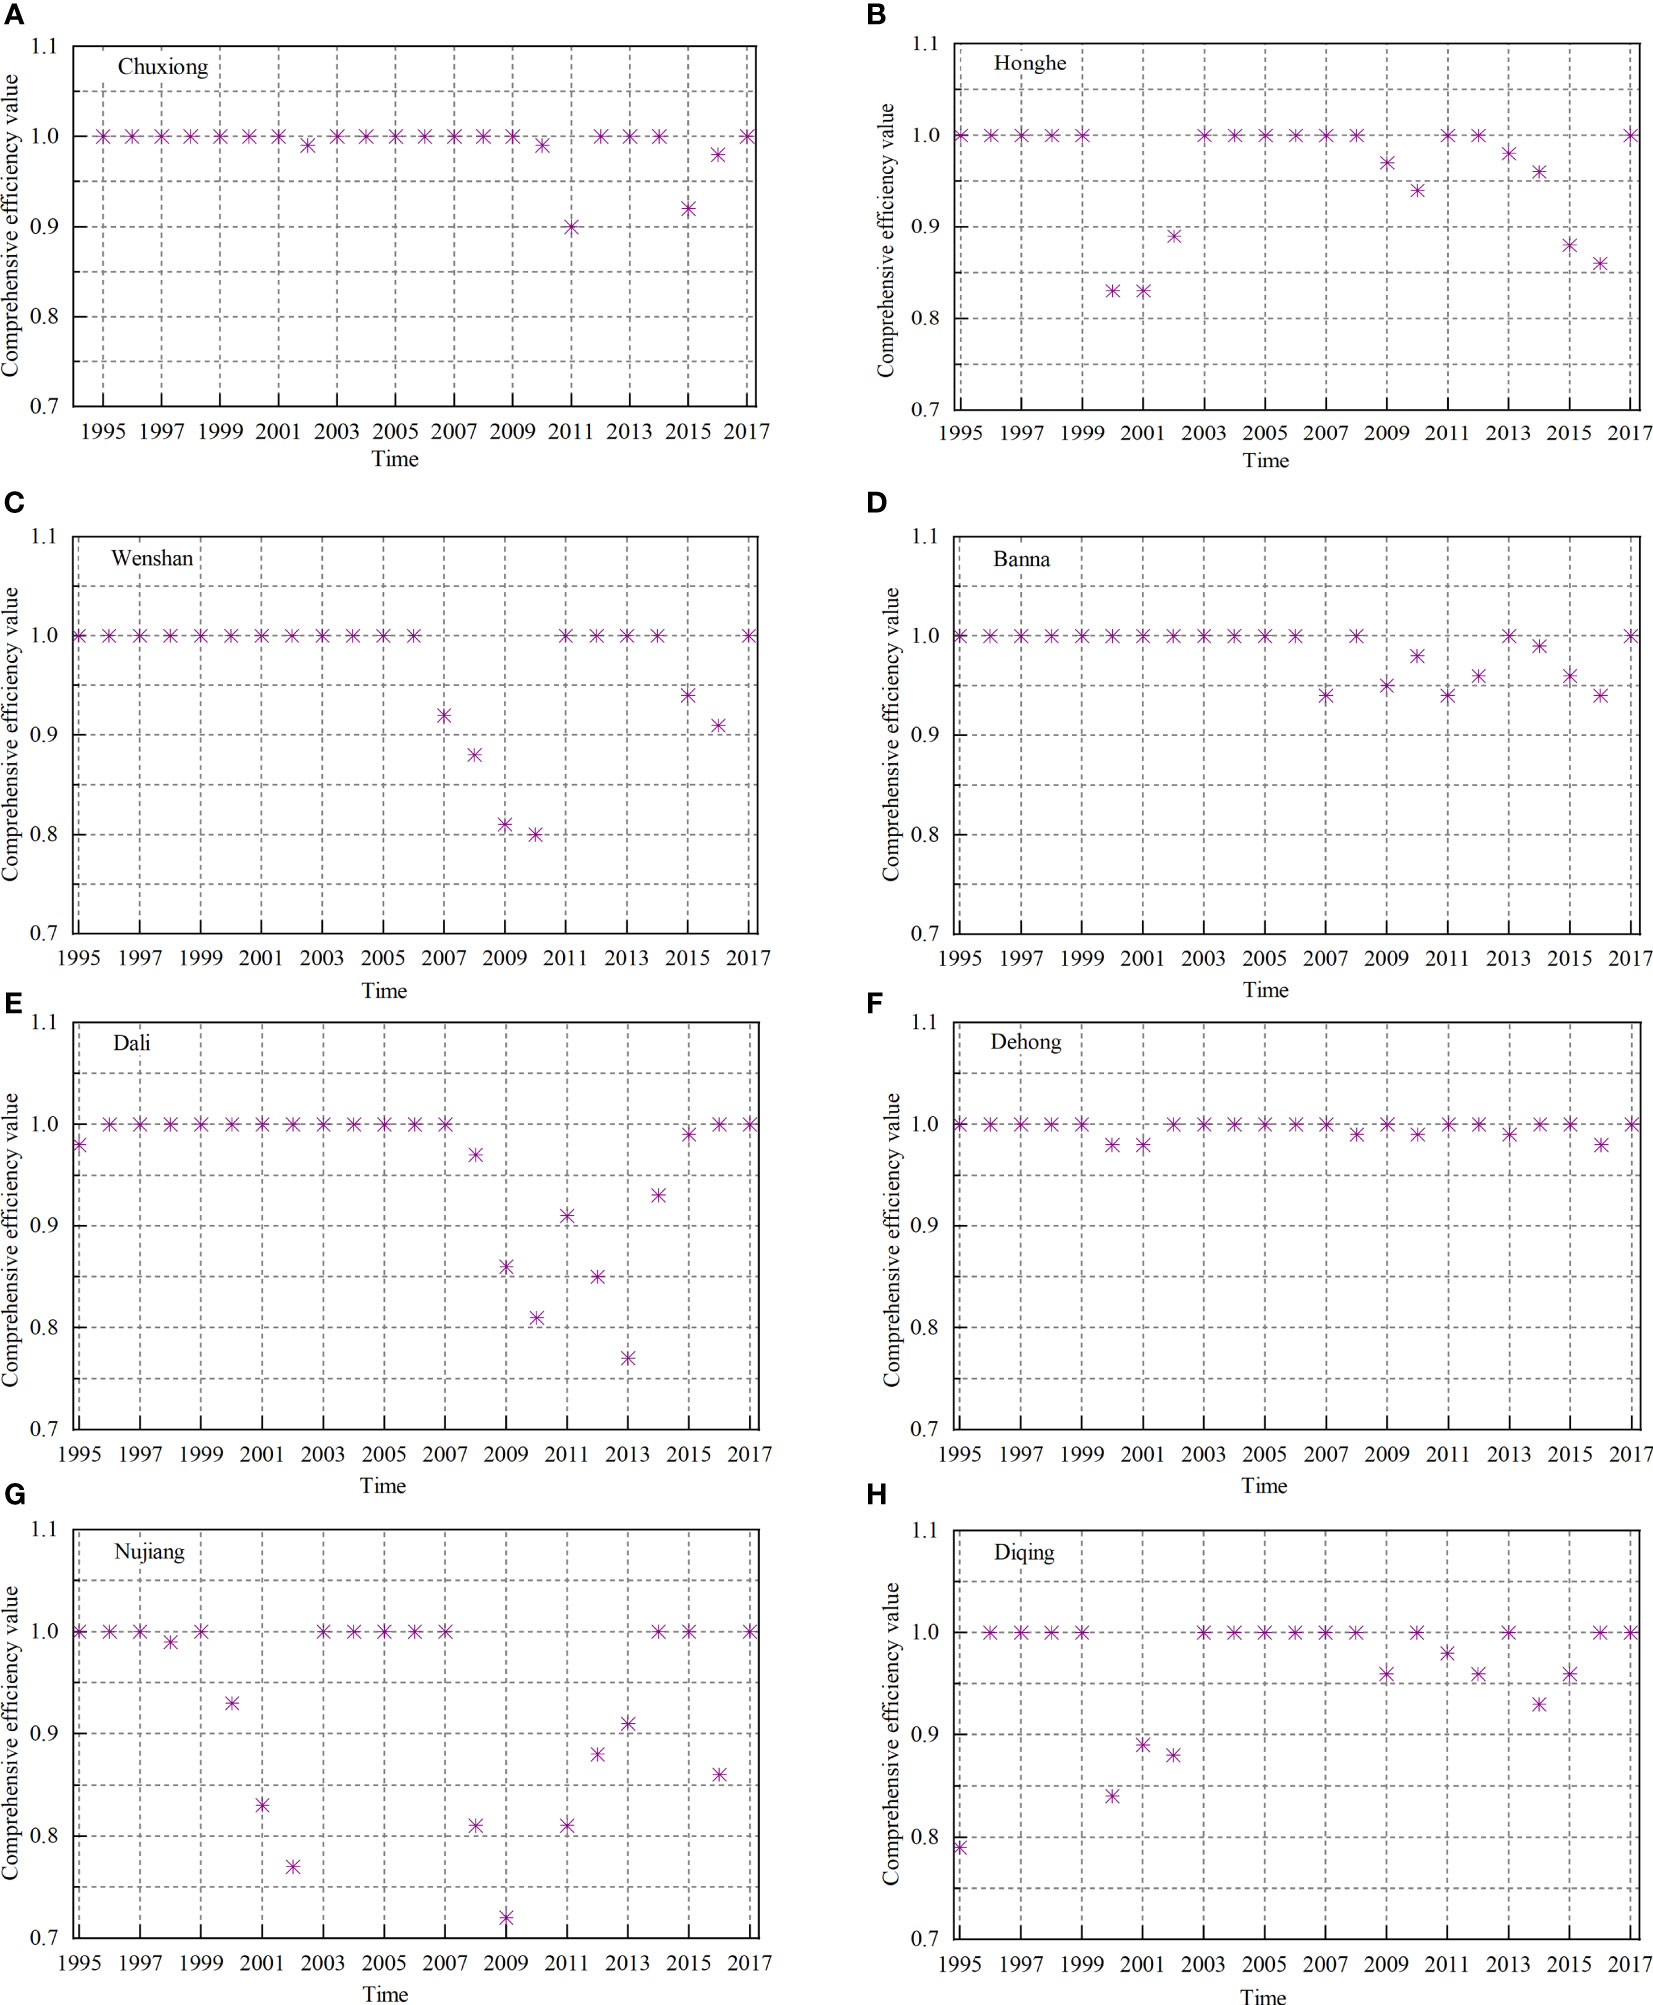
Figure 6 Coordinated development comprehensive efficiency of the human–earth system in Yunnan minority areas (1995–2017). (A) Chuxiong; (B) Honghe; (C) Wenshan; (D) Banna; (E) Dali; (F) Dehong; (G) Nujiang; (H) Diqing.
On the whole, Chuxiong, Wenshan and Dehong are regions with more DEA effective years. Chuxiong has 18 years, Wenshan and Dehong have 17 years. Nujiang had the fewest effective years and the lowest average comprehensive efficiency value of 0.919, and its comprehensive efficiency value in 2010 was only 0.639, which is the lowest in the whole sample period. Under the constraint of a certain degree of coordinated development, the average comprehensive efficiency of the inputs and outputs of the human–earth system in minority areas of Yunnan showed a downward trend. In particular, after 2007, the number of ineffective areas gradually increased. The resource combination among the subsystems in the human–earth system in minority areas of Yunnan is not optimal, with a rising trend of redundant inputs or insufficient outputs.
6 Prediction of the evolution trend of the coordinated development of the human–earth system in Yunnan minority areas
The 0~1 test is used to test the model. Substitute the values of test sample points into the trained network, then MATLAB is used for regression analysis on the output of neural network and the standardized actual values to verify the validity of the model, and the actual data and forecast data of each indicator in Honghe region in 2016 and 2017 are selected for comparative experiments to test the behavior consistency of the model. See Table 2 for the test results.
As seen in Table 2, the Deviation between predicted and actual value is small. The maximum relative error is 17.73% and the minimum relative error is 0.09%. Therefore, it can be concluded that the GA-BP prediction model established in this paper passes the consistency test and can be used to predict the trend of the data of the coordinated development indicators of the human–earth system in Yunnan minority areas.
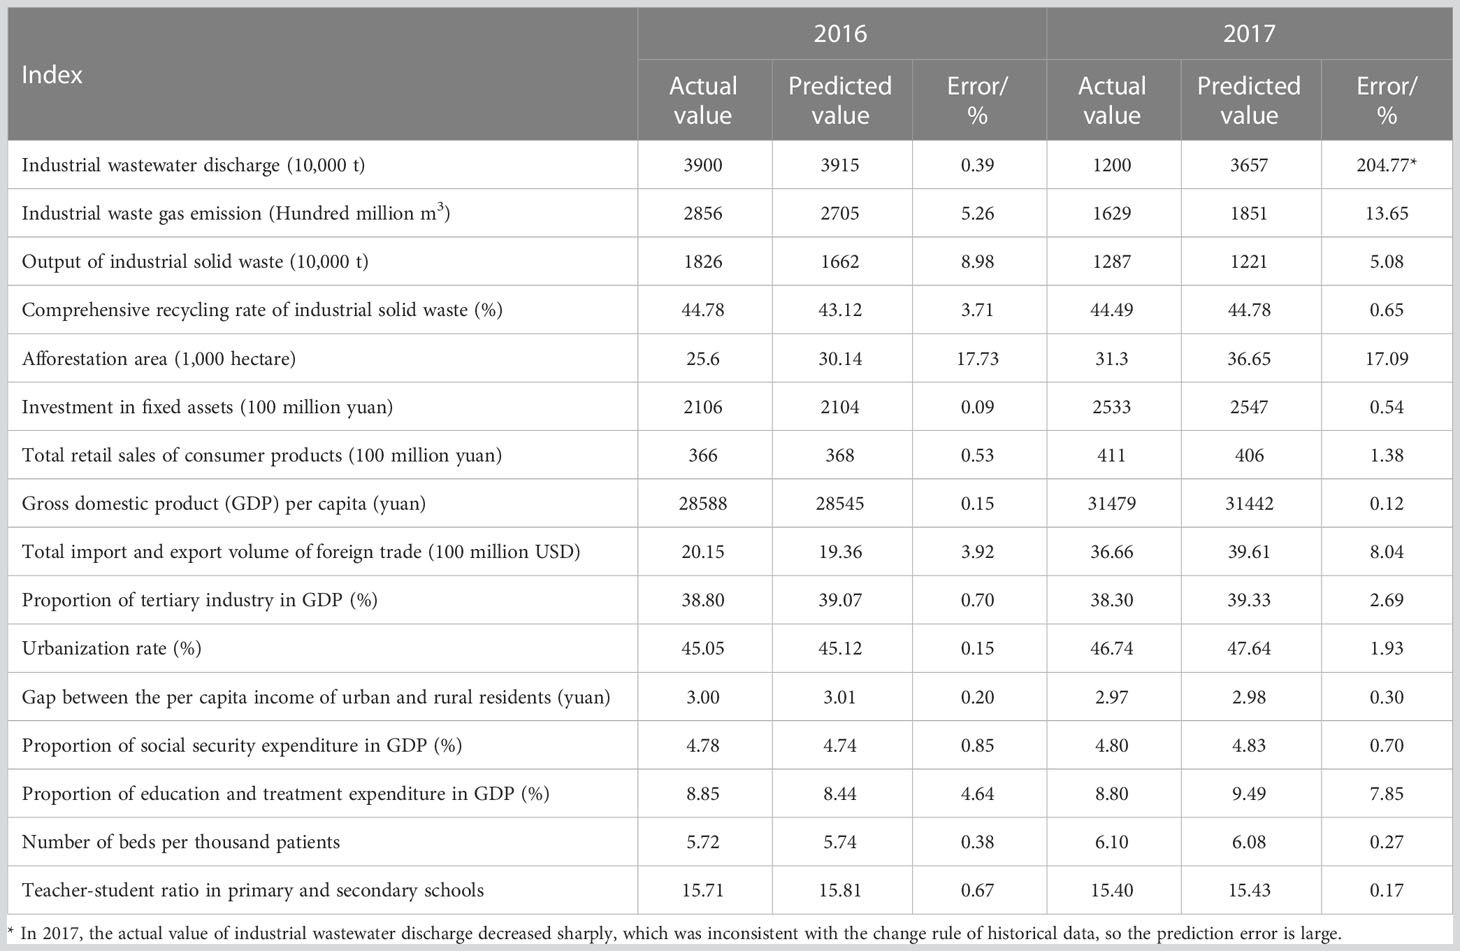
Table 2 Validity test of coordinated development evolutionary prediction model of the Honghe human–earth system.
Based on the predicted data of the indicators, the evolution trend of the coordinated development efficiency of the human–earth system in Yunnan minority areas is calculated as shown in Figure 7, where C is the co-ordination degree, D is the co-ordination development degree, θ is the development efficiency of the whole system, TN, TE, and TS are the development degrees of the natural, economic and social subsystems, respectively.
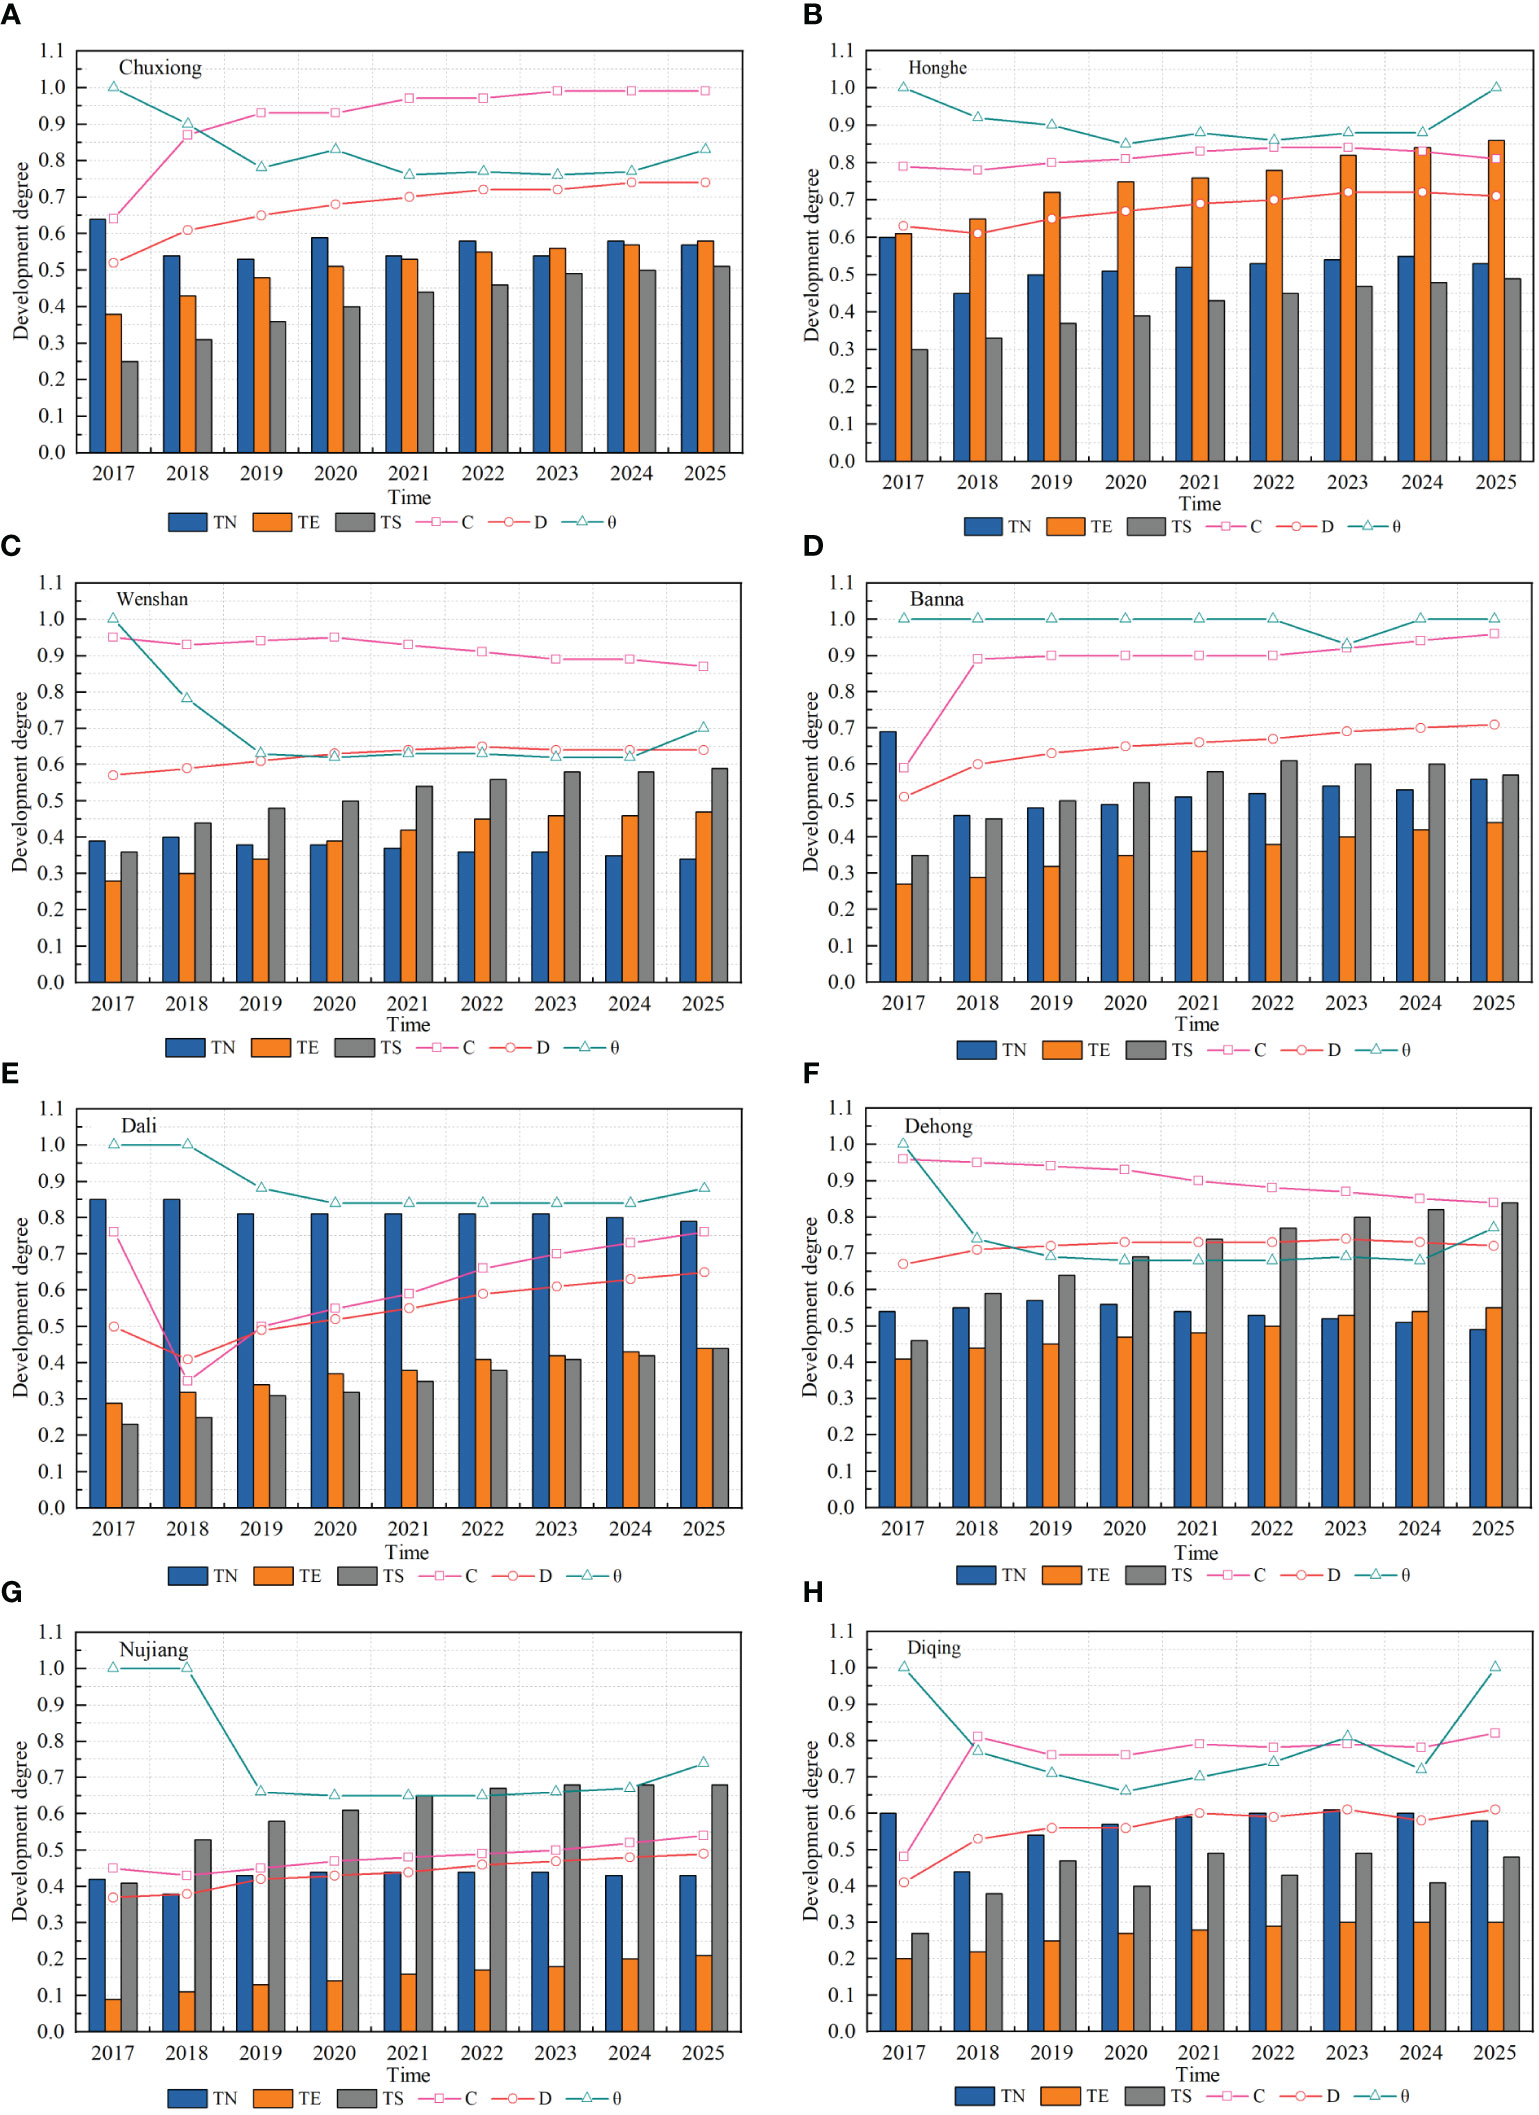
Figure 7 Coordinated development trend of the human–earth system in Yunnan minority areas (2018–2025). (A) Chuxiong; (B) Honghe; (C) Wenshan; (D) Banna; (E) Dali; (F) Dehong; (G) Nujiang; (H) Diqing.
The prediction results show the following changes in the regional human–earth system from 2018 to 2025, based on the existing evolutionary trends and without any intervention. (1) From the perspective of development degree, natural subsystems fluctuated slightly, but generally show a decline in varying degrees. The development degree average of natural subsystems in the 8 regions decreased from 0.541 to 0.536. The development degrees of the economic and social subsystems generally shows an upward trend and their average values of the 8 regions will increase from 0.316 and 0.329 in 2017 to 0.481 and 0.575 in 2025, respectively. (2) From the perspective of coordination degree change, only Dali and Nujiang show an increasing trend, Chuxiong, Banna and Diqing show a stable trend, and Honghe, Wenshan and Dehong show a decreasing trend after a steady development. (3) From the perspective of coordinated development degree change, Dali and Nujiang maintain a relatively slow growth, and the coordinated development degree in Nujiang is still at the bottom, with a value of only 0.49 in 2025. The coordinated development degree of other six regions tends to be stable, and the values are around 0.7. (4) From the perspective of coordinated development efficiency, all the six regions except Honghe and Banna are inefficient regions in 2025. Further study on the Radial Moving (RM) and Slack Moving (SM) of the indicators shows that among the six non-DEA effective regions, only Wenshan has redundancy in input of natural subsystems, indicating that industrial pollution has been controlled to some extent in most regions, however, the phenomenon of redundant input in economic subsystem and insufficient output in natural subsystem is common, indicating that the economic investment pattern and resource recycling rate need to be optimized and improved, as shown in Figure 8.
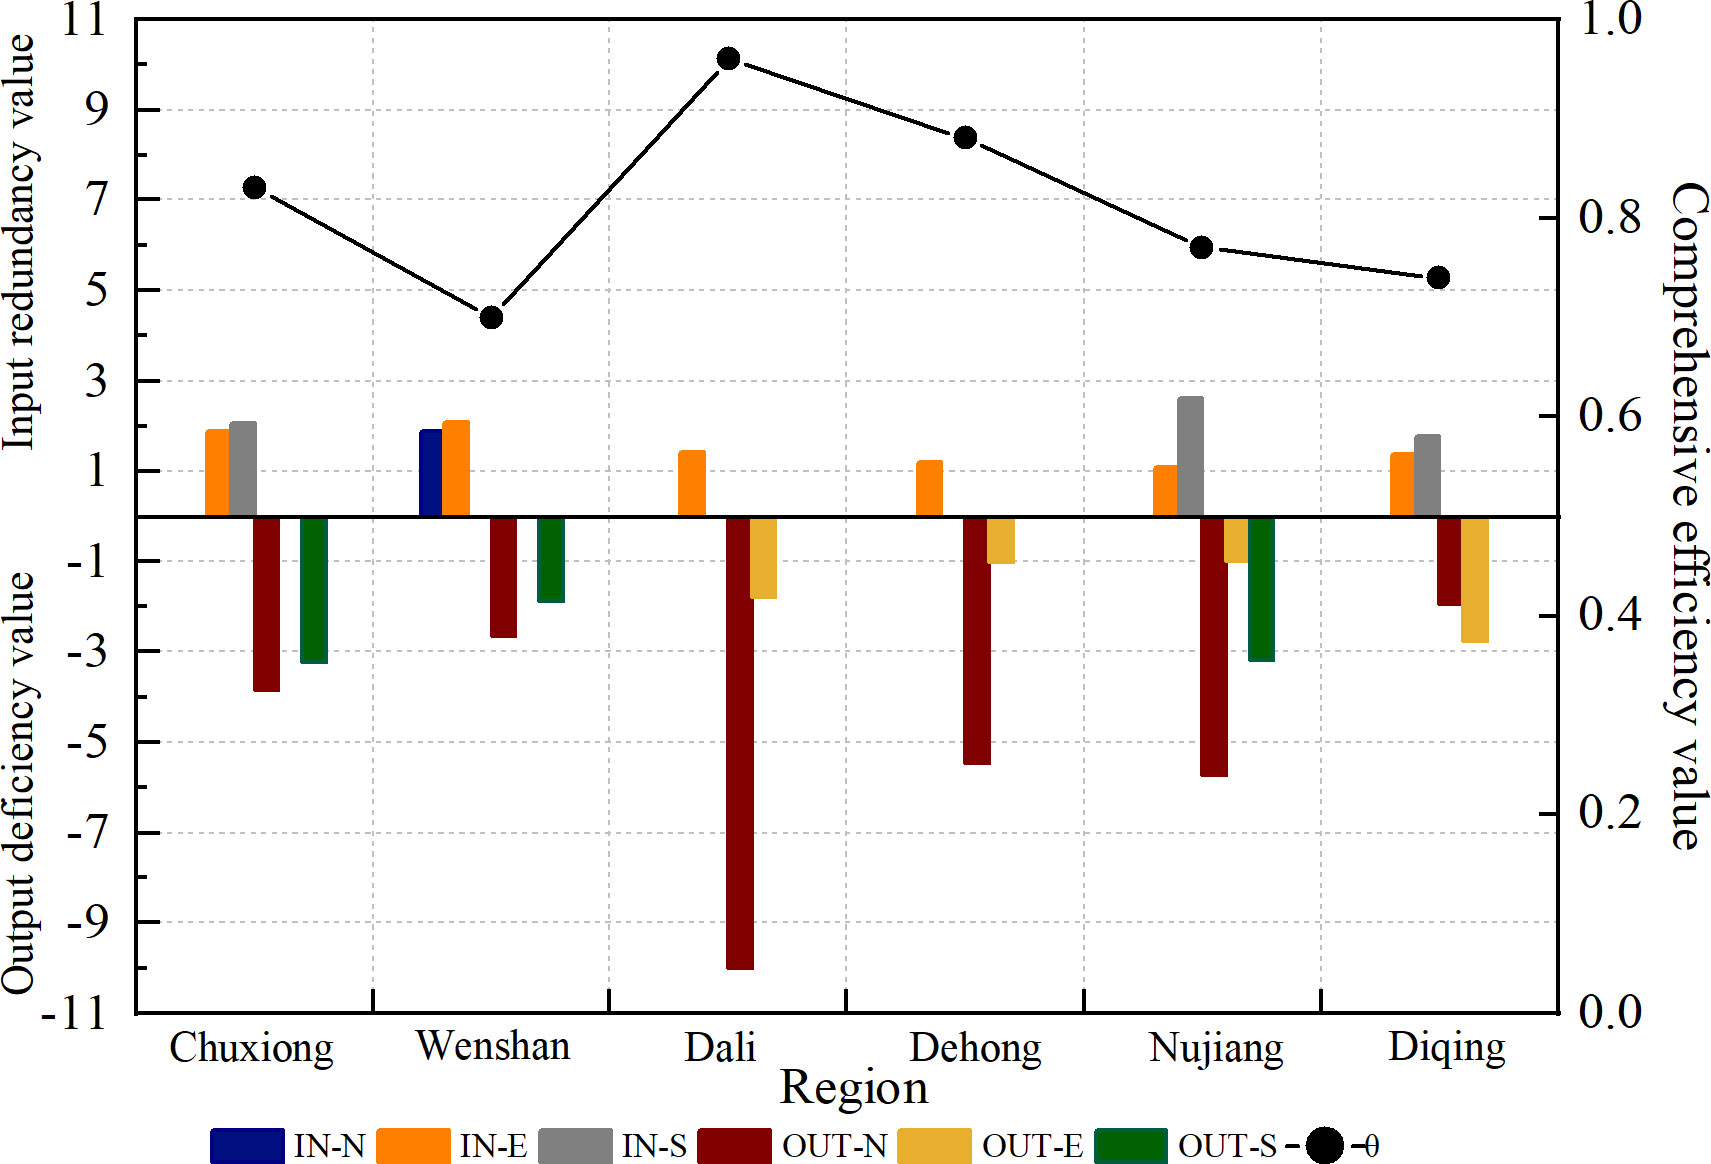
Figure 8 Rm-Sm in non-DEA effective areas in 2025.
7 Suggestions on coordinated development of the human–earth system in Yunnan minority areas
7.1 Add the bearing capacity of natural subsystem
Driven by the strategy of ecological civilization, the Two Mountains Theory has gradually become an important part of the planning of local governments at all levels. The growth rate of the three wastes discharge in most regions has been controlled to a certain extent, and the utilization rate of solid waste has also been continuously improved, but the overall environmental situation is still not optimistic. The construction of environmental system in Wenshan, Dehong, Nujiang lags far behind the development of economic and social subsystems, and the velue of coordinated development degree is low. The prediction results for 2025 show that the development degree of natural subsystems in the 8 regions has declined to varying degrees. Except Honghe and Diqing, the other 6 regions still have extensive development, and the output of natural subsystems is insufficient in DEA measurement. Therefore, in the development process of Yunnan minority areas, we must strengthen ecological restoration and conservation, advocate cleaner production and green consumption, so as to enhance the carrying capacity and comprehensive capacity of regional natural subsystems.
7.2 Optimize the driving force of economic subsystem
Yunnan is a typical resource-based province. At present, the five pillar industries, including tobacco processing industry, biological resource development industry, tourism, mining industry and electric power industry, are all resource-oriented industries. Most of Yunnan’s resources are concentrated in ethnic minority areas, which are highly dependent on resources. To promote the economic development of ethnic minority areas, we must take the improvement of the overall efficiency of resource development and utilization as the goal, formulate differentiated performance assessment standards, perfect the resource development system, take advantage of geographical advantages, actively integrate into the “One Road and One Belt” strategic planning, strengthen cross-border economic trade, and promote development through openness. Through the diversified industrial structure adjustment, the resource advantage will be transformed into the productivity advantage, so as to realize the efficient utilization of resources and the sustainable development of economy.
7.3 Enhance the service capacity of social subsystem
The social development of ethnic minority areas in Yunnan started late. In the interests of the Construction of a harmonious society, we should increase the transfer payment for public services, strengthen the construction of rural infrastructure, narrow the urban–rural gap, and further improve the social development level of ethnic minority areas and enhance the service capacity of social subsystems through optimization of educational resources, medical conditions, social security system, etc.
8 Conclusion
Based on the generalization and analysis of existing theories, this paper defines the connotation of the coordinated development of the human–earth system, around which the evolution trend of the human–earth system in Yunnan minority areas is measured and studied, and the evolution trend of the human–earth system in various regions is predicted. The following conclusions can be drawn.
(1) Based on the NES-E configuration of the human–earth system, this paper defines the coordinated development of the human–earth system as a sustainable development state in which the natural, economic and social subsystems in a certain region cooperate properly and promote each other to maximize the overall efficiency of the system.
(2) From 1995 to 2017, the degree of coordination and coordinated development of the human–earth system in all 8 regions showed a rising tendency, with the average value rising from 0.31 in 1995 to 0.74 in 2017, but the coordinated development degree was lower than the coordination degree, mainly showing as coordination state with low development. Under the constraint of a certain degree of coordinated development, the average comprehensive efficiency of input and output of the human–earth system in Yunnan minority areas shows a decreasing trend. Especially after 2007, the number of areas where DEA was ineffective gradually increased. It shows that the development mode of high input and high consumption in the 8 regions has not been effectively improved.
(3) The prediction results for 2018–2025 show that the human–earth system in Yunnan minority areas has basically entered a stable stage of coordinated development, but according to the historical measurement value from 1995 to 2017 and the prediction value from 2018 to 2025, the average growth rate of the development degree of the economic and social subsystems in the 8 regions is higher than that of the natural subsystem, and the development degree of the natural subsystem in many regions has a negative growth. In particular, the average growth rates of Wenshan, Dali and Dehong are −1.07, −0.35 and −0.25 respectively, which are all less than zero. The human–earth system in Yunnan minority areas generally experiences a stage from low input and low output to high input and high output. To some extent, it reflects the negative correlation between the development degree of natural subsystem and that of economic and social subsystems. With the further development of economy and society, the natural subsystem will face greater pressure.
(4) The ethnic minority areas in Yunnan have an important regional status and outstanding ecological value, but their social and economic development levels are relatively backward. They are typical ecological highlands and poverty alleviation areas. This article studies the evolution laws of the human–earth system from a time dimension and analyzes the key factors that affect its coordinated development that can provide reference basis for maintaining ecological security patterns and ensuring regional comprehensive development efficiency in fragile ecology, backward social and backward economic interaction regions.
Data availability statement
The original contributions presented in the study are included in the article/supplementary material. Further inquiries can be directed to the corresponding author.
Author contributions
LT: conceived the model and completed the manuscript. FL and LH: researched the relevant data. FT and YY: revised the paper. All authors have read and agreed to the published version of the manuscript.
Funding
This work was supported by the Joint Special Fund Project of Basic Research in Local Universities of Yunnan Province of China (202101BA070001-097, 202001BA070001-204).
Acknowledgments
The authors would like to thank the financial supports from the Joint Special Fund Project of Basic Research in Local Universities of Yunnan Province of China.
Conflict of interest
The authors declare that the research was conducted in the absence of any commercial or financial relationships that could be construed as a potential conflict of interest.
Publisher’s note
All claims expressed in this article are solely those of the authors and do not necessarily represent those of their affiliated organizations, or those of the publisher, the editors and the reviewers. Any product that may be evaluated in this article, or claim that may be made by its manufacturer, is not guaranteed or endorsed by the publisher.
References
Aspinall R., Staiano M. (2019). Ecosystem services as the products of land system dynamics: lessons from a longitudinal study of coupled human–environment systems. Landscape Ecology. 34 (7), 1503–1524. doi: 10.1007/s10980-018-0752-7
Aye G., Gupta R., Hammoudeh S., Kim W. G. (2015). Forecasting the price of gold using dynamic model averaging. Int. Rev. Financial Analysis. 41 (10), 257–266. doi: 10.1016/j.irfa.2015.03.010
Barbera E., Curro C., Valenti G. (2010). A hyperbolic model for the effects of urbanization on air pollution. Appl. Math. Model. 34 (8), 2192–2202. doi: 10.1016/j.apm.2009.10.030
Cai S. F. (1997). Scientific definition and operation of coordinated development of regional economy in China. J. Zhongnan Univ. Economics. 3, 21–25+109.
Cao S. Y., Xie G. D. (2009). The evolution of the perspective of functional zoning driven by development issues in china. Resour. Sc. 31 (4), 539–543. doi: CNKI:SUN:ZRZY.0.2009-04-006
Cumberland J. H. A. (1966). Regional inter industry model for analysis of development objectives. Papers Regional Sci. Assoc. 17 (1), 65–94. doi: 10.1007/BF01982510
Diffenbaugh N. S., Burke M. (2019). Global warming has increased global economic inequality. Proc. Natl. Acad. Sci. United States America. 116 (20), 9808–9813. doi: 10.1073/pnas.1816020116
Ellis E. C., Pascual U., Mertz O. (2019). Ecosystem services and nature's contribution to people: negotiating diverse values and trade-offs in land systems. Curr. Opin. Environ. Sustainability 38, 86–94. doi: 10.1016/j.cosust.2019.05.001
Evans M. R., Bithell M., Cornell S. J., Dall S., Díaz S., Emmott S., et al. (2013). Predictive systems ecology. Proc. R. Soc. B: Biol. Sci. 280, 20131452. doi: 10.1098/rspb.2013.1452
Fan J. (2018). “Territorial system of human–environment interaction”: A theoretical corner⁃stone for comprehensive research on formation and evolution of the geographical pattern. Acta Geographica Sinica. 73 (4), 597–607. doi: 10.11821/dlxb20180400
Fang C., Wang Z., Liu H. (2020). Beautiful China Initiative: human–nature harmony theory, evaluation index system and application. J. Geogr. Sci. 30 (5), 619–704. doi: 10.1007/s11442-020-1750-7
Fang C. L., Liu H., Wang S. (2021). The coupling curve between urbanization and the eco-environment: China's urban agglomeration as a case study. Ecol. Indic. 130 (4), 108107. doi: 10.1016/j.ecolind.2021.108107
Fu B. J., Wang S., Shen Y. J., Chen C. X., Li Y., Feng X. M., et al. (2021). Mechanisms of human–natural system coupling and optimization of the Yellow River basin. Bull. Natl. Natural Sci. Foundation China. 35 (4), 504–509. doi: 10.16262/j.cnki.1000-8217.2021.04.002
Gai M., Nie C., Ke L. N. (2018). Carrying capacity and coordinated development of ERE system in the coastal area of Bohai Sea. Economic Geogr. 38 (07), 163–172. doi: 10.15957/j.cnki.jjdl.2018.07.020
Galeotti M., Lanza A., Pauli F. (2006). Reassessing the environmental Kuznets curve for CO2, emissions: a robustness exercise. Ecol. Economics 57 (1), 152–163. doi: 10.1016/j.ecolecon.2005.03.031
Giddings B., Hopwood B., O’brien G. (2002). Environment, economy and society: fitting them together into sustainable development. Sust. Dev. 10 (4), 187–1196. doi: 10.1002/sd.199
Grossman G. M., Krueger A. B. (1995). Economic growth and the environment. Q. J. Economics 110 (2), 353–377. doi: 10.2307/2118443
Hansen J., Hellin J., Rosenstock T. (2019). Climate risk management and rural poverty reduction. Agric. Syst. 172, 28–46. doi: 10.1016/j.agsy.2018.01.019
Hardi P., Barg S., Hodge T. (1997). Measuring sustainable development: review of current practice (Ottawa: Industry Canada).
Hasibagen, Li T. S., Tong B. Q. (2013). Man–land system vulnerability and development model of ecological region. Economic Geogr. 33 (4), 12–19. doi: 10.15957/j.cnki.jjdl.2013.04.028
Huang D. C., Hu H. D., Tian M. (2018). The empirical analysis on synergetic development of ecology and economy composite system in China. Environ. Prot. 46 (14), 39–44. doi: CNKI:SUN:HJBU.0.2018-14-010
Hudak A. T. (1999). Rangeland mismanagement in South Africa: failure to apply ecological knowledge. Hum. Ecology. 27 (1), 55–78. doi: 10.1023/A:1018705300730
Laniak G. F., Olchin G., Goodall J., Voinov A., Hill M., Glynn P., et al. (2013). Integrated environmental modeling: a vision and roadmap for the future. Environ. Model. Software 39, 3–23. doi: 10.1016/j.envsoft.2012.09.006
Li W. L., Kuang W. H., Lv J., Zhao Z. H. (2021) Adaptive evolution mechanism of rural human–land system in farming-and-pastoral areas of northern China Acta Geographica Sinica 76 (2), 487–502 doi: 10.11821/dlxb202102017
Li M. C., Li Q., Wang C. X., Ding X. M. (2022). Temporal and spatial evolution of human land coordinated high-quality development in the Yellow River basin. J. Arid Land Resour. Environ. 36 (2), 1–8. doi: 10.13448/j.cnki.jalre.2022.028
Li X. S., Long X. X., Qi X. X. (2019). Dynamic evolution and analysis of coupling development of economy, society and environment in Yangtze River economic belt. Resour. Environ. Yangtze Basin. 28 (3), 505–516. doi: 10.11870/cjlyzyyhj201903002
Li J., Xu L. L. (2019). Comparison and analysis of research trend prediction models based on machine learning algorithm–BP neural network, support vector machine and LSTM model. J. Modern Information. 39 (4), 23–33. doi: 10.3969/j.issn.1008-0821.2019.04.003
Liang L. W., Wang Z. B., Fang C. L., Sun Z. (2019). Spatiotemporal differentiation and coordinated development pattern of urbanization and the ecological environment of the Beijing-Tianjin-Hebei urban agglomeration. Acta Ecologica Sin. 39 (4), 1212–1225. doi: 10.5846/stxb201809162015
Lin X., Wang D. (2016). Spatiotemporal evolution of urban air quality and socioeconomic driving forces in China. J. Geographical Sci. 26 (11), 17. doi: 10.1007/s11442-016-1342-8
Liu Y. S. (2020). Modern human–earth relationship and human–earth system science. Scientia Geographica Sinica. 40 (8), 1221–1234. doi: 10.13249/j.cnki.sgs.2020.08.001
Liu C. Y., Lin L. X., Kou L. Y., Qiu L. X., Wu J. Q. (2013). Performance comparison between GA-BP neural network and BP neural network. Chin. J. Health Statistics. 30 (2), 173–176+181. doi: CNKI:SUN:ZGWT.0.2013-02-005
Liu Y. S., Qu L. L. (2022). Land use pattern change and human–earth system evolution in Three Gorges Reservoir area in recent 30 years. Resour. Environ. Yangtze Basin. 31 (8), 1664–1676. doi: 10.11870/cjlyzyyhj202208002
Liu H. M., Xing L., Wang C. X., Zhang H. Y. (2022). Sustainability assessment of coupled human and natural systems from the perspective of the supply and demand of ecosystem services. Front. Earth Sci. 10. doi: 10.3389/feart.2022.1025787
Lu D. D. (2003). Some key issues concerning development of geographical science in China. Acta Geographica Sinica.58 1), 3–8. doi: 10.3969/j.issn.1005-5207-B.2003.02.002
Luce R. D. (1986). Uniqueness and homogeneity of ordered relational structures. J. Math. Psychol. 30 (4), 391–415. doi: 10.1016/0022-2496(86)90017-9
Luo S. G., Zeng Z. G. (1999). Reviews of researches on indicator system of sustainable development. Hum. Geography. 14 (4), 54–59. doi: CNKI:SUN:RWDL.0.1999-04-012
Mayes R., Pini B. (2010). The “Feminine revolution in Mining”: a critique. Aust. Geographer. 41 (2), 233–245. doi: 10.1080/00049181003742336
Nielsen S. N., Fath B. D., Bastianoni S., Marques J. C., Tiezzi E. (2020). “Ecosystems as self-organizing hierarchies”, in A New Ecology: Systems Perspective. (Amsterdam: Elsevier Science Press). doi: 10.1016/B978-0-444-63757-4.00005-X
Peng K., Zhu H., Wang S. G., Chen B., Wei W. D., Li J. S. (2018). Energy–water nexus in hubei province based on system input–output analysis and ecological network analysis. J. Natural Resources. 33 (09), 1514–1528. doi: 10.31497/zrzyxb.20170849
Perovi V., Kadovi R., Urevi V., Pavlovi D., Pavlovi P., Cakmak D. (2021). Major drivers of land degradation risk in western Serbia: current trends and future scenarios. Ecol. Indic. 123 (7), 107377. doi: 10.1016/j.ecolind.2021.107377
Qiu J. J., Liu Y. H., Yuan L. (2021). Research progress and prospect of the interrelationship between ecosystem services and human well-being in the context of coupled human and natural system. Prog. Geography. 40 (6), 1060–1072. doi: 10.18306/dlkxjz.2021.06.015
Rajaram T., Das A. (2011). Screening for EIA in India: enhancing effectiveness through ecological carrying capacity approach. J. Environ. Management. 92 (1), 140–148. doi: 10.1016/j.jenvman.2010.08.024
Ren D., Cao G. G., Long S. R. (2021). Analysis of the coordination degree of social development in China based on the framework of HDI. Res. Quantitative Economy Tech. Economy 38 (06), 88–106. doi: 10.13653/j.cnki.jqte.2021.06.004
Robert E., Lucas J. (1999). On the mechanics of economic development. J. Monetary Economics 22 (1), 3–42. doi: 10.1016/0304-3932(88)90168-7
Romer P. M. (1989). Endogenous technological change. Nber Working Papers 98 (98), 71–102. doi: 10.3386/w3210
Sarkodie S. A., Strezov V. (2019). A review on environmental Kuznets curve hypothesis using bibliometric and meta-analysis. Sci. Total Environ. 649, 128–145. doi: 10.1016/j.scitotenv.2018.08.276
Seitzinger S. P., Gaffney O., Brasseur G., Broadgate W., Ciais P., Claussen M., et al. (2015). International geosphere–biosphere programme and earth system science: three decades of co-evolution. Anthropocene 12, 3–16. doi: 10.1016/j.ancene.2016.01.001
Shen L., Liu L. T. (2010). Regional differences and influencing factor for sustainable energy development of China. Chin. J. Population Resour. Environment. 20 (1), 17–23. doi: 10.3969/j.issn.1002-2104.2010.01.004
Solow R. M. (1974). Intergenerational equity and exhaustible resources. Rev. Economic Stud. 41, 29–45. doi: 10.2307/2296370
Wang H., Grant W. E. (2021). Reflections of two systems ecologists on modelling coupled human and natural (socio-ecological, socio-environmental) systems. Ecol. Model. 440, 109403. doi: 10.1016/j.ecolmodel.2020.109403
Wang Y. S., Liu Y. S. (2018). Pollution and restructuring strategies of rural ecological environment in China. Prog. Geography. 37 (5), 710–717. doi: 10.18306/dlkxjz.2018.05.014
Wang M. X., Ma Y., Liu W., Wang Y. L., Li X. (2021). Coupling and coordination relationship between resource recycling and ecological civilization construction. Resour. Science. 43 (3), 577–587. doi: 10.18402/resci.2021.03.14
Wang Y. S., Shi L. N., Liu Y. S. (2020). Evolution process of environmental pollution and its driving mechanisms in rural areal systems. J. Agro-Environment Science. 39 (11), 2495–2503. doi: 10.11654/jaes.2020-0438
Wassily L. (1974). Environmental repercussions and the economic structure: an input–output approach. Rev. Economics Stat 56 (1), 109–110.
Wei H. K. (2008). The changes of China's regional economy in the 30 years of reform and opening up. Economic Perspectives. 5, 9–16. doi: CNKI:SUN:JJXD.0.2008-05-004
Wen W. (2019). Research on the cross-regional ecological compensation coordination mechanism in heilongjiang province (Harbin: Northeast Forestry University).
Weng G. M., Tang Y. B., Pan Y., Mao Y. Q. (2021). Spatiotemporal evolution and spatial difference of tourism–ecology–urbanization coupling coordination in Beijing-Tianjin-Hebei urban agglomeration. Economic Geogr. 41 (12), 196–204. doi: 10.15957/j.cnki.jjdl.2021.12.021
Wu C. J. (1991). On the research core of geography: the regional system of human–earth relations. Economic Geography. 11 (3), 1–6. doi: 10.15957/j.cnki.jjd1.1991.03.001
Wu C. J. (2008). Theoretical research and regulation of the regional system of human land relations. J. Yunnan Normal Univ. 40 (02), 1–3.
Yang S. H. (1994). A study on the forecast and regulation of coordinated development of urban environment and economy in Guangzhou. Chin. Geographical Sci. 14 (2), 136–143. doi: 10.13249/j.cnki.sgs.1994.02.136
Yang Y. J., Goodrich J. A. (2014). Toward quantitative analysis of water-energy-urban-climate nexus for urban adaptation planning. Curr. Opin. Chem. Engineering. 5, 22–28. doi: 10.1016/j.coche.2014.03.006
Yang L. J., Yang H. N., Yang Y. C., Wei W., Pan J. H. (2020). Spatial-temporal evolution of ecological environment quality in hexi corridor based on coupled coordination model. China Population Resour. Environ. 30 (01), 102–112. doi: CNKI:SUN:ZGRZ.0.2020-01-012
Yao N., Wang Y. Z., Ke L. H. (2022). Study on the evolution mechanism of cooperative transformation of resource-exhausted city composite system: a case of Huangshi city. China Min. Magazine. 32 (1), 67–75. doi: 10.12075/j.issn.1004-4051.2023.01.011
Ye D. F. (2001). The interactive mechanism of man–earth areal system and the sustainable development. Geographical Res. 20 (3), 307–313. doi: 10.3321/j.issn:1000-0585.2001.03.007
Yu H. Z., Li L. J., Li J. Y. (2021). Construction of risk assessment model of water resources carrying capacity in Beijing-Tianjin-Hebei region. Geographical Res. 40 (9), 2623–2637. doi: 10.11821/dlyj020201055
Zeng Z. X., Gu P. L. (2000). System analysis and evaluation of sustainable development (Beijing, China: Science Press).
Zeng R., Wei Y. M., Fan Y. (2000). System analysis of harmonization development among population, resource, environment and economy. Syst. Engineering-Theory Practice. 20 (12), 1–6. doi: 10.3321/j.issn:1000-6788.2000.12.001
Keywords: human–earth system, coordinated development, comprehensive efficiency, DEA, evolutionary trend
Citation: Tai L, Lu F, Huang L, Tian F and Yang Y (2023) Study on the efficiency evolution trend of coordinated development of the human–earth system in minority areas of Yunnan, China. Front. Ecol. Evol. 11:1181352. doi: 10.3389/fevo.2023.1181352
Received: 07 March 2023; Accepted: 30 June 2023;
Published: 26 July 2023.
Edited by:
Nallapaneni Manoj Kumar, City University of Hong Kong, ChinaReviewed by:
Haimeng Liu, Chinese Academy of Sciences (CAS), ChinaMeena Kumari Kolli, Indian Institute of Technology Bombay, India
Copyright © 2023 Tai, Lu, Huang, Tian and Yang. This is an open-access article distributed under the terms of the Creative Commons Attribution License (CC BY). The use, distribution or reproduction in other forums is permitted, provided the original author(s) and the copyright owner(s) are credited and that the original publication in this journal is cited, in accordance with accepted academic practice. No use, distribution or reproduction is permitted which does not comply with these terms.
*Correspondence: Lingjuan Tai, dGFpbGoxMTI0QGttdS5lZHUuY24=