 Xi Chen
 Junting Zhou2
 Lirong Xing
- 1College of Humanities and Social Sciences, Jiangsu University of Science and Technology, Zhenjiang, China
- 2School of Economics and Management, Southeast University, Nanjing, China
- 3College of Economics, Shandong University of Technology, Zibo, China
- 4College of Economics, Hefei University of Technology, Hefei, China
- 5Institute of Agricultural Economics and Development, Jiangsu Academy of Agricultural Sciences, Nanjing, China
How to ensure a coordinated development between land urbanization and grain production has been a key issue that needs to be urgently addressed to achieve sustainable development in China. Taking Jiangsu province as an example, this paper measures the coupling coordination degree (CCD) between county land urbanization and grain production from 2010 to 2020 based on the coupling coordination degree model (CCDM). In addition, the exploratory spatial data analysis method and the space Durbin model are combined to explore the spatial correlation and influencing factors of the CCD between land urbanization and grain production. The main conclusions are as follows: (1) From a temporal perspective, the CCD between county land urbanization and grain production in Jiangsu is dominated by basically coordinated, with an overall stable rising trend and a distribution pattern of Northern Jiangsu > Central Jiangsu > Southern Jiangsu. (2) From the perspective of spatial distribution, the CCD between the two is dominated by basically coordinated in the Southern, Central and Northern Jiangsu regions. The spatial clustering characteristics are significant, and the distribution of counties with basically coordinated shows concentrated and contiguous characteristics. (3) From the perspective of spatial correlation, the CCD between the two shows a low level of positive spatial autocorrelation. The state of agglomeration is significant in Northern Jiangsu, while spatial agglomeration is sporadic in Southern Jiangsu and insignificant in Central Jiangsu. (4) The factors affecting the CCD between county land urbanization and grain production in Jiangsu province are determined by many factors together. Based on a driver perspective, Per capita GDP and chemical fertilizer application intensity have a negative effect on it. Highway network density and mobile internet penetration rate have a positive effect on it. Population density, advanced industrial structure, per capita grain planting area and agro-industrial agglomeration are not significant. This study offers useful insights for promoting the coupled and coordinated development of county urbanization and grain production in China.
Introduction
Urbanization is essentially a process of change and integrated transformation of production factors from rural to urban development (Yang et al., 2015). Land and population are considered to be two key dimensions in describing the urbanization process (Lu et al., 2018). Since the 1950s, the harmonization of urbanization and grain production has attracted the attention of people from all walks of life. This is due to the fact that many countries and regions are facing serious challenges of unsustainable development by adopting urban boundary expansion as their development direction (Cui et al., 2019; Lv et al., 2019). In addition, according to data published by the United Nations, the urbanization rate of the population is expected to rise from 30% to 69% from 1950 to 2050 (Deng et al., 2015; Sulemana et al., 2019). It is well known that urban construction land is the spatial carrier for the development of population urbanization (Tsutsumida et al., 2015; Lv et al., 2019). Therefore, the development of population urbanization also drives the process of land urbanization. However, land is a scarce resource and the total amount is constant. This may lead to the global development process facing a game between land for construction and arable land, which is directly related to the problem of grain security.
As the world’s largest developing country, the urbanization rate of China’s population reached 64.72% by the end of 2021 (National Statistical Office, 2022). This means that a large amount of arable land resources is converted into land for urban construction. In addition, local governments have tended to adopt the model of “generating wealth with land and attracting wealth with land” to drive economic growth in recent years (Jin and Dai, 2021). This initiative has further accelerated the process of land urbanization. Some studies found that the rate of land urbanization in China is currently higher than the rate of population urbanization (Lin et al., 2015; Yuan et al., 2020). This poses a serious challenge to arable land conservation and national grain security (Lambin and Meyfroidt, 2011; Deng et al., 2015).
Currently, the construction of county urbanization serves as an important vehicle for the integrated development of China’s urban-rural areas. Then, how to ensure a coordinated development between land urbanization and grain production in county areas? According to data published in the China Statistical Yearbook of Urban and Rural Construction, the built-up area of counties increased from 10,427 square kilometers in 2001 to 20,867 square kilometers in 2020, with an average annual growth rate of 3.72% (Ministry of Housing and Urban-Rural Development, 2020). In fact, land is a non-renewable resource. If land for urban construction increases, it will inevitably displace arable land resources and affect national grain security. One study found that between 1995 and 2000, land urbanization in county areas in eastern China reduced arable land by 7%, and between 2000 and 2008, the loss of arable land increased to 29.2% (Deng et al., 2015). Therefore, it is necessary for this study to explore the coupling coordination relationship between land urbanization and grain production based on the county dimension.
However, there is no consensus in academic research on the relationship between land urbanization and grain production. One view is that the urbanization process may be detrimental to grain production (Satterthwaite et al., 2010; D’Amour et al., 2017). Based on the production factor perspective, urbanization not only leads to the restructuring of agricultural production factor inputs, but also triggers changes in production methods and cropping structures, that negatively affect grain security (Chen et al., 2007; Masters et al., 2013; Long et al., 2018). In addition, urbanization may attract a large influx of rural people to towns and cities, which not only reduces the number and quality of agricultural labor, but also increases the abandonment of arable land, thus affecting grain production (Lu H. et al., 2019; Qiu et al., 2020). Another view is that urbanization is beneficial to grain production (Liu et al., 2021). Urbanization not only promotes local economic development, but also increases agricultural investment and promotes technical efficiency in agriculture (Liang and Yang, 2019; Zhou et al., 2020). Moreover, while urbanization accelerates the flow of rural people into non-agricultural employment, it also creates opportunities for agricultural land transfer and land resource redistribution, which increases agricultural intensification and scale management (Gao et al., 2020; Yu et al., 2020). There are even scholars who argue that urbanization contributes to China’s self-sufficiency in grains (rice and wheat) based on a grain category perspective (Lu et al., 2017). It can be seen that the multidimensional complexity of the impact of urbanization on grain production has led to the existence of divergent views among scholars with different academic backgrounds, which provides important insights for this study. We can’t help but wonder whether there can be a coordinated development between county urbanization and grain production in China to ensure national grain security?
Compared with previous studies, this study highlights the following aspects. First, many scholars tend to study the impact of urbanization on grain production, but few have analyzed the coordinated development issue between land urbanization and grain production based on the county level. This paper takes the counties of Jiangsu province as the subject of study, further breaking down the research scale and providing more practical value. Second, this paper makes full use of spatial geography study methods to analysis the spatiotemporal evolution of the coupling coordination degree (CCD) between county land urbanization and grain production in Jiangsu province from a macro perspective. Finally, few scholars have taken spatial geography into account in previous studies on the factors influencing the CCD between land urbanization and grain production, which may lead to biased empirical estimates. This problem can be effectively solved by using the spatial Durbin model in this paper.
This study includes five parts. The first part is an introduction that describes the background, problem and significance of the study. The second part is materials and methods, mainly including the study area, data sources, study methodology and selection of indicators. The third part is the spatiotemporal characteristics of the CCD between land urbanization and grain production in county areas. The fourth part is the analysis of factors influencing the CCD between land urbanization and grain production in county areas. The fifth part is the main research conclusions and policy recommendations.
Materials and methods
Study area and data sources
Jiangsu province is located in the middle of China’s eastern coastal region (Figure 1) and is situated in the Yangtze River Economic Belt. According to data released by the National Bureau of Statistics, in 2021, Jiangsu’s GDP ranked second in the country, just behind Guangdong province; the population urbanization rate was as high as 73.94%, ranking fourth in the country, which was much higher than the national average of 64.72%. With the rapid development of population urbanization in Jiangsu, land for urban construction is increasing. Since land resources are certain, this will inevitably squeeze a large amount of arable land and affect grain production. Jiangsu province ranks 4th in the country with a population of 85.05 million by the end of 2021. According to the criteria of the “National Grain Security Medium and Long-term Planning Outline (2008–2020)”, Jiangsu province is one of the 13 major grain producing areas in China. In fact, grain production is not only the lifeblood for ensuring national grain security, but also the basis for the development of secondary and tertiary industries. Therefore, this paper mainly selects counties in Jiangsu as the research object to explore the CCD between land urbanization and grain production and its driving factors analysis.
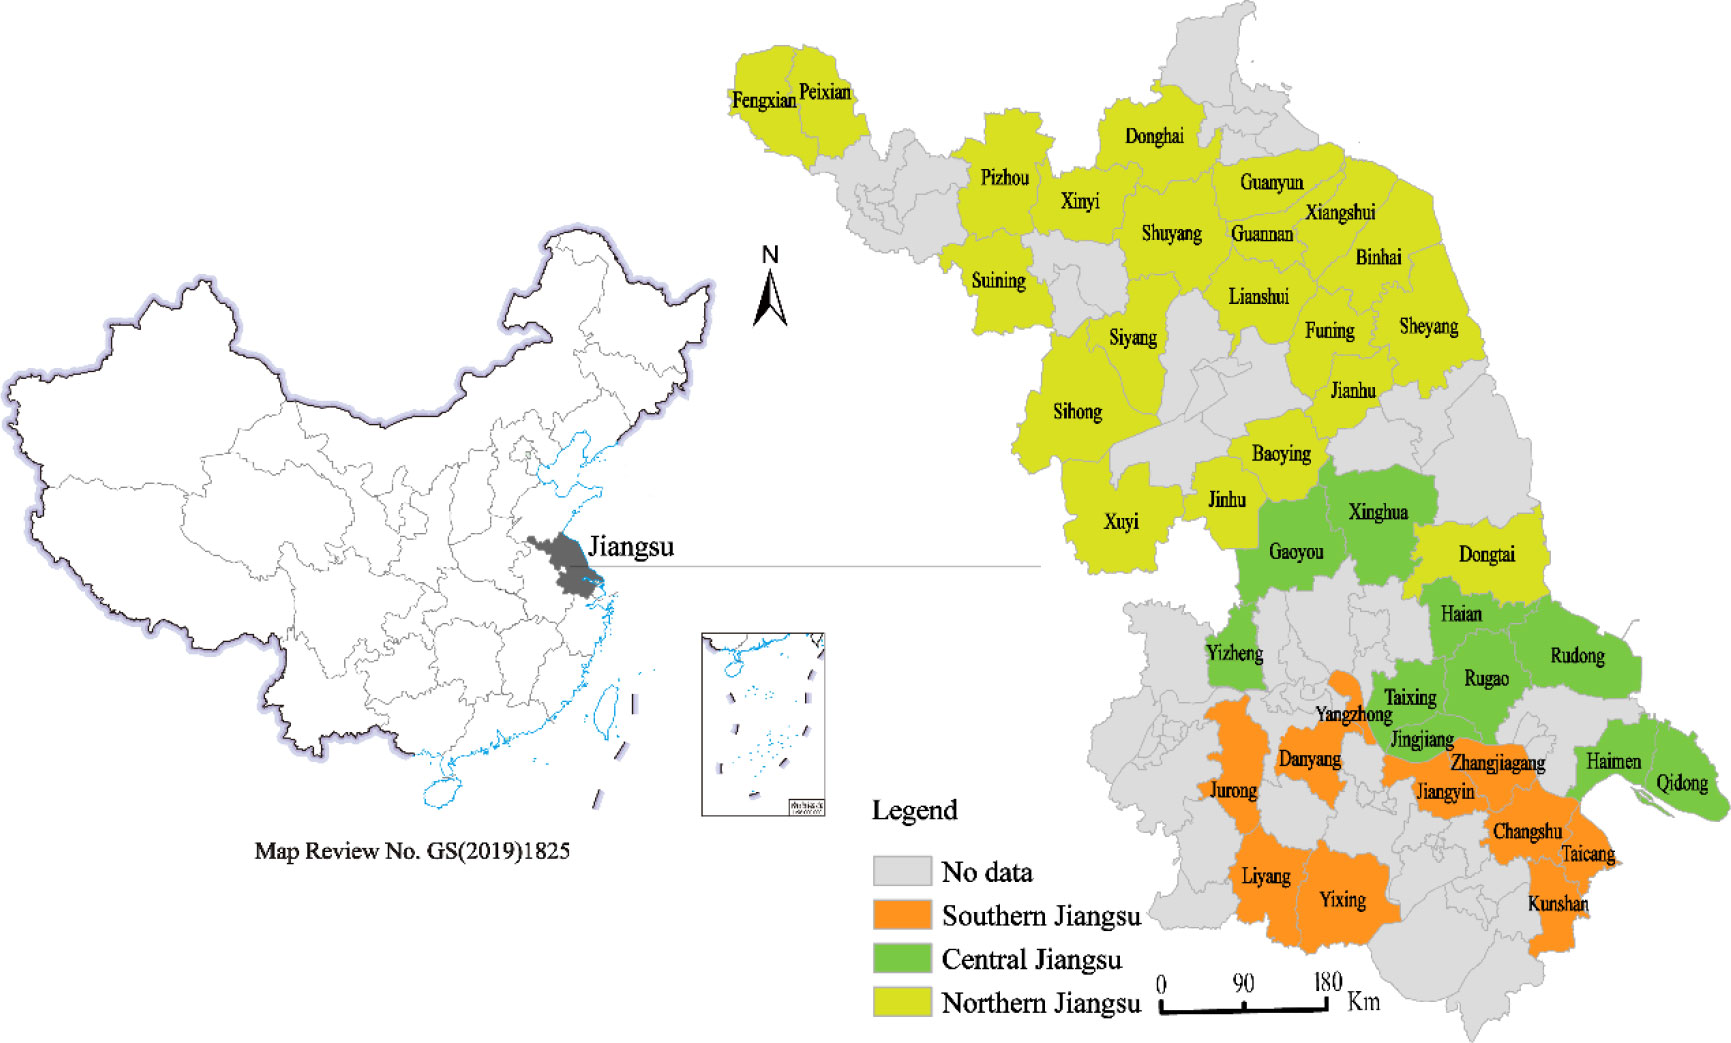
Figure 1 Location of Jiangsu province in China.
At the end of December 2021, there are 19 counties and 21 county-level cities in Jiangsu province. As Haimen County only becomes Haimen District in 2020, it is also included as a research object in this paper. It should be noted that the part without data in Figure 1 is mainly the urban district of the city. Since municipal districts mainly develop non-agricultural industries and lack of statistical data, they are not considered as research subjects in this paper. The data in this paper are taken from the Jiangsu Statistical Yearbook.
Methods
Data standardization
First, the raw data are standardized in order to eliminate the dimensional differences between different indicators. The specific processing methods are as follows (Cui et al., 2019; Zhang et al., 2021; Zhou et al., 2022):
If the value of the variable is as large as possible, then formula (1) is used for data processing. If the variable values have an inverse effect, formula (2) is used for data processing. In formula (1) and formula (2), Xij represents the standardized value of the measured number. Xj represents the value of the measured data of the j-th index. Xmax represents the maximum value of the measured data of the j-th index. Xmin represents the minimum value of the measured data of the j-th index.
Coupling coordination degree model
The coupling coordination degree (CCD) is the degree to which land urbanization and grain production are harmoniously aligned in the process of change. The higher the CCD, the stronger the coupling coordination. It can be calculated by the following formula (Cui et al., 2019; Zhang et al., 2021; Zhou et al., 2022):
In formula (3) and formula (4), CD represents the coupling degree, and takes values in the range of [0, 1]. f(L) represents the level of land urbanization, which is expressed as the proportion of the built-up area of the county to the total area of the county (Ye and Wu, 2014; Lv et al., 2019; Cao et al., 2021). g(G) represents grain production, measured by the total value of grain production in the county. CCD represents the coupling coordination degree between land urbanization and grain production, and takes values in the range [0, 1]. T represents the composite coordination index. m and n represent the coefficients to be determined. In this paper, land urbanization and grain production are considered equally important, so m + n = 0.5. Based on the research experience of related scholars (Ariken et al., 2020; Ding et al., 2022), the CCD is divided into five levels (Table 1).

Table 1 Classification level of CCD between land urbanization and grain production.
Exploratory spatial data analysis methods
ESDA methods is a commonly used method to judge spatial agglomeration, including global spatial autocorrelation (GSA) and local spatial autocorrelation (LSA) (Anselin et al., 2006).
①GSA is used to judge the spatial dependence of geographic phenomena across the region by Moran’s index (Moran’s I). It can be calculated by the following formula (Sridharan et al., 2007):
②LSA is used to describe the degree of similarity and the pattern of change of attributes between adjacent regions. Local Moran’s I and LISA aggregation diagrams are common research methods. It can be calculated by the following formula:
In formula (5) and formula (6), I(d) and Ii take values in [−1,1]. If the value is greater than zero, it means aggregation, less than zero, it means dispersion, and equal to zero, it means no spatiality. Xirepresents the observed values. is the average of Xi. n is the sample size. Zi and Zj are the standardized values. Wij is the space matrix.
Spatial Durbin model
Spatial econometric models include the spatial error model (SEM), the spatial lag model (SLM) and the spatial Durbin model (SDM). The Wald test is often used as the basis for discriminating whether to use the spatial Durbin model (SDM). In addition, the SDM model controls for time and individual effects (Yang et al., 2022). The model form is as follows (Lesage and Pace, 2009):
In formula (7), Y is the dependent variable. X is the relevant explanatory variable. is the spatial lag factor. is the spatial spillover factor. W is the 41*41 geographic contiguity matrix created. is the coefficient. is the random error term. and ν are spatial and time effects, respectively.
Since the regression coefficients of the explanatory variables in the spatial econometric model cannot identify the degree of effect on the dependent variable, it is necessary to decompose them into direct effect, indirect effect and total effect by finding partial differentiation (Lesage and Pace, 2009). Therefore, equation (7) requires further rewriting.
In formula (8), Y is the N*1 dimensional dependent variable. I is an N*1 dimensional unit matrix. d is a constant term. represents an N*1 dimensional vector whose elements are all 1. is the N*K dimensional matrix of all explanatory variables. is the random error term. The other variables have the same meaning as above. Thus, the specific form of the partial differential matrix for the K-th explanatory variable at period t is as follows:
In formula (9), is the direct effect. The average of the elements on the non-diagonal is the indirect effect. The total effect is the sum of the direct and indirect effects.
Variables
This paper takes the CCD as the dependent variable. Based on relevant studies (Lv et al., 2019; Lu X.H. et al., 2019; Hou et al., 2022; Gu et al., 2023), the independent variables are selected in terms of population density, economic development, industrial structure, and agricultural production conditions. Population density (PD) is expressed as the ratio of total population to administrative area at the end of the year and reflects the degree of population density in an area at a given time. Economic development is expressed as per capita GDP (PGDP), which reflects the regional market level to some extent. Advanced industrial structure (AIS) is expressed by the ratio of the value added of the tertiary industry to that of the secondary industry, which can reflect the level of upgrading of industrial structure. Per capita grain planting area (PGPA) is expressed by dividing the sown area of grain crops by the number of people working in agriculture, reflecting the situation of rural grain planting. Chemical fertilizer application intensity (CFAI) is measured by the amount of fertilizer applied per ha (Wu et al., 2021). Agro-industrial agglomeration (AIA) is expressed as the ratio of the total agricultural output value of each region to the total agricultural output value of the province (Xiao, 2012). Highway network density (HND) is measured by dividing the road miles per area by the area of the administrative region, reflecting the transport accessibility of each region. Mobile internet penetration rate (MIPR) is measured as the ratio of cell phone subscribers to the total population in each region at year-end, reflecting the level of informatization in each region. The descriptive statistics of each variable are shown in Table 2.
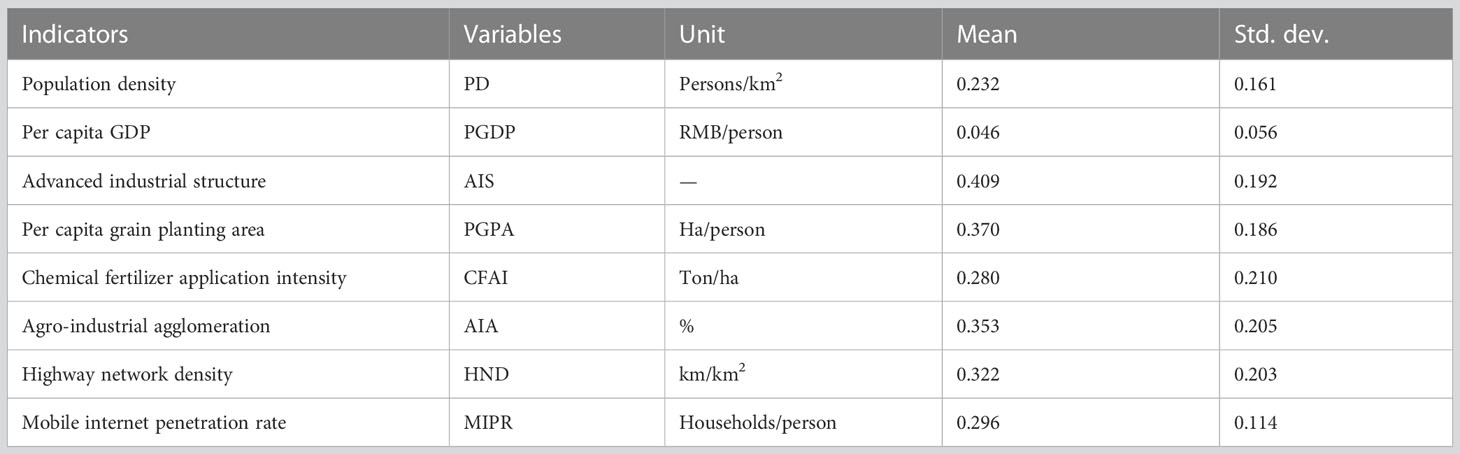
Table 2 Variable descriptive statistics.
Spatiotemporal characteristics of the CCD
Temporal evolution characteristics
Temporal evolution of land urbanization and grain production
First, the temporal evolution of land urbanization in county areas of Jiangsu. From Figure 2A, it is evident that land urbanization in county areas of Jiangsu showed a rising trend year by year. It rose to 0.032 in 2020 from 0.024 in 2010, with an average annual growth rate of 2.9%. The level of land urbanization varied greatly among regions, with a general distribution pattern of Southern Jiangsu > Central Jiangsu > Northern Jiangsu. The level of land urbanization in Southern Jiangsu ranked first and showed a fluctuating rising trend, to 0.058 in 2020 from 0.041 in 2010, with an average annual growth rate of 3.5%. The level of land urbanization in Central Jiangsu ranked second, lower than the countywide average in Jiangsu, and showed a fluctuating rising trend, to 0.028 in 2020 from 0.021 in 2010, with an average annual growth rate of 2.9%. The level of land urbanization in Northern Jiangsu ranked third and showed a rising trend year by year, to 0.022 in 2020 from 0.016 in 2010, with an average annual growth rate of 3.2%.
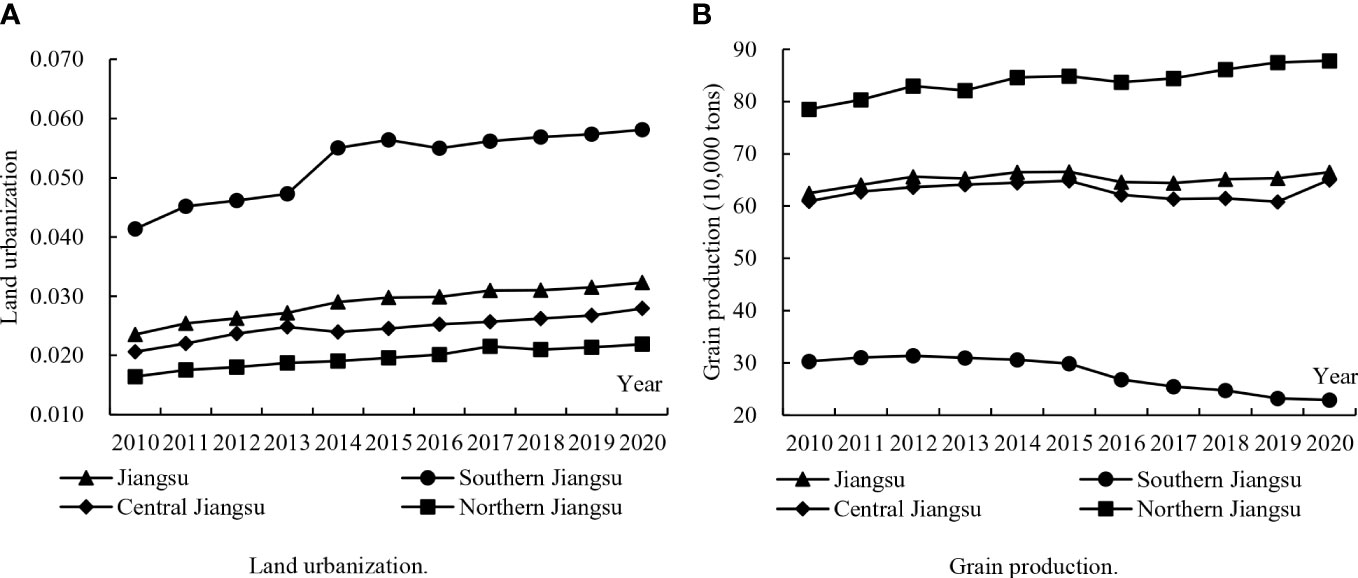
Figure 2 Temporal evolution of (A) land urbanization and (B) grain production (2010–2020).
Second, the temporal evolution of grain production in county areas of Jiangsu. From Figure 2B, it is evident that the grain production in county areas of Jiangsu rose year by year from 2010 to 2015, before it started to decrease in the following two years, and then started to rise again year by year. Overall, it was relatively stable with small fluctuations. However, grain production varied widely among regions, showing an overall distribution pattern of Northern Jiangsu > Central Jiangsu > Southern Jiangsu, which was opposite to land urbanization. Grain production in Northern Jiangsu ranked first and showed a fluctuating rising trend, to 0.878 million tons in 2020 from 0.785 million tons in 2010, with an average annual growth rate of 1.1%. Grain production in Central Jiangsu ranked second, which was lower than the countywide average in Jiangsu, with a rising trend year by year during 2010–2015, after which it started to fall slightly and started to rise after 2019. Overall, the changes are small and relatively stable. Grain production in Southern Jiangsu ranked third, with a rising trend year by year during 2010–2012, after which it started to decline year by year. It dropped to 0.229 million tons in 2020 from 0.303 million tons in 2010, with an average annual growth rate of −2.8%.
Overall, during the period of 2010–2020, both land urbanization and grain production in county areas of Jiangsu show a rising trend, and the development rate of land urbanization is significantly higher than the growth rate of grain production. Among the regional differences, Southern, Central and Northern Jiangsu also show the same characteristics. However, Southern Jiangsu and Northern Jiangsu show a significant polarization trend. These may be closely related to the level of local economic development and location. In contrast to Central and Northern Jiangsu, Southern Jiangsu is close to the Yangtze River Delta economic zone and mainly develops non-agricultural industries.
Temporal evolution of the CCD between land urbanization and grain production
The CCDM were used to measure the CCD between land urbanization and grain production in county areas of Jiangsu from 2010 to 2020 (Figure 3). From Figure 3, it is evident that the CCD between land urbanization and grain production in county areas of Jiangsu only reached basically coordinated and showed an overall stable rising trend. The CCD increased to 0.471 in 2020 from 0.414 in 2010, but the growth trend was relatively slow. In addition, the level of the CCD between land urbanization and grain production varied widely among regions, showing an overall distribution pattern of Northern Jiangsu > Central Jiangsu > Southern Jiangsu. The CCD in Northern Jiangsu was the highest, showing a good rising trend. Its CCD steadily rose to 0.506 from 0.421 with an average annual growth rate of 1.9%, and the overall is at the basically coordinated level. The level of CCD between land urbanization and grain production in Central Jiangsu ranked second and also showed a good rising trend. Its CCD steadily rose to 0.477 from 0.390 with an average annual growth rate of 2%, and reached the basically coordinated level since 2011. The level of CCD between land urbanization and grain production in South Jiangsu ranked third and showed a rising and then falling trend, with the turning point in 2014. Its CCD fluctuated in the range of 0.393 and 0.456 with an average annual growth rate of -0.07%, which was at a low level of basic coordination.
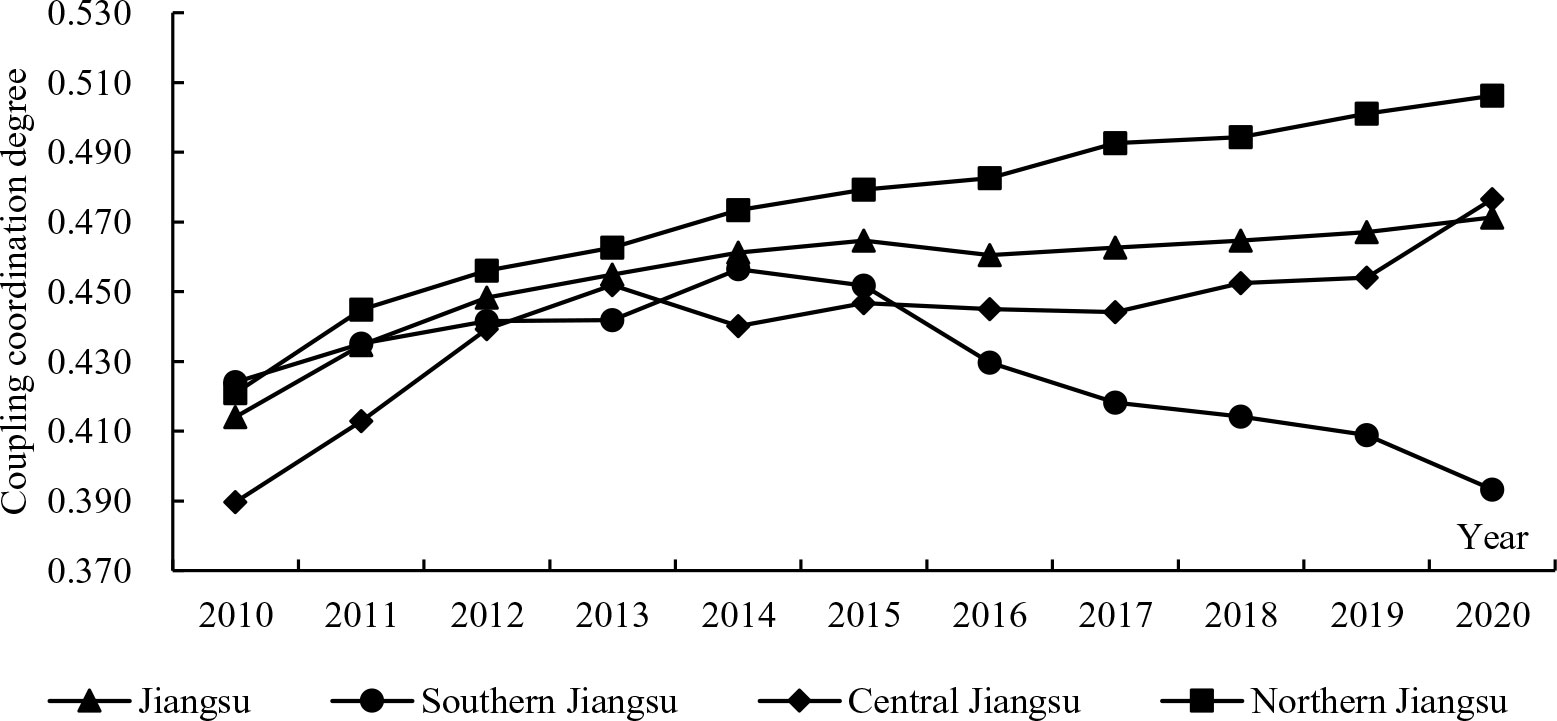
Figure 3 Temporal evolution of the CCD between land urbanization and grain production (2010–2020).
In summary, the CCD between land urbanization and grain production in the county areas of Jiangsu is low, which is dominated by basically coordinated. In addition, the ranking of CCD is Northern Jiangsu > Central Jiangsu > Southern Jiangsu. The reason is that Northern Jiangsu is dominated by the Northern Jiangsu Plain, which is located at the downstream of the Huaihe and Yishu-Si water systems. The region has flat topography, fertile soil and convenient irrigation, leading to obvious advantages in agricultural conditions. Compared with the other two regions, the land in Northern Jiangsu is less urbanized which squeezes out less arable land. Therefore, the CCD between land urbanization and grain production is relatively high in Northern Jiangsu. However, the Southern and Central Jiangsu are an important part of the Yangtze River Delta urban agglomeration. In particular, the commercial economy in Southern Jiangsu is more developed and the urbanization is rapid, which displaces a large amount of arable land and results in a relatively low CCD between land urbanization and grain production.
Spatial pattern characteristics
To reflect the spatial pattern characteristics of the CCD between land urbanization and grain production in county areas of Jiangsu province, this paper drew on the approach of Zhang and Li (2021) by adopting the natural break method with 2010, 2015 and 2020 as the study time points. Then, the map was produced using ArcGIS 10.7 software (Figure 4).
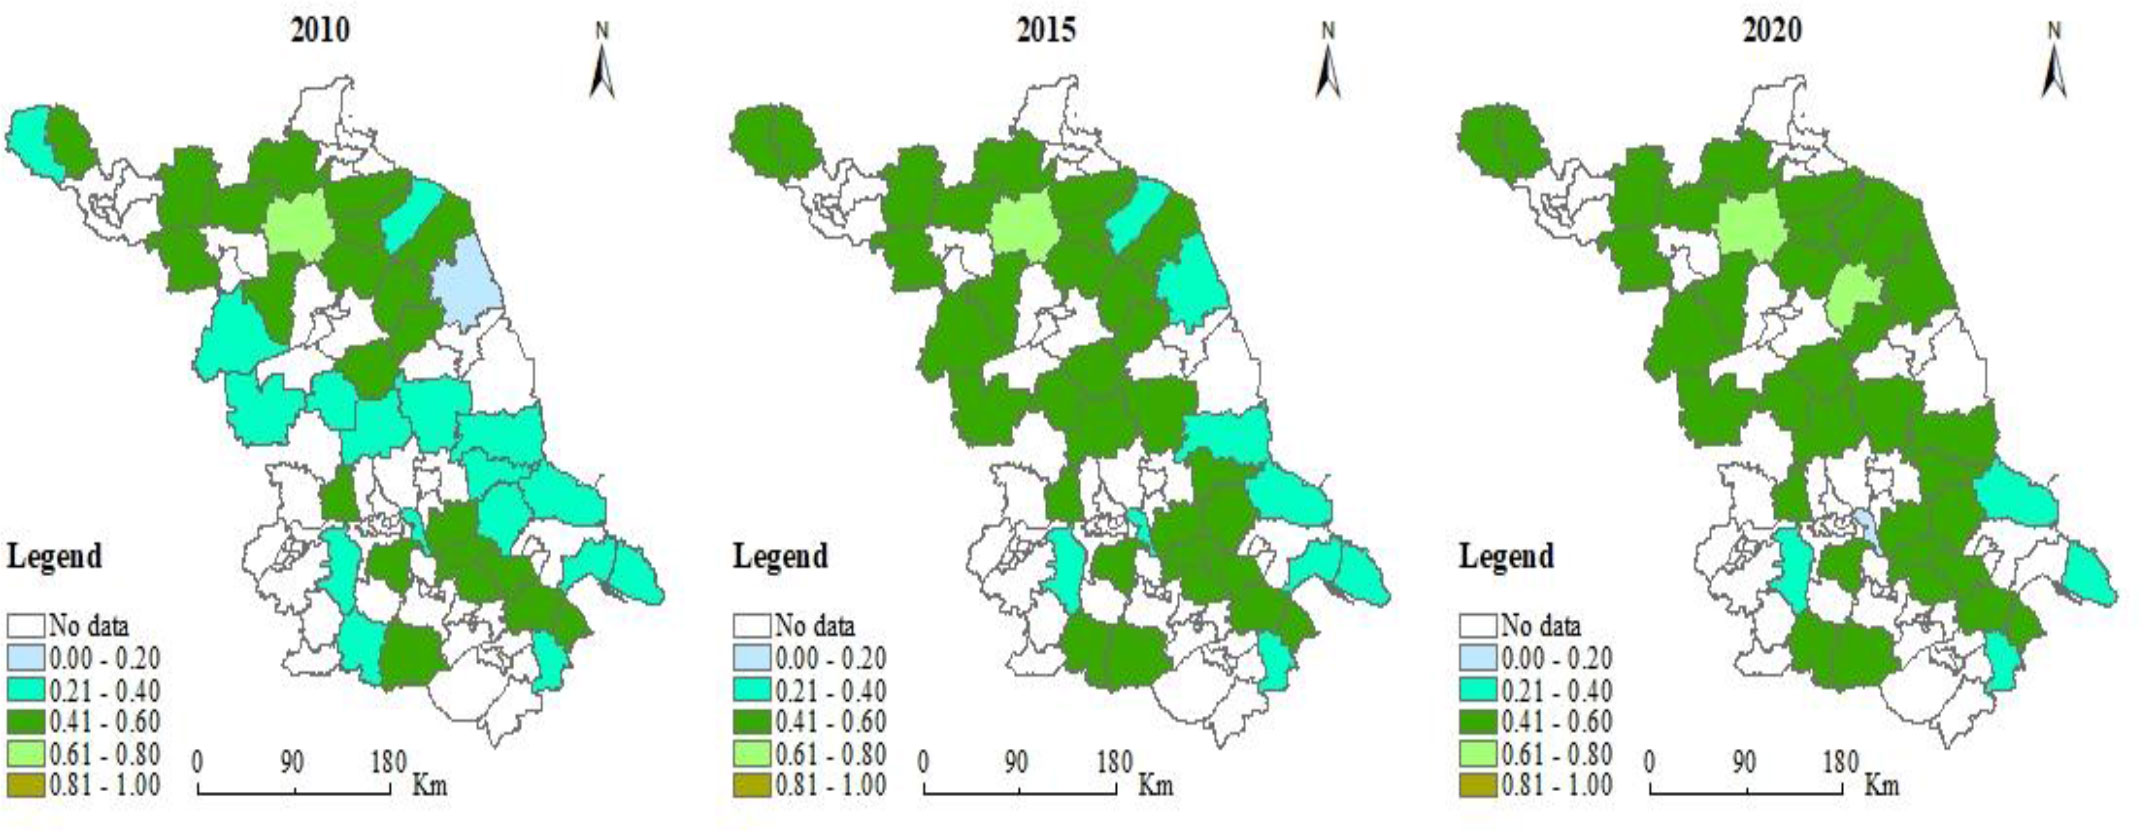
Figure 4 Spatial distribution of CCD between land urbanization and grain production in county areas of Jiangsu (2010, 2015 and 2020).
From Figure 4, it is evident that the CCD between land urbanization and grain production in 2010 was dominated by basically coordinated in Northern Jiangsu and Southern Jiangsu. Among them, Shuyang in Northern Jiangsu reached moderately coordinated, while Central Jiangsu was moderately unbalanced. In 2015, CCD in Southern, Central and Northern Jiangsu were all dominated by basically coordinated, among which Shuyang in Northern Jiangsu remained moderately coordinated, with moderate unbalance mainly sporadically distributed in the coastal counties. In 2020, the Southern, Central and Northern Jiangsu remained dominated by basically coordinated, among which 2 counties in Northern Jiangsu reached moderately coordinated, namely Shuyang and Funing.
In summary, the spatial distribution of CCD between land urbanization and grain production in county areas of Jiangsu has two main characteristics. First, the regional differences are small. The Southern, Central and Northern Jiangsu are all dominated by basically coordinated. Second, the spatial agglomeration characteristics are remarkable. The distribution of the county’s higher level of CCD not only shows concentrated contiguous characteristics, but also is mainly distributed around urban areas.
Spatial correlation characteristics
Global Moran’s I
To further validate the spatial correlation of CCD between land urbanization and grain production in county areas of Jiangsu, GeoDa1.12 software in this paper was applied to measure the global Moran’s I values of CCD between land urbanization and grain production in county areas from 2010 to 2020 (Table 3).
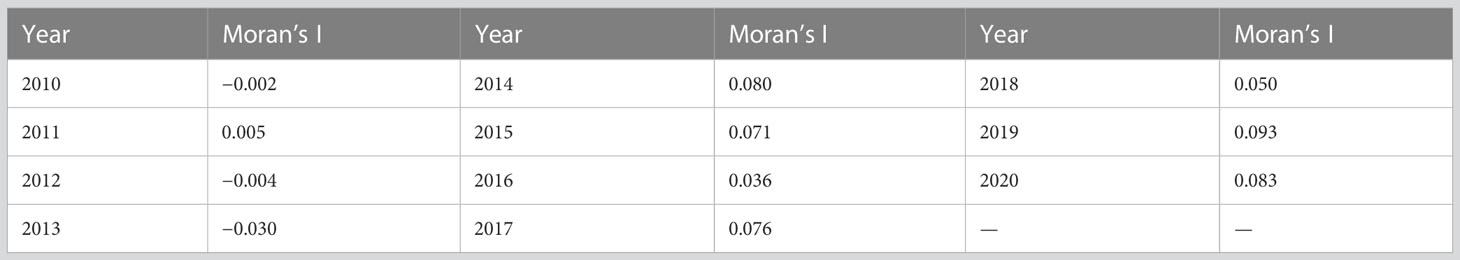
Table 3 Global Moran’s I values (2010–2020).
Table 3 shows that the overall positive spatial autocorrelation characteristic of the CCD between county land urbanization and grain production showed a low level from 2010 to 2020 (except for 2010, 2012 and 2013). The Moran’s I values showed a fluctuating trend and could be roughly divided into 2 stages. The first stage was from 2010 to 2013. The Moran’s I value showed a fluctuating downward trend or even a negative value, indicating a weakening of the spatial agglomeration of the CCD. The second stage was from 2013 to 2020. The Moran’s I value showed a fluctuating rising trend, indicating an increase in the spatial agglomeration of the CCD. This was closely related to the Opinions of Provincial Government on Solidly Promoting Urbanization and Promoting Integration of Urban and Rural Development issued by Jiangsu province in 2012. The policy proposed to insist on small towns as the basis of integrated urban and rural development.
Local Moran’s I
To present the spatial agglomeration characteristics of the CCD between land urbanization and grain production in the county areas of Jiangsu, it is necessary to adopt Local Moran’s I for in-depth analysis in this paper. Therefore, in this paper, the LISA agglomeration map of the CCD between county land urbanization and grain production in Jiangsu was drawn using ArcGIS 10.7 software (Figure 5).
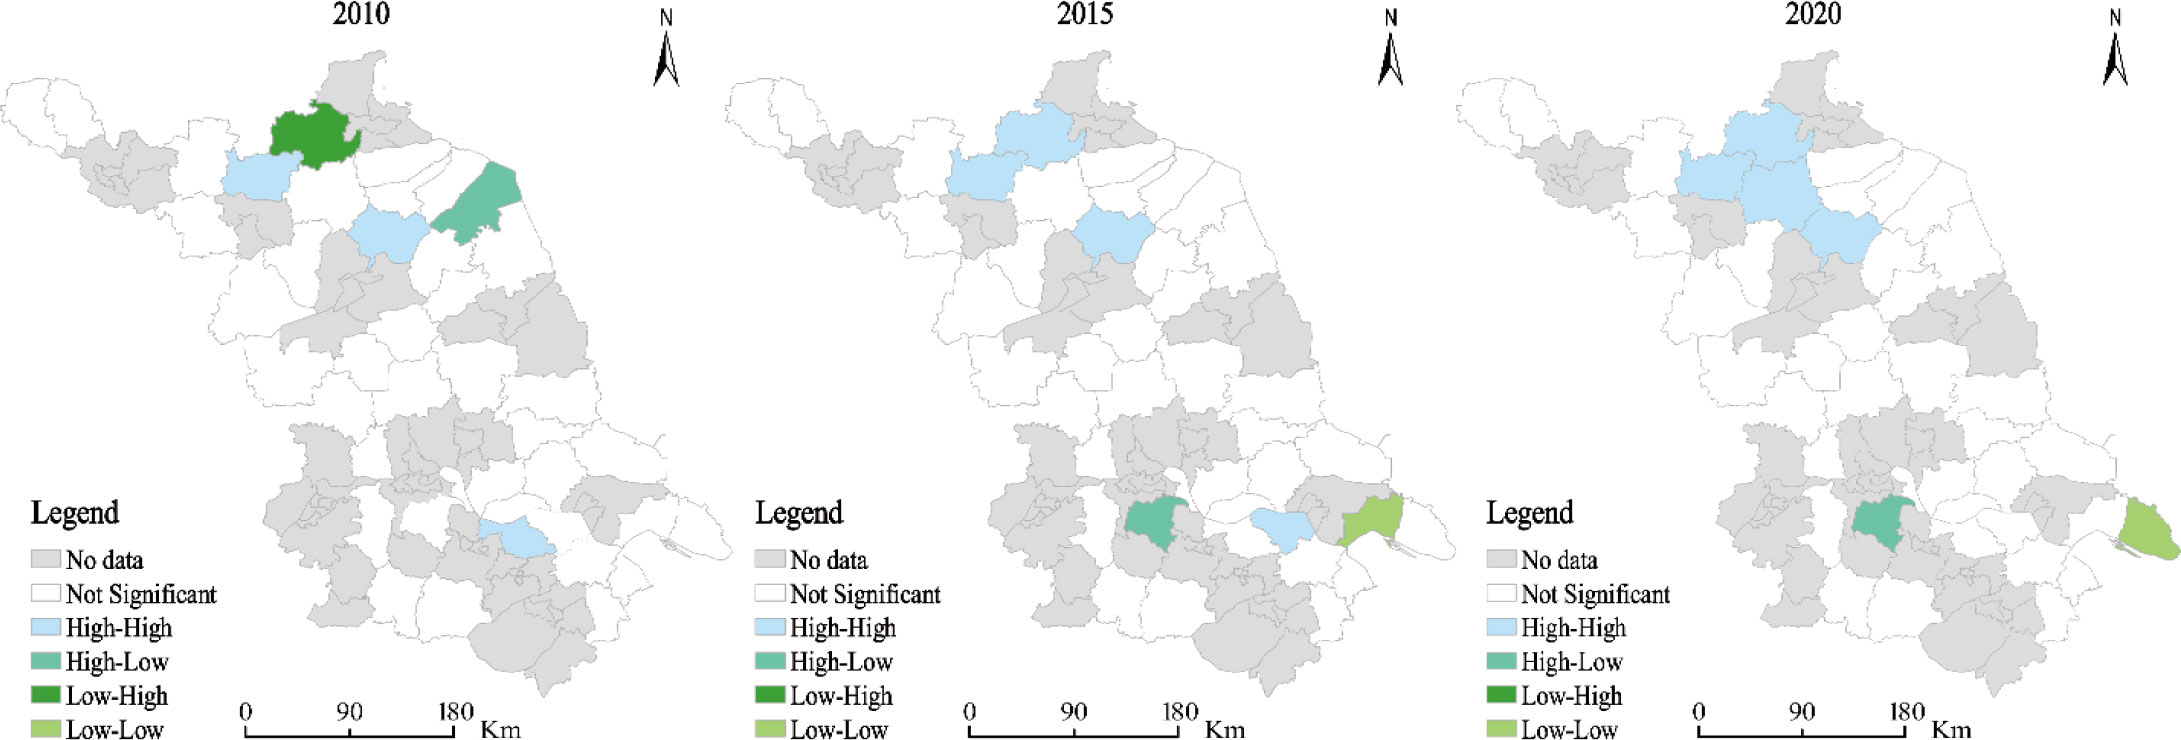
Figure 5 LISA agglomeration map of the CCD between county land urbanization and grain production in Jiangsu (2010, 2015 and 2020).
Figure 5 shows that in 2010, “High-High” agglomerations were mainly located in Xinyi, Lianshui and Jiangyin, and “High-Low” agglomerations were mainly located in Binhai, while “Low-High” agglomerations were mainly located in Donghai. In 2015, “High-High” agglomerations were mainly located in Xinyi, Donghai, Lianshui and Zhangjiagang, and “High-Low” agglomerations were mainly located in Danyang, while “Low-Low” agglomerations were mainly located in Haimen. In 2020, “High-High” agglomerations were mainly located in Xinyi, Donghai, Shuyang and Lianshui, and “High-Low” agglomerations were mainly located in Danyang, while “Low-Low” agglomerations were mainly located in Qidong. Overall, the spatial agglomeration characteristic is gradually highlighted in Northern Jiangsu, while the spatial agglomeration is scattered in Southern Jiangsu and not significant in Central Jiangsu.
Empirical analysis of influencing factors
Selection of spatial econometric models
Due to the existence of spatial correlation, estimation using the traditional ordinary least squares (OLS) method may lead to biased or even erroneous conclusions. Therefore, the MLE method of Elhorst (2010) was used to estimate and test the model in this paper. For the test identification of spatial econometric models, Elhorst (2014) argued that the Wald test is a criterion to determine whether the SDM can be reduced to a spatial error model (SEM) or a spatial lag model (SLM). The Wald test results showed that SDM could not be reduced to SEM or SLM (Table A1). In addition, the Hausman test statistic was 13.45, significant at the 10% statistical level, rejecting the original hypothesis of a random effect of selection effect. Therefore, a spatial panel Durbin model with fixed effects in this paper is selected for regression analysis.
Analysis of empirical results
Table A2 shows that the spatial autoregressive coefficient rho is significantly positive at the 1% level, suggesting the existence of spatial autocorrelation characteristics of the CCD. It can be seen that it is reasonable to consider geospatial factors in the empirical analysis in this paper. Therefore, this further justifies the introduction of geospatial factors into the empirical analysis. The estimated results are shown in Table 4.
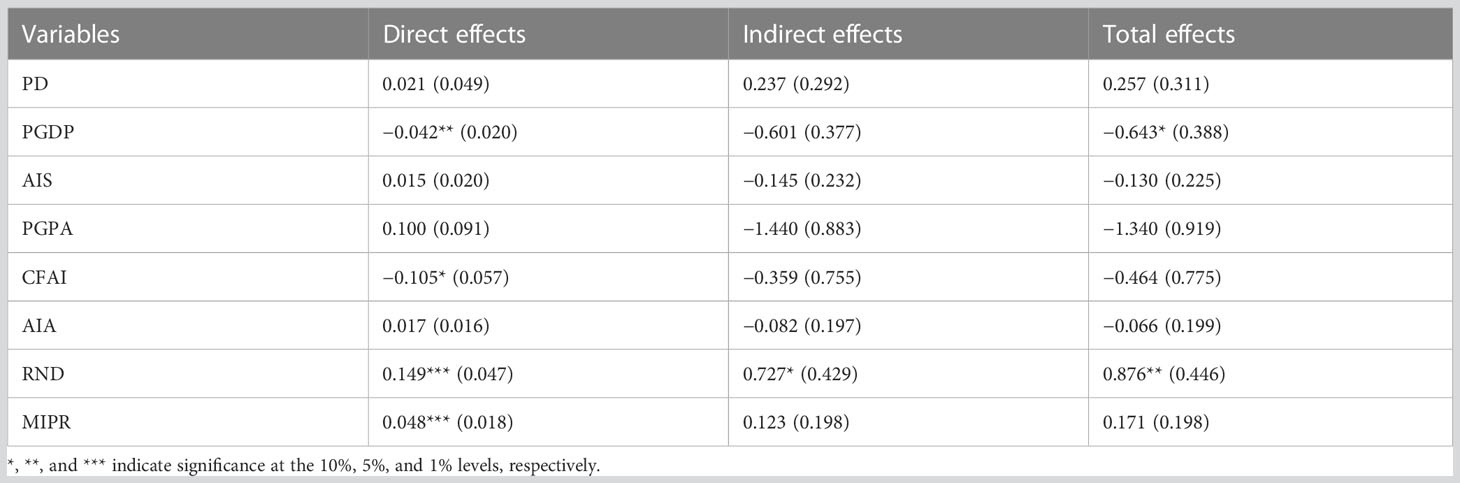
Table 4 The spatial effect decomposition.
Table 4 show that the coefficients of the direct and total effects of per capita GDP (PGDP) are significantly negative at the 5% and 10% statistical levels, respectively. Each 1% increase in PGDP in the region is associated with a 0.042% decrease in the CCD between land urbanization and grain production. This indicates that the increase in the level of economic development in the region has led to the expansion of land for urban construction on the one hand, squeezing out the arable land area and affecting grain production. On the other hand, farmers in economically developed areas tend to plant high value-added cash crops, which reduces the area under grain planting and affects grain production. However, the indirect effect of this variable is not significant, indicating that the level of economic development of neighboring regions has little effect on the CCD between local land urbanization and grain production. The reason is that there is a strong empirical dependence of farmers to grow grain, and it is generally less likely to change the planting structure, and the level of economic development in neighboring areas does not directly affect the outward expansion or shrinkage of local city and town land forms.
The direct effect of chemical fertilizer application intensity (CFAI) is significantly negative at 10% statistical level. Each 1% increase in CFAI in the region is associated with a 0.105% decrease in the CCD between land urbanization and grain production. On the one hand, there is a substitution effect between chemical fertilizers and the labor force engaged in agriculture. The increased use of chemical fertilizers can reduce agricultural labor inputs, releasing more rural labor to engage in non-agricultural industries which leads to an increase in land for non-agricultural industries in urban areas. On the other hand, CFAI in the region has reached a critical point. Excessive use of chemical fertilizers can cause damage to soil structure, shallow tillage layer, poor water and fertilizer storage capacity, intolerance to cold and drought, and frequent occurrence of pests and diseases, which in turn can affect grain production.
The direct, indirect and total effects of highway network density (HND) are 0.149, 0.727 and 0.876, respectively, which are all statistically significant at least at the 10% level. Each 1% increase in RND in the region can improve the CCD between land urbanization and grain production by 0.149%. Each 1% increase in RND in neighboring areas can improve 0.727% of the CCD between local land urbanization and grain production. This is because the greater the RND, the more convenient the transportation. Transportation not only realizes the interconnection of physical distance between regions, but also accelerates the flow of knowledge, information, technology, labor and other factors between regions, alleviating the contradiction between urban construction land and arable land between regions, which in turn improves the CCD between land urbanization and grain production.
The direct effect of mobile internet penetration rate (MIPR) is 0.048, which is significant at the 1% statistical level, indicating that the CCD between land urbanization and grain production in each region is mainly dependent on the improvement of information technology in the region. In fact, the higher the penetration rate of local information technology, not only can narrow the digital divide between urban and rural areas within the local area and reduce the information cost of rural residents working in cities, but also improve the quality of informatization services for the transfer of farmers’ farmland, creating conditions for large-scale land management and large-scale agricultural machinery services, which in turn can promote grain production. It should be noted that the production of cash crops is labor-intensive, with high technical requirements, which are not easily replaced by machinery for labor. The opposite is true for grain crops. With the increase of laborers going out to work, it leads to the rising of local labor market price. In order to reduce the cost of labor, farmers whose land is transferred in tend to plant grain crops. However, the indirect effect of this variable does not pass the test, indicating that the MIPR in neighboring regions has little effect on the CCD between land urbanization and grain production in the region.
The direct and indirect effects of population density (PD), advanced industrial structure (AIS), per capita grain planting area (PGPA), and agro-industrial agglomeration (AIA) are not significant. It may be because the development of county urbanization has not yet matured and these factors have not yet achieved their role in stimulating it. However, their impact cannot be ignored.
Conclusions and implications
Based on the panel data of 41 counties in Jiangsu from 2010 to 2020, this paper adopts the CCDM and ESDA to explore the spatiotemporal evolution characteristics of the CCD between land urbanization and grain production. In addition, the SDM is adopted to empirically analyze the driving factors affecting it. Some interesting conclusions obtained are as follows:
(1) From a temporal perspective, both county land urbanization and grain production in Jiangsu show a rising trend during the examination period of 2010–2020, and the development rate of county land urbanization is significantly higher than the growth rate of grain production. From a temporal evolution of the CCD, the CCD between the two is dominated by basically coordinated, showing a distribution pattern of North Jiangsu > Central Jiangsu > South Jiangsu.
(2) From the perspective of spatial distribution, the CCD between the two is dominated by basically coordinated in the Southern, Central and Northern Jiangsu. In addition, the spatial clustering characteristics are significant, and the distribution of counties with basically coordinated shows concentrated and contiguous characteristics.
(3) From the perspective of spatial correlation, the CCD between the two shows a low level of positive spatial autocorrelation. The state of agglomeration is significant in Northern Jiangsu, while spatial agglomeration is sporadic in Southern Jiangsu and insignificant in Central Jiangsu.
(4) Per capita GDP (PGDP) and chemical fertilizer application intensity (CFAI) have a negative effect on the CCD between land urbanization and grain production. Highway network density (HND) and mobile internet penetration rate (MIPR) have a positive effect on it.
From the above conclusions, this paper puts forward the following advice.
(1) Coordinated development relationship between land urbanization and grain production in county areas should be considered in the top-level planning. At the strategic level, Jiangsu province needs to take a firm view of “grain security” to ensure the sustainable production capacity of national grain security during the active implementation of county urbanization construction planning. It is recommended to make comprehensive planning in terms of land planning, industrial layout, transportation system, information construction, farmland water conservancy construction, etc.
(2) Improving support and protection policies. First, government departments need to strengthen financial support, focusing on the main grain-producing areas. For example, in Northern Jiangsu, the local government department should actively improve the conditions of farmland water conservancy facilities and other facilities in the region to ensure grain production. In addition, the government of Jiangsu province needs to strengthen the subsidies for large grain-producing counties, such as seed subsidies, grain production subsidies, farmland protection subsidies and other subsidies for agricultural policies to improve the local government’s emphasis on grain production and farmers’ enthusiasm to plant grain. Finally, improving grain purchase support and protection policies cannot be ignored.
(3) Each county should consider its own actual situation and formulate targeted supporting measures. Based on the strategic policies of Jiangsu province, for the Northern and Central Jiangsu with a higher level of coordinated development, when the county governments actively promote the development of land urbanization, they should optimize the layout of grain industry production, accelerate the construction of high-standard farmland and information technology, improve the accessibility of transportation, expand the spillover effect of technology and information in grain to raise grain production. For the Southern Jiangsu, where the level of coordinated development is low, the development speed of land urbanization should be slowed down. In addition, scientific planning of urban building land and full potential of spatial resources should be explored.
It is important to note that there are shortcomings in this study. First, not all factors influencing county land urbanization and grain production can be listed in this paper. The main approach in this study is to consider the selection of variables with reference to relevant studies by previous scholars and the accessibility of data. The reasonableness of the practice deserves consideration. Second, there is a lack of analysis of population urbanization. Population urbanization is closely related to land urbanization and grain production. Due to the lack of data on county population urbanization, this paper only examines the coupled and coordinated relationship between county land urbanization and grain production, which is somewhat inadequate.
Data availability statement
The original contributions presented in the study are included in the article/supplementary materials, further inquiries can be directed to the corresponding author/s.
Author contributions
Conceptualization, XC and JL; Methodology, XC, JZ, LX, and HW; Writing – original draft and editing, XC and JL. All authors were committed to improving this paper and are responsible for the viewpoints mentioned in this work. All authors contributed to the article and approved the submitted version.
Funding
This study is supported by China National Social Science Foundation (22BJY143), China National Natural Science Foundation (71403077), Anhui Province Natural Science Foundation (1508085QG142), China Agriculture Research System of MOF and MARA (CARS-10-B23), Jiangsu Province Decision Consultation Research Base Project (22SSLB023) and Jiangsu Province Decision Consultation Research Base Project (18SSL118).
Conflict of interest
The authors declare that the research was conducted in the absence of any commercial or financial relationships that could be construed as a potential conflict of interest.
Publisher’s note
All claims expressed in this article are solely those of the authors and do not necessarily represent those of their affiliated organizations, or those of the publisher, the editors and the reviewers. Any product that may be evaluated in this article, or claim that may be made by its manufacturer, is not guaranteed or endorsed by the publisher.
References
Anselin L., Syabri I., Kho Y. (2006). GeoDa: an introduction to spatial data analysis. Geogr. Anal. 38 (1), 5–22. doi: 10.1111/j.0016-7363.2005.00671.x
Ariken M., Zhang F., Liu K., Fang C., Kung H. (2020). Coupling coordination analysis of urbanization and eco-environment in yanqi basin based on multi-source remote sensing data. Ecol. Indic. 114, 106331. doi: 10.1016/j.ecolind.2020.106331
Cao Y. N., Kong L. Q., Zhang L. F., Ouyang Z. Y. (2021). The balance between economic development and ecosystem service value in the process of land urbanization: a case study of China’s land urbanization from 2000 to 2015. Land Use Policy 108, 105536. doi: 10.1016/j.landusepol.2021.105536
Chen J. F., Wei S. Q., Chang K. T., Tsai B. W. (2007). A comparative case study of cultivated land changes in fujian and Taiwan. Land Use Policy 24 (2), 386–395. doi: 10.1016/j.landusepol.2006.05.002
Cui D., Chen X., Xue Y., Li R., Zeng W. (2019). An integrated approach to investigate the relationship of coupling coordination between social economy and water environment on urban scale-a case study of kunming. J. Environ. Manage. 234, 189–199. doi: 10.1016/j.jenvman.2018.12.091
D’Amour C. B., Reitsma F., Baiocchi G., Barthel S., Guneralp B., Erb K. H., et al. (2017). Future urban land expansion and implications for global croplands. Proc. Natl. Acad. Sci. United States America 114 (34), 8939–8944. doi: 10.1073/pnas.1606036114
Deng X. Z., Huang J. K., Rozelle S., Zhang J. P., Li Z. H. (2015). Impact of urbanization on cultivated land changes in China. Land Use Policy 45, 1–7. doi: 10.1016/j.landusepol.2015.01.007
Ding Y., Huang Y., Xie L., Lu S., Zhu L., Hu C., et al. (2022). Spatial patterns exploration and impacts modelling of carbon emissions: evidence from three stages of metropolitan areas in the YREB, China. Land 11, 1835. doi: 10.3390/land11101835
Elhorst J. P. (2010). “Spatial panel data models,” in Handbook of applied spatial analysis. Eds. Fischer M., Getis A. (Berlin, Heidelberg: Springer). doi: 10.1007/978-3-642-03647-7_19
Elhorst J. P. (2014). Matlab Software for spatial panels. Int. Reg. Sci. Rev. 37 (3), 389–405. doi: 10.1177/0160017612452429
Gao J., Song G., Sun X. Q. (2020). Does labor migration affect rural land transfer? evidence from China. Land Use Policy 99, 105096. doi: 10.1016/j.landusepol.2020.105096
Gu R. L., Duo L., Guo X. F., Zou Z. L., Zhao D. X. (2023). Spatiotemporal heterogeneity between agricultural carbon emission efficiency and food security in henan, China. Environ. Sci. pollut. Res. 30, 49470–49486. doi: 10.1007/s11356-023-25821-z
Hou M. Y., Deng Y. J., Yao S. B. (2022). Urbanization, intensive cropland use, and grain production: a moderated mediating effect test under climate conditions. China Pop. Resour. Environ. 32 (10), 160–171. Available at: https://kns.cnki.net/kcms2/article/abstract?v=np3lk5syO1iQru-LwEbmegGmVIABRDsg98PdReD4hmGZLJx64WYIRatTm-cALpjCllYl2O9-x2ryc7ZDjdKoGlp3lPRofpT1a-Uw7lTIOSysYslr4EVd1-AstFAe-x2r&uniplatform=NZKPT&language=gb
Jin D., Dai L. L. (2021). Temporal and spatial characteristics and driving factors of coordinated development between population urbanization and land urbanization in China. China Land Sci. 35, 74–84. Available at: https://kns.cnki.net/kcms2/article/abstract?v=np3lk5syO1iyAORMmoot0K7_-R1It4ALCCVUe6HU92-KOvDK37NEHOjZWWYNPt6IeWBT6CsI39xXcKL_FMSN0uD0GuLXvX4E1O_RfKaTSTbLOcT0cCWl1jyYa_NLAUzf&uniplatform=NZKPT&language=gb
Lambin E. F., Meyfroidt P. (2011). Global land use change, economic globalization, and the looming land scarcity. Proc. Natl. Acad. Sci. United States America 108, 3465–3472. doi: 10.1073/pnas.1100480108
Liang W., Yang M. (2019). Urbanization, economic growth and environmental pollution: evidence from China. Sustain. Computing-Informatics Syst. 21, 1–9. doi: 10.1016/j.suscom.2018.11.007
Lin X. Q., Wang Y., Wang S. J., Wang D. (2015). Spatial differences and driving forces of land urbanization in China. J. Geogr. Sci. 25 (5), 545–558. doi: 10.1007/s11442-015-1186-7
Liu X., Xu Y. Y., Engel B. A., Sun S. K., Zhao X. N., Wu P. T., et al. (2021). The impact of urbanization and aging on food security in developing countries: the view from Northwest China. J. Clean. Prod. 292, 126067. doi: 10.1016/j.jclepro.2021.126067
Long H. L., Ge D. Z., Zhang Y. N., Tu S. S., Qu Y., Ma L. (2018). Changing man-land interrelations in china’s farming area under urbanization and its implications for food security. J. Environ. Manage. 209, 440–451. doi: 10.1016/j.jenvman.2017.12.047
Lu W. C., Chen N. L., Qian W. X. (2017). Modeling the effects of urbanization on grain production and consumption in China. J. Integr. Agric. 16 (6), 1393–1405. doi: 10.1016/S2095-3119(16)61602-7
Lu X. H., Ke N., Kuang B., Han J. (2019). Spatial-temporal features and influencing factors of difference in land urbanization level of central China. Econ. Geogr. 39 (04), 192–198. doi: 10.15957/j.cnki.jjdl.2019.04.023
Lu X. H., Kuang B., Li J. (2018). Regional difference decomposition and policy implications of china’s urban land use efficiency under the environmental restriction. Habitat Int. 77, 32–39. doi: 10.1016/j.habitatint.2017.11.016
Lu H., Xie H. L., Yao G. R. (2019). Impact of land fragmentation on marginal productivity of agricultural labor and non-agricultural labor supply: a case study of jiangsu, China. Habitat Int. 83, 65–72. doi: 10.1016/j.habitatint.2018.11.004
Lv T. G., Wang L., Zhang X. M., Xie H. L., Lu H., Li H. Y., et al. (2019). Coupling coordinated development and exploring its influencing factors in nanchang, China: from the perspectives of land urbanization and population urbanization. Land 8 (12), 178. doi: 10.3390/land8120178
Masters W. A., Djurfeldt A. A., De Haan C., Hazell P., Jayne T., Jirstrom M., et al. (2013). Urbanization and farm size in Asia and Africa: implications for food security and agricultural research. Global Food Security-Agricult. Policy Econ. Environ. 2 (3), 156–165. doi: 10.1016/j.gfs.2013.07.002
Ministry of Housing and Urban-Rural Development (2020). China Statistical yearbook of urban and rural construction (China Statistics Press). Available at: https://data.cnki.net/yearBook?type=type&code=A
National Statistical Office. (2022). China Statistical Yearbook (China Statistics Press). Available at: https://ChinaStatistics Press
Qiu B. W., Yang X., Tang Z. H., Chen C. C., Li H. W., Berry J. (2020). Urban expansion or poor productivity: explaining regional differences in cropland abandonment in China during the early 21st century. Land Degradation Dev. 31 (17), 2540–2551. doi: 10.1002/ldr.3617
Sridharan S., Tunstall H., Lawder R., Mitchell R. (2007). An exploratory spatial data analysis approach to understanding the relationship between deprivation and mortality in Scotland. Soc. Sci. Med. 65, 1942–1952. doi: 10.1016/j.socscimed.2007.05.052
Satterthwaite D., McGranahan G., Tacoli C. (2010). Urbanization and its implications for food and farming. Philos. Trans. R. Soc. B-Biol. Sci. 365 (1554), 2809–2820. doi: 10.1098/rstb.2010.0136
Sulemana I., Nketiah-Amponsah E., Codjoe E. A., Andoh J. A. N. (2019). Urbanization and income inequality in Sub-Saharan Africa. Sustain. Cities Soc. 48, 101544. doi: 10.1016/j.scs.2019.101544
Tsutsumida N., Saizen I., Matsuoka M., Ishii R. (2015). Addressing urban expansion using feature-oriented spatial data in a peripheral area of ulaanbaatar, Mongolia. Habitat Int. 47, 196–204. doi: 10.1016/j.habitatint.2015.01.024
Wu J. Q., Wen X., Qi X. L., Fang S. L., Xu C. X. (2021). More land, less pollution? how land transfer affects fertilizer application. Int. J. Environ. Res. Public Health 18 (21), 11268. doi: 10.3390/ijerph182111268
Xiao W. D. (2012). Geographical agglomeration of plantations in China: spatial and temporal characteristics, changing trends and influencing factors. Chin. Rural Econ. (05), 19–31. Available at: https://kns.cnki.net/kcms2/article/abstract?v=np3lk5syO1j-r5LRjcpeaW4u0_vqfYhLyc18iTcrd0fzDTyQTOMuULEkKntCnPUKJv_21b2HTGQSPoS4tXLwgL5jhJOzKHyglnh3dP1LlohnDOWMAJIKow==&uniplatform=NZKPT&language=gb
Yang R., Liu Y. S., Long H. L., Qiao L. Y. (2015). Spatio-temporal characteristics of rural settlements and land use in the bohai rim of China. J. Geogr. Sci. 25 (05), 559–572. doi: 10.1007/s11442-015-1187-6
Yang X. D., Wang W. L., Su X. F., Ren S. Y., Ran Q. Y., Wang J. L., et al. (2022). Analysis of the influence of land finance on haze pollution: an empirical study based on 269 prefecture-level cities in China. Growth Change 54 (1), 1–34. doi: 10.1111/grow.12638
Ye L., Wu A. M. (2014). Urbanization, land development, and land financing: evidence from Chinese cities. J. Urban Affairs 36 (1), 354–368. doi: 10.1111/juaf.12105
Yu X. Y., Liu Y. Q., Wang Y. W., Feng X. L., Tu M. Z., Chen J. S. (2020). Role of bioengineering and laborers in integration of farmland resources toward to improve dimension of sustainable agriculture in China. Bioengineered 11 (1), 559–571. doi: 10.1080/21655979.2020.1765523
Yuan Y., Wang M., Zhu Y., Huang X., Xiong X. (2020). Urbanization’s effects on the urban-rural income gap in China: a meta-regression analysis. Land Use Policy 99, 104995. doi: 10.1016/j.landusepol.2020.104995
Zhang T., Li L. (2021). Research on temporal and spatial variations in the degree of coupling coordination of tourism–urbanization–ecological environment: a case study of heilongjiang, China. Environ. Dev. Sustain. 23 (6), 8474–8491. doi: 10.1007/s10668-020-00976-8
Zhang F. T., Sun C. C., An Y. Z., Luo Y. G., Yang Q., Su W. C., et al. (2021). Coupling coordination and obstacle factors between tourism and the ecological environment in chongqing, China: a multi-model comparison. Asia Pacific J. Tour. Res. 26, 811–828. doi: 10.1080/10941665.2021.1925715
Zhou J., Fan X., Li C., Shang G. (2022). Factors influencing the coupling of the development of rural urbanization and rural finance: evidence from rural China. Land 11, 853. doi: 10.3390/land11060853
Zhou Y., Kong Y., Wang H., Luo F. (2020). The impact of population urbanization lag on eco-efficiency: a panel quantile approach. J. Clean. Prod. 244, 118664. doi: 10.1016/j.jclepro.2019.118664
Appendix A
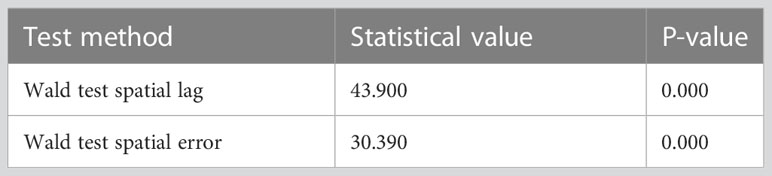
Table A1 Wald test results.
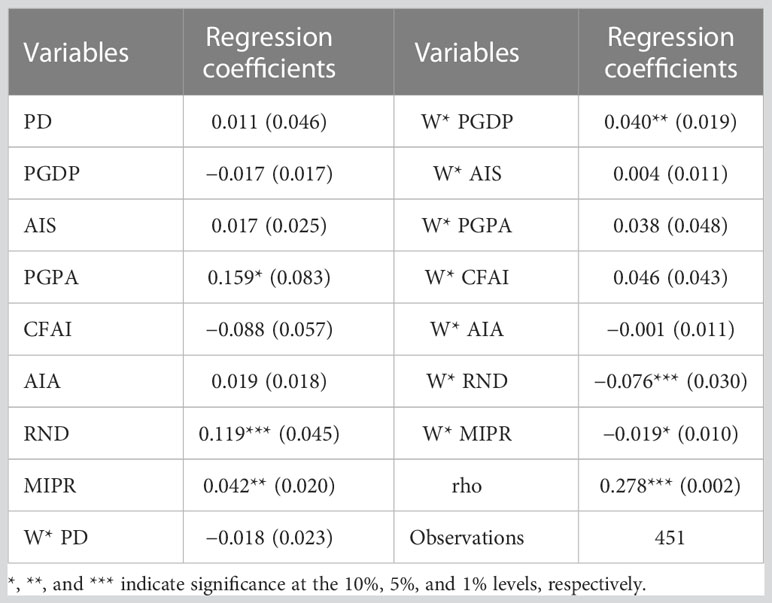
Table A2 The estimation results of spatial Durbin model.
Keywords: land urbanization, grain production, coupling coordination degree (CCD), spatiotemporal evolution, space Durbin model (SDM), Jiangsu province
Citation: Chen X, Zhou J, Xing L, Wang H and Lu J (2023) Spatiotemporal evolution and driving factors of the coupling coordination between county land urbanization and grain production: the case of Jiangsu province, China. Front. Ecol. Evol. 11:1179551. doi: 10.3389/fevo.2023.1179551
Received: 04 March 2023; Accepted: 06 June 2023;
Published: 20 July 2023.
Edited by:
Amir Molajou, Iran University of Science and Technology, IranReviewed by:
Amod Mani Dixit, Universal Engineering and Science College (UESC), NepalBao-Jie He, Chongqing University, China
Copyright © 2023 Chen, Zhou, Xing, Wang and Lu. This is an open-access article distributed under the terms of the Creative Commons Attribution License (CC BY). The use, distribution or reproduction in other forums is permitted, provided the original author(s) and the copyright owner(s) are credited and that the original publication in this journal is cited, in accordance with accepted academic practice. No use, distribution or reproduction is permitted which does not comply with these terms.
*Correspondence: Jianzhen Lu, bGp6QGphYXMuYWMuY24=