 Caidan Duojie
 Shiyu Liu
- Faculty of Engineering Sciences, University College London, London, United Kingdom
This study investigated the current situation of social media adoption in the energy and resources sector, the preferred social media platforms in the energy and resources sector, and the reasons for the differences between these preferred platforms. In this study, quantitative analysis method was adopted, and we used Excel and SPSS for data collection and data analysis. Through the investigation of 262 companies, all companies maintained a strong online presence through corporate websites, email contacts, and various social media platforms. However, the adoption and use of social media platforms differed among countries. Linear regression analysis revealed that companies should constantly update their relevant information on social media platforms to increase their followers, improve their influence and popularity, and achieve better interaction with stakeholders. Through quantitative analysis, it was found that companies in the energy and resources sector should maintain a strong online presence. These companies should choose specific social media platforms according to their target audience. Because some platforms are more suitable for specific purposes, companies should pay attention to the different designs and functions of each social media platform. Future research should focus on the use of social media in B2B marketing by companies operating in the energy and resources sector.
1. Introduction
1.1. Background of the study
Social media is presently a sought-after model of digital communication (Mergel, 2012), with 59% of the world’s population active on different social media platforms (Chaffey, 2022). Thus, social media has become the go-to platform for corporations and individuals who want to reach a particular target audience for business, social, and corporate reasons. Among the different types of social media technologies, which include Facebook, Instagram, Twitter, YouTube, WhatsApp, LinkedIn, SnapChat, WeChat, Tik-Tok, and 2Go, each platform incorporates unique features for specific goals. While individuals mainly use social media for socializing and networking, corporations use these platforms for branding and marketing purposes (Buratti et al., 2018).
In the energy and resources sector, industry stakeholders employ different social media channels to promote their brand image and reputation while marketing their respective products and services. In the energy sector, companies typically focus on business groups as opposed to consumer groups when marketing and branding their products and services because other corporate entities are their main consumers, not individual consumers; as such, these companies use social media platforms mainly for business-to-business (B2B) marketing (Durkin et al., 2013; Ning et al., 2022). However, Lacka and Chong (2016) argued that some companies in the energy and resources sector also operate an active business-to-consumer (B2C) division alongside their B2B division. This is common in the oil and gas sectors, where leading industry giants such as Shell, BP, Total, and ExxonMobil are not only involved in the exploration and drilling of crude oil, but also the refining, distribution, and retail of petroleum products in their primary markets worldwide.
1.2. Social media usage in the energy and resources sector
As most companies in the energy and resources sector deal with B2B companies, social media platforms are predominantly used for community engagement, with the primary goal of creating a reputable brand image in the primary market (Khan et al., 2014; Ravichandran and Keikhosrokiani, 2023). However, this has only been the case since the 2000s, when the first social media platforms were being developed (Mergel, 2013). Firms in this sector use social media platforms to gain trust from local stakeholders and community members in the region where the projects are undertaken, thereby boosting their brand reputation and industry competitiveness (Ning et al., 2022). In the current business setting, where markets are relatively competitive, having a reputable brand image is advantageous for the company, especially because B2B clients demand to be allied only with other reputable brands. According to Lacka and Chong (2016), by obtaining a social license to operate (SLO) as proof of trust and confidence in the local community, firms in the energy and resources sector enhance their advantages as preferred B2B business partners of their prospective corporate clients. For example, if a mining company can obtain the trust of a local community, it can become licensed to begin mining with the community’s support. Companies with a strong brand reputation are more capable of building strong, long-lasting business relationships with key development partners (Mergel, 2012).
The growing preference for social media use by the corporate sector is largely informed by its effectiveness in engaging the key stakeholders of the company, including customers, owners, the business community, and the media, with firms taking advantage of the interactive features of such platforms to exchange ideas, collect feedback, and respond to concerns raised about the company’s brand, products, or services (Styan, 2018). Most firms operating in the energy and resources sector try to maintain a strong social media presence on their preferred social media platform, in addition to operating an official corporate website (Styan et al., 2015). The acceptance of external knowledge on social media by energy and resources companies can also promote the change of companies (Saura et al., 2023). Social media platforms are primarily designed for community engagement and interaction, especially with groups and individuals who cannot engage the firm officially. Firms use social media platforms to reach out to their target audience according to their respective objectives and desired outcomes from a particular social media platform (Lampe and Roth, 2012). This explains why different companies prefer specific social media platforms over others.
1.3. Choice of social media platforms
The choice of a preferred social media platform by a company is commonly determined by its desired objectives, with a preference for a platform that will achieve the best results in community engagement (Lampe and Roth, 2012; Ravichandran and Keikhosrokiani, 2023). In each case, the principles of environmental, social, and governance (ESG) and SLO are observed; a social media platform that enables firms to achieve these objectives is preferred. Sine and Lee (2009) identified three key ESG factors influencing the sustainability and societal impact of an investment in a business or company. This criterion is critical for facilitating improved determination of the return-to-risk ratio, given that energy and resources firms have to balance the gains from their investments against the risks incurred. Similarly, firms also consider their SLO when selecting a preferred social media platform, as they seek ongoing acceptance by the business community of the firm’s adherence and strict compliance with the standard practices of business established by industry regulators, in addition to observing sound operation practices, as expected by its key stakeholders, which include employees, media, the community, and the government (Loukis et al., 2017).
Bale et al. (2013) asserted that larger companies in the energy and resources sector use more than one social media platform, enabling them to post more frequently and access more followers. The higher the number of followers on social media, the more influential the firm becomes, especially with regard to corporate branding and promotion. Martin (2016) agreed with the above claims, stating that engaging the community on different platforms, including Twitter, Facebook, YouTube, and Instagram, enables corporate entities to enhance their market reach to the target audience, engage them actively, and respond to their feedback in a timely manner. Fyfe and Crookall (2011) noted that expansive social media engagement affords a strong competitive advantage over other industry players because of the strong brand reputation developed in line with ESG and SLO principles.
1.4. Benefits of using social media
As most firms in the energy and resources sector deal with B2B customers, the main benefit of using social media platforms is the enhanced implementation of their community engagement policies and strategies (Bonnemaizon and Batat, 2011). These firms need to partake in a wide range of community engagement activities to earn their SLO and adhere to ESG principles. Wueest (2014) found that, for companies in the energy and resources sector, effective community engagement is instrumental in building a strong brand reputation and thereby enhancing and strengthening B2B relationships. This is because community engagement increases the company’s visibility and understanding of issues affecting its primary community, in addition to empowering community members to decide on issues affecting their lives, such as the impact of a firm’s operations on the community. Pyakurel and Wright (2021) noted that social media platforms allow firms to engage their respective communities more effectively, thereby building deeper, stronger, and more trusting relationships that are beneficial for the sustainability of the company.
According to Flanigan and Obermier (2016), the key benefits of community engagement for corporate entities operating in the energy and resources sector include significantly improved consumer understanding of issues related to ESG, brand image and reputation, community satisfaction, customer satisfaction, better community investment and ownership, high responsiveness to environmental and health issues, and ethical investment decisions. Moreover, social media platforms provide firms in this sector with an effective platform to engage the community through their interactive and participative features, whereby members of the public who have issues to raise with the company can comfortably do so through their official social media pages (Mergel, 2013). Thackeray et al. (2008) also noted that social media plays a strategic role in the modern technological era through enabling swift branding for firms, as the market requires companies to have a strong online presence to gain a reputable brand and competitive advantage over other industry players.
Leonardi (2014) emphasized the need to interact and socialize at the community and corporate levels. Stable social media interactions are crucial in legitimizing popular thoughts and practices, especially with regard to key issues affecting the public, as well as transforming individuals, communities, and corporations through the effective transfer of knowledge. Furthermore, as the primary goal of corporations in the energy and resources sector is to engage their respective communities to earn approval on ESG issues and gain their trust and confidence through SLO, social media platforms provide them with the most effective communication channels to engage their respective communities (Sigala et al., 2012). These firms engage their communities via social media on a wide range of issues that are directly or indirectly attributed to the existence and operation of the firm in their community (Lai and To, 2015). As such, social media platforms provide a platform for sharing, exchanging ideas and opinions, responding to feedback and concerns, and raising alarms and warnings regarding company operations and their respective effects on the business community (Kwahk and Ge, 2012). In the long run, this has helped businesses achieve their desired objectives by enhancing their brand reputation, enabling them to create strong and long-lasting business relationships with their B2B clients.
1.5. Research gap
The following aspects have not yet been elucidated in the literature:
1. A situation description of social media adoption in the energy and resources sector.
2. The social media platforms preferred by the energy and resources sector.
3. The reason for different preferred social media platforms in the energy and resources sector.
In this study, we aim to fill these gaps by investigating the reasons and benefits of social media use in the energy and resources sector. Therefore, we quantify the use and adoption of social media by firms in the energy and resources sector from the top five countries according to their total energy supply (I Key World Energy Statistics, 2020).
2. Materials and methods
2.1. Research design and method
This study employed an exploratory research design (Figure 1) to evaluate the adoption and use of social media by firms operating in the energy and resources sector across different countries. This research design was adopted because of its effectiveness for in-depth research of a topic lacking previous studies. Additionally, the design provided the appropriate framework for evaluating social media use by B2B corporations in the energy and resources sector, identifying which social media platforms were used, why they were used, and their benefits.
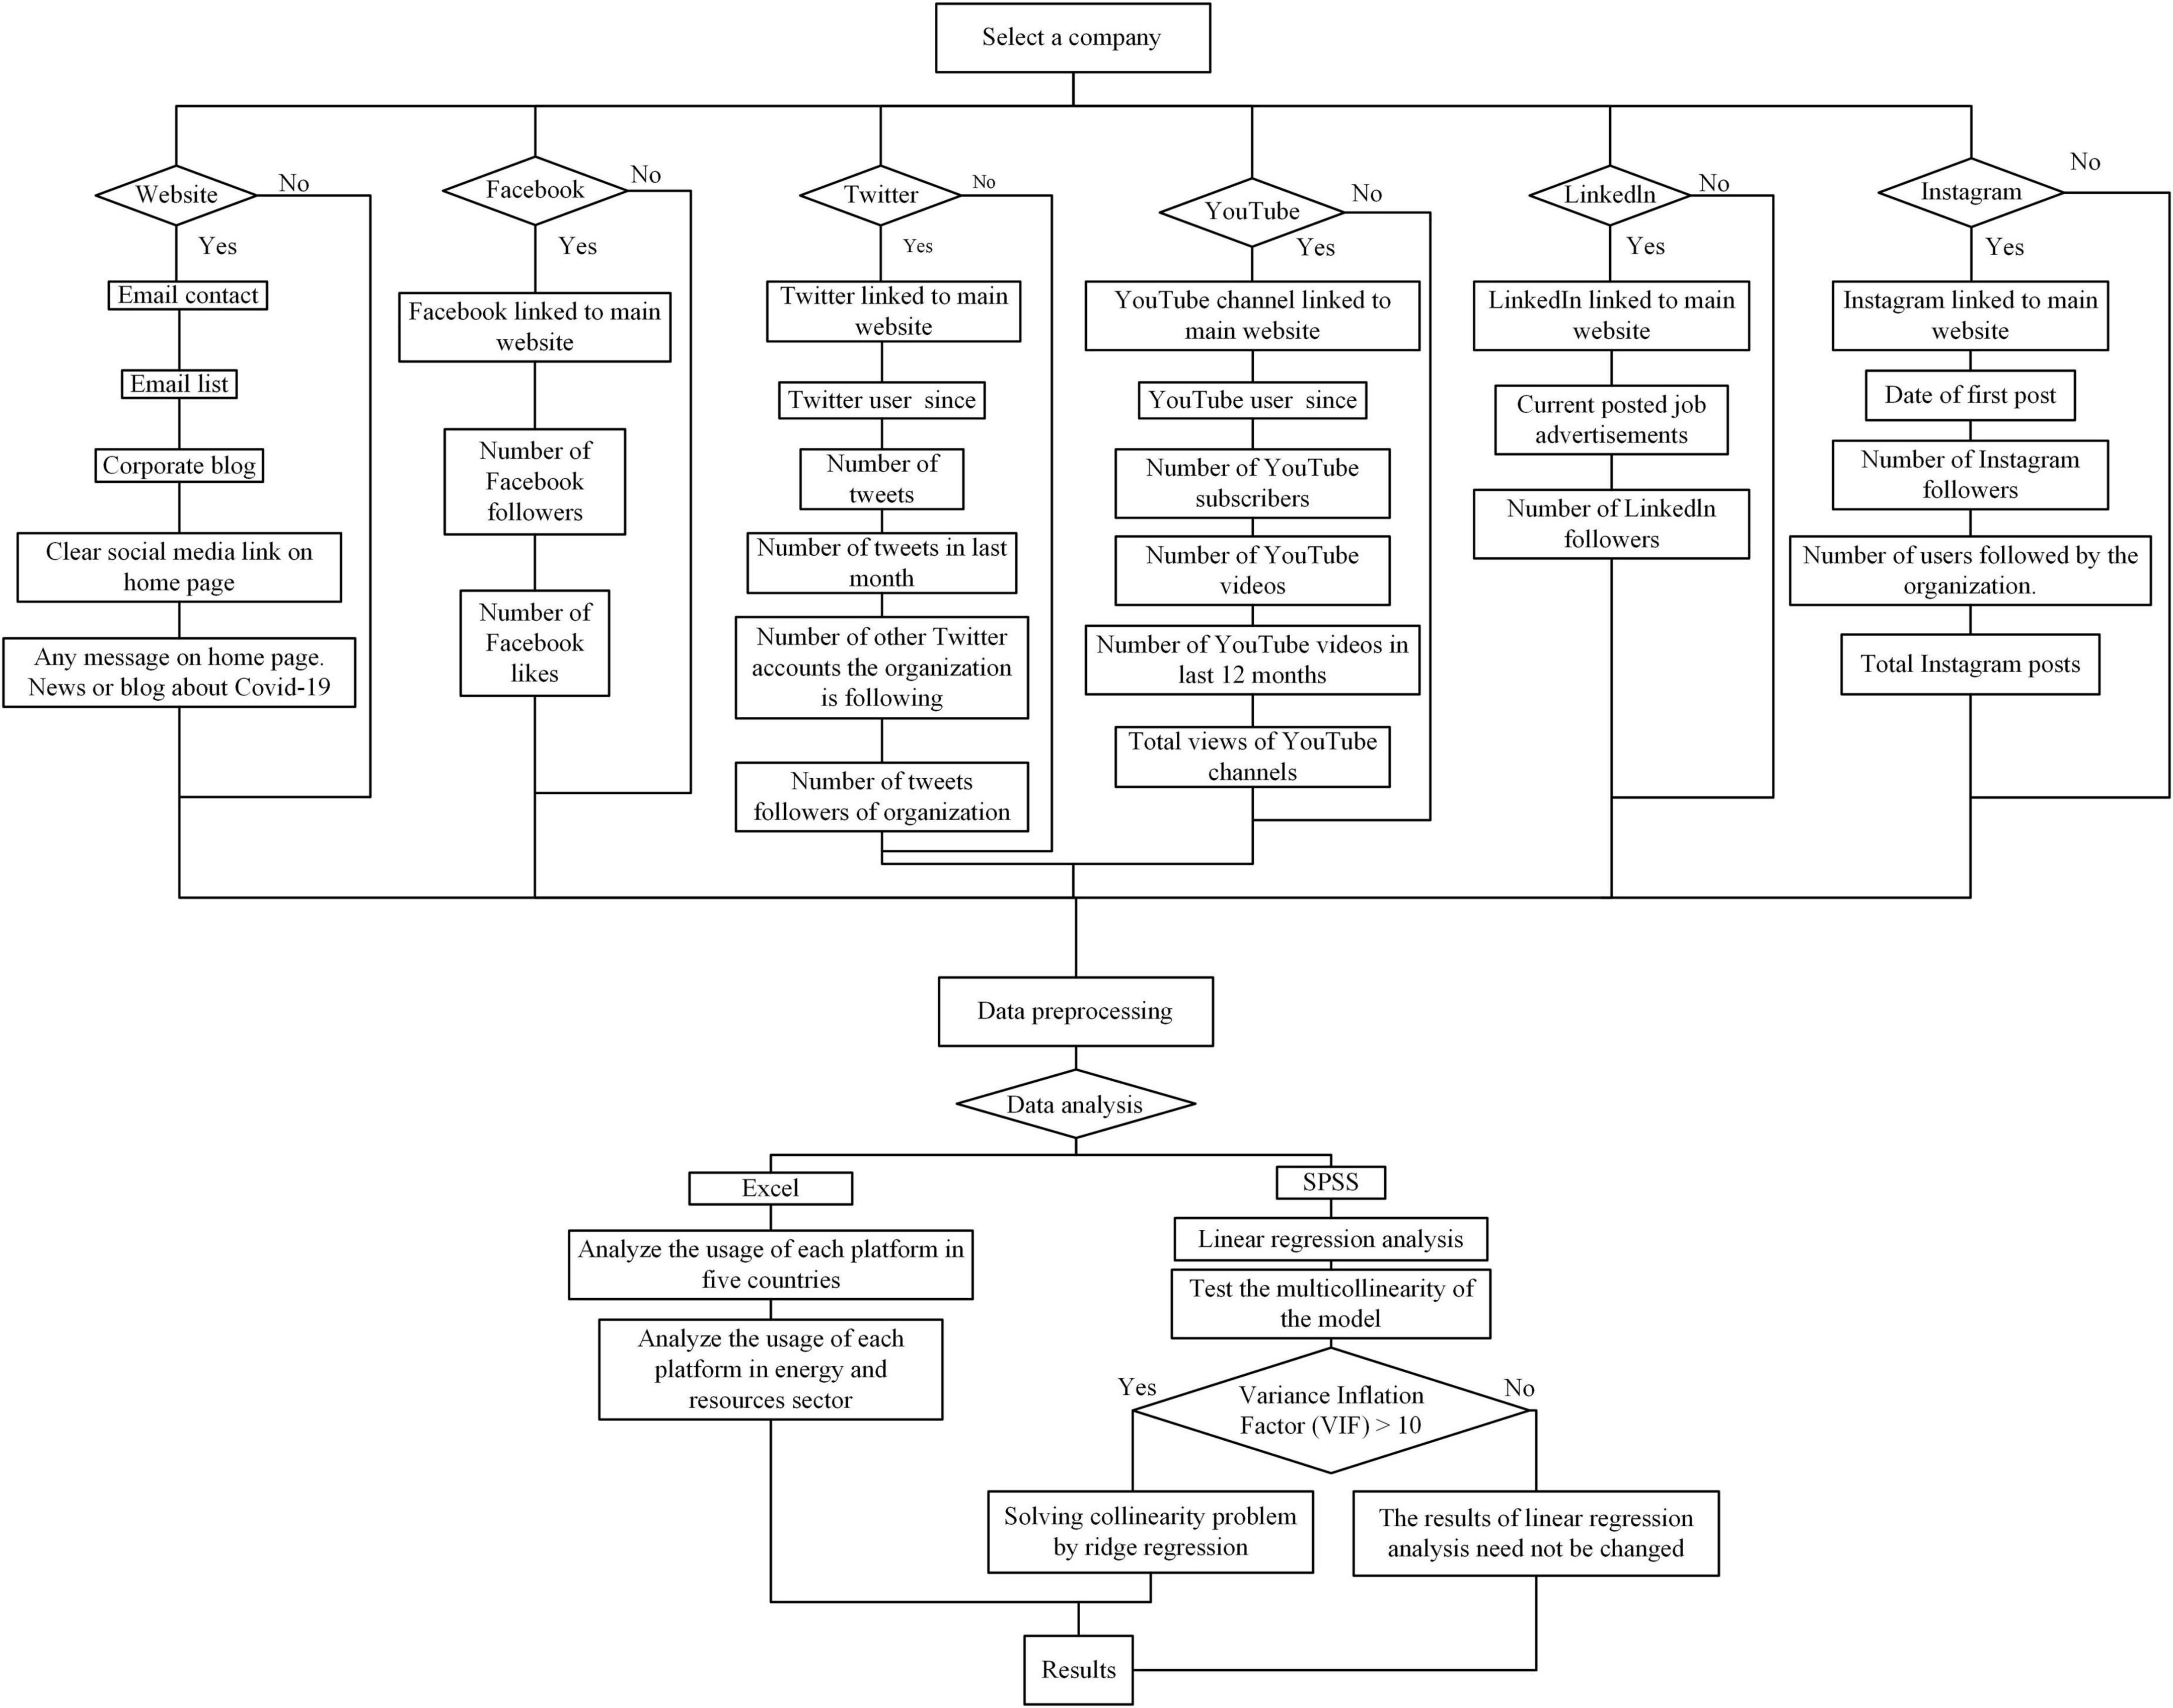
Figure 1. Schematic of the exploratory research design used in this study.
Quantitative analysis was used to determine the statistical information of companies in the energy and resources sector using social media channels, as well as the number and choice of channels used. This approach uses statistical figures in data collection and statistical tools in data analysis to address the key aspects of the study. Specifically, we used an Excel spreadsheet to analyze the use of social media by enterprises in various countries (Appendix 1). Then, all enterprises were integrated to analyze the usage and trends of social media in the entire energy and resources sector, with SPSS linear correlation used to analyze the relationships among various variables.
2.2. Sampling technique
This study focused on five different countries across the world: India, China, Russia, Japan, and the United States of America (USA), which are the top five countries in terms of their total energy supply (I Key World Energy Statistics, 2020). The random sampling technique was used to identify and select companies in each of these five countries, which yielded 200 companies in each country, with a total of 1,000 companies. The random sampling tool of SPSS (functions: data-select cases-random sample of cases-approximately 35% of cases) was used to select 35% of the total number of companies for data collection, where the selected companies must be companies in the energy and resources sector. To further confirm the accuracy of the data, we removed the companies that have been shut down or merged from the selected companies using SPSS and obtained 50 companies each in China, the USA, and Russia, 44 companies in India, and 68 companies in Japan. The random sampling approach was used to ensure fairness and equitable representation of all companies within a particular study population, with the selected companies including energy, mining, materials, and mixed firms.
2.3. Data collection
The study used Excel workbooks to collect data on the usage and application of social media channels by companies in the energy and resources sector across the five countries. This method was adopted because the workbooks are simple to prepare and administer and preferable for a large study sample, given that each country had an average of 52 different companies for analysis. Furthermore, the data workbooks ensured an extensive analysis of all key areas pertaining to the use and adoption of social media platforms, with 38 questions answered for each company (see Appendix 1). We then looked for links to social media platforms on the official websites of these enterprises; if none were found, we searched the names of the companies on Facebook, Twitter, YouTube, LinkedIn, and Instagram to verify if these companies used these platforms. We judged whether the social media accounts were the official accounts of the companies using information on the platforms. We then collected 38 questions from each company, as shown in Appendix 1, which was collated in a uniform manner in Excel. Because the data were collected artificially on various social media platforms, pre-processing was necessary to ensure the accuracy of the data, and a checklist approach was used to quantify the data workbook results.
2.4. Data analysis
Excel was used to statistically evaluate the data, detailing the trends in social media adoption by firms in different countries, the number of channels adopted, and the prevalence of social media use in handling the corporate affairs of the selected firms. Next, all companies were integrated to analyze the use of social media in the entire energy and resources sector and the trends of companies adopting social media. For the numerical problems shown in Appendix 1, such as the number of followers and number of publications, we used SPSS for linear regression analysis and analyzed the influence of other variables on followers/subscribers when the followers/subscribers of various social media platforms were taken as the dependent variables. For the linear regression analysis, we first analyzed the model. For the SPSS linear regression analysis, we first analyzed the model fitting situation using the R-squared value, then calculated the variance inflation factor (VIF) to determine whether the model exhibits collinearity. If the VIF value of the variables was greater than 10, we estimated the K value using ridge trace diagrams before conducting ridge regression analysis. A Durbin–Watson (D–W) statistic of approximately 2 (between 1.7 and 2.3) indicates no autocorrelation and that the model is well constructed. If the linear regression analysis is significant (P < 0.05), the independent variable has an influence on the dependent variable.
2.5. Validity and reliability of data
The validity of the research findings was ensured by selecting appropriate methodological protocols throughout the study. This included the research design and method, sampling technique, data collection, and analysis techniques. The reliability of the research findings was enhanced by ensuring that the data sources were credible, relevant, and accurate for use in this study. As mentioned in section “2.2. Sampling technique,” we used data on social media usage from companies selected from different countries across the world. The accuracy and relevance of these data are critical for ensuring the validity of the research findings.
2.6. Limitations
The main limitation of this study is that it did not integrate any form of human interest; in other words, we included no subjective judgment data. However, we overcame this challenge by using relevant information about the firms selected, particularly in regard to their social media use on different platforms, given that the focus of the study was primarily corporate entities rather than individuals. In addition, this research focused only on international social media platforms; thus, we did not include local social media platforms such as WeChat and Weibo in China and VK and Telegram in Russia, and in China, most energy and resources companies use WeChat and Weibo to post relevant information.
3. Results
3.1. National-level social media use
In this study, we selected 50 companies in China, the USA, and Russia each, 44 in India, and 68 in Japan. Because a different number of companies was selected in each country, summary statistics were used in this study. The proportion of all companies in each country that use social media was used as the proportion to compare the different countries. We then integrated the companies from all countries to explore social media adoption across the entire energy and resources sector.
3.1.1. India
Forty-four companies drawn from different divisions in the energy and resources sector were used in the analysis. Of the 44 companies, 98% had email contacts, but only four used email lists. All of the companies used corporate blogs (Table 1), 84% were active on Facebook, more than 40% were active on other social media platforms (Table 2), and 59% shared links to these social media platforms on their corporate websites. Additionally, 25% of companies in India shared information about coronavirus disease 2019 (COVID-19) on their corporate blogs. LinkedIn was the most common social media platform in India, with a 95% usage rate, and was mainly used for networking purposes and reaching out to potential professionals in the ever-growing gig economy in India. Facebook was the second most common social media platform in India, with an 84% usage rate. YouTube, Instagram, and Twitter were also adopted, but were not as popular.
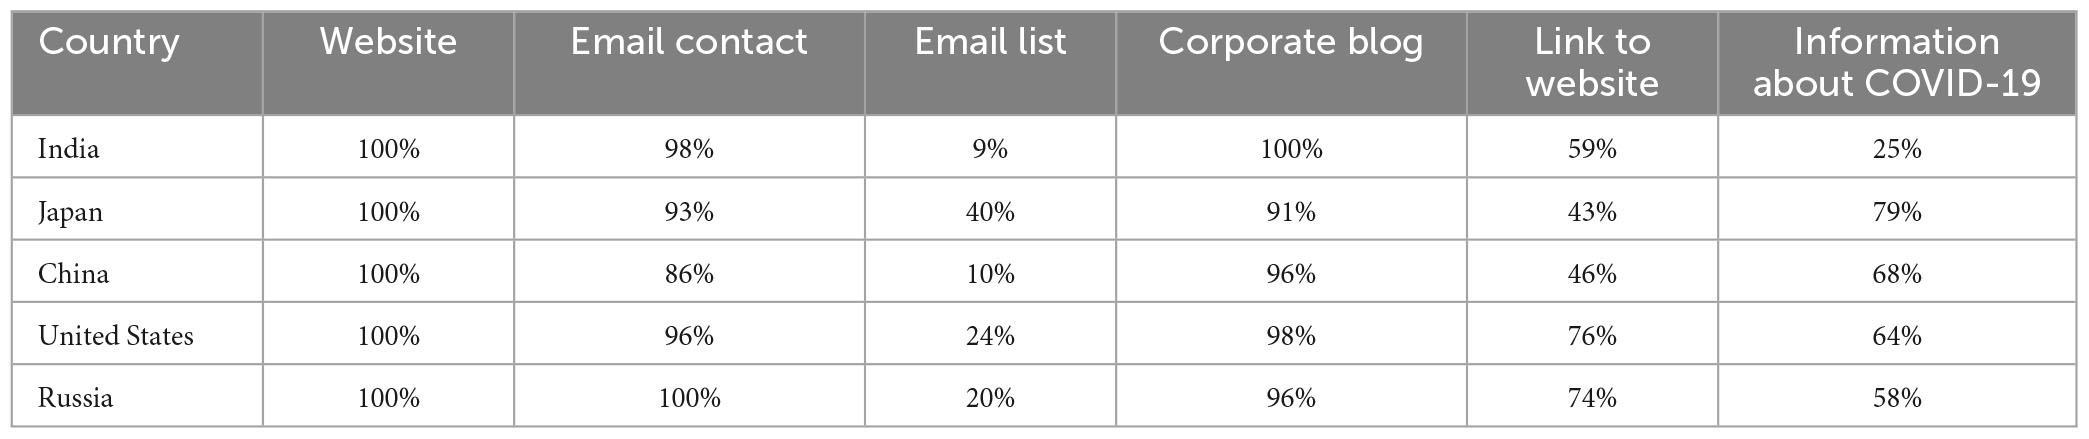
Table 1. Social media use by country.

Table 2. Social media platforms adopted by each country.
3.1.2. Japan
In comparison to other countries, Japan showed less social media use for community engagement or brand promotion. Among the 68 listed companies, email lists were not commonly used, with firms preferring to engage their key stakeholders through corporate blogs rather than social media platforms. Moreover, 79% of companies shared information about COVID-19 on their corporate blogs (Table 1). The adoption and use of social media channels such as LinkedIn, Facebook, Twitter, and Instagram were less than 50%; however, YouTube was used by 54% of companies (Table 2).
3.1.3. China
Social media use and adoption in China tended to be less active than that in other countries. Of the 50 mainland Chinese companies, 86% maintained email contacts, but only 10% used their email lists. Corporate blogs were the most preferred mode of community engagement, used by 96% of firms (Table 1). All firms maintained an active online presence with an official company website, and 46% also shared their social media links on their corporate websites. Chinese firms were not particularly active on social media, with only 10% of the firms maintaining an active Facebook page (Table 2). Potentially because China was the first country to detect COVID-19, the official websites of 68% of Chinese companies contained information about COVID-19 (Kumar et al., 2021).
3.1.4. USA
Each of the 50 energy and resource companies operating in the USA had an active online platform on its official company website. Twenty-two companies had a strong social media presence on different channels, such as Twitter, YouTube, Facebook, Instagram, and LinkedIn. In addition to promoting traffic on their official corporate websites, social media platforms were widely used for community engagement purposes. Most firms shared their organization’s homepage URL on social media platforms, 96% maintained email contact, and 76% shared a clear social media link on their homepage. Moreover, 64% of firms engaged the community with messages about COVID-19 on their official websites by sharing health tips crucial for enabling community members to prevent the spread of the disease (Table 1). The most commonly used social media platform, except for corporate blogs, was LinkedIn (94%), which was mainly used for professional networking (Table 2). Considering the level of interest in the energy and resources sector, these firms require a wide range of skilled professionals to help structure their human capital, and LinkedIn provides an appropriate platform for companies to identify and engage potential professionals willing to cooperate in various aspects of their operations.
3.1.5. Russia
Fifty Russian companies were selected for the investigation. Among them, 96% used corporate blogs, 74% had links to other social media channels, and 58% updated their information about COVID-19 during the pandemic (Table 1). Although the usage rate of social media was higher in Russia than in China and Japan for every social media platform, further data analysis showed that 70% of firms in Russia had links to their official websites on YouTube but less than 40% of companies had links to their official websites on the other four social media platforms.
3.2. Sector-level social media use
Here, we integrated the results of companies from all five countries to explore social media adoption and use throughout the entire energy and resources sector. All companies analyzed in this study used corporate blogs as the most popular form of social media, accounting for 77%; LinkedIn was the second most popular social media platform, accounting for 58%, followed by Facebook, accounting for 53%. Among the major social media platforms involved in this research, Instagram accounted for only 32%, representing the least popular social media platform (Figure 2). Corporate blogs were the most popular type of social media in the energy and resources sector, with 61% of companies actively publishing relevant information about COVID-19, which has attracted recent public attention. As shown in Figure 3, 20% of companies in the energy and resources sector used all five social media platforms involved in this study, and 16% used two different social media platforms. Since 2005, companies in the energy and resources sector have started to adopt social media, with the usage rate gradually increasing over time to 14.1% in 2014. Since then, the proportion of companies newly using social media platforms has continuously decreased, to 2.3% in 2022 (Figure 4). Further analysis of various social media platforms showed that 30% of companies have attached official website links to their Facebook pages, 31% have official website links on Twitter, 34% have official website links on YouTube, and 34% have official website links on LinkedIn. Moreover, 26% of companies actively use Twitter (i.e., they post a tweet at least once per month), 19% actively use YouTube (i.e., they post a video at least once per month), and 13% are active on LinkedIn (i.e., they have posted at least one job requirement).

Figure 2. Relative percentage use of different social media platforms in the energy and resources sector.
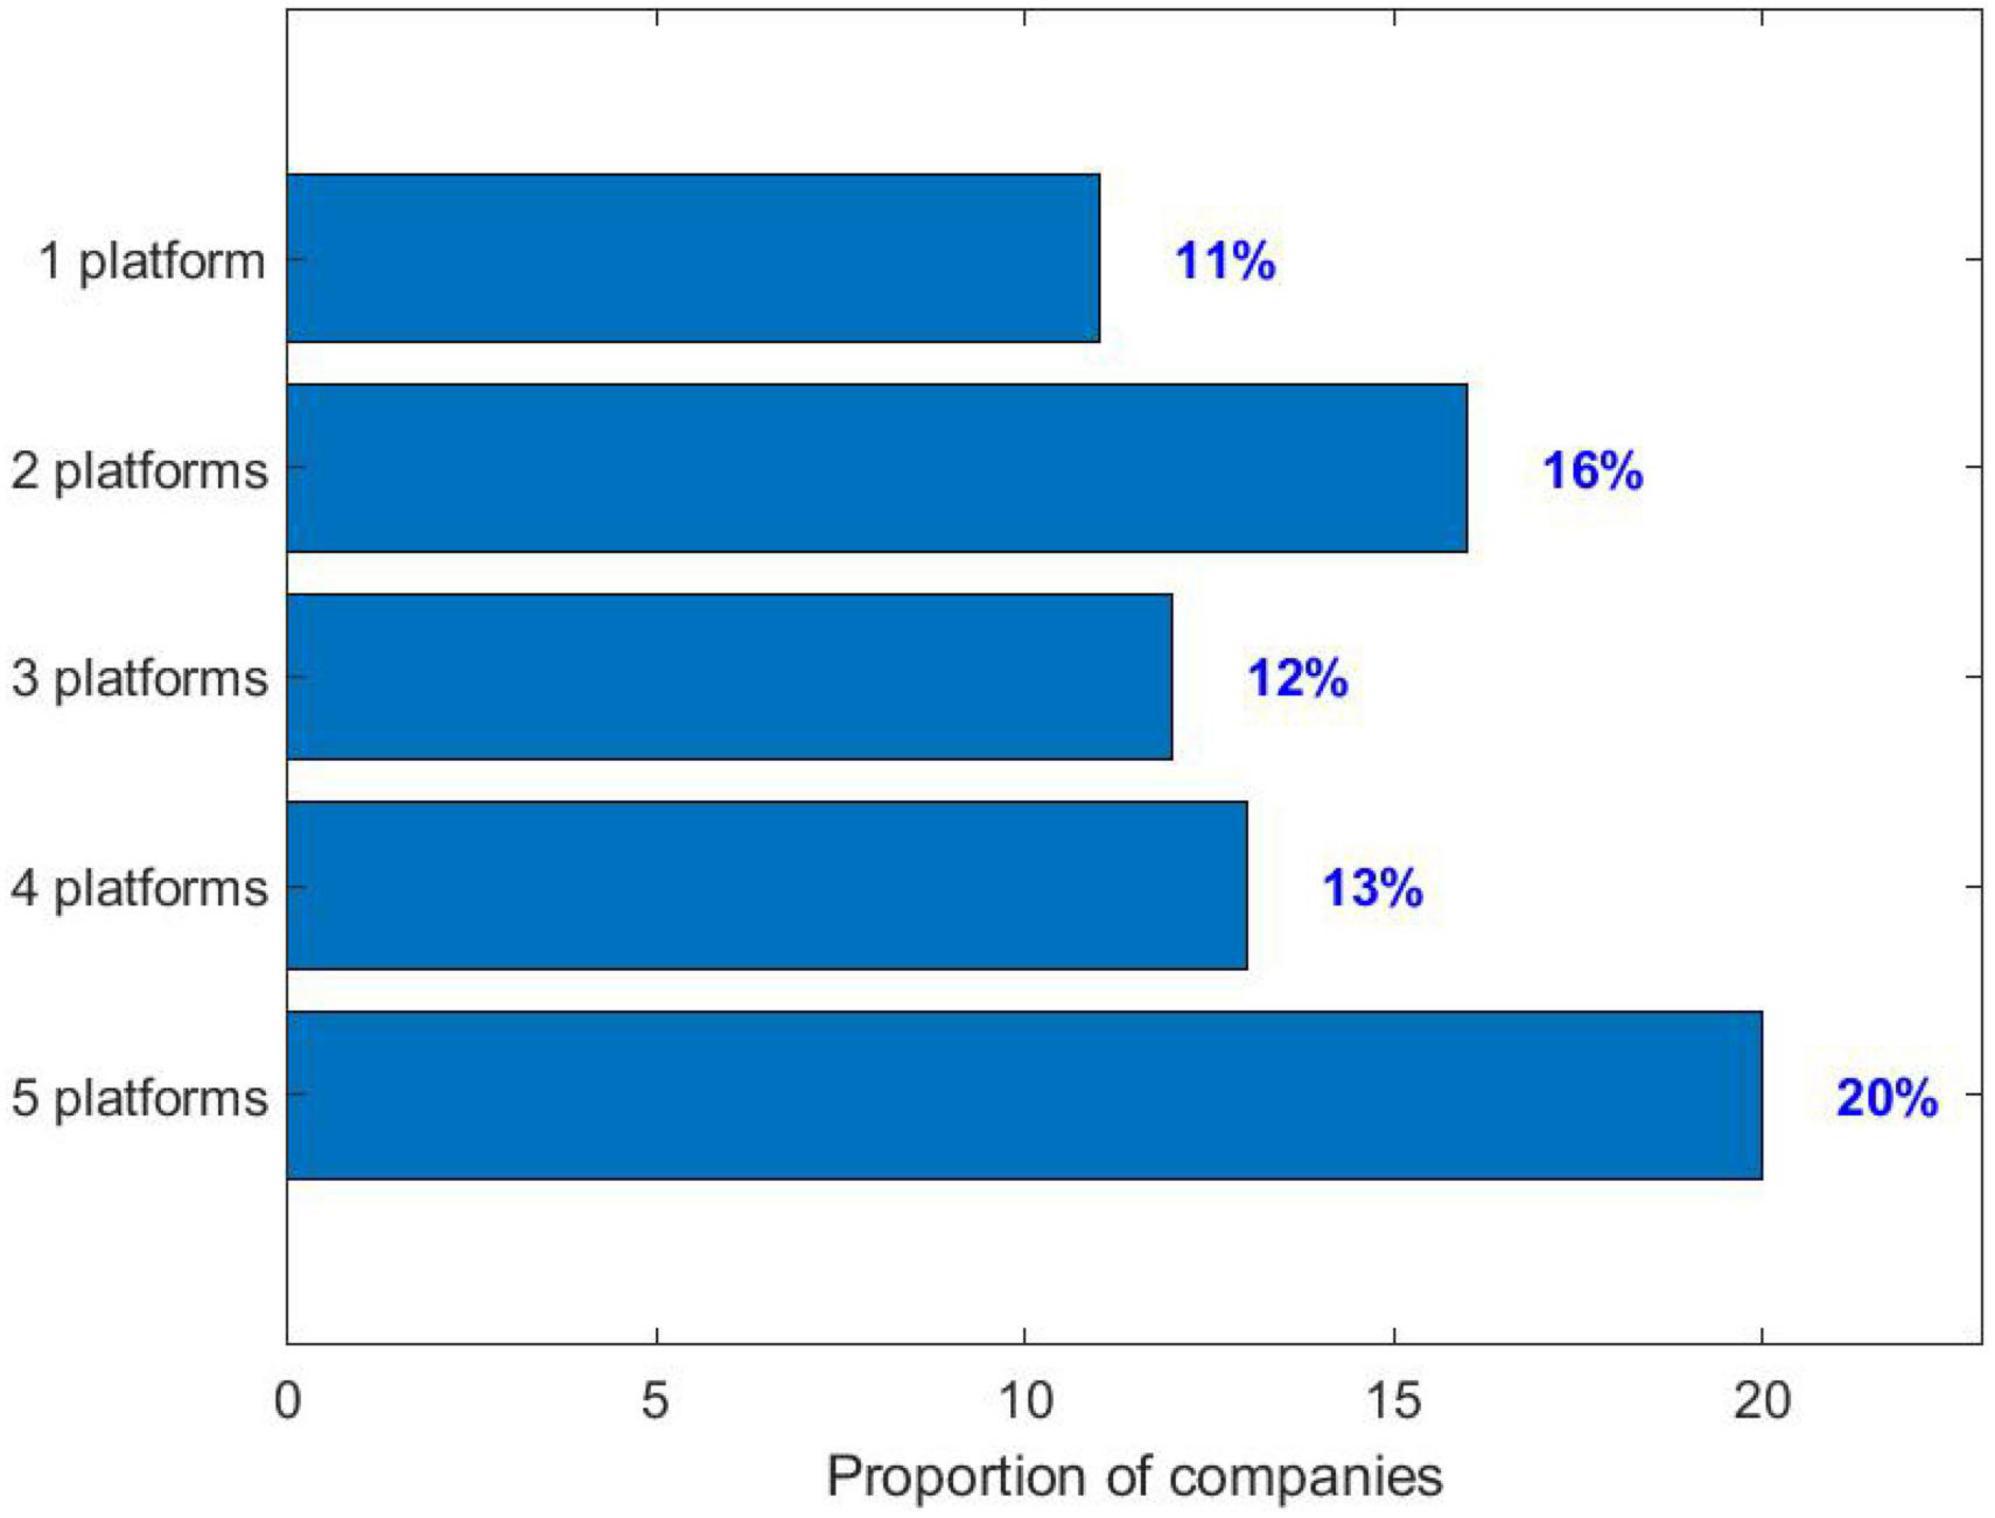
Figure 3. Number of social media platforms used by companies in the energy and resource sector.
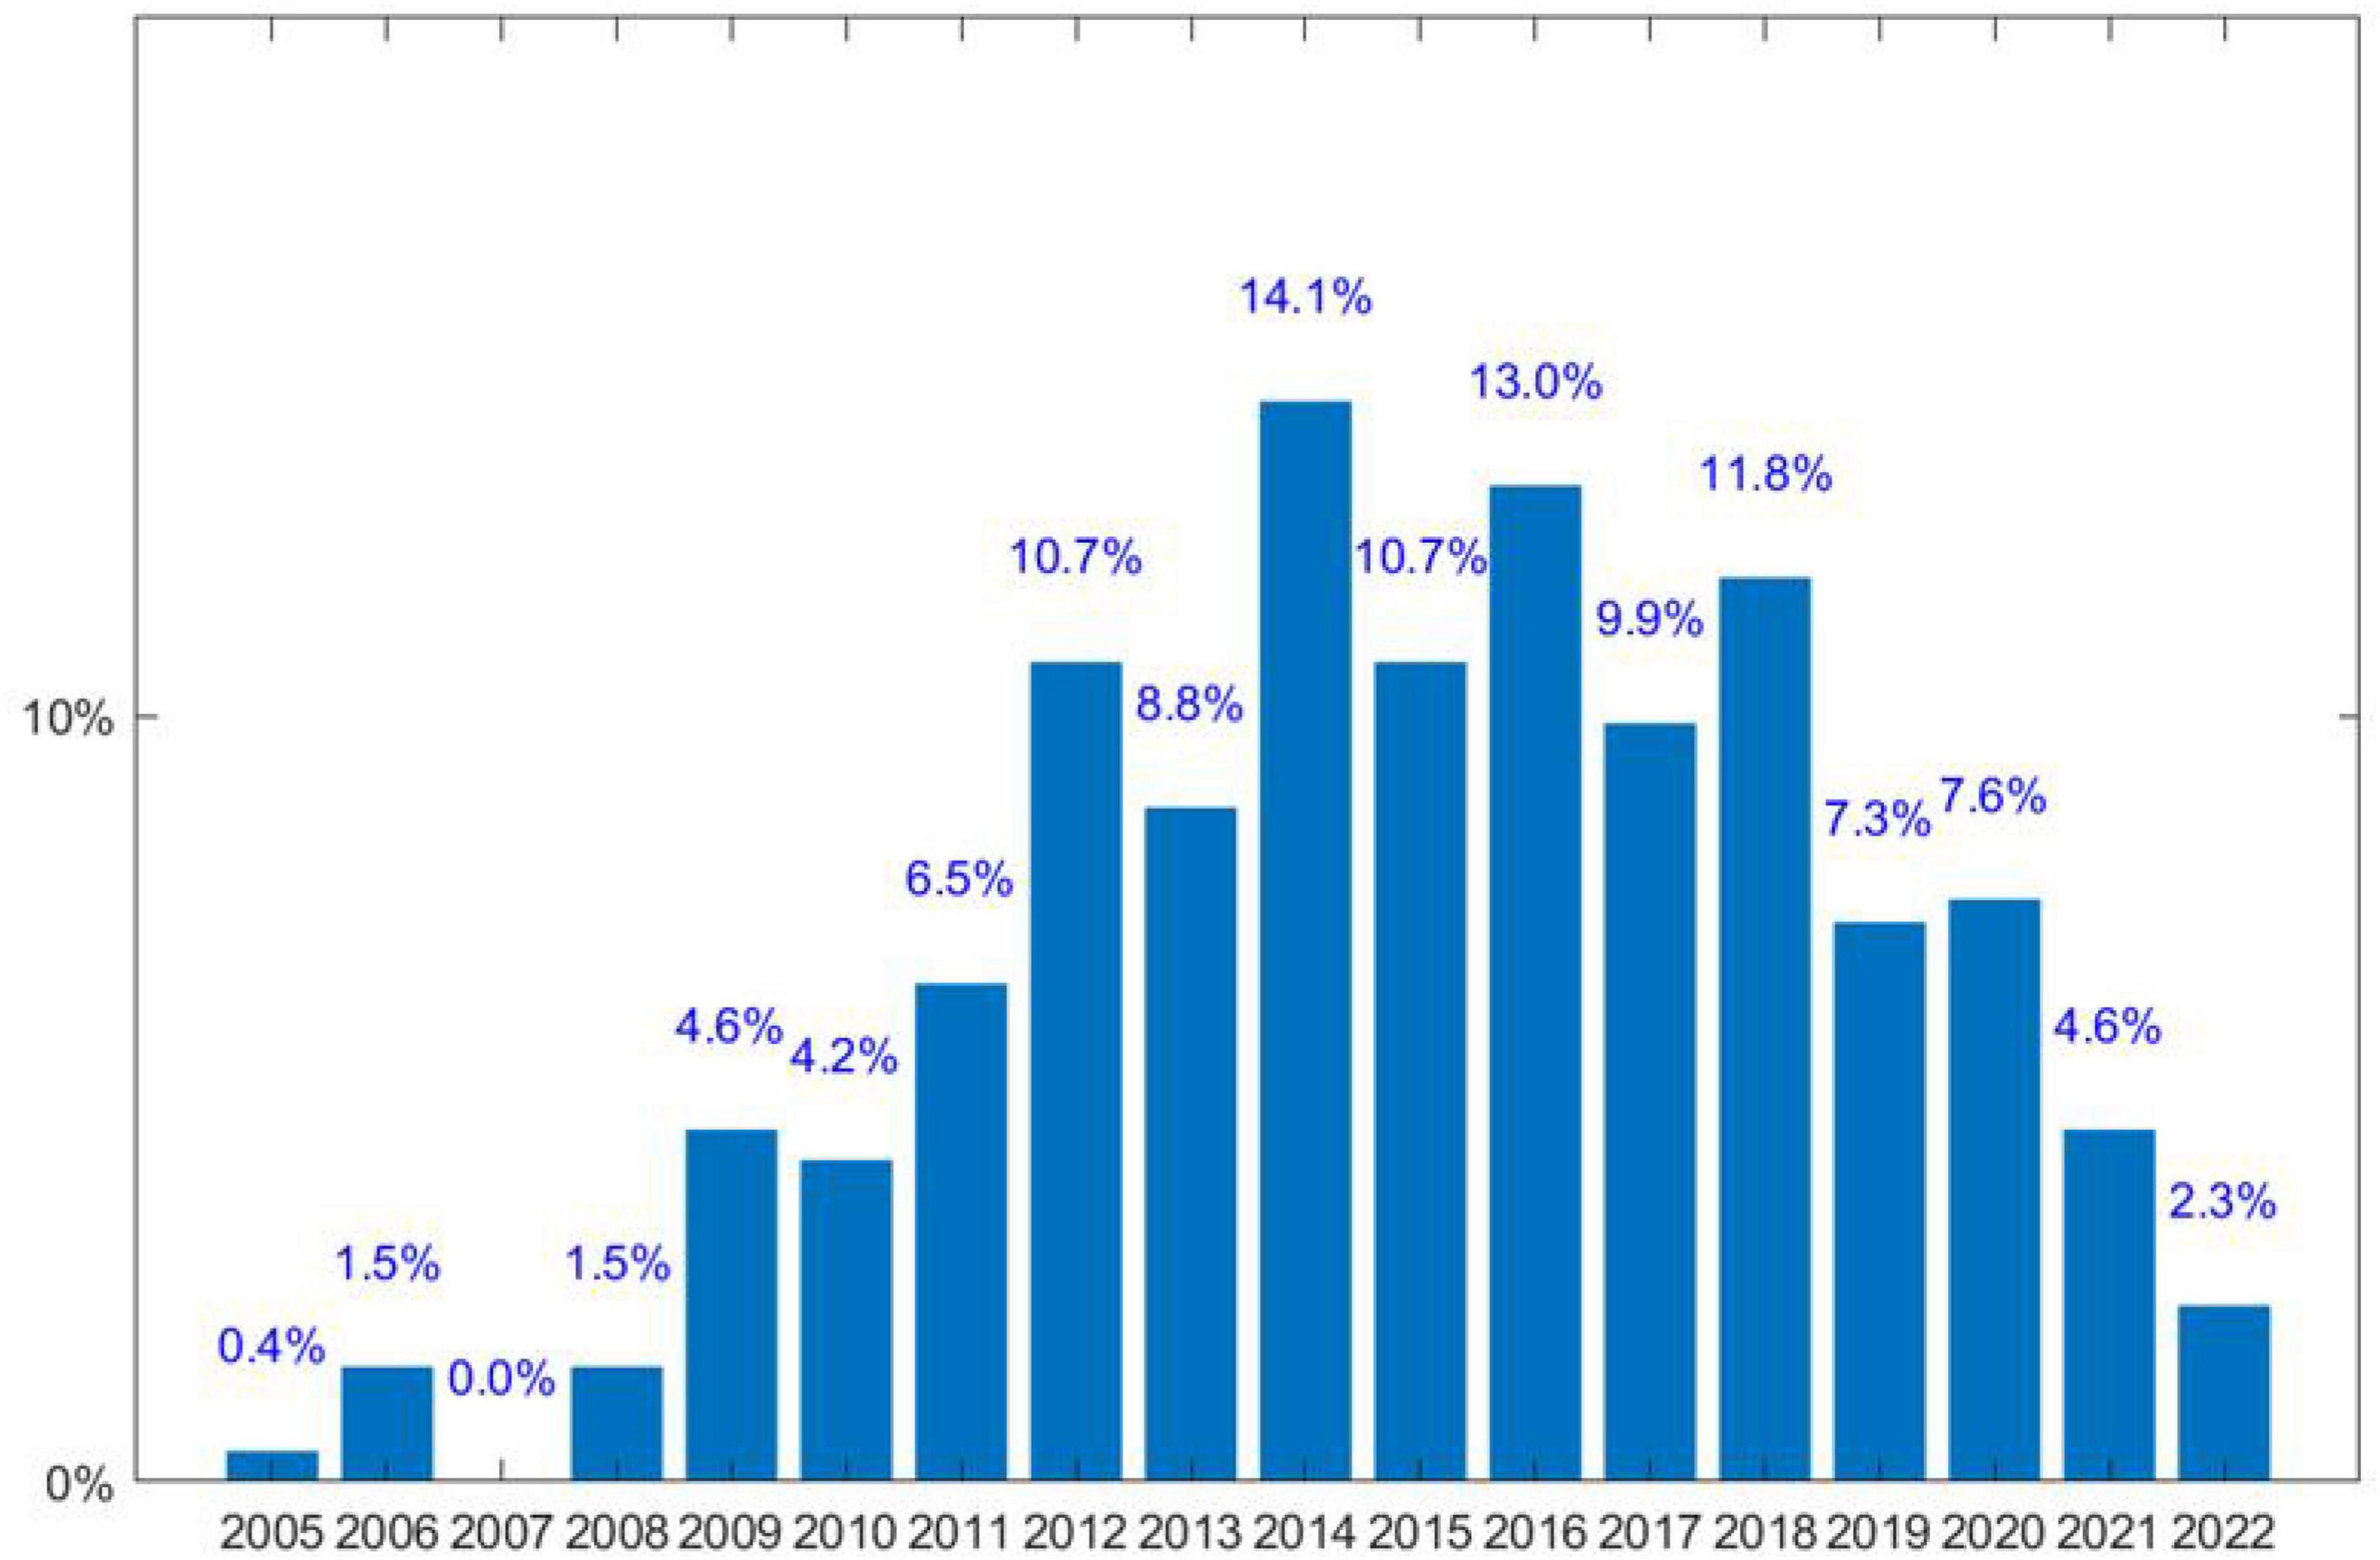
Figure 4. Evolution of new social media use by companies in the energy and resources sector over time.
3.2.1. Linear regression analysis of social media use in the energy and resources sector
For the linear regression analysis results listed in Table 3, the number of Facebook likes was used as the independent variable, and the number of Facebook followers was used as the dependent variable. The formula of the model was as follows: number of Facebook followers = 23,479.282 + 0.509 × number of Facebook likes. The r-squared value was 0.492, indicating that the number of Facebook likes explain 49.2% of changes in the number of Facebook followers. The model passed the F-test (F = 131.521, p = 0.000 < 0.05), and the regression coefficient of the number of Facebook likes was 0.509 (t = 11.468, p = 0.000 < 0.01). Therefore, the model is meaningful, and the number of Facebook likes has a significant positive impact on the number of Facebook followers.
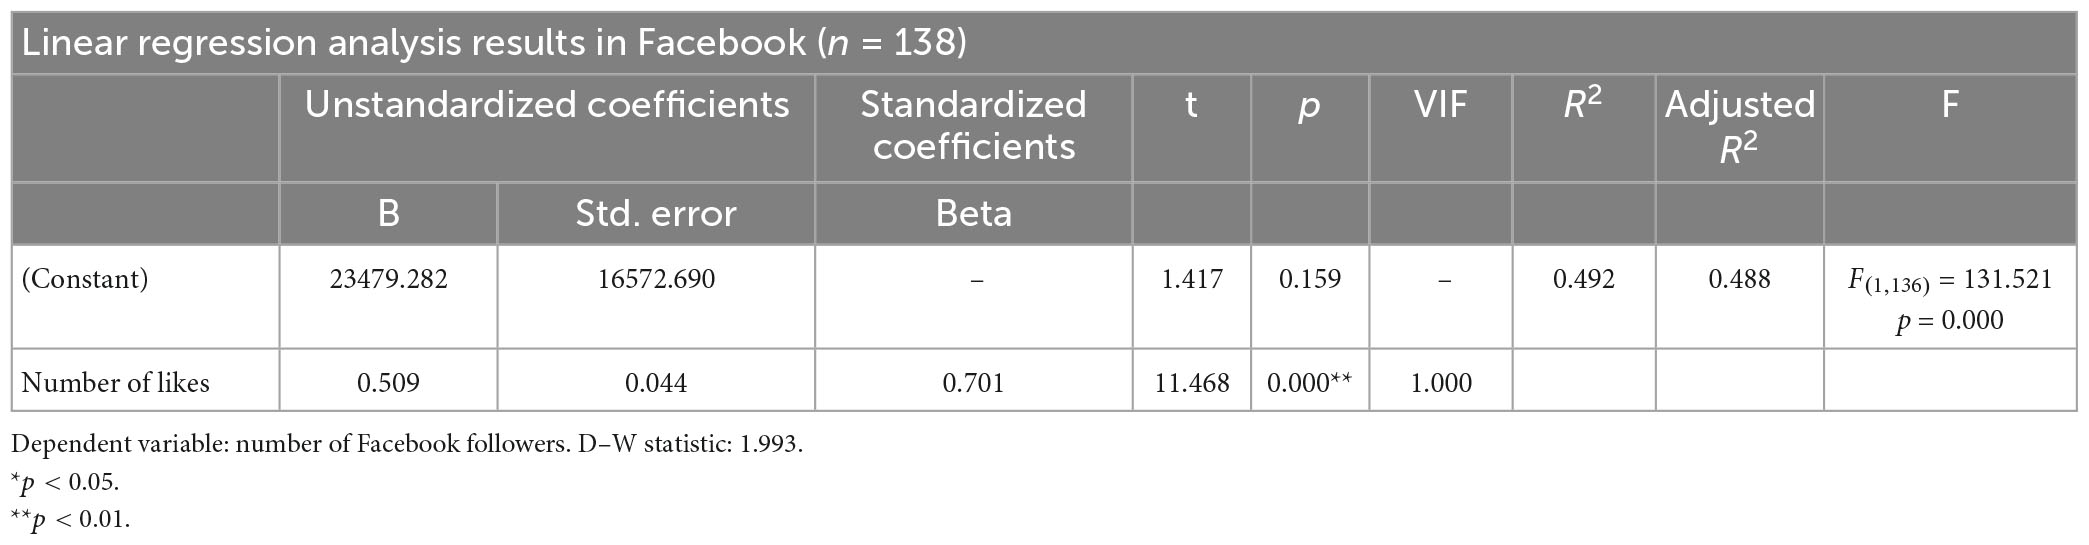
Table 3. Linear regression analysis of the effect of Facebook likes on number of followers.
For the linear regression analysis results listed in Table 4, the number of tweets, the number of tweets in the last month, and the number of other Twitter accounts the organization is following were taken as independent variables, and the number of Twitter followers of an organization was used as the dependent variable. The model formula was as follows: number of twitter followers of organization = 3355.289-4.826 × number of other Twitter accounts the organization is following −49.773 × number of tweets in last month + 7.599 × number of tweets. The r-squared value of the model was 0.470, indicating that the three independent variables explain 47.0% of changes in the number of Twitter followers of the organization. The model passed the F-test (F = 30.702, p = 0.000 < 0.05), indicating that the independent variables affect the number of Twitter followers of the organization. According to the multicollinearity test of the model, all VIF values were less than five, indicating no collinearity problem. Furthermore, the D–W statistic was close to 2, showing that the model has no autocorrelation and that the sample data are not correlated; therefore, the model is good. The regression coefficients of the independent variables [7.599(t = 9.232, p = 0.000 < 0.01)] indicate that the number of tweets has a significant positive impact on the number of Twitter followers, but the number of tweets in the last month and the number of other Twitter accounts the organization is following do not affect the number of Twitter followers of the organization.
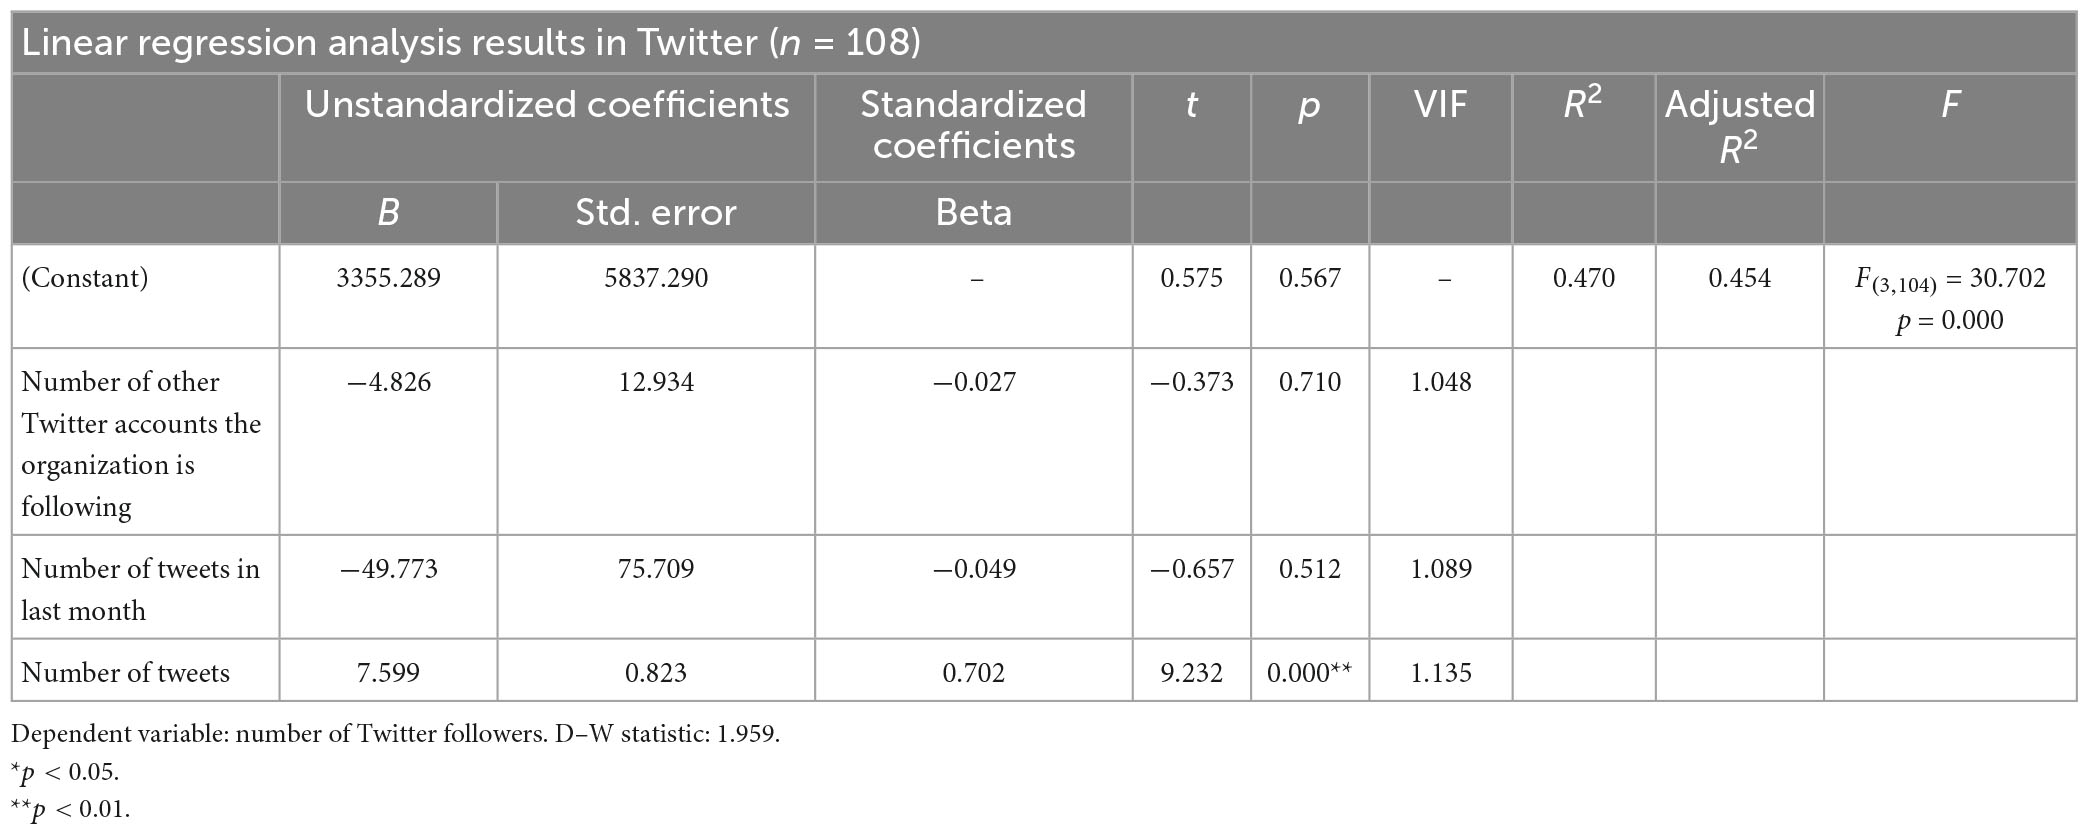
Table 4. Linear regression results of the effect of the number of tweets, number of tweets in the last month, and number of other Twitter accounts the organization is following on the number of Twitter followers of an organization.
For the linear regression analysis results listed in Table 5, the number of YouTube videos in the last 12 months, the number of YouTube videos, and the total views of YouTube channels were taken as the independent variables, and the number of YouTube subscribers was used as the dependent variable. The model formula was as follows: number of YouTube subscribers = 3018.248 + 2.885 × number of YouTube videos + 23.905 × number of YouTube videos in last 12 months + 0.000 × total views of YouTube channels. The r-square value of the model was 0.588, indicating that the three independent variables can explain the 58.8% change in the number of YouTube subscribers. The model passed the F-test (F = 57.114, p = 0.000 < 0.05), which means that at least one of independent variables affected the number of YouTube subscribers. In addition, the multicollinearity test of the model showed that all the VIF values in the model were less than 5, indicating that there was no collinearity problem. The D–W statistic was close to 2, which showed that the model has no autocorrelation, and there is no correlation between the sample data; therefore, the model is good. The final analysis showed that the regression coefficients of the number of YouTube videos and number of YouTube videos in the last 12 months does not have an impact on the number of YouTube subscribers. The regression coefficient of the total views of YouTube channels is 0.000 (t = 12.014, p < 0.01), suggesting that the total views of YouTube channels have a significant positive impact on the number of YouTube subscribers.
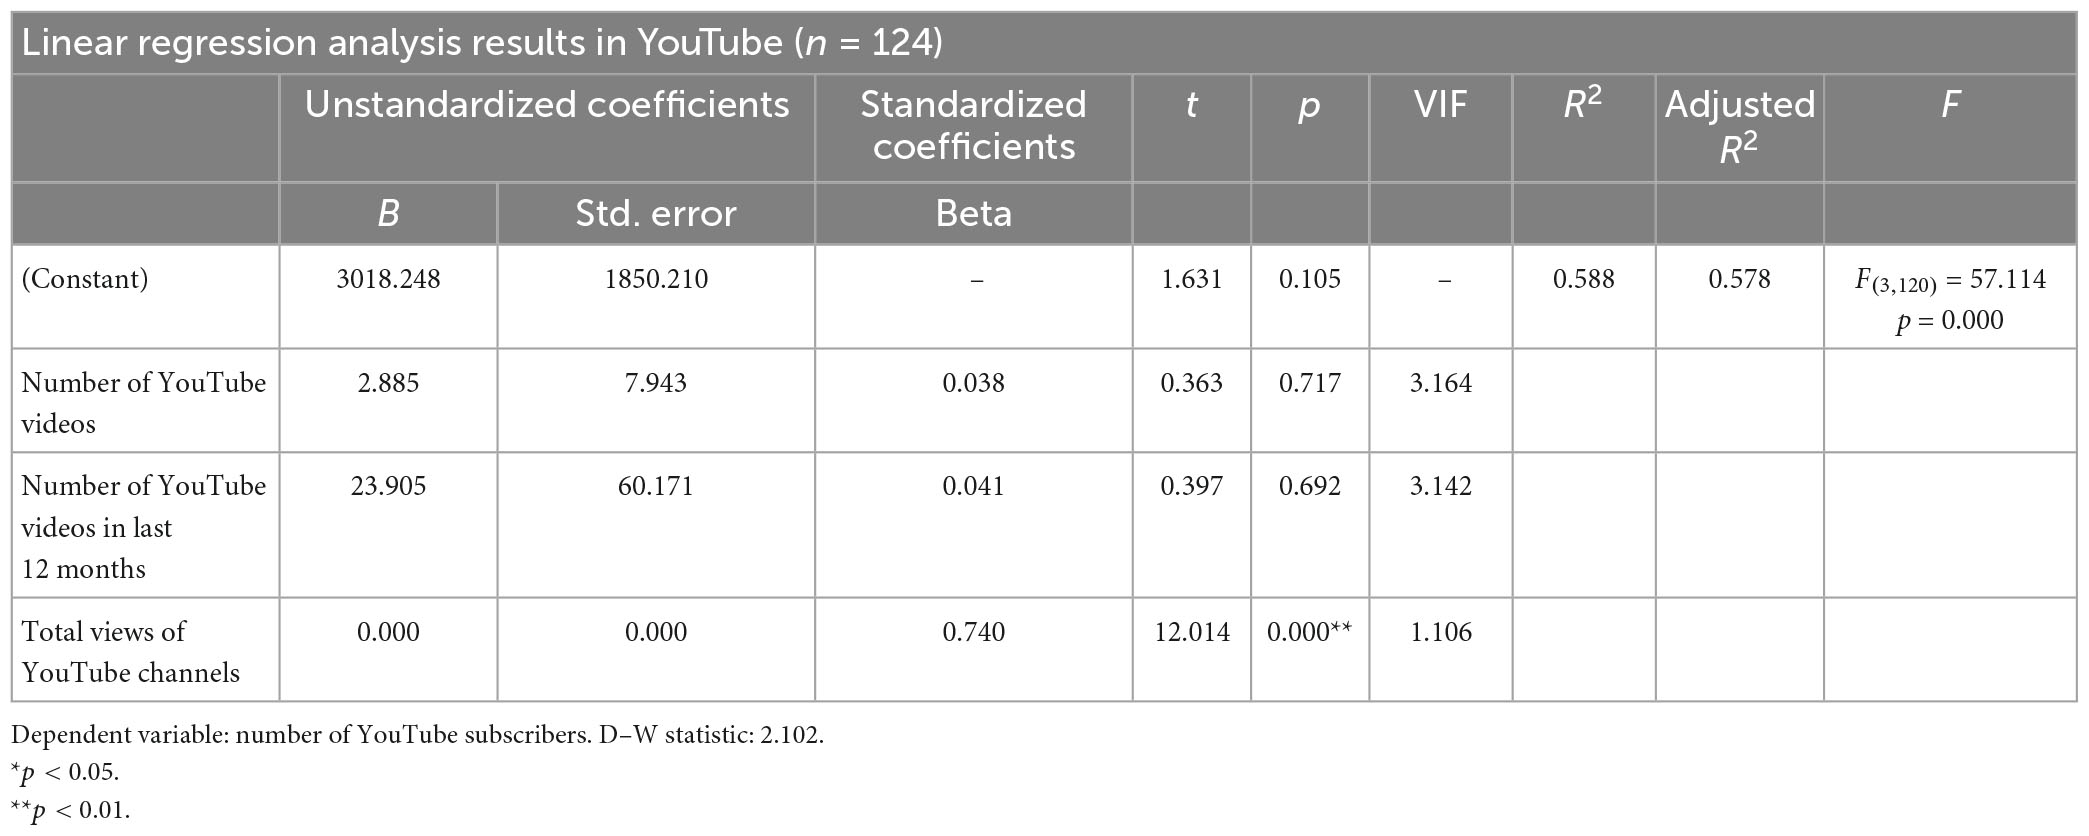
Table 5. Linear regression analysis of the effect of the number of YouTube videos in the last 12 months, number of YouTube videos, and total views of YouTube channels on the number of YouTube subscribers.
For the linear regression analysis results listed in Table 6, current posted job advertisements were used as the independent variable, and the number of LinkedIn followers was used as the dependent variable. The formula of the model was as follows: number of LinkedIn followers = 88612.465 + 1657.689 × current posted job advertisements. The r-squared value of the model was 0.371, indicating that the current posted job advertisements explain 37.1% of changes in the number of LinkedIn followers. The model passed the F-test (F = 88.370, p = 0.000 < 0.05), and the regression coefficient of the independent variable was 1,657.689 (t = 9.401, p = 0.000 < 0.01); therefore, current posted job advertisements have a significant positive impact on the number of LinkedIn followers.

Table 6. Linear regression analysis of the effect of current posted job advertisements on the number of LinkedIn followers.
For the linear regression analysis results listed in Table 7, total Instagram posts and the number of users followed by the organization were used as the independent variables, and the number of Instagram followers was used as the dependent variable. The model formula was as follows: number of Instagram followers = 7085.712–1.136 × number of users followed by the organization + 15.765 × total Instagram posts. The r-squared value of the model was 0.249, indicating that the total Instagram posts and number of users followed by the organization explain 24.9% of changes in the number of Instagram followers. The model passed the F-test (F = 13.288, p = 0.000 < 0.05) and the regression coefficients of total Instagram posts and the number of users followed by the organization were 15.765 (t = 5.080, p = 0.000 < 0.01) and −1.136 (t = −0.863, p = 0.390 > 0.05). Therefore, the total Instagram posts have a significant positive influence on the number of Instagram followers, whereas the number of users followed by the organization has no influence on the number of Instagram followers.
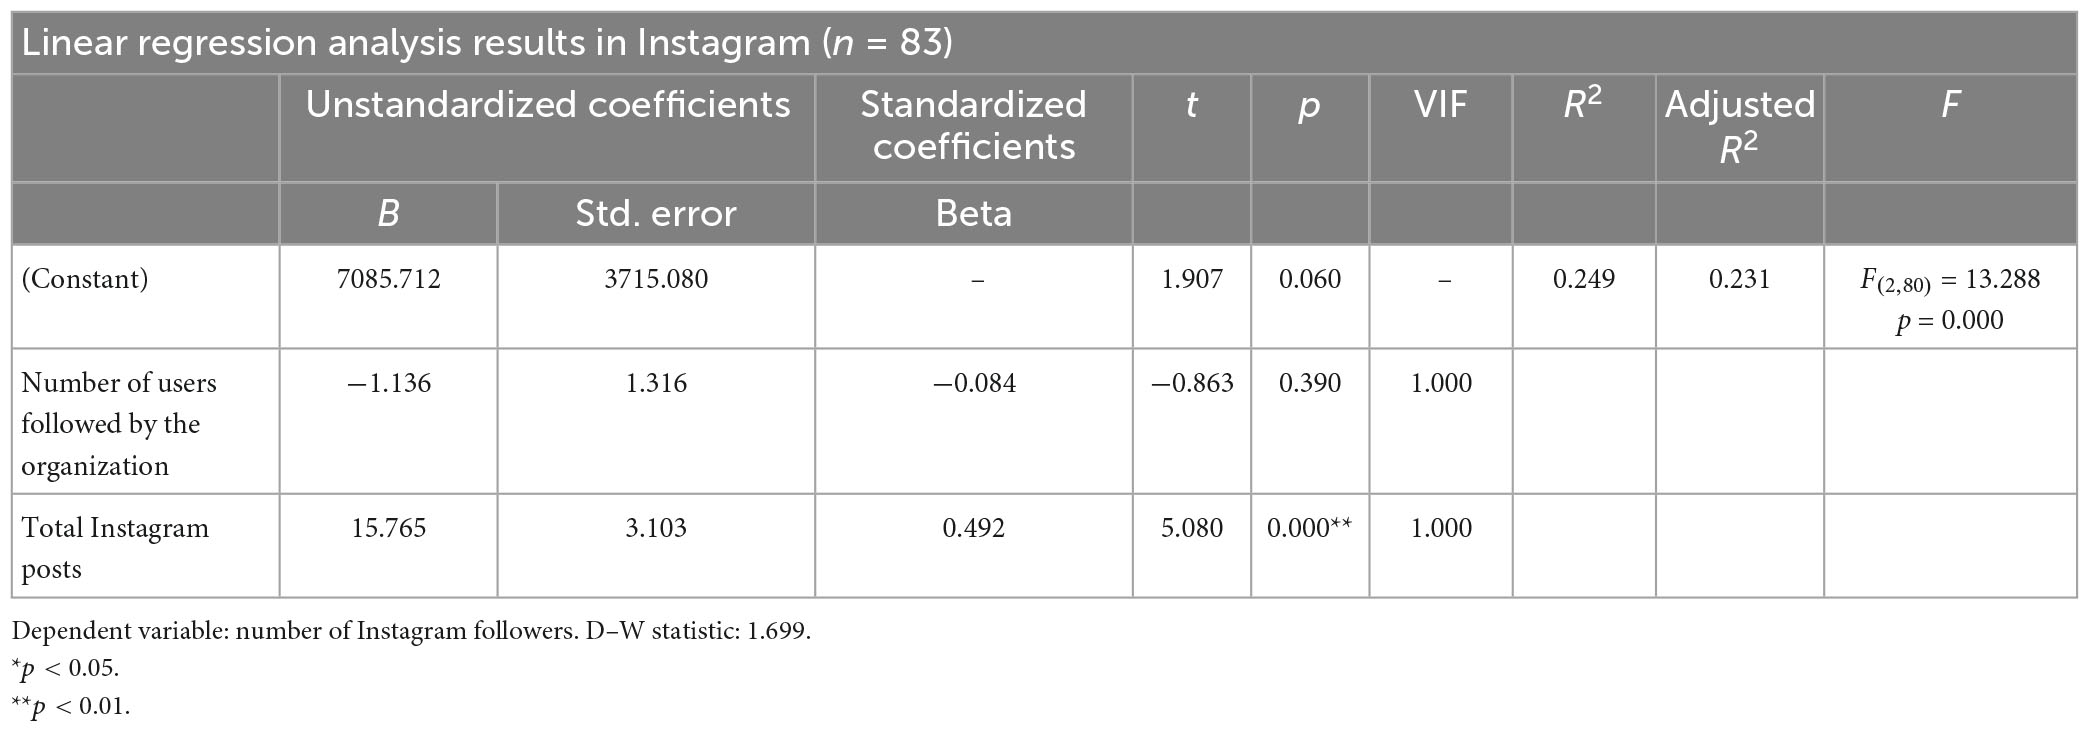
Table 7. Linear regression analysis of the effect of total Instagram posts and the number of users followed by the organization on the number of Instagram followers.
4. Discussion
In this study, we quantified social media use by firms operating in the energy and resources sector in five different countries across the world: India, China, Russia, Japan, and the USA. An average of 52 firms from each country was used for the analysis, which encompassed energy, mining, materials, and mixed firms. The analysis was performed at the national level and for the entire energy and resources sector. We established that most firms make a significant effort to maintain a strong online presence through corporate websites, blogs, email lists, and social media sites. These findings are consistent with those of Buratti et al. (2018), who found that an active online presence enabled corporate bodies to engage with their key stakeholders consistently and efficiently through virtual platforms, including for community engagement purposes, which was the case in the energy and resources sector.
All firms operated an official corporate website through which they communicated virtually with key stakeholders. These firms shared links with their respective social media sites on their corporate websites to help increase user traffic to their sites. These findings are also consistent with those of Creamer et al. (2018), who found that linking two online sites was an effective way of enhancing user traffic at each site. For example, sharing a company’s social media links on its website helped increase traffic on their social media pages from their corporate websites, and vice versa. Most companies in the energy and resources sector used this strategy to enhance their online presence, which agrees with the findings of Buratti et al. (2018), who found that a strong online presence was instrumental in boosting a firm’s corporate image and reputation, particularly for firms operating in the energy and resources sector as they deal with corporate B2B clients.
However, firms in different countries have different patterns of social media adoption and use. In the energy and resources sector, all firms were relatively active on their corporate websites, which gave them a strong online presence, and tended to focus on corporate blogs. These findings are consistent with those of Creamer et al. (2018), that is, corporate entities struggle to maintain a strong online presence for the purposes of branding and effective engagement with key stakeholders, particularly community members, in relation to obtaining their SLO and approval on ESG issues.
Except for corporate blogs, companies in the energy and resources sector that use social media platforms for community engagement prefer LinkedIn and Facebook over other social media platforms. Facebook was preferred because of its wide market reach, having the largest number of registered and active users. LinkedIn was preferred because it helped firms to link with potential professionals in their primary markets. These findings are consistent with those of Ning et al. (2022), who established that Facebook is the leading social media platform, and as such, the perfect channel for community engagement because it has most of the targeted stakeholders a company wishes to reach, including community members, the media, and the government, to secure its SLO and ESG approval. These findings are also consistent with those of Lacka and Chong (2016), who reported that LinkedIn was a less popular social media platform with the masses, but more popular with professionals; thus, it enables companies to network with potential professionals they might require to handle various activities in their firm.
The concept of community engagement was put into practice by these firms during the COVID-19 pandemic, with companies in all countries except India actively publishing information about COVID-19, and more than half of companies in the entire sector providing their respective communities with COVID-19 information. This approach to community engagement indicates that firms wish to appear concerned with the wellbeing and survival of their communities, as opposed to using them only when necessary. These findings were consistent with those of Loukis et al. (2017), who stated that community engagement by corporate entities entailed showing local communities that the firm was not only concerned with its primary line of business but also the wellbeing and development of the community. As such, firms are expected to wade into issues affecting the community, even if unrelated to their line of business, solely to help alleviate problems the community may be facing, such as COVID-19. These findings are also consistent with those of Shanmugam et al. (2019), who reported that community engagement programs are the most effective approach for gaining SLO and approval on ESG issues, which is crucial for boosting the business of energy and resources sector firms.
Our findings confirm that firms in the energy and resources sector adopt and use social media platforms to engage their respective communities and promote their brands. In fact, many firms operate more than one social media channel to enhance their online presence and social media leadership. These findings are consistent with those of Styan (2018), who found that operating more than one social media channel is beneficial for corporations in the energy and resources market, as it enables them to reach specific communities that prefer a particular social media channel, such as LinkedIn for networking professionals.
According to the linear regression analysis, current posted job advertisements have a significant positive impact on the number of LinkedIn followers. LinkedIn is an extremely important platform for mining potential professionals in the energy and resources industry; therefore, it is necessary to actively publish relevant job recruitment requirements to further increase followers, thereby increasing the influence and popularity of the platform. Moreover, the number of Facebook likes has a significant positive impact on the number of followers on Facebook. Facebook also plays an important role in interacting with stakeholders and communities. For Facebook to be actively used, enterprises need to increase Facebook likes in relevant ways to increase platform followers, further expand the influence of enterprises, and interact with communities. The total views of YouTube channels had a significant positive influence on YouTube followers; therefore, enterprises need to increase the total views of their YouTube channels to enhance their influence. Furthermore, total Instagram posts have a significant positive impact on the number of Instagram followers. Instagram, like Facebook, plays an important role in companies in the energy and resources industry; thus, it is necessary to publish relevant posts in real time to increase the number of Instagram followers. Finally, the number of tweets has a significant positive impact on the number of Twitter followers of an organization. Thus, continually updating their relevant information on Twitter, similar to that on Facebook, Instagram, and LinkedIn, is necessary for companies to increase their number of followers.
5. Conclusion
The results of this study indicate that firms in the energy and resources sector worldwide have made strategic efforts toward maintaining a strong online presence by operating official corporate websites and maintaining an active presence on select social media channels. Each company had an official corporate website and an active presence on one or more social media channels, which represents a strategic tool for closely engaging the community to obtain their SLO and gain approval on ESG issues arising within the industry.
However, firms in the five countries adopted and used social media platforms on different scales. Aside from strengthening their online capabilities through official websites, most companies have updated their relevant information in relation to the COVID-19 pandemic. More than half of the companies use Facebook and LinkedIn, approximately 40% use YouTube and Twitter, and 32% use Instagram. Furthermore, 96% of companies use corporate blogs, with 61% publishing information about COVID-19 on their corporate blogs.
The first recommendation drawn from these results is that firms in the energy and resources sector should maintain a strong online presence in the modern digital era. This is because the modern-day community is now actively engaged in multiple online platforms, which represent an easier tool for community engagement than conventional means of reaching target groups, such as community meetings or public rallies. The second recommendation is that these firms should select a given social media channel according to their target audience. As some channels are more effective for specific purposes, such as LinkedIn for professional purposes, companies should note the varied designs and features of each social media channel. Future research should address the use of social media in B2B marketing by firms operating in the energy and resources sector. The findings of this study advance our understanding of social media use by firms in this industrial sector. It is important for companies in in the energy and resources sector to use social media, because they need social media platforms for community engagement and improve their brand image. This paper explains the use of social media in the energy and resources sector, and what measures can be taken to increase the followers of social media platforms. And further enhance the brand image of companies and participate in community, so as to obtain SLO.
Data availability statement
The data that support the findings of this study are openly available in Figshare at https://doi.org/10.6084/m9.figshare.21545502.v1.
Author contributions
CD: conceptualization, methodology, validation, formal analysis, investigation, resources, data curation, writing—original draft, writing—review and editing, visualization, supervision, and project administration. SL: validation, formal analysis, investigation, resources, data curation, writing—original draft, writing—review and editing, and supervision. Both authors contributed to the article and approved the submitted version.
Acknowledgments
We would like to express our heartfelt gratitude to Professor Craig Styan from the School of Engineering, University College London, for their contribution to this study; specifically, the selection of social media platforms involved in this research, providing a list of some companies in India and China, and suggesting the pretreatment process.
Conflict of interest
The authors declare that the research was conducted in the absence of any commercial or financial relationships that could be construed as a potential conflict of interest.
Publisher’s note
All claims expressed in this article are solely those of the authors and do not necessarily represent those of their affiliated organizations, or those of the publisher, the editors and the reviewers. Any product that may be evaluated in this article, or claim that may be made by its manufacturer, is not guaranteed or endorsed by the publisher.
Supplementary material
The Supplementary Material for this article can be found online at: https://www.frontiersin.org/articles/10.3389/fevo.2023.1178042/full#supplementary-material
References
Bale, C., McCullen, N., Foxon, T., Rucklidge, A., and Gale, W. (2013). Harnessing social networks for promoting adoption of energy technologies in the domestic sector. Energy Policy 63, 833–844. doi: 10.1016/j.enpol.2013.09.033
Bonnemaizon, A., and Batat, W. (2011). How competent are consumers? The case of the energy sector in France. Int. J. Con. Stud. 35, 348–358. doi: 10.1111/j.1470-6431.2010.00937.x
Buratti, N., Parola, F., and Satta, G. (2018). Insights on the adoption of social media marketing in B2B services. TQM J. 30, 490–529. doi: 10.1108/TQM-11-2017-0136
Chaffey, D. (2022). Global social media statistics research summary 2022. Available online at: https://www.smartinsights.com/social-media-marketing/social-media-strategy/new-global-social-media-research/ (accessed September 13, 2022)
Creamer, E., Eadson, W., van Veelen, B., Pinker, A., Tingey, M., Braunholtz-Speight, T., et al. (2018). Community energy: Entanglements of community, state, and private sector. Geogr. Compass 12:e12378. doi: 10.1111/gec3.12378
Durkin, M., McGowan, P., and McKeown, N. (2013). Exploring social media adoption in small to medium-sized enterprises in Ireland. J. Small Bus. Enterpr. Dev. 20, 716–734. doi: 10.1108/JSBED-08-2012-0094
Flanigan, R., and Obermier, T. (2016). An assessment of the use of social media in the industrial distribution business-to-business market sector. J. Technol. Stud. 42, 18–29. doi: 10.21061/jots.v42i1.a.2
Fyfe, T., and Crookall, P. (2011). Social media and public sector policy dilemmas. Toronto, ON: Institute of Public Administration of Canada.
I Key World Energy Statistics (2020). Key world energy statistics 2020. Available online at: https://www.iea.org/reports/key-world-energy-statistics-2020 (accessed November 11, 2022)
Khan, G., Swar, B., and Lee, S. (2014). Social media risks and benefits: A public sector perspective. Soc. Sci. Comput. Rev. 32, 606–627. doi: 10.1177/0894439314524701
Kumar, A., Singh, R., Kaur, J., Pandey, S., Sharma, V., Thakur, L., et al. (2021). Wuhan to world: The COVID-19 pandemic. Front. Cell Infect. Microbiol. 11:596201. doi: 10.3389/fcimb.2021.596201
Kwahk, K., and Ge, X. (2012). “The effects of social media on e-commerce: A perspective of social impact theory,” in Proceedings of the 45th Hawaii international conference on system sciences, (Maui, HI: IEEE Publications), 1814–1823.
Lacka, E., and Chong, A. (2016). Usability perspective on social media sites’ adoption in the B2B context. Ind. Mark. Manag. 54, 80–91. doi: 10.1016/j.indmarman.2016.01.001
Lai, L., and To, W. (2015). Content analysis of social media: A grounded theory approach. J. Electron. Commer. Res. 16:138.
Lampe, C., and Roth, R. (2012). “Implementing social media in public sector organizations,” in Proceedings of the 2012 iConference, (New York: Association for Computing Machinery), 191–198. doi: 10.1145/2132176.2132201
Leonardi, P. (2014). Social media, knowledge sharing, and innovation: Toward a theory of communication visibility. Inf. Syst. Res. 25, 796–816. doi: 10.1287/isre.2014.0536
Loukis, E., Charalabidis, Y., and Androutsopoulou, A. (2017). Promoting open innovation in the public sector through social media monitoring. Gov. Inf. Q. 34, 99–109. doi: 10.1016/j.giq.2016.09.004
Martin, S. (2016). The rise of Facebook-based communication in the energy sector. Z. Energiewirtschaft 40, 89–96. doi: 10.1007/s12398-016-0173-8
Mergel, I. (2012). Social media in the public sector: a guide to participation, collaboration and transparency in the networked world. Hoboken, NJ: John Wiley & Sons.
Mergel, I. (2013). Social media adoption and resulting tactics in the U.S. federal government. Gov. Inf. Q. 30, 123–130. doi: 10.1016/j.giq.2012.12.004
Ning, X., Tian, W., He, F., Bai, X., Sun, L., Li, W., et al. (2022). Hyper-sausage coverage function neuron model and learning algorithm for image classication. Pattern Recognit. 136:109216.
Pyakurel, P., and Wright, L. (2021). Energy and resources cooperation for greenhouse gases emissions reduction of industrial sector. Energy Environ. 32, 635–647. doi: 10.1177/0958305X20949957
Ravichandran, B. D., and Keikhosrokiani, P. (2023). Classification of Covid-19 misinformation on social media based on neuro-fuzzy and neural network: A systematic review. Neural Comput. Applic. 35, 699–717. doi: 10.1007/s00521-022-07797-y
Saura, J. R., Palacios-Marqués, D., and Ribeiro-Soriano, D. (2023). Exploring the boundaries of open innovation: Evidence from social media mining. Technovation 119, 2–3. doi: 10.1016/j.technovation.2021.102447
Shanmugam, M., Karunakaran, V., and Amidi, A. (2019). Formulation of an integrated social commerce framework to promote social capital for energy sectors. IJEECS 15, 427–434. doi: 10.11591/ijeecs.v15.i1.pp427-434
Sigala, M., Christou, E., and Gretzel, U. (eds) (2012). Social media in travel, tourism and hospitality: theory, practice and cases. Farnham: Ashgate Publishing, Ltd.
Sine, W., and Lee, B. (2009). Tilting at windmills? the environmental movement and the emergence of the U.S. Wind energy sector. Admin. Sci. Q. 54, 123–155. doi: 10.2189/asqu.2009.54.1.123
Styan, C. (2018). Social media use in the Australian energy and resources sectors. APPEA J. 58, 617–620. doi: 10.1071/AJ17152
Styan, C., Trott, W., Bartley, C., Sharpe, O., Wu, H., and Tubb, A. (2015). “Adoption of social media in the Australian energy and resources sectors,” in Proceedings of the 3rd international conference on social responsibility in mining, (Antofagasta: Gecamin).
Thackeray, R., Neiger, B., Hanson, C., and McKenzie, J. (2008). Enhancing promotional strategies within social marketing programs: Use of Web 2.0 social media. Health Promot. Pract. 9, 338–343. doi: 10.1177/1524839908325335
Keywords: energy and resources sector, SLO, ESG, social media, Facebook, Twitter, YouTube, Instagram
Citation: Duojie C and Liu S (2023) Quantitative analysis of social media use in the energy and resources sector: national comparison and sector analysis. Front. Ecol. Evol. 11:1178042. doi: 10.3389/fevo.2023.1178042
Received: 02 March 2023; Accepted: 30 March 2023;
Published: 25 April 2023.
Edited by:
Xin Ning, Institute of Semiconductors (CAS), ChinaReviewed by:
Jose Ramon Saura, Rey Juan Carlos University, SpainHongping Cao, University of Warsaw, Poland
Cheng Tong, Saigon University, Vietnam
Jun Zheng, Baotou Teachers’ College, China
Copyright © 2023 Duojie and Liu. This is an open-access article distributed under the terms of the Creative Commons Attribution License (CC BY). The use, distribution or reproduction in other forums is permitted, provided the original author(s) and the copyright owner(s) are credited and that the original publication in this journal is cited, in accordance with accepted academic practice. No use, distribution or reproduction is permitted which does not comply with these terms.
*Correspondence: Caidan Duojie, dWNlY2RjYUB1Y2wuYWMudWs=