 Mengmeng Gao
 Qiong Liu1*
- 1China Institute of Geological Environmental Monitoring, Beijing, China
- 2School of Grassland Science, Beijing Forestry University, Beijing, China
- 3Institute of Geophysical and Geochemical Exploration, Chinese Academy of Geological Sciences, Langfang, China
Water use efficiency [WUE = gross primary production (GPP)/evapotranspiration (ET)] is an important indicator of the degree of coupling between carbon and water cycles in ecosystems. However, the response of the carbon and water cycles to climate change and human activities,as well as the underlying driving mechanisms in the West Liao River Plain (WLRP), a typical farming–pasturing ecotone in northern China, remain unclear. This study examined the temporal and spatial variation characteristics of WUE in the WLRP from 2000 to 2020 using linear regression and the coefficient of variation (CV) method based on MODIS GPP and ET datasets. The relationships between WUE, meteorological factors, and human activities as well as the mechanism driving WUE changes were revealed through correlation analyses, residual analysis, and the grey correlation model. The interannual change of WUE from 2000 to 2020 showed a fluctuating but weakly upward trend. The intra-annual change in WUE followed an M-type bimodal trend, with two peaks from May to June and August to September. Areas with increased WUE accounted for 50.82% of the study area, and 11.11% of these showed a significant increasing trend. WUE was mainly positively correlated with temperature and solar radiation and negatively correlated with precipitation and VPD and presented obvious regional differences. Solar radiation had the most significant impact on WUE. WUE change is not entirely driven by climate change, and human activities have also played an important role. In areas where WUE increased, The average contribution rate of climate change was 72.4%, and that of human activities was 27.6%. This study reveals the temporal and spatial dynamics of WUE in the WLRP and highlights the influence of human activities on WUE changes.
1 Introduction
Water use efficiency (WUE) is defined as the amount of biomass produced per unit of water used by a plant. This concept was introduced 100 years ago by Briggs and Shantz (1913), who demonstrated the relationship between plant productivity and water use. As a key measurement of the coupled carbon and water cycle function of terrestrial ecosystems, WUE not only reflects the interrelationship between these two factors but also explains the response of terrestrial ecosystems to climate change (Gang et al., 2016; Hatfield and Dold, 2019).
WUE can be estimated in different ways, depending on the temporal and spatial scales or the scientific question of interest (Bhattacharya, 2019). Based on its definition, agricultural scientists usually determine WUE as the relationship between either biomass or crop yield and either transpiration or the total water provided to the crop, which includes the amount of water provided by precipitation and irrigation (Gadanakis et al., 2015; Bhattacharya, 2019). In ecology, when WUE is calculated on a regional scale, the mass of CO2 assimilation may be measured as the gross primary productivity (GPP), net primary productivity (NPP), or net ecosystem carbon production (NEP), and the water use may be measured as evapotranspiration (ET) or annual rainfall (Tian et al., 2020). Among these, one common way of calculating WUE is to use the ratio of GPP to ET. This method is typically used to analyze the carbon and water coupling characteristics of ecosystems and their responses to environmental changes over long timescales, such as months or years (Jassal et al., 2009; Zhen et al., 2017; Ai et al., 2020).
In addition to being regulated by the vegetation system, WUE is closely related to external environmental conditions. Temperature, precipitation, humidity, solar radiation, and CO2 concentration are key climatic factors affecting vegetation WUE (Hatfield and Dold, 2019). In the context of global climate change, the warming rate is remarkable, precipitation on land has increased, the carbon dioxide concentration is at its highest level in the past two million years, and extreme climate events are occurring frequently (IPCC, 2021). Therefore, temporal and spatial variations in ecosystem WUE under climate change and the response of WUE to climate change have attracted considerable attention (Niu et al., 2011; Klein et al., 2013; Hao et al., 2019; Jia et al., 2023).
The West Liao River Plain (WLRP), located between the eastern plain of Inner Mongolia and the southwestern part of Northeast China, is one of the important birthplaces of agricultural civilization in northern China. As this region is located in the monsoon fringe area, the transition zone between arid, semi-arid, and semi-humid regions, and at the edge of the Horqin Sandy Land, plant growth is particularly sensitive to climate change, environmental transition, and human activities. Currently, studies on the vegetation ecology and related climatic factors in this region focus mostly on the vegetation community and coverage, NPP, crop yields, biomass, and NEP (Huang et al., 2013; Feng et al., 2014; Gao et al., 2017; Zhao, 2017; Yan et al., 2018; Aruna, 2020; Gao W. D. et al., 2022; Zhu et al., 2022). Few studies have examined WUE and its response to meteorological factors and human activities.
Through an analysis of the spatiotemporal change trend of WUE and the relationship between WUE, climate change, and human activities from 2000 to 2020, this study identified the driving mechanism of WUE change in the WLRP. This study has considerable significance for promoting the protection of ecosystems, utilizing and managing water resources, and achieving sustainable development of agriculture in the region.
2 Materials and methods
2.1 Study area
The WLRP is located in a farming–pasturing ecotone in Northeast China (42°21’–45°20’ N, 119°01’–123°43’ E), which is within a semiarid region including the Horqin Sandy Land, where the ecological environment is extremely fragile. It covers an area of 57,600 km2 (Gao M. M. et al., 2022), has an altitude range of 6–748 m, and slopes gradually from southwest to northeast (Figure 1A). The main geomorphic units are river impact plains and eolian dunes. The land-use types are mainly grassland and cropland, which account for more than 89% of the total area (Figure 1B). The grassland pastoral area is distributed in the north, agricultural areas are distributed in the center and at the southern edge, and sandy land is mainly distributed in the southwest. The average annual precipitation in this area is 385 mm, which occurs mainly in the form of rainstorms from June to September. The average annual temperature of the WLRP is 6.9°C.
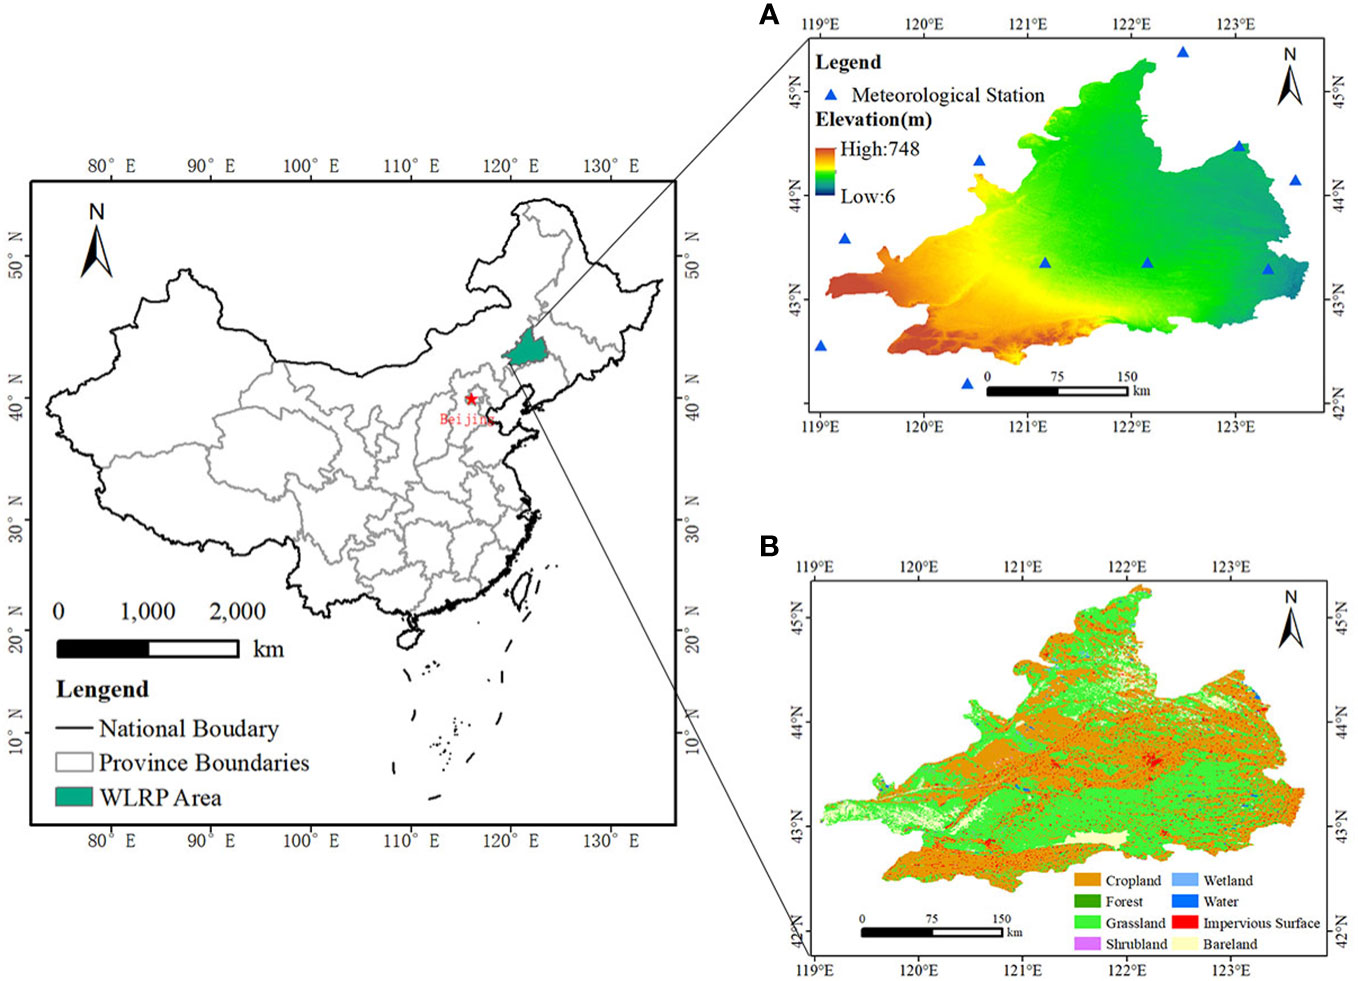
Figure 1 Location of the West Liao River Plain (WLRP). Meteorological station distribution and elevation (A) and land use in 2020 (B).
The WLRP includes the Xiliao and Xinkai Rivers, which have run dry since 1999. Exploitation of groundwater since the 1960s has reduced groundwater levels in the surrounding sandy land and aggravated desertification. However, in recent years, the ecological environment has improved as a result of comprehensive actions to control desertification.
2.2 Data sources and processing
2.2.1 Modis data
GPP data and ET data were obtained from MOD17A2 and MOD16A2 during the time period from 2000 to 2020 (https://earthdata.nasa.gov/). The spatial resolution of GPP (Zhao et al., 2005; Fu et al., 2017) and ET (Mu et al., 2011; Stavroula and Konstantinos, 2021) is 500 m, and the temporal resolution is 8 days. MODIS Reprojection Tool (MRT) software was used to process the GPP and ET datasets, including mosaic, projection, and format conversion.
WUE was expressed as the ratio of the GPP to ET of vegetation based on previous research (Hu et al., 2008; Zhu et al., 2014; Adams et al., 2016; An, 2022). It was formulated as follows:
where WUE is the water use efficiency (gC·mm−1·m−2), GPP is the gross primary productivity of the terrestrial ecosystem (g C·m−2), and ET is the evapotranspiration of the ecosystem (mm).
2.2.2 Meteorological data
Precipitation, temperature, solar radiation, and vapor pressure deficit (VPD) data were used in this study. Monthly precipitation and temperature data of 11 meteorological observation stations in the WLRP and surrounding areas were obtained from China Meteorological Data Sharing Service System (http://cdc.cma.gov.cn). Monthly solar radiation data with a spatial resolution of 0.1° × 0.1° were obtained from European Centre for Medium-Range Weather Forecasts (ERA5) Reanalysis Datasets (https://cds.climate.copernicus.eu/). All these monthly data were processed to annual data using kriging interpolation with a resolution of 500 m.
The vapor pressure deficit (VPD) indicates the dryness of air, which is often used to study the impact of climate change on WUE (Riha and Melkonian, 2023). This factor was calculated using the mean monthly maximum temperature, minimum temperature, and relative humidity and the following formula (Li et al., 2014). The above data used in Eqs. 3 and 4 were also obtained from China Meteorological Data Sharing Service System. The monthly VPDs were calculated first, and then, the average annual VPD was calculated using the monthly VPD.
where es is saturated vapor pressure (kPa), ea is the actual vapor pressure (kPa),λmean is the mean relative humidity (%), and e0(Tmax) and e0(Tmin) are the saturated vapor pressure at the mean monthly maximum temperature and minimum temperature, respectively, which can be calculated by Tetens’ empirical formula (Allen et al., 1998) as follows:
where T is the temperature (°C), and e0(T) is the saturated vapor pressure at the temperature T (kPa). The spatial distribution of the multi-year mean precipitation (A), temperature (B), solar radiation(C), VPD (D) from 2000 to 2020 in the WLRP were shown in Supplementary Figure 1.
2.2.3 Human activities data
Land use data were obtained from Landsat-derived annual land cover product of China (CLCD) developed by Yang and Huang (2021), with a spatial resolution of 30 m. The land cover was classified into eight types: cropland, forest, grassland, wetland, shrubland, water, bareland, and impervious surface (Figure 1B). Population density datasets were obtained from Worldpop hub (https://hub.worldpop.org/) with a 1 km resolution from 2000 to 2020. Global NPP-VIIRS-Like Nighttime Light data (NTL) were obtained from National Earth System Science Data Center with 500 resolution from 2000 to 2020.
2.3 Methods
2.3.1 Linear regression
The mean annual WUE trends from 2000 to 2020 were analyzed using linear regression analysis, which was calculated using the following formula (Mafi-Gholami et al., 2019; Yan et al., 2022):
where n is the number of samples, i is the serial year number (i = 1,2,3……, 21), WUEi is the WUE value in year i, and slope represents the change trend. If slope > 0, WUE has an increasing trend; if slope = 0, WUE does not change; if slope< 0, WUE has a decreasing trend.
The F-test was used to analyze the significance of the results. By combining the slope value and the F test, the results were divided into five grades: extremely significant decrease area (slope< 0, p< 0.01), significant decrease area (slope< 0, 0.01< p< 0.05), stable area (p > 0.05), significant increase area (slope > 0, 0.01< p< 0.05), and extremely significant increase area (slope > 0, p< 0.01).
The calculation formula for the F-test was based on the study of Chen et al. (2017).
2.3.2 Coefficient of variation
The coefficient of variation (CV), a statistic describing the degree of dispersion of random variables, was used to analyze the dispersion of WUE (Tucker et al., 1991; Milich and Weiss, 2000). The formula was
where CVWUE is the coefficient of variation of WUE, σWUE is the standard deviation of WUE, and is the mean annual WUE. When the CV is larger, the change of WUE is more unstable; when CV is smaller, it is more stable.
2.3.3 Correlation analysis
The correlation between WUE and the meteorological factors was analyzed. The correlation coefficient was calculated as follows:
where is the correlation coefficient of factor x and y, xi and yj are the values of factor x and y in year i, are the mean values of xi and yj, respectively. The value range of is [−1,1]. If rxy>0, the correlation between x and y is positive. The greater the absolute value of rxy, the stronger the correlation between x and y.
The t-test was used to test the significance of the correlation coefficient. The calculation formula for t-test refers to the paper Miao et al. (2023).
2.3.4 Residual analysis
The sampling multiple linear regression residual analysis method was used to analyze the effects and contributions of human activities and climate change on WUE (Evans and Geerken, 2004). The predicted and residual WUE was calculated using the following formula:
where a, b, c, d, and e are regression coefficients, PRE is the annual precipitation, TEM is the average annual temperature, VPD is the average annual vapor pressure deficit, RAD is the annual solar radiation. WUEres, WUEobs, and WUEpre are the residual, observed, and predicted values of WUE, respectively. The value of WUEres reflects the influence of human activities on WUE, while the value of WUEpre reflects the influence of climate change on WUE.
The contribution of climate change and human activities to the changes in WUE can be analyzed by grading the residual results. The criteria for determining the drivers of WUE changes (Supplementary Table 1) were defined by referring to previous studies (Gao W. D. et al., 2022; Yu et al., 2022).
2.3.5 Grey correlation model
To quantify the impact of climate change and human activity on WUE in the study area, the grey correlation model was introduced to calculate the correlation degree of each evaluation index (Liu et al., 2017). The higher the correlation degree, the higher the influence of this index on WUE.
3 Results
3.1 Spatial distribution of the multi-year mean WUE
The spatial distribution of WUE differed significantly across the WLRP (Figure 2). The multi-year mean WUE of the WLRP ranged from 0.458 to 2.027 gC·mm−1·m−2. The areas with the highest WUE were predominantly located in the southern and central regions of the study area. The areas with the lowest WUE were mainly in the western Horqin Sandy Land. The average WUE values of different vegetation types were ranked as follows: forest (1.38 gC·mm−1·m−2), cropland (1.34 gC·mm−1·m−2), grassland (1.31 gC·mm−1·m−2), wetland (1.23 gC·mm−1·m−2), shrubland (1.22 gC·mm−1·m−2) and bareland (1.04 gC·mm−1·m−2), respectively.
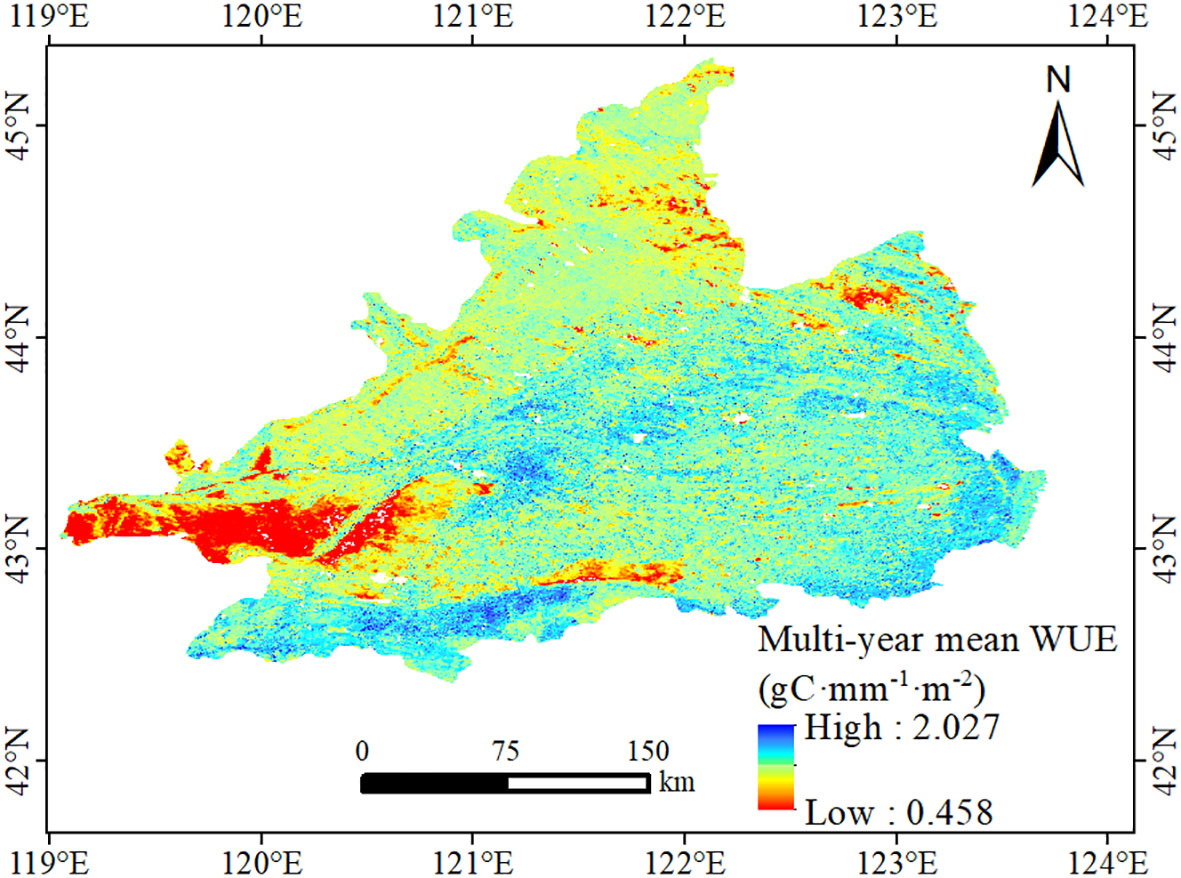
Figure 2 Spatial distribution of the multi-year mean water use efficiency (WUE) from 2000 to 2020 in the WLRP.
3.2 Temporal change of WUE
3.2.1 Interannual change of WUE
Figure 3 shows the interannual variations of WUE from 2000 to 2020, revealing the temporal changes of WUE in the WLRP. The interannual change of WUE showed a fluctuating but weakly upward trend, with the highest and lowest values being observed in 2019 and 2010, respectively. The interannual change trend was divided into two stages. The first stage, from 2000 to 2010, showed a downward trend with a rate of decrease of 0.00449 gC·mm−1·m−2·a−1. The second stage, from 2010 to 2020, showed an upward trend with a rate of increase of 0.00766 gC·mm−1·m−2·a−1.
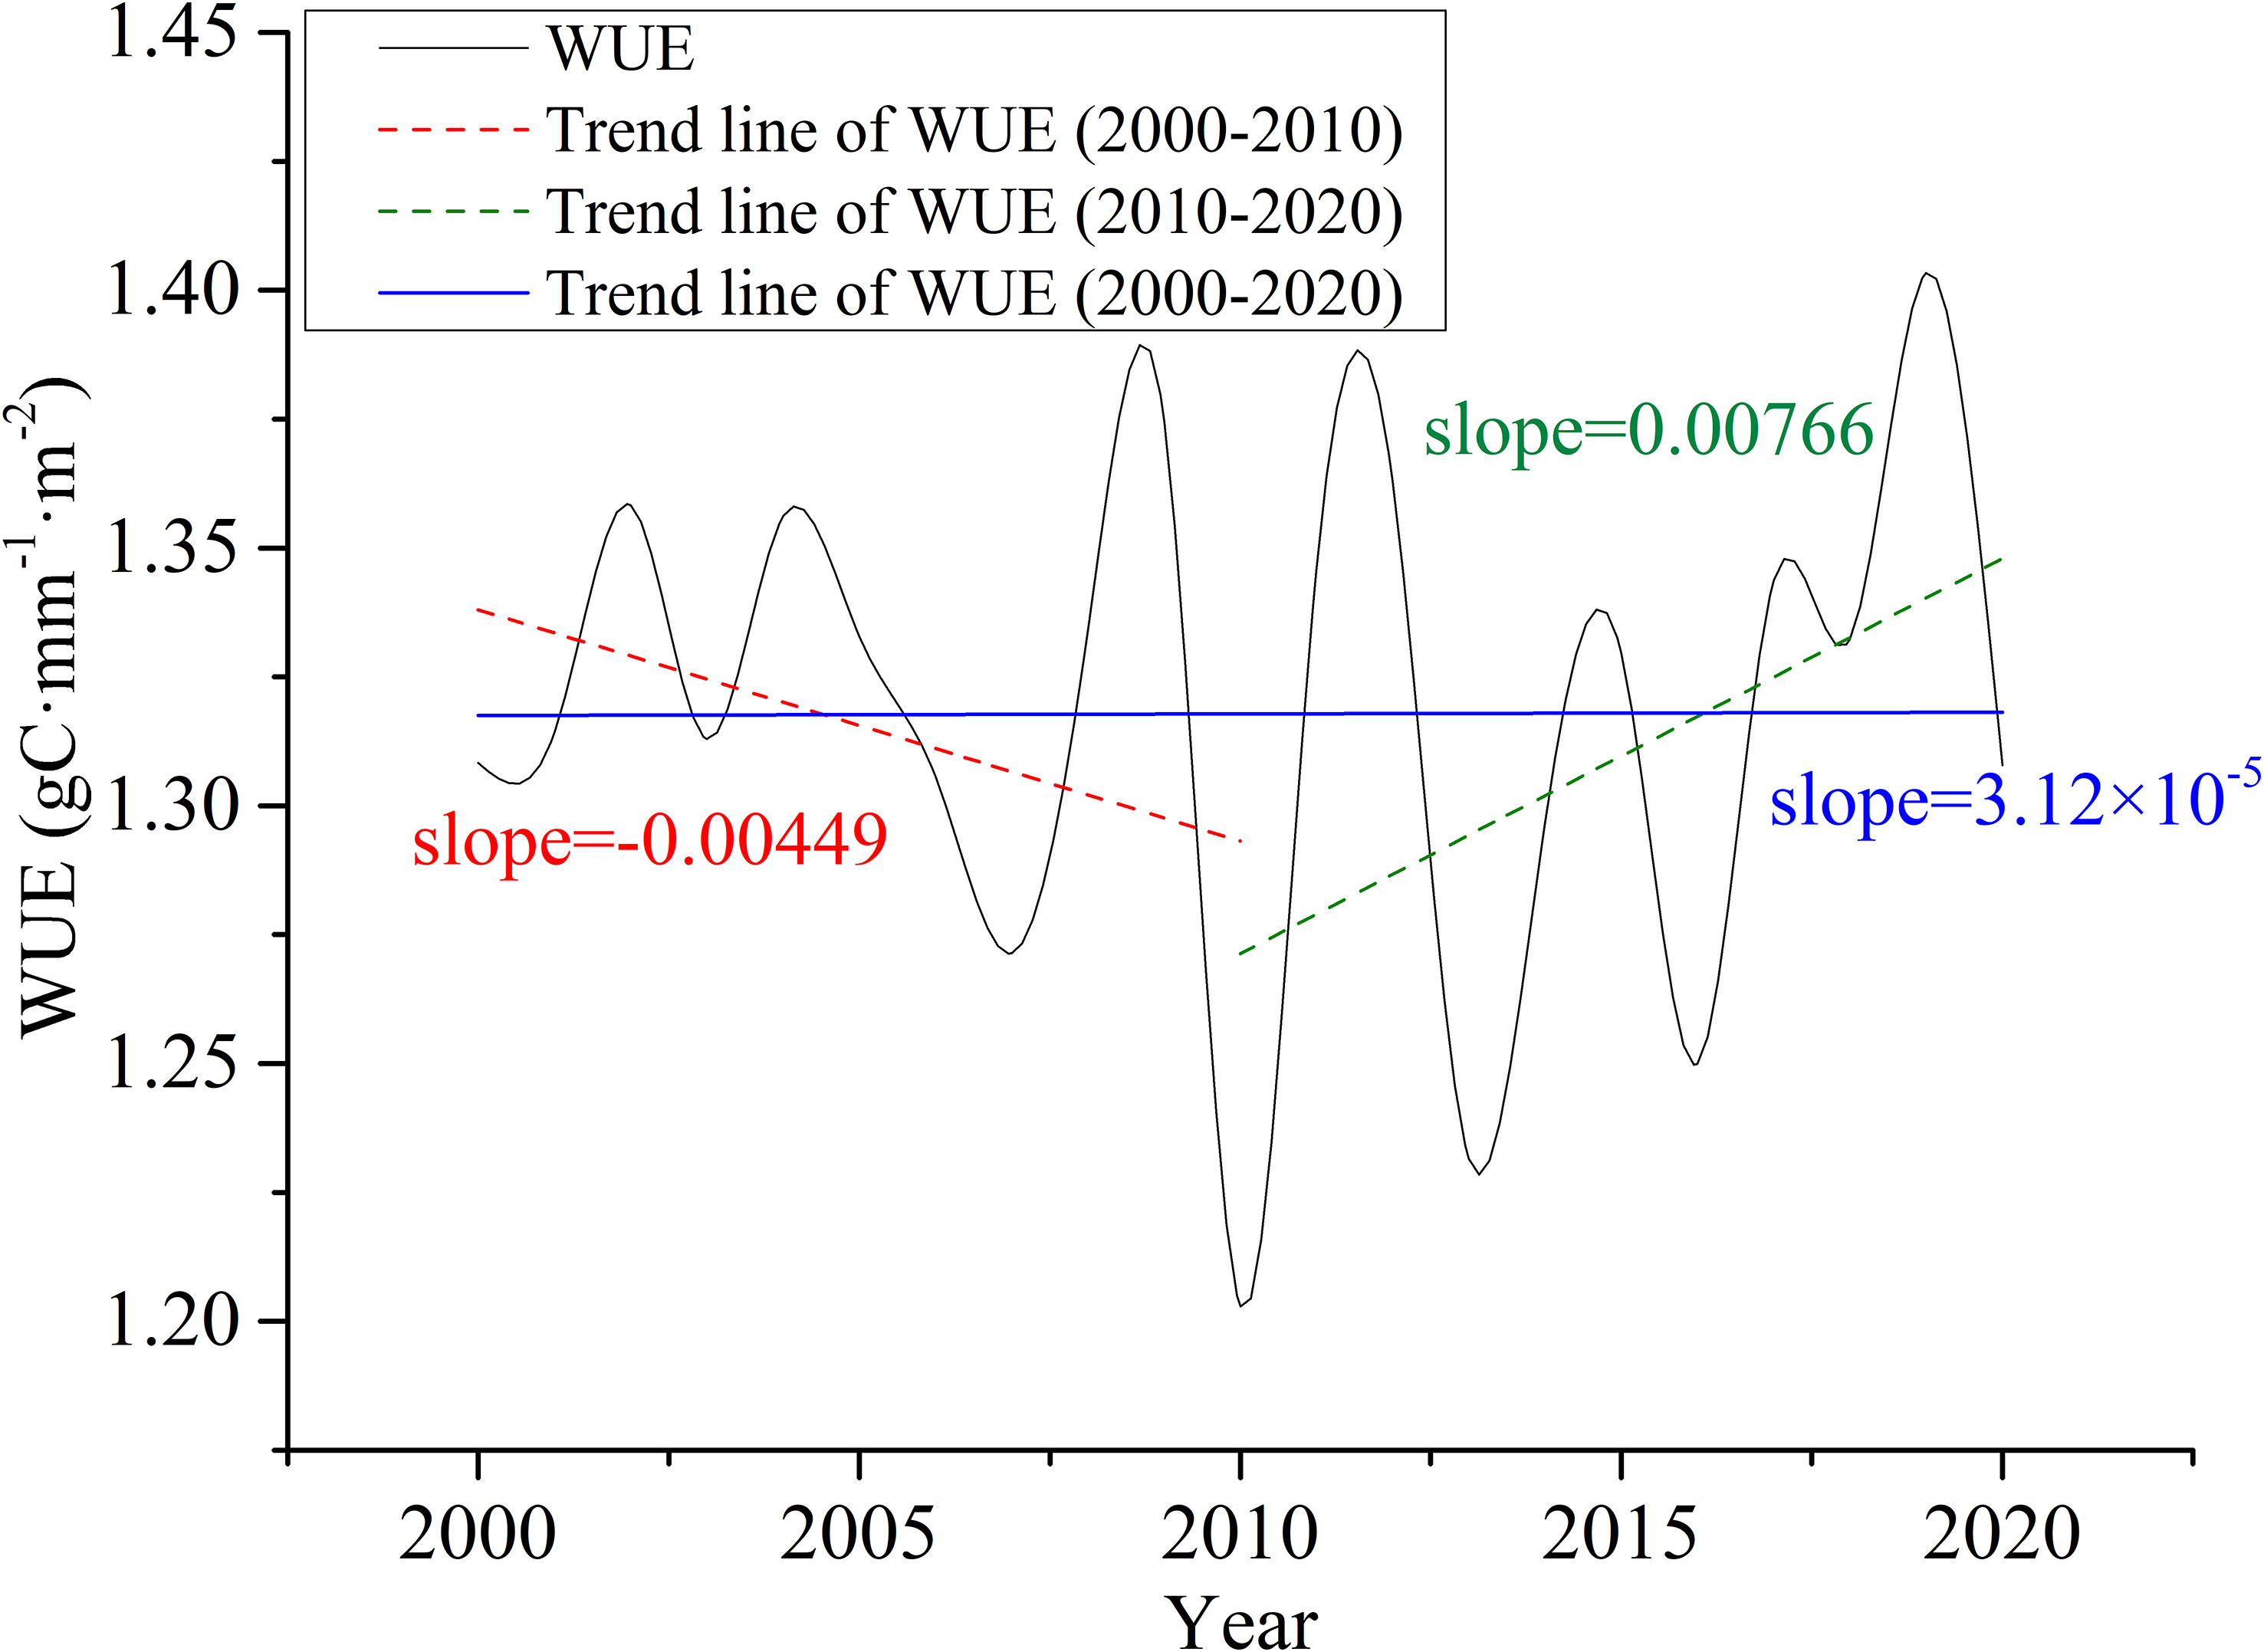
Figure 3 Interannual variations of WUE from 2000 to 2020 in the WLRP.
3.2.2 Intra-annual change of WUE
Figure 4 shows the monthly WUE change from 2000 to 2020, revealing the intra-annual change of WUE in the WLRP. The intra-annual change of WUE showed an M-type bimodal mode, with two peaks occurring from May to June and August to September, respectively. The average seasonal WUE decreased in the following order: summer (2.00 gC·mm−1·m−2) > spring (1.64 gC·mm−1·m−2) > autumn (1.23 gC·mm−1·m−2) > winter (0.01 gC·mm−1·m−2).
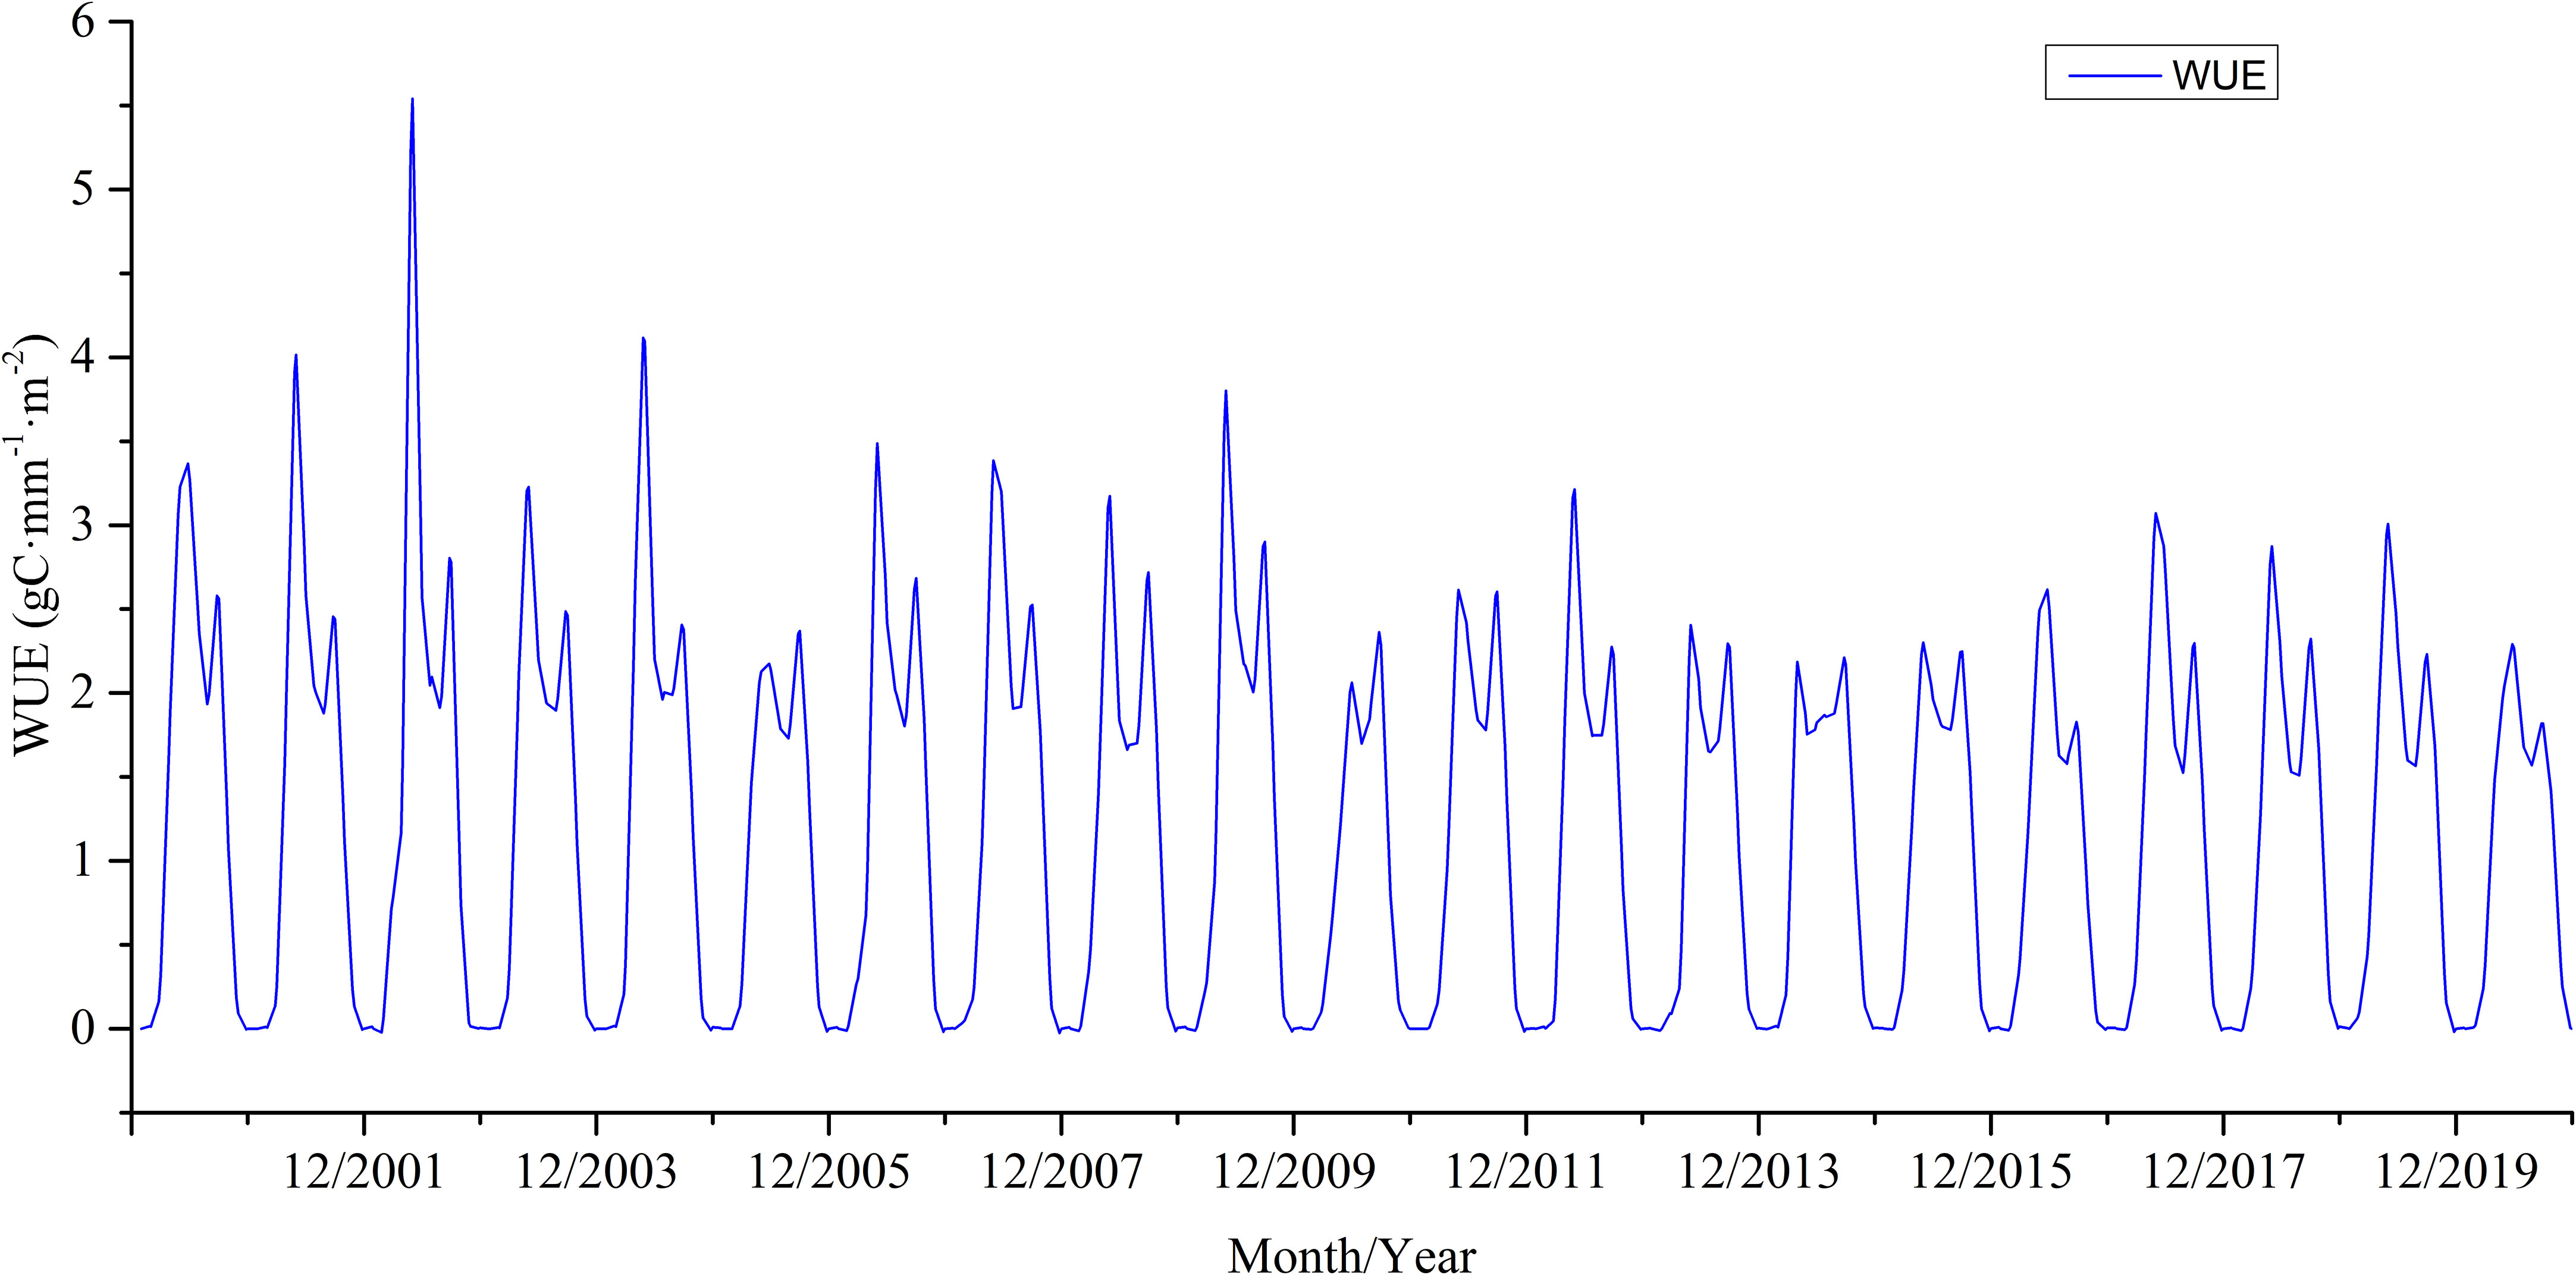
Figure 4 Monthly change of WUE from 2000 to 2020 in the WLRP.
3.3 The spatial distributions of trend in WUE
Figure 5 shows the slope of the annual WUE for each pixel from 2000 to 2020, revealing the spatial change of WUE in the WLRP. The change trend of WUE in the study area showed obvious spatial differentiation, with slope values ranging from −0.05 to 0.05 gC·mm−1·m−2·a−1. The areas of increasing and decreasing trends of WUE accounted for 50.82% and 49.18% of the total, respectively (Figure 5A). However, the significance test of the WUE change trend showed that more than half of the total area (77.13%) showed no significant change. The extremely significant decrease and significant decrease areas accounted for 6.57% and 5.20% of the total, respectively, and were mainly distributed in the western region. The extremely significant increase and significant increase areas accounted for 5.85% and 5.26%, respectively, and were mainly distributed in the southern and central regions (Figure 5B).
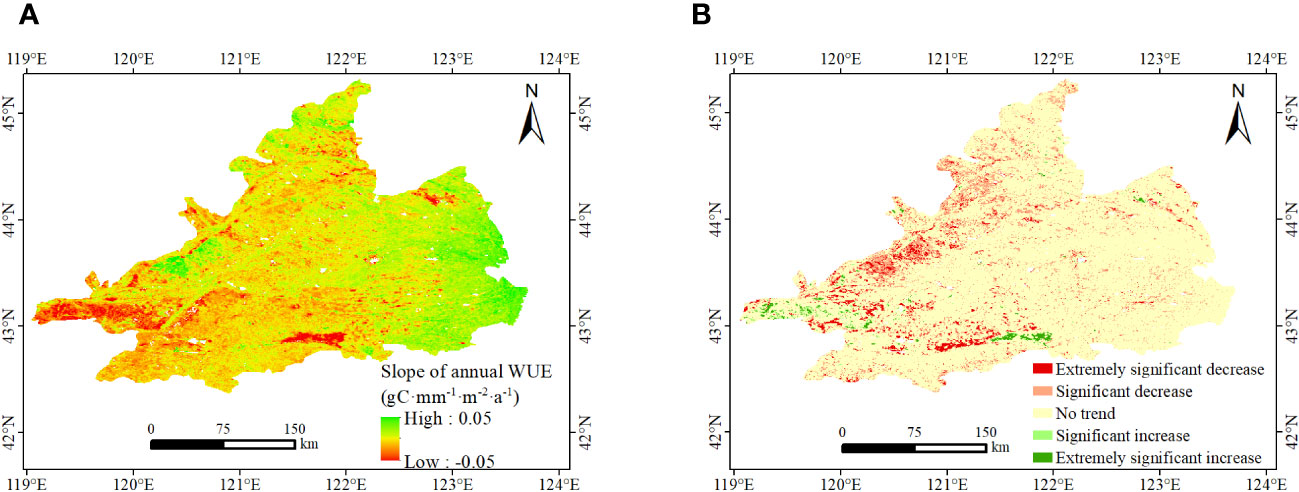
Figure 5 The spatial distributions of trend in WUE from 2000 to 2020 in the WLRP. Slope of annual WUE (A), and significant changes in WUE (B).
Figure 6 shows the proportions of different types of WUE change trends for the different land-use types. Areas where WUE showed no trend accounted for the largest proportion of the total area in all land-use types: forest (84.39%), grassland (81.23%), wetland (78.37%), shrubland (74.86%), cropland (74.24%), and bareland (70.35%). The proportions of areas that showed decreasing trends (including both extremely significant decrease and significant decrease) were in the following order: bareland (18.96%) > cropland (16.01%) > forest (11.13%) > shrubland (8.69%) > grassland (6.75%) > wetland (3.85%). The proportions of areas that showed an increasing trend (extremely significant increase and significant increase) were in the following order: wetland (17.77%) > shrubland (16.45%) > grassland (12.80%) > bareland (10.69%) > cropland (9.75%) > forest (4.48%).
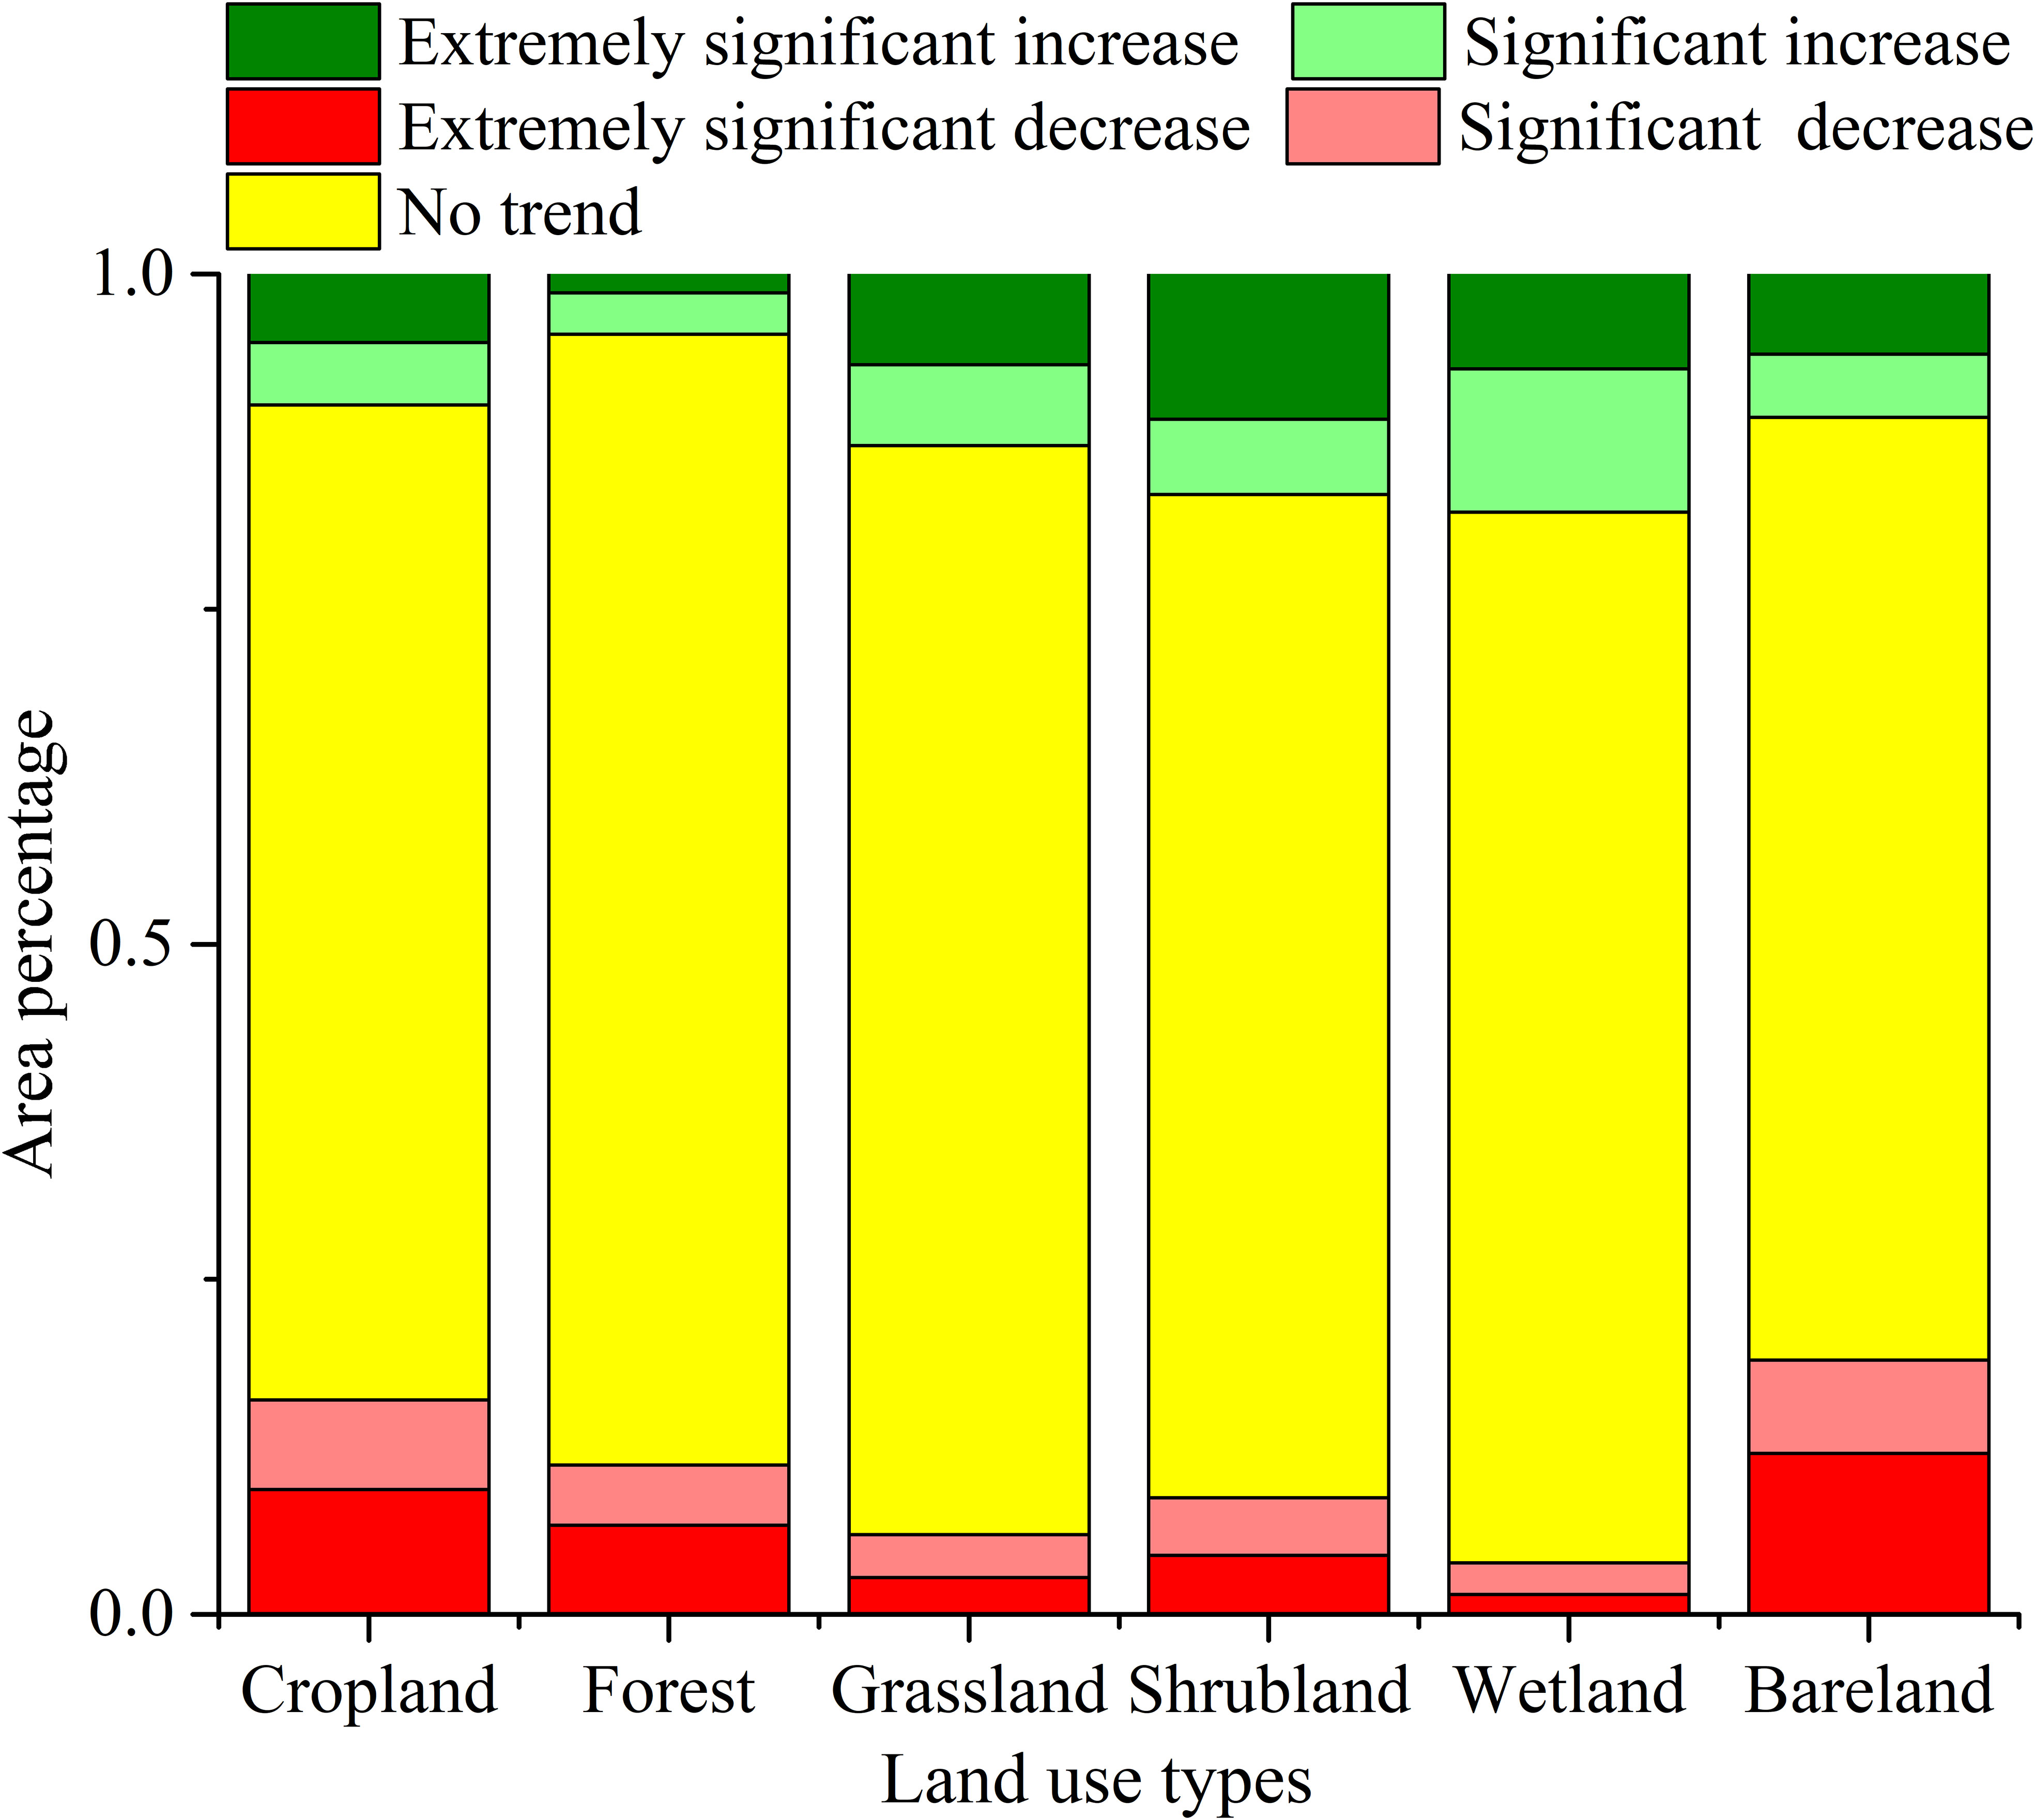
Figure 6 Proportions of different types of WUE change in different land-use types from 2000 to 2020 in the WLRP.
Figure 7 shows the degree of dispersion of WUE. The CV of the annual WUE ranged from 0.02 to 0.68. As there was low dispersion of WUE in most of the study area, the WUE in most areas was likely relatively stable. Areas with high CV values, exhibiting unstable WUE changes, were mainly located in the west, south, and northeast portions of the study area. The CV values of the different vegetation types were in the following order: bareland (0.120), shrubland (0.080), wetland (0.077), grassland (0.064), cropland (0.051), and forest (0.050), respectively.
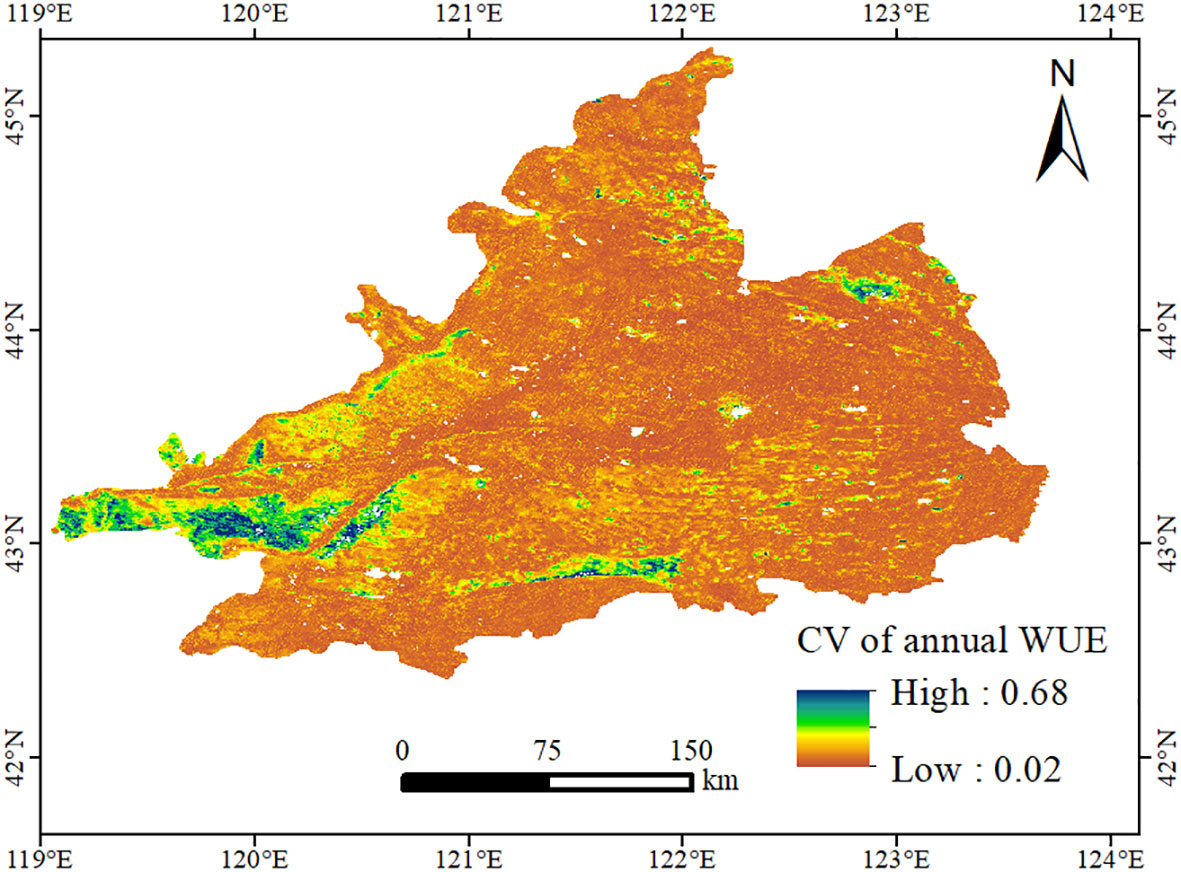
Figure 7 Spatial distribution of the CV of annual WUE from 2000 to 2020 in the WLRP.
3.4 Correlation analysis between WUE and meteorological factors
The correlations between meteorological factors and WUE were examined to determine the causes of the WUE trends. To analyze the impact of each meteorological factor on WUE, the coefficient of correlation was calculated between WUE and each meteorological factor. There were obvious regional differences in the correlation between WUE and precipitation, temperature, solar radiation, and VPD and their average correlation coefficients were −0.015, 0.124, 0.222, and −0.044, respectively (Figures 8A, C, E, G). Areas with positive and negative correlations between WUE and precipitation accounted for 46.20% and 53.80% of the WLRP. The areas with a positive correlation in the western region were larger than those in the eastern region. Areas with a positive correlation between WUE and temperature accounted for 71.60% of the WLRP which were mainly distributed in the northern and southern parts of the study area, whereas areas with a negative correlation accounted for 28.40% of the WLRP which were mainly distributed in the southwestern and central portions of the study area. Areas with a positive correlation between WUE and solar radiation accounted for 84.55% of the WLRP which were mainly distributed in the southeastern parts of the study area, whereas areas with a negative correlation accounted for 15.45% of the WLRP which were mainly distributed in the central and western regions of the study area. The areas with positive and negative correlations between WUE and VPD accounted for 45.65% and 54.35%, respectively. The regions with positive correlation were mainly distributed in the eastern and northern regions, while that with negative correlation were mainly distributed in the central and southwestern regions.
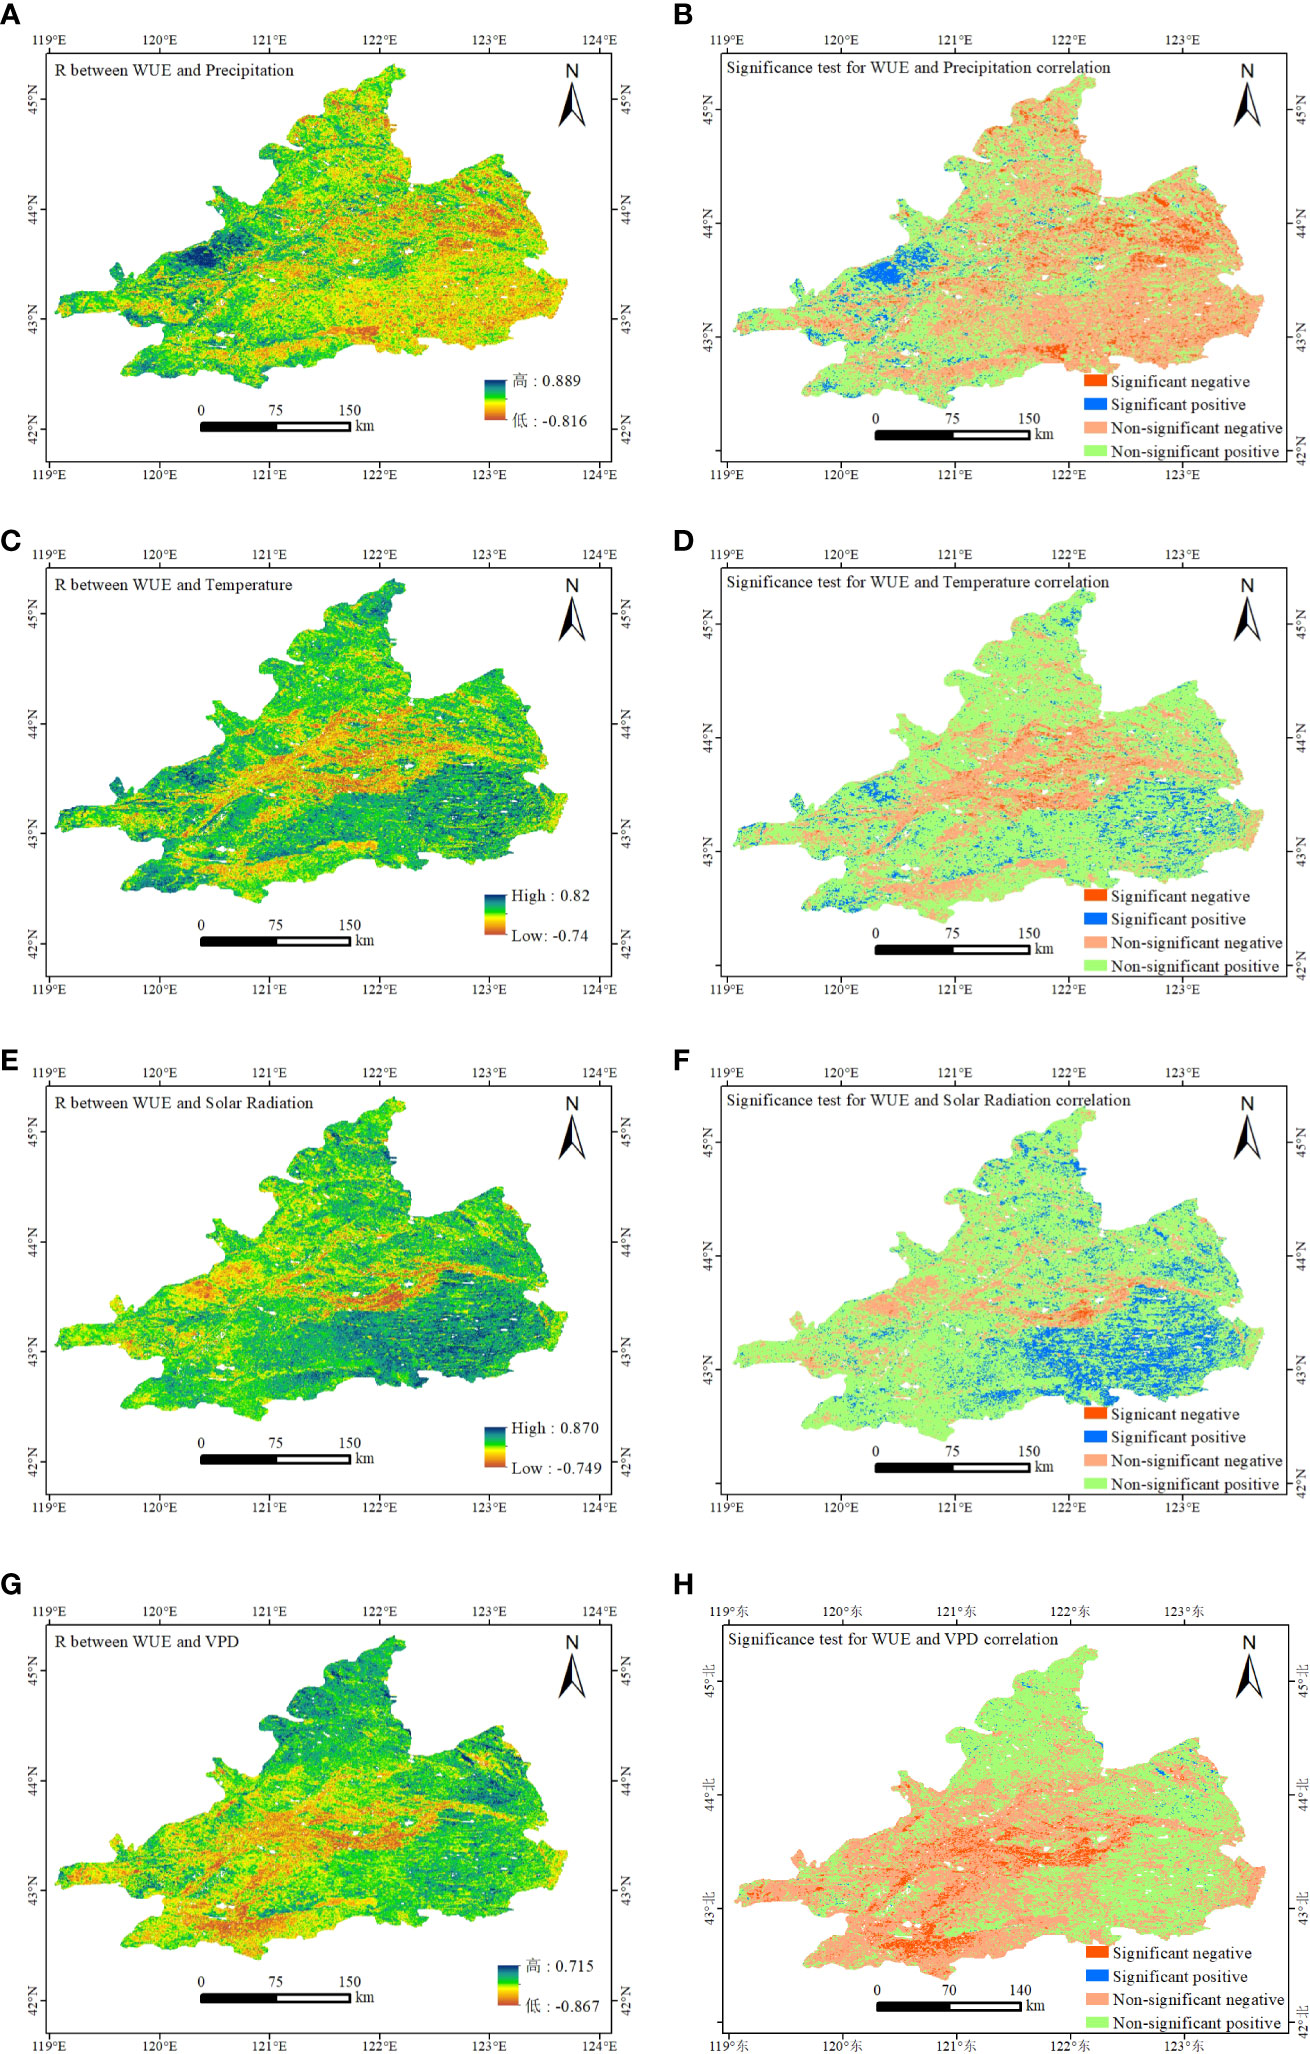
Figure 8 Spatial distributions of the correlation coefficients between WUE and (A) precipitation, (C) temperature, (E) solar radiation, and (G) VPD in the WLRP from 2000 to 2020; Significant test of correlation between WUE and (B) precipitation, (D) temperature, (F) solar radiation, and (H) VPD in the WLRP from 2000 to 2020.
Overall, WUE in the WLRP was positively correlated with temperature and solar radiation, while it was negatively correlated with precipitation and VPD. However, the areas that passed the significance test (P<0.05) only accounted for 4.70%, 7.33%, 16.12%, and 0.64% (Figures 8B, D, F, H), which indicated that the change in WUE in the WLRP was not determined by a single indicator and was influenced by multiple indicators. In addition to meteorological factors, human activities need to be considered.
3.5 Trends of climate change on WUE change
The value of the predicted WUE could reflect the influence of climate change on WUE. The slope of the predicted WUE ranged from -0.03 and 0.03 gC·mm−1·m−2·a−1, with a regional average of 0.0008 gC·mm−1·m−2·a−1 (Figure 9A). The proportion of areas where meteorological factors have a positive impact on WUE was 60.27%, and these areas were mainly distributed in the western regions, indicating that climate change had a positive impact on WUE in this region. The proportion of areas where meteorological factors have a negative impact on WUE was 39.73%, and these areas were mainly distributed in the central and southern regions, indicating that climate change had a negative impact on WUE in this region. Among them, the regions with significant positive (P<0.05) and significant negative effects (P<0.05) accounted for 22.82% and 11.76%, respectively (Figure 9B).
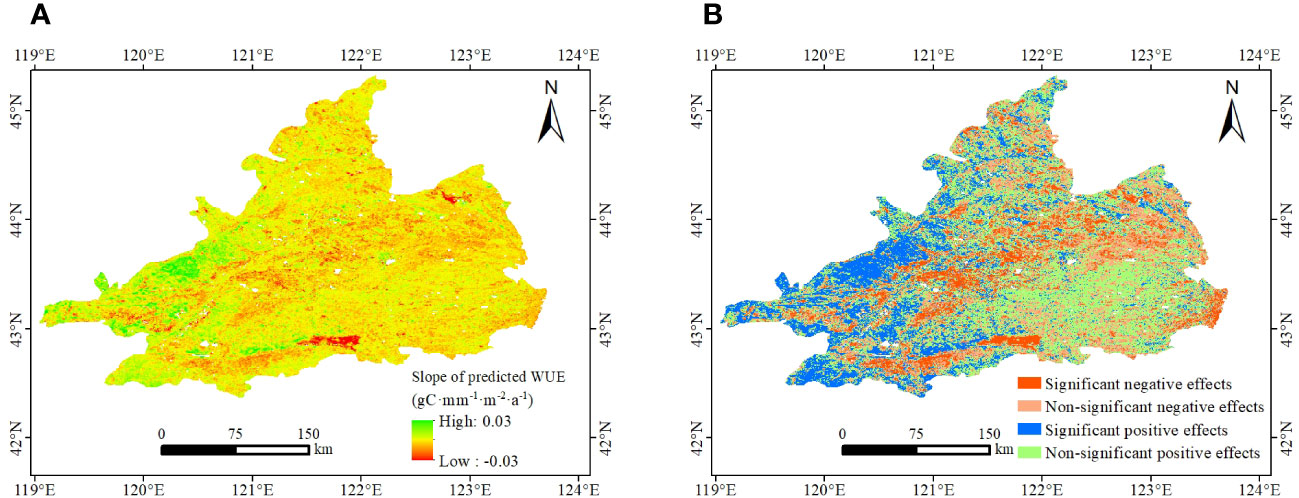
Figure 9 The spatial distributions of trend in predicted WUE from 2000 to 2020 in the WLRP. Slope of predicted WUE (A), and significance test in predicated WUE (B).
3.6 Trend of human activities on WUE change
The value of residual WUE could reflect the influence of human activities on WUE. The slope of the predicted WUE ranged from −0.02 and 0.02 gC·mm−1·m−2·a−1, with a regional average of −0.0007gC·mm−1·m−2·a−1 (Figure 10A). The proportion of areas where human activities have a positive impact on WUE was 38.07%, and these areas were mainly distributed in the southeastern and northwestern regions, indicating that human activities had a positive impact on WUE in this region. The proportion of areas where human activities have a negative impact on WUE was 61.93%, and these areas were mainly distributed in the central and southern regions, indicating that human activities had a negative impact on WUE in this region. Among them, the regions with significant positive (P<0.05) and significant negative effects (P<0.05) accounted for 0.83% and 2.58%, respectively (Figure 10B).
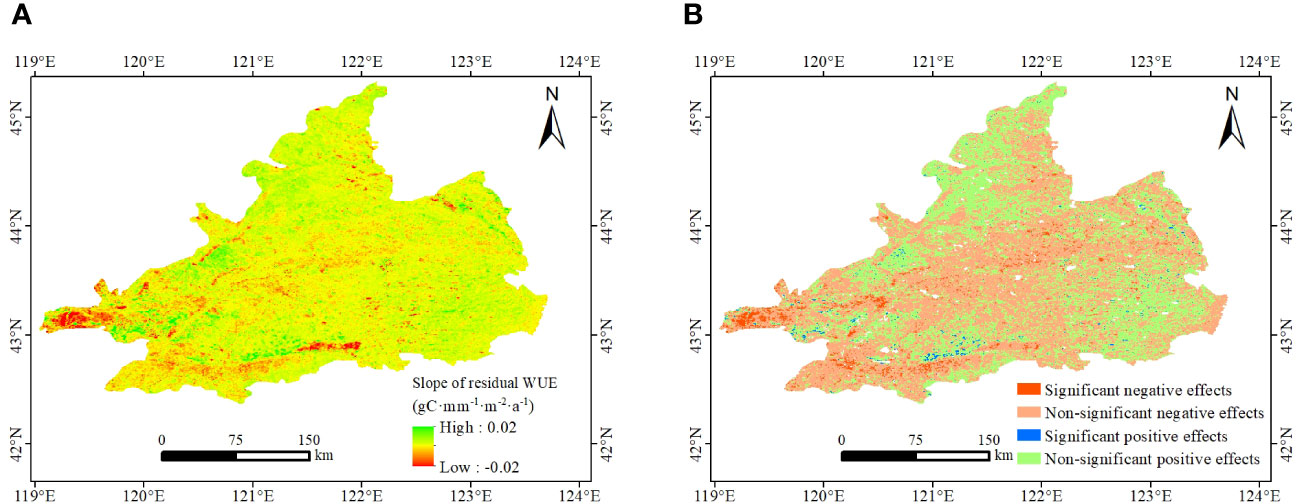
Figure 10 The spatial distributions of trend in residual WUE from 2000 to 2020 in the WLRP. Slope of residual WUE (A), and significance test in residual WUE (B).
3.7 Comprehensive analysis of WUE change
The contribution rate of climate change and human activities to regional WUE from 2000 to 2020 in the WLRP could be obtained by determining the criteria for driving factors and calculating the contribution rate (Supplementary Table 1). Overall, driven by both human activities and climate change, the area where the WUE has improved accounted for 50.82%, with an average contribution rate of 72.4% for climate change and 27.6% for human activities (Figures 11A, B). The combined effect of human activities and climate change could also have a negative impact on WUE. The area where WUE decreased driven by both factors accounted for approximately 49.18% of the total area of the region, with an average contribution of 39.9% for climate change and 60.1% for human activities (Figures 11C, D). Overall, the main contribution of WUE improvement was climate change, while the decrease in WUE was mainly due to human activities.
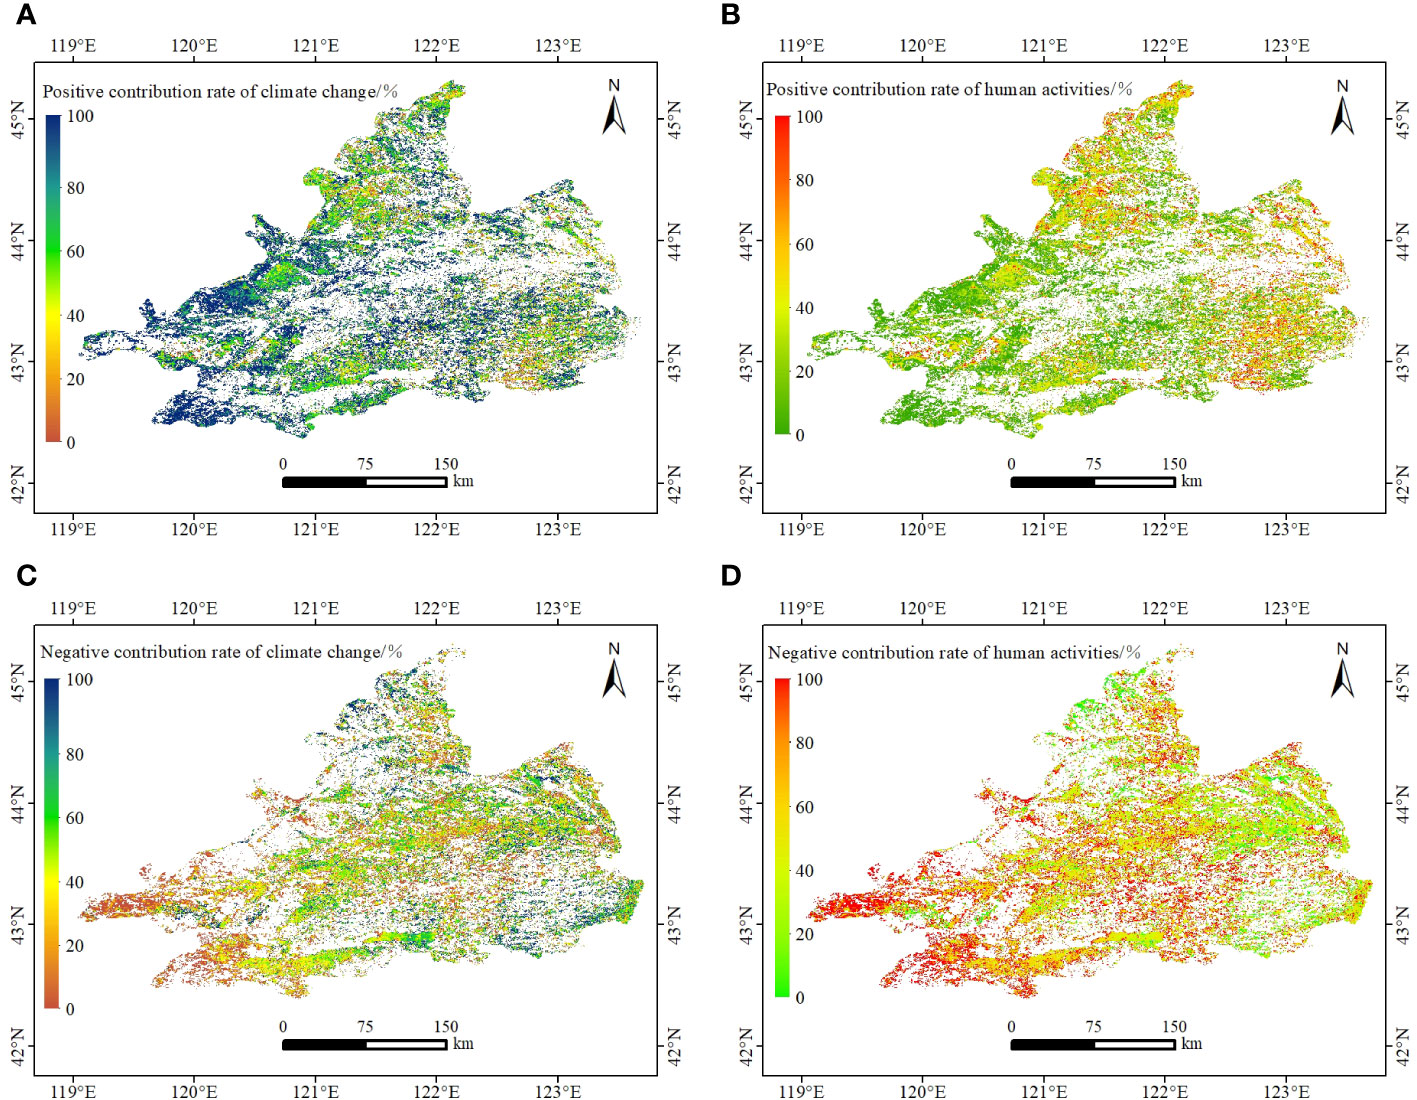
Figure 11 Spatial distribution of positive (A, B) and negative (C, D) contributions of climate change and human activities to WUE in the WLRP from 2000 to 2020.
To further explore the driving factors affecting WUE, human activity indicators such as population density (PD), the proportion of impervious surface area (IS), and nighttime light (NTL) were selected and were combined with meteorological factors such as precipitation (PRE), temperature (TEM), vapor pressure deficit (VPD), and solar radiation(RAD), the grey correlation model was used to identify the main control factors on WUE changes (Table 1). The results showed that for the seven evaluation factors in this study, the top three factors in terms of correlation degree were RAD, PD, and VPD, in which RAD had the highest correlation degree (0.939), indicating that WUE changes were considerably affected by RAD. The impact of human activities on WUE cannot be ignored, especially that of PD, which had a correlation degree of 0.93.
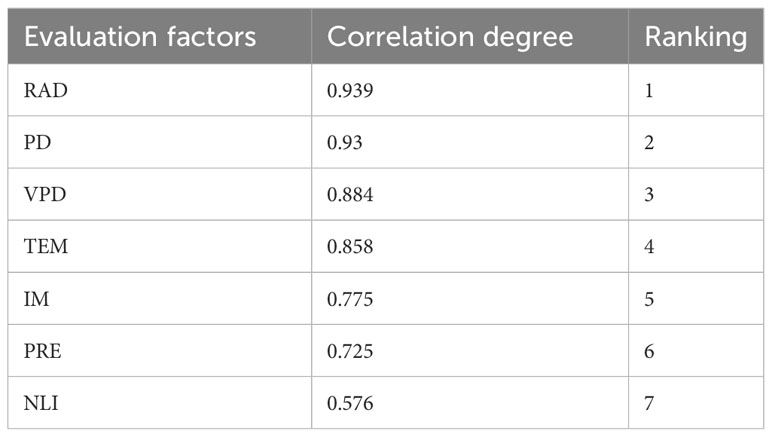
Table 1 The grey correlation result.
4 Discussion
4.1 Spatial and temporal distribution of WUE
From 2000–2020, the annual mean WUE of the WLRP ranged from 0.458 to 2.027 gC·mm−1·m−2, and the regional average was 1.31. This result is consistent with the result of Luo et al. (2022), who reported an annual mean WUE in Inner Mongolia of 1.39 gC·mm−1·m−2, with a range of 0–3.03 gC·mm−1·m−2 and an increasing trend. There were different trends of regional WUE during 2001-2010 and 2010-2020 in WLRP, which is directly related to the sharp decrease in WUE in 2010. In 2010, the decrease in solar radiation led to a decrease in vegetation photosynthesis and carbon sequestration capacity, resulting in lower levels of GPP, while an increase in precipitation resulted in higher levels of ET, resulting in a drastic decrease in WUE values. In previous studies, although some regions also showed a downward trend in WUE from 2000 to 2010 (Zhang et al., 2016), most regions showed an overall upward trend in WUE during the study period and did not show a significant segmented trend (Zhao et al., 2019; Luo et al., 2022). This is related to the differences in geographical location, meteorological conditions, and human activity interference in the study area.
WUE reflects the trade-off between GPP and ET in an ecosystem, that is, the relationship between organic carbon and water consumption (Shao et al., 2020). There was no significant change trend in most areas of the WLRP from 2000 to 2020. The main reason for this result is that the change trends of GPP and ET in the study area were consistent (Figures 12A, B), and the linear correlation coefficient of these variables was as high as 0.94 (Figure 12C), indicating that the carbon-fixing ability in this area is directly proportional to water consumption and leads to the insignificant change trend of WUE.
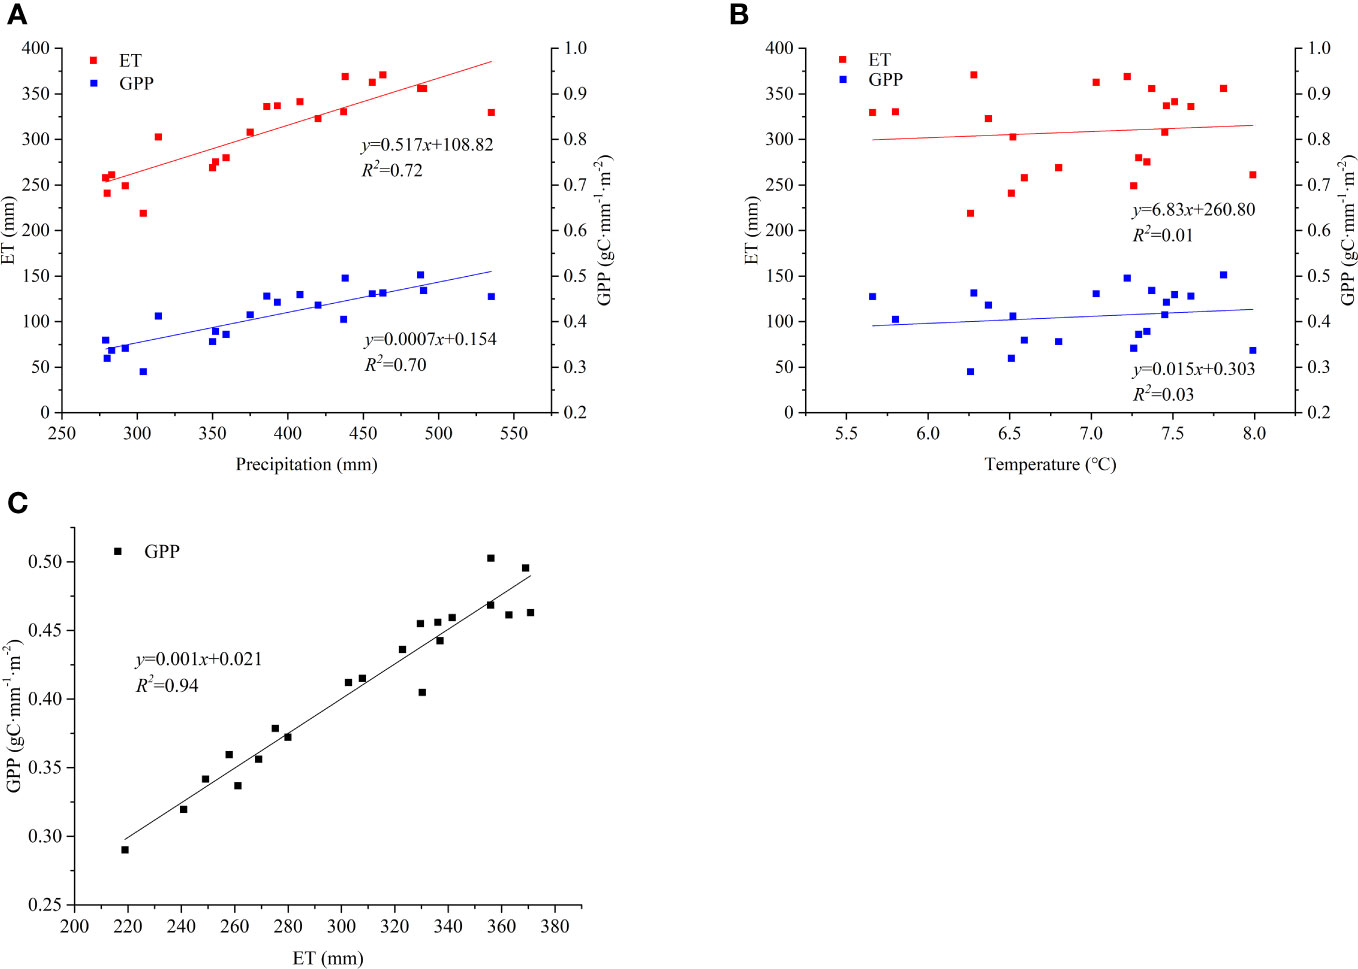
Figure 12 Change trends of ET and GPP with precipitation (A), change trends of ET and GPP with temperature (B), and correlation between ET and GPP (C) on an annual scale.
The average WUE values of the different vegetation types ranked in the order of forest, cropland, grassland, wetland, shrubland, and bareland, respectively, were in general agreement with the results of previous studies (Feng et al., 2018; Chang et al., 2021). Although the WUE values followed the same order rule, the same land-use type showed different WUE values in different regions, which is consistent with the conclusions of other researchers (Liu et al., 2015; Muhammad et al., 2018). This is probably attributable to physiological, zonal, and climatic differences (Tang et al., 2014; Yao et al., 2014; Zhang et al., 2022). Wang et al. (2020) also reported water and heat conditions and their uneven distribution as the main reasons for zonal differences in WUE, which are not solely determined by the physiological characteristics of plants.
Forest vegetation can obtain deep soil water and nutrients through developed roots to support plant growth (Chang et al., 2021), and croplands often receive sufficient irrigation water for plant growth(Zheng et al., 2019). Both forest and cropland have relatively high vegetation coverage, which can reduce soil water evaporation and increase the efficiency with which water is converted into organic matter, which is produced more abundantly by forests than cropland (Xia et al., 2015). Therefore, the WUE values of cropland and forest were high, and those of forest were the highest. The GPP values of bareland and shrubland, with little vegetation, are low, and evapotranspiration depends mainly on soil water evaporation. Therefore, bareland and shrubland had the smallest values of WUE. The GPP of shrubland may also be underestimated (Zhang et al., 2012; Zhang et al., 2015; Chang et al., 2021). In grassland, the root system is short, plants depend primarily on precipitation and shallow soil water, and evaporation of soil water is high, making full use of the available water difficult.
In areas with a significant downward trend in WUE, the proportion of bareland, cropland, and forest land is relatively large. This is because better hydrothermal conditions can lead to an increase in ET, resulting in a significant decrease of WUE in bareland. Cropland and forest in the area mainly depend irrigation, resulting in a more stable interannual variation in GPP (Tian et al., 2011). However, unreasonable irrigation may promote higher ET, which may lead to a decreasing trend of WUE in cropland and forest.
4.2 Effects of climate change and human activities on WUE change
In addition to being regulated by the internal vegetation of the system, WUE is also affected by external environmental conditions. Previous studies have shown that precipitation and temperature have either promotional or inhibitory effects on WUE (Zhang et al., 2012; Qiu et al., 2015; Xue et al., 2015; Sun et al., 2016; Wei et al., 2016). Generally, a moderate increase in precipitation is favorable for WUE, but excessive precipitation is unfavorable (Tian et al., 2010; Qiu et al., 2015; Wei et al., 2016; Li et al., 2017). Qiu et al. (2015) and Xue et al. (2015) found a nonlinear relationship between WUE and precipitation and other researchers have reported similar findings (Hu et al., 2010; Mu et al., 2014; Li et al., 2015). Yin et al. (2022) and Shao et al. (2020) found that WUE was negatively correlated with temperature. However, some studies also found that there was a critical value for the impact of temperature on WUE: temperatures that are too high or too low are unfavorable for vegetation WUE (Xiao, 2001; Zhou et al., 2014; Qiu et al., 2015; Xue et al., 2015; Wei et al., 2016). Solar radiation is one of the important factors in plant photosynthesis and also has a significant impact on plant WUE. Previous studies have found a high correlation between solar radiation and WUE (Xu, 2008). In areas with solar radiation below 242.2 W/m2, WUE showed an increasing trend with an increase in solar radiation, and after exceeding the critical value, WUE showed a decreasing trend (Xue et al., 2015). In addition, most studies have found that the increase in VPD has a negative impact on WUE (Wang et al., 2022; Zheng and Zhang, 2022; Li F. et al., 2023).
WUE was positively correlated with temperature and solar radiation in most of the study area. The increase in temperature and solar radiation promoted photosynthesis, resulting in higher production of dry matter and an increase in the GPP (Li et al., 2002). Although the increase in temperature and solar radiation can also lead to an increase in ET, previous studies have found that the impact on GPP is more significant than that on ET (Wang et al., 2020). WUE was negatively correlated with precipitation and vapor pressure deficit in most of the study area.
In arid and semi-arid areas, available water is the most important factor in controlling vegetation function, and its reduction can increase the physiological stress and vulnerability of plants. In arid areas, vegetation chooses more conservative water use methods when the precipitation decreases and adapts to drought stress by increasing WUE (Chen et al., 2003). The main reason for the negative correlation between VPD and WUE was the interannual variation of VPD, which has a limiting effect on the terrestrial primary productivity (GPP) (He B. et al., 2022). This is because an increase in VPD may cause stomatal closure to avoid excessive water loss in plants due to high air evaporation demand. However, this can also lead to a negative carbon balance, causing plants to consume a large amount of carbohydrate reserves and cause carbohydrate starvation (Yuan et al., 2019). This is consistent with the conclusion of Li F. et al. (2023), who showed that an increase in VPD leads to WUE stagnation.
In addition, the impact of human activities on WUE cannot be ignored, and population density has the highest correlation with WUE. The main reason was that in the past two decades, with the increase in population and the implementation of a series of ecological engineering practices, the area of cropland and forest in the region has increased. Due to their high WUE, the overall WUE has increased. Although the WUE values of forest and cropland were high, this result does not mean that a large amount of land can be reclaimed for artificial tree planting or expansion of cultivated land area. The high WUE was largely attributable to the relatively abundant water resource conditions caused by artificial irrigation, and the local irrigation water is mainly sourced from groundwater; thus, excessive exploitation of this water will lead to the deterioration of the ecological environment.
4.3 Limitations and uncertainties
4.3.1 Data accuracy
This study analyzed the impact of meteorological factors on WUE based on remote sensing data. The Kriging interpolation method was used for the meteorological data. However, the volume and accuracy of the data were limited, and the difference in interpolation methods may have affected the results. Previous studies have shown that ET and GPP data from MODIS play a good performance (Turner et al., 2006; Velpuri et al., 2013), which were widely used in WUE calculations (Huang et al., 2017; Li X. Y. et al., 2023). But the use of remote sensing data, especially that from the same sensor inevitably introduces some potential uncertainties such as data self-correlated problem. Besides MODIS data, more and more remote sensing data products were used in WUE calculated such as GLASS data (Luo et al., 2023), Sentinel-2 data (Elfarkh et al., 2023) and PML-V2 product (He S. Y. et al., 2022; Ji et al., 2023). Different data sources may result in differences in evaluation results due to differences in resolution and model. Therefore, further analysis is needed to obtain more reliable conclusions regarding the consistency and uncertainty generated by different data sources, combining multi-source data.
4.3.2 Analytical methods
Only linear methods such as linear regression analysis and residual analysis were used to analyze the relationship between WUE and factors such as temperature, precipitation, VPD, and solar radiation, without considering the nonlinear relationship between meteorological factors and WUE. In addition, this paper demonstrated the impact of human activities on WUE, but its driving mechanism needs to be further analyzed. For example, human activities affect biological characteristics such as Leaf area index (LAI) and NDVI by modifying surface features such as afforestation, urban expansion, cropland reclamation, or changing irrigation methods, thereby affecting WUE.
5 Conclusions
This study explored the changes in WUE in the WLRP from 2001 to 2020 using linear regression and the CV method based on the MODIS GPP and ET datasets. The relationships between WUE and climate change and human activities and the driving mechanism of WUE changes were revealed through correlation analyses, residual analysis, and the grey correlation model. From 2001 to 2020, most areas of the WLRP (77.13%) were in a stable state without significant changes, whereas a small part of the WLRP (22.87%) changed significantly. WUE change is not entirely driven by climate change, and human activities have also played an important role. In areas where WUE increased, the average contribution rate of climate change was 72.4%, and that of human activities was 27.6%.
Data availability statement
Publicly available datasets were analyzed in this study. This data can be found here: http://cdc.cma.gov.cn, https://cds.climate.copernicus.eu/, https://hub.worldpop.org/, https://earthdata.nasa.gov/.
Author contributions
QL and YL conceptualized the study. MG and QL drafted the manuscript and were responsible for data preparation and analysis. NY, YW, and XL were responsible for verifying the results and reviewing the article. All authors reviewed the manuscript.
Funding
This research was supported by the National Natural Science Foundation of China (41702386) and Geological Survey Project of the China Geological Survey (DD20190506 and DD20221726).
Conflict of interest
The authors declare that this study was conducted in the absence of any commercial or financial relationships that could be considered potential conflicts of interest.
Publisher’s note
All claims expressed in this article are solely those of the authors and do not necessarily represent those of their affiliated organizations, or those of the publisher, the editors and the reviewers. Any product that may be evaluated in this article, or claim that may be made by its manufacturer, is not guaranteed or endorsed by the publisher.
Supplementary material
The Supplementary Material for this article can be found online at: https://www.frontiersin.org/articles/10.3389/fevo.2023.1176131/full#supplementary-material
References
Adams M. A., Turnbull T. L., Sprent J. I., Buchmann N. (2016). Legumes are different:leaf nitrogen,photosynthesis, and water use efficiency. J.Proc.Natl.Acad.Sci 113 (15), 4098–4103. doi: 10.1073/pnas.1523936113
Ai Z. P., Wang Q. X., Yang Y. H., Manevski K., Yi S., Zhao X. (2020). Variation of gross primary production, evapotranspiration and water use efficiency for global croplands. J. Agric. For. Meteorology. 287, 107935. doi: 10.1016/j.agrformet.2020.107935
Allen R. G., Pereira L. S., Raes D., Smith M. (1998). Crop evapotranspiration—guidelines for computing crop water requirements (Rome, Italy: FAO).
An X. (2022). Responses of Water Use Efficiency to climate change in evapotranspiration and transpiration ecosystems. J. Ecol. Indic. 141, 109157. doi: 10.1016/j.ecolind.2022.109157
Aruna (2020). Trade-off and synergy analyses and sustainable management of ecosystem services in West Liao River Plain (Xi’an: Northwest University).
Bhattacharya A. (2019). Changing Climate and Resource Use Efficiency in Plants (London: Academic Press), 15. doi: 10.1016/B978-0-12-816209-5.00001-5
Briggs L. J., Shantz H. L. (1913). “The water requirement of plants,” in Bureau of Plant Industry Bulletin (Washington, DC: US Department of Agriculture), 282–285.
Chang X. G., Wang Z. H., Wei F. ,. Y., Xiao P. Q., Shen Z. Z., Lv X. Z., et al. (2021). Determining the contributions of vegetation and climate change to ecosystem WUE variation over the last two decades on the Loess Plateau. J. Forests 12 (11), 1442. doi: 10.3390/f12111442
Chen L., Chen S. J., Cai X. B., Liu H. (2017). Analysis on spatial-temporal variation characteristics of vegetation cover in the Three Gorges Reservoir Area based on time series NDVI data. J. J. Cent. China Normal Univ. (Natural Sciences). 51 (3), 407–415. doi: 10.19603/j.cnki.1000-1190.2017.03.021
Chen T., Yang M. X., Feng H. Y. (2003). Spatial distribution of stable carbon isotope compositions of plant leaves in the north of the Tibetan Plateau. J.Journal Glaciology Geocryology 25 (1), 83–87. doi: 10.1023/A:1022289509702
Elfarkh J., Johansen K., Hajj M. E., Almashharawi S. K., McCabe M. F. (2023). Evapotranspiration, gross primary productivity and water use efficiency over a high-density olive orchard using ground and satellite based data. J.Agricultural Water Manage. 287, 108423. doi: 10.1016/j.agwat.2023.108423
Evans J., Geerken R. (2004). Discrimination between climate and human induced dryland degradation. J.Journal Arid Environments. 57 (4), 535–554. doi: 10.1016/S0140-1963(03)00121-6
Feng C. Y., Wang H. S., Sun J. X. (2018). Temporal changes of vegetation water use efficiency and its influencing factors in Northern China. J. Chin. J. Plant Ecol. 42 (04), 453–465. doi: 10.17521/cjpe.2017.0214
Feng Z. M., Yang L., Yang Y. Z. (2014). Temporal and spatial distribution patterns of grain crops in the west liaohe river basin. J. J. Resour. Ecol. 5 (3), 244–252.
Fu G., Zhang J., Shen Z., Shi P. L., He Y. T., Zhang X. Z. (2017). Validation of collection of 6 MODIS/Terra and MODIS/Aqua gross primary production in an alpine meadow of the Northern Tibetan Plateau. Int.J.Rem.Sens 38 (16), 4517–4534. doi: 10.1080/01431161.2017.1323283
Gadanakis Y., Bennett R., Park J., Areal F. J. (2015). Improving productivity and water use efficiency: A case study of farms in England. J.Agricultural Water Manage. 160, 22–32. doi: 10.1016/j.agwat.2015.06.020
Gang C. C., Wang Z. Q., Chen Y. Z., Yang Y., Li J. L., Cheng J. M., et al. (2016). Drought-induced dynamics of carbon and water use efficiency of global grasslands from 2000 to 2011. J. Ecol. Indic. 67, 788–797. doi: 10.1016/j.ecolind.2016.03.049
Gao Z. D., He J. S., Dong K. B., Li X. (2017). Trends in reference evapotranspiration and their causative factors in the West Liao River basin, China. J. Agric. For. Meteorology 232, 106–117. doi: 10.1016/j.agrformet.2016.08.006
Gao M. M., Liu Q., Wang Y., Li X. L., Shi P. (2022). Spatial and temporal variations in vegetation index and its impact factors in the West Liaohe Plain in Inner Mongolia. J. Hydrogeology Eng. Geology. 49 (1), 175–182. doi: 10.16030/j.cnki.issn.1000-3665.202108051
Gao W. D., Zheng C., Liu X. H., Lu Y. D., Chen Y. F., Wei Y., et al. (2022). NDVI-based vegetation dynamics and their responses to climate change and human activities from 1982 to 2020: A case study in the Mu Us Sandy Land, China. J. Ecol. Indic. 137, 108745. doi: 10.1016/j.ecolind.2022.108745
Hao X. M., Ma H. Y., Hua D., Qin J. X., Zhang Y. (2019). Response of ecosystem water use efficiency to climate change in the Tianshan Mountains, Central Asia. J.Environmental Monit. Assess. 191 (9). doi: 10.1007/s10661-019-7673-z
Hatfield J. L., Dold C. (2019). Water-use efficiency: advances and challenges in a changing climate.J. Front. Plant Science. 10, 1–14. doi: 10.3389/fpls.2019.00103
He B., Chen C., Lin S. (2022). Worldwide impacts of atmospheric vapor pressure deficit on the interannual variability of terrestrial carbon sinks. J. Natl. Sci. Review. 9 (04), 33–40. doi: 10.1093/nsr/nwab150
He S. Y., Zhang Y. Q., Ma N., Tian J., Kong D. D., Liu C. M., et al. (2022). A daily and 500m coupled evapotranspiration and gross primary production across China during 2000-2020. J.Earth Syst.Sci.Data 14, 5463–5488. doi: 10.5194/essd-14-5463-2022
Hu Z. M., Yu G. R., Fan J. W., Zhong H. P., Wang S. Q., Li S. G. (2010). Precipitation-use efficiency along a 4500-km grassland transect. J. Global Ecol. Biogeography 19 (6), 842–851. doi: 10.1111/j.1466-8238.2010.00564.x
Hu Z. M., Yu G. R., Fu Y. L., Sun X. M., L Y. N., Shi P. L., et al. (2008). Effects of vegetation control on ecosystem water use efficiency within and among four grassland ecosystems in China. J. Global Change Biol. 14 (7), 1609–1619. doi: 10.1111/j.1365-2486.2008.01582.x
Huang L., He B., Han L., Liu J. J., Wang H. Y., Chen Z. Y. (2017). A global examination of the response of ecosystem water-use efficiency to drought based on MODIS data. J.Science Total Environ. 601–602, 1097–1107. doi: 10.1016/j.scitotenv.2017.05.084
Huang F., Zhang H. J., Wang P. (2013). Assessment of vegetation change and its causes in the West Liaohe River Basin of China using SPOT-VGT image. J.Earth Resour. Environ. Remote sensing/GIS applications., 889312, 1–11. doi: 10.1117/12.2028227
IPCC (2021). Climate change 2021: The Physical Science Basis (Cambridge: Cambridge University Press).
Jassal R. S., Black T. A., Spittlehouse D. L., Brümmer C., Nesic Z. (2009). Evapotranspiration and water use efficiency in different-aged Pacific Northwest Douglas-fir stands. J.Agric For Meteorol .149, 1168–1178. doi: 10.1016/j.agrformet.2009.02.004
Ji Y. Y., Zeng S. D., Tang Q. Q., Yan L. Y., Wu S. J., Fan Y. C., et al. (2023). Spatiotemporal variations and driving factors of China’s ecosystem water use efficiency. J.Ecological Indic. 148, 110077. doi: 10.1016/j.ecolind.2023.110077
Jia B. H., Luo X., Wang L. H., Lai X. (2023). Changes in water use efficiency caused by climate change, CO2 fertilization, and land use changes on the tibetan plateau. J. Adv. Atmospheric Sci. 40 (01), 144–154. doi: 10.1007/s00376-022-2172-5
Klein T., Shpringer I., Fikler B., Elbaz G., Cohen S., Yakir D. (2013). Relationships between stomatal regulation, wateruse, and water-use efficiency of two coexisting key Mediterranean tree species. J.Forest Ecol. Manage. 302, 34–42. doi: 10.1016/j.foreco.2013.03.044
Li Z. X., Feng Q., Liu W., Wang T. T., Gao Y., Wang Y. M., et al. (2014). Spatial and temporal trend of potential evapotranspiration and related driving forces in Southwestern China, during 1961–2009. J.Quaternary Int. 336 (26), 127–144. doi: 10.1016/j.quaint.2013.12.045
Li H. D., Guan D. X., Yuan F. H., Wang A. Z., Jin C. J., Wu J. B., et al. (2015). Water use efficiency and its influential factor over Horqin Meadow. J.Acta Ecologica Sinica. 35 (02), 478–488. doi: 10.5846/stxb201303310566
Li F. S., Kang S. Z., Zhang F. C. (2002). Effects of elevated atmospheric CO2 concentration and temperature on crop physiology and ecology. J. J. Appl. Ecology. 09, 1169–1173.
Li F., Xiao J. F., Chen J. Q., Ballantyne A., Jin K. (2023). Global water use efficiency saturation due to increased vapor pressure deficit. J. Sci. (New York N.Y.). 381 (6658), 672–677. doi: 10.1126/science.adf5041
Li X. J., Zhang F. P., Wang H. W., Lei S. J., Gao Z. (2017). Analysis of the spatio-temporal characteristics of water use efficiency of vegetation and its relationship with climate in the Heihe River Basin. J. J. Desert Res. 37 (4), 733–741.
Li X. Y., Zou L., Xia J., Wang F. Y., Li H. W. (2023). Identifying the Responses of Vegetation Gross Primary Productivity and Water Use Efficiency to Climate Change under Different Aridity Gradients across China. J. Remote Sens. 15 (6). doi: 10.3390/rs15061563
Liu S. F., Dang Y. G., Fang Z. G. (2017). Gray system theory and its application (Beijing: Science Press).
Liu Y., Xiao J., Ju W., Zhou Y., Wang S., Wu X. (2015). Water use efficiency of China’s terrestrial ecosystems and responses to drought. Sci. Rep. 5, 13799. doi: 10.1038/srep13799
Luo H., Bie X. J., Yi G. H., Zhou X. B., Zhang T. B., Li J. J., et al. (2022). Dominant impacting factors on water-use efficiency variation in inner Mongolia from 2001 to 2018: vegetation or climate? J. Remote Sens. 14 (18), 4541. doi: 10.3390/rs14184541
Luo X., Wang Y. F., Li Y. G. (2023). Responses of ecosystem water use efficiency to drought in the Lancang-Mekong River Basin. J.Fron.Ecol.Evol 11. doi: 10.3389/fevo.2023.1203725
Mafi-Gholami D., Zenner E. K., Jaafari A., Ward R. D. (2019). Modeling multi-decadal mangrove leaf area index in response to drought along the semi-arid southern coasts of Iran. J. Total Environ. 656, 1326–1336. doi: 10.1016/j.scitotenv.2018.11.462
Miao L., Lu Q., Liu G. L. (2023). Spatiotemporal evolution characteristics of NDVI of different vegetation types and its response to climate factors on the Qinghai-Tibet Plateau from 1999 to 2019. J. Res. Soil Water Conserv. 30 (1), 97–105. doi: 10.13869/j.cnki.rswc.2023.01.027
Milich L., Weiss E. (2000). GAC NDVI interannual coefficient of variation (CoV) images: ground truth sampling of the Sahel along north-south transects. J. Remote Sens. 21 (2), 235–260. doi: 10.1080/014311600210812
Mu Q., Zhao M., Running S. W. (2011). Improvements to a MODIS global terrestrial evapotranspiration algorithm. J. Remote Sens. Environ. 115, 1781–1800. doi: 10.1016/j.rse.2011.02.019
Mu S. J., Zhou K. X., Qi Y., Chen Y. Z., Fang Y., Zhu C. (2014). Spatio-temporal patterns of precipitation-use efficiency of vegetation and their controlling factors in Inner Mongolia. J. Chin. J. Plant Ecology. 38 (01), 1–16. doi: 10.3724/SP.J.1258.2014.00001
Muhammad K., Ahmed E. N., Lars R., Karl S. (2018). Spatio-temporal variations in climate, primary productivity and efficiency of water and carbon use of the land cover types in Sudan and Ethiopia. Sci. Total Environ. 624, 790–806. doi: 10.1016/j.scitotenv.2017.12.090
Niu S. L., Xing X. R., Zhang Z., Xia J. Y., Zhou X. H., Song B., et al. (2011). Water-use efficiency in response to climate change: from leaf to ecosystem in a temperate steppe. J. Global Change Biol. 17 (2), 1073–1082. doi: 10.1111/j.1365-2486.2010.02280.x
Qiu K. B., Cheng J. F., B.Q J. (2015). Spatio-temporal distribution of cropland water use efficiency and influential factors in middle and east of China. J. Trans. Chin. Soc. Agric. Engineering. 31 (11), 103–109. doi: 10.11975/j.issn.1002-6819.2015.11.015
Riha S. J., Melkonian J. (2023). Limited impact of vapor pressure deficit on rainfed maize evapotranspiration, CO2 flux, and canopy temperature. J. Agron. J. 115 (2), 844–858. doi: 10.1002/agj2.21254
Shao H., Zhang Y. D., Gu F. X., Miao N., Liu S. R. (2020). Changes of water use efficiency in the Yangtze River Economic Zone and its relationship with temperature and precipitation. J. Acta Ecologica Sinica. 40 (16), 5579–5590. doi: 10.5846/stxb201901020010
Stavroula D., Konstantinos G. ,. N. (2021). Annual actual evapotranspiration estimation via GIS models of three empirical methods employing remotely sensed data for the peloponnese, Greece, and comparison with annual MODIS ET and pan evaporation measurements. J.ISPRS Int. J. Geo-Information 7 (8), 522. doi: 10.3390/ijgi10080522
Sun Y., Piao S. L., Huang M. T., Ciais P., Zeng Z. Z., Cheng L., et al. (2016). Global patterns and climate drivers of water-use efficiency in terrestrial ecosystems deduced from satellite-based datasets and carbon cycle models. J.Global Ecol. Biogeography 25 (3), 311–323. doi: 10.1111/geb.12411
Tang X., Li H., Desai A. R., Nagy Z., Luo J., Kolb T. E., et al. (2014). How is water-use efficiency of terrestrial ecosystems distributed and changing on Earth? J.Sci.Rep. 4, 7483. doi: 10.1038/srep07483
Tian H. Q., Chen G. S., Liu M. L., Zhang C., Sun G., Lu C. Q., et al. (2010). Model estimates of net primary productivity, evapotranspiration, and water use efficiency in the terrestrial ecosystems of the southern United States during 1895–2007. J. For. Ecol. Manage. 259 (7), 1311–1327. doi: 10.1016/j.foreco.2009.10.009
Tian H., Lu C., Chen G., Xu X., Liu M., Ren W., et al. (2011). Climate and land use controls over terrestrial water use efficiency in monsoon Asia. J. Ecohydrology 4, 322–340. doi: 10.1002/eco.216
Tian F., Zhang Y., Lu S. H. (2020). Spatial-temporal dynamics of cropland ecosystem water-use efficiency and the responses to agricultural water management in the Shiyang River Basin, northwestern China. J.Agricultural Water Management. 237, 106176. doi: 10.1016/j.agwat.2020.106176
Tucker C. J., Newcomb W. W., Los S. O., Prince S. D. (1991). Mean and inter-year variation of growing-season normalized difference vegetation index for the Sahel 1981-1989. J.Remote Sens. 12 (6), 1133–1135. doi: 10.1080/01431169108929717
Turner D. P., Ritts W. D., Cohen W. B., Gower S. T., Running S. W., Zhao M., et al. (2006). Evaluation of MODIS NPP and GPP products across multiple biomes.J. Remote Sens. Env. 102 (3–4), 282–292. doi: 10.1016/j.rse.2006.02.017
Velpuri N. M., Senay G. B., Singh R. K., Bohms S., Verdin J. P. (2013). A comprehensive evaluation of two MODIS evapotranspiration products over the conterminous United States: using point and gridded FLUXNET and water balance ET. J.Remote Sens. Env. 139, 35–49. doi: 10.1016/j.rse.2013.07.013
Wang C. Y., Li S. E., Wu M. S., Zhang W. X., He H. X., Yang D. N., et al. (2022). Water use efficiency control for a maize field under mulched drip irrigation. J. Sci. total Environ. 857 (3), 159457. doi: 10.1016/j.scitotenv.2022.159457
Wang J. Y., Qin S. G., Zhang Y. Q. (2020). Spatial-temporal patterns of vegetation water use efficiency in the Mu Us Desert. J.Journal Desert Res. 40 (05), 120–129.
Wei H. J., Zhang Y. F., Dong X. B., Lu N. C., Wang X. C. (2016). Estimating the spatio-temporal characteristic of vegetation water use efficiency over Weihe River Basin. J. J. Natural Resources. 31 (08), 1275–1288. doi: 10.11849/zrzyxb.20151064
Xia L., Wang F., Mu X., Jin K., Sun W., Gao P., et al. (2015). Water use efficiency of net primary production in global terrestrial cosystems. J. Earth Syst. Sci. 124, 921–931. doi: 10.1007/s12040-015-0587-4
Xiao C. W. (2001). Potential effect of simulated precipitation change on the evapotranspiration of salix psammophylla seedlings in maowusu sandland. J. J. grassland. 9 (2), 121–127. doi: 10.11733/j.issn.1007-0435.2001.02.009
Xu X. T. (2008). Analysis of spatiotemporal characteristics of NPP and vegetation water use efficiency in the source area of the Yellow River (Lanzhou: Lanzhou University).
Xue B. L., Guo Q. H., Otto A., Xiao J. F., Tao S. L., Li L. (2015). Global patterns, trends, and drivers of water use efficiency from 2000 to 2013. J. Ecosphere 6 (10), 1–18. doi: 10.1890/ES14-00416.1
Yan L., Chen M. J., Ma J. (2018). A study of the ecological patterns of farming-pastoral zones in semi-arid regions: using the west liaohe river plain of China as an example. J. Appl. Ecol. Environ. Res. 16 (03), 3229–3244. doi: 10.15666/aeer/1603_32293244
Yan X., Wang R., Niu Z. G. (2022). Response of China’s wetland NDVI to climate changes. J.Wetlands. 42 (6). doi: 10.1007/s13157-022-01568-0
Yang J., Huang X. (2021). The 30 m annual land cover dataset and its dynamics in China from 1990 to 2019. J. Earth System Sci. Data 13 (8), 3907–3925. doi: 10.5194/essd-13-3907-2021
Yao Y., Liang S., Li X., Hong Y., Fisher J. B., Zhang N., et al. (2014). Bayesian multimodel esrimation of global terrestrial latent heat flux from eddy covariance, meteorological, and satellite observations. J.Geophys.Res.Atmos. 119, 4521–4545. doi: 10.1002/2013JD020864
Yin C. H., Luo M., Meng F. H., Sa C. L., Bao Y. H. (2022). The spatiotemporal variation and influencing factors of vegetation carbon and water use efficiency in the Mongolian Plateau. J. Chin. J. Ecology. 41 (06), 1079–1089. doi: 10.13292/j.1000-4890.202205.008
Yu Y. Y., Song F. Y., Zhang S. J. (2022). Quantitative analysis of temporal and spatial changes of NDVI and Its driving factors in Henan province from 2000 to 2020. J.Ecology Environ. Sci. 31 (10), 1939–1950. doi: 10.16258/j.cnki.1674-5906.2022.10.002
Yuan W. P., Zheng Y., Piao S. L., Ciais P., Lombardozzi D., Wang Y. P., et al. (2019). Increased atmospheric vapor pressure deficit reduces global vegetation growth. J. Sci. Advances. 2019, 5(8). doi: 10.1126/sciadv.aax1396
Zhang Z., Jiang H., Liu J. X., Zhou G. M., Liu S. R., Zhang X. Y. (2012). Assessment on water use efficiency under climate change and heterogeneous carbon dioxide in China terrestrial ecosystems. J.Procedia Environ. Sci. 13, 2031–2044. doi: 10.1016/j.proenv.2012.01.194
Zhang Y. D., Pang R., Gu F. X., Liu S. R. (2016). Temporal-spatial variations of WUE and its response to climate change in alpine area of southwestern China. J. Acta Ecologica Sinica. 36 (6), 1515–1525. doi: 10.5846/stxb201408121602
Zhang L., Tian J., He H., Ren X., Sun X., Yu G., et al. (2015). Evaluation of water use efficiency derived from MODIS products against eddy variance measurements in China. J.Remote. Sens. 7, 11183–11201. doi: 10.3390/rs70911183
Zhang H., Zhan C., Xia J., Yeh P. J. F., Ning L., Hu S., et al. (2022). The role of groundwater in the spatio-temporal variations of vegetation water use efficiency in the Ordos Plateau,China. J.Hydrol. 605, 127332. doi: 10.1016/j.jhydrol.2021.127332
Zhao Z. Z. (2017). Study on ecological environment change of Horqin Sandy Land based on multi-source data (Wuhan: Wuhan University).
Zhao M., Heinsch F. A., Nemani R. R., Running S. W. (2005). Improvements of the MODIS terrestrial gross and net primary production global data set. J.Remote Sens. Environ. 95, 164–176. doi: 10.1016/j.rse.2004.12.011
Zhao A. Z., Zhang A. B., Feng L. L., Wang D. L., Cheng D. Y. (2019). Spatio-temporal characteristics of water-use efficiency and its relationship with climatic factors in the Haihe River basin. J. Acta Ecologica Sinica. 39 (4), 1452–1462.
Zhen Y., Wang J. X., Liu S. R., Rentch J. S., Sun P. S., Lu C. Q. (2017). Global gross primary productivity and water use efficiency changes under drought stress. J.Envirinmental Res. Lett. 12 (1), 014016. doi: 10.1088/1748-9326/aa5258
Zheng H., Lin H., Zhou W. J., Bao H., Zhu X. J., Jin Z., et al. (2019). Revegetation has increased ecosystem water-use efficiency during 2000–2014 in the Chinese Loess Plateau: Evidence from satellite data. J.Ecological Indic. 102, 507–518. doi: 10.1016/j.ecolind.2019.02.049
Zheng Z. T., Zhang Y. J. (2022). Variation in ecosystem water use efficiency and its attribution analysis during 1982-2018 in Qingzang Plateau. J. Chin. J. Plant Ecology. 46 (12), 1486–1496. doi: 10.17521/cjpe.2021.0187
Zhou M., Zhou S. S., Wang J. X., Zhang Z. W., Yang J. H. (2014). Research advance on influencing factors of crop water use efficiency. J.Agricultural Sci. Technol. 15 (11), 1967–1976. doi: 10.16175/j.cnki.1009-4229.2014.11.031
Zhu Y. H., Xi X. K., Ma P. F., Yun T., Zhang J. (2022). Spatiotemporal variation of vegetation net primary productivity and its influencing factors. J. J. Inner Mongolia Agric. University(Natural Sci. Edition). 43 (01), 21–26. doi: 10.16853/j.cnki.1009-3575.2022.01.005
Keywords: water use efficiency (WUE), climate change, human activities, residual analysis, grey correlation model, West Liao River Plain (WLRP)
Citation: Gao M, Liu Q, Liu Y, Yang N, Wang Y and Li X (2023) Spatial and temporal variations of vegetation water use efficiency and its response to climate change and human activities in the West Liao River Plain, China. Front. Ecol. Evol. 11:1176131. doi: 10.3389/fevo.2023.1176131
Received: 28 February 2023; Accepted: 05 October 2023;
Published: 24 October 2023.
Edited by:
Jixi Gao, Ministry of Ecology and Environment (China), ChinaReviewed by:
Yahui Guo, Central China Normal University, ChinaHao Zhou, Chinese Academy of Sciences (CAS), China
Copyright © 2023 Gao, Liu, Liu, Yang, Wang and Li. This is an open-access article distributed under the terms of the Creative Commons Attribution License (CC BY). The use, distribution or reproduction in other forums is permitted, provided the original author(s) and the copyright owner(s) are credited and that the original publication in this journal is cited, in accordance with accepted academic practice. No use, distribution or reproduction is permitted which does not comply with these terms.
*Correspondence: Qiong Liu, bGl1cUBtYWlsLmNncy5nb3YuY24=; Yali Liu, bGl1eWFsaUBiamZ1LmVkdS5jbg==