 Rui Chen
 Lei Han2,3*
 Yonghua Zhao
- 1School of Earth Science and Resources, Chang’an University, Xi’an, China
- 2School of Land Engineering, Shaanxi Key Laboratory of Land Consolidation, Chang’an University, Xi’an, China
- 3Key Laboratory of Degraded and Unused Land Consolidation Engineering, Ministry of Natural Resources of the People’s Republic of China, Chang’an University, Xi’an, China
- 4Institute of Land Engineering and Technology, Shaanxi Provincial Land Engineering Construction Group, Xi’an, China
Vegetation coverage reflects the degree of environmental degradation. Timely and effective monitoring of vegetation conditions is the basis for promoting vegetation protection and improving the ecological environment of mining areas. Exploring vegetation coverage extraction methods and selecting the optimal vegetation index in mining areas can provide scientific reference for estimating vegetation coverage based on vegetation index in mining areas. Uncrewed aerial vehicles (UAVs) are widely used because of their fast real-time performance, high spatial resolution, and easy accessibility. In this study, the performances of nine visible vegetation indices and two threshold segmentation methods for extracting vegetation coverage in a post-gold mining area in the Qinling Mountains were comprehensively compared using visible spectrum UAV images. Of the nine indices, the excess green index (EXG) and visible-band difference vegetation index (VDVI) were the most effective in discriminating between vegetation and non-vegetation by visual interpretation. In addition, the accuracy of the bimodal histogram threshold method in extracting vegetation coverage was higher than that of Otsu’s threshold method. The bimodal histogram threshold method combined with EXG yielded optimal extraction results. Based on optimal methods, the total percentages of fractional vegetation coverage in 2019, 2020, and 2021 were 31.47%, 34.08%, and 42.77%, respectively, indicating that the vegetation in the mining area improved. These results provide valuable guidance for extracting vegetation information and evaluating vegetation restoration in mining areas.
1 Introduction
Vegetation restoration and reconstruction are key components of ecological restoration in mining areas and are effective ways to improve the quality of the local ecological environment (Li et al., 2019). Therefore, obtaining vegetation information quickly and accurately in mining areas to evaluate the status of local ecological restoration is an urgent issue. As an important indicator of vegetation status, fractional vegetation coverage (FVC) is defined as the percentage ratio of the vertical projection area of vegetation (including leaves, stems, and branches) on the ground in a statistical area (Jia et al., 2015). FVC is not only the main indicator of regional environmental status and quality assessment but also an important part of terrestrial ecosystem research. Thus, accurate and rapid extraction of vegetation coverage requires timely monitoring of vegetation change, which is crucial for protecting biodiversity and promoting economic development.
Currently, remote sensing observations and land surface measurements are primarily used to monitor FVC (Lu et al., 2020). As a low-cost and highly efficient monitoring technology, remote sensing can provide objective and accurate environmental monitoring for large-scale mining areas. With the rapid development of satellite remote sensing technologies, many vegetation products, such as those derived from NOAA/AVHRR (Boyd et al., 2002), TM/Landsat (Voorde et al., 2008; Leng et al., 2019), and Terra & Aqua/MODIS (Song et al., 2017), have facilitated large-scale monitoring of vegetation coverage. However, for small-scale areas, such as mining areas with complex topography and heterogeneous habitats, monitoring FVC using satellite remote sensing technologies is challenging because of their relatively coarse spatial resolution and long revisit period. Furthermore, although in situ measurements have high accuracy, they are usually time consuming and labor intensive, rendering them unsuitable for real-time and long-term monitoring. Notably, uncrewed aerial vehicles (UAVs) have the advantages of strong real-time performance, high spatial resolution, and easy access; thus, they have attracted wide attention as a novel and improved method to extract vegetation coverage with high efficiency and precision on small spatial scales in agriculture, forestry, surveying, mapping, and other related fields (Watanabe et al., 2017; Schofield et al., 2019; Ana et al., 2021; Guo et al., 2021; Park et al., 2022; Mishra et al., 2023).
Compared with multispectral, hyperspectral, and other sensors, visible light sensors are better options for extracting vegetation coverage via UAV technology owing to their outstanding advantages, such as low cost and are less affected by weather and light (Coy et al., 2016; Jay et al., 2019; Ren et al., 2021). The vegetation index can effectively reflect vegetation vitality and information and is a commonly used method for extracting vegetation coverage (Woebbecke et al., 1995; Hague et al., 2006; Rasmussen et al., 2016; Kim et al., 2018; Geng et al., 2022). Various vegetation indices have been developed based on the spectral characteristics of green vegetation in the visible light band, such as the green leaf index (Shane et al., 2021), green-red vegetation index (Zhang et al., 2019), and difference-enhanced vegetation index (Zhou et al., 2021). An increasing number of studies have shown that vegetation coverage can be extracted using a vegetation index derived from UAV-visible images. Therefore, the limited wavelength information of UAV visible-light images must be used to construct a universally applicable and highly accurate vegetation index and effectively extract green vegetation information. Another key aspect of vegetation coverage extraction by vegetation indices is the determination of a suitable threshold, which can be based on threshold segmentation methods (Akash et al., 2019). However, few studies have used this method to determine the thresholds in mining areas, and the effectiveness of vegetation indices in mountainous mining areas has not yet been evaluated.
The Qinling Mountains are an important ecological security barrier in China and provide many ecosystem services, such as climate regulation, water yield, carbon sequestration, and biodiversity preservation (Fu et al., 2022). Rich gold mineral resources in the Qinling Mountains provide a good foundation for mining activities; however, long-term mining has resulted in serious vegetation destruction (Li et al., 2022), which has plagued sustainable local development (Huo et al., 2022). Therefore, a rapid and accurate method for acquisition of mine vegetation cover is required. Currently, research on vegetation coverage extraction based on visible vegetation index focuses mostly on cities, forests, grasslands, and farmlands with well-growing plants (Geng et al., 2022). However, an optimal vegetation index for extracting vegetation coverage suitable for Qinling gold mining areas with sparse vegetation and complex terrain has not yet been determined. Furthermore, previous studies focused on extraction methods for the current vegetation situation and lacked long-term monitoring. Therefore, an abandoned gold mining area in the Qinling Mountains was selected as the research area, and high spatial resolution visible spectrum images obtained by a UAV were used as the data source. The objectives of this study were to (1) compare the performances of nine visible light vegetation indices (RGRI, BGRI, EXG, EXGR, NGRDI, NGBDI, RGBVI, VDVI, and VEG) and two threshold segmentation methods (bimodal histogram method and Otsu’s threshold method) in the extraction of vegetation coverage information; (2) select the optimal combination of the vegetation index and threshold segmentation method with high extraction accuracy and wide applicability; and (3) analyze the interannual variation of FVC in the study area using results obtained by the optimal combination. This study provides scientific guidance for rapidly and accurately extracting vegetation coverage and offers technical support for evaluating vegetation restoration in mining areas.
2 Materials and methods
2.1 Study area
The study area is located in the southeastern part of Shangluo City, Shaanxi Province, China (Figure 1). It is between 108°34′20′′–111°1′25′′ E and 33°2′30′′–34°24′40′′ N. The study area is located in the Qinling Mountains and has a warm, temperate climate. The mean annual temperature is 12.2°C, the mean annual precipitation is 804.8 mm, and the mean annual sunshine duration is 1947.4 h. The soil type is yellow cinnamon. It is high in the northwest and low in the southeast. A gold production company in the research area began operations in 1999 and ceased production after a dam failure in 2006. Even after several years, bare slag still poses a serious threat to human health, and this research area has been listed as a key area for heavy metal prevention and control (Chen et al., 2022).
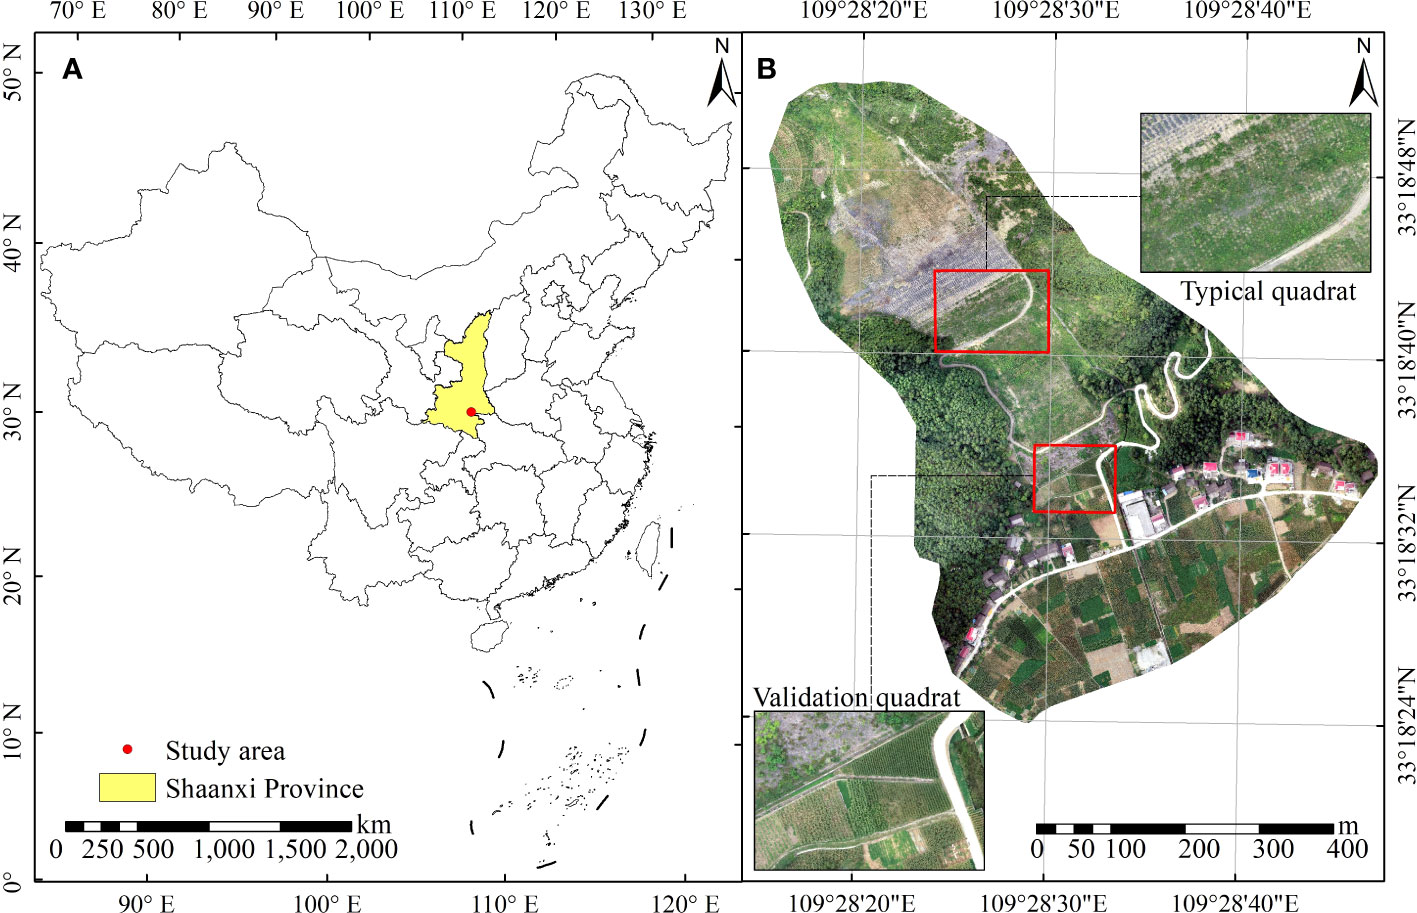
Figure 1 (A) Geographical location and (B) UAV image with a spatial resolution of 0.0436 m of the study area.
2.2 UAV image acquisition and processing
Field and UAV aerial surveys were conducted in August 2019, 2020, and 2021 to monitor the vegetation coverage at the research site in the post-mining area. The UAV flight test was conducted using a DJI Phantom 4 Pro on clear and cloudless days, and RGB-visible images were acquired. The flight parameters are listed in Table 1. The automatic cruise mode was used for route planning during the flight. The flight area and route were designed prior to conducting the experiment. The flight was 0.68 km2. Orthoimages of the study area are shown in Figure 1B.
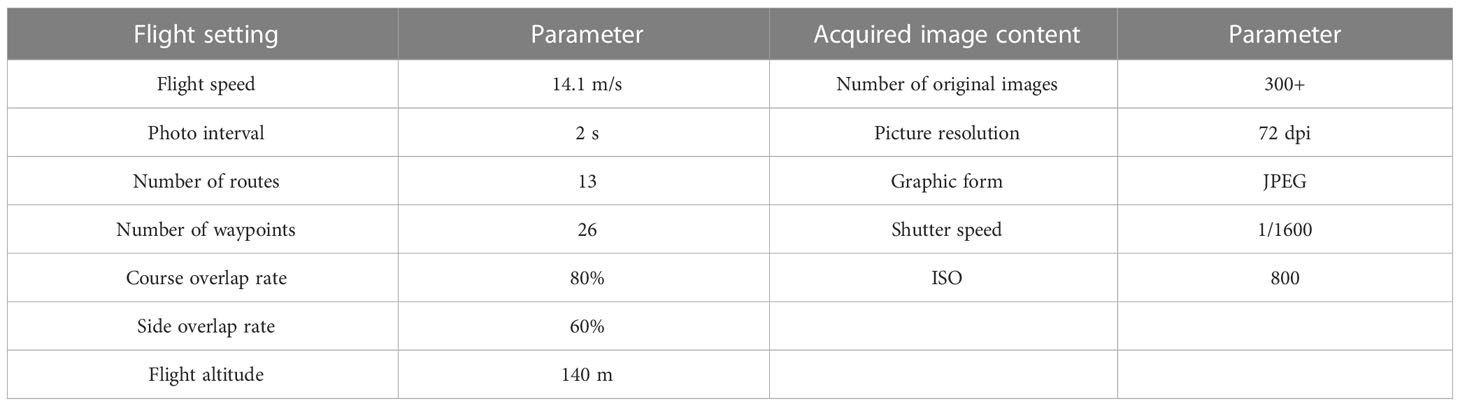
Table 1 Flight setting of the UAV and image parameters.
2.3 Calculation of visible light vegetation index
The basic principle behind the construction of a vegetation index is that vegetation absorbs and reflects light of different wavelengths. The corresponding vegetation index can be obtained by combining different bands of remote sensing images to enhance vegetation (Guilherme et al., 2018). The visible vegetation index is mainly constructed based on the red, green, and blue bands of the image because healthy green vegetation has a strong reflection in the green band and weak reflections in the red and blue bands. The nine commonly used visible light vegetation indices are listed in Table 2.
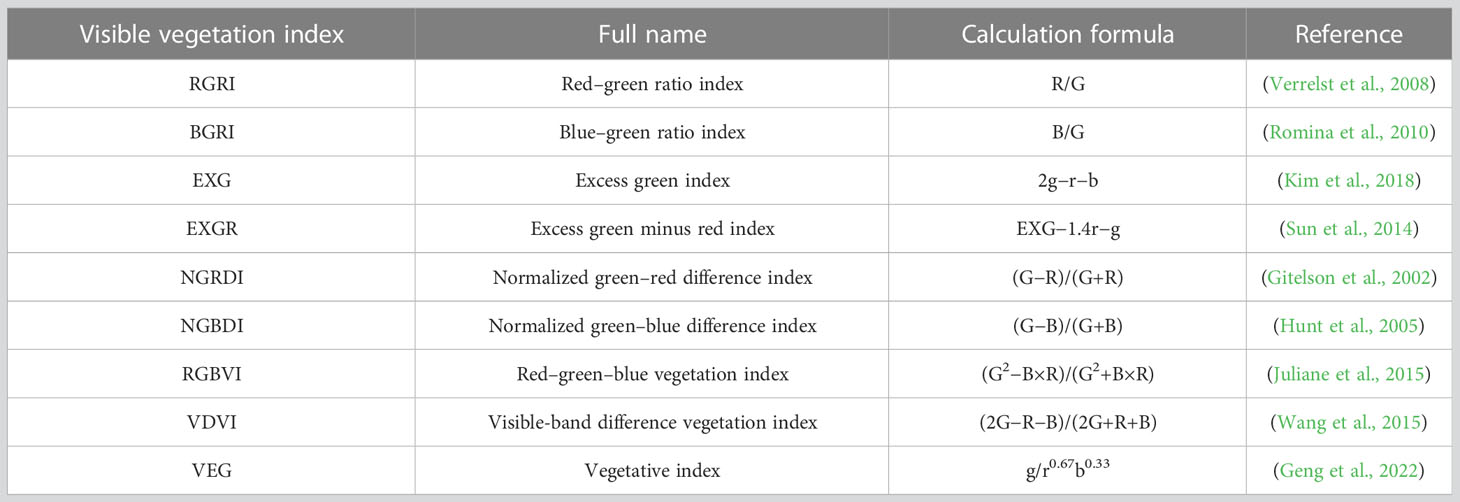
Table 2 Nine commonly used visible light vegetation indices considered in this study and the calculation formulas based on the visible spectrum.
2.4 Vegetation information extraction based on threshold
The vegetation index threshold method is effective for discriminating between vegetation and non-vegetation information in an image. Three steps are required to extract the vegetation coverage using the visible light vegetation index. The first step is to calculate the vegetation index, the second is to set an appropriate threshold, and the final is to separate the vegetation and non-vegetation parts. The accuracy of vegetation coverage extraction largely depends on threshold selection (Wang et al., 2015). Two commonly used methods, the bimodal histogram threshold method and Otsu’s threshold method, were applied to determine the threshold for each vegetation index.
2.4.1 Bimodal histogram method
A bimodal histogram is an image with two obvious peaks in a gray histogram (Zhou et al., 2021). These two wave peaks correspond to the internal and external target points. The wave trough between the two wave peaks corresponded to the target point near the edge of the object. Typically, the value at the wave trough is selected as the threshold. The calculation process of the bimodal histogram used in this study is as follows. (1) Calculate the average gray value (avg) and standard deviation of the pixels. (2) Considering the average pixel value as the dividing point, find the positions of the maximum values of the left (small peak) and right (large peak) parts. (3) If the two peak positions are close (within the standard deviation range), then one of the two peaks of the histogram is very low; hence, another low peak position must be found; otherwise, proceed to step (7). (4) Determine the position of the pixel gray median point (midpoint). (5) If midpoints>avg, then the small peak is on the left side of the large peak (lower gray level); otherwise, the small peak is on the right side of the large peak (higher gray level), and the position of the dividing point should be adjusted accordingly. (6) Re-find the positions of the large and small peaks. (7) The wave trough of the two peak positions is considered the required threshold (Liang, 2002).
2.4.2 Otsu’s threshold method
Otsu’s threshold method, also known as the maximum between-cluster variance method, is a global threshold selection method (Otsu, 2007). This method divides an image into background and target images based on a threshold. When the optimal threshold is considered, the variance between the background and target and the difference between the two parts of the image are the largest; that is, the optimal threshold is determined based on the maximum between-cluster variance. The calculation process of Otsu’s method is as follows. (1) Identify the highest gray level in the image. (2) Take each gray level as a threshold. (3) Calculate the number of pixels and the average value of the two categories segmented by the threshold. (4) Calculate the variance between the two clusters. (5) Determine the threshold of the maximum variance (Xu et al., 2022).
2.5 Extraction accuracy evaluation
Accuracy, Precision, and Recall were calculated as follows to evaluate the classification accuracy (Shukla and Jain, 2020):
where TP, which stands for “true positive,” is the object that is correctly classified as vegetation among all the extracted objects; TN, which stands for “true negative,” is the object that is correctly classified as non-vegetation among all the extracted objects; FP, which stands for “false positive,” is the object that is misclassified as vegetation among all extracted objects; and FN, which stands for “false negative,” is the object that is misclassified as non-vegetation among all the extracted objects.
2.6 Data analysis
The UAV images were converted into orthoimages using DJI Terra v.3.3 software developed by DJI (Shenzhen, China). Supervised classification, calculation of vegetation indices, threshold segmentation, and extraction of vegetation coverage were performed using ENVI 5.3 software.
3 Results
3.1 Calculation results of vegetation index
3.1.1 Visual interpretation and supervision classification
The performance of the visible vegetation indices in extracting vegetation was evaluated by comparison with the results of the maximum likelihood classification method (Figure 2). Fifty regions of interest (ROIs) with non-vegetation and fifty ROIs with vegetation were uniformly selected to verify the classification accuracy. The overall accuracies of the typical and validation quadrats were 99.99% and 99.39%, respectively.
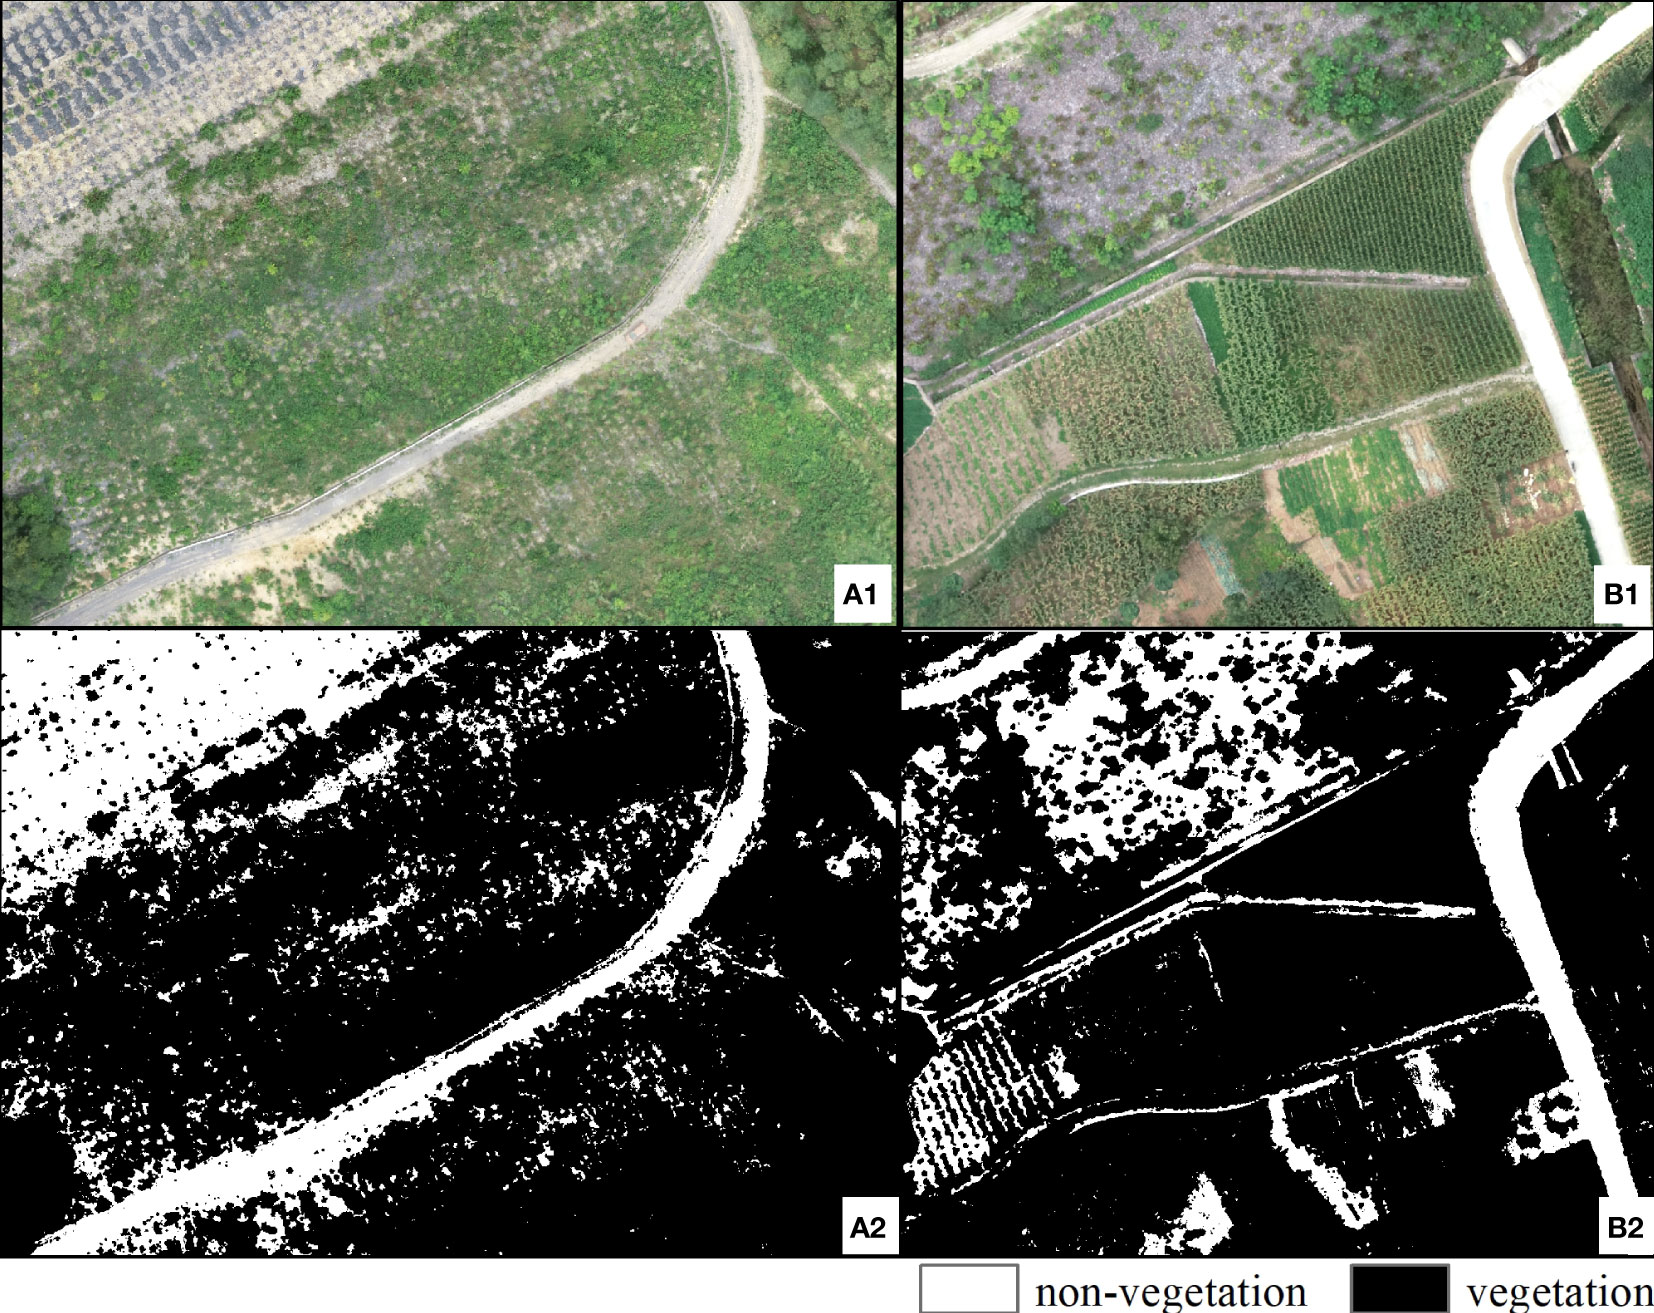
Figure 2 Original images of (A1) typical and (B1) validation quadrats and classification results of the (A2) typical and (B2) verification quadrats.
3.1.2 Vegetation index calculation results
The vegetation indices derived from the gray image of a typical quadrat are shown in Figure 3. Most visible light vegetation indices can be used to effectively distinguish vegetation from non-vegetation information; however, the extraction effects are different. Some vegetation indices, such as EXG, EXGR, RGBVI, VEG, and VDVI, can clearly discriminate between vegetation and non-vegetation areas; however, BGRI, RGRI, NGBDI, and NGRDI cannot clearly distinguish between the two and resulted in some misclassifications, indicating poor extraction performance. Furthermore, to analyze the pixel value ranges of vegetation and non-vegetation in the gray image of each band and vegetation index, 75 representative ROIs were randomly selected to count the pixel eigenvalues of each visible band and vegetation index (Table 3). The results indicated that the reflectance in the green band of the vegetation was significantly higher than that of the non-vegetation. In the BGRI, RGRI, and NGRDI gray images, the pixel values of vegetation and non-vegetation overlapped over a large range; therefore, vegetation and non-vegetation areas overlapped. In addition, the calculation formulas for RGRI, NGBDI, and NGRDI only used blue + green or red + green bands, indicating that the red, green, and blue bands should be combined when calculating the visible light vegetation index.

Figure 3 Calculation results of nine vegetation indices for the typical quadrat.
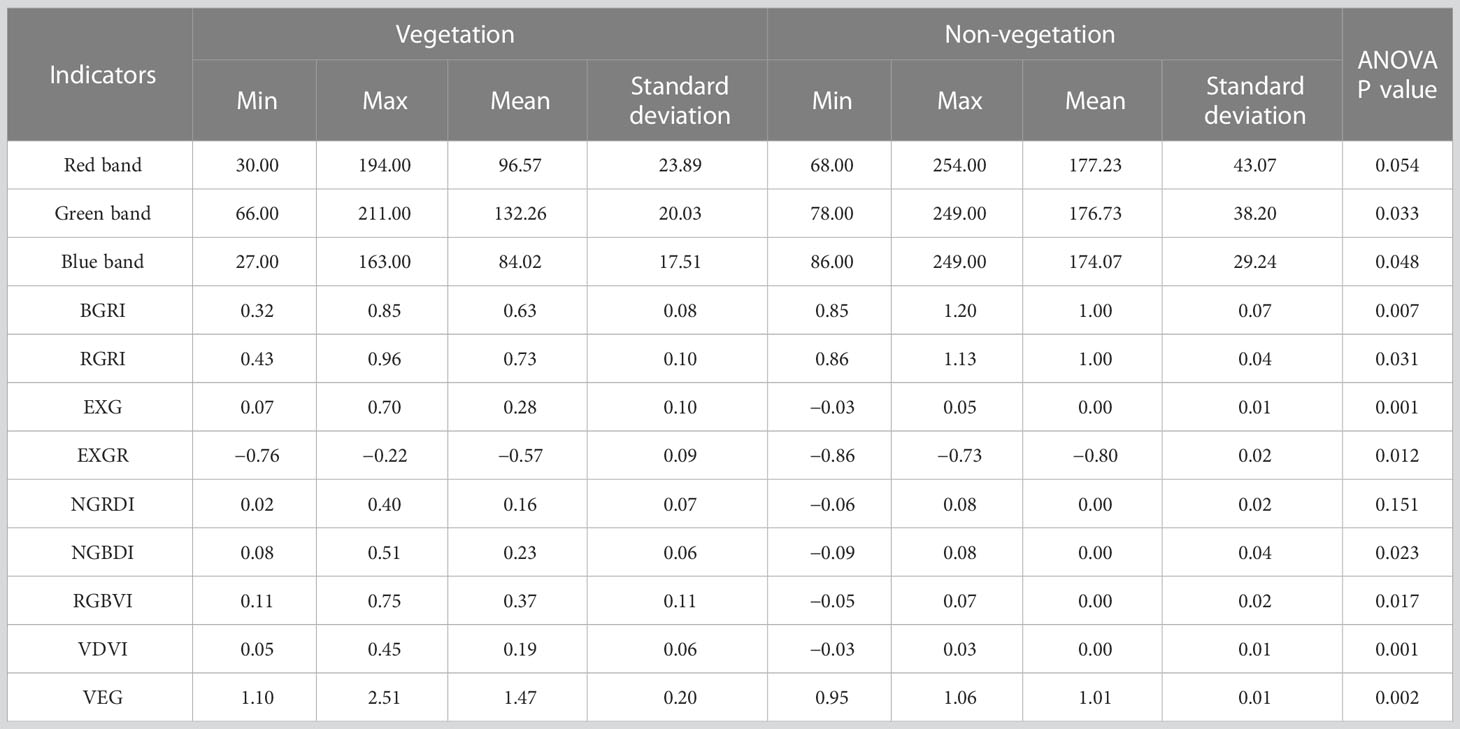
Table 3 Differences in pixel values of visible bands and vegetation indices of the typical quadrat.
3.1.3 Threshold segmentation and vegetation index selection
The bimodal histogram threshold and Otsu’s threshold methods were employed to determine the threshold of each visible light vegetation index grey image. The vegetation and non-vegetation areas were discriminated based on the thresholds, and the extraction accuracy was verified by comparison with the supervised classification results. The threshold segmentation results are shown in Figures 4, 5. By jointly viewing the orthoimages and supervised classification results (Figure 2A1, A2), we found that the extraction results of the bimodal histogram threshold method had fewer misclassifications, and the segmentation effect was obviously better than that of Otsu’s threshold method. In the segmentation results of the bimodal histogram threshold method, RGRI, EXGR, NGRDI, and VEG misclassified vegetation as non-vegetation, whereas BGRI and EXG misclassified non-vegetation as non-vegetation, indicating relatively poor extraction accuracy. The quantitative accuracy must be evaluated to accurately evaluate the effects of the segmentation results. The Accuracy, Precision and Recall of the threshold segmentation results were calculated based on the maximum likelihood classification results (Table 4). Overall, the classification accuracy of the bimodal histogram method was higher than that of Otsu’s threshold method. Among the visible light vegetation indices, EXG, based on the bimodal histogram method, had the highest classification accuracy, with the Accuracy was 98.264%, Precision was 99. 811% and 97.572% in vegetation and non-vegetation, and Recall was 99.913% and 94.847% in vegetation and non-vegetation.
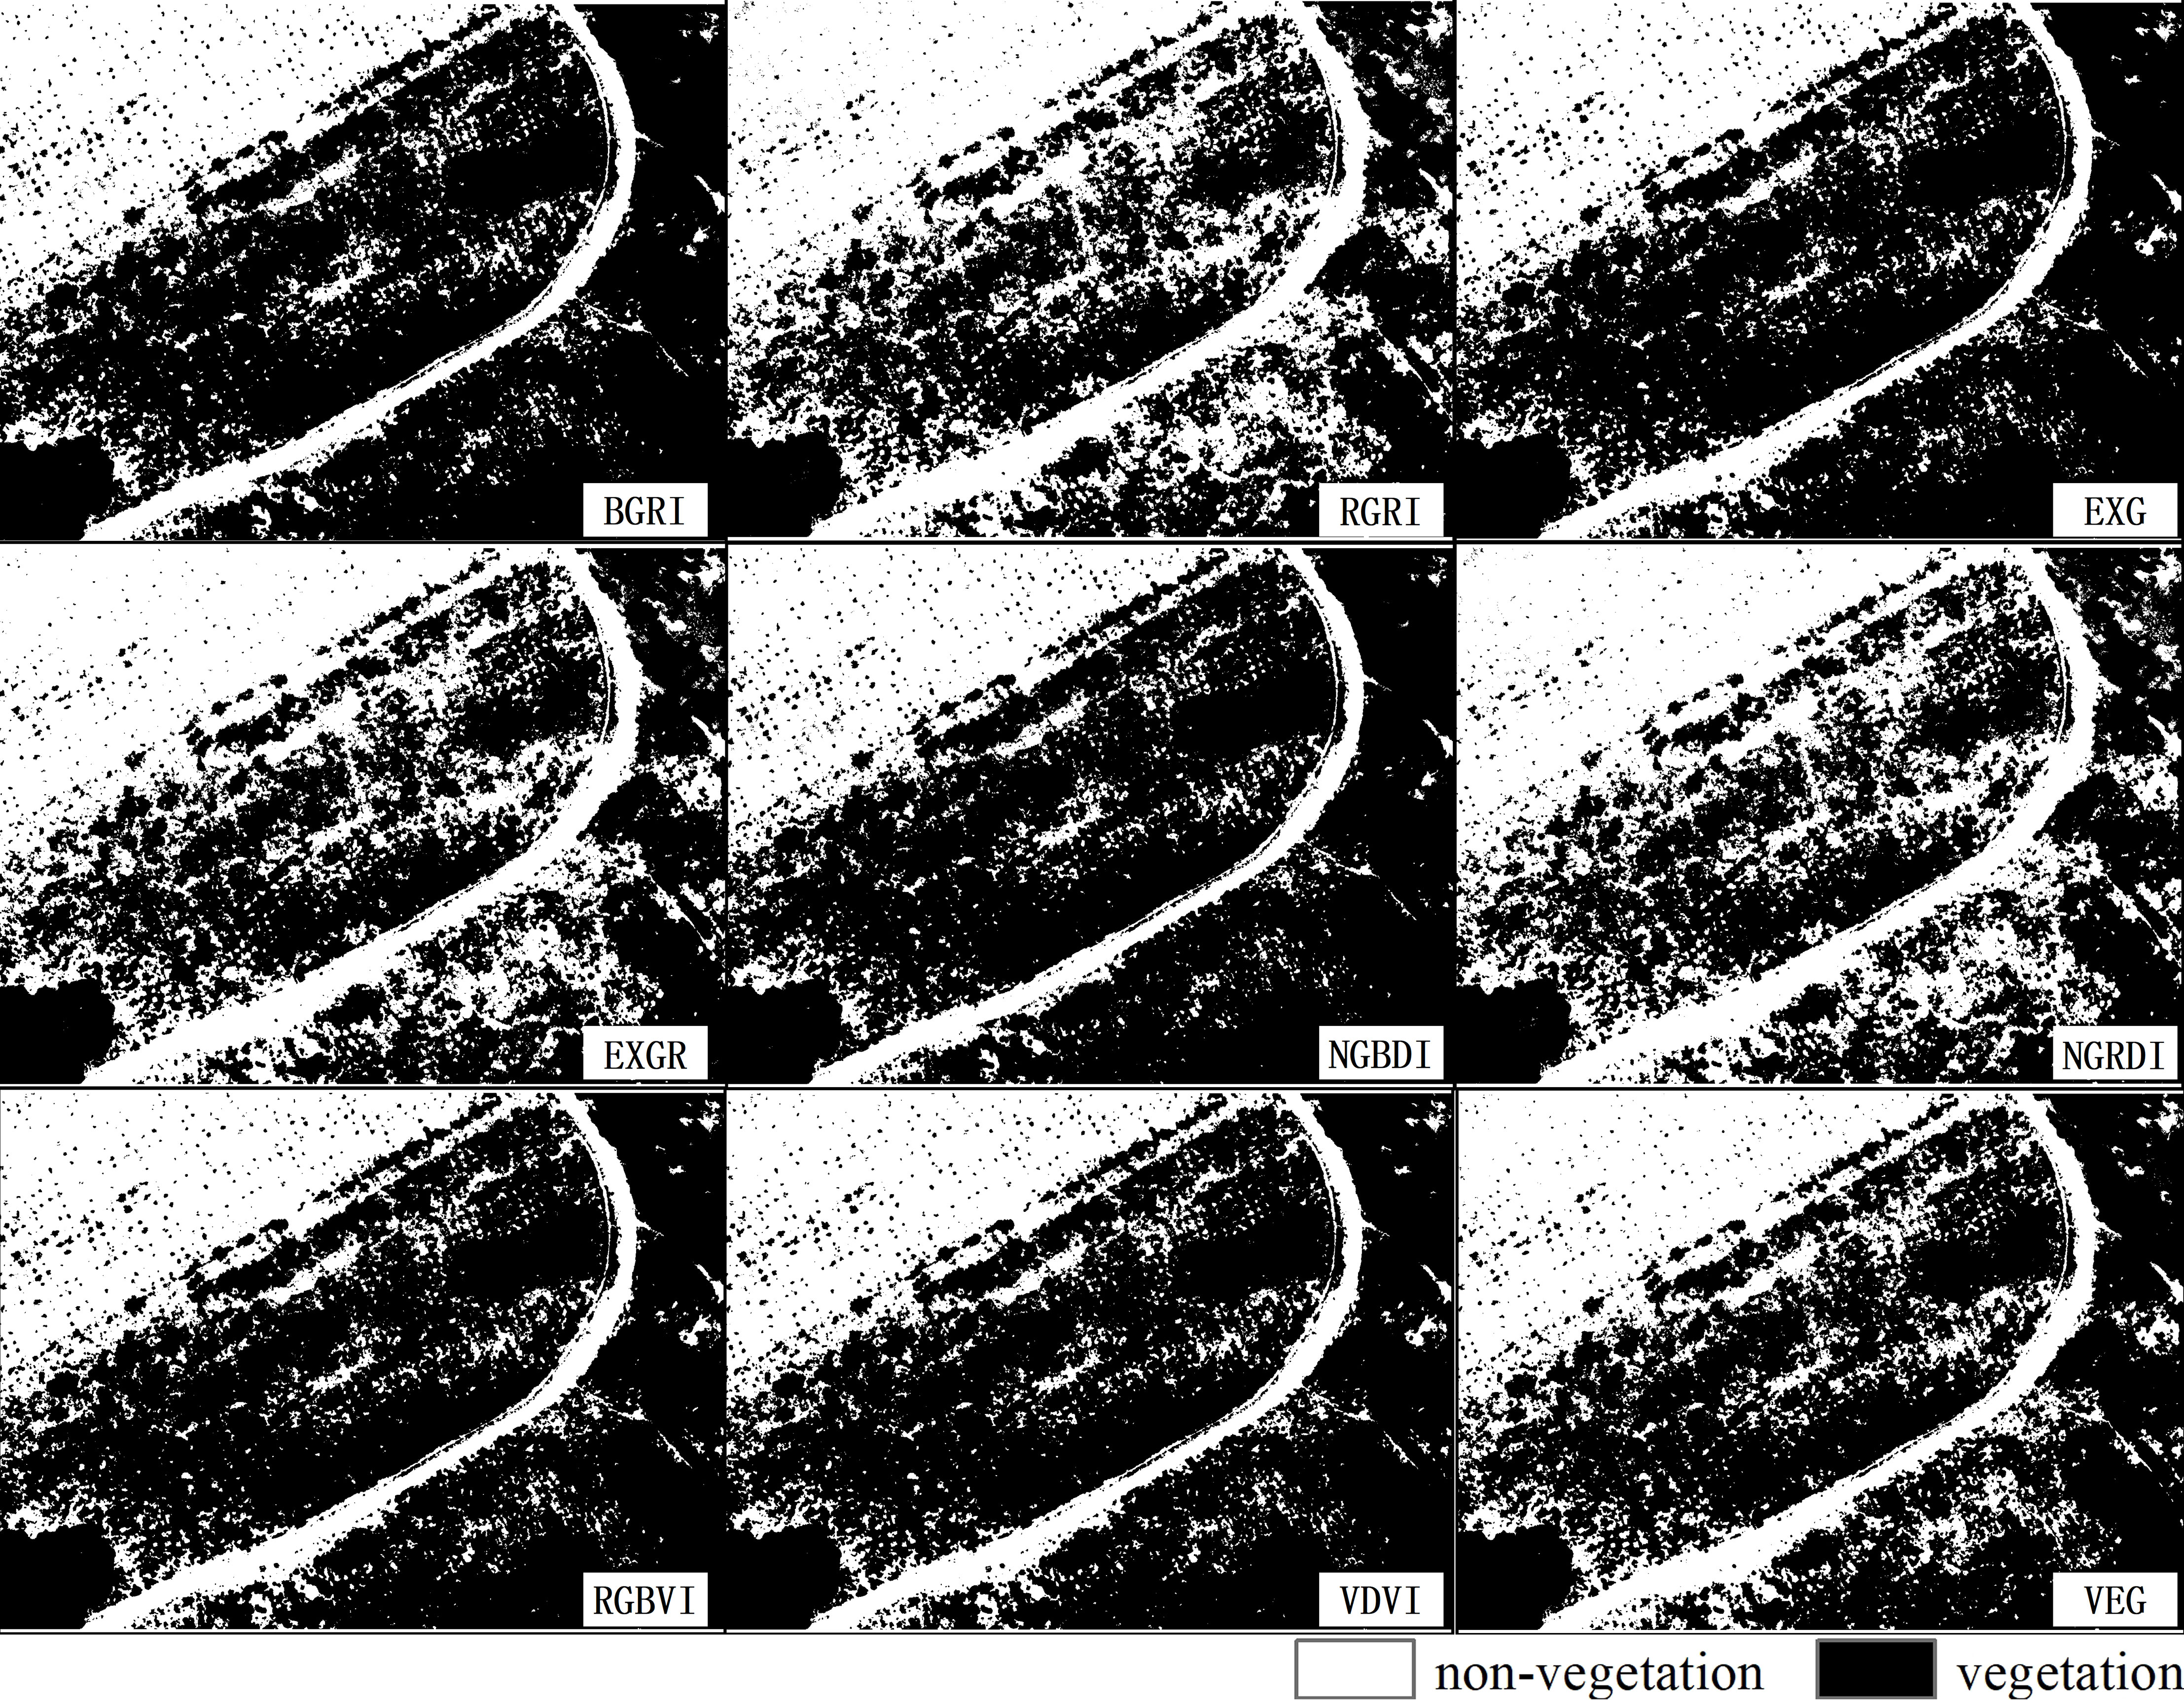
Figure 4 Segmentation results of the bimodal histogram threshold method.
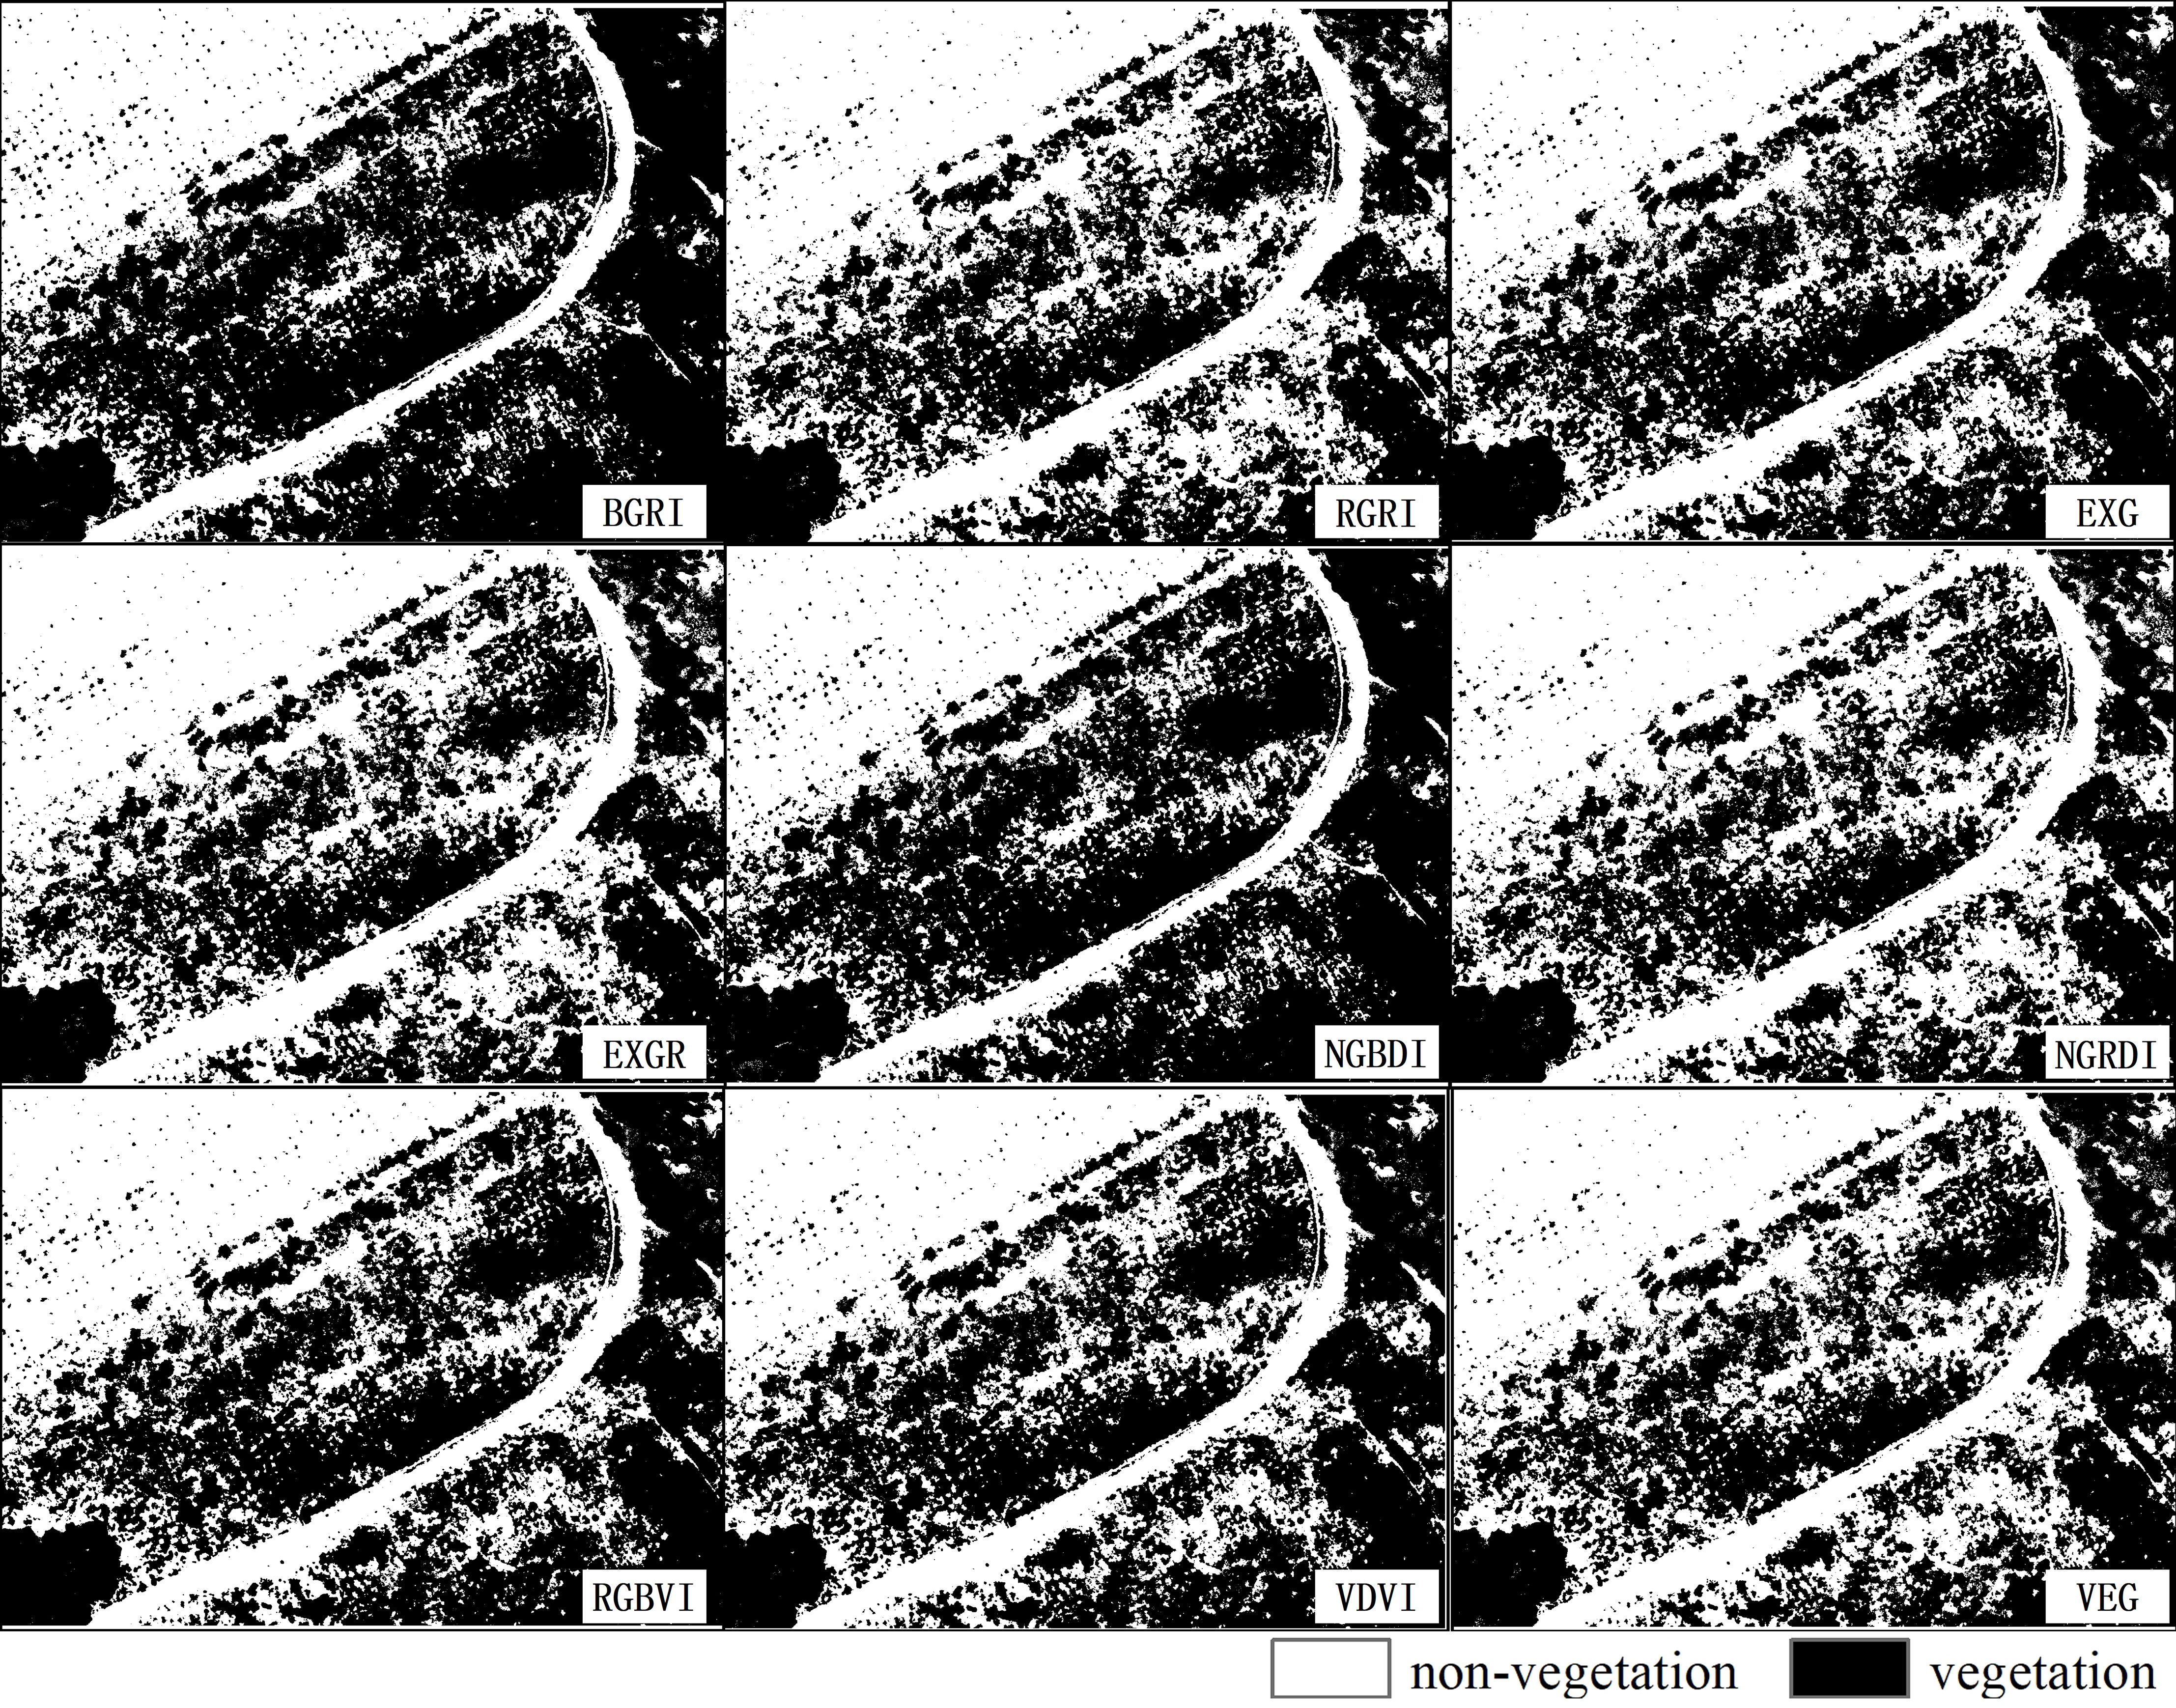
Figure 5 Segmentation results of Otsu’s threshold method.
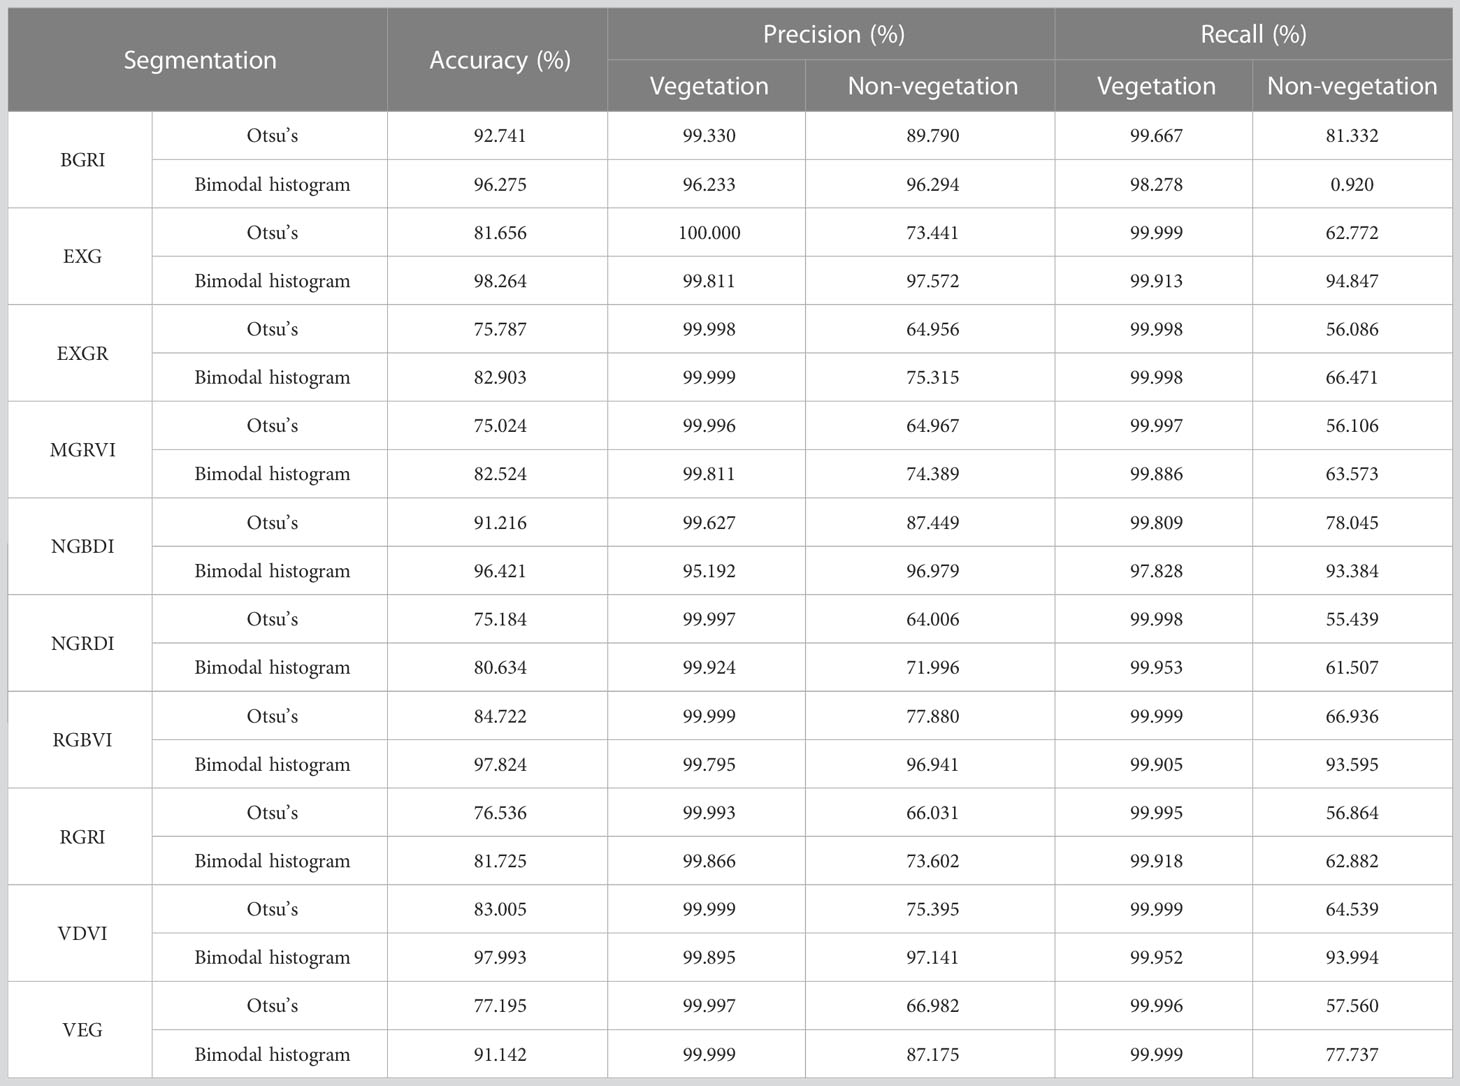
Table 4 Accuracy evaluation of the typical quadrat.
3.2 Suitability performance test
The reliability and applicability of EXG, VDVI, and RGBVI for extracting vegetation coverage were verified based on the supervised classification results of the verification quadrat. The vegetation extracted based on EXG, VDVI, RGBVI, and the bimodal histogram threshold method (the thresholds were 0.047603, 0.041258, and 0.075669, respectively) are shown in Figure 6. The results of vegetation coverage extraction were compared with those of the maximum likelihood classification (Table 5). EXG combined with the bimodal histogram method still had the highest accuracy in extracting vegetation coverage, followed by VDVI and RGBVI, suggesting that EXG had the highest precision in extracting vegetation information and could be used to estimate vegetation coverage in mining areas.
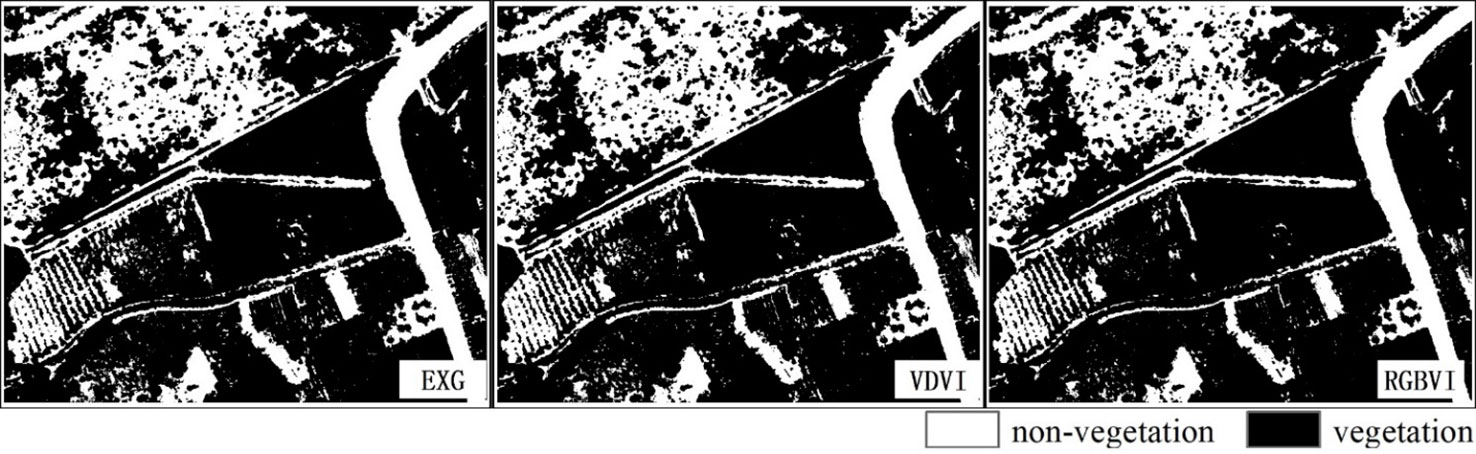
Figure 6 Verification results of the verification quadrat.
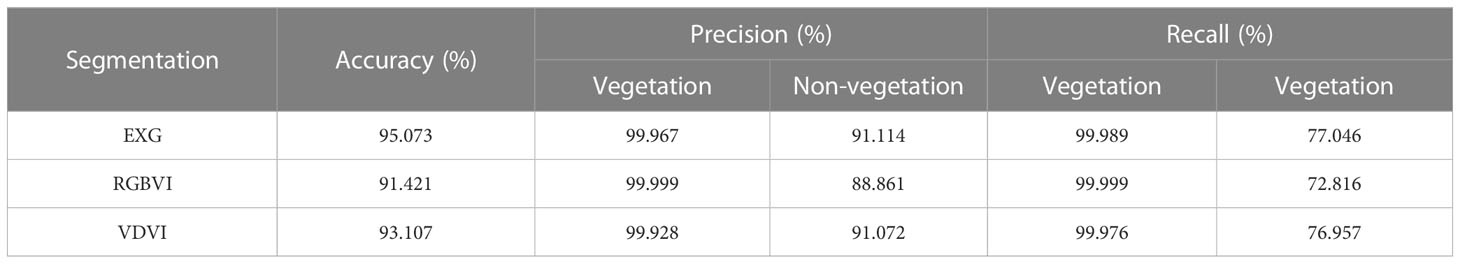
Table 5 Accuracy evaluation of the verification quadrat.
3.3 Vegetation coverage assessment
According to the above results, EXG combined with the bimodal histogram threshold method was used to estimate vegetation coverage in 2019, 2020, and 2021 (the thresholds were 0.07848, 0.122353, and 0.125108, respectively). The extraction results were statistically classified as follows: vegetation coverage of 0–0.05 was considered a zero-coverage area, 0.05–0.2 was a low vegetation coverage area, 0.2–0.4 was a low–moderate vegetation coverage area, 0.4–0.6 was a moderate vegetation coverage area, 0.6–0.8 was a moderate–high vegetation coverage area, and 0.8–1 was a high vegetation coverage area (Zhao et al., 2022). Figure 7 shows that EXG can clearly discriminate between vegetation and non-vegetation areas. From 2019 to 2021, the non-vegetation area decreased, and the proportion of moderate–high and high vegetation coverage areas increased significantly. The average FVC values in 2019, 2020, and 2021 were 31.47%, 34.08%, and 42.77%, respectively, indicating that the FVC in the mining area increased. The results suggest that the effect of vegetation restoration was remarkable, and the quality of the ecological environment improved. However, most areas in the post-mining area had low, low–moderate, and moderate vegetation coverage, and vegetation restoration requires further strengthening.
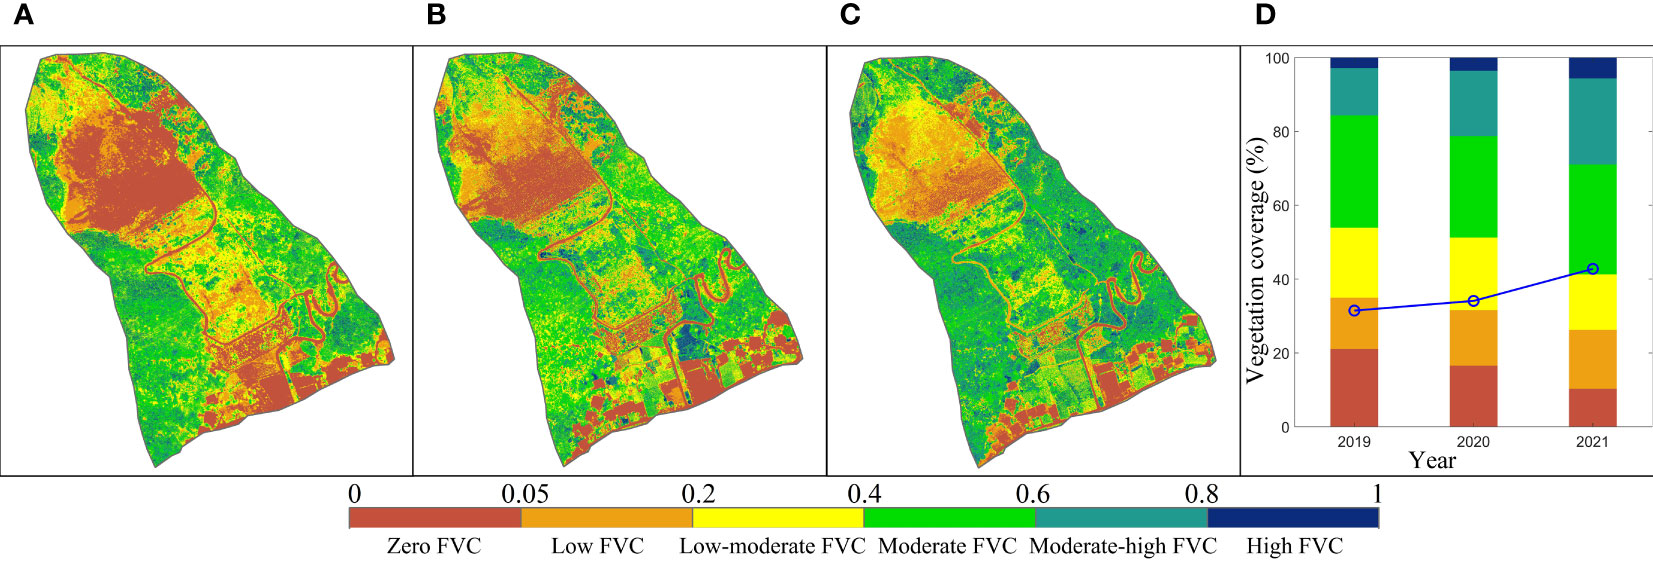
Figure 7 Estimated results of vegetation coverage based on EXG combined with the bimodal histogram threshold method in (A) 2019, (B) 2020, and (C) 2021. (D) Inter-annual variation of vegetation coverage from 2019 to 2021.
4 Discussion
4.1 Extraction accuracy of vegetation coverage
The accuracy of vegetation coverage extraction was related to both the vegetation index and threshold segmentation method. In this study, EXG exhibited the highest extraction accuracy, followed by VDVI and RGBVI, which is consistent with the results of Wang et al. (2015) and Chen and Deng (2019). The calculation formulas for EXG, VDVI, and RGNVI show the reflectance characteristics of vegetation in the visible bands, which effectively increase the sensitivity of vegetation to green bands and make full use of the information in the red, green, and blue bands. Currently, the bimodal histogram threshold and Otsu’s threshold methods are widely used for threshold segmentation. In this study, the results of the threshold methods for vegetation coverage extraction suggested that the accuracy of the bimodal histogram method was significantly better than that of Otsu’s threshold method (Figure 5), reaffirming the results of Zhao et al. (2019). Using the bimodal histogram method, the accuracies of RGRI, EXGR, and NGRDI were relatively low, which may be related to the histogram characteristics. As shown in the histogram of each vegetation index (Figure 8), EXG, VDVI, and RGBVI showed similar changes and obvious bimodal characteristics, whereas the histograms of RGRI, EXGR, and NGRDI had no obvious bimodal characteristics. Therefore, the accuracy of vegetation coverage extraction varied greatly.

Figure 8 Statistical histogram of the nine vegetation indices considered in this study.
4.2 Characteristics of UAV visible vegetation indices
Satellite remote sensing images have advantages, such as large image areas and multiple bands (Xu et al., 2020; Guo and Guo, 2021). However, owing to the relatively coarse spatial resolution, the interpretation accuracy is relatively limited, and the temporal resolution often cannot meet the real-time requirements of vegetation monitoring on a small spatial scale, such as in mining areas. With the popularization of UAV technology, UAV images have compensated for the deficiencies in satellite remote sensing images in terms of spatial and temporal resolution. UAVs provide a new data source for the acquisition of vegetation coverage information in mining areas and offer new approaches for monitoring vegetation growth and recovery in mining areas (Sun et al., 2021). The results of this study indicate that vegetation coverage data can be accurately extracted from UAV images. As an unsupervised classification method, the visible light vegetation index can be used to extract vegetation coverage quickly and accurately without manual visual discrimination of vegetation areas or non-vegetation areas. Two major advantages are commonly associated with using visible spectrum images for extracting vegetation coverage. One is that RGB images are low cost, convenient to process, and less affected by weather and light. The other is that RGB images have a relatively high spatial and temporal resolution, which is more suitable for local studies. For example, Marcial-Pablo et al. (2019) indicated that the accuracy of visible vegetation indices is higher than that of visible NIR vegetation indices for early crop cover. Furukawa et al. (2021) reported that RGB images provide reliable information for vegetation monitoring. For the mining areas, the land-use type was relatively single, and vegetation coverage could be quickly obtained via UAV images. Moreover, the UAV-visible images were acquired in summer, when vegetation growth was the best. For most vegetation, summer is the most vigorous period for plant growth, during which the vegetation exhibits the strongest reflected spectral features. Thus, vegetation coverage can be accurately estimated using the vegetation index.
4.3 Variation characteristics of vegetation coverage
According to previous investigation and research results, the soil arsenic contamination in the gold mining area is serious (the average soil arsenic content was 93.96 mg/kg) (Chen et al., 2022). Vegetation types are scarce (mostly herbaceous plants), and vegetation coverage is low. The results of the vegetation coverage change from 2019 to 2021 indicated that most natural vegetation restoration sites had low to low–moderate vegetation coverage. This was mainly because soil As contamination limited the normal growth and development of plants in the early stages of vegetation restoration (Yang et al., 2020), and community succession was relatively slow. Increased vegetation coverage improves the quality of regional ecological environments. With the progress of ecological restoration, the soil arsenic content has decreased, and plants have developed their own unique physiological and ecological characteristics after a period of adaptation. The number of pixels with zero vegetation and low and low-moderate vegetation coverage decreased, those with moderate–high and high vegetation coverage increased, and the overall vegetation coverage increased.
5 Conclusions
In this study, a disused gold mining area in the Qinling Mountains was selected as the research area, and UAVs were deployed to obtain image data with high spatial resolution in the visible light. The performance of different visible light vegetation indices combined with two threshold segmentation methods for extracting vegetation coverage was evaluated. The main conclusions are as follows. (1) Except for RGRI, NGRDI, and NGBDI, the other visible light vegetation indices effectively discriminated between vegetation and non-vegetation in the study area. (2) EXG, VDVI, and RGBVI combined with the bimodal histogram threshold method had higher extraction accuracy in distinguishing between vegetation and non-vegetation areas. (3) EXG and the bimodal histogram threshold method had the highest accuracy for vegetation identification, which was the closest to the results of the monitored and actual situations. (4) The spatiotemporal analysis of vegetation coverage in 2019, 2020, and 2021 showed that most mining areas had low, low–moderate, and moderate vegetation coverage, whereas the overall vegetation coverage was low. The average FVC for the three years were 31.47%, 34.08%, and 42.77%, respectively, indicating an increasing trend. Future studies should continue monitoring vegetation coverage changes to provide technical support for land reclamation and ecological restoration in mining areas.
Data availability statement
The original contributions presented in the study are included in the article/supplementary material. Further inquiries can be directed to the corresponding author.
Author contributions
RC: conceptualization, methodology, analysis, and writing – original manuscript. LH: conceptualization, reviewing and editing, and funding acquisition. YHZ: reviewing and editing, supervision. ZZ: methodology, statistical analysis, and reviewing and editing. ZL: reviewing and editing, supervision. RL: methodology, reviewing and editing. LX: reviewing and editing, providing revisions and comments, and supervision. YMZ: methodology, providing revisions and comments, and reviewing and editing. All authors contributed to the article and approved the submitted version.
Funding
This work was supported by the Key Laboratory of Degraded and Unused Land Consolidation Engineering, Ministry of Natural Resources of the People’s Republic of China (Program No. SXDJ2017-9), and the Shaanxi Key Laboratory of Land Reclamation Engineering: (Program No. 2018-ZZ03).
Acknowledgments
We are grateful to the reviewers whose comments have helped to clarify and improve the manuscript.
Conflict of interest
RL and LX were employed by the Institute of Land Engineering and Technology, Shaanxi Provincial Land Engineering Construction Group, Xi’an, China.
The remaining authors declare that the research was conducted in the absence of any commercial or financial relationships that could be construed as a potential conflict of interest.
Publisher’s note
All claims expressed in this article are solely those of the authors and do not necessarily represent those of their affiliated organizations, or those of the publisher, the editors and the reviewers. Any product that may be evaluated in this article, or claim that may be made by its manufacturer, is not guaranteed or endorsed by the publisher.
References
Akash A., Jinha J., Anjin C., Sungchan O., Murilo M., Juan L. (2019). A comparative study of RGB and multispectral sensor-based cotton canopy cover modelling using multi-temporal UAS data. Remote Sens. 11 (23), 2757. doi: 10.3390/rs11232757
Ana D. C., Shi Y. Y., Maja J. M., Peña J. M. (2021). UAVs for vegetation monitoring: overview and recent scientific contributions. Remote Sens-Basel 13, 2139. doi: 10.3390/rs13112139
Boyd D. S., Foody G. M., Ripple W. J. (2002). Evaluation of approaches for forest cover estimation in the pacific Northwest, USA, using remote sensing. Appl. Geogr. 22 (4), 375–393. doi: 10.1016/S0143-6228(02)00048-6
Chen X. D., Deng J. H. (2019). Study on extraction method of vegetation coverage of summer maize based on visible image. Exp. Technol. Manage. 36 (12), 131–136. doi: 10.6041/j.issn.1000-1298.2019.05.027
Chen R., Han L., Liu Z., Zhao Y. H., Li R. S., Xia L. F., et al. (2022). Assessment of soil-heavy metal pollution and the health risks in a mining area from southern shaanxi province, China. Toxics 10, 385. doi: 10.3390/toxics10070385
Coy A., Rankine D., Taylor M., Nielsen D. C. (2016). Increasing the accuracy and automation of fractional vegetation cover estimation from digital photographs. Remote Sens. 8 (7), 474. doi: 10.3390/rs8070474
Fu Y., Song Y., Yang C., Liu X., Liu Y., Huang Y. (2022). Relationship between brain size and digestive tract length support the expensive-tissue hypothesis in feirana quadranus. Front. Ecol. Evol. 10. doi: 10.3389/fevo.2022.982590
Furukawa F., Laneng L. A., Ando H., Yoshimura N., Kaneko M., Morimoto J. (2021). Comparison of RGB and multispectral unmanned aerial vehicle for monitoring vegetation coverage changes on a landslide area. Drones 5, 97. doi: 10.3390/drones5030097
Geng X., Wang X. M., Fang H. L., Ye J. S., Han L. K., Gong Y., et al. (2022). Vegetation coverage of desert ecosystems in the qinghai-Tibet plateau is underestimated. Ecol. Indic 137, 108780. doi: 10.1016/j.ecolind.2022.108780
Gitelson A. A., Kaufman Y. J., Stark R., Rundquist D. (2002). Novel algorithms for remote estimation of vegetation fraction. Remote Sens. Environ. 80 (1), 76–87. doi: 10.1016/S0034-4257(01)00289-9
Guilherme M. S., Daniel G. D., Oriel T. K., Ana C. S. L., Sérgio G., Fábio M. O., et al. (2018). The potential for RGB images obtained using unmanned aerial vehicle to assess and predict yield in sugarcane fields. Int. J. Remote Sens. 39 (15-16), 5402–5414. doi: 10.1080/01431161.2018.1448484
Guo X., Guo Q. (2021). And feng z detecting the vegetation change related to the creep of 2018 baige landslide in jinsha river, SE Tibet using SPOT data. Front. Earth Sci. 9. doi: 10.3389/feart.2021.706998
Guo Z. C., Wang T., Liu S. L., Kang W. P., Chen X., Feng K., et al. (2021). Biomass and vegetation coverage survey in the mu us sandy land - based on unmanned aerial vehicle RGB images. Int. J. Appl. Earth Obs. 94, 102239. doi: 10.1016/j.jag.2020.102239
Hague T., Tillett N. D., Wheeler H. (2006). Automated crop and weed monitoring in widely spaced cereals. Precis. Agric. 7 (1), 21–32. doi: 10.1007/s11119-005-6787-1
Hunt E. R., Cavigelli M., Daughtry C., Mcmurtrey J., Walthall C. (2005). Evaluation of digital photography from model aircraft for remote sensing of crop biomass and nitrogen status. Precis. Agric. 6 (4), 359–378. doi: 10.1007/s11119-005-2324-5
Huo A. D., Wang X., Zhao Z. X., Yang L. Y., Zhong F. Q., Zheng C. L., et al. (2022). Risk assessment of heavy metal pollution in farmland soils at the northern foot of the qinling mountains, China. Int. J. Environ. Res. Public Health 19 (22), 14962. doi: 10.3390/ijerph192214962
Jay S., Baret F., Dutartre D., Malatesta G., Héno S., Comar A., et al. (2019). Exploiting the centimeter resolution of UAV multispectral imagery to improve remote-sensing estimates of canopy structure and biochemistry in sugar beet crops. Remote Sens. Environ. 231, 110898. doi: 10.1016/j.rse.2018.09.011
Jia K., Liang S. L., Liu S. H., Li Y. W., Xiao Z. Q., Yao Y. J., et al. (2015). Global land surface fractional vegetation cover estimation using general regression neural networks from MODIS surface reflectance. IEEE T Geosci Remote 53 (9), 4787–4796. doi: 10.1109/TGRS.2015.2409563
Juliane Be, Kang Y., Helge A., Andreas B., Simon B., Janis B., et al. (2015). Combining UAV-based plant height from crop surface models, visible, and near infrared vegetation indices for biomass monitoring in barley. Int. J. Appl. Earth Obs. 39, 79–87. doi: 10.1016/j.jag.2015.02.012
Kim D. W., Yun H. S., Jeong S. J., Kwon Y. S., Kim S. G., Lee W. S., et al. (2018). Modeling and testing of growth status for Chinese cabbage and white radish with UAV-based RGB imagery. Remote Sens. 10 (4), 563. doi: 10.3390/rs10040563
Leng R. L., Zhang Y. Y., Xie J. Q., Li F. N., Xu G., Cui X. (2019). An analysis of fractional vegetation cover of the gannan grassland in the non-growing season based on multispectral data and small UVAs. Pratacultural Sci. 36 (11), 2742–2751. doi: 10.11829/j.issn.1001-0629.2019-0013
Li X. L., Gao J., Zhang J., Wang R., Jin L. Q., Zhou H. K. (2019). Adaptive strategies to overcome challenges in vegetation restoration to coalmine wasteland in a frigid alpine setting. Catena 182, 104142. doi: 10.1016/j.catena.2019.104142
Li T., Wu M. H., Duan C. G., Li S. Y., Liu C. E. (2022). The effect of different restoration approaches on vegetation development in metal mines. Sci. Total Environ. 806 (2), 150626. doi: 10.1016/J.Scitotenv.2021.150626
Liang H. W. (2002). Direct determination of threshold from bimodal histogram. Pattern Recognition Artificial Intell. 15 (2), 253–256.
Lu M., Liao X. H., Yue H. Y., Huang Y. H., Ye H. P., Xu C. C., et al. (2020). Optimizing distribution of drone ports for emergency monitoring of flood disasters in China. J. Flood Risk Manag. 13 (1), e12593. doi: 10.1111/jfr3.12593
Marcial-Pablo M. D. J., Gonzalez-Sanchez A., Jimenez-Jimenez S. I., Ontiveros-Capurata R. E., Ojeda-Bustamante W. (2019). Estimation of vegetation fraction using RGB and multispectral images from UAV. Int. J. Remote Sens. 40 (2), 420–438. doi: 10.1080/01431161.2018.1528017
Mishra V., Avtar R., Prathiba A. P., Mishra P. K., Tiwari A., Sharma S. K. (2023). Uncrewed aerial systems in water resource management and monitoring: a review of sensors, applications, software, and issues. Adv. Civ. Eng. 28, 3544724. doi: 10.1155/2023/3544724
Otsu N. (2007). A threshold selection method from gray-level histograms. IEEE T Syst. Man Cy-S 9 (1), 62–66. doi: 10.1109/TSMC.1979.4310076
Park G., Park K., Song B., Lee H. (2022). Analyzing impact of types of UAV-derived images on the object-based classification of land cover in an urban area. Drones 6, 71. doi: 10.3390/drones6030071
Rasmussen J., Ntakos G., Nielsen J., Svensgaard J., Poulsen R. N., Christensen S. (2016). Are vegetation indices derived from consumer-grade cameras mounted on UAVs sufficiently reliable for assessing experimental plots? Eur. J. Agron. 74, 75–92. doi: 10.1016/j.eja.2015.11.026
Ren L., Liu Y., Zhang S., Cheng L., Guo Y., Ding A. (2021). Vegetation properties in human-impacted riparian zones based on unmanned aerial vehicle (UAV) imagery: an analysis of river reaches in the yongding river basin. Forests 12, 22. doi: 10.3390/f12010022
Romina S., María C., Santiago A. T., Elizabeth K., Ana S. B., Constanza R., et al. (2010). Cryptochrome as a sensor of the blue/green ratio of natural radiation in arabidopsis. Plant Physiol. 154 (1), 401–409. doi: 10.1104/pp.110.160820
Schofield G., Esteban N., Katselidis K. A., Graeme C. H. (2019). Drones for research on sea turtles and other marine vertebrates – a review. Biol. Conserv. 238, 108214. doi: 10.1016/j.biocon.2019.108214
Shane G., Kevin L., John J., Kenny S. (2021). Use of an unmanned aerial vehicle (UAV) to document vegetation coverage rate in managed grasslands following a historic river flood. J. Anim. Sci. 99 (2), 9–10. doi: 10.1093/jas/skab096.015
Shukla A., Jain K. (2020). Automatic extraction of urban land information from unmanned aerial vehicle (UAV) data. Earth Sci. Inform 13, 1225–1236. doi: 10.1007/s12145-020-00498-x
Song W. J., Mu X. H., Ruan G. Y., Gao Z., Li L. Y., Yan G. Y. (2017). Estimating fractional vegetation cover and the vegetation index of bare soil and highly dense vegetation with a physically based method. Int. J. Appl. Earth Obs. 58, 168–176. doi: 10.1016/j.jag.2017.01.015
Sun Z. Y., Wang X. N., Wang Z. H., Yang L., Xie Y. C., Huang Y. H. (2021). UAVs as remote sensing platforms in plant ecology: review of applications and challenges. J. Plant Ecol. 14 (6), 1003–1023. doi: 10.1093/jpe/rtab089
Sun G. X., Wang X. C., Yan T. T., Li X., Chen M., Shi Y. Y., et al. (2014). Inversion method of flora growth parameters based on machine vision. Trans. Chin. Soc. Agric. Eng. 30 (20), 187–195.
Verrelst J., Schaepman M. E., Koetz B., Kneubühlerb M. (2008). Angular sensitivity analysis of vegetation indices derived from CHRIS/PROBA data. Remote Sens. Environ. 112 (5), 2341–2353. doi: 10.1016/j.rse.2007.11.001
Voorde T. V., Vlaeminck J., Canters F. (2008). Comparing different approaches for mapping urban vegetation cover from landsat ETM+ data: a case study on Brussels. Sensors 8, 3880–3902. doi: 10.3390/s8063880
Wang X. Q., Wang M. M., Wang S. Q., Wu D. P. (2015). Extraction of vegetation information from visible unmanned aerial vehicle images. Trans. Chin. Soc. Agric. Eng. 31 (05), 152–159.
Watanabe K., Guo W., Arai K., Takanashi H., Kajiya-Kanegae H., Kobayashi M., et al. (2017). High-throughput phenotyping of sorghum plant height using an unmanned aerial vehicle and its application to genomic prediction modeling. Front. Plant Sci. 8. doi: 10.3389/fpls.2017.00421
Woebbecke D., Meyer G., Bargen K., Mortensen D. (1995). Color indices for weed identification under various soil, residue, and lighting conditions. T ASABE 38, 259–269. doi: 10.13031/2013.27838
Xu X., Liu L., Han P., Gong X., Zhang Q. (2022). Accuracy of vegetation indices in assessing different grades of grassland desertification from UAV. Int. J. Env. Res. Pub. He. 19 (24), 16793. doi: 10.3390/ijerph192416793
Xu K. X., Su Y. J., Liu J., Hu T. Y., Jin S. C., Ma Q., et al. (2020). Estimation of degraded grassland aboveground biomass using machine learning methods from terrestrial laser scanning data. Ecol. Indic. 108 (C), 105747. doi: 10.1016/j.ecolind.2019.105747
Yang G. Y., Zhong H., Liu X., Liu C. E., Li S. Y., Hou L., et al. (2020). Arsenic distribution, accumulation and tolerance mechanisms of typha angustifolia in different phenological growth stages. B Environ. Contam. Tox. 104 (3), 358–365. doi: 10.1007/s00128-020-02796-y
Zhang X. L., Zhang F., Qi Y. X., Deng L. F., Wang X. L., Yang S. T. (2019). New research methods for vegetation information extraction based on visible light remote sensing images from an unmanned aerial vehicle (UAV). Int. J. Appl. Earth Obs. 78, 215–226. doi: 10.1016/j.jag.2019.01.001
Zhao D., Wang Z. W., Zhang G. Z., Xu Y. M., Sun L. J. (2022). Exploration of influence factors on regional fractional vegetation cover based on a combination of factor regression and interaction–take the three-river headwaters region as an example. China Environ. Sci. 42 (8), 3903–3912. doi: 10.19674/j.cnki.issn1000-6923.20220329d011
Zhao J., Yang H. B., Lan Y. B., Lu L. Q., Jia P., Li Z. M. (2019). Extraction method of summer corn vegetation coverage based on visible light image of unmanned aerial vehicle. Trans. Chin. Soc. Agric. Machinery 050 (005), 232–240.
Keywords: remote sensing, uncrewed aerial vehicle, vegetation coverage, eco-monitoring, post-mining area
Citation: Chen R, Han L, Zhao Y, Zhao Z, Liu Z, Li R, Xia L and Zhai Y (2023) Extraction and monitoring of vegetation coverage based on uncrewed aerial vehicle visible image in a post gold mining area. Front. Ecol. Evol. 11:1171358. doi: 10.3389/fevo.2023.1171358
Received: 22 February 2023; Accepted: 20 June 2023;
Published: 12 July 2023.
Edited by:
Jie Lou, Zhejiang Lab, ChinaReviewed by:
Jinman Wang, China University of Geosciences, ChinaVishal Mishra, Indian Institute of Technology Roorkee, India
Copyright © 2023 Chen, Han, Zhao, Zhao, Liu, Li, Xia and Zhai. This is an open-access article distributed under the terms of the Creative Commons Attribution License (CC BY). The use, distribution or reproduction in other forums is permitted, provided the original author(s) and the copyright owner(s) are credited and that the original publication in this journal is cited, in accordance with accepted academic practice. No use, distribution or reproduction is permitted which does not comply with these terms.
*Correspondence: Lei Han, aGFuc2h1YW5nbGVpQGNoZC5lZHUuY24=