 Jingyuan Lin
 Yi Guo
 Ming Shao
- School of Landscape and Architecture, Beijing Forest University, Beijing, China
Introduction: Global climate change, increase in human activities, and prominence of ecological issues have led to uneven quantitative and spatial distributions of carbon emission and sequestration of terrestrial ecosystems. Such uneven distributions can lead to more negative impacts on the natural environment and human living conditions.
Methods: Therefore, based on the carbon neutralization policy, we conducted geographically weighted regression (GWR) modeling in this study using panel data from 352 Chinese prefectural administrative districts in 2000, 2005, 2010, and 2017 to analyze and determine the impact factors and their spatial distribution for carbon emission and sequestration of terrestrial ecosystems.
Results: Our results showed that total population (TP), per capita gross domestic product (GDP) (PCG), proportion of secondary industry output (PSIO), scale of urban built-up area (SUB), green space proportion in city areas (GSP), normalized difference vegetation index (NDVI), and temperature (TEM) are factors driving carbon sequestration and carbon emission. The spatial distribution of these driving factors in mainland China is: (1) TP showed a negative correlation to carbon emission in most areas, while it exhibited a positive correlation to carbon sequestration in the southern, southwestern, and western parts of northwest China; however, in all other areas, TP showed a negative correlation with carbon sequestration; (2) PCG was positively correlated to carbon emission in most areas of China and to carbon sequestration in southwest, south, central, and northeast China; however, PCG demonstrated a negative correlation to carbon sequestration in the remaining areas; (3) PSIO and SUB presented a positive correlation to carbon emission and a negative correlation to carbon sequestration in most areas; (3) In contrast, GSP showed a negative correlation to carbon emission and a positive correlation to carbon sequestration in most areas; (5)NDVI showed a negative correlation to carbon emission and carbon sequestration in most areas toward the east of the “Heihe-Tengchong Line”; NDVI was positively correlated to both carbon emission and sequestration toward the west of this line; (6)TEM was positively correlated to carbon emission and sequestration in most parts of China.
Discussion: Based on these results, we further divided the Chinese cities into 6 groups: (1) Groups 1, 2, 3, and 6 are areas where carbon emission and sequestration are governed by both socioeconomic and natural ecological factors. The major driving factors of carbon emission and carbon sequestration in group 1 are PSIO, GSP, and NDVI; the driving factors of group 2 are SUB and NDVI. Meanwhile, carbon emission and sequestration in group 3 are governed by PCG, GSP, and NDVI; for group 6, carbon emission and sequestration are controlled by PCG, SUB, GSP, and NDVI; (2) Group 4 represents areas where carbon emission and sequestration are majorly impacted by PCG and SUB, thereby rendering socioeconomic factors as the major driving forces. Group 5 represents areas where carbon emission and sequestration are sensitive to the natural environment, with GSP and NDVI being the driving factors. Considering the uneven distribution of carbon sequestration and emission and the diverse driving factors in different areas of China, we provided guidance for future environmental policies aimed at reducing the uneven distribution of carbon sequestration and emission in different areas to achieve carbon neutralization.
1. Introduction
Carbon emission and sequestration of terrestrial ecosystems are the most important components in the global carbon cycle (Matthews and Keith, 2007; Hao et al., 2015; Keller et al., 2018). Recently, with increasing human activity and energy consumption, carbon dioxide (CO2) production has significantly increased (Ohara et al., 2007). CO2 emissions can cause several environmental issues such as global warming, glacier retreat, and sea-level rise (Stroeve et al., 2007; Solomon et al., 2009). Although reducing energy consumption proves effective in decreasing carbon emissions, terrestrial ecosystems play a significant role in fixing carbon (Huang Y. et al., 2022). The carbon sequestration rate of global terrestrial ecosystems has shown an increasing trend since the 1980s, and terrestrial ecosystems offset 41% of the global carbon emissions by the beginning of the 21st century (Friedlingstein et al., 2020). Forests are essential for carbon sequestration (Fang et al., 2018; Tang et al., 2018); however, with economic development and urbanization, several forests have been disturbed and thus show reduced capacity for carbon sequestration. Together with the increased CO2 emissions, the distribution of carbon contaminants started to become uneven both quantitatively and spatially. To reduce such uneven distributions, carbon neutralization policies have been promoted in many countries including China (Ma et al., 2021; Salvia et al., 2021; Majava et al., 2022). According to the World Resources Institute (WRI), the total carbon emission of China in 2019 was 12.06 Gt, accounting for 24.23% of the total global carbon emission that year. Therefore, at the 75th session of the United Nations General Assembly, the Chinese government proposed that China will reach peak carbon emissions by 2030 and achieve carbon neutralization by 2060 by balancing carbon emissions with carbon sequestration (Mallapaty, 2020). Therefore, studies that focus on the driving factors of carbon emission and sequestration and Chinese cities classification are urgently needed to solve environmental issues as well as promote sustainable development of China.
Facing the severe carbon balance problem, early treatments mainly start from reducing the amount of CO2 into the atmosphere (Figueroa et al., 2008; Meinshausen et al., 2009), and achieve the purpose of reducing carbon emissions and increasing carbon sequestration by controlling the development of industries with high carbon emissions and improving green space and green infrastructure (Gartner, 2004; Niemelä et al., 2010; Artz et al., 2018). However, those treatments cannot effectively solve the imbalance of carbon emissions and carbon sequestration by terrestrial vegetation among different regions (Zhang P. et al., 2018), and we are not sure the essential reasons for the formation of its spatial characteristics. Cities influence each other (Ben-Zadok, 2008), regional convergence will lead to the development of nearby cities into large metropolitan areas, because they share the same characteristics (Fang and Yu, 2017). And that requires us to analyze the driving factors of carbon emissions in each city and carbon sequestration by land vegetation, so as to distinguish and determine the driving characteristics and types of each city. It allows us to come up with management strategies for cities at the national level and to address the root causes.
As mentioned above, the increase in carbon emissions and the decrease in carbon sequestration by terrestrial vegetation are two important reasons of the increase in atmospheric CO2. In terms of the socioeconomic aspect, previous studies have shown that carbon emissions are primarily increased due to a rise in energy consumption, accelerated urbanization, and changes in industrial structures. For example, Zhang and Da (2015) used an LMDI (log mean Divisia index) approach to reveal that economy growth, energy intensity, and structure are the driving factors of carbon emissions. Wang Z. et al. (2012) applied the STIRPAT model to prove that CO2 emissions in Beijing were driven by urbanization and the tertiary sector. Moreover, Dong et al. (2018) showed that the carbon emission per unit of GDP (CEI) can be reduced by improving technology and increasing urbanization. With regard to natural ecology, several studies have shown that the expansion of cities and climate change tend to weaken the carbon sequestration ability of terrestrial ecosystems, thereby resulting in increased carbon emissions in the atmosphere in the form of CO2 (Wardle et al., 2012). Yang Y. et al. (2022) demonstrated that climate changes, land coverage, and the remediation and restoration of ecosystems are the driving factors of carbon sequestration by terrestrial ecosystems in China. Xiao et al. (2013) and Piao et al. (2012) discovered that the CO2 concentration in the air is governed by temperature, precipitation, and the length of the growing season; this is because these factors can control terrestrial vegetation and its carbon sequestration ability. Although several studies have focused on carbon emission and sequestration, these two processes have always been investigated separately. Furthermore, the driving factors that impact emission, sequestration, and their uneven spatial distributions have long been overlooked (Chen et al., 2020a).
In the past, studies on carbon emission and carbon sequestration at the prefecture-level and city level mostly focused on local areas of China (Wang Z. et al., 2012), while national studies mostly focused on the provincial level (Dong et al., 2018). Therefore, in this study, we improved the data granularity of this study at the prefectural administrative level to improve the accuracy of the results. Furthermore, we collected data from mainland China associated with carbon emission, carbon sequestration, and potential socioeconomic and ecological factors. By analyzing data of 22 potential driving factors of carbon emission and carbon sequestration collected from 352 prefecture-level administrative regions in China, we determined the factors that impact both carbon emission and sequestration. Moreover, we also analyzed the potential causes for the uneven spatial distributions of carbon emission and sequestration. Finally, we sorted 352 regions into different categories according to their dominant driving factors of carbon emission and sequestration, while identifying the reasons behind their uneven spatial distributions. Our study is the first to investigate the driving factors of both carbon emission and sequestration. We believe that this study can provide guidance for future policy development to decrease carbon emissions and enhance carbon sequestration in terrestrial ecosystems, and clear city grouping can serve as a basis for each city to formulate carbon reduction policies.
2. Materials and methods
2.1. Study area
The study area covered 352 prefectural-level administrative regions and some counties under provincial administration in China. However, since data were not available for Hong Kong, Macao, Taiwan, Tibet, and three counties in Hainan (Qiongzhong Li and Miao Autonomous County, Baoting Li and Miao Autonomous County, and Sansha County), these regions were not considered in this study. Information regarding each division is shown in Figure 1 (Chuai et al., 2012).
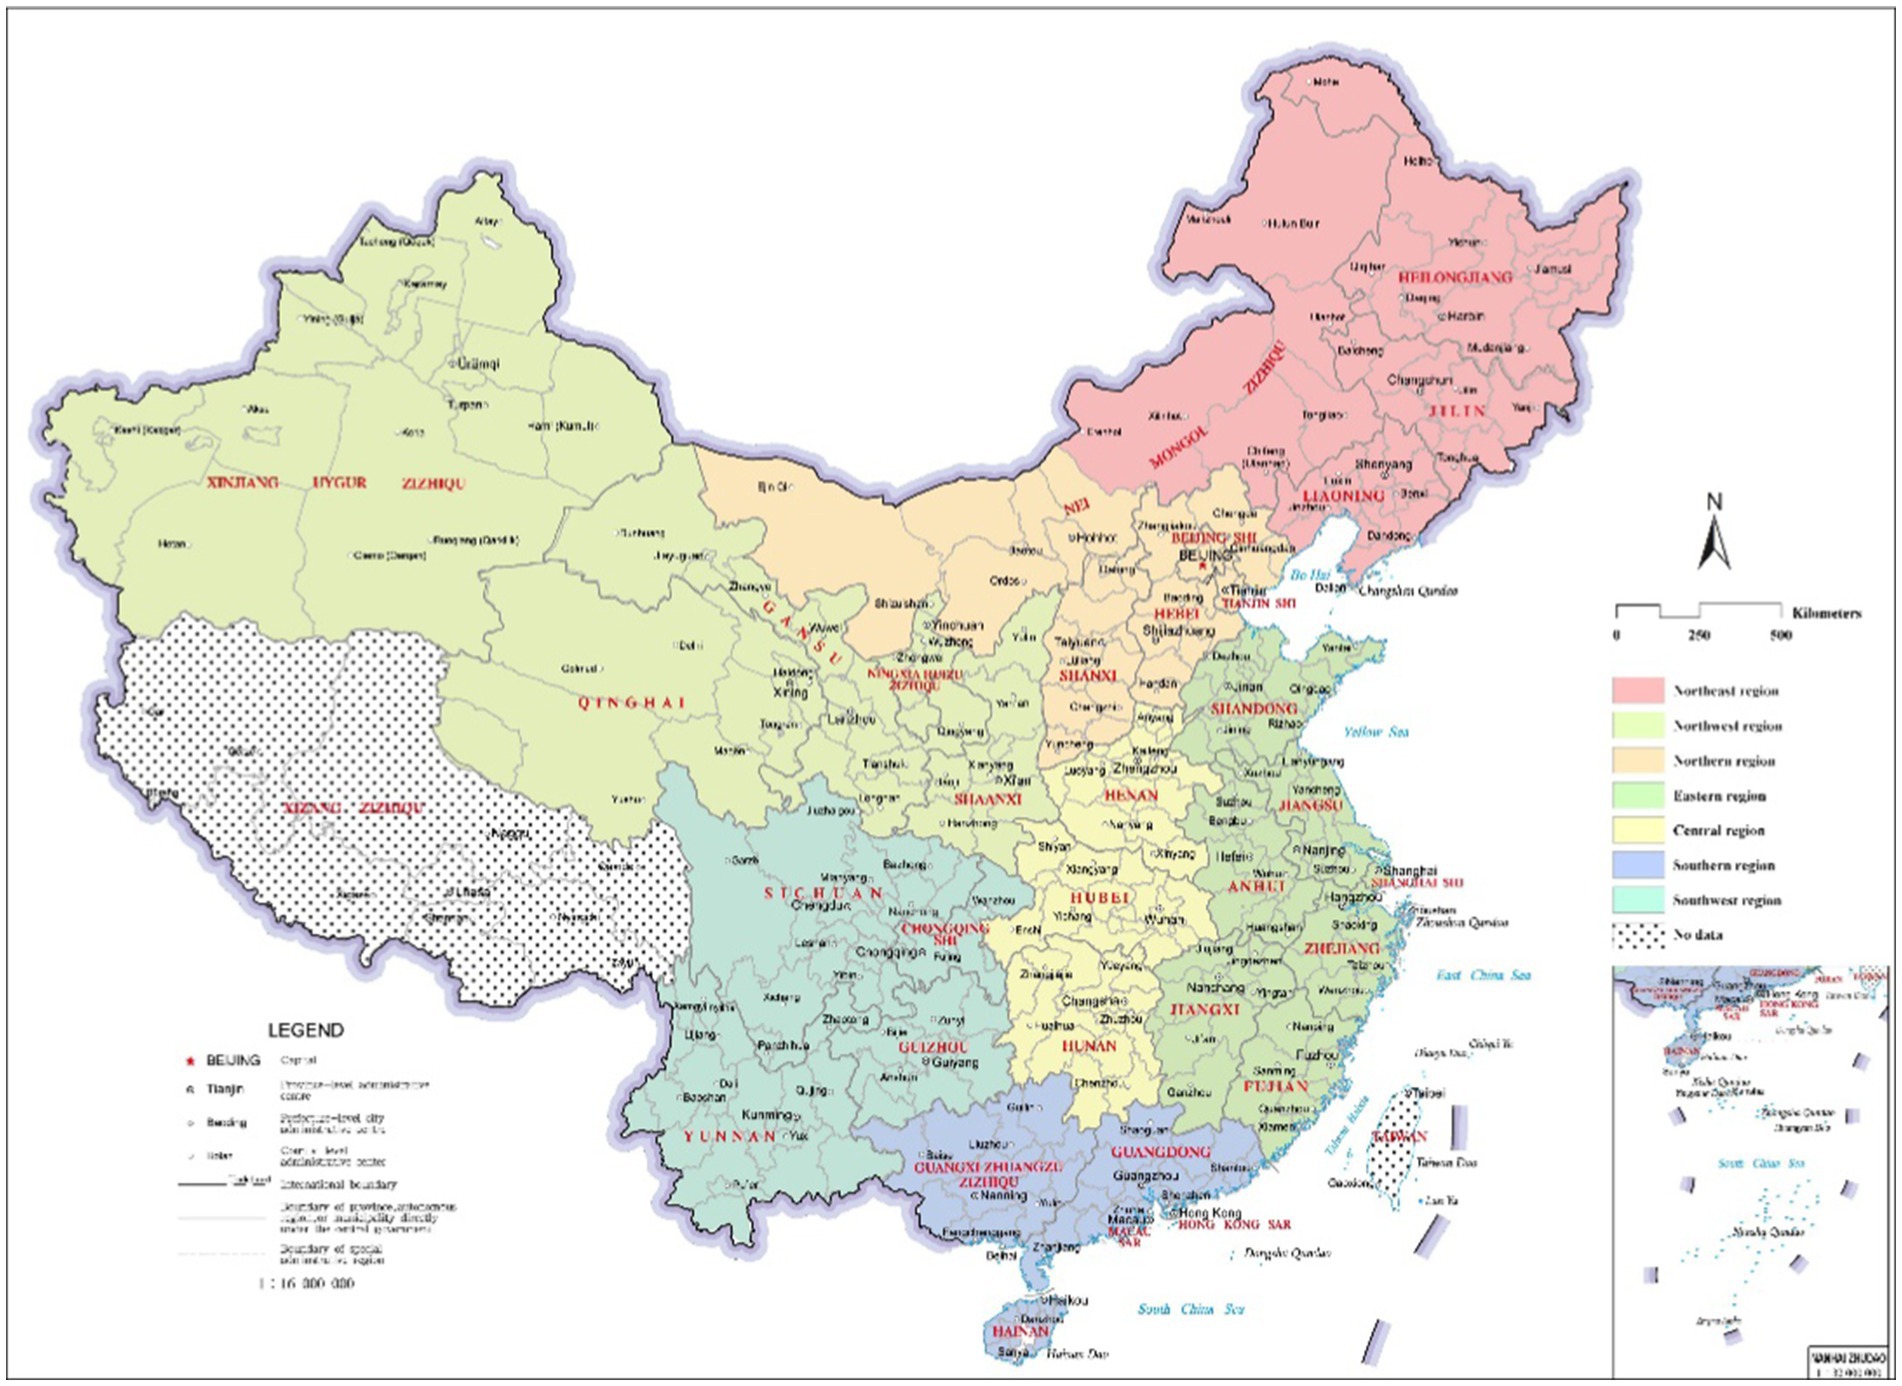
Figure 1. Study area location and zoning of 352 administrative units. Hong Kong, Macao, Taiwan, Tibet, Qiongzhong Li and Miao Autonomous County, Baoting Li and Miao Autonomous County, and Sansha County are not included in the study.
2.2. Variable selection and data sources
2.2.1. Variable selection and data processing
Based on previous studies (Arneth et al., 2017; Krausmann et al., 2017; Shuai et al., 2017; Zhang et al., 2017; Tang et al., 2018; Zhang X. et al., 2018; Tharammal et al., 2019; Reich et al., 2020; Tagesson et al., 2020; Yang Y. et al., 2022), 22 indicators reflecting economic growth, urban development, geographic characteristics, and meteorological conditions were selected for 2000, 2005, 2010, and 2017.
In order to ensure the integrity and consistency of the research data, each type of index in this study was selected from the data set covering the whole period from 2000 to 2017. All data were standardized using the SPSS-22.0 software. But it is worth noting that in the 17 years since 2000, the adjustment of the administrative scope of prefecture-level cities resulted in the absence of some data. These unavailable data were replaced by the data from adjacent years or obtained via interpolation. For 11 types of raster data such as PRCP (Precipitation), we used the ArcGIS10.4 tool to conduct unified coordinate adjustment and data statistics with reference to Administrative data of 2015, which was consistent with the statistical diameter of Carbon data (Chen et al., 2020b).
2.2.2. Data sources
The information used in this study includes data related to administration, carbon (including carbon emission and carbon sequestration), and driving factors. Among them, administrative data were obtained from the county-level administrative boundary data published by Data Center for Resources and Environmental Sciences, Chinese Academy of Sciences in 2015.1 Carbon data were obtained from the county-level CO2 emissions and sequestration dataset published by Carbon Emission Accounts and Datasets (CEAD).2 Information in this database is consistent with results of a previous study (Chen et al., 2020b). Administrative and carbon data at the prefectural level were obtained by integrating and processing these data from the county-level datasets. Remaining natural ecological data and socioeconomic data were obtained from the Science Data Center,3 Data Center for Resources and Environmental Sciences, Chinese Academy of Sciences,4 National Bureau of Statistics of China and Provincial Bureau of Statistics,5 Cities and Autonomous prefectures statistical yearbook6 and Global Change Research Data Publishing and Repository.7 Detailed information regarding the selected data is shown in Table 1.
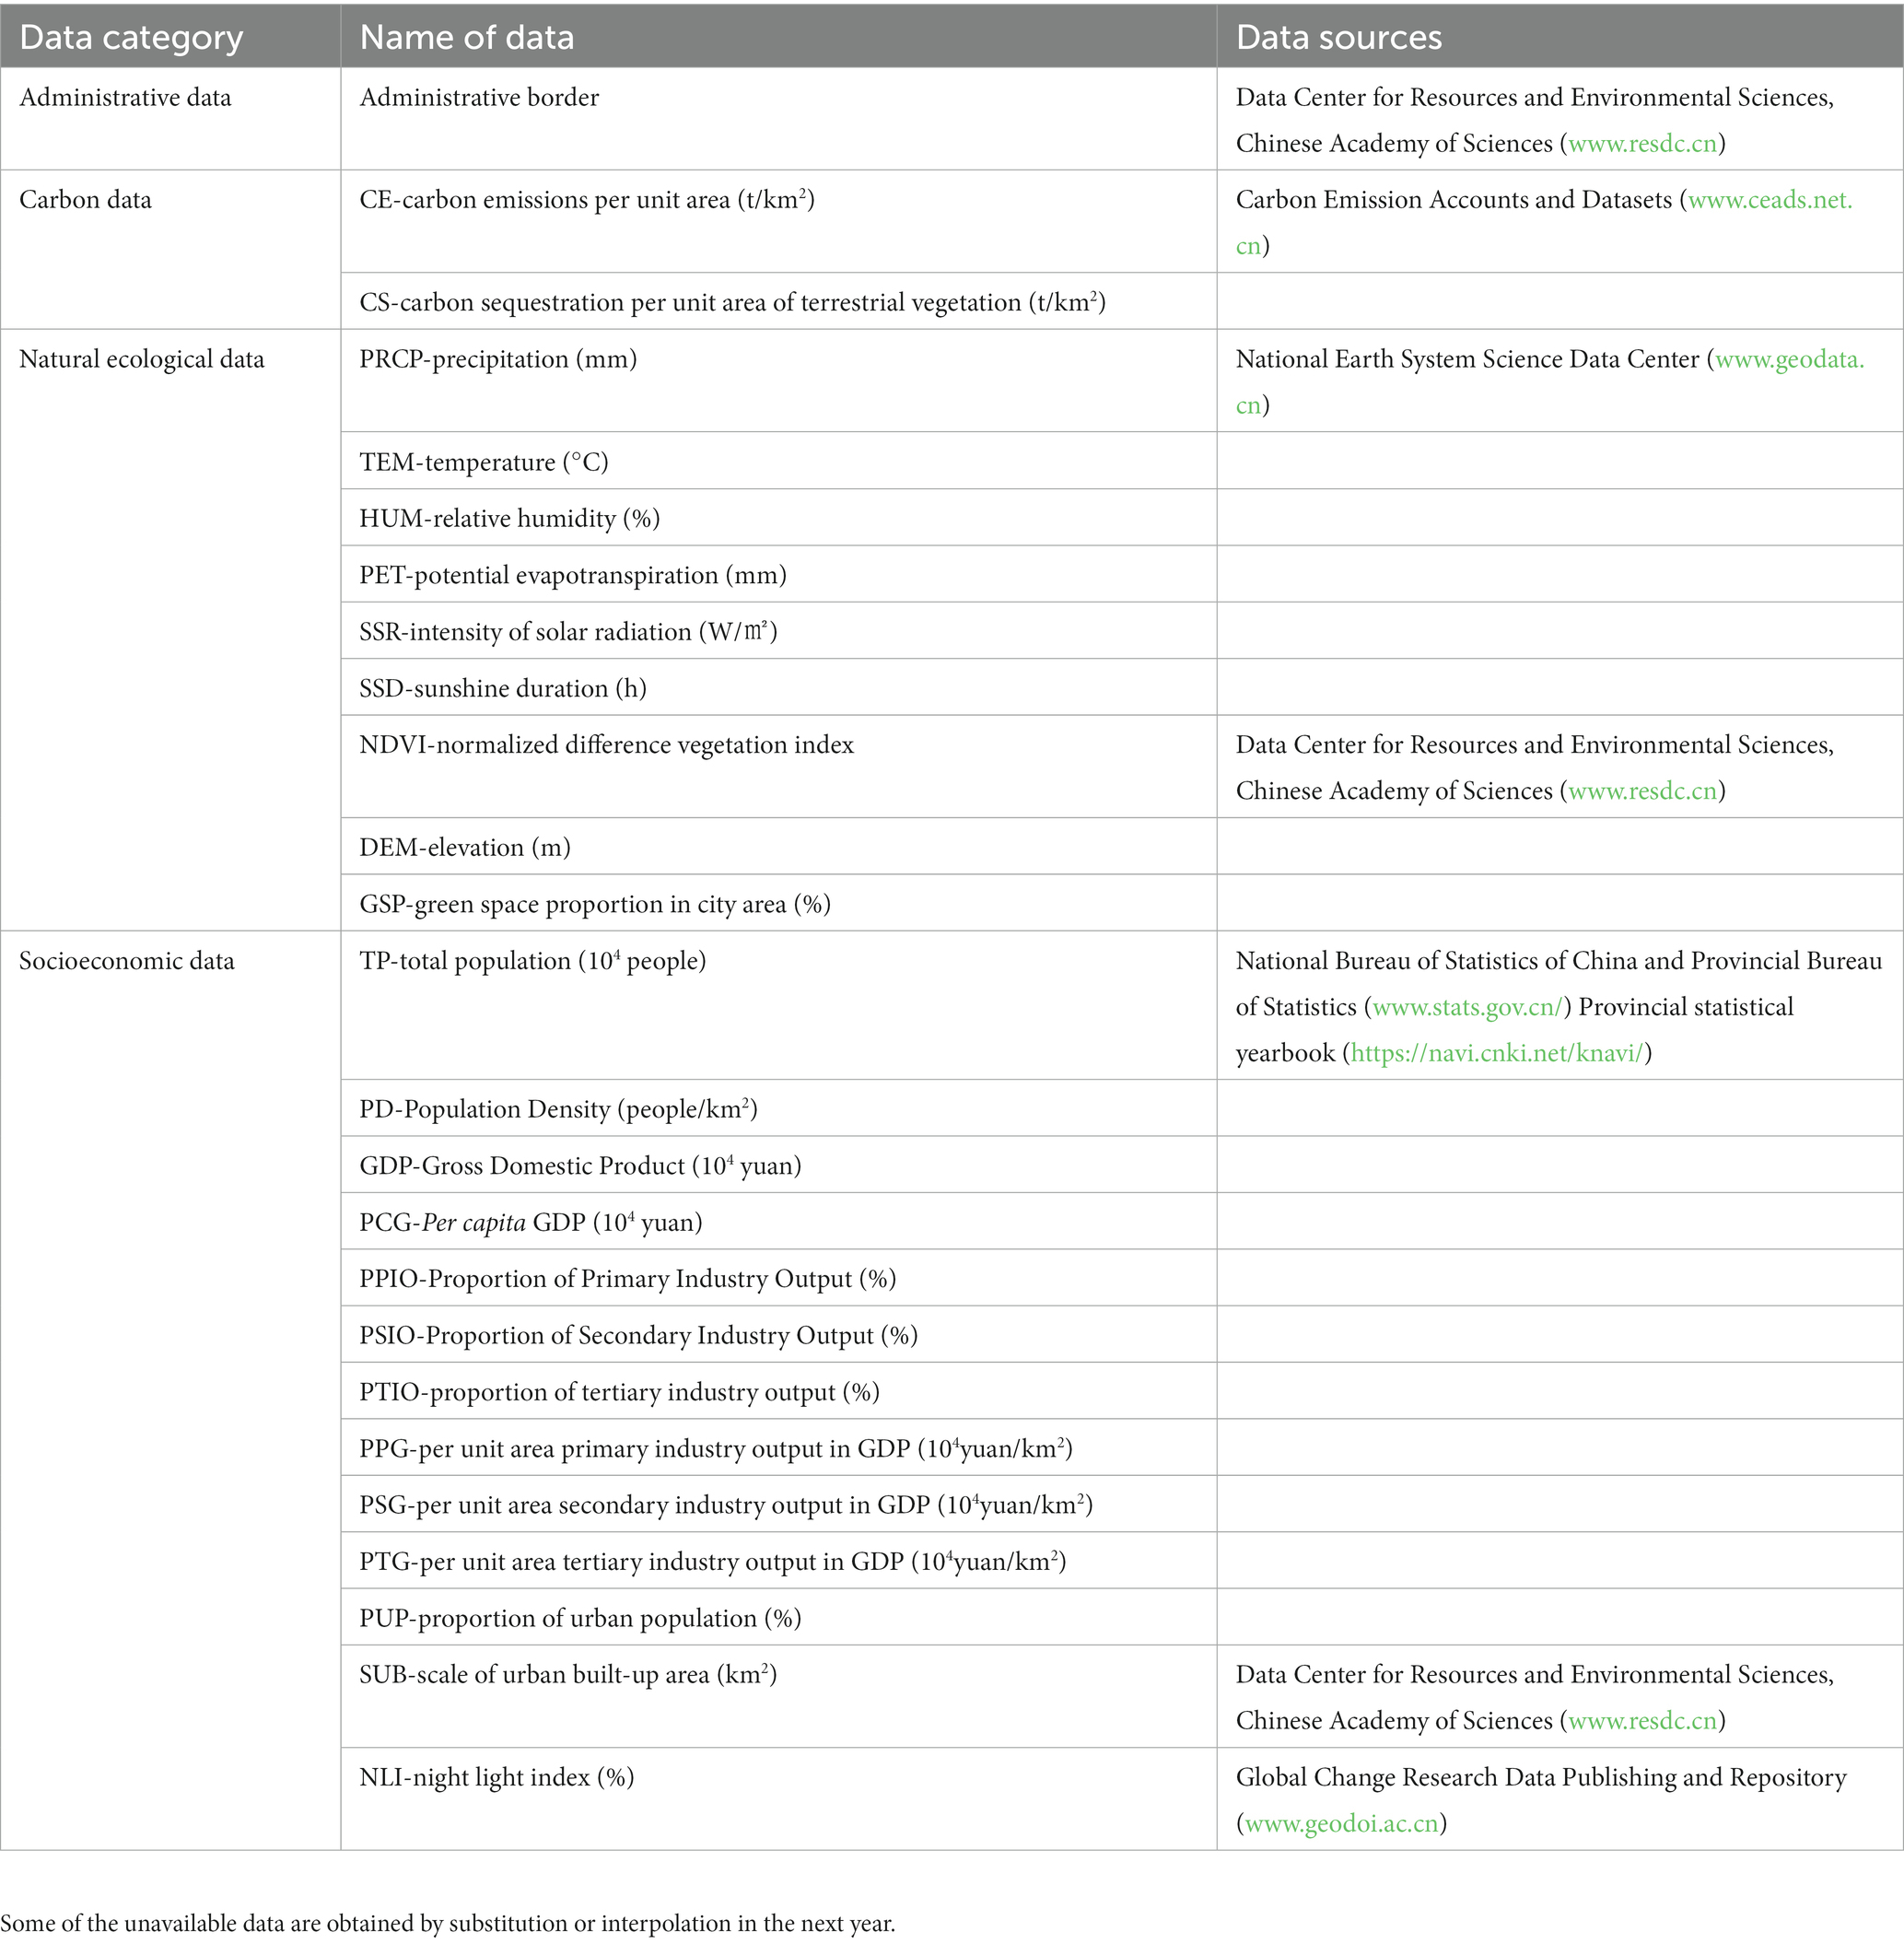
Table 1. Summary of data sources.
2.3. Research method—geographically weighted regression (GWR)
In previous studies, the OLS model is often used as a reference for the spatial regression model (GWR; Brunsdon et al., 1996; Wang et al., 2005; Windle et al., 2010; Xie and Ng, 2013; Huilei et al., 2017; Kontokosta and Tull, 2017; Dadashpoor et al., 2019; Chang Chien et al., 2020; Zhu et al., 2020; Xu et al., 2021; Xu and Zhang, 2021; Yu et al., 2022). In this study, in addition to using OLS model, we also added Partial Least Squares Regression (PLSR) into the comparison (Wold et al., 2001; Prasad et al., 2008; Jia, 2009; Abdi, 2010; Trap et al., 2013; Yan et al., 2013; Zhang et al., 2015; Liu et al., 2020; Yan et al., 2020).
We used GWR to construct spatial regression models on carbon emission and carbon sequestration to explore the spatial mechanisms of each driving factor on the response variables. The equations of the GWR model can be expressed as follows (Wang et al., 2014, 2021a):
Where represents the 352 administrative units, indicates the locations of the administrative units, is the carbon emission per unit area, represents the carbon sequestration per unit area of terrestrial vegetation, and are the number of predictor variables, and are the constants, and are the regression coefficients, is the predictor variable of carbon emission, is the predictor variable of carbon sequestration by terrestrial vegetation, and is the random error. In this study, a Gaussian weight function was used to determine the regression coefficient of sample whose equation can be expressed as follows (Wang et al., 2021a):
Where is the transpose matrix and is the distance weight matrix at , which represents the spatial weights between point and the observation points in the model. The calculations were performed using ArcGIS10.4.
3. Results
3.1. Spatial and temporal characteristics of the carbon emission per unit area and carbon sequestration per unit area of terrestrial vegetation
From 2000 to 2017, the Carbon Emission per Unit Area (CE) of prefecture-level cities in mainland China showed a significant upward trend on the whole, and CE of prefecture-level cities increased from 352127.4 t/km2 in 2000 to 1016977.5 t/km2 in 2017. In terms of spatial distribution, CE presents the distribution characteristics of “high in the east and low in the west,” and its high value prefecture-level cities are concentrated in Northern Region of China, Eastern Region of China and Southern Region of China (Figure 1). In addition, CE presents a significant spatial aggregation feature in the whole range. In the North, CE gradually decreases from the Beijing-Tianjin-Hebei region as the center to the surrounding areas, while in the South, the main high-value centers are mainly the Yangtze River Delta and the Pearl River Delta, and such areas are gradually increasing over time.
During the study period, Carbon Sequestration per Unit Area of Terrestrial Vegetation (CS) showed a steady increase trend. It increased from 611123.5 t/km2 in 2000 to 709379.8 t/km2 in 2017. The overall spatial distribution features are high in the east and low in the west and high in the South and low in the North. The high value prefecture-level cities are concentrated in Northeast Region of China, Eastern Region of China, Southern Region of China and Southwest Region of China (Figure 1).
On this basis, we use Global Moran’s I index to conduct spatial autocorrelation analysis of Carbon Emission and Carbon Sequestration. Table 2 reports the global Moran’s I index of PM2.5 from 2005 to 2018. All year indexes are positive and significant at the 1% level. The distribution of Carbon Emission and Carbon Sequestration showed positive spatial correlation (Wu et al., 2020).
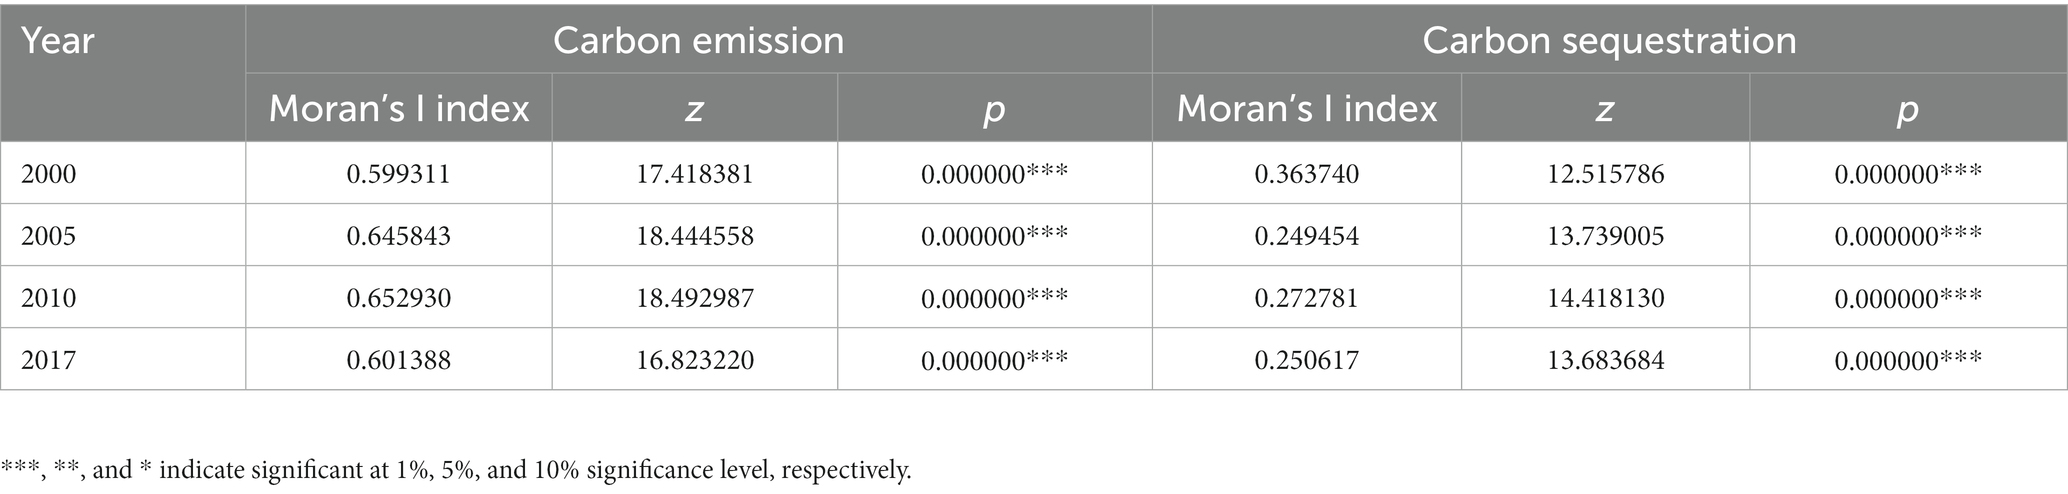
Table 2. Global Moran’s I of carbon emission and carbon sequestration.
3.2. OLS analysis of global drivers
In this study, we used the OLS (Ordinary Least Squares) model to construct the regression models for carbon emission and sequestration in 2000, 2005, 2010, and 2017. Moreover, we verified the robustness probability (Robust Pr) and the collinearity (VIF) of each predictor variable with Robust Pr < 0.05 and VIF < 7.5 as the criteria. The mean R2 of the four carbon emission models was 0.769318, and the mean adjusted R2 was 0.753893; the average AICc value was 341.988046 (Table 3). The mean R2 of the four carbon sequestration models was 0.532214, and the mean adjusted R2 was 0.500932; the average AICc value was 778.761457 (Table 3). According to the results of the OLS testing, we concluded that although relevancies between carbon emission and carbon sequestration and a variety of driving factors, there was a lack of robustness in the variables and the collinearity between them was also extremely high (Table 4).
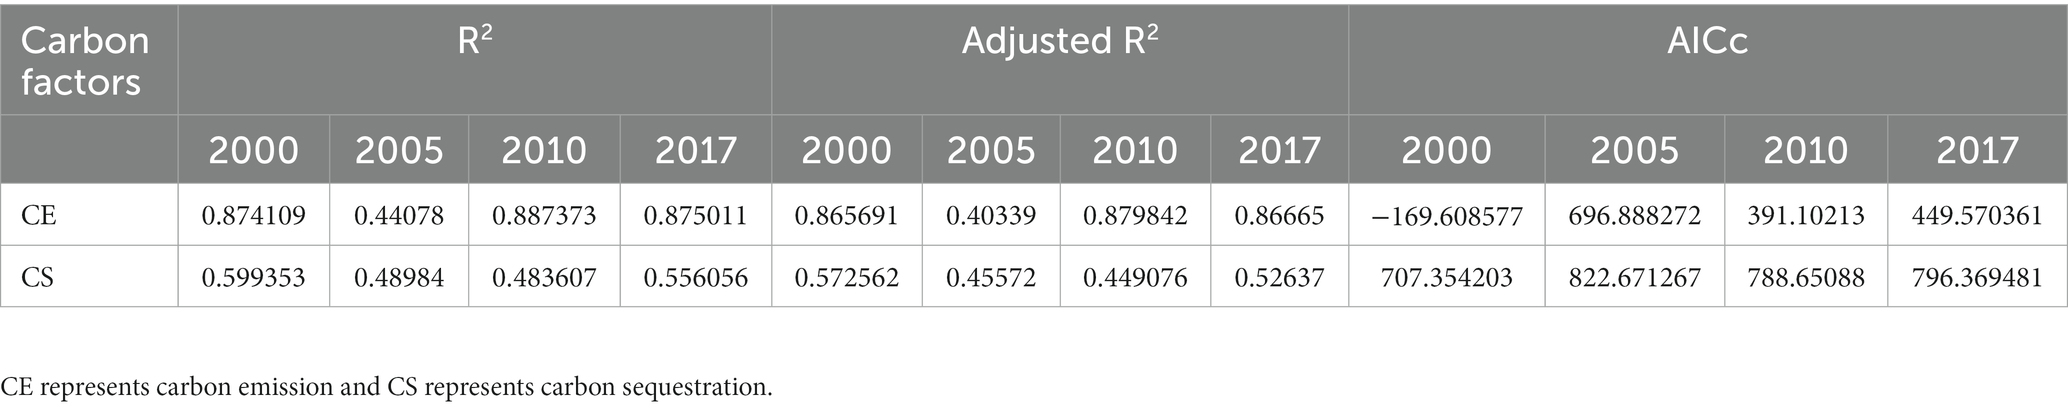
Table 3. OLS analysis results for all carbon factors.
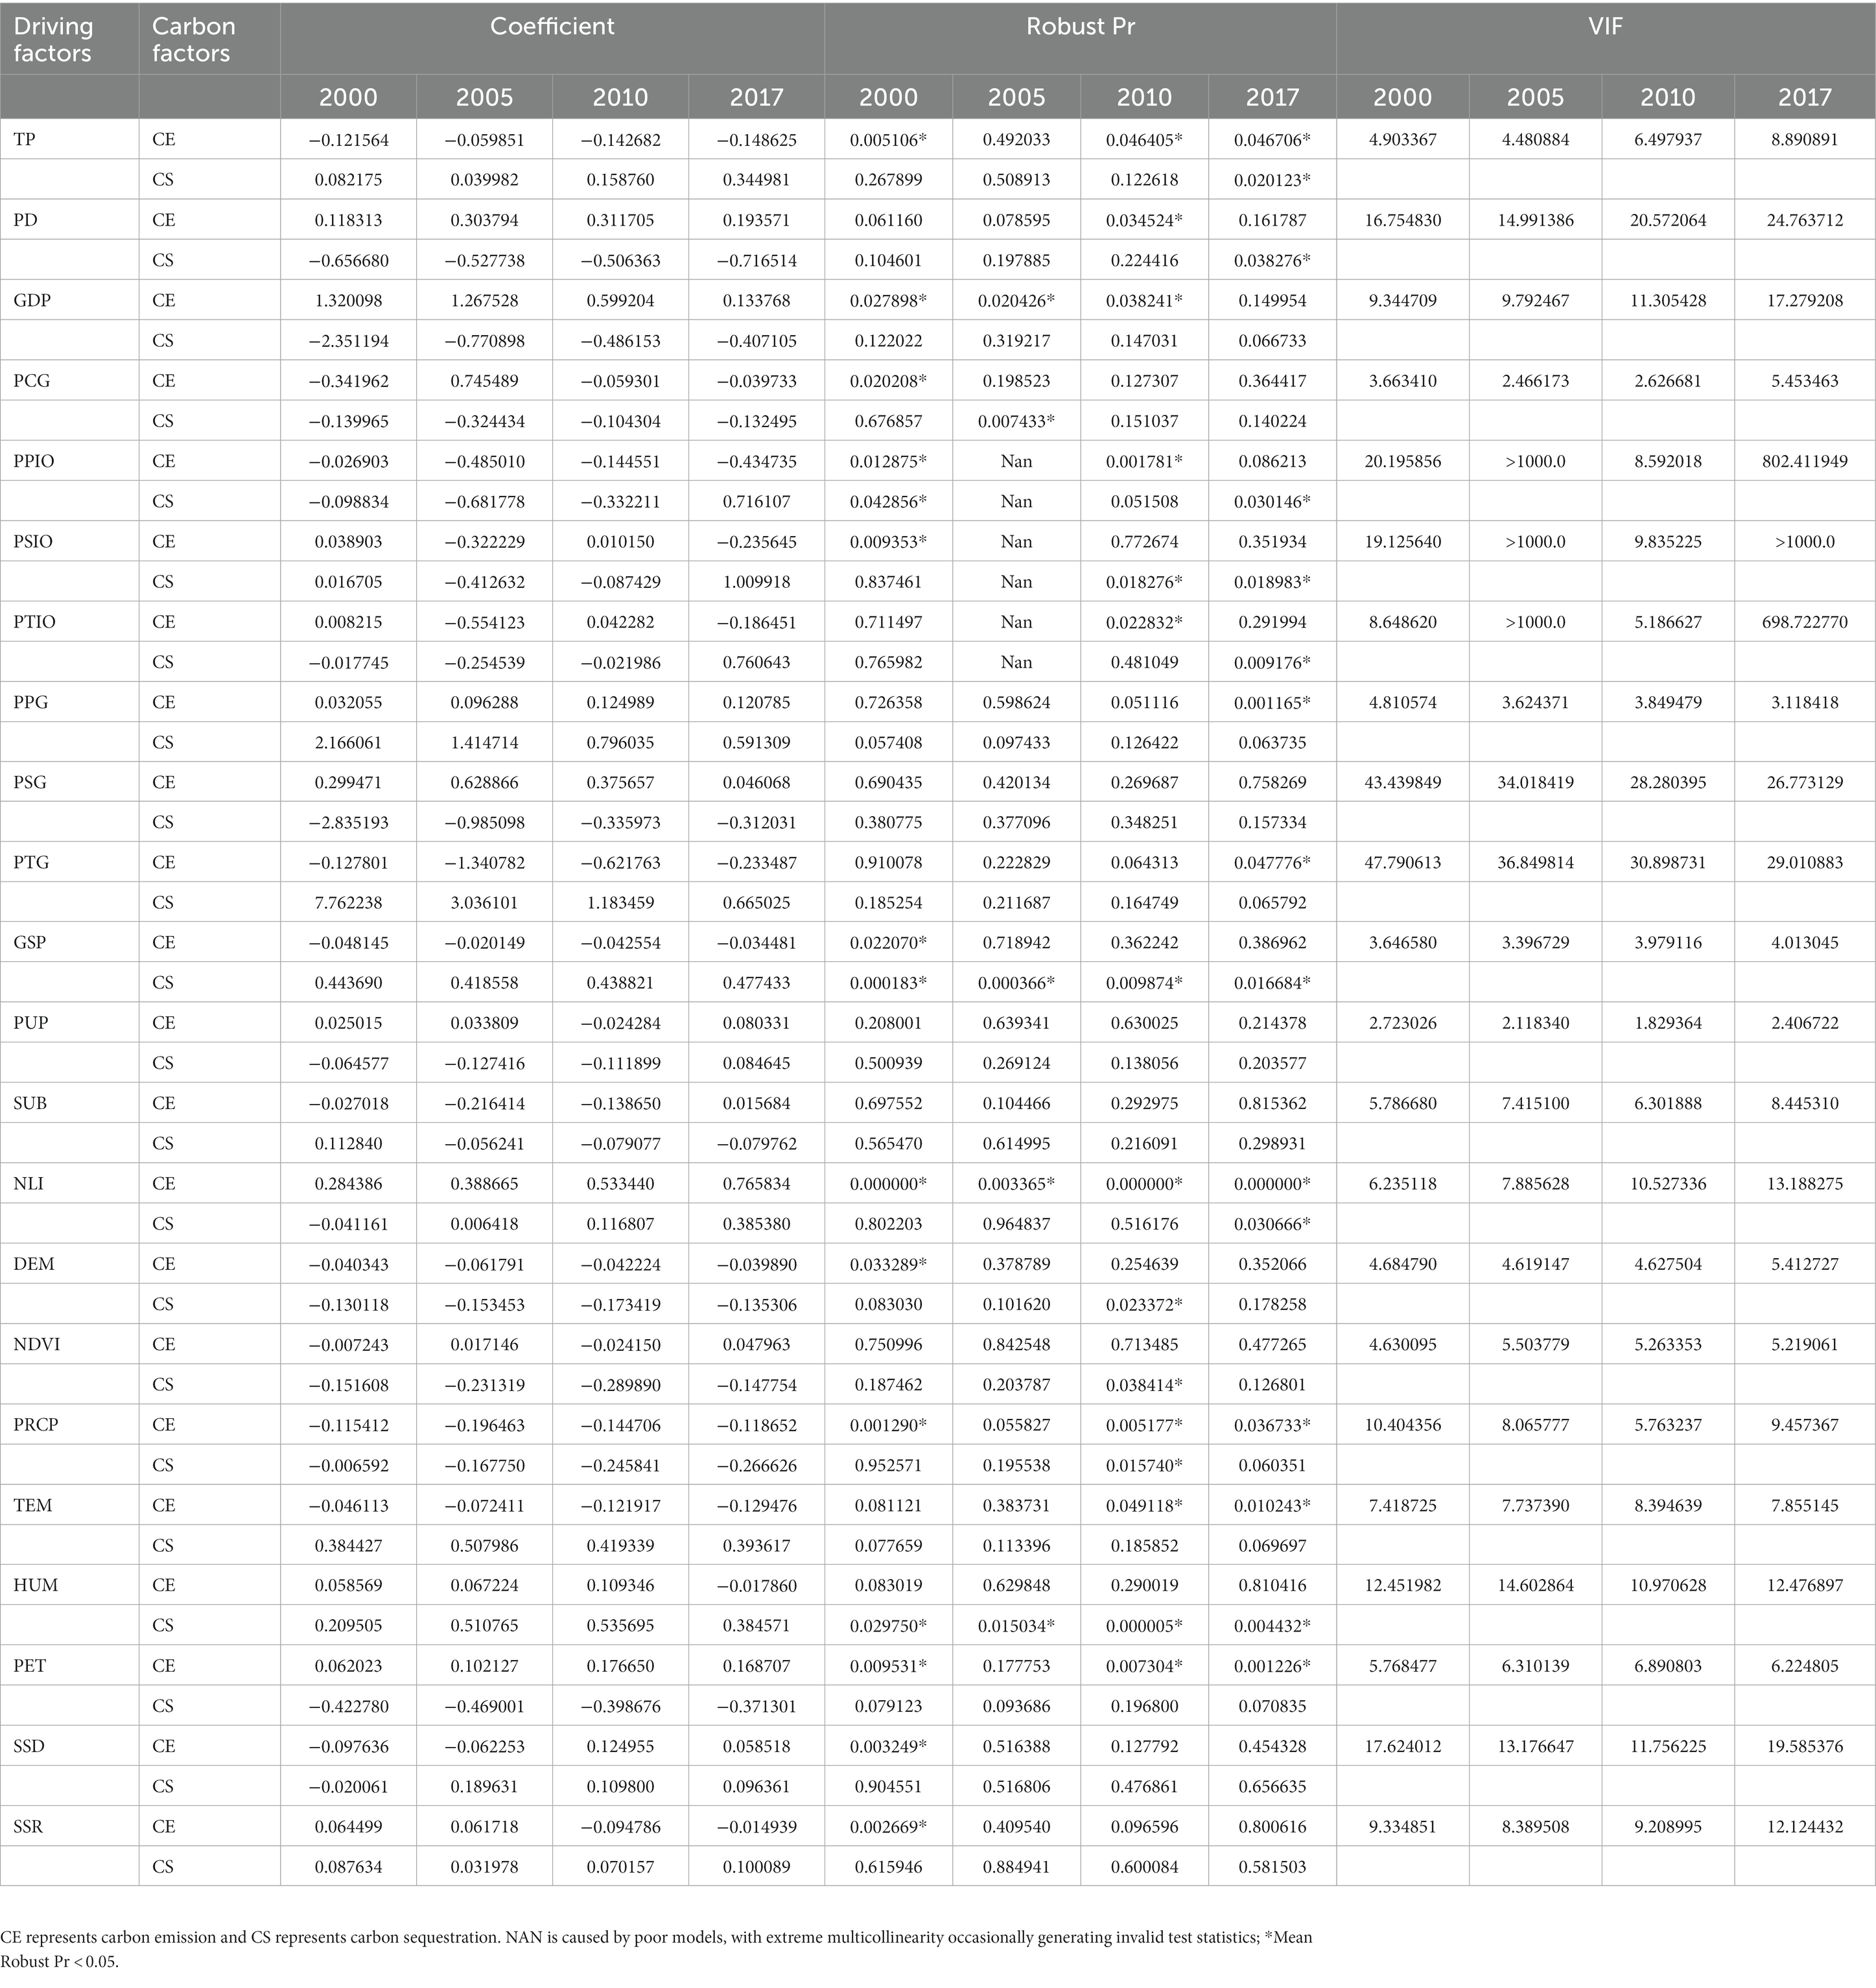
Table 4. OLS analysis results for all driving factors.
3.3. Model construction for determining the carbon emission and carbon sequestration per unit area of terrestrial vegetation
To address the problems of insufficient robustness and high collinearity of variables in the OLS model, we used exploratory regression (ER) analysis to conduct preliminary screening of the driving factors (Wang Z. et al., 2012; Feng et al., 2015; Wang and Liu, 2017; Li et al., 2019; Ning et al., 2021). The ER analysis combined with results of previous studies and experiences helped us delete 13 variables in the carbon emission model and 12 variables in the carbon sequestration model, which had insufficient robustness and high collinearity. Consequently, a more stable regression model was developed, and the final variables (driving factors) considered in the model are shown in Table 5.
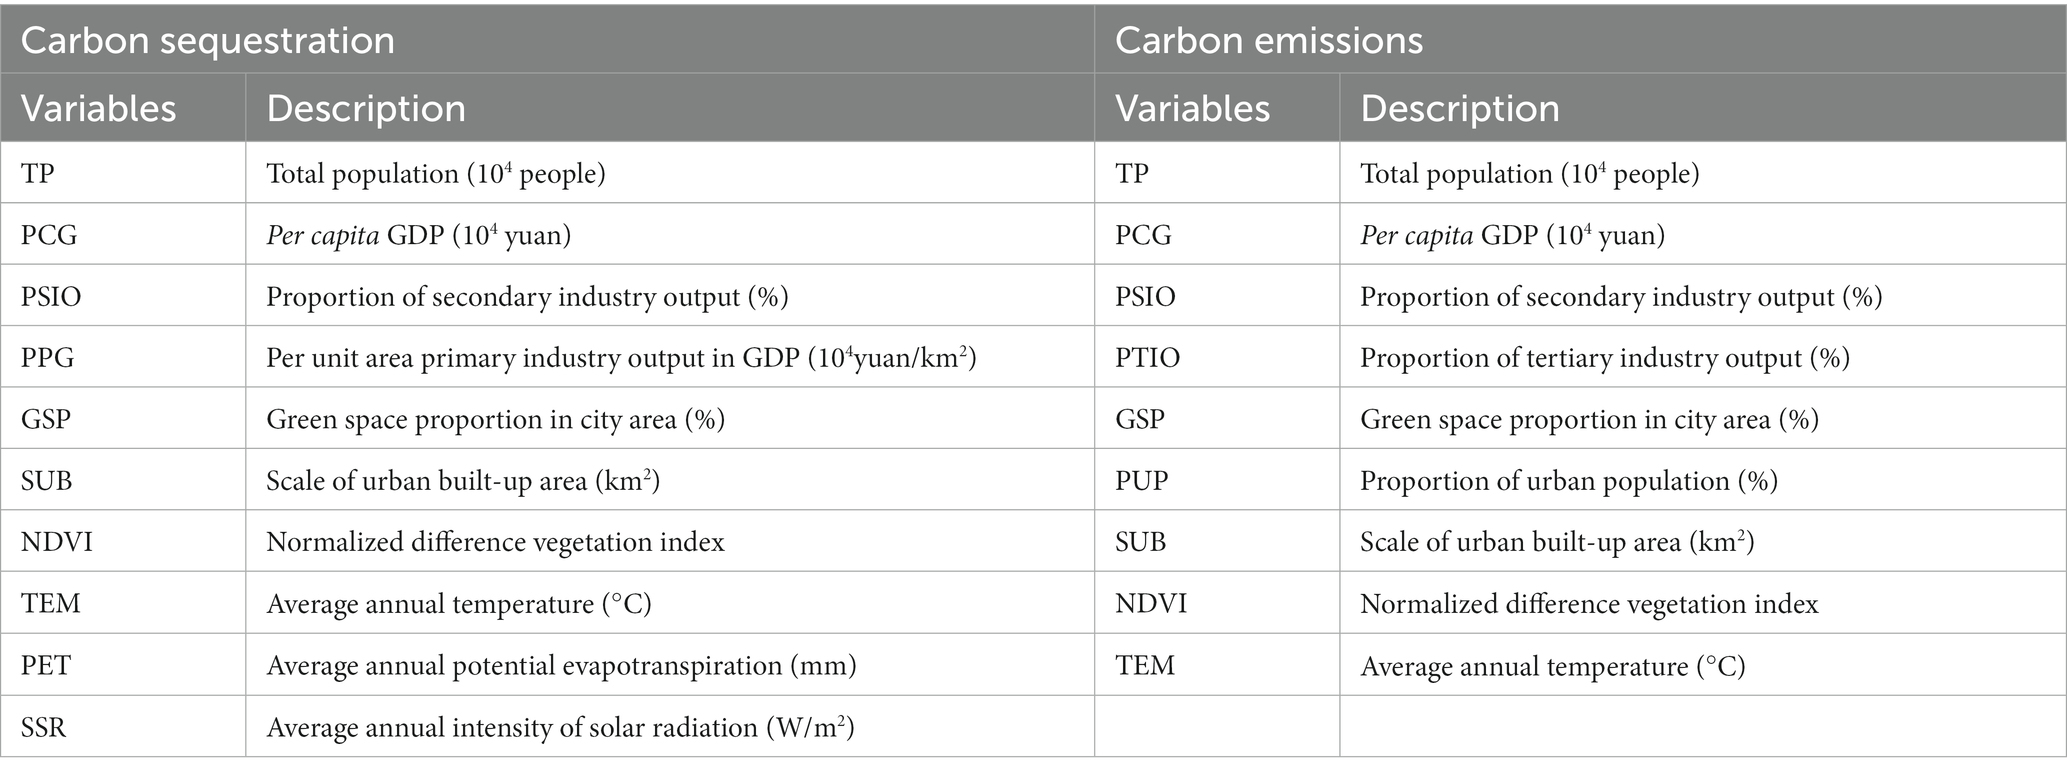
Table 5. Driving factors of carbon emission per unit area and carbon sequestration per unit area of terrestrial vegetation.
Subsequently, analyses were performed using the PLSR (Partial Least Squares Regression) model and the optimized OLS model. We found that the R2Y and Q2 of the PLSR model (0.4272 and 0.3345, respectively) were much lower than those of the OLS model. However, although OLS proved superior for our research purpose, some panel data still failed the robustness probability test (Robust Pr < 0.05; Tables 6, 7). The results suggested that there were other factors that affect the accuracy of the analytical results such as the spatial heterogeneity of the variables (Song et al., 2014). Next, we used the GWR model to conduct a comparative analysis using the same variables used in OLS and PLSR. The results verified that spatial heterogeneity plays a vital role in the carbon emission and carbon sequestration processes (Table 8).
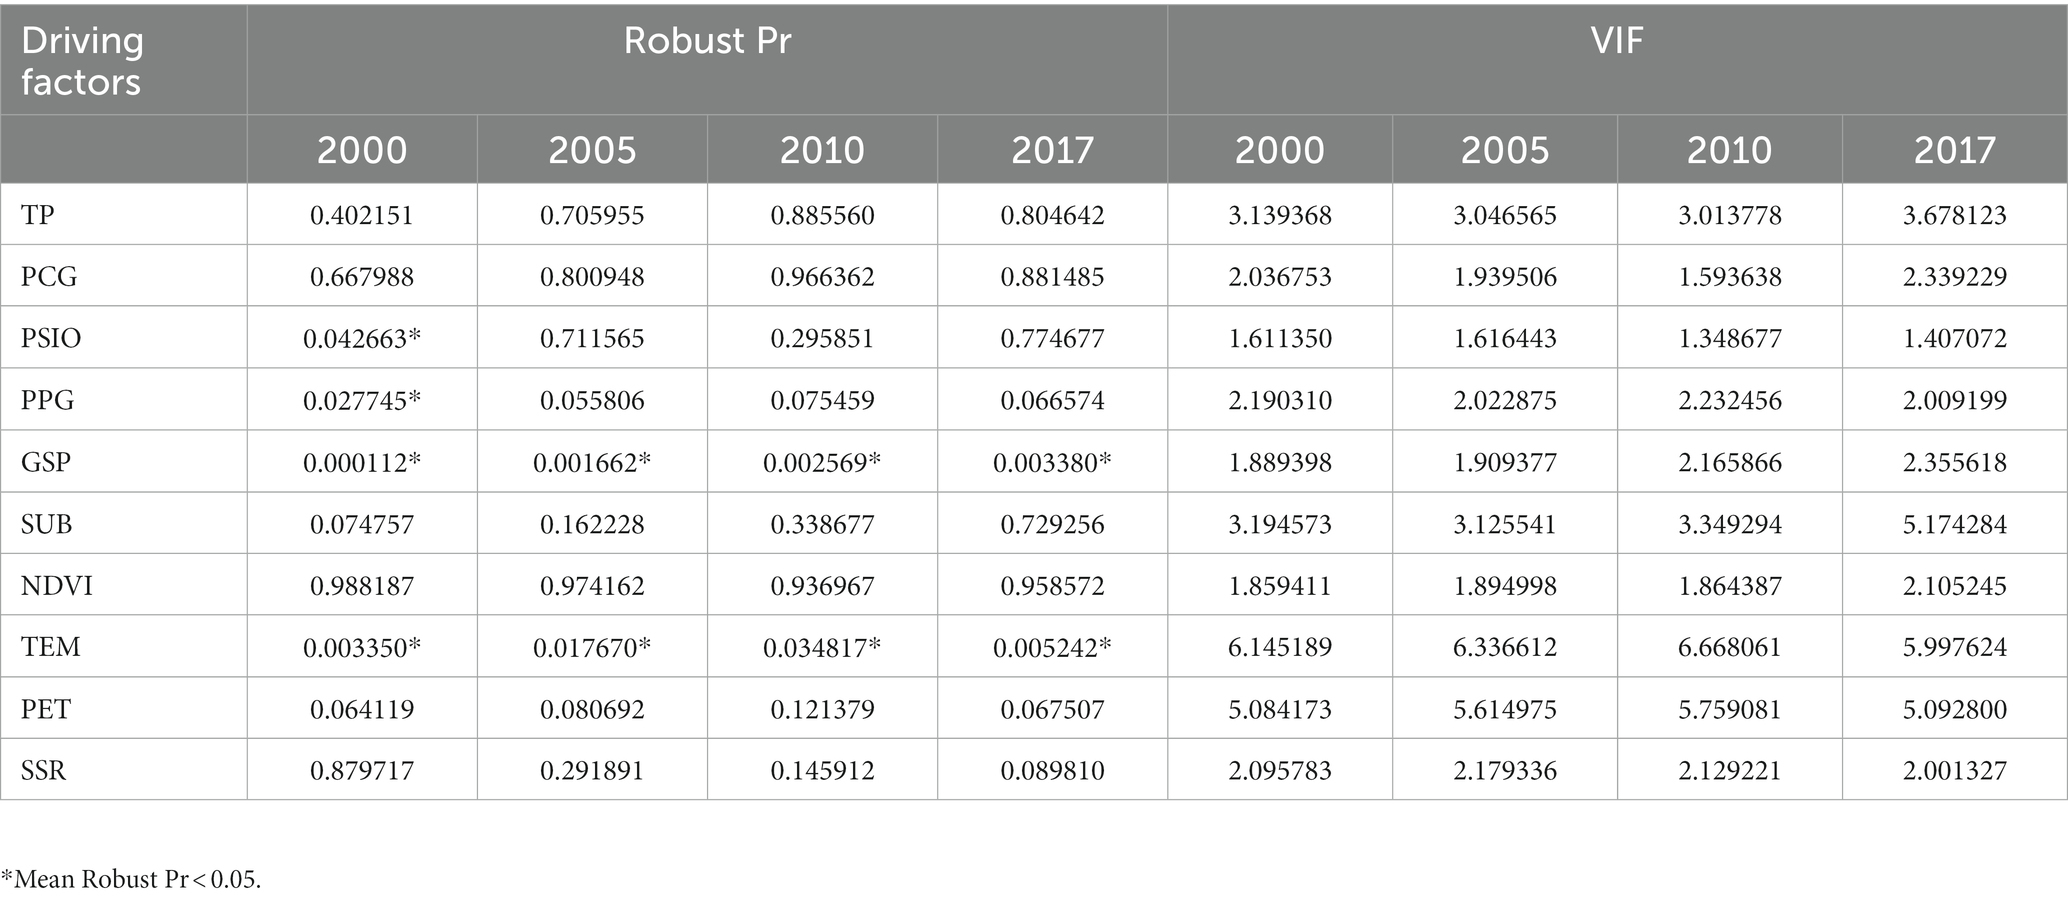
Table 6. Analysis results of the OLS model for carbon sequestration after screening.
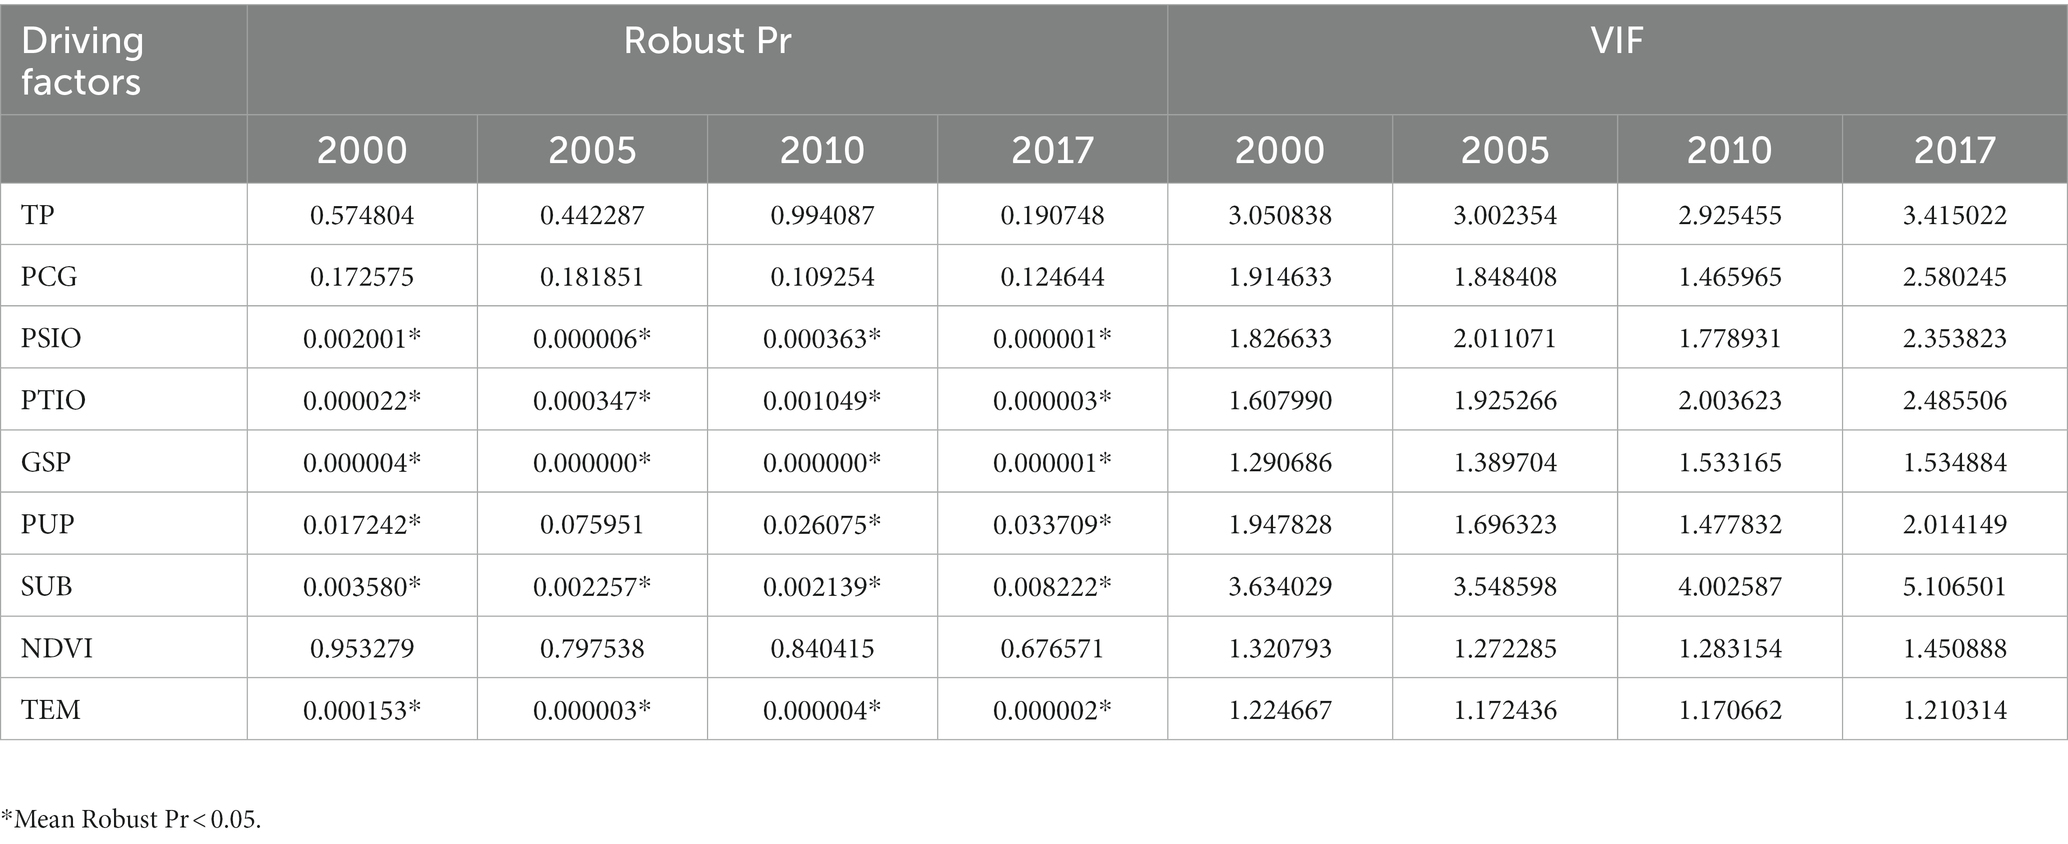
Table 7. Analysis results of the OLS model for carbon emissions after screening.
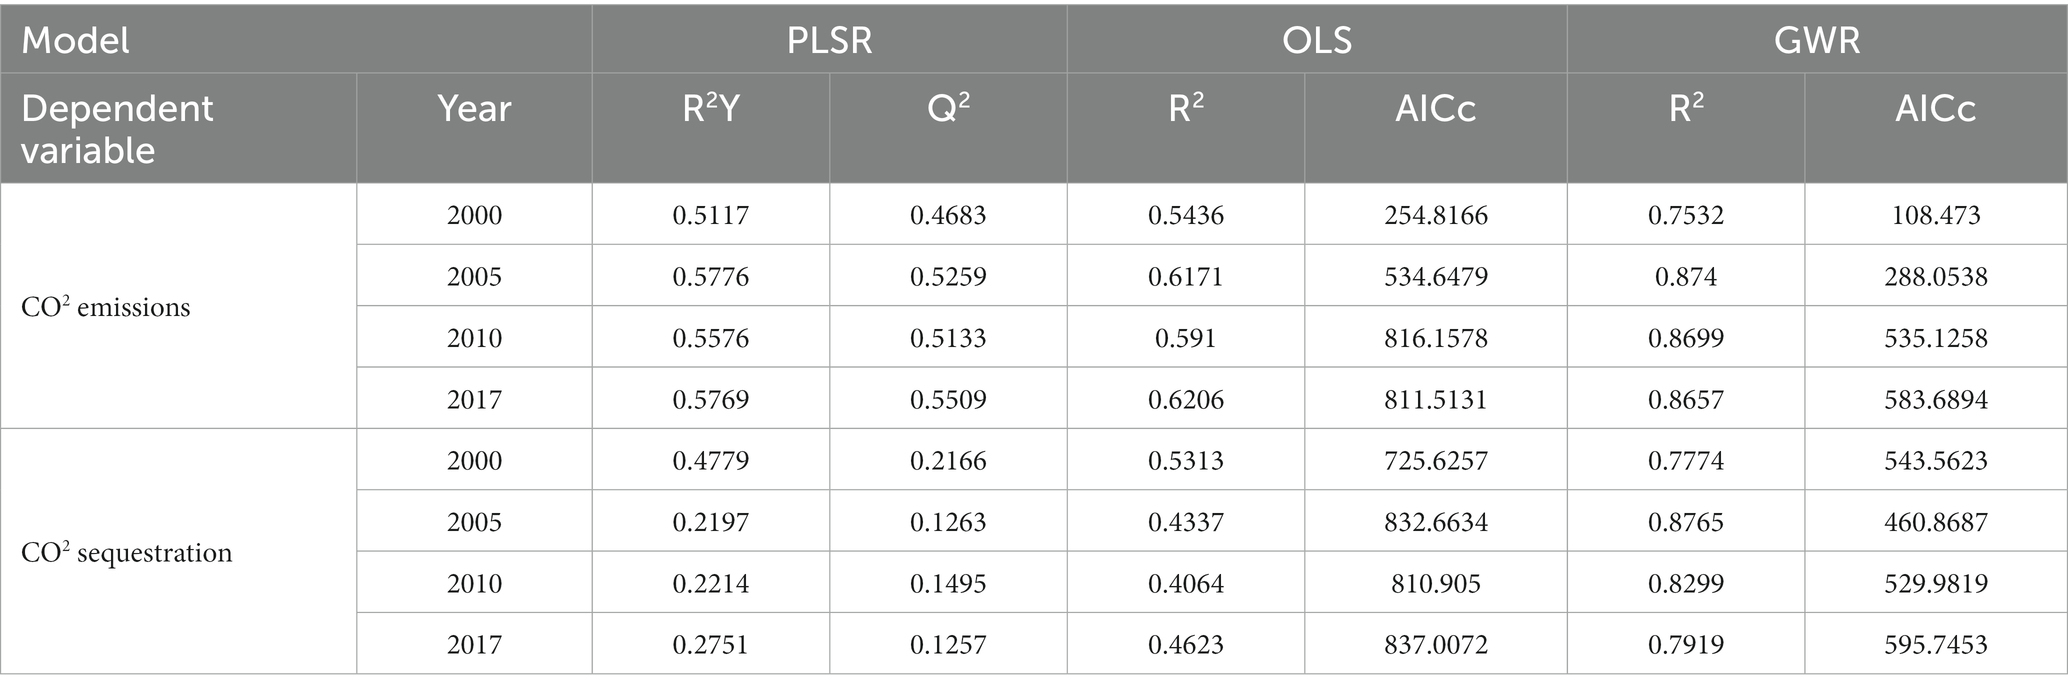
Table 8. Comparisons of PLSR, OLS, and GWR models.
3.4. Driving factors of the carbon emission per unit area based on the GWR analysis
Figures 2, 3 show that carbon emissions exhibit a negative spatial correlation with GSP and NDVI in most regions of China, with GSP and NDVI being strong driving forces. In contrast, TEM in most areas showed a positive correlation with carbon emission, while being a relatively weak driving force. The correlation between NDVI and carbon emission changed from positive to negative from the northwest region to the coastal area of the southeast region (Figure 2H). Eventually, areas exhibiting negative correlations between NDVI and carbon emission increased gradually; by 2017, these areas accounted for 86.36% of the prefecture-level administrative regions (Figures 2HIV). GSP showed a negative correlation with carbon emission nationwide at the beginning, with low regression coefficients being observed in the surrounding areas of the North and northwest regions. However, regions that showed positive spatial correlations between GSP and carbon emission gradually emerged primarily in the Eastern part of northwest China and the Western part of North China (Figure 2E). Meanwhile, TEM and carbon emission showed a positive spatial correlation, and areas with high regression coefficients were mainly clustered in the North-Central part of the east region. In some parts of the northwest region, TEM and carbon emission exhibited a negative spatial correlation (Figure 2I).
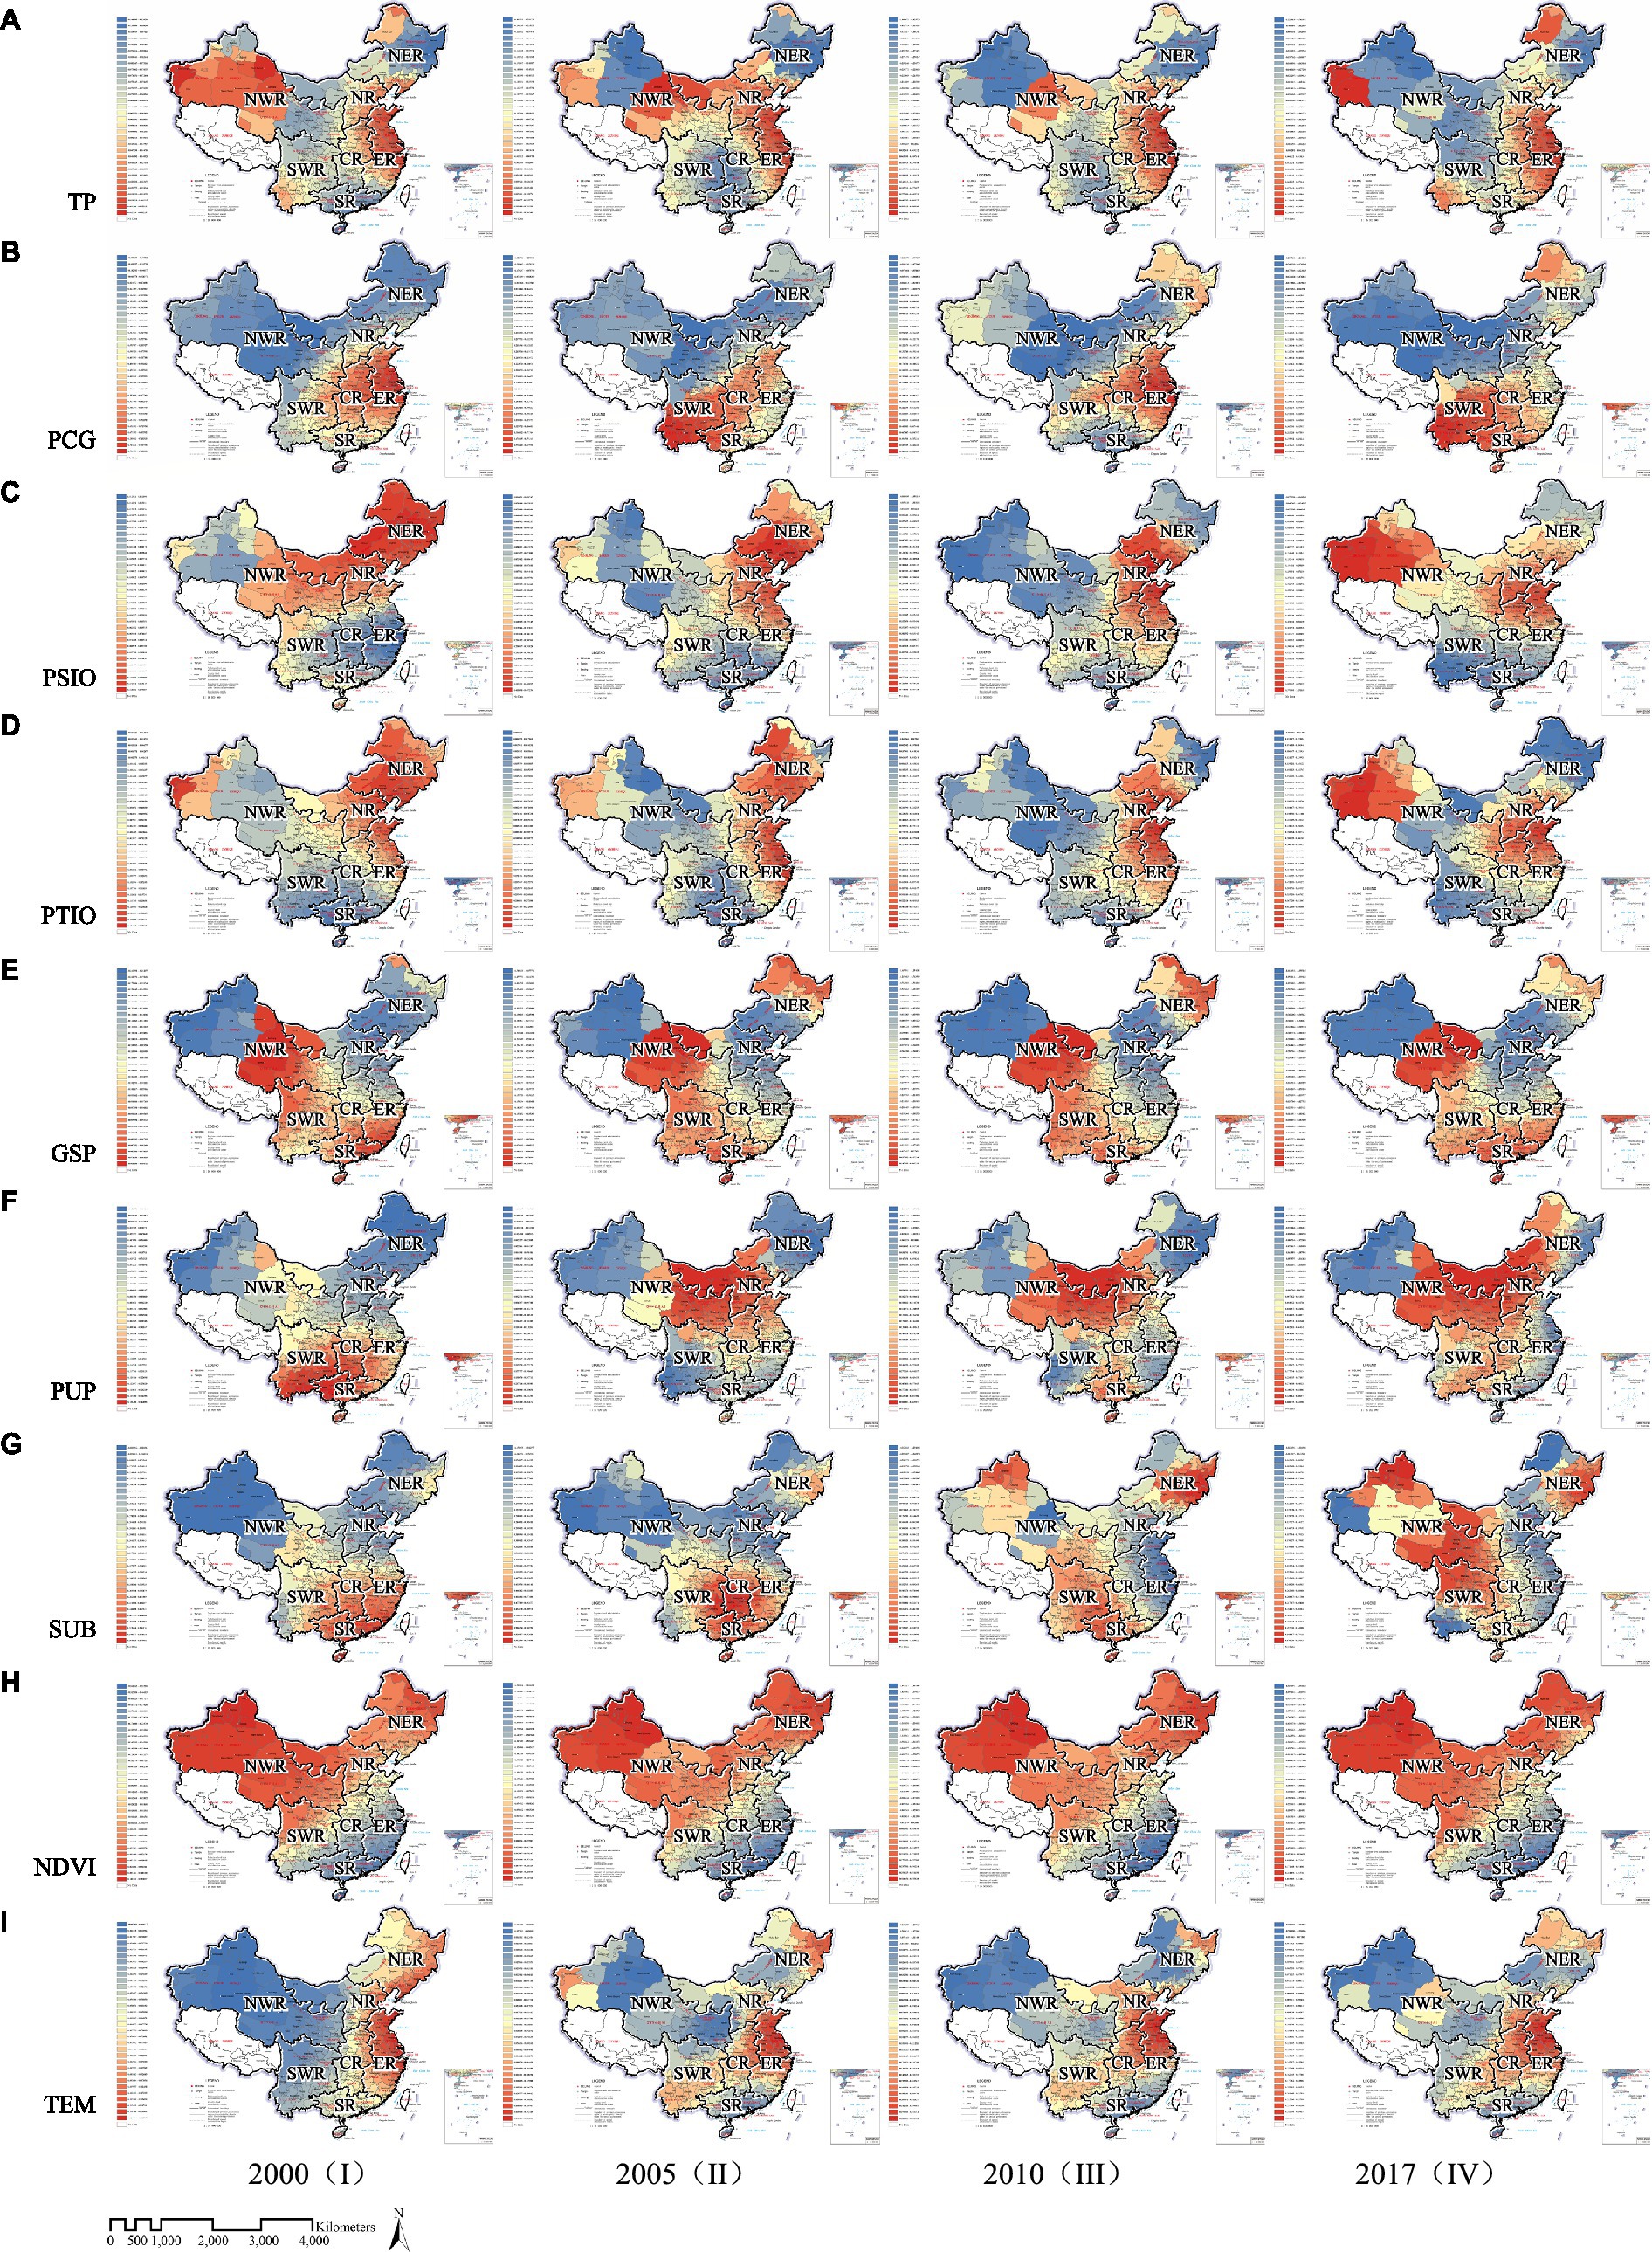
Figure 2. Spatial distributions of regression coefficients associated with carbon emission (A-I) driving factors for (I) 2000, (II) 2005, (III) 2010 and (IV) 2017 in the GWR model for 352 prefecture-level administrative regions in China.
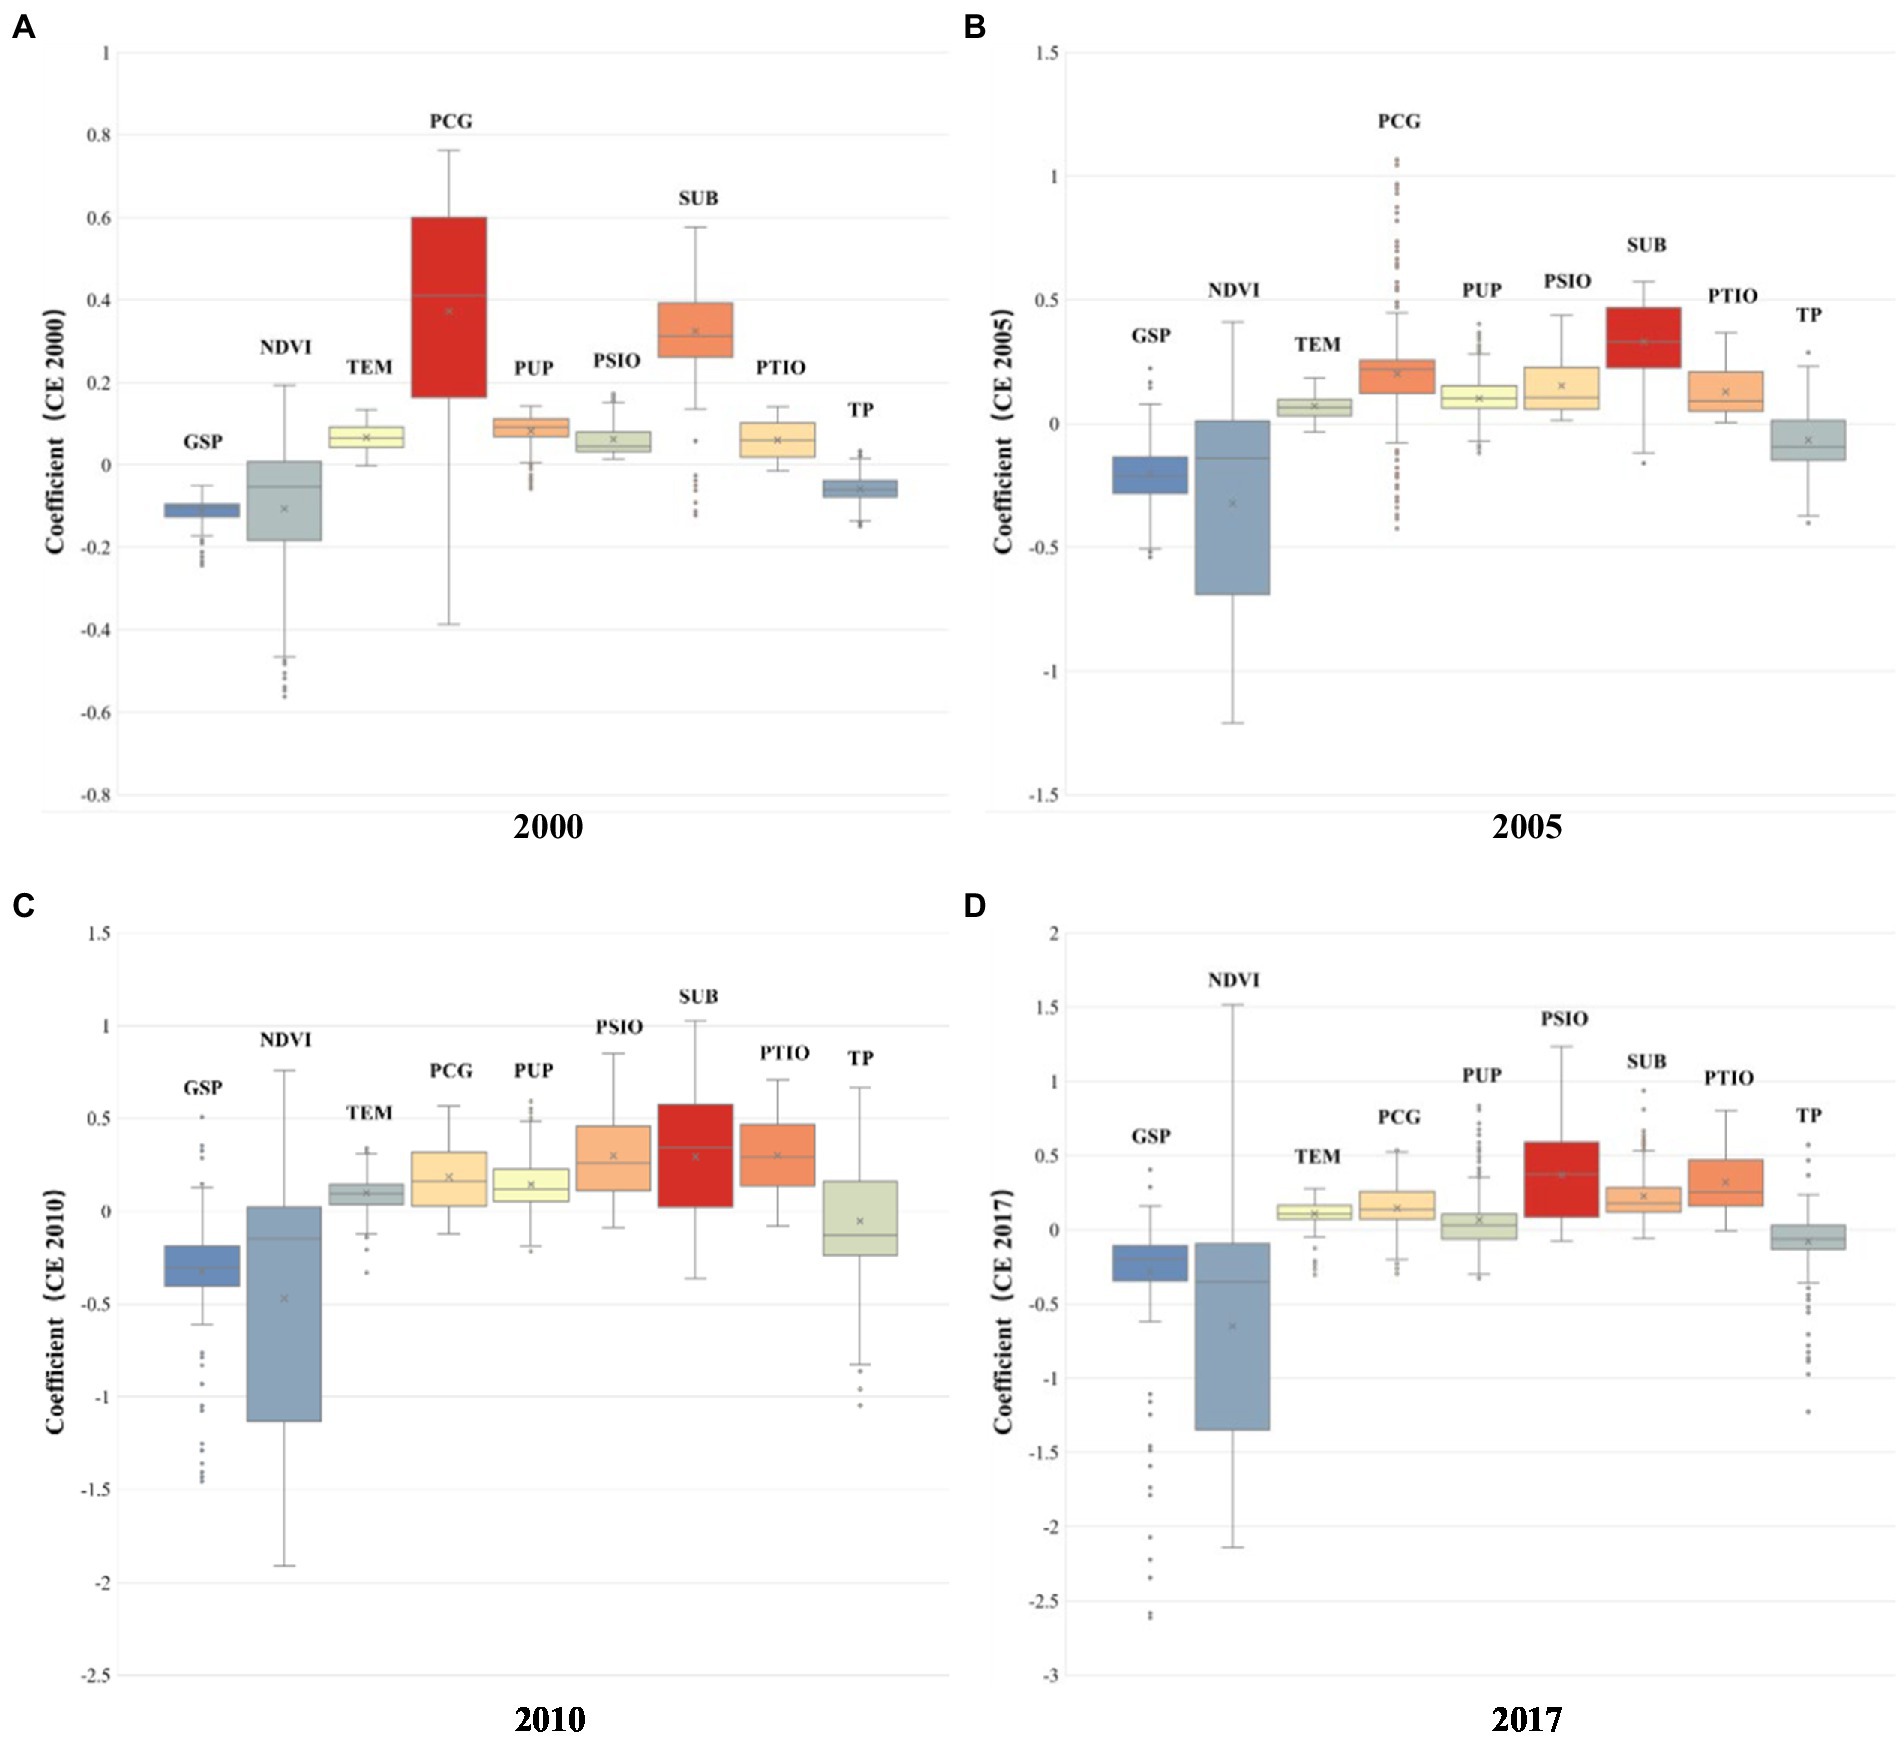
Figure 3. Summary plots of the regression coefficients associated with different carbon emission driving factors for (A) 2000, (B) 2005, (C) 2010, and (D) 2017.
Among all the socioeconomic driving factors, PCG, PSIO, PTIO, PUP, and SUB showed positive spatial correlations with carbon emission in most areas of China. TP, in contrast, showed a negative correlation with carbon emission. Meanwhile, PCG, PSIO, and SUB were the strongest driving forces. Gradually, the negative correlation between TP and carbon emission showed a weakening trend nationwide. Low regression coefficients were mainly observed in the Eastern part of the northeast region, South region, and the Central and southwest regions; meanwhile, high regression coefficients were observed in the Eastern Central region and east region (Figure 2A). Although PCG was positively correlated to carbon emission, its driving power decreased over time. High regression coefficients were observed between PCG and carbon emission mainly in the northeast and southeast regions, whereas the Eastern northwest region and Western North region showed a negative correlation (Figure 2B). PSIO and PTIO showed very similar positive spatial correlation patterns with carbon emission, and the correlation exhibited a strengthening trend over time. The regression coefficient increased significantly from 2000 to 2010 in the North and the northeast regions, and the Eastern part of the northwest region gradually developed to be the region with the highest regression coefficient in China from 2010 to 2017. Meanwhile, regions exhibiting negative correlations between PSIO/PTIO and carbon emission started to appear. PSIO and carbon emission were significantly negatively correlated in the South and southwest regions, while the negative correlation between PTIO and carbon emission was observed in the South and Western parts of the Southwest Region (Figures 2C,D). The positive correlation pattern between PUP and carbon emission changed over time, and the areas with a high regression coefficient gradually shifted from the South and southwest regions to the Eastern part of the northwest region and North region. PUP and carbon emission were locally negatively correlated in several areas, such as the northeast region and the Western part of the northwest region (Figure 2E). The positive correlation pattern between SUB and carbon emission changed significantly over time, and the area with the high regression coefficient shifted from the southeast Coast to northwest and northeast regions in 2000.
3.5. Results of carbon sequestration per unit area of terrestrial vegetation based on GWR spatial regression model
Based on the long-term results shown in Figures 4, 5, PPG, GSP, and TEM showed positive correlations with carbon sequestration (Figures 4D–H), whereas PET showed a negative correlation with carbon sequestration (Figure 4I). NDVI and carbon sequestration showed distinguishable differences between the positively and negatively correlated areas, and the driving force of NDVI and GSP toward carbon sequestration gradually increased over time (Figure 4G). However, the driving force of PCG and PPG toward carbon sequestration decreased dramatically over time (Figures 4B,D).
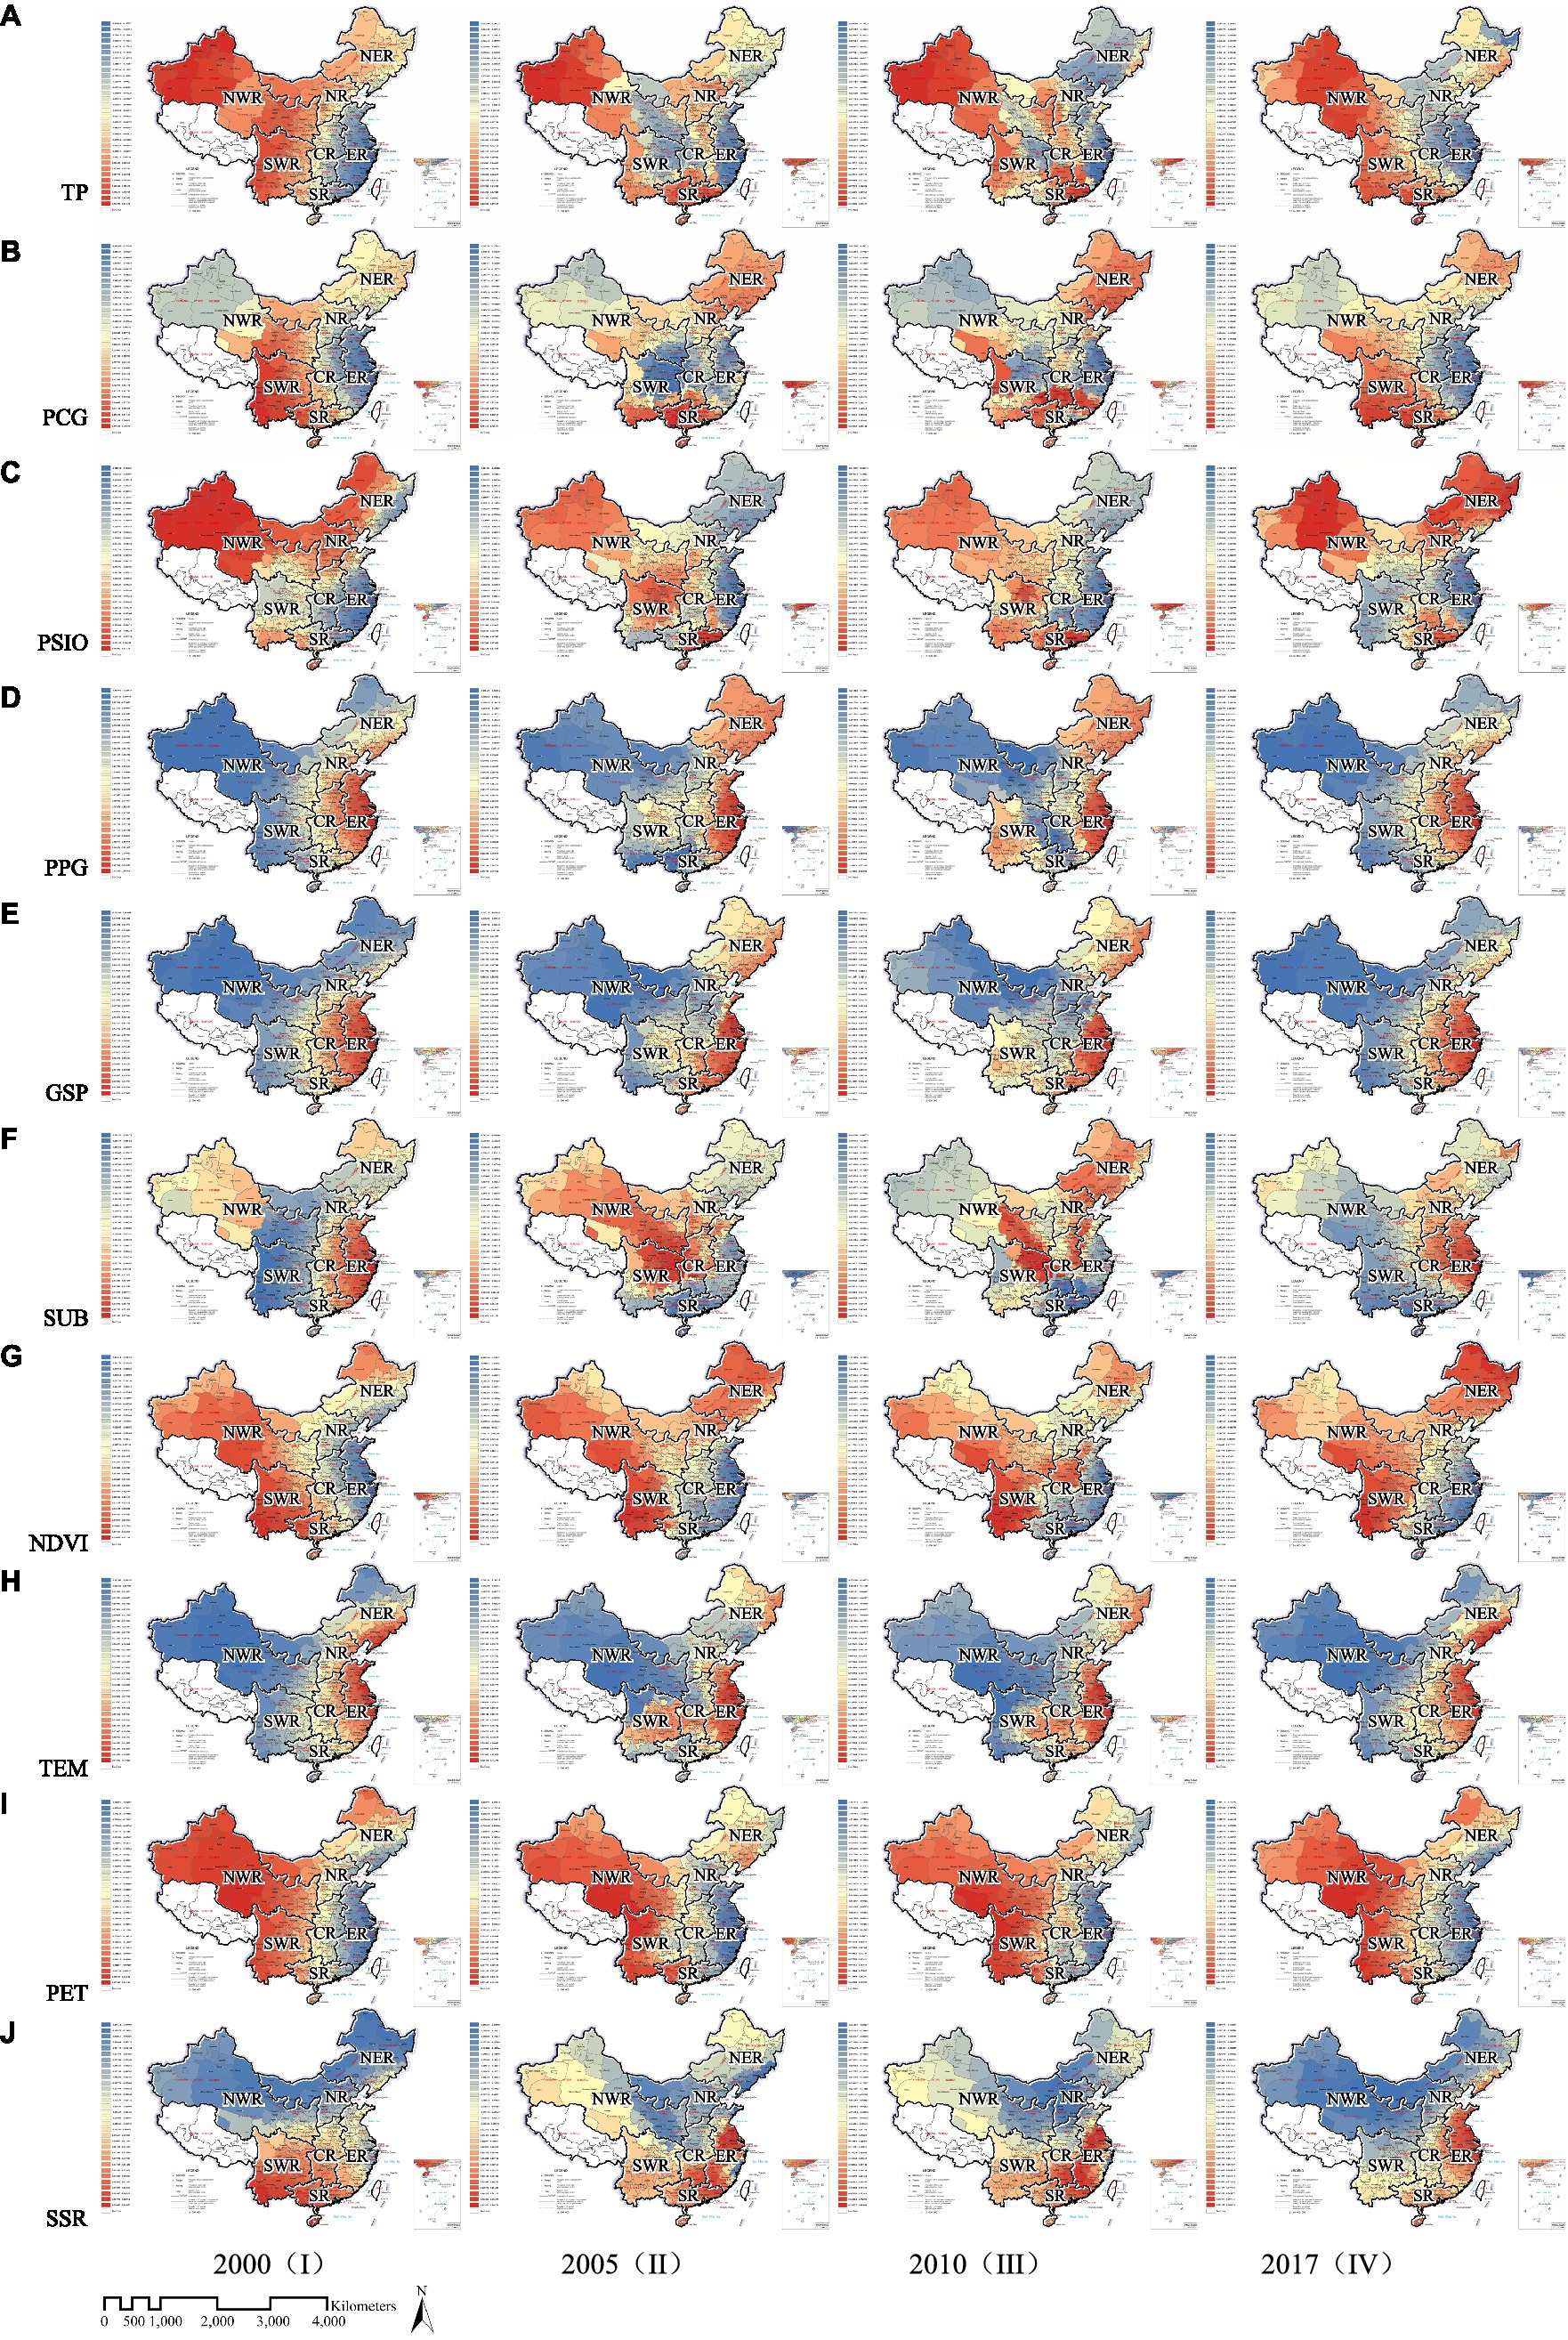
Figure 4. Spatial distributions of regression coefficients associated with carbon sequestration (A-J) driving factors for (I) 2000, (II) 2005, (III) 2010 and (IV) 2017 in the GWR model for 352 prefecture-level administrative regions in China.
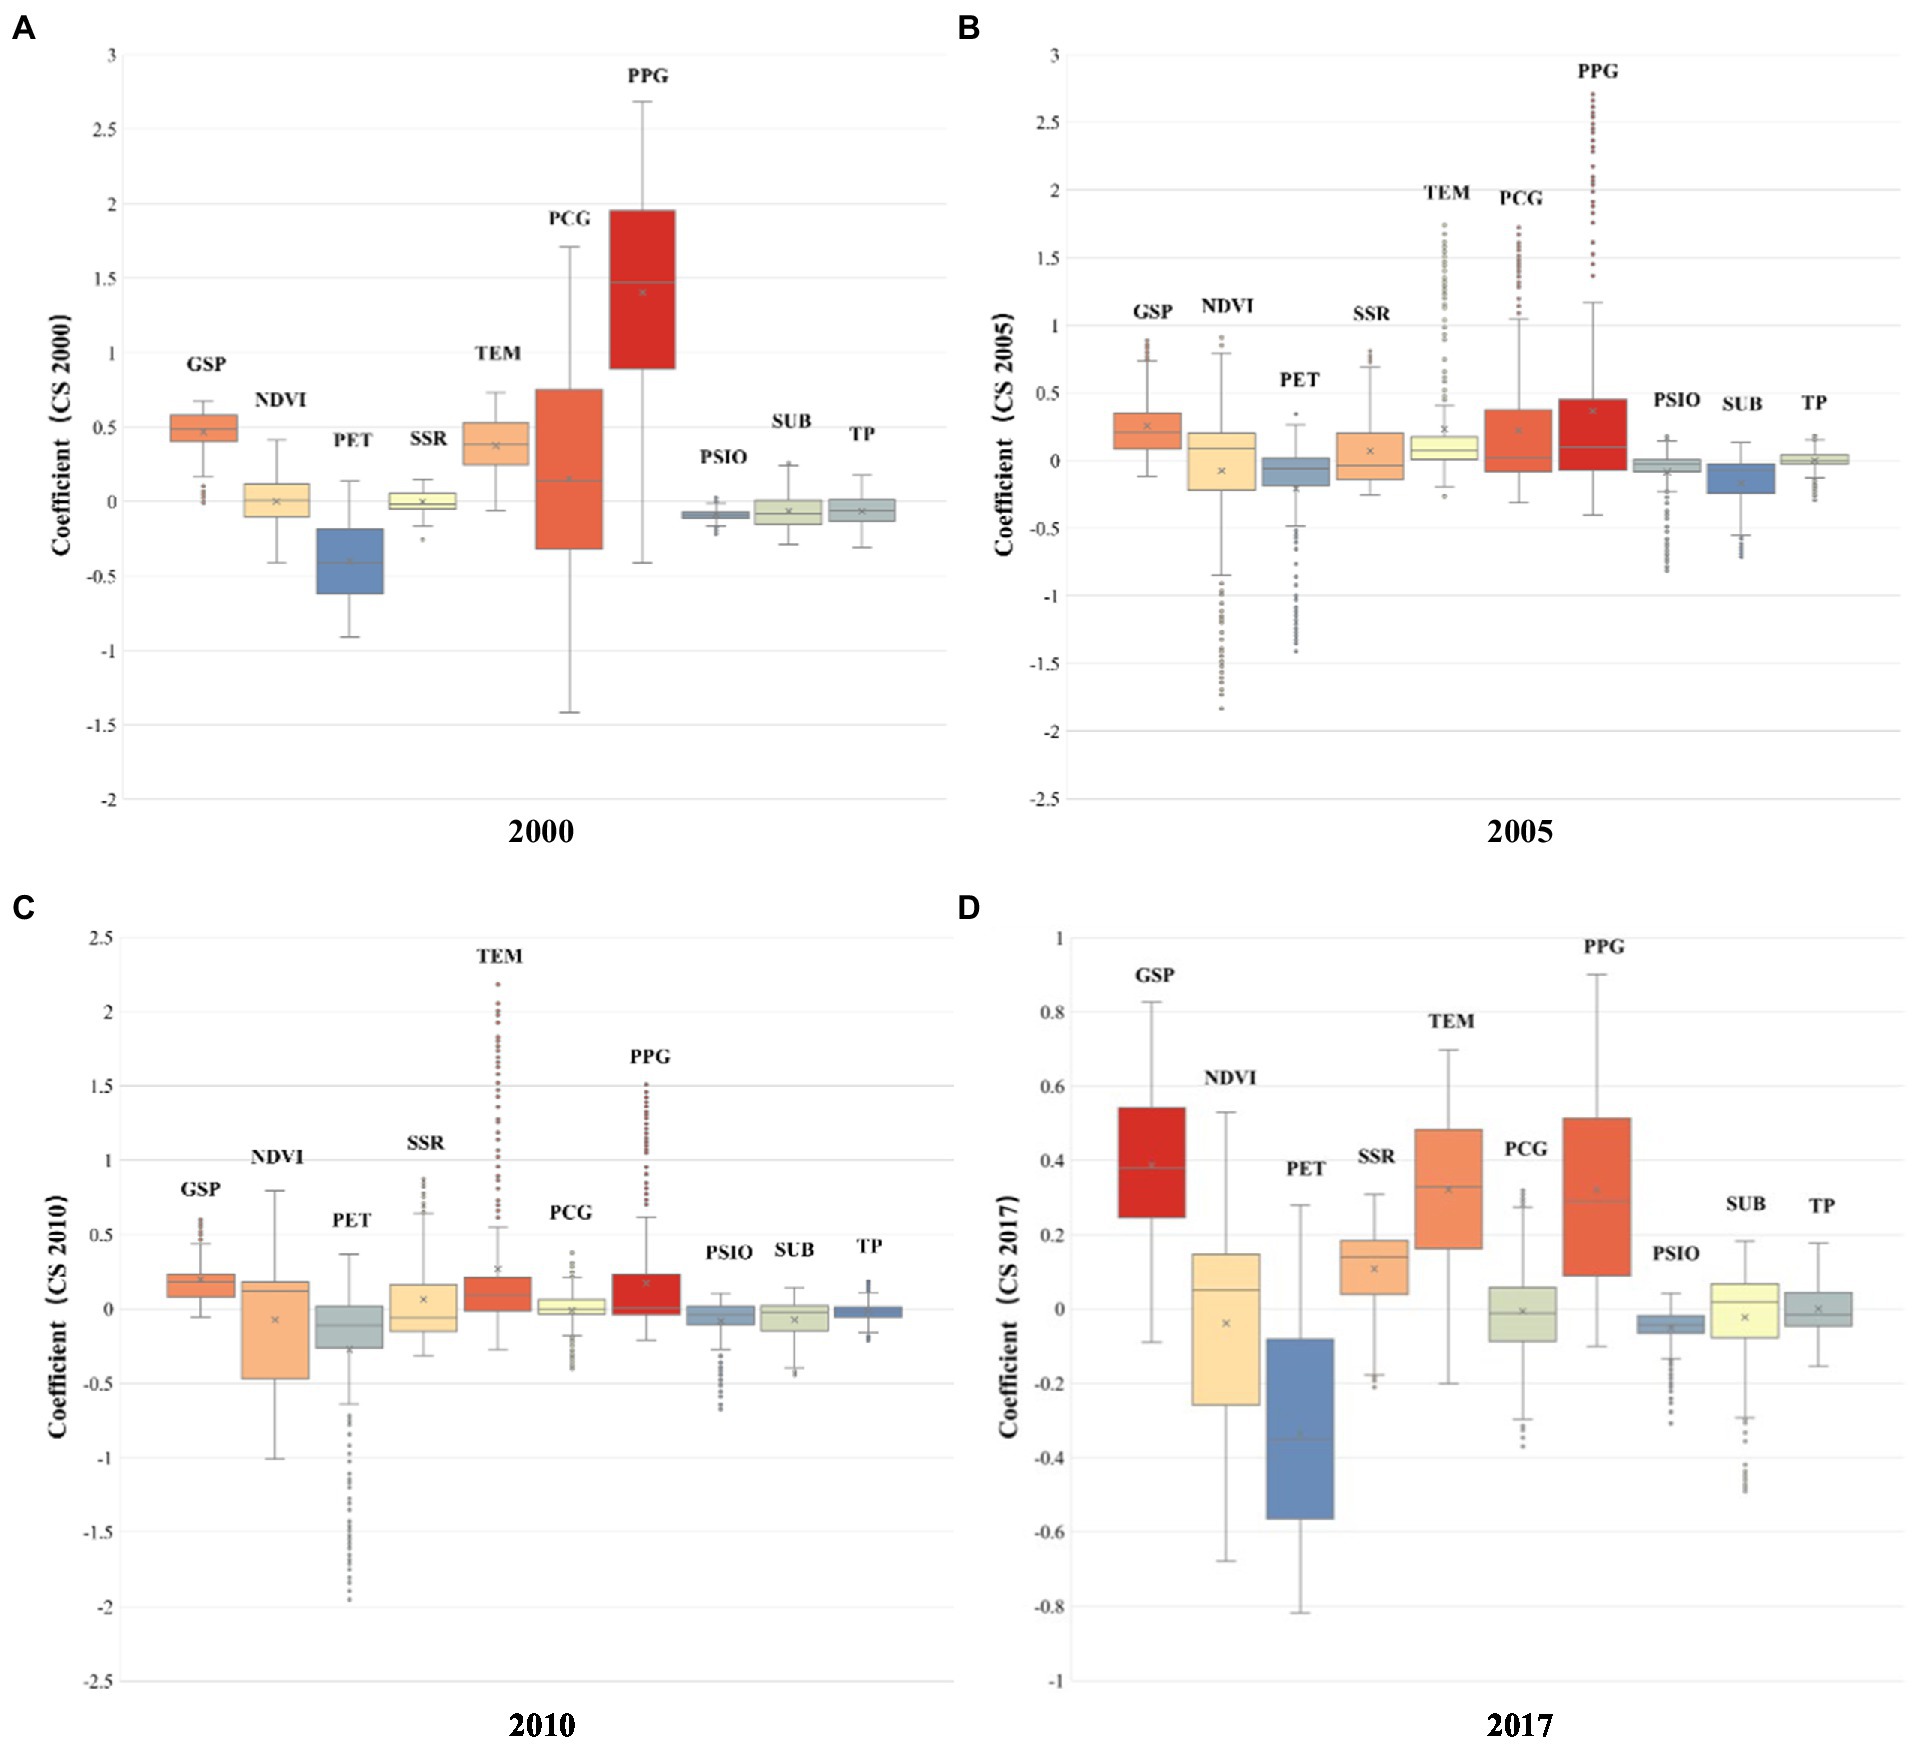
Figure 5. Summary plots of the regression coefficients associated with different carbon sequestration driving factors for (A) 2000, (B) 2005, (C) 2010, and (D) 2017.
There are evident spatial differences with regard to the correlation between the driving factors and carbon sequestration. Overall, the spatial pattern showed a negative correlation in the northwest region and a positive correlation in the southeast region. TP, PPG, GSP, and TEM were positively correlated with carbon sequestration in most regions of the country (Figures 4A,D,E,H), with PPG, GSP, and TEM exhibiting high regression coefficients in the coastal areas of the east region and Southern Liaoning providence; meanwhile, low regression coefficients were concentrated in the northwest region (Figures 4D,E,H). The areas where PPG and GSP showed high regression coefficients tended to shrink and then expand (Figures 4DII,III,E). However, areas where TEM exhibited high regression coefficients moved within the east, Central, and southwest regions over time (Figures 4HII,III). Highest regression coefficients were exhibited by TP in the Western part of the northwest region and spread to the Southern part of the South region, whereas the low regression coefficients were concentrated in the coastal areas of the east region (Figure 4A).
Meanwhile, PSIO and PET showed negative correlations to carbon sequestration at the intersection of the northeast, southwest, and center regions (Figures 4E,I). Both PSIO and PET initially exhibited a low regression coefficient in the east region; however, eventually, PSIO and PET exhibited low regression coefficients in the southwest and east, respectively. Furthermore, high regression coefficients were exhibited by both PSIO and PET in the northwest region; these areas tended to expand toward the northeast region. Furthermore, PSIO also exhibited high regression coefficients in the South region whose intensity increased over time, whereas PET showed high regression coefficients in the southwest corner of the Southwest Region (Figure 4I). The spatial distributions of areas where PCG and NDVI were positively and negatively correlated to carbon sequestration were very even. Both PCG and NDVI exhibited positive correlations in the southwest, South, northwest, and northeast regions, which decreased toward the southeast direction. Meanwhile, PCG and NDVI were negatively correlated to carbon sequestration in the east region, and the lowest regression coefficient of NDVI gradually moved toward the Southern part of the South region (Figure 3G). The lowest regression coefficient of PCG was observed in the east, Central, and southwest regions (Figures 4BII,III). The percentage of areas that showed negative correlation between SUB and carbon sequestration decreased from 73.68% (Figures 4FI) in 2000 to 40.63% in 2017 (Figures 4FIV). Areas with high regression coefficients between SUB and carbon sequestration underwent two phases of movement: in the first phase, these areas moved from the east Coast to the Central region (Figures 3FI–III); in the second stage, these areas moved back to the east in 2017 (Figures 4FIV). Similarly, areas exhibiting low regression coefficients between SUB and carbon sequestration also moved twice; initially, these areas moved from the southwest and Eastern northwest regions to the South and east regions (Figures 4FI–III), after which they gradually moved toward the northwest region (Figures 4FIV). The correlation between SSR and carbon sequestration showed obvious differences in the North and South. It was positive in the South and negative in the North, and the regression coefficient showed a decreasing trend from South to North (Figure 4J).
3.6. Comparison between the driving factors of carbon emission per unit area and carbon sequestration per unit area of terrestrial vegetation
According to our results, we found that the common driving factors of both carbon emission and carbon sequestration are TP, PCG, PSIO, SUB, GSP, NDVI, and TEM.
With the development of society and economy, all socioeconomic factors except TP had a positive driving effect on carbon emission. In 2000, the driving force of PCG was significantly higher for carbon sequestration than that for carbon emission. However, the impact of PCG decreased gradually, especially on carbon sequestration. By 2017, the driving force of PCG was only slightly higher for carbon sequestration compared to that for carbon emission. Moreover, PCG and carbon sequestration were positively correlated in some regions, while being negatively correlated in other areas. In contrast, the driving force of SUB was higher for carbon emission than that for carbon sequestration; it had a strong positive correlation with carbon emission, while being negatively correlated to carbon sequestration. Although the driving force of SUB for carbon emission was consistently high, it decreased gradually with carbon sequestration. Meanwhile, the driving force of PSIO was higher for carbon emission than that for carbon sequestration; from 2000 to 2017, its positive impact on carbon emission gradually increased, while its impact on carbon sequestration remained constant with some spatial differences. The driving force of TP was similar for both carbon emission and carbon sequestration, while being accompanied by strong spatial differences. In most areas of China, TP was negatively correlated to carbon emission, except in the North and east regions. Carbon sequestration was positively correlated to TP in the Western part of the northwest region, South region, and the Southern part of the Southwest Region.
GSP and NDVI were the major natural ecological factors that decreased carbon emissions, and their driving power increased over time. Since 2005, the negative correlation between NDVI and carbon emission has increased significantly in coastal areas of the southeast region. Although a negative correlation was also observed between NDVI and carbon sequestration, it had a less profound effect on carbon sequestration than on carbon emission. GSP has always been an important driving factor for increasing carbon sequestration and decreasing carbon emission; its positive impact on carbon sequestration was stronger than its negative impact on carbon emission. However, the positive driving force of GSP for carbon sequestration declined significantly, while having a negative impact in some cases. Although TEM had a positive effect on both carbon emission and carbon sequestration nationwide, it had a stronger effect on carbon sequestration and its driving force did not show significant change overtime.
4. Discussion
To achieve carbon neutralization, carbon emissions need to be balanced out via sequestration, utilization, and storage of carbon (Rogelj et al., 2015; Yang Y. et al., 2022). Overall, terrestrial ecosystems account for 57% of the carbon sink globally (Friedlingstein et al., 2020). Therefore, in this study, we investigated the potential driving factors of carbon emission and sequestration of terrestrial vegetation, while looking into driving factors that impact both processes. Based on the different types of driving factors of carbon emission and sequestration, we sorted the Chinese regions into different categories.
4.1. Impact of socioeconomic factors on the carbon emission per unit area and carbon sequestration per unit area of vegetation
Although many previous studies have shown that TP had a positive correlation with carbon emission (Al-Mulali and Ozturk, 2016; Huang C. et al., 2022; Yang S. et al., 2022; Zhao and Ren, 2022), our findings were contrasting. In most areas of China, an increase in TP decreased carbon emissions. This maybe because the impact of TP on carbon emission has a threshold. Before TP reaches this threshold, an increase in TP can slow down the carbon emission because rising population can promote the optimization of the urban industrial structure and improve the energy utilization efficiency, which can offset the carbon emission increase caused by a bigger population; this was also concluded by He et al. (2017). However, after refining the granularity of our study to the level of prefectural administrative regions, we found that not all regions of China showed a negative correlation between TP and carbon emission. For example, in Eastern and Central Eastern China, higher levels of economic development and urbanization have put the urban and ecological environment under greater pressure; consequently, TP was no longer effective in mitigating the carbon emissions generated by itself, which suggests that once TP crosses the threshold, TP may show a positive driving relationship with carbon emission. Meanwhile, as TP increased, its positive and negative correlations with carbon emission showed an increasing trend at both extremes during the study period. This indicated that TP has already crossed the threshold in Eastern and Central China, while in other regions it remained under the threshold. In addition, TP and carbon sequestration showed a negative correlation in most parts of the country, which may be due to the environmental pressure brought by the increasing population that was beyond the tolerance of the ecosystem (Yang et al., 2016). However, there were areas showing a positive correlation between TP and carbon sequestration. Based on the study of Yin S. et al. (2022) and Yin Y. et al. (2022) we confirmed that the positive correlation between TP and carbon sequestration was mainly observed in the southwest, Southern, and Western parts of the northwest region.
On this basis, we used the Panel Threshold Model (PTR), which was proposed by Hansen (1999), Li and Lin (2015), and Tatoğlu and Polat (2021), to detect and verify the threshold effect that we talked above. The results show that the model has a significant double threshold effect when TP is used as a threshold variable (Table 9). The threshold values are 476,100 and 8,763,500, respectively, (Table 10; Figure 6). Industrial development and urban expansion brought about by the increase of TP are the main reasons for the threshold effect. Table 11 reports the regression results of the threshold effect model. The estimated results of regression coefficient show that with the growth of population, The contribution of proportion of primary industry output (PPIO) and scale of urban build-up area (SUB) to carbon emission is gradually decreasing. However, the contribution of a proportion of secondary industry output (PSIO) to carbon emission is growing rapidly. When TP exceeds 476,100, the driving effect of PSIO on carbon emissions changes from negative correlation to positive correlation, but the optimization of industrial structure can still offset the increase of carbon emissions brought by PISO. When TP exceeds 8,763,500, PSIO will lead to a larger amount of carbon emissions, then the role of industrial structure optimization becomes negligible.
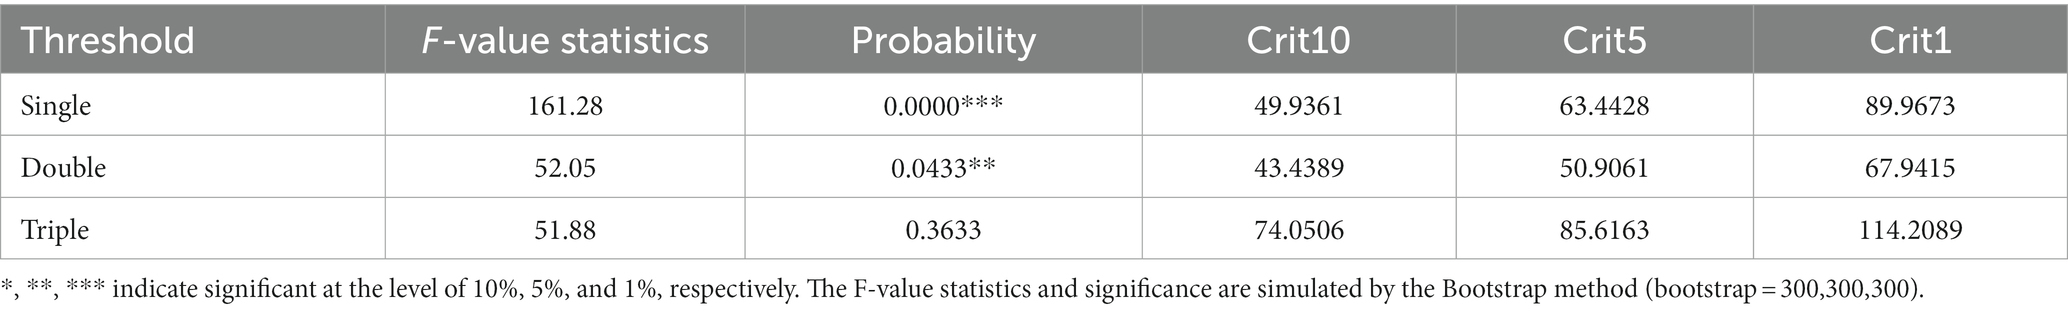
Table 9. Threshold effect test.
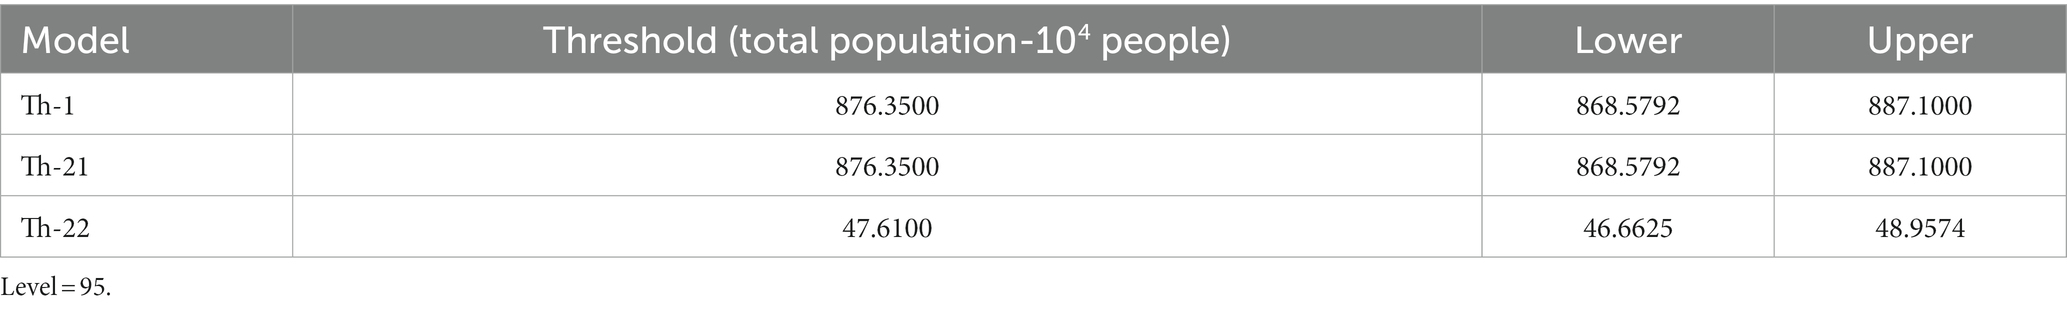
Table 10. Estimator results of double threshold model.
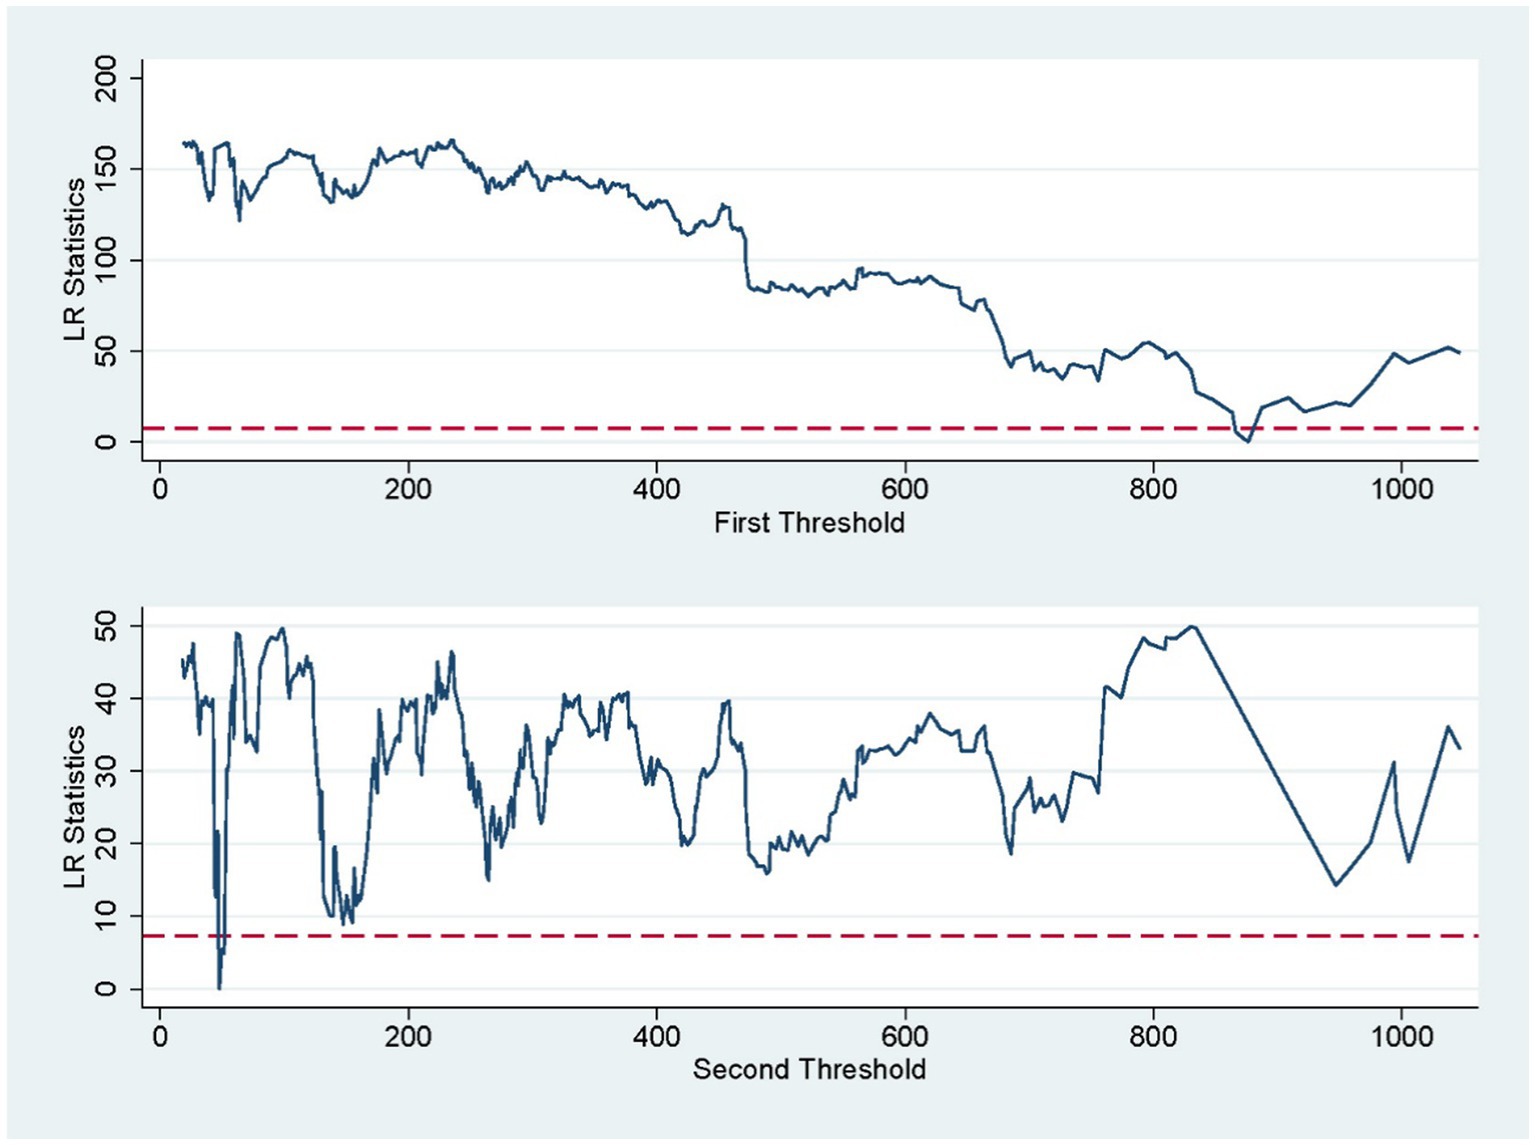
Figure 6. Double threshold confidence interval test for the Carbon Emissions and increase in total population.

Table 11. Results of double threshold panel regression.
Furthermore, our study showed that PCG, PSIO, and SUB are the main factors promoting carbon emission, which is generally consistent with previous studies (Zhou et al., 2019; Liu et al., 2021; Zhang et al., 2021). However, the effects of PCG, PSIO, and SUB on carbon sequestration were different from those observed in other studies.
First, PCG showed positive and negative correlations with carbon sequestration in different regions due to different climate conditions, industrial transformations, and forestry policies. Viña et al. (2016) revealed that GDP per capita has a positive effect on forest loss. Since mechanisms and causes of this positive effect were not discussed, we found explanations for it using our results. Figure 3B shows that PCG showed a strong positive spatial correlation with carbon sequestration in the southwest, South, Central and northeast regions. These regions represent areas where China initially started implementing forestry policies and industrial transformation (Liu et al., 2008; Chu et al., 2019; Piao, 2023). These results indicated that suitable climate conditions, good vegetation cover, and reasonable economic and industrial development policies can effectively alleviate the problem of increasing carbon emissions caused by economic development. However, PCG still impacts carbon sequestration negatively in several areas such as the east, Central, North, and the Western parts of the northwest region. Although the Chinese government has implemented a series of forestry policies (Wu et al., 2013; Liu et al., 2014; Li et al., 2018; Yao et al., 2019; Hu et al., 2020; Wang et al., 2022), they have been insufficient to balance out carbon emissions. These results indicate that forest plantation and other relevant ecological and environmental policies are still urgently needed in these regions.
Second, PSIO presented a negative effect on carbon sequestration in most areas of the country. Although PSIO can reduce the pressure on terrestrial ecosystems to a certain extent by improving the scale of industry, technology, and energy structure, the destruction of terrestrial ecosystems due to industrial development has a greater impact on carbon sequestration (Wei and Yang, 2010). During the study period, PSIO exhibited an inverted U-shaped relationship with carbon sequestration, which was consistent with the findings of Xiao et al. (2018), Zhou et al. (2018), and Xu et al. (2021). However, we also observed a weak positive correlation between PSIO and carbon sequestration in the southwest, Southern, Western parts of the northwest, and northeast (Figure 3C). This observation has never been reported in previous studies.
Finally, increasing SUB caused negative effects on carbon sequestration throughout the country. However, the growth of natural vegetation can mitigate this phenomenon locally to some extent (de Groot et al., 2012; Wang L. et al., 2012; Zhang et al., 2012; Tian and Qiao, 2014). During the study period, the negative spatial correlation between SUB and carbon sequestration showed a trend of increasing and then decreasing, thus exhibiting an inverted U-shaped characteristic. This indicates that vegetation growth can to some extent offset the reduction in vegetation cover caused by land change when urban expansion occurs (Wu et al., 2018). This conclusion can also explain the positive correlation between SUB and carbon sequestration in the east, northeast, Northern southwest, and Western northwest regions of China.
4.2. Impact of natural ecological factors on the carbon emission per unit area and carbon sequestration per unit area of vegetation
Among all the natural ecological factors, GSP and NDVI had the strongest impact on both carbon emission and carbon sequestration. GSP played an irreplicable role in decreasing carbon emissions, while having a positive spatial effect on carbon sequestration. This is mainly because the expansion of forest areas can effectively decrease carbon emissions and enhance carbon fixation (Fang et al., 2001; Lai et al., 2016). However, the positive effects of GSP were significantly weaker in the Western part of the northwest region. This was due to the characteristics of grassland vegetation, as well as the severe degradation of grasslands in these regions (Wang et al., 2017; Chang et al., 2022).
In areas located toward the east of the “Heihe-Tengchong Line,” the main reasons behind the negative correlation between NDVI and carbon emission were the warm and humid climate, suitable vegetation growth conditions, long growth period of forest trees, good vegetation cover, and well-structured forest areas; these factors significantly increased carbon sequestration and effectively reduced carbon emissions, as shown by Wang et al. (2020). However, NDVI had a negative impact on carbon sequestration. This was because the area toward the east of the “Heihe-Tengchong Line” is the most developed area in China, and the carbon sequestration capacity of the ecosystem was significantly weakened or even completely lost after several lands were urbanized. Wang et al. (2019) also showed that NDVI in urban complexes had very limited effects on carbon emission reduction. This suggests that building a continuous terrestrial vegetation ecosystem far from the city is key to achieving carbon neutralization. In the area toward the west of the “Heihe-Tengchong Line,” NDVI showed positive spatial correlations with carbon emission and carbon sequestration; however, the driving force for carbon sequestration was weak mainly due to the poor climate conditions and low vegetation cover in this region. Northwestern China is an arid and semi-arid area where precipitation is limited, vegetation growth period is short, and vegetation cover is low (He et al., 2021). All these factors have led to a low vegetation carbon sequestration capacity in this region. Therefore, carbon sequestration by vegetation is not enough to eliminate carbon emissions. This constitutes as a reason for the slow growth of the positive correlation between NDVI and carbon sequestration in this region (Qiu et al., 2020). In addition, the gap between the driving forces of NDVI for carbon emission and carbon sequestration is increasing overtime, and weak ecosystems alone cannot meet the demand for carbon sequestration. Therefore, we believe that carbon balance cannot be achieved through natural processes, and suitable human interventions and policies are required.
TEM had a positive spatial correlation with both carbon emission and sequestration. However, its impact on carbon emission and sequestration differed slightly because extreme temperatures reduce human and vegetation activities. Furthermore, high summer temperatures in local areas of China can decrease carbon sequestration (Wang et al., 2021b). Although high temperatures have started to negatively affect carbon sequestration, they do not significantly affect overall carbon sequestration due to the infrequency of these temperatures. In addition, the current study showed a positive spatial correlation between TEM and carbon emission in most regions of the country. Previous studies have shown that increasing TEM influenced human economic activities significantly both positively and negatively (Schlenker and Roberts, 2009; Sequeira et al., 2018; Yuan et al., 2022). The results of the present study proved that the average annual temperature in most regions of the country was favorable for society to maintain its economic vitality. However, it had a suppressive effect on the socioeconomic vitality and productive activities in the Western part of the northwest region, which exhibited a tendency to gradually spread to other areas. This was a result of the geographical conditions of the region, which indicated the negative impact of global temperature rise on the habitat of human beings.
4.3. Classification of Chinese cities based on the driving forces for carbon emission and carbon sequestration by terrestrial vegetation
In this study, we used the grouping analysis based on the minimum spanning tree principle to classify 352 prefecture-level administrative regions in China. In some cases, similar factors were observed in areas that are far apart; however, the reasons behind these results are quite different. To avoid such situations, we ensured that the prefecture-level administrative districts in each group were as close to each other as possible. Furthermore, we chose k-nearest neighbors as the spatial constraint with a spatial element value of K = 8. To measure the distance between adjacent elements, we used the MANHATTAN distance method. The final classification results (Figure 7) and the driving factors of Chinese cities are shown in Table 12.
(1) Group 1—Xinjiang Province. This area was studied from 2000 to 2017. The carbon emission and carbon sequestration in this region were dominated by both socioeconomic and natural ecological factors. Except PCG, all other driving factors increased carbon emission and carbon sequestration during the study period, and the driving power of PSIO, GSP, and NDVI was particularly strong.
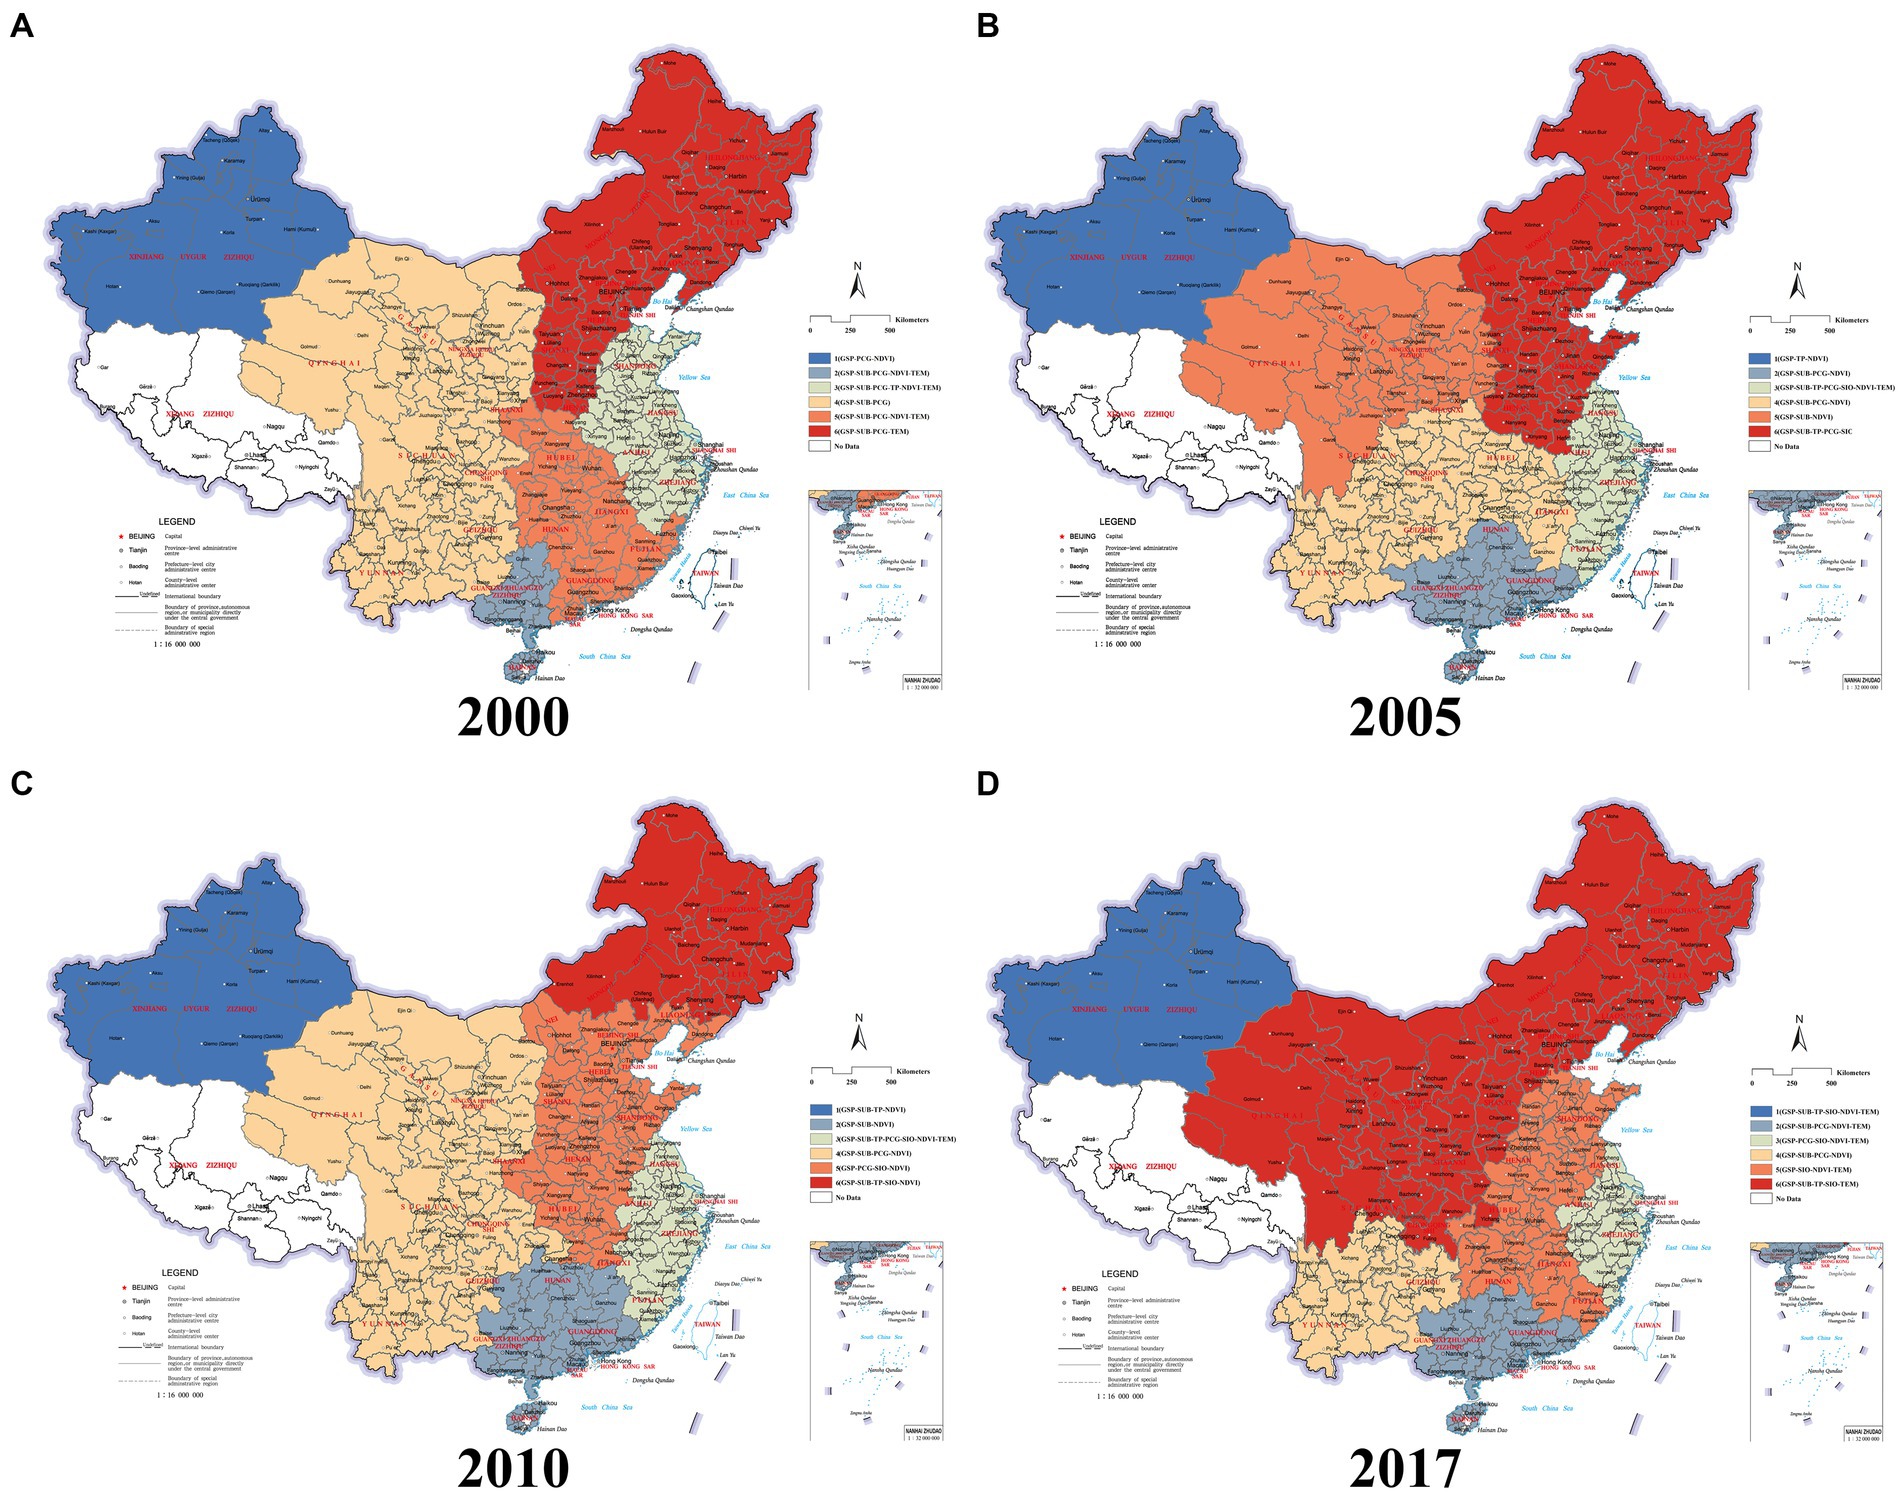
Figure 7. Drivers of carbon emissions and sequestration in different administrative regions of China in (A) 2000, (B) 2005, (C) 2010, and (D) 2017.
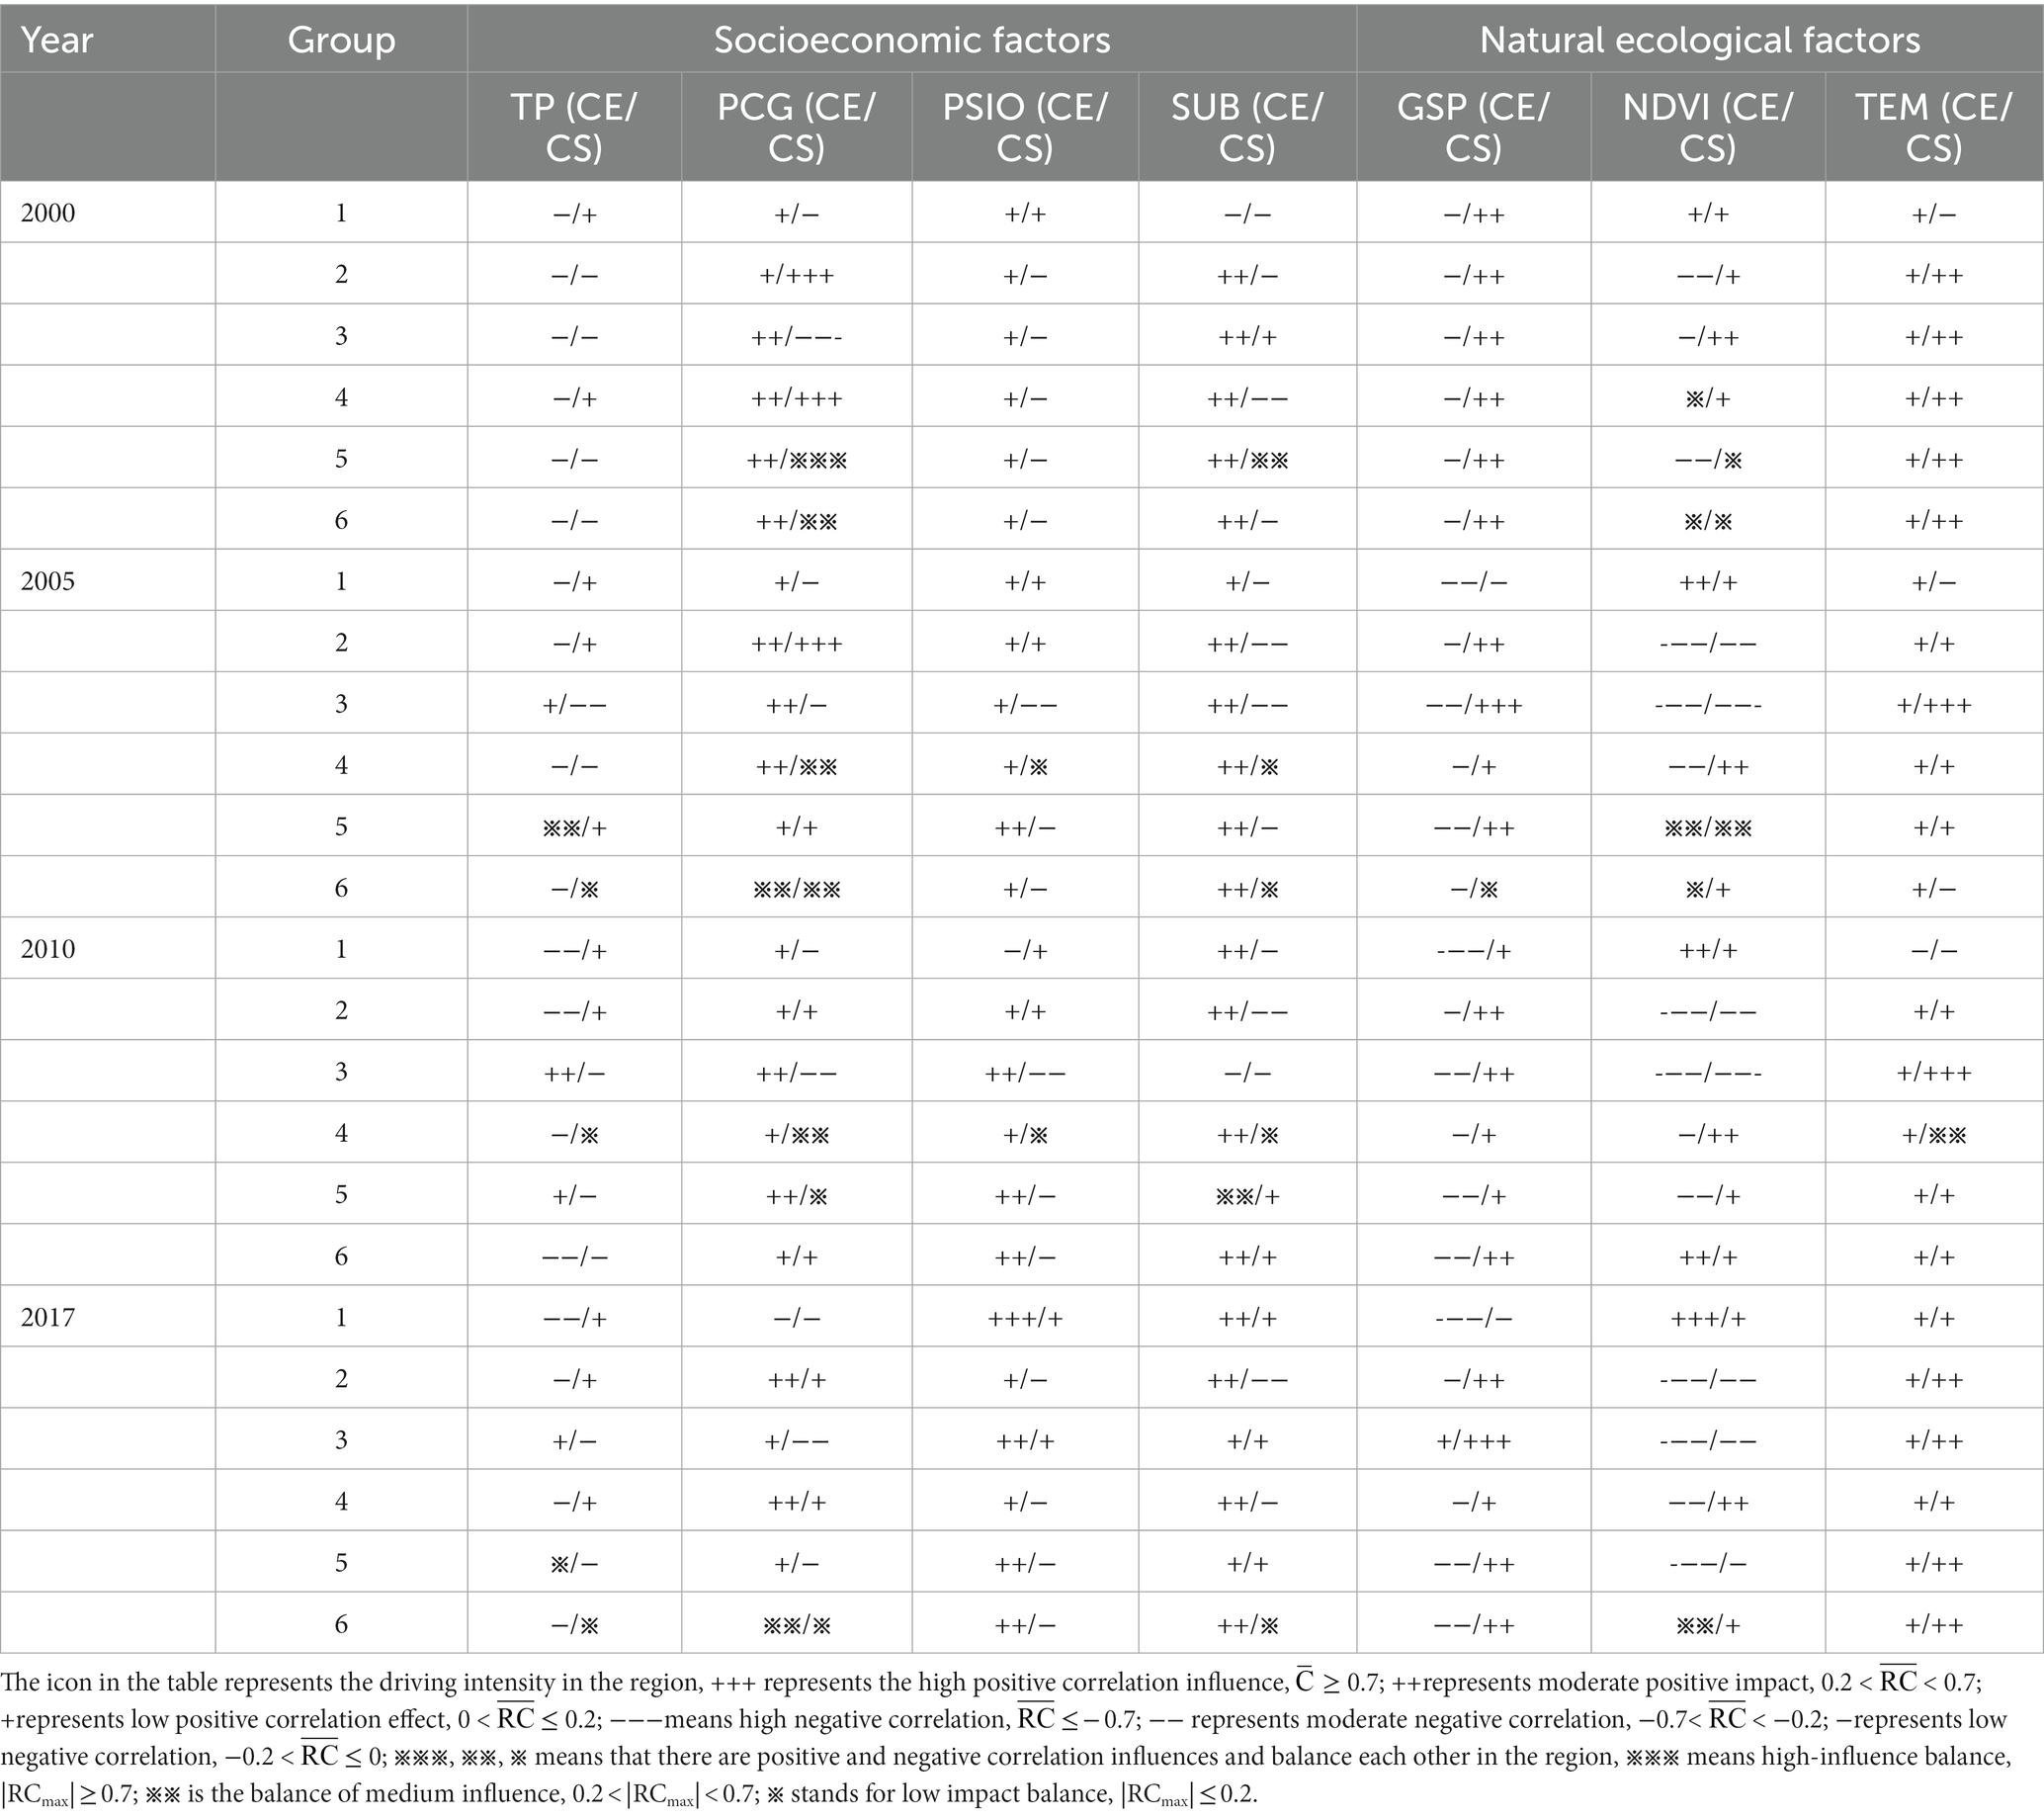
Table 12. Driving factors of carbon emission and sequestration in each group.
The changes in the carbon emission and sequestration over 4 years showed that the fragile ecological environment made Xinjiang Province vulnerable to socioeconomic factors. Socioeconomic factors frequently increased carbon emissions and decreased carbon sequestration by terrestrial vegetation. Furthermore, ecological issues caused by the increase in PSIO and SUB were the major causes for a rise in carbon emissions. Therefore, to reduce the high carbon emissions in this region, future socioeconomic policies should (1) increase the investments that augment the energy use efficiency, (2) reduce carbon emissions from industrial development and urban expansion by insisting on low-carbon development in urban areas. Furthermore, Comparing the natural ecological factors of the region such as NDVI and GSP, we can conclude that enhancing the ecological environment outside the urban construction areas is key to solving the carbon emission problem in Xinjiang Province.
(2) Group 2—this group is primarily composed of cities in Southern China. Carbon emission and sequestration in this area were dominated by both socioeconomic and natural ecological factors. During the study period, the driving force of TP, PSIO, GSP, and TEM remained stable; however, the driving force of PCG showed a declining trend, while that of SUB and NDVI increased. By 2017, SUB and NDVI became the dominant driving factors for carbon emission and sequestration in this region.
In summary, cities in group 2 are highly developed and exhibit extraordinary climate, open economic systems, and commercial communication networks. These characteristics promote the balance between carbon emission and sequestration. Although the developments in society and economy unavoidably led to higher carbon emissions, carbon sequestration by terrestrial vegetation was enhanced more dramatically. The increase in SUB, GSP, and NDVI had significantly different effects on carbon sequestration. These results indicated that the invasion of the natural environment by expanding cities was the major reason behind the decrease in carbon sequestration. Therefore, the key for sustainable development of regions in group 2 is to improve the regulations for environmental protectionand invest more in technological innovations.
(3) Group 3—this group includes most areas in Eastern China. Cities in this area are located near the southeast Coast and exhibit highly developed economies and superior climate. During the study, period, except PCG, the driving force of all socioeconomic factors showed a trend of increasing and then decreasing. GSP and NDVI showed a gradually increasing trend, while TEM remained stable. The first period of the study was dominated by socioeconomic factors, with PCG being the most influential factor. The second period was dominated by natural ecological factors, with NDVI and GSP being the main influencing factors.
Similar to group 2, the high urbanization levels and excellent natural conditions of cities in this group can help improve and regulate the balance of carbon emission and sequestration. By comparing the driving factors of the two groups, we found that industries play a more essential role in the economic growth of cities in group 3, and the early growth of cities had a more severe impact on the environment. The gradually weakening influence of socioeconomic factors and the strengthening influence of natural ecological factors in cities from group 3 indicated that energy conservation, emission reduction, and ecological environment policies have been effectively implemented in recent years. However, these factors are not enough to compensate for the previous losses. Therefore, continuous strengthening of the policies mentioned above is key to promoting the carbon balance in group 3.
(4) Group 4—this group includes areas in Central and Western China where carbon emission and sequestration are sensitive to economic development (Figure 7; Table 12). During the study period, carbon emission and carbon sequestration in group 4 were both dominated primarily by socioeconomic factors, with PCG and SUB being the most influential factors. Meanwhile, socioeconomic factors showed a tendency to reduce over time, while the natural ecological factors increased. Among them, PCG and SUB were the main factors promoting carbon emission, while NDVI, TP, and GSP were the predominant factors inhibiting carbon emission. Furthermore, the factors promoting carbon sequestration gradually changed from PCG, GSP, and TEM to PCG and NDVI.
The negative environmental impacts of economic development and urban expansion in these areas were well compensated at the beginning of the study period. This was because although these developments encroached and disturbed the ecological environment to some extent, industrial development and technological advancement also improved the energy use efficiency. With the completion of industrial transformation and the slowing down of urbanization, the impact of PCG and SUB decreased; however, these were still the main factors driving carbon emission. Moreover, population was one of the limiting factors in northwestern and Northern China; the advantages of southwestern and Central China were good vegetation cover and suitable climate for vegetation growth. Considering the differences within various regions in group 4, we suggest that the key to achieving carbon balance in this group is to promote economic development, environmental protection, and ecological restoration policies according to the characteristics of each region.
(5) Group 5—this group includes cities in Central and Eastern China where carbon emission and sequestration are sensitive to the natural environment (Figure 7; Table 12). In this region, except TEM, all other natural ecological factors showed a negative correlation with carbon emission and a positive correlation with carbon sequestration. Furthermore, the driving power of these factors has been increasing. Although socioeconomic factors were positively correlated with carbon emission, their influence was weaker compared to that of ecological factors.
At the beginning, areas where carbon emission and sequestration were majorly impacted by natural ecological factors mainly existed in the Central and South regions of China (Figure 7A). In these regions, development of the economy and expansion of cities increased carbon emissions; however, due to their suitable climate for vegetation growth and good vegetation cover, carbon emission and sequestration in these areas can still be balanced. However, areas in the Eastern part of the northwest region and the Western part of the Northern region suffered remarkably due to soil erosion and vegetation degradation. Therefore, these ecosystems became very vulnerable, and their carbon emissions cannot be balanced out by carbon sequestration. Since 2005, the impact of natural ecological factors on these regions is increasing; consequently, the driving force of these factors is the highest in these regions. Eventually, the sensitivity of carbon emission and carbon sequestration to natural ecological factors stabilized in the border areas of Northern, Eastern, and Central China (Figures 7C,D). NDVI and GSP were the main influencing factors in this region, owing to the former destruction of terrestrial vegetation ecosystems caused by the industrial economy development (PSIO, PCG). Ecosystem restoration techniques, such as reforestation, is key to achieving a balance between carbon emission and carbon sequestration in these areas.
(6) Group 6—this group includes the North, northeast regions, and their surrounding areas. Although the area under group 6 changed considerably over time, it mainly existed in the northeast, North, and Eastern parts of the northwest region. PCG and SUB were the dominant factors promoting carbon emission in this group, while GSP and TEM were the primary factors increasing carbon sequestration. The driving factors and their driving forces in this group were extremely stable during the study period.
Overall, group 6 includes typical resource-based cities and is home to two major heavy industrial bases in South-Central Liaoning and Beijing-Tianjin-Hebei areas. Owing to large-scale industrial development and early ecological damage, the increase in carbon emissions cannot be offset by the increase in resources and environmental efficiency caused by industrial transformation and technological progress. Furthermore, the correlation between GSP and carbon emission showed a slowly increasing trend due to reforestation schemes such as the Natural Forest Protection project. Meanwhile, carbon sequestration showed a weak response to each driving factor, owing to the climate conditions in the North of the country. In summary, the industrial-based economic development model implemented in this region was the biggest threat to its carbon balance. Therefore, efforts toward strengthening industrial restructuring, especially the input and development of tertiary industry, are key to promoting carbon balance in regions of group 6.
5. Conclusion
With the intensification of greenhouse gas emissions and global warming, several countries are aiming to achieve carbon neutralization. Realizing a balance between carbon emission and carbon sequestration has become a focus of attention for countries around the world. Understanding the driving mechanisms and common drivers for carbon emission and carbon sequestration can guide decision makers to formulate urban development strategies and environmental protection policies with carbon neutrality as the goal. This study explored the potential drivers for both carbon emission and carbon sequestration in 352 prefecture-level administrative units in China using multiple data sources. Analyses and discussions of our results led to the following conclusions:
1. Overall, the most effective pathway for carbon neutralization is to improve the natural environment. Figure 7D and Table 12 reveal that the influence of socioeconomical factors on carbon emission and carbon sequestration has been declining constantly from 2000 to 2017; however, the influence of natural ecological factors is becoming increasingly strong. Natural ecological factors such as NDVI and GSP have already become the dominant driving forces for achieving the balance between carbon emission and carbon sequestration, especially in the southeast coastal areas. That is to say, we should pay more attention to carbon sequestration by terrestrial vegetation, which is more sensitive to natural ecological factors, rather than carbon emissions.
2. With regard to carbon sequestration, it is necessary to focus on the quality and scale of the ecological environment in areas outside the cities. According to the results of NDVI and GSP analyses, The improvement of GSP is more effective than NDVI in promoting carbon sequestration of terrestrial vegetation (Figure 7; Table 12). Meanwhile, SUB was the main factor that reduced carbon sequestration, which emphasizes that urban green space has limited effect on carbon sequestration of urban ecosystems under the influence of the overall urban environment. This indicates that natural ecological spaces outside cities are of great importance for carbon neutralization as they can effectively enhance the carbon sequestration ability of terrestrial vegetation.
3. In terms of carbon emission, promoting the innovation of industrial and environmental technologies as well as the development of low-carbon eco-friendly industries can effectively reduce the damage caused to the environment by industrial development and help achieve carbon neutrality. According to the results of this study, PCG, PSIO, and SUB are the main factors that increase carbon emissions (Table 12). In most areas of the country, especially in the southeast Coast, industrial economic development and urban expansion have slowed down; however, they still play a strong role in increasing emissions and reducing carbon sequestration. This shows that we are not doing enough to mitigate carbon emissions from economic and social activities.
4. In this study, we categorized China into several regions according to the driving factors of carbon emission and sequestration in each region. The results show that in most regions of China, carbon emission and sequestration were dominated by both socioeconomical and natural ecological factors. These driving factors restrict each other and balance the carbon emission and sequestration. Therefore we also proposed that to achieve carbon neutralization, geographical features, climate conditions, economic growth, and urbanization must be considered in each region.
This study also has certain limitations:
1. Owing to the restricted availability of data, this study was not able to analyze the driving factors of carbon emission and sequestration in regions of Hong Kong, Macau, Taiwan, Tibet, and 3 counties in Central Hainan (Qiongzhong Li and Miao Autonomous County, Baoting Li and Miao Autonomous County, and Sansha County).
2. This study only analyzed the driving factors of carbon emission and sequestration according to the data obtained within a limited time frame (from 2000 to 2017).
Data availability statement
The original contributions presented in the study are included in the article/supplementary material, further inquiries can be directed to the corresponding authors.
Author contributions
JLin: conceptualization, methodology, formal analysis, data curation, investigation, writing original draft, visualization, resources, software, and data curation. YG and JLi: investigation and visualization. JL: resources. PY and MS: project administration, writing-review and editing, supervision, validation, and software. All authors contributed to the article and approved the submitted version.
Funding
This work was supported by the Project of Beijing Natural Science Foundation (grant number 8222022), Hot Spot Tracking Project of Beijing Forestry University (grant number 2022BLRD08), “Outstanding Young Talents” Cultivation Program of Beijing Forestry University (grant number 2019JQ03010), and Science and Technology Innovation Program of Beijing Forestry University (grant number BLX202111).
Conflict of interest
The authors declare that the research was conducted in the absence of any commercial or financial relationships that could be construed as a potential conflict of interest.
Publisher’s note
All claims expressed in this article are solely those of the authors and do not necessarily represent those of their affiliated organizations, or those of the publisher, the editors and the reviewers. Any product that may be evaluated in this article, or claim that may be made by its manufacturer, is not guaranteed or endorsed by the publisher.
Footnotes
References
Abdi, H. (2010). Partial least squares regression and projection on latent structure regression (PLS Regression). Wiley Interdiscip. Rev. Comput. Stat. 2, 97–106. doi: 10.1002/wics.51
Al-Mulali, U., and Ozturk, I. (2016). The investigation of environmental Kuznets curve hypothesis in the advanced economies: The role of energy prices. Renew. Sustain. Energy Rev. 54, 1622–1631. doi: 10.1016/j.rser.2015.10.131
Arneth, A., Sitch, S., Pongratz, J., Stocker, B. D., Ciais, P., Poulter, B., et al. (2017). Historical carbon dioxide emissions caused by land-use changes are possibly larger than assumed. Nat. Geosci. 10:79. doi: 10.1038/NGEO2882
Artz, J., Müller, T. E., Thenert, K., Kleinekorte, J., Meys, R., Sternberg, A., et al. (2018). Sustainable Conversion of Carbon Dioxide: An Integrated Review of Catalysis and Life Cycle Assessment. Chem. Rev. 118, 434–504. doi: 10.1021/acs.chemrev.7b00435
Ben-Zadok, E. (2008) in The Metropolitan Revolution: The Rise Of Post-urban America. ed. J. C. Teaford , vol. 30 (New York: Columbia University Press, 2006), 463–465.
Brunsdon, C., Fotheringham, A. S., and Charlton, M. E. (1996). Geographically Weighted Regression: A Method for Exploring Spatial Nonstationarity. Geogr. Anal. 28, 281–298.
Chang Chien, Y.-M., Carver, S., and Comber, A. (2020). Using geographically weighted models to explore how crowdsourced landscape perceptions relate to landscape physical characteristics. Landsc. Urban Plan. 203:103904. doi: 10.1016/j.landurbplan.2020.103904
Chang, X., Xing, Y., Wang, J., Yang, H., and Gong, W. (2022). Effects of land use and cover change (LUCC) on terrestrial carbon stocks in China between 2000 and 2018. Resour. Conserv. Recycl. 182:106333. doi: 10.1016/j.resconrec.2022.106333
Chen, J., Fan, W., Li, D., Liu, X., and Song, M. (2020a). Driving factors of global carbon footprint pressure: Based on vegetation carbon sequestration. Appl. Energy :267:114914. doi: 10.1016/j.apenergy.2020.114914
Chen, J., Gao, M., Cheng, S., Hou, W., Song, M., Liu, X., et al. (2020b). County-level CO2 emissions and sequestration in China during 1997–2017. Sci. Data 7:391. doi: 10.1038/s41597-020-00736-3
Chu, X., Zhan, J., Li, Z., Zhang, F., and Qi, W. (2019). Assessment on forest carbon sequestration in the Three-North Shelterbelt Program region, China. ChinaJ. Clean. Prod. 215, 382–389. doi: 10.1016/j.jclepro.2018.12.296
Chuai, X., Lai, L., Huang, X., Zhao, R., Wang, W., and Chen, Z. (2012). Temporospatial changes of carbon footprint based on energy consumption in China. J. Geogr. Sci. 22, 110–124. doi: 10.1007/s11442-012-0915-4
Dadashpoor, H., Azizi, P., and Moghadasi, M. (2019). Land use change, urbanization, and change in landscape pattern in a metropolitan area. Sci. Total Environ. 655, 707–719. doi: 10.1016/j.scitotenv.2018.11.267
de Groot, R., van der Ploeg, S., Hein, L., Brander, L., van Beukering, P., Costanza, R., et al. (2012). Global estimates of the value of ecosystems and their services in monetary units. Ecosyst. Serv. 1, 50–61. doi: 10.1016/j.ecoser.2012.07.005
Dong, F., Yu, B., Hadachin, T., Dai, Y., Wang, Y., Zhang, S., et al. (2018). Drivers of carbon emission intensity change in China. Resour. Conserv. Recycl. 129, 187–201. doi: 10.1016/j.resconrec.2017.10.035
Fang, J., Chen, A., Peng, C., Zhao, S., and Ci, L. (2001). Changes in Forest Biomass Carbon Storage in China between 1949 and 1998. Science 292, 2320–2322. doi: 10.1016/j.landurbplan.2017.02.014
Fang, C., and Yu, D. (2017). Urban agglomeration: An evolving concept of an emerging phenomenon. Landsc. Urban Plan. 162, 126–136. doi: 10.1016/j.landurbplan.2017.02.014
Fang, J., Yu, G., Liu, L., Hu, S., and Chapin, F. S. (2018). Climate change, human impacts, and carbon sequestration in China. Proc. Natl. Acad. Sci. U. S. A. 115, 4015–4020. doi: 10.1073/pnas.1700304115
Feng, K., Sun, L., Hubacek, K., and Davis, S. J. (2015). Drivers of the US CO2 emissions 1997-2013. Nat. Commun. 6:7714. doi: 10.1038/ncomms8714
Figueroa, J. D., Fout, T., Plasynski, S., McIlvried, H., and Srivastava, R. D. (2008). Advances in CO2 capture technology—The U.S. Department of Energy's Carbon Sequestration Program. Int J Greenhouse Gas Control 2, 9–20. doi: 10.1016/S1750-5836(07)00094-1
Friedlingstein, P., O’Sullivan, M., Jones, M. W., Andrew, R. M., Hauck, J., Olsen, A., et al. (2020). Global Carbon Budget 2020. Earth Syst. Sci. Data 12, 3269–3340. doi: 10.5194/essd-12-3269-2020
Gartner, E. (2004). Industrially interesting approaches to low-CO2 cements. Cem. Concr. Res. 34, 1489–1498. doi: 10.1016/j.cemconres.2004.01.021
Hansen, B. E. (1999). Threshold effects in non-dynamic panels: Estimation, testing, and inference. J. Econ. 93, 345–368.
Hao, Y., Su, M., Zhang, L., Cai, Y., and Yang, Z. (2015). Integrated accounting of urban carbon cycle in Guangyuan, a mountainous city of China: The impacts of earthquake and reconstruction. J. Clean. Prod. 103, 231–240. doi: 10.1016/j.jclepro.2014.05.091
He, P., Sun, Z., Han, Z., Dong, Y., Liu, H., Meng, X., et al. (2021). Dynamic characteristics and driving factors of vegetation greenness under changing environments in Xinjiang. Environ. Sci. Pollut. Res. 28, 42516–42532. doi: 10.1007/s11356-021-13721-z
He, Z., Xu, S., Long, R., Chen, H., and Shen, W. (2017). Impact of urbanization on energy related CO2 emission at different development levels: Regional difference in China based on panel estimation. J. Clean. Prod. 140, 1719–1730. doi: 10.1016/j.jclepro.2016.08.155
Hu, T., Li, X., Gong, P., Yu, W., and Huang, X. (2020). Evaluating the effect of plain afforestation project and future spatial suitability in Beijing. Sci. China Earth Sci. 63, 1587–1598. doi: 10.1007/s11430-019-9636-0
Huang, C., Pan, P., Qu, Y., Huang, L., Meng, X., and Chen, Y. (2022). Quantifying the Impact of Urban Form and Socio-Economic Development on China’s Carbon Emissions. Int. J. Environ. Res. Public Health 19:2976. doi: 10.3390/ijerph19052976
Huang, Y., Sun, W., Qin, Z., Zhang, W., Yu, Y., Li, T., et al. (2022). The role of China’s terrestrial carbon sequestration 2010-2060 in offsetting energy-related CO2 emissions. Natl. Sci. Rev. 9:nwac057. doi: 10.1093/nsr/nwac057
Huilei, L., Jian, P., Yanxu, L., and Yi’na, H. (2017). Urbanization impact on landscape patterns in Beijing City, China: A spatial heterogeneity perspective. Ecol. Indic. 82, 50–60. doi: 10.1016/j.ecolind.2017.06.032
Jia, J. (2009). Analysis of the major drivers of the ecological footprint using the STIRPAT model and the PLS method: a case study in Henan Province, China. Ecol. Econ. 68, 2818–2824. doi: 10.1016/j.ecolecon.2009.05.012
Keller, D. P., Lenton, A., Littleton, E. W., Oschlies, A., Scott, V., and Vaughan, N. E. (2018). The Effects of Carbon Dioxide Removal on the Carbon Cycle. Curr. Clim. Change Rep. 4, 250–265. doi: 10.1007/s40641-018-0104-3
Kontokosta, C. E., and Tull, C. (2017). A data-driven predictive model of city-scale energy use in buildings. Appl. Energy 197, 303–317. doi: 10.1016/j.apenergy.2017.04.005
Krausmann, F., Wiedenhofer, D., Lauk, C., Haas, W., Tanikawa, H., Fishman, T., et al. (2017). Global socioeconomic material stocks rise 23-fold over the 20th century and require half of annual resource use. Proc. Natl. Acad. Sci. U. S. A. 114, 1880–1885. doi: 10.1073/pnas.1613773114
Lai, L., Huang, X., Yang, H., Chuai, X., Zhang, M., Zhong, T., et al. (2016). Carbon emissions from land-use change and management in China between 1990 and 2010. Sci. Adv. 2:1601063. doi: 10.1126/sciadv.1601063
Li, T., Li, J., and Wang, Y. (2019). Carbon sequestration service flow in the Guanzhong-Tianshui economic region of China: How it flows, what drives it, and where could be optimized? Ecol. Indic. 96, 548–558. doi: 10.1016/j.ecolind.2018.09.040
Li, K., and Lin, B. (2015). Impacts of urbanization and industrialization on energy consumption/CO2 emissions: Does the level of development matter? Renew. Sustain. Energy Rev. 52, 1107–1122. doi: 10.1016/j.rser.2015.07.185
Li, H., Zhang, K., Zhang, X., Yang, X., and Zhang, Y. (2018). Risk assessment of forest landscape degradation using Bayesian network modeling in the Miyun Reservoir catchment (China) with emphasis on the Beijing–Tianjin sandstorm source control program. Land Degrad. Dev. 29, 3876–3885. doi: 10.1002/ldr.3133
Liu, Y., Jiang, Y., Liu, H., Li, B., and Yuan, J. (2021). Driving factors of carbon emissions in China’s municipalities: a LMDI approach. Environ. Sci. Pollut. Res. 1–14:21789. doi: 10.1007/s11356-021-17277-w
Liu, J., Li, S., Ouyang, Z., Tam, C., and Chen, X. (2008). Ecological and Socioeconomic Effects of China’s Policies for Ecosystem Services. Proc. Natl. Acad. Sci. U. S. A. 105, 9477–9482. doi: 10.1073/pnas.0706436105
Liu, X., Yang, X., and Guo, R. (2020). Regional differences in fossil energy-related carbon emissions in China’s eight economic regions: Based on the theil index and PLS-VIP method. Sustain. Switz. 12:2576. doi: 10.3390/su12072576
Liu, W., Zhu, J., Jia, Q., Zheng, X., Li, J., Lou, X., et al. (2014). Carbon sequestration effects of shrublands in Three-North Shelterbelt Forest region. Geogr. Sci. 24, 444–453. doi: 10.1007/s11769-014-0698-x
Ma, Q., Murshed, M., and Khan, Z. (2021). The nexuses between energy investments, technological innovations, emission taxes, and carbon emissions in China. Energy Policy 155:112345. doi: 10.1016/j.enpol.2021.112345
Majava, A., Vadén, T., Toivanen, T., Järvensivu, P., Lähde, V., and Eronen, J. T. (2022). Sectoral low-carbon roadmaps and the role of forest biomass in Finland’s carbon neutrality 2035 target. Energ. Strat. Rev. 41:100836. doi: 10.1016/j.esr.2022.100836
Mallapaty, S. (2020). How China could be carbon neutral by mid-century. Nat. Int. Wkly. J. Sci. 586, 482–483. doi: 10.1038/d41586-020-02927-9
Matthews, H. D., and Keith, D. W. (2007). Carbon-cycle feedbacks increase the likelihood of a warmer future. Geophys. Res. Lett. 34, 1–5. doi: 10.1029/2006GL028685
Meinshausen, M., Meinshausen, N., Hare, W., Raper, S. C. B., Frieler, K., Knutti, R., et al. (2009). Greenhouse-gas emission targets for limiting global warming to 2 degrees C. Nature 458, 1158–U1196. doi: 10.1038/nature08017
Niemelä, J., Saarela, S.-R., Söderman, T., Kopperoinen, L., Yli-Pelkonen, V., Väre, S., et al. (2010). Using the ecosystem services approach for better planning and conservation of urban green spaces: a Finland case study. Biodivers. Conserv. 19, 3225–3243. doi: 10.1007/s10531-010-9888-8
Ning, K., Li, Z., Wang, L., Hu, X., Nie, X., Liu, Y., et al. (2021). Land use change induced by the implementation of ecological restoration Programs increases future terrestrial ecosystem carbon sequestration in red soil hilly region of China. Ecol. Indic. 133:108409. doi: 10.1016/j.ecolind.2021.108409
Ohara, T., Akimoto, H., Kurokawa, J., Horii, N., Yamaji, K., Yan, X., et al. (2007). An Asian emission inventory of anthropogenic emission sources for the period 1980-2020. Atmospheric Chem. Phys. 7, 4419–4444. doi: 10.5194/acp-7-4419-2007
Piao, S. (2023). The carbon balance of terrestrial ecosystems in China. Nature 458, 1009–1013. doi: 10.1038/nature07944
Piao, S., Tan, K., Nan, H., Ciais, P., Fang, J., Wang, T., et al. (2012). Impacts of climate and CO2 changes on the vegetation growth and carbon balance of Qinghai–Tibetan grasslands over the past five decades. Global Planet. Change 98–99, 73–80. doi: 10.1016/j.gloplacha.2012.08.009
Prasad, V. K., Badarinath, K. V. S., and Eaturu, A. (2008). Effects of precipitation, temperature and topographic parameters on evergreen vegetation greenery in the Western Ghats, India. Int. J. Climatol. 28, 1807–1819. doi: 10.1002/joc.1662
Qiu, Z., Feng, Z., Zhang, P., Song, Y., and Li, M. (2020). Carbon sequestration potential of forest vegetation in China from 2003 to 2050: Predicting forest vegetation growth based on climate and the environment. J. Clean. Prod. 252:119715. doi: 10.1016/j.jclepro.2019.119715
Reich, P. B., Hobbie, S. E., Lee, T. D., Rich, R., Pastore, M. A., and Worm, K. (2020). Synergistic effects of four climate change drivers on terrestrial carbon cycling. Nat. Geosci. 13, 787–793. doi: 10.1038/s41561-020-00657-1
Rogelj, J., Riahi, K., Knutti, R., Schaeffer, M., Hare, W., Meinshausen, M., et al. (2015). Zero emission targets as long-term global goals for climate protection. Environ. Res. Lett. 10:105007. doi: 10.1088/1748-9326/10/10/105007
Salvia, M., Pietrapertosa, F., Reckien, D., de Boer, C., Eckersley, P., Spyridaki, N.-A., et al. (2021). Will climate mitigation ambitions lead to carbon neutrality? An analysis of the local-level plans of 327 cities in the EU. Renew. Sustain. Energy Rev. 135:110253. doi: 10.1016/j.rser.2020.110253
Schlenker, W., and Roberts, M. J. (2009). Nonlinear temperature effects indicate severe damages to US crop yields under climate change. Proc. Natl. Acad. Sci. U. S. A. 106, 15594–15598. doi: 10.1073/pnas.0906865106
Sequeira, T. N., Santos, M. S., and Magalhães, M. (2018). Climate change and economic growth: a heterogeneous panel data approach. Environ. Sci. Pollut. Res. 25, 22725–22735. doi: 10.1007/s11356-018-2305-7
Shuai, C., Shen, L., Jiao, L., Wu, Y., and Tan, Y. (2017). Identifying key impact factors on carbon emission: Evidences from panel and time-series data of 125 countries from 1990 to 2011. Appl. Energy 187, 310–325. doi: 10.1016/j.apenergy.2016.11.029
Solomon, S., Plattner, G.-K., Knutti, R., and Friedlingstein, P. (2009). Irreversible Climate Change Due to Carbon Dioxide Emissions. Proc. Natl. Acad. Sci. U. S. A. 106, 1704–1709. doi: 10.1073/pnas.0812721106
Song, W., Jia, H., Zhang, Y., and Huang, J. (2014). A satellite-based geographically weighted regression model for regional PM2.5 estimation over the Pearl River Delta region in China. Remote Sens. Environ. 154, 1–7. doi: 10.1016/j.rse.2014.08.008
Stroeve, J., Meier, W., Scambos, T., Serreze, M., and Holland, M. M. (2007). Arctic sea ice decline: Faster than forecast. Geophys. Res. Lett. 34, 1–5. doi: 10.1029/2007GL029703
Tagesson, T., Schurgers, G., Horion, S., Ciais, P., Tian, F., Brandt, M., et al. (2020). Recent divergence in the contributions of tropical and boreal forests to the terrestrial carbon sink. Nat. Ecol. Evol. 4, 202–209. doi: 10.1038/s41559-019-1090-0
Tang, X., Zhao, X., Bai, Y., Tang, Z., Wang, W., Zhao, Y., et al. (2018). Carbon pools in China’s terrestrial ecosystems: New estimates based on an intensive field survey. Proc. Natl. Acad. Sci. U. S. A. 115, 4021–4026. doi: 10.1073/pnas.1700291115
Tatoğlu, F. Y., and Polat, B. (2021). Occurrence of turnig points on environmental kuznets curve: Sharp breaks or smooth shifts? J. Clean. Prod. 317:128333. doi: 10.1016/j.jclepro.2021.128333
Tharammal, T., Bala, G., Devaraju, N., and Nemani, R. (2019). A review of the major drivers of the terrestrial carbon uptake: model-based assessments, consensus, and uncertainties. Environ. Res. Lett. 14:093005. doi: 10.1088/1748-9326/ab3012
Tian, G., and Qiao, Z. (2014). Assessing the impact of the urbanization process on net primary productivity in China in 1989-2000. Environ. Pollut. 184, 320–326. doi: 10.1016/j.envpol.2013.09.012
Trap, J., Hättenschwiler, S., Gattin, I., and Aubert, M. (2013). Forest ageing: An unexpected driver of beech leaf litter quality variability in European forests with strong consequences on soil processes. For. Ecol. Manage. 302, 338–345. doi: 10.1016/j.foreco.2013.03.011
Viña, A., Yang, H., Xu, Z., Liu, J., and McConnell, W. J. (2016). Effects of conservation policy on China’s forest recovery. Sci. Adv. 2:1500965. doi: 10.1126/sciadv.1500965
Wang, Z., Bai, T., Xu, D., Kang, J., Shi, J., Yan, P., et al. (2022). Temporal and Spatial Changes in Vegetation Ecological Quality and Driving Mechanism in Kökyar Project Area from 2000 to 2021. Sustain. Switz. 14, 1–18. doi: 10.3390/su14137668
Wang, X., Dong, X., Wei, H., Fan, W., Lu, N., Xu, Z., et al. (2017). Linking land use change, ecosystem services and human well-being: A case study of the Manas River Basin of Xinjiang, China. Ecosyst. Serv. 27, 113–123. doi: 10.1016/j.ecoser.2017.08.013
Wang, J., Du, H., Li, X., Mao, F., Zhang, M., Liu, E., et al. (2021a). Remote Sensing Estimation of Bamboo Forest Aboveground Biomass Based on Geographically Weighted Regression. Remote Sens. 13:2962. doi: 10.3390/rs13152962
Wang, S., Fang, C., Ma, H., Wang, Y., and Qin, J. (2014). Spatial differences and multi-mechanism of carbon footprint based on GWR model in provincial China. J. Geogr. Sci. 24, 612–630. doi: 10.1007/s11442-014-1109-z
Wang, J., Feng, L., Palmer, P. I., Liu, Y., Fang, S., Bösch, H., et al. (2020). Large Chinese land carbon sink estimated from atmospheric carbon dioxide data. Nat. Int. Wkly. J. Sci. 586, 720–723. doi: 10.1038/s41586-020-2849-9
Wang, L., Li, C., Ying, Q., Cheng, X., Wang, X., Li, X., et al. (2012). China’s urban expansion from 1990 to 2010 determined with satellite remote sensing. Chin. Sci. Bull. 57, 2802–2812. doi: 10.1007/s11434-012-5235-7
Wang, S., and Liu, X. (2017). China’s city-level energy-related CO2 emissions: Spatiotemporal patterns and driving forces. Appl. Energy 200, 204–214. doi: 10.1016/j.apenergy.2017.05.085
Wang, Q., Ni, J., and Tenhunen, J. (2005). Application of a Geographically-Weighted Regression Analysis to Estimate Net Primary Production of Chinese Forest Ecosystems. Glob. Ecol. Biogeogr. 14, 379–393. doi: 10.1111/j.1466-822X.2005.00153.x
Wang, H., Shi, K., and Liu, G. (2019). What are the driving forces of urban CO2 emissions in China? A refined scale analysis between national and urban agglomeration levels. Int. J. Environ. Res. Public Health 16, 1–9. doi: 10.3390/ijerph16193692
Wang, J., Xiang, Z., Wang, W., Chang, W., and Wang, Y. (2021b). Impacts of strengthened warming by urban heat Island on carbon sequestration of urban ecosystems in a subtropical city of China. Urban Ecosyst. 24, 1165–1177. doi: 10.1007/s11252-021-01104-8
Wang, Z., Yin, F., Zhang, Y., and Zhang, X. (2012). An empirical research on the influencing factors of regional CO2 emissions: Evidence from Beijing city, China. Appl. Energy 100, 277–284. doi: 10.1016/j.apenergy.2012.05.038
Wardle, D. A., Jonsson, M., Bansal, S., Bardgett, R. D., Gundale, M. J., and Metcalfe, D. B. (2012). Linking vegetation change, carbon sequestration and biodiversity: insights from Island ecosystems in a long-term natural experiment. J. Ecol. 100, 16–30. doi: 10.1111/j.1365-2745.2011.01907.x
Wei, B., and Yang, L. (2010). A review of heavy metal contaminations in urban soils, urban road dusts and agricultural soils from China. Microchem. J. 94, 99–107. doi: 10.1016/j.microc.2009.09.014
Windle, M. J. S., Rose, G. A., Devillers, R., and Fortin, M.-J. (2010). Exploring spatial non-stationarity of fisheries survey data using geographically weighted regression (GWR): An example from the Northwest Atlantic. ICES J. Mar. Sci. 67, 145–154. doi: 10.1093/icesjms/fsp224
Wold, S., Sjostrom, M., and Eriksson, L. (2001). PLS-regression: a basic tool of chemometrics. Chemom. Intel. Lab. Syst. 58, 109–130. doi: 10.1016/S0169-7439(01)00155-1
Wu, J., Chen, B., Mao, J., and Feng, Z. (2018). Spatiotemporal evolution of carbon sequestration vulnerability and its relationship with urbanization in China’s coastal zone. Sci. Total Environ. 645, 692–701. doi: 10.1016/j.scitotenv.2018.07.086
Wu, H., Hao, Y., and Ren, S. (2020). How do environmental regulation and environmental decentralization affect green total factor energy efficiency: Evidence from China. Energy Econ. 91:104880. doi: 10.1016/j.eneco.2020.104880
Wu, Z., Wu, J., Liu, J., Lei, T., Wang, Q., and He, B. (2013). Increasing terrestrial vegetation activity of ecological restoration program in the Beijing-Tianjin Sand Source Region of China. Ecol. Eng. 52, 37–50. doi: 10.1016/j.ecoleng.2012.12.040
Xiao, J., Sun, G., McNulty, S., Chen, J., Chen, H., Lu, W., et al. (2013). Carbon fluxes, evapotranspiration, and water use efficiency of terrestrial ecosystems in China. Agric. For. Meteorol. 182–183, 76–90. doi: 10.1016/j.agrformet.2013.08.007
Xiao, C., Wang, Z., Wei, L., Wang, Y., Peng, S., Shi, W., et al. (2018). Sectoral energy-environmental efficiency and its influencing factors in China: Based on S-U-SBM model and panel regression model. J. Clean. Prod. 182, 545–552. doi: 10.1016/j.jclepro.2018.02.033
Xie, Y. J., and Ng, C. N. (2013). Exploring spatio-temporal variations of habitat loss and its causal factors in the Shenzhen River cross-border watershed. Appl. Geogr. 39, 140–150. doi: 10.1016/j.apgeog.2013.01.001
Xu, J., Jiang, Y., Guo, X., and Jiang, L. (2021). Environmental efficiency assessment of heavy pollution industry by data envelopment analysis and malmquist index analysis: Empirical evidence from China. Int. J. Environ. Res. Public Health 18:5761. doi: 10.3390/ijerph18115761
Xu, H., and Zhang, C. (2021). Investigating spatially varying relationships between total organic carbon contents and pH values in European agricultural soil using geographically weighted regression. Sci. Total Environ. 752:141977. doi: 10.1016/j.scitotenv.2020.141977
Yan, B., Fang, N. F., Zhang, P. C., and Shi, Z. H. (2013). Impacts of land use change on watershed streamflow and sediment yield; an assessment using hydrologic modelling and partial least squares regression. J. Hydrol. 484, 26–37. doi: 10.1016/j.jhydrol.2013.01.008
Yan, X., Li, J., Hu, Z., Yang, Z., Yin, S., Cui, L., et al. (2020). Driving forces of grassland vegetation changes in Chen Barag Banner, Inner Mongolia. GIScience Remote Sens. 57, 753–769. doi: 10.1080/15481603.2020.1794395
Yang, Y., Shi, Y., Sun, W., Chang, J., Zhu, J., Chen, L., et al. (2022). Terrestrial carbon sinks in China and around the world and their contribution to carbon neutrality. Sci. China Life Sci. 65, 1–35. doi: 10.1007/s11427-021-2045-5
Yang, S., Yang, X., Gao, X., and Zhang, J. (2022). Spatial and temporal distribution characteristics of carbon emissions and their drivers in shrinking cities in China: Empirical evidence based on the NPP/VIIRS nighttime lighting index. J. Environ. Manage. 322:116082. doi: 10.1016/j.jenvman.2022.116082
Yang, X., Zhou, Z., Li, J., Fu, X., Mu, X., and Li, T. (2016). Trade-offs between carbon sequestration, soil retention and water yield in the Guanzhong-Tianshui Economic Region of China. J. Geogr. Sci. 26, 1449–1462. doi: 10.1007/s11442-016-1337-5
Yao, N., Jia, L., Duan, J., Ma, L., Konijnendijk van den Bosch, C. C., Devisscher, T., et al. (2019). Beijing’s 50 million new urban trees: Strategic governance for large-scale urban afforestation. Urban For. Urban Green. 44, 1–13. doi: 10.1016/j.ufug.2019.126392
Yin, S., Gong, Z., Deng, Y., Niu, Y., and Gu, L. (2022). Driving forces of the efficiency of forest carbon sequestration production: Spatial panel data from the national forest inventory in China. J. Clean. Prod. 330, 1–11. doi: 10.1016/j.jclepro.2021.129776
Yin, Y., Hou, X., Zhou, X., Zhang, D., and Liu, J. (2022). Detection and attribution of changes in cultivated land use ecological efficiency: A case study on Yangtze River Economic Belt, China. Ecol. Indic. 137, 1–17. doi: 10.1016/j.ecolind.2022.108753
Yu, S., Ye, Q., Li, Z., Zhang, M., Zhu, H., Zhao, Z., et al. (2022). Effects of Driving Factors on Forest Aboveground Biomass (AGB) in China’s Loess Plateau by Using Spatial Regression Models. Remote Sens. (Basel) 14. doi: 10.3390/rs14122842
Yuan, B., Cui, Y., Wang, X., and Xu, H. (2022). Study on the heterogeneity of China’s agricultural economic growth in the context of temperature shocks. Sci. Rep. 12, 1–15. doi: 10.1038/s41598-022-11877-3
Zhang, Y.-J., and Da, Y.-B. (2015). The decomposition of energy-related carbon emission and its decoupling with economic growth in China. Renew. Sustain. Energy Rev. 41, 1255–1266. doi: 10.1016/j.rser.2014.09.021
Zhang, P., He, J., Hong, X., Zhang, W., Qin, C., Pang, B., et al. (2018). Carbon sources/sinks analysis of land use changes in China based on data envelopment analysis. J. Clean. Prod. 204, 702–711. doi: 10.1016/j.jclepro.2018.08.341
Zhang, X., Peng, S., Piao, S., Zhu, Z., Wang, Y.-P., Rayner, P. J., et al. (2018). Dominant regions and drivers of the variability of the global land carbon sink across timescales. Glob. Chang. Biol. 24, 3954–3968. doi: 10.1111/gcb.14275
Zhang, C., Tian, H., Chen, G., Chappelka, A., Xu, X., Ren, W., et al. (2012). Impacts of urbanization on carbon balance in terrestrial ecosystems of the Southern United States. Environ. Pollut. 164, 89–101. doi: 10.1016/j.envpol.2012.01.020
Zhang, Y., Wang, T., Cai, C., Li, C., and Bao, Y. (2015). County-level patterns of cropland and their relationships with socio-economic factors in northwestern China. Agric. Ecosyst. Environ. 203, 11–18. doi: 10.1016/j.agee.2014.11.016
Zhang, K., Zhang, Q., Song, C., and Zhang, Y. (2017). Natural disasters and economic development drive forest dynamics and transition in China. For. Policy Econ. 76, 56–64. doi: 10.1016/j.forpol.2015.08.010
Zhang, H., Zhang, X., and Yuan, J. (2021). Driving forces of carbon emissions in China: a provincial analysis. Environ. Sci. Pollut. Res. 28, 21455–21470. doi: 10.1007/s11356-020-11789-7
Zhao, J., and Ren, S. (2022). Urban Residential CO2 from Spatial and Non-Spatial Perspectives: Regional Difference between Northern and Southern China. Atmos. 13, 1–17. doi: 10.3390/atmos13081240
Zhou, Y., Chen, X., Shen, M., Liu, W., and Lv, X. (2019). Investigating interior driving factors and cross-industrial linkages of carbon emission efficiency in China’s construction industry: Based on Super-SBM DEA and GVAR model. J. Clean. Prod. 241, 1–13. doi: 10.1016/j.jclepro.2019.118322
Zhou, C., Shi, C., Wang, S., and Zhang, G. (2018). Estimation of eco-efficiency and its influencing factors in Guangdong Province based on Super-SBM and panel regression models. Ecol. Indic. 86, 67–80. doi: 10.1016/j.ecolind.2017.12.011
Keywords: carbon emission, carbon sequestration, terrestrial ecosystems, driving factors, spatial and temporal characteristics
Citation: Lin J, Guo Y, Li J, Shao M and Yao P (2023) Spatial and temporal characteristics of carbon emission and sequestration of terrestrial ecosystems and their driving factors in mainland China—a case study of 352 prefectural administrative districts. Front. Ecol. Evol. 11:1169427. doi: 10.3389/fevo.2023.1169427
Edited by:
Salvador García-Ayllón Veintimilla, Technical University of Cartagena, SpainReviewed by:
Jincai Zhao, Henan Normal University, ChinaFuqiang Dai, Chongqing Technology and Business University, China
Copyright © 2023 Lin, Guo, Li, Shao and Yao. This is an open-access article distributed under the terms of the Creative Commons Attribution License (CC BY). The use, distribution or reproduction in other forums is permitted, provided the original author(s) and the copyright owner(s) are credited and that the original publication in this journal is cited, in accordance with accepted academic practice. No use, distribution or reproduction is permitted which does not comply with these terms.
*Correspondence: Ming Shao, c2hhb18wNzAxQGZveG1haWwuY29t; Peng Yao, Y2hpbmF5cDgxNUAxNjMuY29t