 Bing Wang1,2
 Li He
Li He Zhengwei He
94% of researchers rate our articles as excellent or good
Learn more about the work of our research integrity team to safeguard the quality of each article we publish.
Find out more
ORIGINAL RESEARCH article
Front. Ecol. Evol., 21 April 2023
Sec. Environmental Informatics and Remote Sensing
Volume 11 - 2023 | https://doi.org/10.3389/fevo.2023.1169028
This article is part of the Research TopicManagement and Monitoring of Natural Disasters Using Remote Sensing and Ground-Based DataView all 5 articles
Landslide disasters with dense vegetation and steep terrain, and high concealment frequently occur in Southwest China. Current field surveys, unmanned aerial vehicle (UAV) photogrammetry, and Interferometric Synthetic Aperture Radar (InSAR) technologies all have limitations in complex environments with high vegetation coverage. In this study, the landslide in Xinmo Village, Mao County, Aba Prefecture, Sichuan Province, was used as the research object. The slope types were divided according to the regional stratum occurrence and slope direction, and the dip slope was identified as the pre-selected area for the landslide. Nine vegetation indexes were constructed based on Landsat 8 Operational Land Imager (OLI) data, and Modified Soil Adjusted Vegetation Index (MSAVI) with high correlation was selected as the indicator of landslide change to estimate the vegetation coverage. The relationship between vegetation anomalies and landslide creep was analyzed by superimposing slope structure and vegetation spatial variation characteristics. The results showed that from May 2015 to May 2017, the vegetation coverage in the landslide main source area, above the deformation body, local collapse area, and around the washouts showed a significant decrease; i.e., as the time of landslide was approaching, some vegetation in the study area was affected by the landslide deformation and the growth condition became worse. Between April and May 2017, the vegetation coverage in the area not affected by the landslide was less than 0.6 (i.e., bare ground area) decreased abruptly, with change rates of 78.4, 87.7, and 89.7%, respectively, which is consistent with the development pattern of vegetation in the growing period; while the reduction rate of image elements in the vegetation abnormal area was only 20.5%, which judged that the vegetation might be affected by landslide creep and the growth and development were hindered. The study shows that there is an obvious spatial–temporal correlation between vegetation anomalies and landslide deformation during the landslide creep phase, which indirectly reflects the evolution process of landslide gradual destabilization and provides a theoretical basis for the early identification of landslides in high vegetation coverage areas.
Landslide is a phenomenon in which a slope’s geotechnical body slides downwards as a whole or scattered along a penetrating damage surface under the action of factors such as the natural environment and human activities (James and Sitharam, 2013; Bogaard and Greco, 2016). Landslide disasters are also one of the most frequent, widespread, and costly geological disasters in the world (Gao et al., 2017). Between 1998 and 2017, a total of 378 major landslides occurred all over the earth which accounts for the deaths of 18,141 people, 4.8 billion people were affected, and US$ 8 billion resources were fully damaged worldwide (Pal et al., 2019). with approximately 66 million people in Asia living at risk in landslide-prone areas (Tien Bui et al., 2019). To effectively reduce the human and economic losses caused by landslide disasters, there is an urgent need for effective early identification and monitoring of landslides on a global scale.
In recent years, landslide disasters have occurred frequently in southwest China, where valley slopes are steep and vegetation is dense (Xu et al., 2019). For example, the landslide in Nayong, Guizhou in August 2017 (Zheng et al., 2018), the landslide in Xinmo Village, Mao County, Sichuan in June 2017 (Yin et al., 2017), and the landslide in Sanxi Village, Dujiangyan, Sichuan in July 2013 (Liang et al., 2014). The landslides were characterized by high elevation, high vegetation coverage, and high concealment. Landslide hazard areas are difficult to carry out through traditional field surveys and UAV photogrammetry technology, InSAR technology is affected by high vegetation coverage and cannot effectively detect the pre-deformation development characteristics of landslides (Xu, 2020). According to relevant research statistics, 80% of landslide disasters occur outside the range of identified hidden sites, and 70% of landslide disasters occur in western mountainous areas that are difficult to reach by on-site investigation (Ge et al., 2019). Therefore, for highly concealed areas with high vegetation coverage, how to effectively predict the location of landslide occurrence is still an important research direction for early identification, evaluation, and prevention of landslides.
With the emergence of advanced technologies such as modern satellite remote sensing, unmanned aerial vehicle remote sensing, and wireless sensor networks, landslide monitoring technologies have developed significantly. Landslide monitoring mainly focuses on deformation and rainfall, and the monitoring technology methods cover optical remote sensing technology (Martha et al., 2010), satellite-based InSAR technology (Tofani et al., 2013), UAV photogrammetry technology (Kong et al., 2020), LiDAR technology (Du et al., 2019) and machine learning, etc. (Arabameri et al., 2020). Among them, the satellite-based InSAR technology can accurately extract information about small deformations on the Earth’s surface, but it is also limited by the revisit cycle of satellites, which cannot increase the frequency of photography in some areas, covers fewer periods, and cannot detect high vegetation coverage areas (Li et al., 2019). UAV technology, as a new type of high-precision telemetry, compensates for the accuracy problems of satellite-based telemetry, but it is mainly used as a useful supplement to satellite remote sensing. LiDAR technology has a unique and practical vegetation removal function to form a digital elevation model of bare ground (Mezaal et al., 2017), but its high cost is not suitable for monitoring a large range of long-time sequences. Other scholars have built landslide susceptibility models based on machine learning algorithms or artificial intelligence techniques to achieve landslide spatial prediction (Chowdhuri et al., 2020), which will enable the development of geological hazard potential identification toward intelligent automation.
At present, there have been a large number of related studies on landslide disaster detection by optical remote sensing technology. Its application in landslide research has gradually developed from single data to multi-temporal and multi-source data fusion analysis, and from static landslide disaster identification and morphological analysis to the dynamic observation of the deformation process (Xu et al., 2022). However, the use of optical remote sensing for landslide disaster identification requires extensive professional background knowledge of the interpreters, while the dense vegetation in high vegetation coverage areas obscures and suppresses the morphological characteristics of the landslide surface, cannot provide the deformation characteristics and more accurate quantitative information (Chen et al., 2014). For high vegetation coverage areas, a few scholars have also studied landslides using vegetation with the help of optical remote sensing technology (Zhang et al., 2018). For example, Saito et al. (2022) used multi-temporal high-resolution satellite images and UAV terrain data to explore the recovery of vegetation after the Aso volcano-induced landslide in Japan by Normalized Difference Vegetation Index (NDVI) and its ratio, and found that the NDVI ratio decreased significantly after the landslide occurred while reaching the same vegetation level as before the landslide after 12 years. Taking Jiuzhaigou, Sichuan Province, as an example, Guo et al. (2022) proposed to use multi-temporal remote sensing images before and after the landslide as data source, to detect changes in pixels based on NDVI, and to complete landslide identification by combining object-oriented geometric rules. The above studies mainly focus on the extraction and rapid detection of landslides after landslides based on NDVI vegetation index, as well as the monitoring of vegetation recovery before and after landslides for landslide identification, while less research has been conducted on landslide development by using such weak information as vegetation changes around Pre-sliding slopes to play its indicative role on landslide creep. and the selection of NDVI as a landslide monitoring index was interfered by factors such as soil, seasonal phase, and sensor differences, leading to easy saturation of its value and reduced sensitivity to high vegetation density areas, making it more difficult to meet the accuracy requirements for early identification of such landslides (Small, 2001).
Therefore, this study proposes an efficient, low-cost, and universal landslide early identification method for high vegetation coverage areas. Through the combination of optical remote sensing and ecology, the dynamic change characteristics of vegetation in remote sensing images of the landslide development stage were extracted, and the internal relationship between vegetation anomaly and landslide creep was explored by using multi-temporal spatial feature sequence, and the landslide monitoring index with vegetation as the core change was constructed. The apparent remote sensing phenomenon indirectly reflects the deformation process of landslides and provides a new research idea for obtaining landslide precursor information in high vegetation coverage areas.
The study area is located in Xinmo Village, Mao County, Aba Tibetan and Qiang Autonomous Prefecture, Sichuan Province, in the overlap between the Qinghai-Tibetan Plateau and the western Sichuan Plain, and in the middle of the upper reaches of the Minjiang River. The terrain is dominated by high mountains and valleys, with an altitude of 857-5,133 m, the terrain is high in the northwest and low in the southeast, and the Minjiang River system runs from north to south throughout the area (Figure 1). The natural landscape of the study area is characterized by high mountains and dense vegetation, with a high vegetation coverage of approximately 75% (Figure 2). The climate is dry and windy, and the annual rainfall is unevenly distributed, mostly concentrated from May–October. with a maximum daily precipitation of 75.2 mm and heavy transient rainfall, resulting in widespread geological disasters such as landslides, collapses, and mudslides in the Mao County area (Liu et al., 2019). The Maowen Fault and the Longmenshan Fault are frequently active in the study area, with deep rock joints and fragile geological conditions (Fan et al., 2017). The regional stratigraphy is dominated by the Malcolm Division strata, with the , , , , Q, C, (Figure 3).
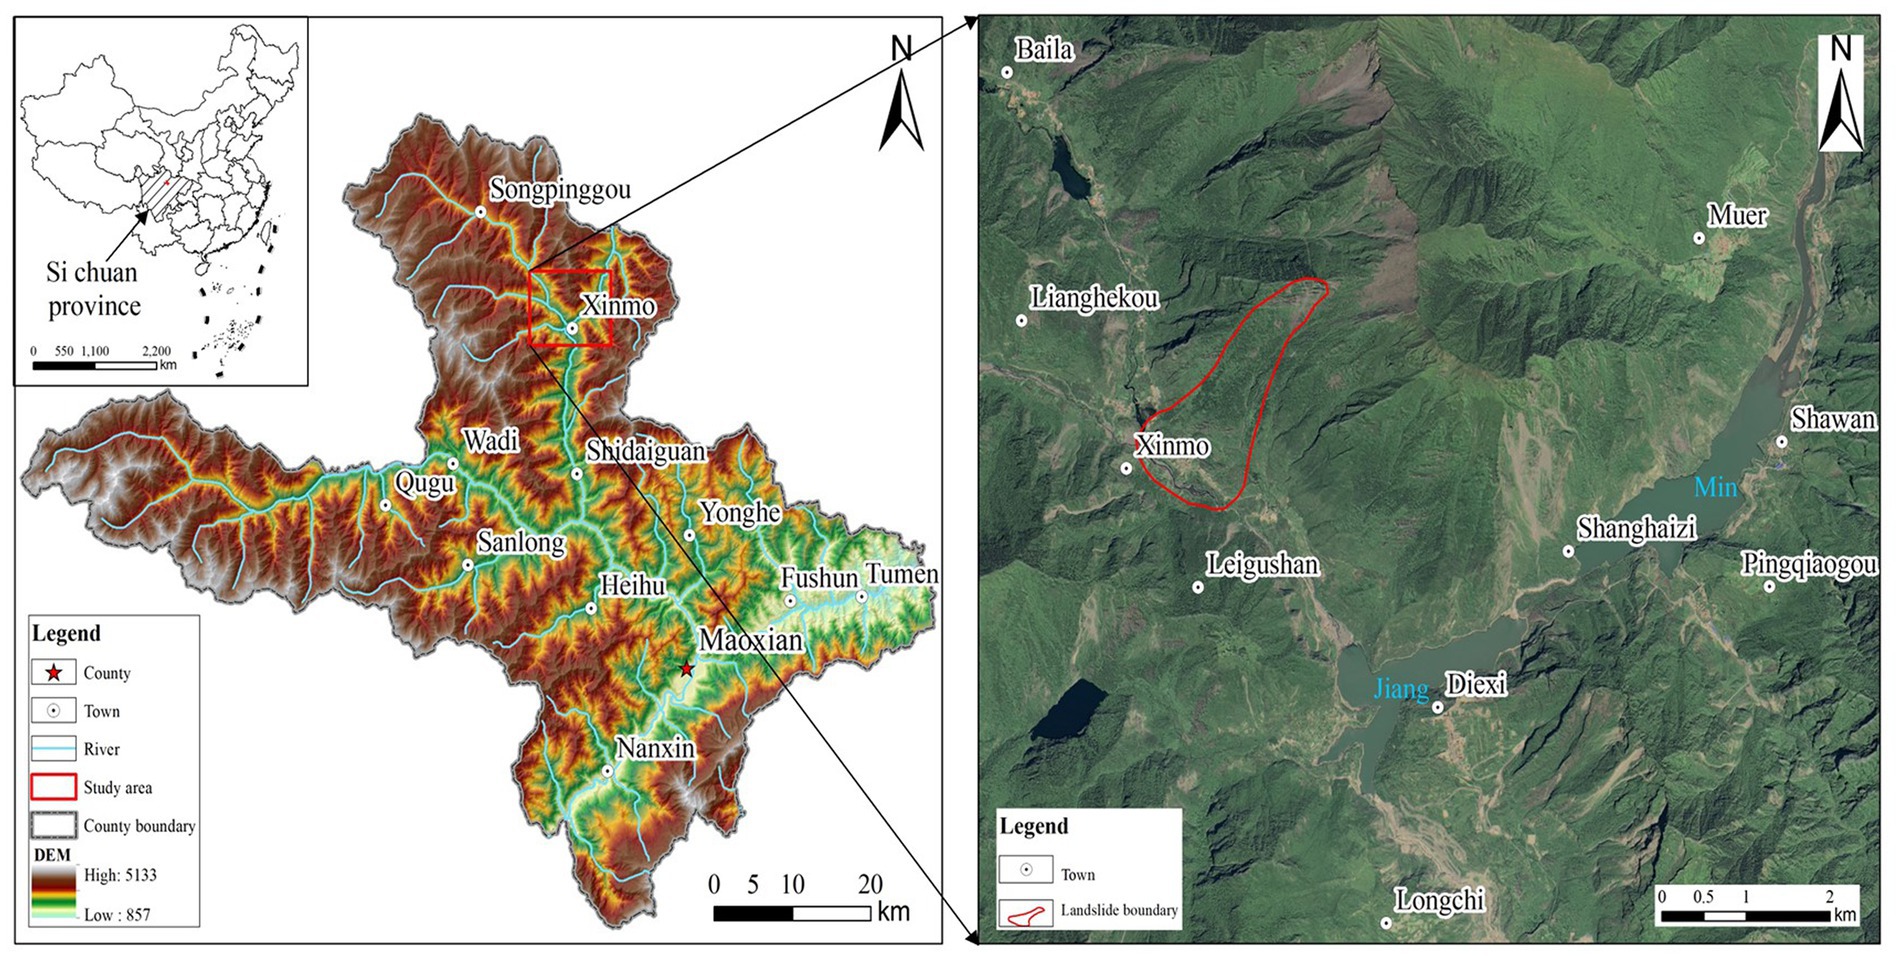
Figure 1. Location map of Mao county study area, Aba Prefecture, Sichuan Province.
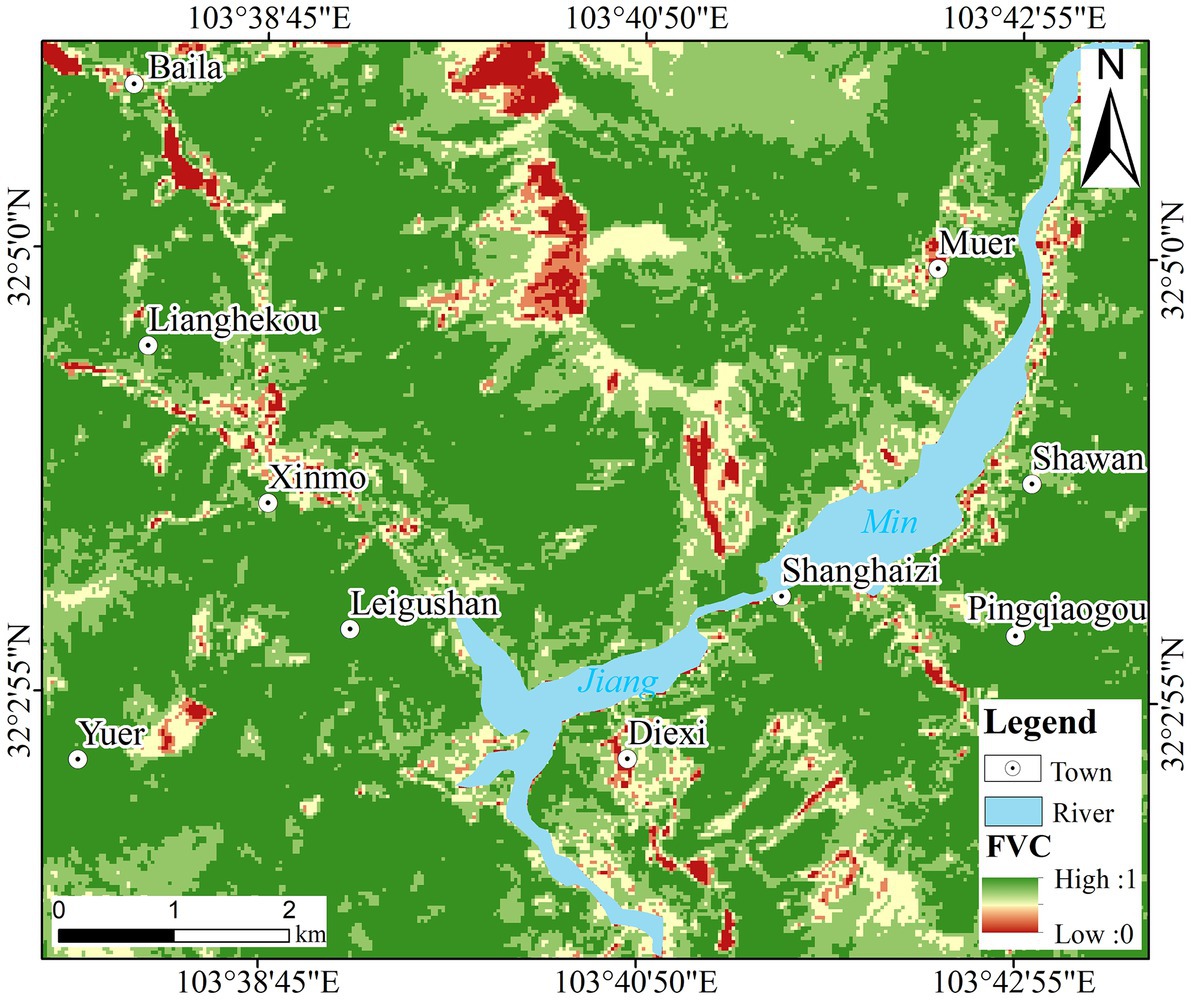
Figure 2. Vegetation coverage map of the study area.
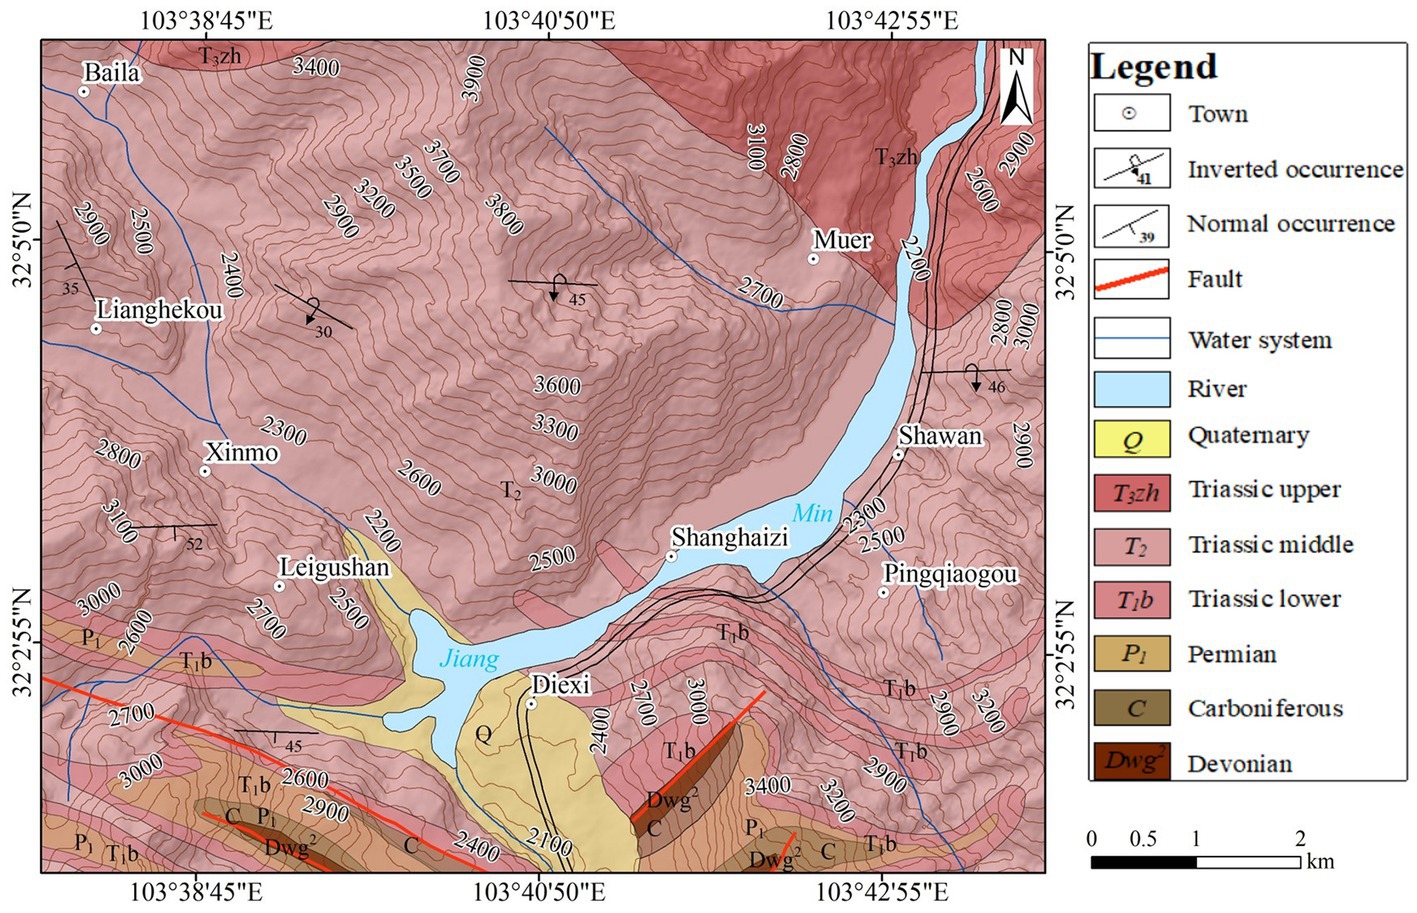
Figure 3. Geological map of the study area.
The Xinmo landslide occurred at about 6:00 (GMT + 8) on June 24, 2017, in Xinmo Village, Diexi Town, Mao County, Sichuan Province (Li et al., 2022). The back edge of the slope is approximately 3,400 m and the front edge is approximately 2,200 m, with a difference in elevation of 1,200 m. The mountain where the landslide is located is clamped by the Songpinggou fault and the Minjiang fault. The original slope is steep at the top and gentle at the bottom. The upper section is mainly bedrock slope with a slope of up to 50° in the material source area, and the lower section is old landslide deposits with a gentle slope (He et al., 2017; Su et al., 2017). From the above, it is clear that the Xinmo Village landslide is high, steep, densely covered with vegetation and extremely concealed, making it difficult to carry out through traditional means, UAV photogrammetry, and InSAR technology.
Taking into account the resolution of the remote sensing images, the reflection of the vegetation and the quality of the images available, Landsat 8 OLI satellite images were selected for this study, with data from the United States Geological Survey (USGS).1 The Landsat 8 satellite carries two sensors, the Operational Land Imager (OLI) and the Thermal Infrared red Sensor (TIRS), with 11 bands, bands 1–7, 9–11 with a spatial resolution of 30 m and band 8 with a panchromatic resolution of 15 m, providing a reliable data source for vegetation growth information (Chu et al., 2013).
In terms of temporal phase, to avoid the interference of seasonal and natural growth factors on the abnormal characteristics of vegetation, 3 images in May 2015, May 2016, and May 2017 that were close to the month of the landslide were selected. Due to the influence of clouds and fog, 2 images of Landsat 8 OLI from April 2017 and May 2017 were selected to obtain the growth of vegetation at the time of the landslide proximity (Table 1).
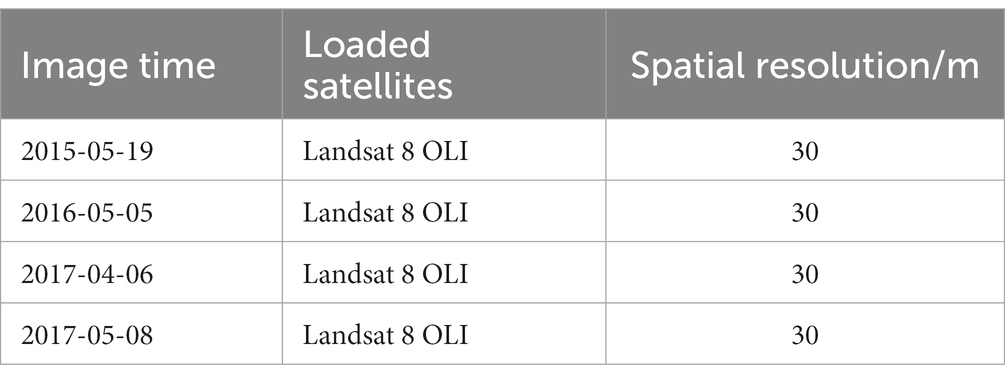
Table 1. Remote sensing image information used in this paper.
In this study, the Advanced Land Observing Satellite (ALOS) satellite launched by Japan in 2006 was selected to acquire ALOS 12.5 m Digital Elevation Model (DEM) data from National Aeronautics and Space Administration (NASA).2 It has higher accuracy compared with other DEM data and extracts elevation, slope, and slope direction information from it, which is widely used in various natural hazard surveys and mapping studies.
The geological data of stratum lithology, geological structure, and occurrence in the study area are mainly obtained from the “Regional Geological Survey Report-1: 200,000 Songpan Area” compiled by the Second Regional Geological Survey Team of the Sichuan Provincial Geological Bureau in 1975.
This study is oriented toward high vegetation coverage areas with complex geological elements, where a single technical approach has a specific scope of application and limitations. The research methodology is divided into four steps: (1) data preparation; (2) landslide pre-selection; (3) landslide monitoring indicator selection; and (4) identification and quantitative analysis of landslide hazard areas. In the first step, data are collected from satellites and Google images and geological information, which are pre-processed and analyzed. In the second step, topography (elevation, gradient, slope direction), underlying geology (lithology production), and environmental conditions (water system) are selected as landslide evaluation factors to analyze the spatial distribution of disasters and to establish landslide pre-selection areas. In the third step, nine vegetation indexes were constructed based on Landsat 8 OLI image data, and the index with the highest correlation and better dispersion with vegetation coverage was selected as the landslide monitoring indicator through the correlation analysis of the nine indexes. In the fourth step, the phenological phenomena and quantitative analysis of image pixels of abnormal vegetation changes on remote sensing images were extracted and overlaid with the above landslide pre-selected areas, and finally, the landslide hazards were verified through the analysis of Google Earth satellite images. The research process is shown in Figure 4.
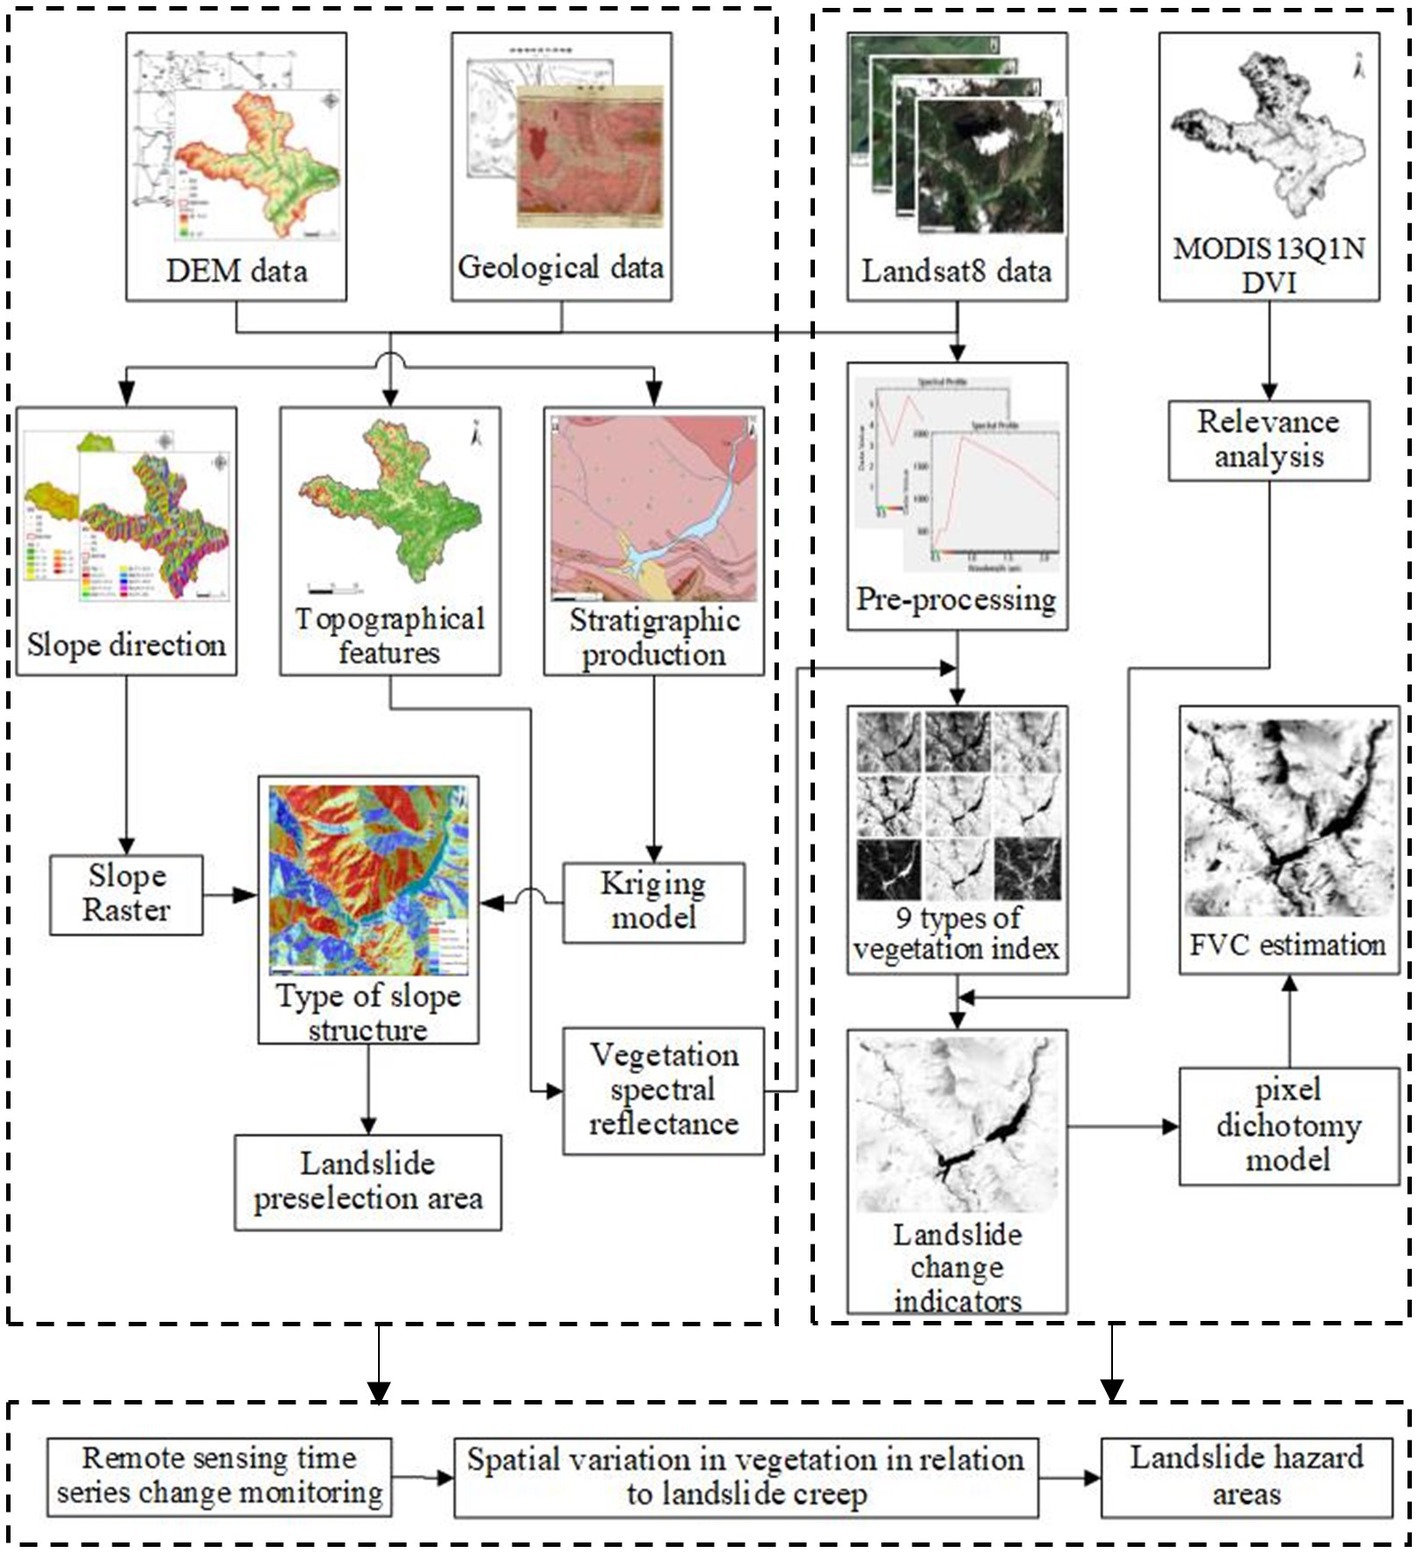
Figure 4. Technology roadmap.
Different slopes, with different elevations, slope directions, geological formations, and surface environments, are bound to have different impacts on the stability of the slope, thus affecting the probability of landslide disasters. The environmental factors of landslide breeding in the study area are mainly topography and geomorphology, basic geology, and environmental conditions. According to the study of LCFs and the characteristics of the study area itself, five LCFs, namely elevation, gradient, slope direction, rock production, and water system, are selected through remote sensing image processing and ArcGIS spatial analysis and other technical means (Table 2).
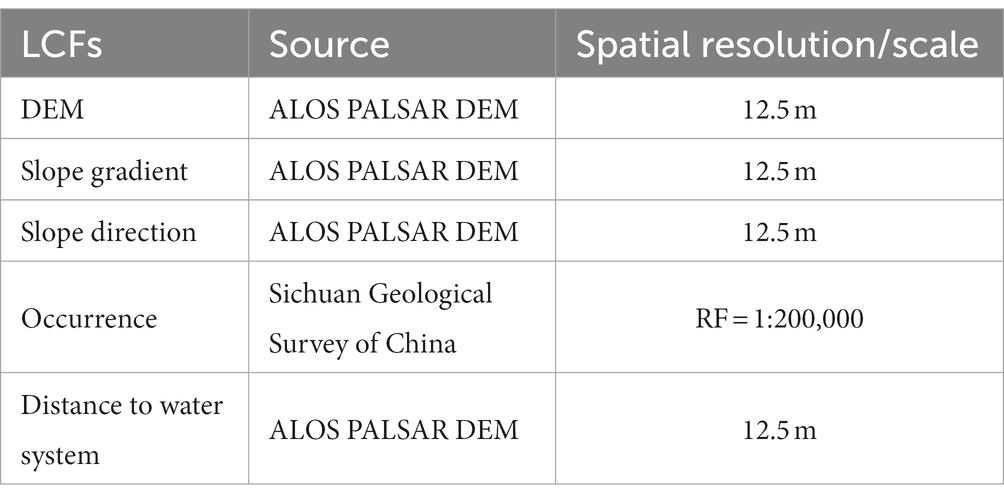
Table 2. Landslide causative factors.
In landslide sensitivity evaluation, the covariance between landslide factors can affect the accuracy of model predictions. Therefore, to improve the accuracy and robustness of the model, it is necessary to analyze the multicollinearity among the landslide causative factors before model construction (Sahana et al., 2020). In this study, the variance inflation factor (VIF) and tolerance level (TOL) were used to analyze the multicollinearity of the extracted landslide factors, and the results are shown in Table 3. The VIF values of the five selected landslide evaluation factors were found to be less than 2 and the TOL values were found to be greater than 0.5, indicating that there was no covariance among the selected landslide causative indicators, and therefore the five landslide factors could be used in the landslide model construction.
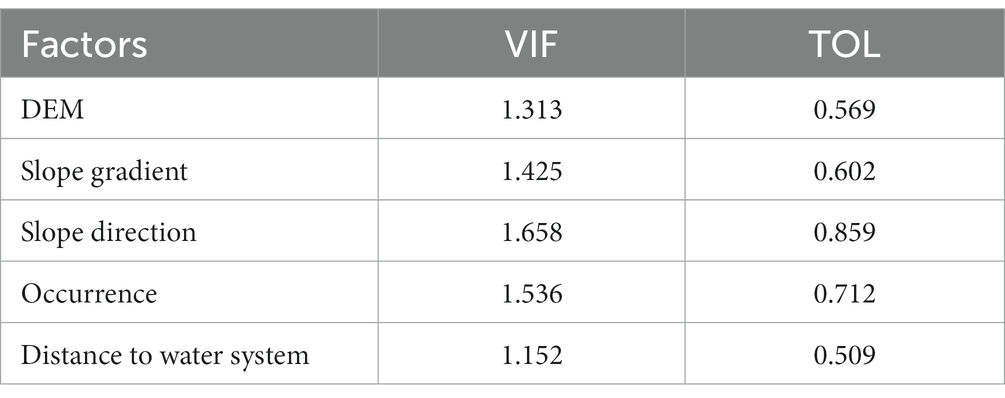
Table 3. Results of multicollinearity tests for landslide causative factors.
The slope structure is a combination of different rock structures and slope surfaces, and the complexity of the rock structures in the study area determines the variety of slope structure types (Wen et al., 2020). Due to the different geological environments in each region, the distribution of slope types also shows differences, but in general, the slope direction of the dip slope and rock tendency are basically the same, and it is an unstable slope prone to disasters compared with other slope structures (Chen et al., 2021). In this study, using the LCFs in the area, the relationship between the occurrence of rock and the slope direction in the region was used to classify the slope structure types in the region as follows: dip slope, down slope, transverse slope, reverse slope, counter-tilt slope, and combined with the visual interpretation results, the red dip slope part in Figure 5 was identified as a pre-selected area for landslides.
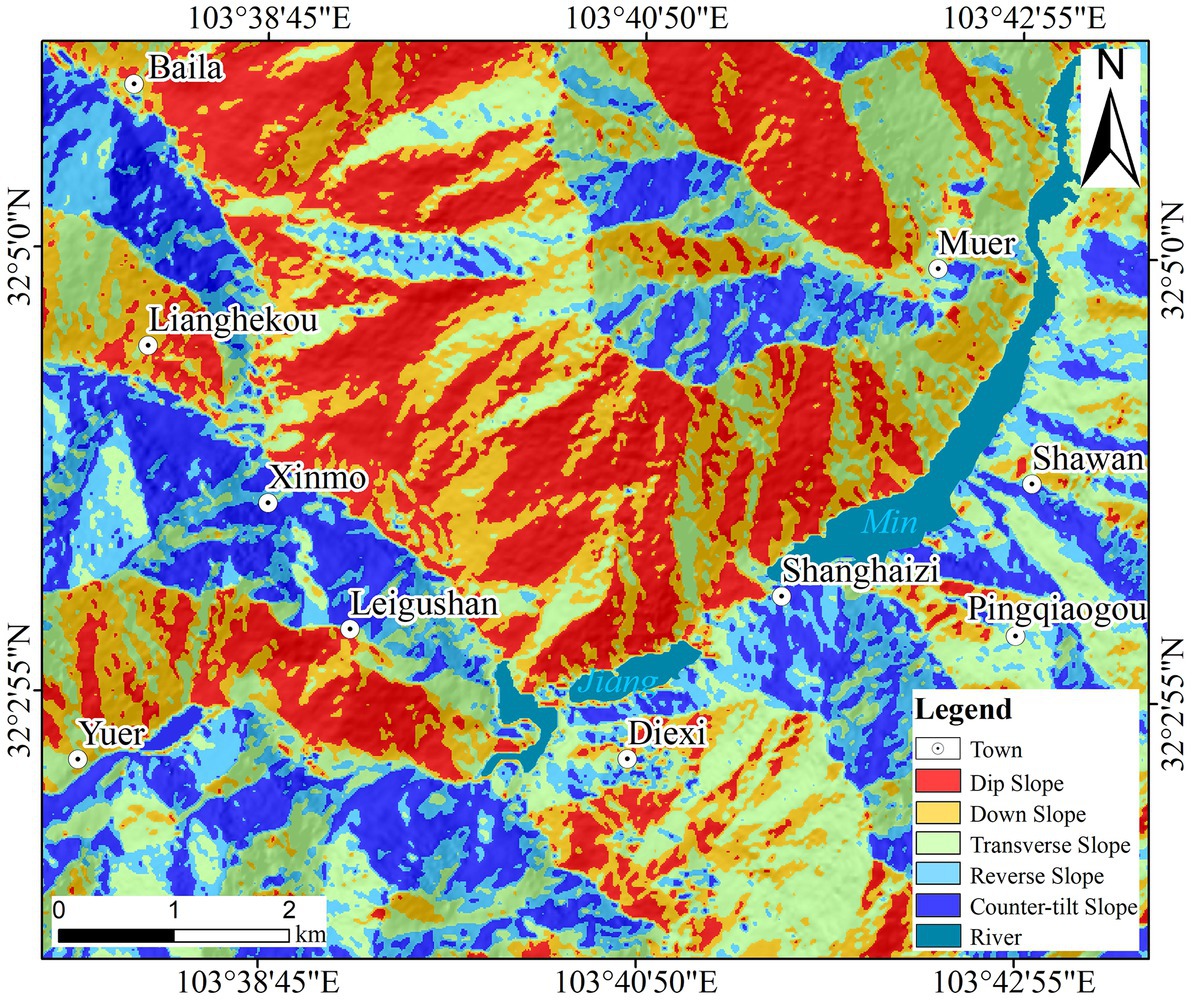
Figure 5. Classification of slope structure types in the study area.
During the landslide development stage, the vegetation on the slope is also undergoing abnormal changes, and the vegetation index can reflect the vegetation growth, coverage, and biomass, so this study indirectly reflects the creeping process of landslide through the dynamic change of vegetation. Since the selection of vegetation index has a direct impact on the estimation results of vegetation coverage. It can be seen from Figure 6 that each curve represents a different vegetation coverage, with the lowermost curve indicating no vegetation coverage and 0% FVC, the uppermost indicating complete coverage of vegetation was 100%. In the blue band range (450–515 nm) within the visible band, as the vegetation coverage increases (FVC from 0% to 100%), the corresponding vertical coordinate develops downward, with a tendency for the reflectance to decrease. While the reflectance in the green band (525–600 nm) tends to increase in the high vegetation coverage area, the reflectance in the red band (630–680 nm) tends to decrease more obviously, and the reflectance in the near-infrared band (845–885 nm) tends to decrease. and the increase rate is relatively larger. The spectral reflectance of bare soil is significantly higher in the red band (630–680 nm) and lower in the near-infrared band (845–885 nm) than that of vegetation coverage, and the pattern of vegetation spectral reflectance with vegetation coverage is not obvious after 1,000 nm (Xie et al., 2020). Therefore, the following nine vegetation indexes with reflectance less than 1,000 nm were chosen for the study area in Mao County, Sichuan Province, which is deep inland and densely vegetated. The formulae are shown in Table 4 and the different vegetation indexes calculated for the study area are shown in Figure 7.
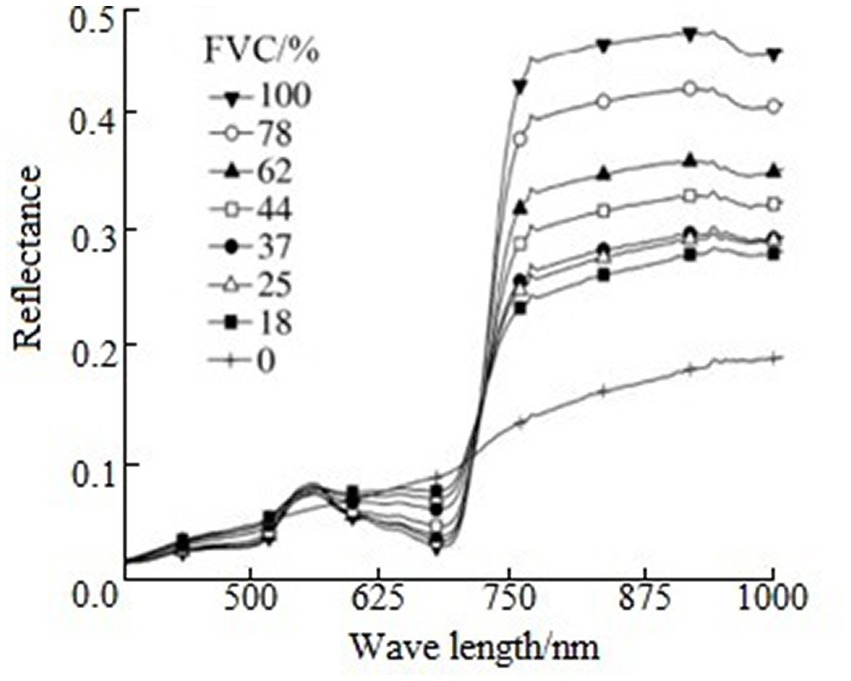
Figure 6. Reflectance spectra of vegetation in different levels of vegetation coverage (Xu et al., 2012).
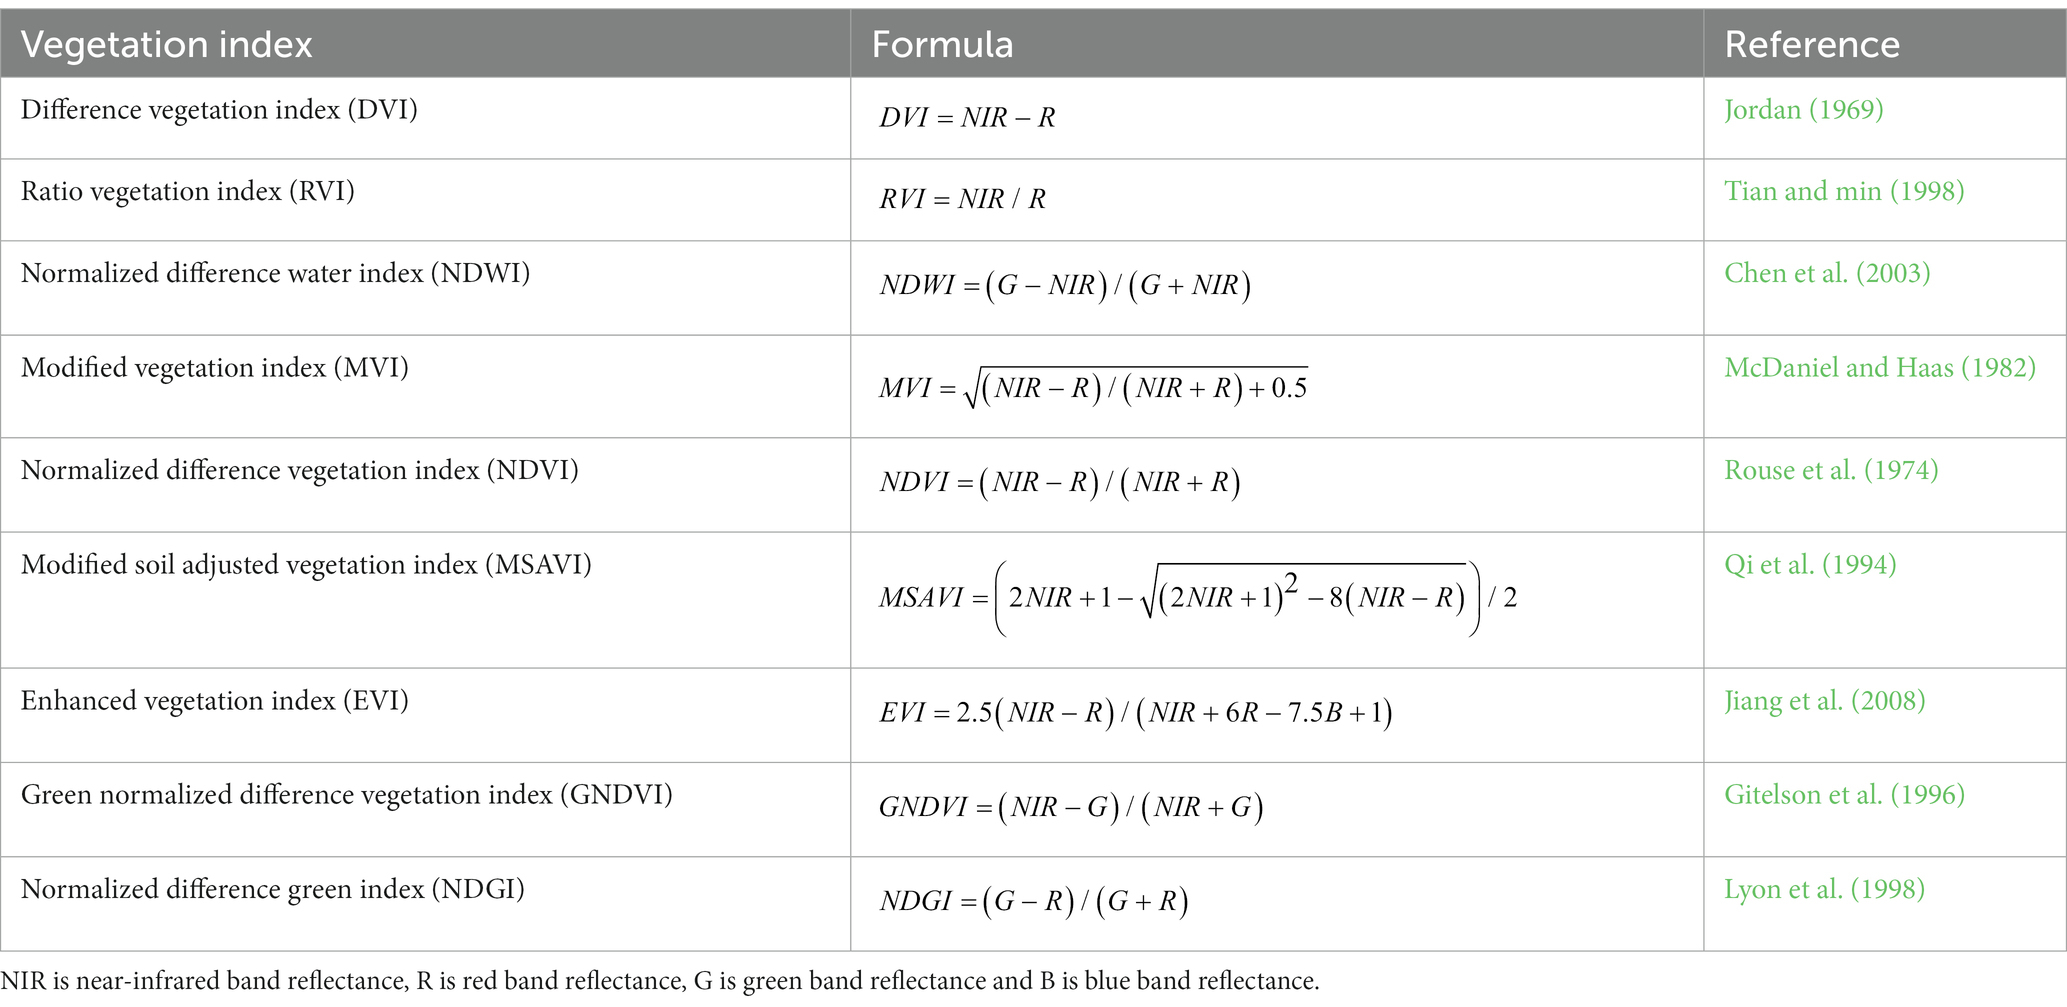
Table 4. Vegetation indexes.
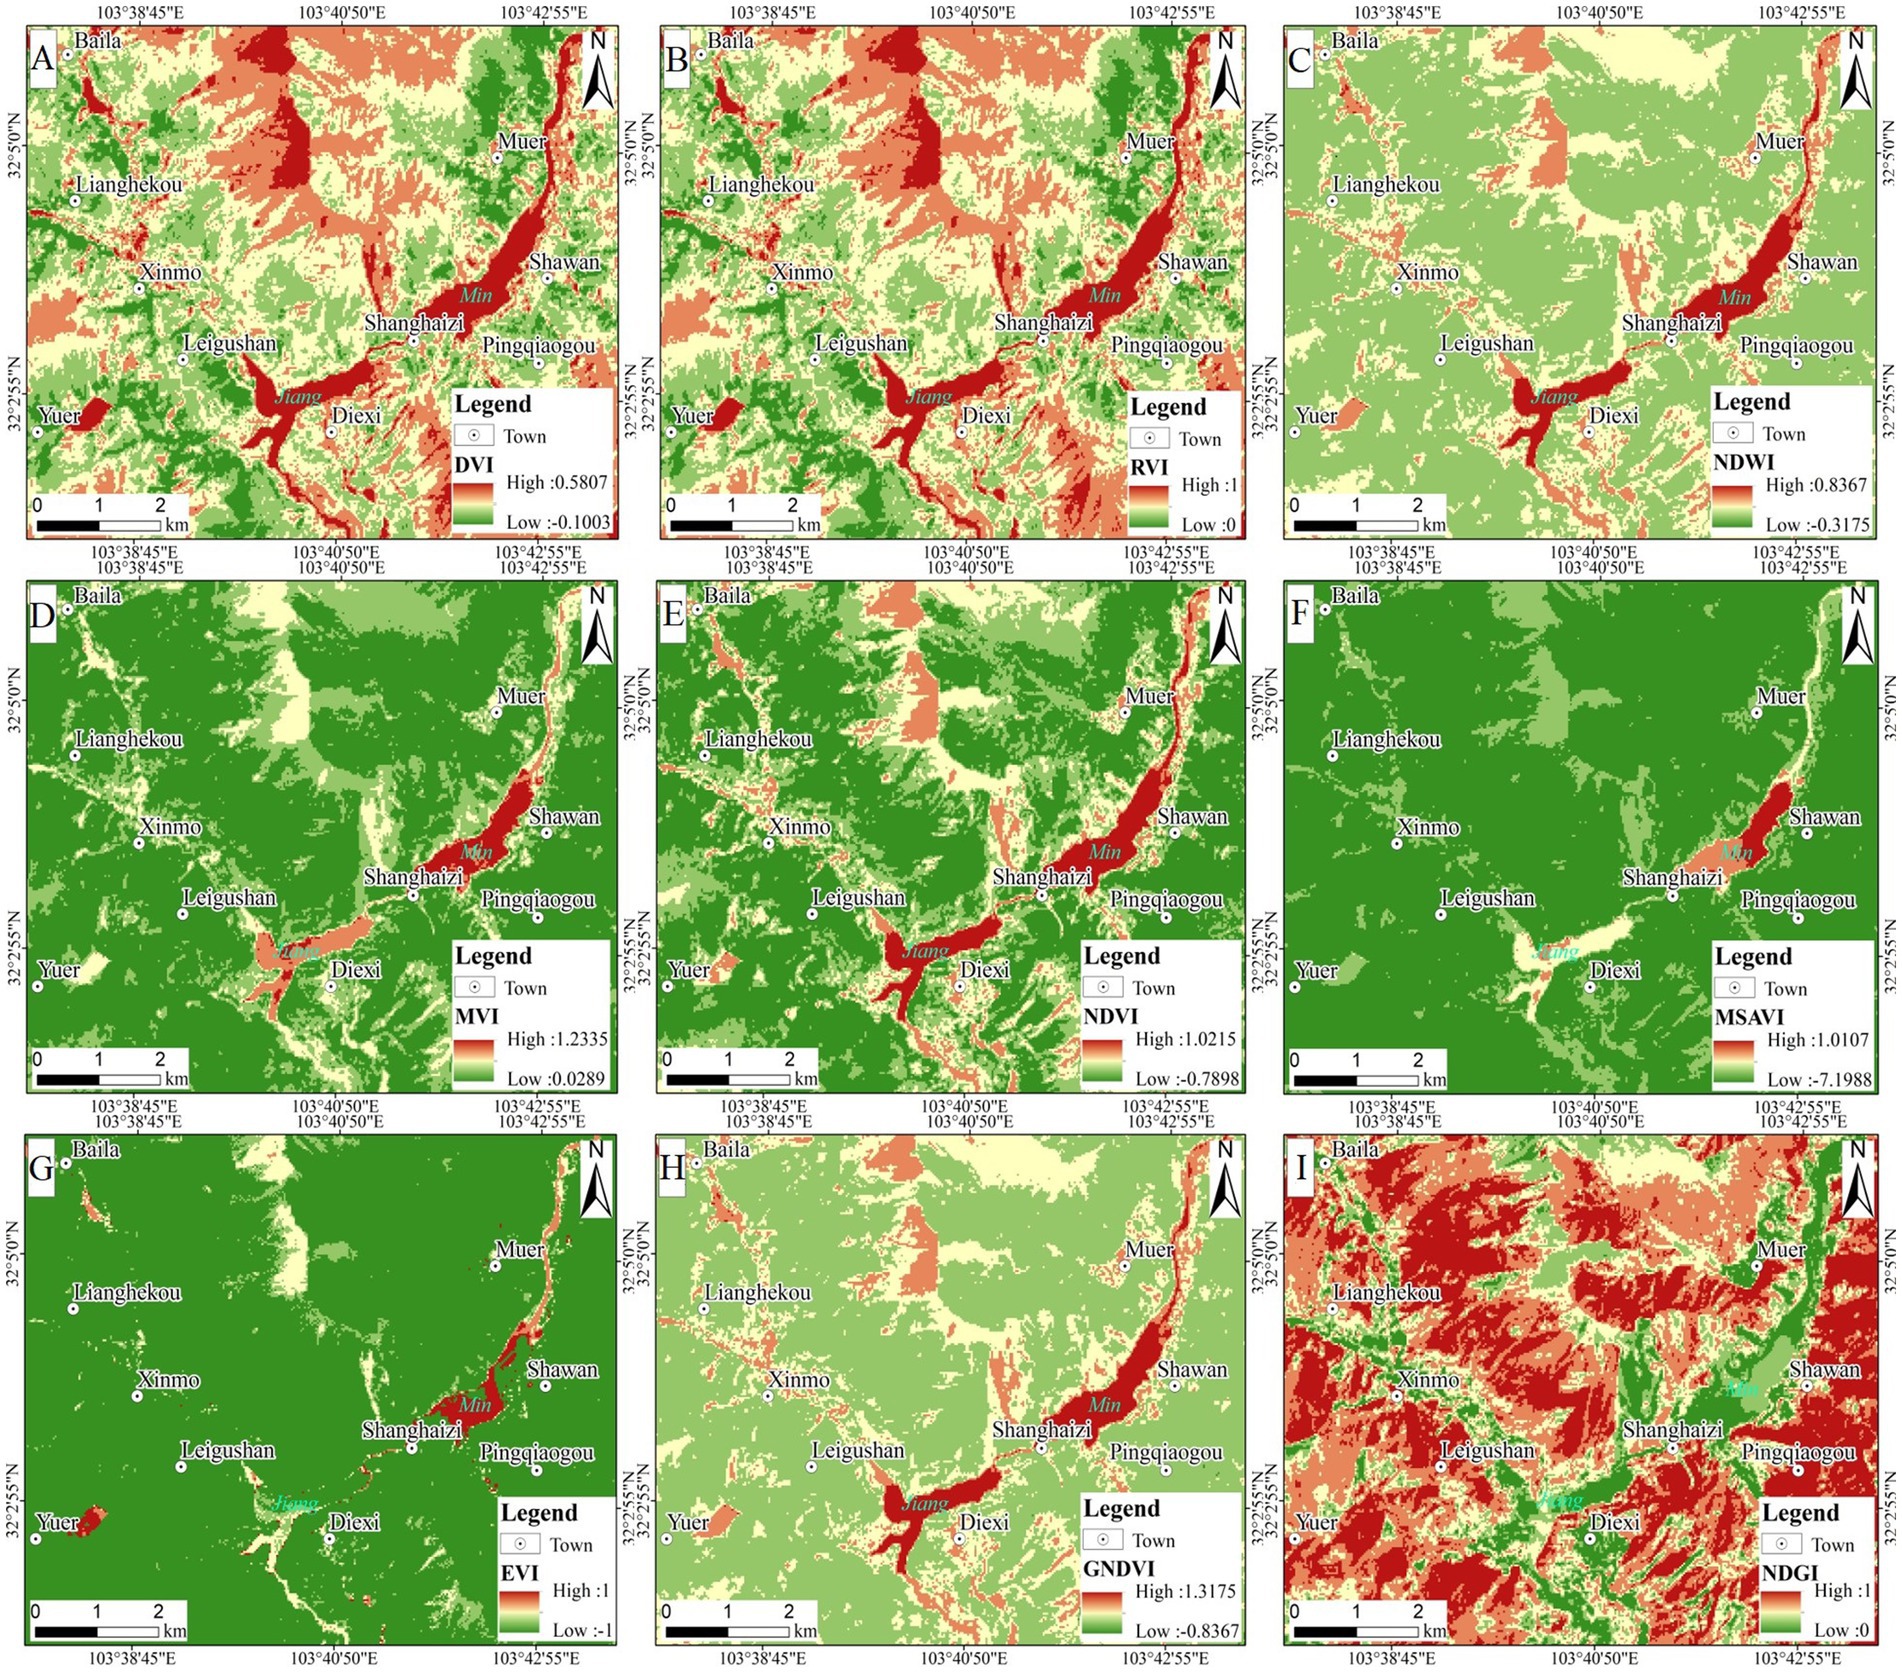
Figure 7. Different vegetation indexes in the study area. (A) DVI. (B) RVI. (C) NDWI. (D) MVI. (E) NDVI. (F) MSAVI. (G) EVI. (H) GNDVI. (I) NDGI.
The study used the moderate-resolution imaging spectroradiometer (MODIS) NDVI datasets (MOD13Q1) synthetic product with a resolution of 250 m as the standard to calculate the vegetation coverage of the study area. 21 pixels were randomly selected on the MODIS image, 8*8 pixels of the same area were found on the spatial distribution map of each vegetation index according to the latitude and longitude, and the average value of 64 pixels in the area was calculated as the estimated value of the vegetation index of the area and compared with the standard value. The two-dimensional scatter plot was obtained with the vegetation index as the horizontal coordinate and the vegetation coverage as the vertical coordinate. The results of the correlation analysis of the scatter plot using Statistical Product Service Solutions (SPSS) software are shown in Figure 8. The correlation judgment coefficients of DVI and standard vegetation coverage was 0.694, RVI was 0.696, NDWI was 0.902, MVI was 0.484, NDVI was 0.933, MSAVI was 0.953, EVI was 0.471, GNDVI was 0.904, NDGI was 0.487. The of EVI, MVI, and NDGI were all less than 0.5, indicating that the correlation between these three vegetation indexes and vegetation coverage was low, while all other vegetation indexes could reflect the vegetation coverage in the study area to a certain extent, but the MSAVI index had the highest correlation with vegetation coverage, and the estimated vegetation coverage was closer to the real ground surface Vegetation coverage.

Figure 8. Correlation between different vegetation indexes and vegetation coverage.
The Coefficient of Variation (CV), a normalized measure of the degree of dispersion of a probability distribution, is introduced for comparative analysis of the vegetation indexes in the study area and is defined as the ratio of the standard deviation σ to the mean μ. The results of the analysis are shown in Table 5. The standard deviation and coefficient of variation of the vegetation index MSAVI are higher than those of other vegetation indexes, indicating that the MSAVI dataset is more discrete than other vegetation indexes. From a statistical point of view, it shows that the MSAVI index better reflects the spatial variability of vegetation coverage and has a stronger ability to identify vegetation differences. Therefore, combining with the correlation analysis and the degree of dispersion, the MSAVI index was selected as the index of landslide change.
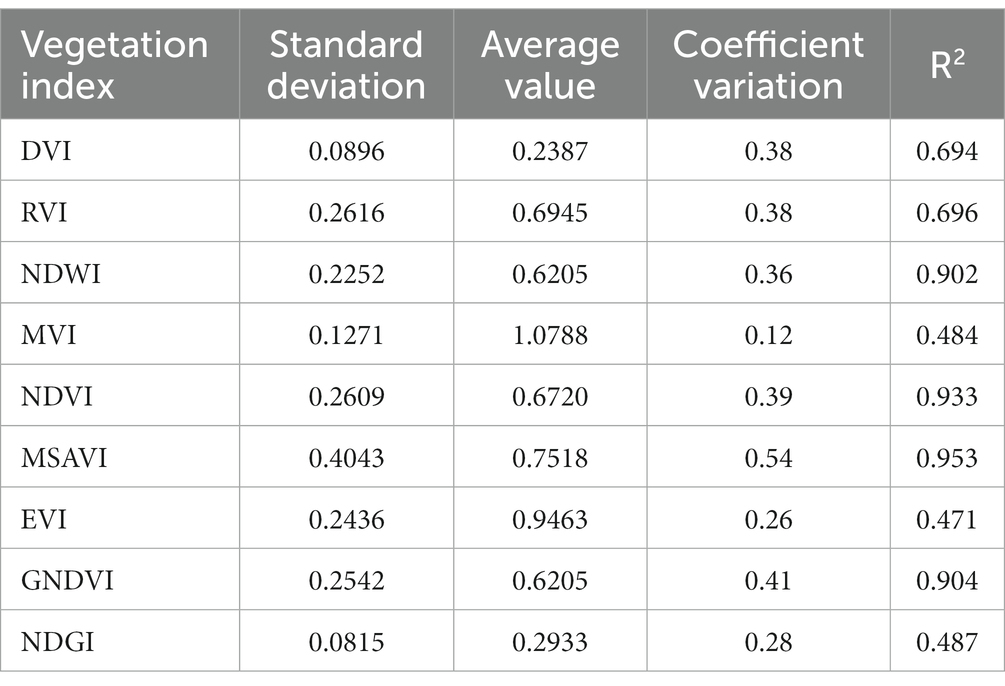
Table 5. Statistical analysis of different vegetation indexes.
As the vegetation index is related to many factors such as climate, soil, vegetation type and topographic relief, it cannot be used directly to reflect vegetation anomalies caused by landslide creep, and it is necessary to remove the influence of non-landslide factors from the vegetation index and retain the vegetation coverage information related to landslide creep. Therefore, the study is based on vegetation index, and the vegetation coverage is estimated by means of a dimidiate pixel model as a base model, which weakens the influence of soil background, vegetation type and atmosphere, and has a certain theoretical basis, is not restricted by geographical area, and can be easily extended (Carlson and Ripley, 1997).
The dimidiate pixel model is a method for calculating vegetation coverage based on the pixel linear decomposition model, which is based on the principle of decomposing the spectral information of the ground surface acquired by remote sensing sensors into two parts, one is the information contributed entirely by green vegetation, and the other is the information of bare ground without vegetation coverage, the pixel information S is synthesized by these two parts (Yue et al., 2021),
Namely:
In a pixel of a remote sensing image, assuming that the area covered by vegetation (i.e., vegetation coverage) is In a pixel of a remote sensing image, assuming that the area covered by vegetation (i.e., vegetation coverage) is , the area covered by bare ground is . The information of pure pixel covered by vegetation is , and for a mixed pixel composed of vegetation and bare soil, the information contributed by vegetation is equal to the product of and :
Similarly, if a pure pixel information completely covered by bare ground is , then for a mixed pixel composed of vegetation and bare ground, the information contributed by the bare ground is the product of and, that is:
Substituting Equations (2), (3) into Equation (1) and transforming gives the equation for vegetation coverage :
where S is the spectral information of the ground surface acquired by the remote sensing sensor. Therefore, as long as the spectral information of pure bare ground pixels and the spectral information of pure vegetation pixels are obtained, the vegetation coverage of the entire study area can be estimated (Song et al., 2022).
In this study, the MSAVI index was used to estimate vegetation coverage based on the principles of the dimidiate pixel model with the following equation:
Where is the MSAVI value of the bare ground pixel, and the MSAVI value of the pure vegetation pixel.
In the actual calculation, it is difficult to find pure bare ground pixels and pure vegetation pixels, and are generally used instead. In order to ensure the accuracy of the experimental results, this study used histogram statistics to analyze the MSAVI values, obtain the cumulative percentage corresponding to each MSAVI, set the confidence interval according to the cumulative percentage, and then determine the values of and . The confidence interval was set to 5–95% and the cumulative percentage of MSAVI ≤5% was defined as the pure bare ground portion, that is, the MSAVI value with a cumulative percentage of 5% was ; The cumulative percentage of MSAVI ≥95% was defined as the pure vegetation fraction, that is, the MSAVI value with a cumulative percentage of 95% was (Gao et al., 2020).
Vegetation coverage was estimated by MSAVI index using three phases of Landsat 8 OLI images data in the study area from May 2015, May 2016, and May 2017 (Figures 9A,C,E), where the arrows in Figures 9C,E point to the cloud-obscured portion and are not used as a vegetation spatial variation feature. The vegetation spatial variation areas of the 3 images were overlaid with the landslide pre-selection areas to obtain the areas of vegetation anomalies (Figure 9).
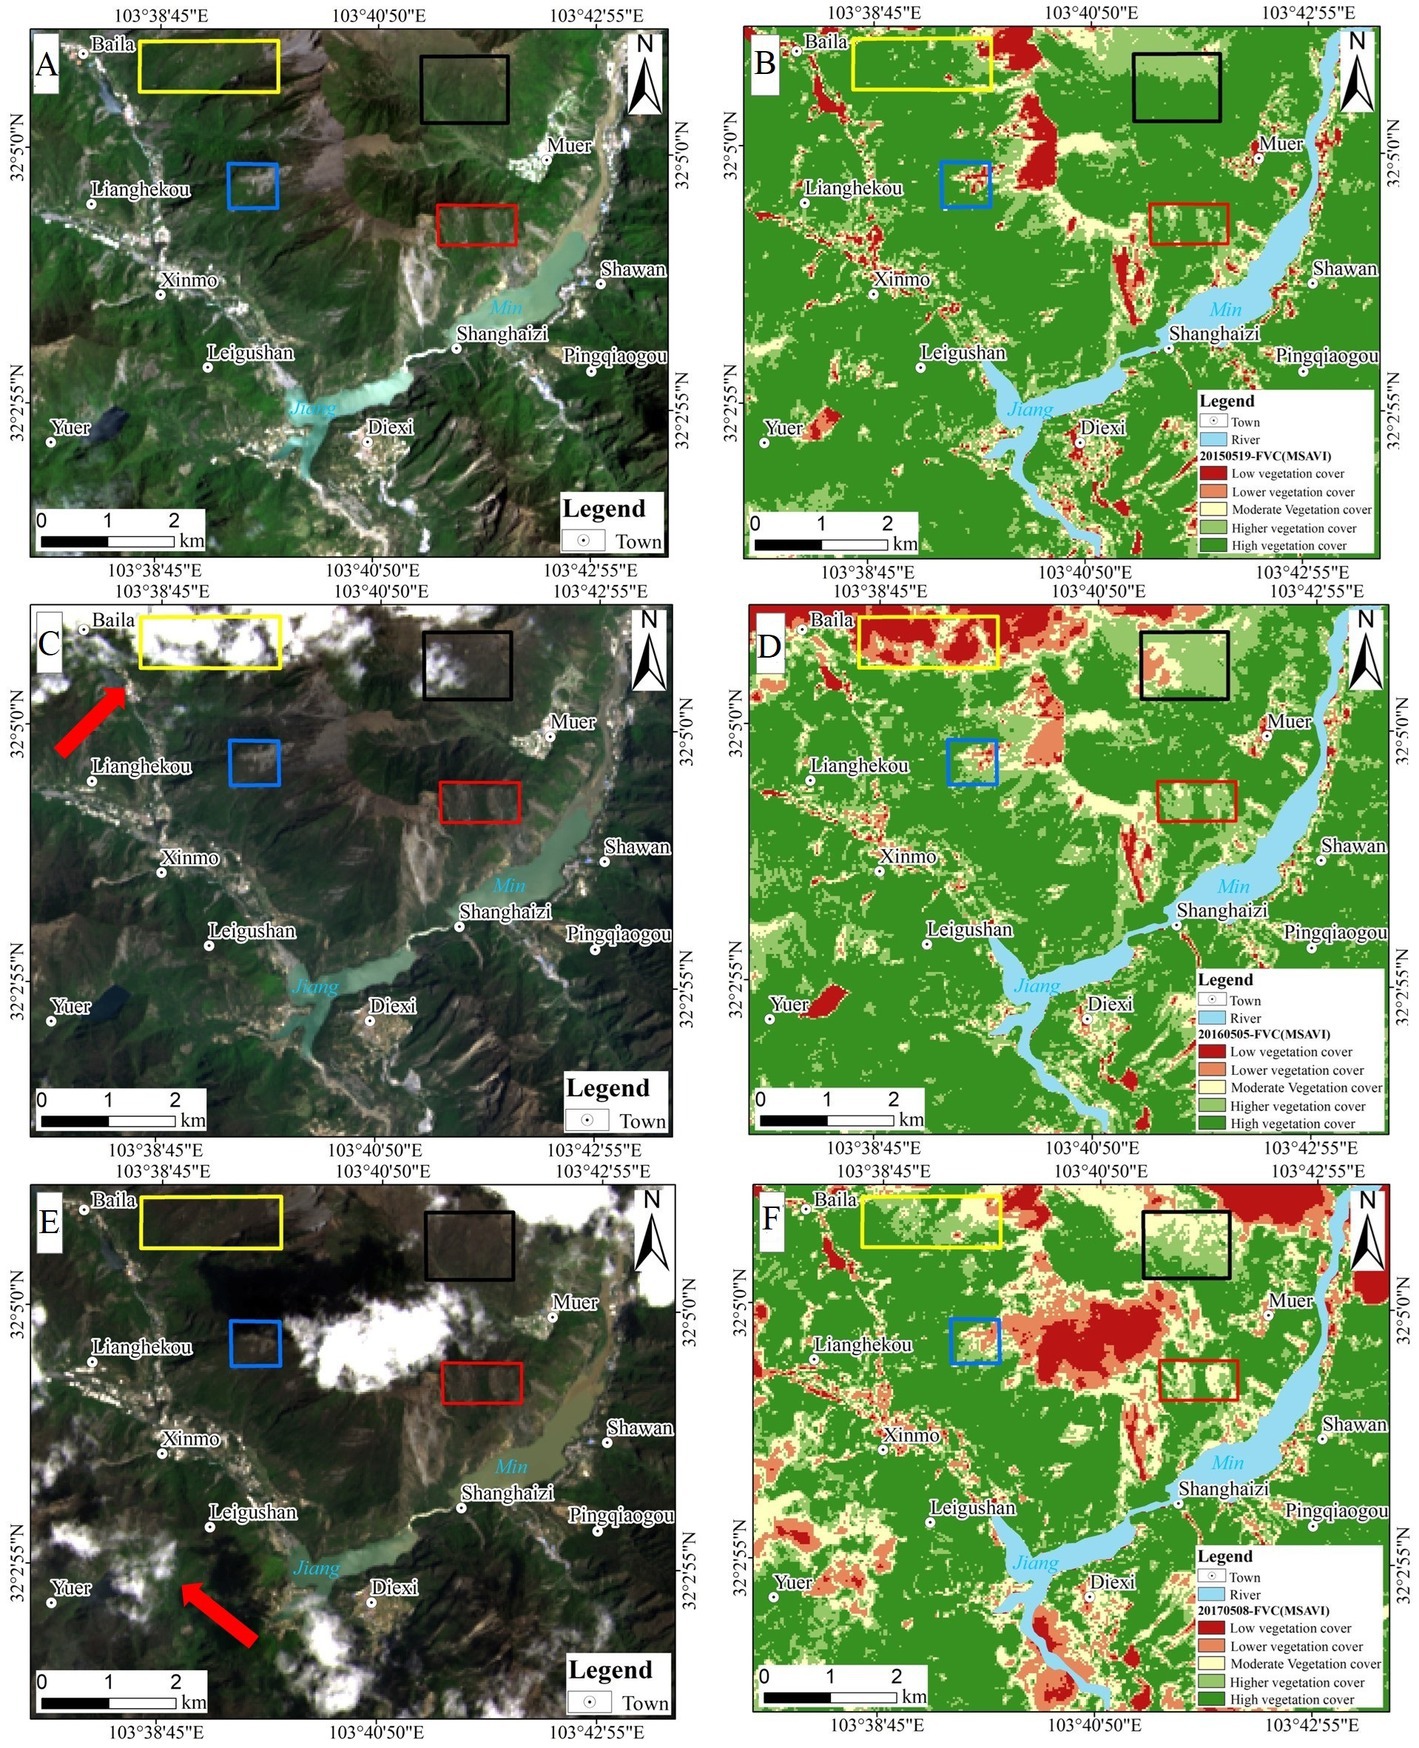
Figure 9. Landslide potential areas. (A) 20150519 Landsat 8 satellite image. (B) 20150519 Vegetation coverage anomaly map. (C) 20160505 Landsat 8 satellite image. (D) 20160505 Vegetation coverage anomaly map. (E) 20170508 Landsat satellite image. (F) 20170508Vegetation coverage anomaly map.
Figures 9B,D,F can be observed that, with the change of time series, the color of the yellow frame area coverage gradually changed from dark green to yellow-green, indicating that the vegetation coverage in the yellow frame gradually declined and the vegetation growth condition became worse (the yellow frame was red in 2016 due to the influence of clouds); the green in the black frame gradually decreased, and the yellow gradually increased in May 2017, reflecting a decreasing trend of vegetation coverage; the area in the red frame changed from green to yellow, and the vegetation coverage changed from high to low; the dark green in the blue frame gradually changed to light green and yellow, and had a gradual downward trend, indicating degradation of vegetation growth in the blue frame area. Therefore, as the time of the landslide approaches, the vegetation coverage is affected by landslide creep and shows a gradual decline. By combining the vegetation coverage in the above 3 time phases with the slope structure, the four areas of yellow, black, red, and blue are identified as landslide hazard areas.
The growth of the vegetation has the phenological characteristics of an inter-annual cycle: the growth continues to accelerate in spring and the biomass begins to increase; the growth accelerates in summer, chlorophyll content and biomass reach their peak; it begins to gradually decline in autumn; it drops to a minimum in winter (Wu et al., 2008).To exclude the influence of non-landslide factors on vegetation anomalies, the vegetation coverage was analyzed by comparing April 2017 with May 2017 (Figures 10A,B). As can be observed in Figure 10, the yellow, black, and red frames changed from yellow to large areas of green, indicating that the vegetation coverage was gradually increasing in May in good condition, in line with its growth pattern; however, the vegetation coverage in the blue frame did not change color over a large area, judging that the vegetation may have been affected by landslide creep and its growth and development was hindered.
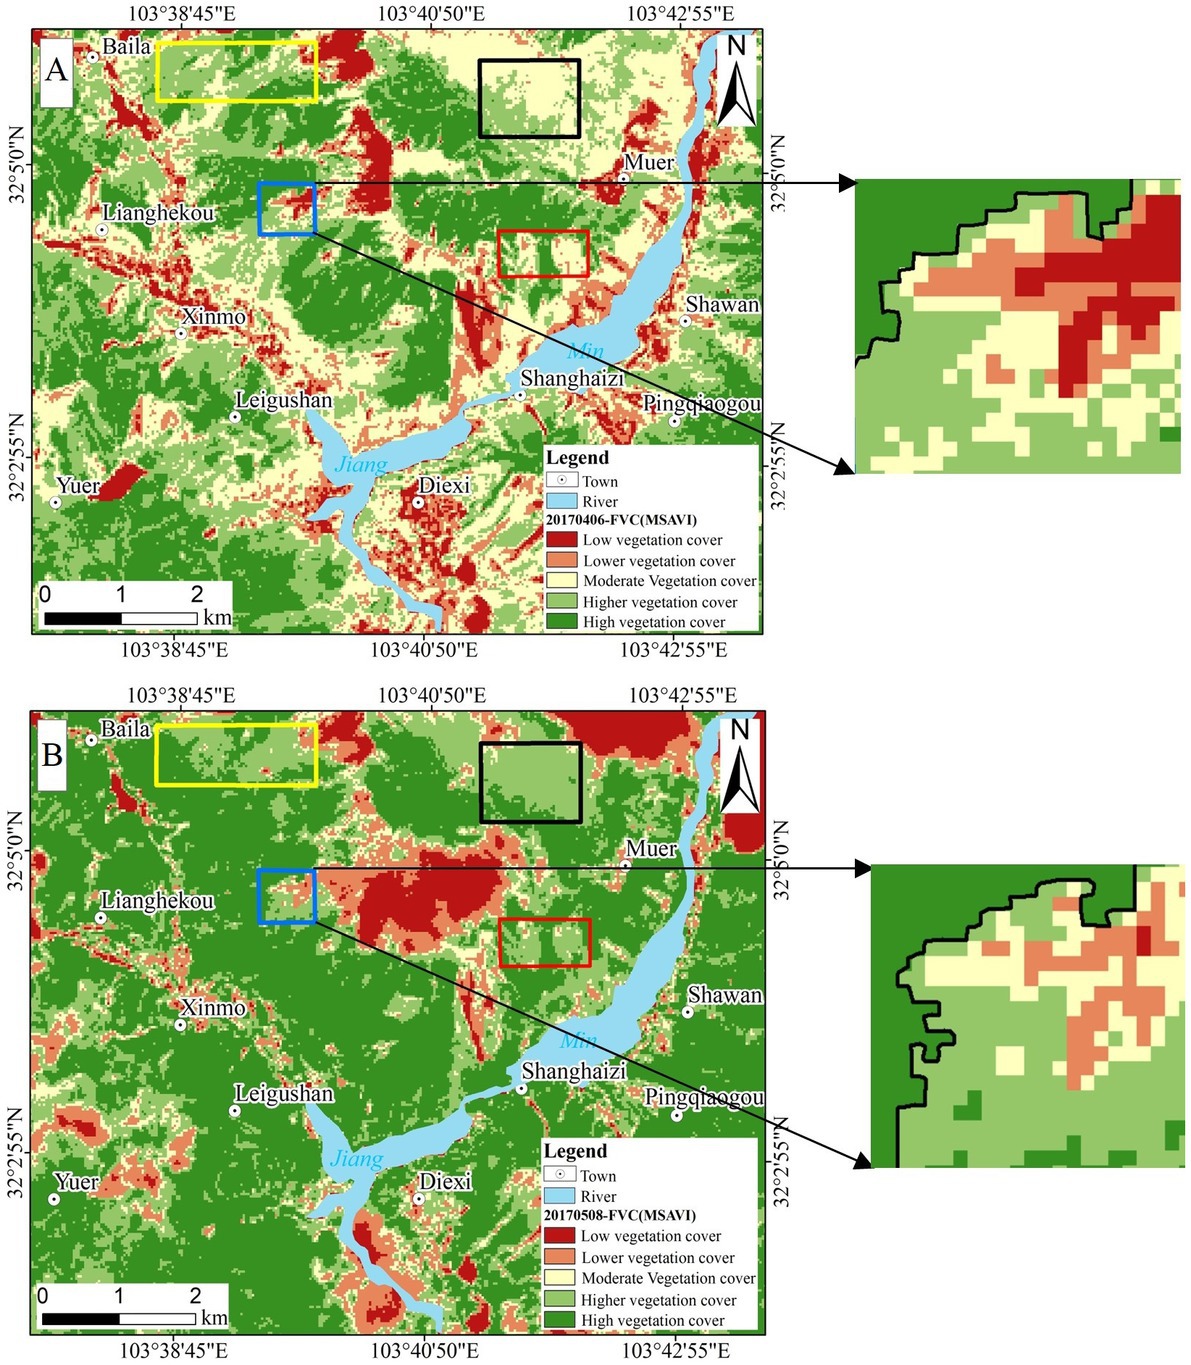
Figure 10. Comparison of vegetation coverage between 201704 and 201705. (A) 20170406 vegetation anomaly map. (B) 20170508 vegetation anomaly map.
The above study was based on the analysis of visual interpretation, and the original remote sensing images, slope structure type, and vegetation coverage of the time series were combined for comparison, showing the spatial variation in regional details of vegetation anomalies and spatial–temporal correlation of landslide creep. To correspond the vegetation anomalies on the remote sensing images with the actual landslide development, the vegetation coverage was graded based on the visual interpretation of the medium-resolution remote sensing images and field investigation (Table 6). Areas with vegetation coverage above 0.60 were defined as medium-high vegetation coverage areas and areas below 0.60 were defined as medium-low vegetation coverage areas. In this study, the number of pixels in the medium-low vegetation coverage area was counted to obtain the variation of the area, and then the spatial correlation between the vegetation anomalies and the landslide deformation on the images was analyzed from a quantitative perspective.
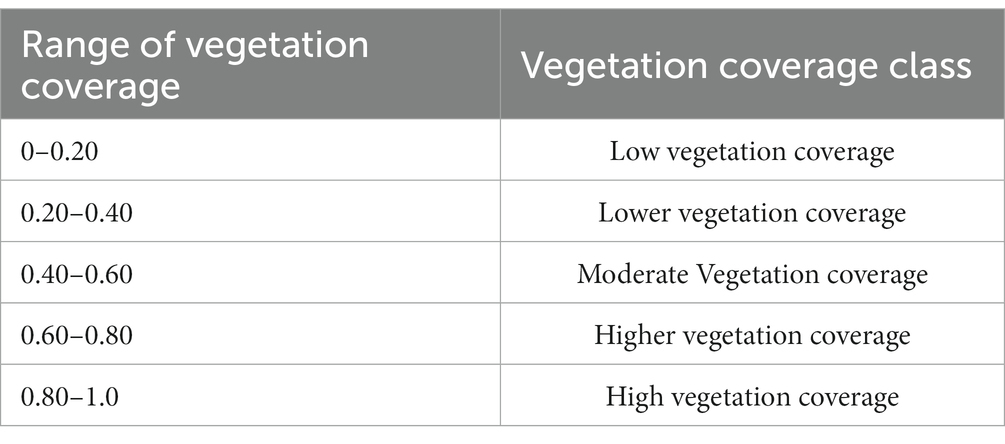
Table 6. Vegetation coverage grading scale.
The statistics of the pixels of middle-low vegetation coverage areas (i.e., vegetation coverage less than 0.60) in the 2 temporal landslide hazard areas in the study area in April 2017 and May 2017 (Table 7). It can be observed that the number of pixels with vegetation coverage less than 0.60 in the yellow, black and red frames decreased significantly month by month, with change rates of 78.4, 87.7, and 89.7% respectively, indicating that the area of bare ground in the yellow, black and red areas decreased significantly, which was consistent with the vegetation development pattern and visual interpretation results. In contrast, the number of pixels in the blue area changed from 234 in April to 186 in May, a decrease of 48 pixels, or 20.5 l%. Comparing the changes in pixels in the three hazard areas of yellow, black, and red, the change of vegetation in the blue area was not obvious, and the number of pixels with vegetation coverage of less than 0.60 decreased abruptly, indicating that the vegetation here may be affected by landslide creep and the vegetation growth was abnormal. Also based on the histogram of the change in the number of pixels with coverage less than 0.6 in each hidden area (Figure 11), it can be clearly that the blue frame shows the least change in the number of pixels. Therefore, from the four landslide hazard areas in the yellow, black, red, and blue frames, the blue frame was finally identified as the most likely area for landslides to occur.

Table 7. Statistics on vegetation anomalies in landslide hazard areas.
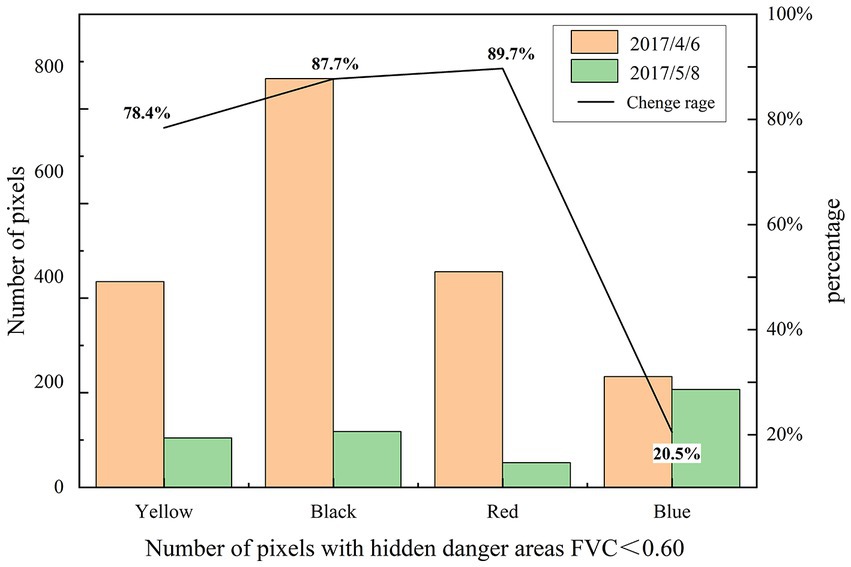
Figure 11. Histogram of the change in the number of image elements in the hidden area.
To further verify the accuracy of the vegetation coverage estimation model, a linear regression model was established using the MOD13Q1 NDVI product as the standard value and the vegetation index extraction model results as the estimated value (Figure 8). The accuracy of the linear regression model was verified by root mean squared error (RMSE), the smaller the RMSE, the closer the standard value was to the estimated value; the coefficient of determination () was used to evaluate the goodness of fit of the linear regression model, the closer was to 1, the better the standard value fitted the estimated value. Among them, the MSAVI index extracted better ( was 0.953 and RMSE was 0.190) (Table 8).
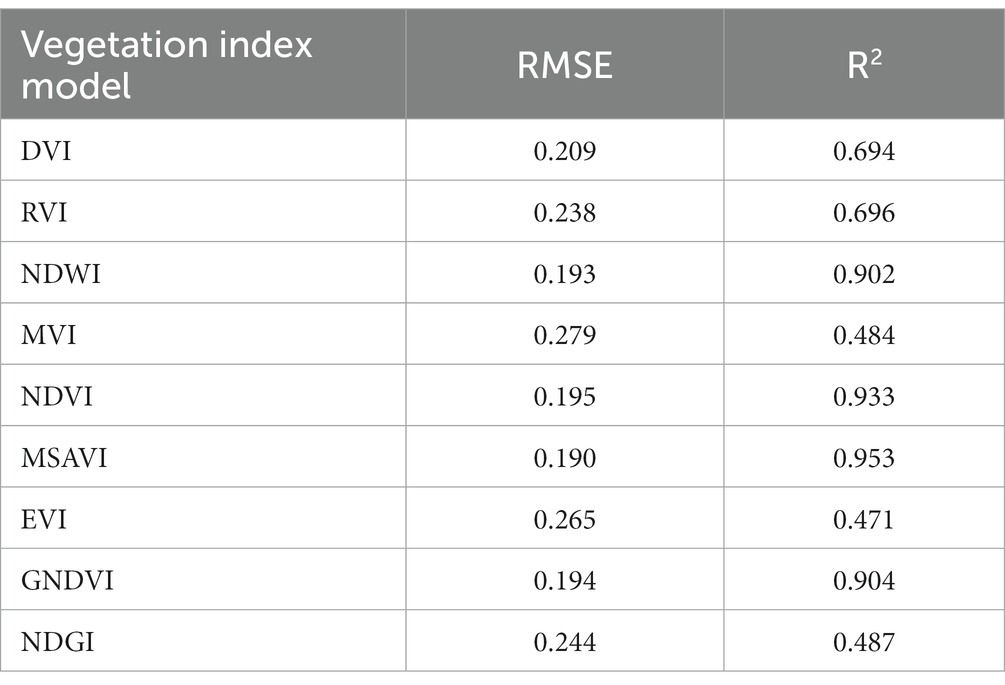
Table 8. Vegetation coverage estimation model accuracy validation.
To further verify the correlation between vegetation anomalies on remote sensing images and landslide creep, according to the Google Earth satellite images in August 2003 and January 2016 (Figures 12A,B), five obvious fissures F1-F5 were found in each slide source area, and a group of joints J1 was developed on the bedrock surface. In Figure 12A, five fissures can be seen spreading in the sliding direction, roughly parallel to the direction of joints J1, with fissures F1 and F4 corresponding to the right and left boundaries of this landslide, respectively. According to Figure 12B, fissures F1–F4 did not obvious expansion and extension, and fissure F5 extended along the cracking direction to the ridgeline, and the vegetation shadows were distributed in thin lines, indicating that fissures developed under the vegetation (Xu et al., 2017). Comparing the images from 2003 to 2016, we found that the lower part of the bedrock on the left side and the lower side of the slope deposit had an obvious downward crumbling trend, indicating that the loose debris was slowly dislodged, and the upper part of the rock body was more clearly defined and longer than in 2003.
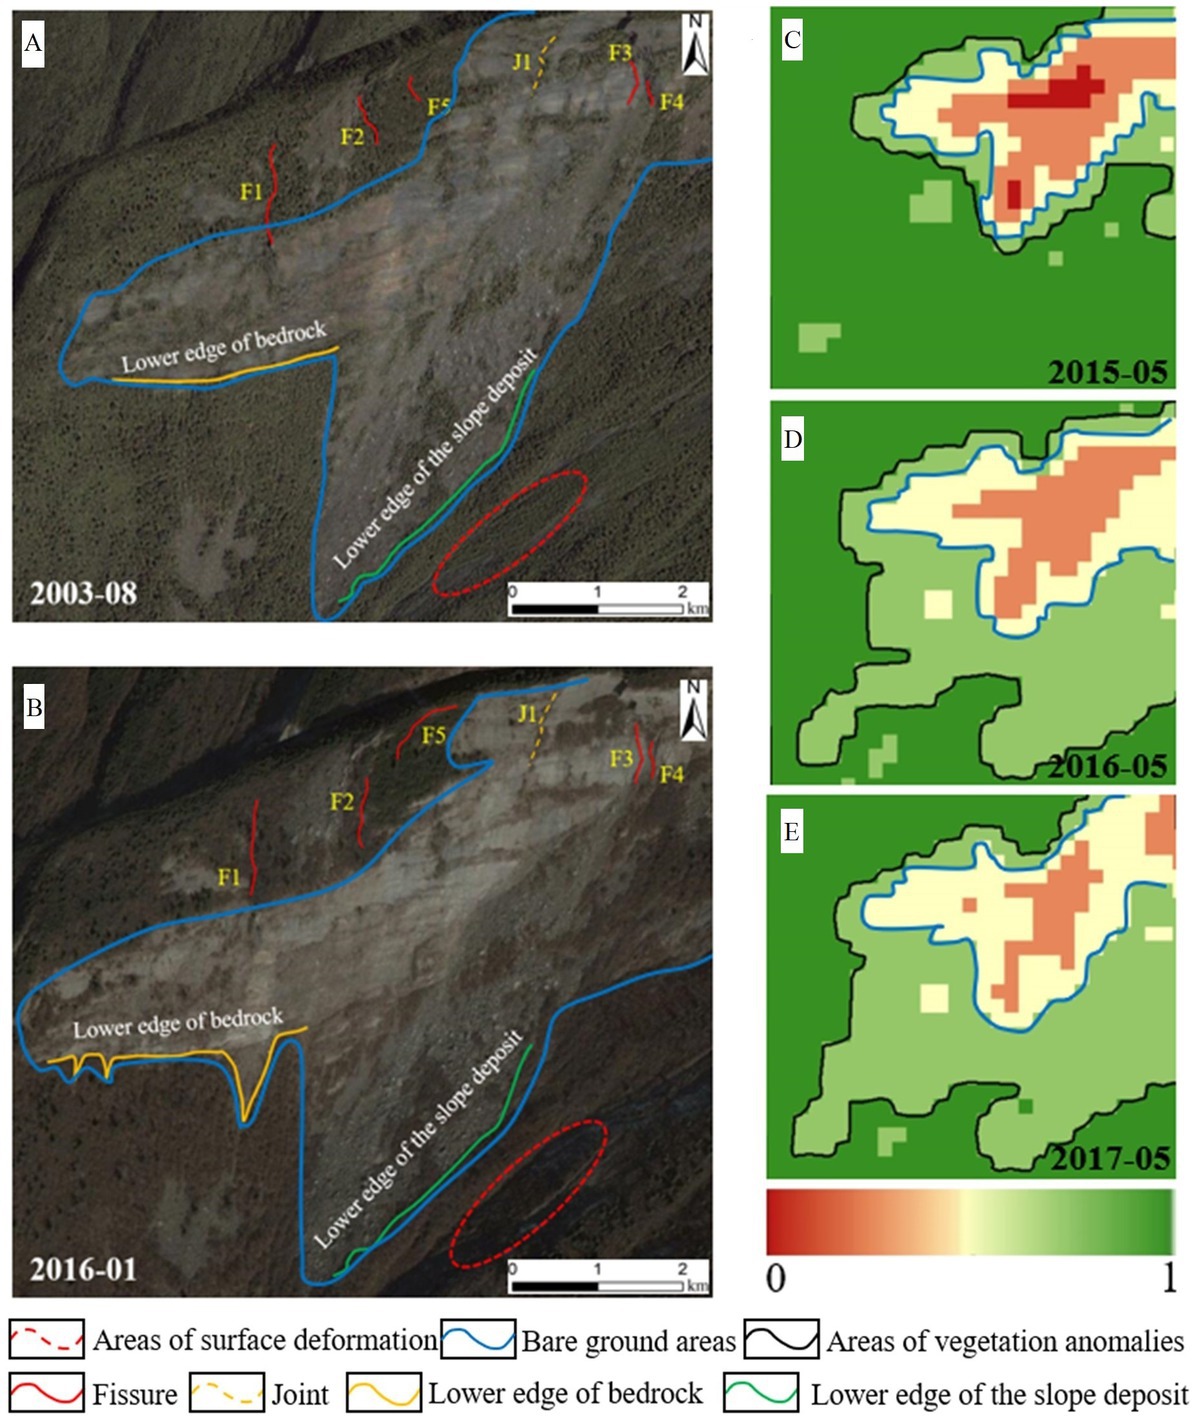
Figure 12. Comparison of hidden danger development and vegetation anomalies. (A) 2003–08 Google earth image 2D view. (B) 2016–01 Google earth image 2D view. (C) Changes in vegetation coverage in 2015–05. (D) Changes in vegetation coverage in 2016–05. (E) Changes in vegetation coverage in 2017–05.
In the red ellipse (Figures 12A,B), approximately 60 m from the lower margin of the slope deposit, there were significant differences in the shading of the surface between the two phases, with the surface was relatively flat in 2003 and there were fluctuations roughly parallel to the underside line of the slope deposit in 2016, this phenomenon was not found on either side of the rock mass or at lower levels. The hidden danger was characterized by a hard top and soft bottom, with a localized high-strength “locked section” in the middle or lower middle of the area and slow creep in the weaker parts, confirming that stresses were constantly shifting toward the “locked section” of the rock. With the accumulation of stress, the locking section was “overloaded” and a sudden brittle fracture occurs, resulting in a high-speed collapse (Li et al., 2018).
When the above features of hidden danger development (Figures 12A,B) were compared with the vegetation anomalous changes in the landslide hazard areas in May 2015, May 2016, and May 2017 (Figures 12C–E). It can be observed that although the red area within the blue curve in Figures 12C–E decreases, the yellow area corresponds to the blue curve in Figures 12A,B, which is consistent with the trend of the lower edge of the bedrock on the left side and has an obvious downward sliding trend, it basically matches the position of some fissures and joints in the pre-slip image, indicating that the vegetation growth condition becomes worse. The black curve in Figures 12C–E gradually extended downwards, indicating a downward trend of vegetation coverage degradation. It not only verifies the correlation between vegetation anomalies and landslide creep, but also reflects in practice the feasibility of optical remote sensing for early identification of landslides in areas with high vegetation coverage.
In this study, the Landsat 8 OLI satellite was used to estimate the vegetation coverage using time-series remote sensing images from May 2015, May 2016, April and May 2017, to exclude the influence of non-landslide factors on the spatial variation of vegetation, and to establish the correlation between landslide creep and vegetation anomalies based on the slope structure types and vegetation spatial–temporal variation characteristics in the region, so as to reflect the evolution of landslides in areas with high vegetation coverage and successfully identify the landslide in Xinmo Village. This is also consistent with the study results of some scholars, who have used the flexible and time-efficient UAV technology to obtain digital terrain products and on-site images of the “6.24” Xinmo Village landslide for accurate description, and qualitative and quantitative analysis of geological hazards. But UAV technology is mainly used as a useful supplement to satellite remote sensing means, which can realize regular and continuous observation in small areas and meet the dynamic monitoring needs of landslides in key areas (Guo C. et al., 2020). Another Intrieri et al. (2017) conducted the deformation history of 45 c-band synthetic aperture radar (SAR) images acquired by the European Space Agency’s Sentinel-1 satellite and found deformation of the Xinmo Village landslide in the slide source area. However, since Xinmo Village in Mao County is located in the southwest mountainous area with steep terrain and dense vegetation, the InSAR technique has uncertainties about the complexity of ground undulations and the quality differences of the interferometric image data itself and loses the ability to observe deformation damage of large magnitude, and the high vegetation coverage acquires fewer stable scatterers, causing data loss of correlation and difficulty in phase deconvolution, which restricts the accuracy of landslide identification in areas with high vegetation coverage. Guo X. Y. et al. (2020) based on the objective reality of field investigation that the creep of slope in the development stage of landslide in Xinmo village would cause the change of environmental conditions and further affect the growth of vegetation, used high-resolution satellite images to judge the abnormal situation of vegetation on the landslide slope through the changes of NDVI sequence. But the values are prone to saturation when based on the NDVI index as an indicator for landslide monitoring in areas with high vegetation coverage, making it more difficult to meet its accuracy requirements (Jiang et al., 2006). Therefore, in this study, nine vegetation indexes were compared and analyzed for high vegetation coverage areas, and the MSAVI index with the highest correlation and better dispersion with vegetation coverage was selected as the landslide monitoring Indicator, which reduces the change of soil factors and better reflects the spatial differences of vegetation, extracts the appearance of abnormal changes in vegetation on remote sensing images and pixel quantitative analysis to achieve early identification of landslides in high vegetation coverage areas.
The complex topographic and geomorphological conditions in the high vegetation coverage areas of southwest China, there are numerous factors influencing vegetation coverage, resulting in spatial–temporal variations in vegetation that are not always caused by landslide deformation. Analysis of the influence of precipitation and topographic factors on vegetation dynamics through the recovery of vegetation in the NDVI dataset after the 2008 Wenchuan earthquake revealed that precipitation appeared to inhibit vegetation recovery in 2010 and 2011, and that vegetation recovery was weaker on gentle slopes with elevations <1,300 or > 3,500 m and slopes <35° (Yang et al., 2018). Another Deijns et al. (2020) used the cumulative difference (CD) between the NDVI and the fitted harmonic sine curve for semi-automated landslide monitoring in the Buckinghorse River region of Canada, and found the utility of anomalous changes in vegetation as an indicator of landslide creep, suggesting that riverbank erosion, deforestation, etc. have similar NDVI response, which may confound landslide characteristics. All of the above studies show that the combination of hydrometeorology, topography, physical and chemical characteristics of vegetation, land use et.al, spatial changes in vegetation caused by natural phenomena and human actions should not be ignored as well, all of which may interfere with the early identification accuracy of landslides.
In summary, with sufficient time-series remote sensing images, combined with the phenological characteristics of normal vegetation, the use of multiple quantifications of known landslide time-series imagery to train the vegetation index sequence characteristics of specific landslide areas can effectively distinguish landslides from non-dominant factors such as cropland and bare ground, and improve the accuracy of the spatial distribution of landslides in large areas, which will be an important direction for future research on the early identification of landslides in high vegetation coverage areas.
Landsat image was chosen for the study because of its large period and global coverage, which facilitates long time series analysis, and the large number of bands and ease of combining Landsat imagery to analyze specific features (Zhu et al., 2019), but its relatively low spatial resolution resulted in some small-scale landslide creep not being easily detected. With regard to the application of lower resolution products to landslide monitoring, most “landslide” pixels are a mixture of landslides and other land coverage, and analyses based on these pixels are uncertain to effectively identify smaller landslides, and their data do not reveal the spatial variability of small landslides. In order to reduce the influence of mixed pixels, landslides with more than 9 Landsat pixels are selected for analysis, which can reveal more detailed vegetation recovery processes and slope activity (Zhong et al., 2021). Therefore, the use of Landsat imagery to effectively capture large landslide deformation in areas of high vegetation cover at a large scale can help reduce the influence of mixed pixels and support detailed investigation of landslide areas.
In addition, this study analyses the spatial–temporal variation characteristics of vegetation based on the MSAVI index for early identification of landslides, which had the highest correlation with vegetation coverage of 0.953, and the CV is 0.54, effectively weakening the influence of soil background and mountain shadows on vegetation, with stronger ability to identify vegetation differences and better reflecting the real vegetation coverage information in high vegetation cover areas. Yang et al. (2014) used MOD13Q1 data to construct various vegetation indexes and compared them with TM images for analysis, and found that the vegetation coverage estimated using MSAVI was closer to the actual situation in Shangri-La County. However, the MSAVI index has certain limitations for non-growing season vegetation monitoring, and its overall change is decreasing, which cannot better represent the spatial change characteristics of vegetation, leading to uncertainty in landslide identification. Therefore, there are still challenges in detecting landslides in the non-growing season based on optical remote sensing extraction of vegetation index. For non-growing vegetation, the estimation of classification thresholds of vegetation index varies widely, and in subsequent studies, attempts can be made to study the limit values of landslide Indicator, where different indexes may be more appropriate depending on the situation, or to construct new types of index or composite index, whether they are better than the landslide results obtained from a single vegetation index to reduce the influence of non-growing vegetation uncertainty as much as possible.
There is an urgent need to establish an effective monitoring system for the early identification of landslide disasters globally to reduce the loss of life and property caused by such natural disasters. Large landslides are often highly concealed and it is difficult to comprehensively identify the potential hazards by traditional manual inspection methods, especially in the dense forests of southwest China, where landslides, collapses and other potential hazards are hidden under the dense forests and are a constant threat to people’s life and property. This study focuses on the steep terrain and dense vegetation of southwest China as the main study area. Based on the topography, stratigraphic, and slope structure of the high vegetation coverage area. From the perspective of remote sensing, the MSAVI index with the highest correlation was proposed as the indicator of landslide change to estimate the vegetation coverage by using medium resolution Landsat 8 OLI optical remote sensing images, and the abnormal characteristics of the vegetation overlying the slope before the occurrence of the landslide were identified and quantitatively analyzed by remote sensing to establish the intrinsic link between the abnormal vegetation development and landslide creep. The study shows that there is an obvious spatial and temporal correlation between vegetation anomalies and landslide deformation during the landslide creep phase, which indirectly reflects the evolutionary process of landslide instability. The method is efficient and universal, and to a certain extent compensates for the shortcomings of existing methods in the early identification of landslides in complex geographical environments, providing effective scientific support for the early identification of large landslides in areas with high vegetation coverage worldwide.
The original contributions presented in the study are included in the article/supplementary material, further inquiries can be directed to the corresponding author.
BW, LH, and ZH: conceptualization, methodology, validation, writing—review and editing, and visualization. BW: software, formal analysis, data curation, and writing—original draft preparation. BW, RQ, and GK: investigation. LH and ZH: resources, supervision, and project administration. LH: funding acquisition. All authors have read and agreed to the published version of the manuscript.
This research was sponsored by the Independent Research Project of the State Key Laboratory of Geohazard Prevention and Geoenvironment Protection Independent Research Project (SKLGP2021Z003) and supported by the Natural Science Foundation of Sichuan, China (2022NSFSC1040).
The authors would like to thank the State Key Laboratory of Geohazard Prevention and Geoenvironment Protection (Chengdu University of Technology) and Natural Science Foundation of Sichuan for this support. We sincerely thank the editor, associate editor and reviewers for critical evaluation and constructive suggestions to improve the manuscript.
The authors declare that the research was conducted in the absence of any commercial or financial relationships that could be construed as a potential conflict of interest.
All claims expressed in this article are solely those of the authors and do not necessarily represent those of their affiliated organizations, or those of the publisher, the editors and the reviewers. Any product that may be evaluated in this article, or claim that may be made by its manufacturer, is not guaranteed or endorsed by the publisher.
Arabameri, A., Sanchini, E. K., Pal, S. C., Saha, A., and Bui, D. T. (2020). Novel credal decision tree-based ensemble approaches for predicting the landslide susceptibility. Remote Sens. 12:3389. doi: 10.3390/rs12203389
Bogaard, T. A., and Greco, R. (2016). Landslide hydrology: from hydrology to pore pressure. Wiley Interdiscip. Rev. Water 3, 439–459. doi: 10.1002/wat2.1126
Carlson, T. N., and Ripley, D. A. (1997). On the relation between ndvi, fractional vegetation cover, and leaf area index. Remote Sens. Environ. 62, 241–252. doi: 10.1016/s0034-4257(97)00104-1
Chen, Q., He, Q. W., Zhang, M., and Yang, L. (2021). Research on the mechanism of earthquake-triggered failure of bedding slope in Taxian of Xinjiang. Saf. Environ. Eng. 28, 88–95. doi: 10.13578/j.cnki.issn.1671-1556.20201041
Chen, D., Jackson, T. J., and Li, F. (2003). Estimation of vegetation water content for corn and soybeans with a normalized difference water index (NDWI) using Landsat thematic mapper data. IEEE Int. Geosci. Remote Sens. Sympos. Proc. 2003, 2853–2856. doi: 10.1109/igarss.2003.1294609
Chen, W., Li, X., Wang, Y., Chen, G., and Liu, S. (2014). Forested landslide detection using LiDAR data and the random forest algorithm: a case study of the three gorges, China. Remote Sens. Environ. 152, 291–301. doi: 10.1016/j.rse.2014.07.004
Chowdhuri, I., Pal, S. C., Arabameri, A., Ngo, P. T. T., Chakrabortty, R., Malik, S., et al. (2020). Ensemble approach to develop landslide susceptibility map in landslide dominated Sikkim Himalayan region, India. Environ. Earth Sci. 79, 1–28. doi: 10.1007/s12665-020-09227-5
Chu, Q. W., Zhang, H. Q., and Wu, Y. W. (2013). Application research of Landsat-8. Remote Sens. Inform. 28:5. doi: 10.3969/j.issn.1000-3177.2013.04.019
Deijns, A. A. J., Bevington, A. R., van Zadelhoff, F., de Jong, S. M., Geertsema, M., and McDougall, S. (2020). Semi-automated detection of landslide timing using harmonic modelling of satellite imagery, buckinghorse river, Canada. Int. J. Appl. Earth Obs. Geoinf. 84:101943. doi: 10.1016/j.jag.2019.101943
Du, L., Chen, J., Li, M. M., Zheng, X. W., Li, J., and Gao, Z. H. (2019). Application of airborne lidar technology in landslide investigation-an example of Zhangjiawan landslide in three gorges reservoir area. Remote Sens. Land Res. 31, 180–186. doi: 10.6046/gtzyyg.2019.01.24
Fan, X. M., Xu, Q., Gianvito, S., Dai, L. X., Li, W., Dong, X., et al. (2017). Failure mechanism and kinematics of the deadly June 24th 2017 Xinmo landslide, Maoxian, Sichuan, China. Landslides 14, 2129–2146. doi: 10.1007/s10346-017-0907-7
Gao, Y., Li, B., Feng, Z., and Zuo, X. (2017). Analysis of global climate change and geohazard response. J. Geom. 23, 65–77. doi: 10.3969/j.issn.1006-6616.2017.01.002
Gao, L., Wang, X., Johnson, B. A., Tian, Q., Wang, Y., Verrelst, J., et al. (2020). Remote sensing algorithms for estimation of fractional vegetation cover using pure vegetation index values: a review. ISPRS J. Photogramm. Remote Sens. 159, 364–377. doi: 10.1016/j.isprsjprs.2019.11.018
Ge, D. Q., Dai, K., Guo, Z., and Li, Z. (2019). Reflections and suggestions on the application of integrated remote sensing in the early identification of major geological hazards potential hazards. J. Wuhan Univ. 44, 10–14. doi: 10.13203/j.whugis2019004
Gitelson, A. A., Kaufman, Y. J., and Merzlyak, M. N. (1996). Use of a green channel in remote sensing of global vegetation from EOS-MODIS. Remote Sens. Environ. 58, 289–298. doi: 10.1016/s0034-4257(96)00072-7
Guo, X. Y., Guo, Q., and Feng, Z. K. (2020). Relationship between landslide creep and vegetation anomalies in remote sensing images. J. Remote Sens. 24, 776–786. doi: 10.11834/jrs.20208330
Guo, C., Xu, Q., Dong, X. J., Ju, Y. Z., and Ning, H. (2020). Application of UAV photogrammetry technology in the emergency rescue of catastrophic geohazards. Mapp. Circul. 2020, 6–11. doi: 10.13474/j.cnki.11-2246.2020.0309
Guo, Q., Zhu, L. Y., Li, A., and Gu, L. Y. (2022). Remote sensing fine identification of landslides based on ndvi change detection. Remote Sens. Technol. Applicat. 37, 17–23. doi: 10.11873/j.issn.1004-0323.2022.1.0017
He, S. M., Bai, X. Q., Yang, C. J., and Wang, D. P. (2017). Emergency scientific investigation of the mega-landslide at Xinma Village, Feixi town, Mao County, Sichuan Province. J. Mt. Sci. 35, 598–603. doi: 10.16089/j.cnki.1008-2786.000258
Intrieri, E., Raspini, F., Fumagalli, A., Lu, P., del Conte, S., Farina, P., et al. (2017). The Maoxian landslide as seen from space: detecting precursors of failure with Sentinel-1 data. Landslides 15, 123–133. doi: 10.1007/s10346-017-0915-7
James, N., and Sitharam, T. G. (2013). Assessment of seismically induced landslide Hazard for the state of Karnataka using GIS technique. J. Indian Soc. Remote Sens. 42, 73–89. doi: 10.1007/s12524-013-0306-z
Jiang, Z. Y., Huete, A. R., Chen, J., Chen, Y., Li, J., Yan, G., et al. (2006). Analysis of NDVI and scaled difference vegetation index retrievals of vegetation fraction. Remote Sens. Environ. 101, 366–378. doi: 10.1016/j.rse.2006.01.003
Jiang, Z., Huete, A., Didan, K., and Miura, T. (2008). Development of a two-band enhanced vegetation index without a blue band. Remote Sens. Environ. 112, 3833–3845. doi: 10.1016/j.rse.2008.06.006
Jordan, C. F. (1969). Derivation of leaf-area index from quality of light on the forest floor. Ecology 50, 663–666. doi: 10.2307/1936256
Kong, J. X., Gu, T. F., Sun, B., Zhang, F. C., Sun, J. X., and Song, Z. J. (2020). Research progress of landslide deformation based on unmanned aerial vehicle photogrammetry. Sci. Technol. Eng. 20, 11391–11399. doi: 10.3969/j.issn.1671-1815.2020.28.001
Li, A. N., Nan, X., Zhang, Z. J., Zhao, Y. B., Wang, S. Z., and Liu, R. J. (2018). Remote sensing research on development characteristics and emergency investigation of Mao County long range and high position landslide on June 24th, 2017. J. Nat. Dis. 27, 43–51. doi: 10.13577/j.jnd.2018.0205
Li, Z. H., Song, C., Yu, C., Xiao, R. Y., Chen, L. F., Luo, H., et al. (2019). Application of satellite radar remote sensing in landslide disaster detection and monitoring: challenges and countermeasures. J. Wuhan Univ. 44, 967–979. doi: 10.13203/j.whugis20190098
Li, W. L., Zhan, W. W., Lu, H. Y., Xu, Q., Pei, X., Wang, D., et al. (2022). Precursors to large rockslides visible on optical remote-sensing images and their implications for landslide early detection. Landslides 20, 1–12. doi: 10.1007/s10346-022-01960-1
Liang, J. T., Cheng, Y. L., Wang, J., Wang, Y. M., Liu, B., Wang, M., et al. (2014). Remote sensing investigation of the Wulipo mega-landslide disaster in Sanxi Village, Dujiangyan, Sichuan Province, July 10, 2013, and an analysis of the causal mechanism. J. Eng. Geol. 22, 1194–1203. doi: 10.13544/j.cnki.jeg.2014.06.025
Liu, X. J., Zhao, C. Y., and Kang, Y. (2019). Sentinel-1 data analysis of landslide deformation in Mao County. Mapp. Sci. 44, 55–59. doi: 10.16251/j.cnki.1009-2307.2019.04.009
Lyon, J. G., Yuan, D., Lunetta, R. S., and Elvidge, C. D. (1998). A change detection experiment using vegetation indices. Photogramm. Eng. Remote Sens. 64, 143–150.
Martha, T. R., Kerle, N., Jetten, V., van Westen, C. J., and Kumar, K. V. (2010). Characterising spectral, spatial and morphometric properties of landslides for semi-automatic detection using object-oriented methods. Geomorphology 116, 24–36. doi: 10.1016/j.geomorph.2009.10.004
McDaniel, K., and Haas, R. H. (1982). Assessing mesquite-grass vegetation condition from Landsat. Photogramm. Eng. Remote Sens. 48, 441–450.
Mezaal, M. R., Pradhan, B., Sameen, M. I., Mohd, S. H., and Yusoff, Z. M. (2017). Optimized neural architecture for automatic landslide detection from high-resolution airborne laser scanning data. Appl. Sci. 7:730. doi: 10.3390/app7070730
Pal, S. C., Das, B., and Malik, S. (2019). Potential landslide vulnerability zonation using integrated analytic hierarchy process and GIS technique of Upper Rangit Catchment Area, West Sikkim, India. J. Indian Soc. Remote Sens. 47, 1643–1655. doi: 10.1007/s12524-019-01009-2
Qi, J. G., Chehbouni, A. R., Huete, A. R., Kerr, Y. H., and Sorooshian, S. (1994). A modified soil adjusted vegetation index. Remote Sens. Environ. 48, 119–126. doi: 10.1016/0034-4257(94)90134-1
Rouse, J. W., Haas, R. H., Schell, J. A., and Deering, D. W.. (1974). Monitoring vegetation systems in the great plains with ERTS. Washington, DC NASA Special Publication:309–351
Sahana, M., Pham, B. T., Shukla, M., Costache, R. D., and Prakash, I. (2020). Rainfall induced landslide susceptibility mapping using novel hybrid soft computing methods based on multi-layer perceptron neural network classifier. Geocarto Int. 37, 2747–2771. doi: 10.1080/10106049.2020.1837262
Saito, H., Shoichiro, U., and Koki, T. (2022). Rapid vegetation recovery at landslide scars detected by multitemporal high-resolution satellite imagery at Aso volcano, Japan. Geomorphology 398:107989. doi: 10.1016/j.geomorph.2021.107989
Small, C. (2001). Estimation of urban vegetation abundance by spectral mixture analysis. Int. J. Remote Sens. 22, 1305–1334. doi: 10.1080/01431160151144369
Song, W., Zhao, T., Mu, X. H., Zhong, B., Zhao, J., Yan, G., et al. (2022). Using a vegetation index-based mixture model to estimate fractional vegetation cover products by jointly using multiple satellite data: method and feasibility analysis. Forests 13:691. doi: 10.3390/f13050691
Su, L. J., Hu, K. H., Zhang, W. F., Wang, J., Lei, Y., Zhang, C. L., et al. (2017). Characteristics and triggering mechanism of Xinmo landslide on 24 June 2017 in Sichuan, China. J. Mt. Sci. 14, 1689–1700. doi: 10.1007/s11629-017-4609-3
Tian, Q. J., and Min, X. J. (1998). Progress in vegetation index research. Adv. Earth Sci. 13, 10–16.
Tien Bui, D., Shahabi, H., Omidvar, E., Shirzadi, A., Geertsema, M., Clague, J., et al. (2019). Shallow landslide prediction using a novel hybrid functional machine learning algorithm. Remote Sens. 11:931. doi: 10.3390/rs11080931
Tofani, V., Raspini, F., Catani, F., and Casagli, N. (2013). Persistent scatterer interferometry (psi) technique for landslide characterization and monitoring. Remote Sens. 5, 1045–1065. doi: 10.3390/rs5031045
Wen, B. P., Zeng, Q. Q., and Yan, T. X. (2020). A preliminary geomechanical model for the initiation of large rocky, high-speed remote landslides on the southeastern Qinghai-Tibet Plateau. Eng. Sci. Technol. 52, 38–49. doi: 10.15961/j.jsuese.202000207
Wu, Y. F., Li, M. S., and Song, J. Q. (2008). Progress in remote sensing monitoring of plant phenology. J. Meteorol. Environ. 24, 51–58. doi: 10.3969/j.issn.1673-503X.2008.03.011
Xie, D. J., Lv, C. L., and Zu, M. (2020). Research progress of bionic materials simulating vegetation visible-near infrared reflectance spectra. Spectrosc. Spectr. Anal. 41, 1032–1038. doi: 10.3964/j.issn.1000-0593(2021)04-1032-07
Xu, Q. (2020). Awareness and reflection on issues related to landslide monitoring and early warning. J. Eng. Geol. 28, 360–374. doi: 10.13544/j.cnki.jeg.2020-025
Xu, Q., Dong, X. J., and Li, W. L. (2019). Integrated space-air-ground early detection, monitoring and warning system for potential catastrophic geohazards. J. Wuhan Univ. 44, 957–966. doi: 10.13203/j.whugis20190088
Xu, Q., Li, W. L., and Dong, X. J. (2017). Preliminary study on the characteristics and genesis mechanism of landslide in Xinmao Village, Feixi town, Mao County, Sichuan. J. Rock Mechan. Eng. 36, 2613–2628. doi: 10.13722/j.cnki.jrme.2017.0855
Xu, S., Shen, R. P., and Yang, X. Y. (2012). A comparative study of different vegetation indices for estimating vegetation coverage based on the dimidiate pixel model. Remote Sens. Land Res. 4, 95–100. doi: 10.6046/gtzyyg.2012.04.16
Xu, Q., Zhu, X., Li, W. L., and Dong, X. J. (2022). Technical progress of space-air-ground collaborative monitoring of landslide. J. Surv. Mapp. 51, 1416–1436. doi: 10.11947/j.AGCS.2022.20220320
Yang, W. T., Qi, W. W., and Zhou, J. X. (2018). Effects of precipitation and topography on vegetation recovery at landslide sites after the 2008 Wenchuan earthquake. Land Degrad. Dev. 29, 3355–3365. doi: 10.1002/ldr.3098
Yang, R., Yang, K., and Hong, L. (2014). Comparative analysis on the estimation precision of vegetation coverage of Shangrila based on different vegetation indices. Soil Water Conserv. Res. 21, 116–119. doi: 10.13869/j.cnki.rswc.2014.03.022
Yin, Y., Wang, W. P., Zhang, N., Yan, J. K., Wei, Y. J., and Yang, L. W. (2017). Long runout geological disaster initiated by the ridge-top rockslide in a strong earthquake area: A case study of the Xinmo landslide in Maoxian County, Sichuan Province[J]. Geol. China 44, 827–84. doi: 10.12029/gc20170501
Yue, J., Guo, W., Yang, G., Zhou, C., Feng, H., and Qiao, H. (2021). Method for accurate multi-growth-stage estimation of fractional vegetation cover using unmanned aerial vehicle remote sensing. Plant Methods 17:51. doi: 10.1186/s13007-021-00752-3
Zhang, X. L., Wang, M., Liu, K., Xie, J., and Xu, H. (2018). Using NDVI time series to diagnose vegetation recovery after major earthquake based on dynamic time warping and lower bound distance. Ecol. Indic. 94, 52–61. doi: 10.1016/j.ecolind.2018.06.026
Zheng, G., Xu, Q., Ju, Y. Z., Li, W. L., Zhou, X. P., and Peng, S. Q. (2018). Study on the characteristics and genesis mechanism of avalanches in Pusha Village, Zhangjiawan Town, Nayong County, Guizhou, August 28, 2017. J. Eng. Geol. 26, 223–240. doi: 10.13544/j.cnki.jeg.2018.01.023
Zhong, C., Li, C., Gao, P., and Li, H. (2021). Discovering vegetation recovery and landslide activities in the Wenchuan earthquake area with Landsat imagery. Sensors 21:5243. doi: 10.3390/s21155243
Keywords: high vegetation coverage, early identification of landslides, vegetation index, abnormal vegetation change, landslide creep
Citation: Wang B, He L, He Z, Qu R and Kang G (2023) Study of early identification method for large landslides in high vegetation coverage areas of Southwest China. Front. Ecol. Evol. 11:1169028. doi: 10.3389/fevo.2023.1169028
Edited by:
Michele Monego, University of Padua, ItalyReviewed by:
Subodh Chandra Pal, University of Burdwan, IndiaCopyright © 2023 Wang, He, He, Qu and Kang. This is an open-access article distributed under the terms of the Creative Commons Attribution License (CC BY). The use, distribution or reproduction in other forums is permitted, provided the original author(s) and the copyright owner(s) are credited and that the original publication in this journal is cited, in accordance with accepted academic practice. No use, distribution or reproduction is permitted which does not comply with these terms.
*Correspondence: Li He, aGVsaTIwMjBAY2R1dC5lZHUuY24=
Disclaimer: All claims expressed in this article are solely those of the authors and do not necessarily represent those of their affiliated organizations, or those of the publisher, the editors and the reviewers. Any product that may be evaluated in this article or claim that may be made by its manufacturer is not guaranteed or endorsed by the publisher.
Research integrity at Frontiers
Learn more about the work of our research integrity team to safeguard the quality of each article we publish.