 Amanda C. Croteau
 Haley N. Gancel2
 Tesfay G. Gebremicael
 Jane M. Caffrey
 Matthew J. Deitch
95% of researchers rate our articles as excellent or good
Learn more about the work of our research integrity team to safeguard the quality of each article we publish.
Find out more
ORIGINAL RESEARCH article
Front. Ecol. Evol. , 23 June 2023
Sec. Biogeography and Macroecology
Volume 11 - 2023 | https://doi.org/10.3389/fevo.2023.1167767
This article is part of the Research Topic Environmental Threats to the State of Florida—Climate Change and Beyond, volume II View all 10 articles
Florida’s low elevation and geographic location make it particularly vulnerable to climate change effects such as sea level rise, increased intensity and frequency of storm events, and altered precipitation. Climate change is expected to exacerbate hydrological cycling with potential widespread implications for estuarine habitats that thrive under specific salinity regimes. We used historical data from sites in the eastern Gulf Coastal Plain, USA to examine trends and trend variability of several climatic, hydrologic, and estuarine water quality variables which have implications on seagrass and oyster habitat extent in downstream estuarine environments. We analyzed temperature, precipitation, low-flow and high-flow metrics (including the highest or lowest daily, 7-day average, and 30-day average) for each season annually over the period 1985–2020. We also analyzed estuarine water clarity metrics and salinity within waterbody segments of four estuary systems within the study area. Hydroclimate results showed that temperature increased at most sites. While there was variation in streamflow, the overall trend was declining streamflow. Declining trends were observed in most water clarity metrics, indicating improved clarity, especially in winter. Salinity generally declined across the study area. While overall streamflow decreased, main river stems to the estuaries had increasing trends in maximum streamflow characteristics, likely contributing to the decrease in estuarine salinity across the region. These results indicate that trends in streamflow (both magnitude and timing) in the watershed affect downstream estuarine water quality. These results have important implications on seagrass and oyster restoration and management efforts in the region, indicating that it is important to understand changing climatic and hydrologic conditions and how they may impact the estuarine resources.
The Coastal Plain of southeastern North America is ecologically significant due to high biodiversity and endemism (Blaustein, 2008; Noss et al., 2015). Aquatic ecosystems of the Gulf Coastal Plain, including alluvial plains of Florida, Alabama, and Mississippi are particularly ecologically rich (Hamilton et al., 2022). This region is home to diverse communities of fishes (Warren Jr et al., 2000), amphibians (Walls, 2014), aquatic insects (Markos et al., 2016), and plants (Estill and Cruzan, 2001), more than 2,000 of which are endemic to the region (Noss et al., 2015). Aquatic and adjacent terrestrial ecosystems in the Gulf Coastal Plain also provide a number of ecosystem services that benefit human well-being. Managed forests across the region provide among the highest volumes of timber harvested annually in the world (Fox et al., 2007). Estuarine systems at the base of the Coastal Plain benefit from upstream process, particularly freshwater discharge, which helps maintain suitable environments for many fish, invertebrate, and plant species. Freshwater discharge from upstream catchments supports some of the largest commercial and recreational fisheries in the Gulf of Mexico (Karnauskas et al., 2013), which in turn provide the fishing industry with billions of dollars of revenue each year (Karnauskas et al., 2013; National Marine Fisheries Service, 2016).
Climatic stability is a key factor contributing to biodiversity and endemism, especially in the Gulf Coastal Plain, where topography and relief are low compared to other biodiversity hotspots (Harrison and Noss, 2017). While analysis of rainfall and streamflow trends in other parts of the U.S. illustrate statistically significant declining or increasing trends depending on the season, trends in the Gulf Coastal Plain from a handful of sites have appeared relatively stable over the latter 20th Century (Ficklin et al., 2016; Poshtiri and Pal, 2016). Despite this, recent extremes in precipitation and weather events have raised concerns about long-term aquatic ecosystem and water resource sustainability (Lockette, 2016). Climate change studies have reported regional and global increases in temperature and increases in both frequency and intensity of extreme weather events, which can alter the timing and intensity of freshwater flow to estuaries and coastal areas. Changes to freshwater flow have implications on estuarine function, influencing productivity through nutrient and organic matter availability, and altered salinity regimes that impact habitat and species distributions along the estuarine gradient. Marshall et al. (2021) examined five estuaries in the northwestern Gulf of Mexico and determined that all had decreases in freshwater inflow over the last 40 years. Changes in duration and intensity of freshwater flow regimes can result in shifts to parameters influencing key foundation species within these estuarine systems, such as seagrasses and oysters. Both seagrass and oysters provide critical ecological roles (habitat, food, etc.) in estuarine systems of the northern Gulf of Mexico and numerous ecosystem benefits, such as improved water clarity, shoreline stabilization, and enhancement of fisheries (Congdon et al., 2018; Shepard et al., 2018).
The growth and survival of seagrasses are directly related to both the quantity and quality of light penetrating the water (Dennison et al., 1993). Light penetration is tied directly to water clarity parameters such as color, turbidity, and total suspended solids. In the northern Gulf of Mexico, water transparency has been identified as a primary ecological integrity parameter for seagrass (Congdon et al., 2018). Seagrass species composition, seasonal abundance, and spatial distribution have been linked to salinity patterns (Lirman et al., 2008; Browder et al., 2013; Congdon et al., 2018).
Eastern Oysters (Crassotrea virginica) are typically found in salinities of 10–30 ppt, but can tolerate short periods of much lower (as low as 2 ppt) and higher (as high as 40 ppt) salinities (Gunter and Geyer, 1955). Short periods of freshwater inflow can reduce predation, but extended low salinity exposure can reduce spat survival and lead to sedimentation, while periods of high salinity can result in increased predation and disease exposure (Soniat, 1996; Chu and Volety, 1997; La Peyre et al., 2003, 2009, 2013; Volety et al., 2009). Salinity, in particular mean summer salinity, has been identified as the primary indicator of ecological integrity for oysters in the northern Gulf of Mexico (Shepard et al., 2018).
Despite the biodiversity value of the Gulf Coastal Plain of North America, few studies have investigated the dynamics or trends in discharge in this region. The purpose of this paper is to examine trends in several hydroclimatic and associated water quality variables in a portion of the Gulf Coastal Plain biodiversity hotspot—the northwest Florida Panhandle—over the period 1985–2020. Studies focusing on a particular region can help to understand regional relationships and variability among hydrologic variables at a finer level of detail than larger-scale studies in hydrologic trends can provide (e.g., Bawden et al., 2015; Ficklin et al., 2016; Poshtiri and Pal, 2016). Data analysis over a temporal scale of three to four decades can provide important hydrological insights: significant upward or downward trends over a period of three to four decades can allow inferences regarding shifts and deviations in water balance relationships (Ficklin et al., 2016; Wei et al., 2017). Long-term hydroclimatic trends can also help explain shifts in ecological communities: reduced flows over tens of years or less can cause long-term changes in aquatic ecosystem composition (Beche et al., 2006). Understanding shifts in freshwater flow, and associated impacts on salinity and water clarity are important for the long-term management and restoration of both seagrasses and oysters, especially in the context of anticipated impacts from climate change. In this study, we examined trends in precipitation, temperature, and high-and low-streamflow magnitude over the period 1985–2020 across the Gulf Coastal Plain. We also analyzed trends in several water clarity metrics (turbidity, total suspended solids) and salinity in four downstream estuaries: St. Andrews Bay, Choctawhatchee Bay, Pensacola Bay, and Perdido Bay.
We examined climatic, hydrologic, and estuarine water quality variables in southern Alabama and northwest Florida, located in the Gulf Coastal Plain of North America (Figure 1). The Gulf Coastal Plain is topographically characterized as flat or hilly with elevations ranging from 0 to 549 m above sea level, and is distinguished from the alluvial deposits of the Mississippi River (United States Army Corps of Engineers, 2010). Precipitation in the eastern Gulf Coastal Plain is bimodal, with high rainfall in winter and summer followed by drier seasons in spring and fall. Stream discharge is typically highest in late winter and early spring, with a slight increase in summer. The lower discharge in summer, relative to rainfall, is likely a result of higher summer evapotranspiration (United States Army Corps of Engineers, 2010). Most streams in this region flow south into one of six estuaries: Apalachicola Bay, St. Andrew Bay, Choctawhatchee Bay, Pensacola Bay, Perdido Bay, and Mobile Bay. In addition to their high ecological (United States Army Corps of Engineers, 2010; Karnauskas et al., 2013) and fisheries value (National Marine Fisheries Service, 2016), the associated beaches of these estuaries are a popular regional tourism destination (Hollis, 2004). The majority of the urban development and population growth has occurred in the southern portions of the watershed and along the bays (Northwest Florida Water Management District, 2017a,b,c,d; Figure 2).
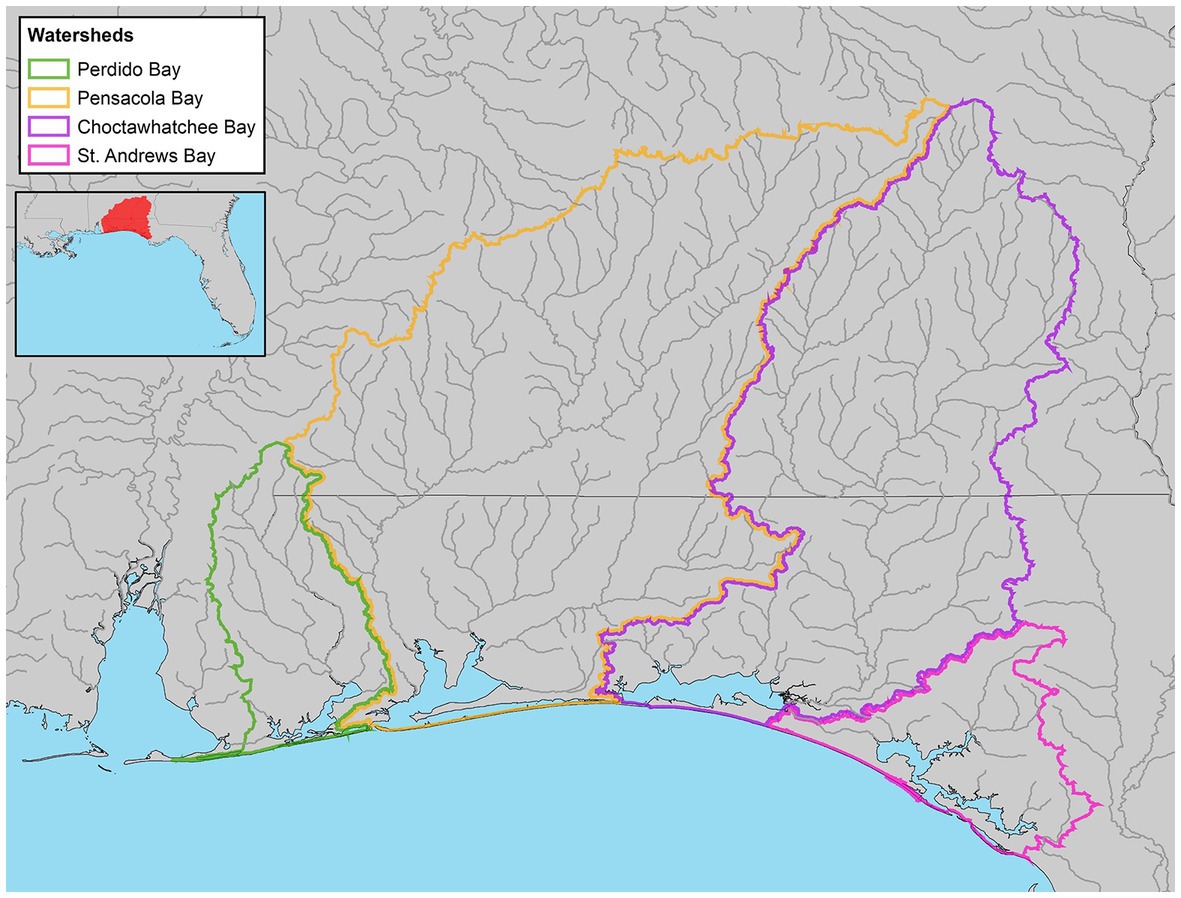
Figure 1. Location of study area, indicating the watershed boundary for each estuary: Perdido Bay, Pensacola Bay, Choctawhatchee Bay, and St. Andrew Bay.
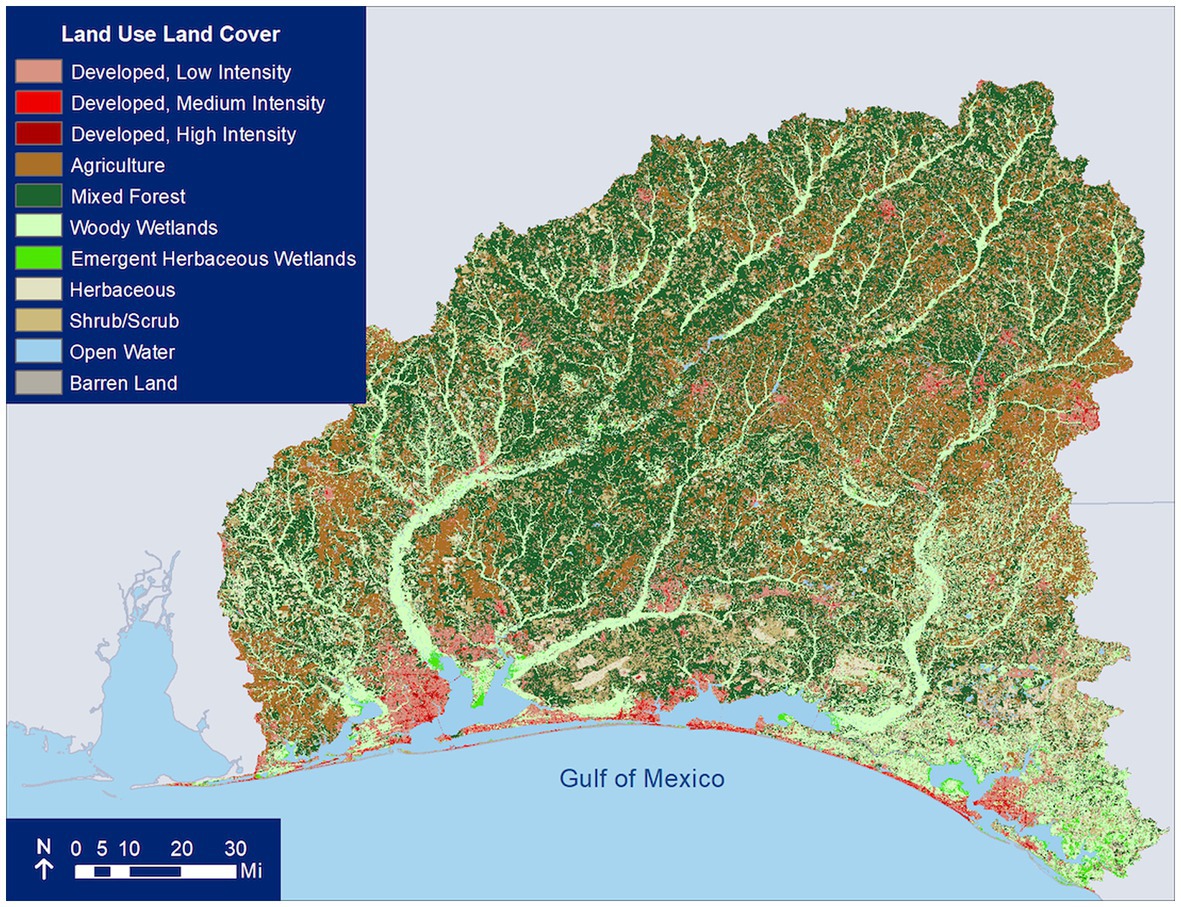
Figure 2. Land use and land cover of the study area from 2019. Data source: National Land Cover Database.
The St. Andrew Bay catchment encompasses approximately 3,000 km2 over six counties and receives inflow from the spring-fed Econfina Creek (from the Gainer Spring group, which has an average discharge of more than 350,000 m3 per day) through Deer Point Lake Reservoir. Only 12% of the catchment is developed; much of it is held as conservation land including the Econfina Creek Water Management Area. Major habitats in St. Andrew Bay system consist of springs, coastal dune lakes, tidal creeks, marshes, wetlands, estuarine, marine, and terrestrial ecosystems (Northwest Florida Water Management District, 2017a). Major stressors to the St. Andrew Bay include nutrient and bacterial loading from point and non-point sources, low dissolved oxygen, and high chlorophyll levels (Northwest Florida Water Management District, 2017a).
The Choctawhatchee Bay watershed spans approximately 13,800 km2 across parts of 10 counties in southern Alabama and six counties in northwest Florida. The Pea and Choctawhatchee Rivers are the primary sources of freshwater delivery to Choctawhatchee Bay. Most of the watershed is forested or agricultural (Le et al., 2015), with most commercial and residential development (including resort communities such as Destin and Seaside) immediately surrounding the bay, owing to the popularity of local beaches and the Gulf of Mexico coastline (Figure 2). A large portion of the catchment in Florida (1,700 km2) is held by Eglin Air Force Base, with smaller areas held in conservation by the State of Florida, local governments, and non-profits (including the river delta and adjacent areas designated per the Florida Administrative Code as Outstanding Florida Waters). Primary habitats in the bay and watershed are seagrasses, coastal dune lakes, longleaf pine uplands, steephead ravines, and wetlands. The Choctawhatchee River and Bay are also important habitat for many rare and endangered species such as the Gulf Sturgeon, for which the Choctawhatchee River population of over 3,000 adults is second only to the Suwannee River (Wakeford, 2001). Specific stressors include hillslope, channel bank, and road-related erosion from the watershed and nutrient loading, which have negatively impacted seagrasses beds of the region; other reported stressors relating to water quality in Choctawhatchee Bay are heavy metals, bacterial loading, and low dissolved oxygen (Northwest Florida Water Management District, 2017b).
The Pensacola Bay catchment extends from southern Alabama through northwest Florida to the Gulf of Mexico, covering approximately 18,100 km2, with approximately two-thirds of the catchment located in Alabama. The Escambia, Blackwater, and Yellow Rivers discharge into the Pensacola Bay complex. The Pensacola Bay system is comprised of four main bays (Pensacola, Escambia, Blackwater, and East Bay), several urban bayous, and Santa Rosa Sound. The area surrounding the estuary consists of wetlands, upland forests, agricultural lands, and urban and residential development (Figure 2). Stressors include point and non-point pollution (nutrients and organic compounds) and sedimentation from urban and agricultural development, which have degraded seagrass habitats and sediment quality (Northwest Florida Water Management District, 2017c). The bay has also been impacted from long-term industrial pollution (Northwest Florida Water Management District, 2017c).
Perdido Bay serves as the border between Florida and Alabama and the catchment extends from southern Alabama through northwest Florida, covering approximately 2,900 km2. It receives major freshwater inputs from the Perdido River flowing approximately 110 km. The area surrounding the estuary consists of wetlands, upland forests, agricultural lands, and urban and residential development (Figure 2). System stressors include point and non-point pollution and sedimentation from urban and agricultural development, which have degraded seagrass habitats and sediment quality, and impacts from long-term industrial pollution (Northwest Florida Water Management District, 2017d).
Climate data (daily precipitation and average daily temperature) were obtained through the NOAA National Climatic Data Center (NCDC) Global Historical Climatology Network (National Oceanic and Atmospheric Administration National Climatic Data Center Global Historical Climatology Network, 2022) and Climate Data Online (CDO) Weather-Bureau-Army-Navy dataset (National Oceanic and Atmospheric Administration Climate Data Online, 2022). We performed quality control checks on climate data for omitted values (indicated by no data entered for a date) and erroneous data (indicated by 9,999 or 99.99). Precipitation and temperature values other than those with omitted or error values were presumed accurate after plotting the data to check for other outliers. We only used those sites with a combined data error under 5% for both common data error types during 1985–2020, which resulted in 20 precipitation sites (Alabama N = 14, Florida N = 6) and 17 temperature sites (Alabama N = 12, Florida N = 5; Figure 3). Climate variable stations, where precipitation and temperature data were collected were assigned a station code (CV-1 – CV-20).
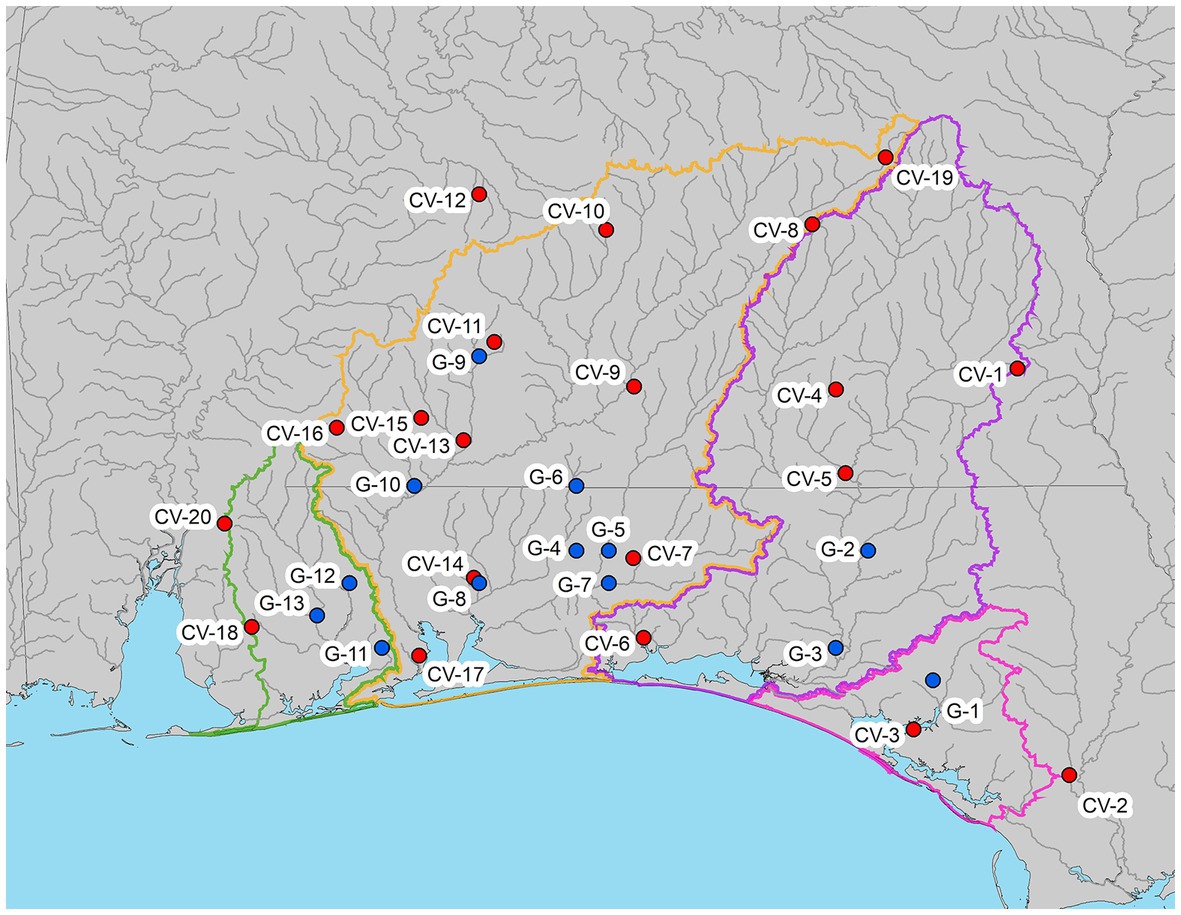
Figure 3. Location of climate variable (temperature and precipitation) stations (CV), and USGS streamflow gauge stations (G). Stations with both precipitation and temperature datasets are indicated in red, and stations with only precipitation are indicated in blue.
We identified 13 US Geological Survey (USGS) streamflow gauges (United States Geological Survey National Water Information System, 2022) upstream of the bay systems from St. Andrew Bay to the east and Perdido Bay to the west and north, with at least 30 years of streamflow records between 1985 and 2020 (Figure 3). Gauge stations were assigned a station code (G-1 – G-13). Out of the 13 stations, 10 had complete records and the remaining 4 stations had some missing values (Table 1). Seven of the 13 sites are part of the USGS Hydro-Climatic Data Network (HCDN, intended to indicate streams that are minimally affected by large-scale water management operations), and others are within state forests or other protected areas.
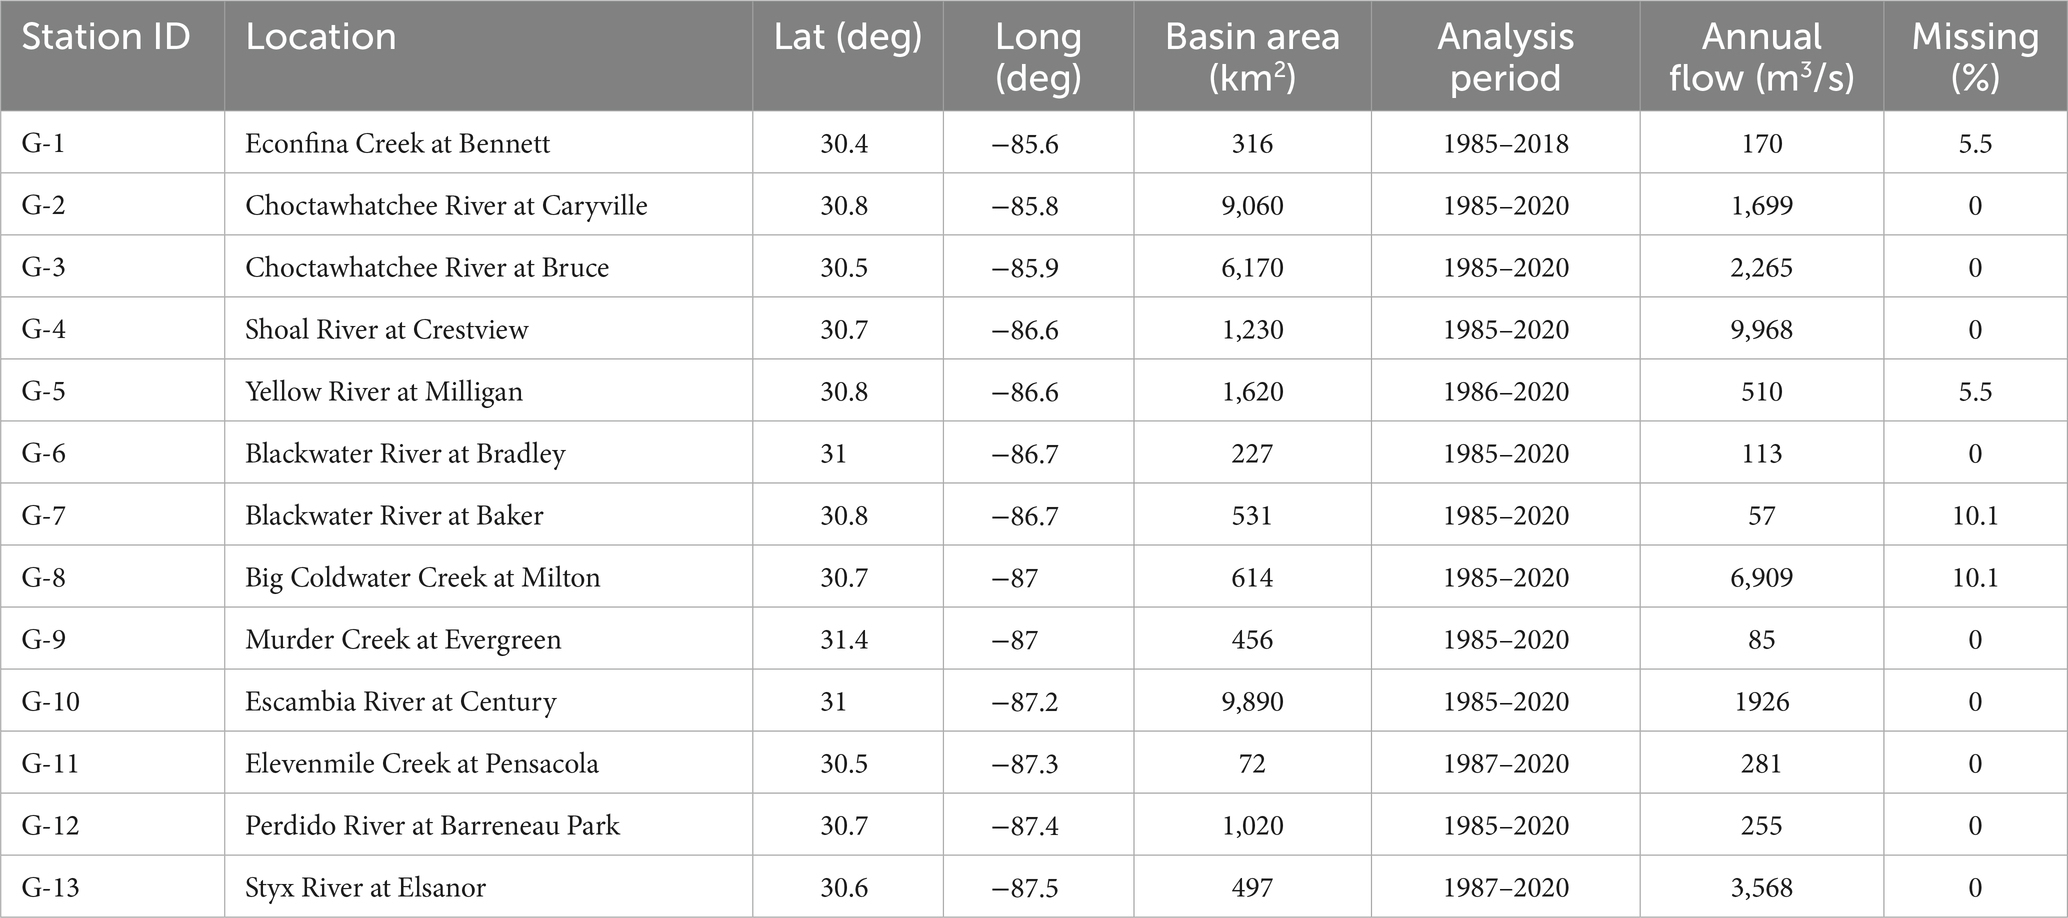
Table 1. Summary characteristics of the hydrological monitoring stations.
Estuarine water clarity parameters [turbidity and total suspended solids (TSS)] and salinity data were obtained from the US EPA Water Quality Portal (United States Environmental Protection Agency Water Quality Portal, 2022) and Florida Department of Environmental Protection’s (DEP) Impaired Waters Rule database. All estuarine parameters were the result of discrete sampling events collected by multiple organizations across our study area and sampling frequency varied by both organization and over the study period. Downloaded data were standardized to sample depth (surface, ≤1 m), comparable analysis methods and units, and then cleaned by removing quality control samples and duplicate entries. Datasets with unknown or non-standard sampling or analysis methods, did not have associated units, or were missing other metadata that prevented standardization were removed. Within each of the four estuarine systems (St. Andrew, Choctawhatchee, Pensacola, and Perdido Bays), parameter metrics were calculated for each unique estuarine segment using the Florida DEP and Alabama Department of Environmental Management waterbody identification (WBID) number, resulting in 9 St. Andrew Bay segments, 19 Choctawhatchee Bay segments, 13 Pensacola Bay segments, and 6 Perdido Bay segments (Figure 4). Estuary segments were assigned a station identification code consisting of a bay code and numerical identifier (SAB-1 – SAB-9, CB-1 – CB-19, PB-1 – PB-9, and PDB-1 – PDB-6).
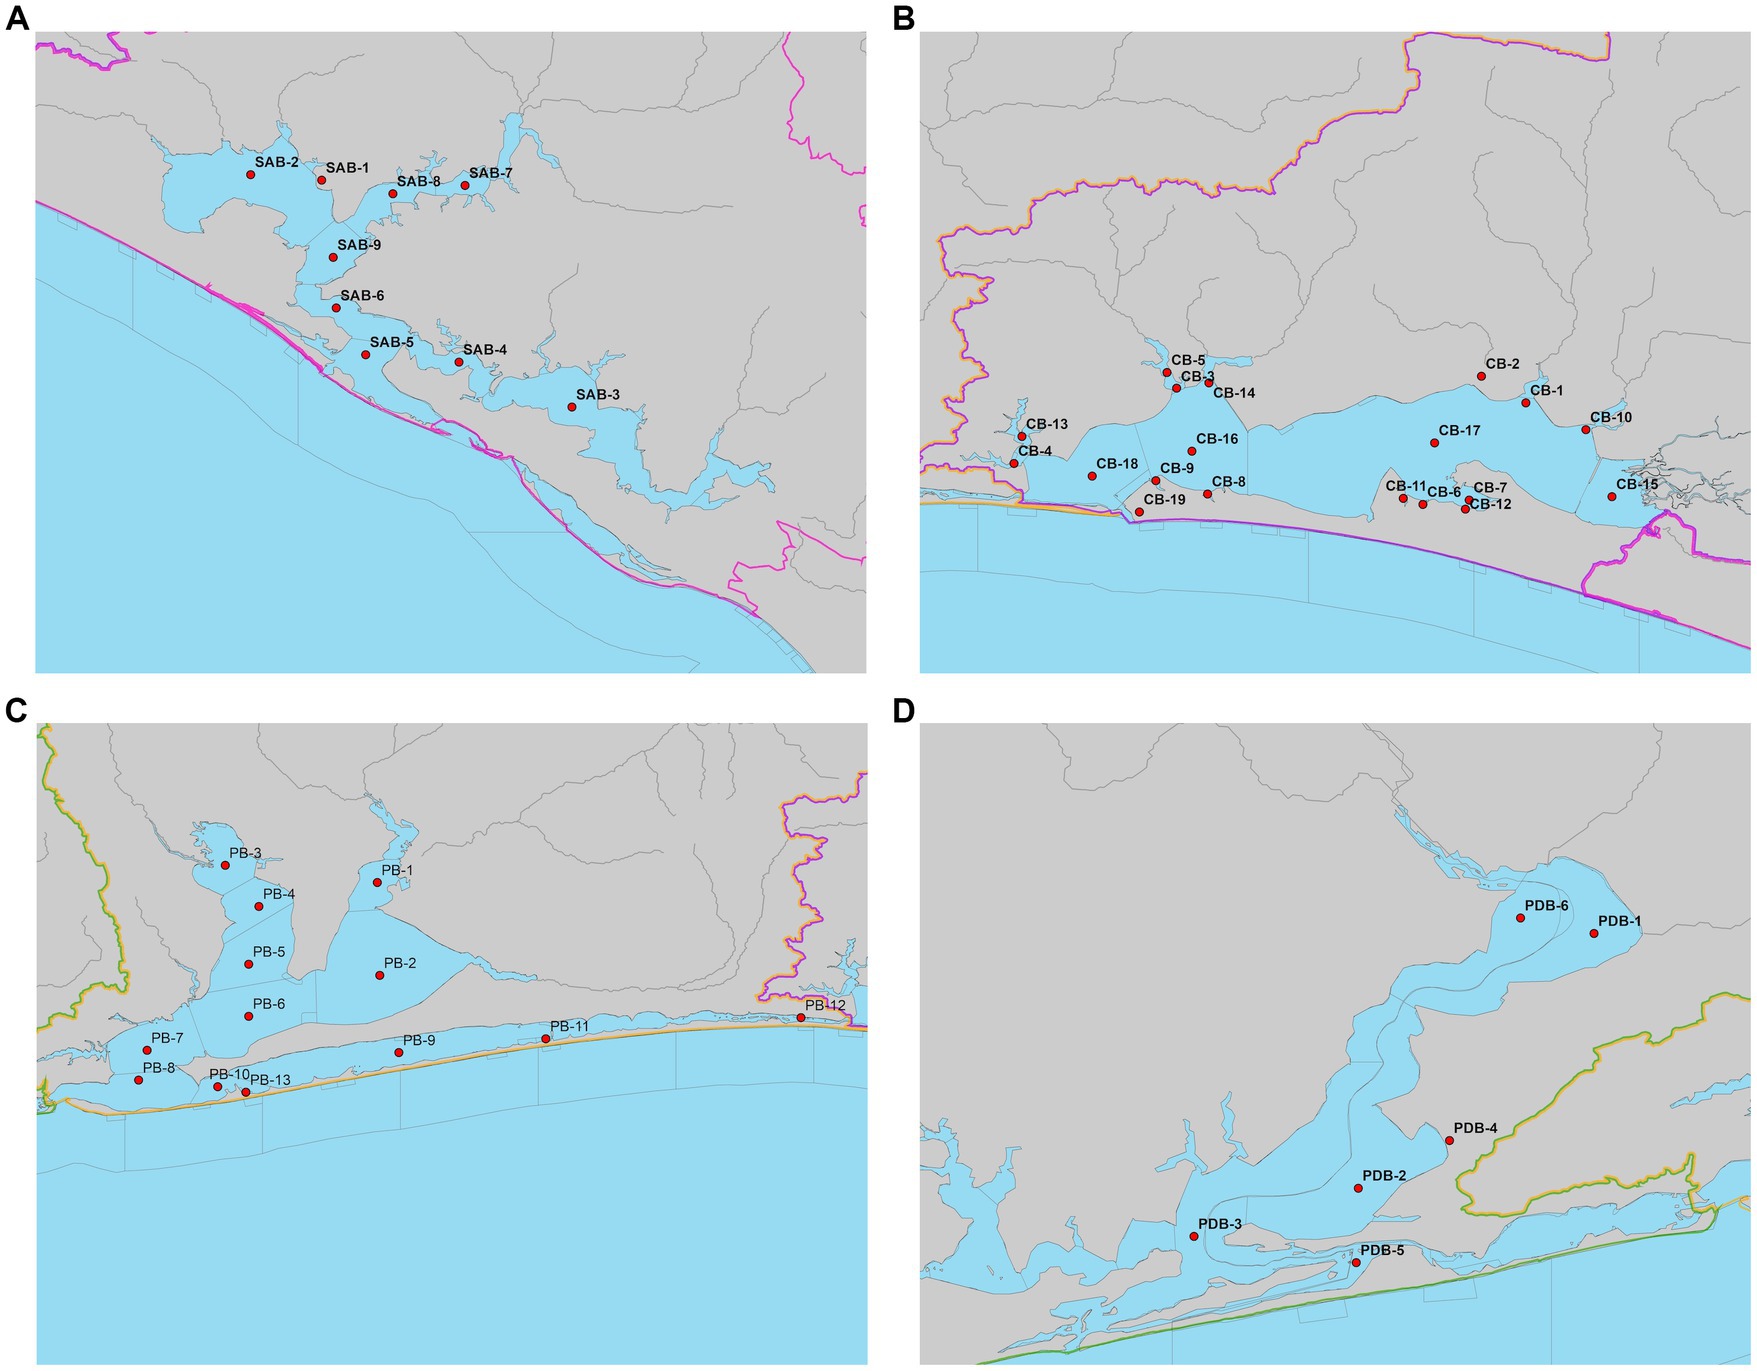
Figure 4. Location of estuarine variable stations in (A) St. Andrew Bay system, (B) Choctawhatchee Bay system, (C) Pensacola Bay system, and (D) Perdido Bay; gray lines indicate borders among state-designated estuary segments.
We used historical precipitation and temperature records to calculate seasonal median precipitation and maximum temperature. Seasons in the study region are classified as winter (December to February), spring (March to May), summer (June to August), and fall (September to November). To reduce the influence of zeros in the dataset, a 7-day total precipitation was calculated for each day (sum that day and six previous days), and the seasonal median value was determined for each season.
Streamflow data were used to develop metrics describing high and low flow magnitudes and their timing each year over the 36-year study period. We used three metrics to examine changes in low-flow magnitude over different timescales: lowest mean daily flow, 7-day low flow (calculated as the average flow for the period with the lowest total discharge over seven consecutive days) and the 30-day low flow (calculated as the average flow for the period with the lowest total discharge over 30 consecutive days). Similarly, we calculated three metrics to examine high-flow trends over different timescales: the highest mean daily flow, 7-day high flow (the average flow over the seven-day period with highest discharge), and the 30-day high flow (the average flow over the 30-day period with highest discharge). This range of time scales was examined because different flow regimes can have differing effects on the downstream aquatic communities. In their analysis of long-term flow data in the US, Poshtiri et al. (2018) found no difference in variability between daily, 7-day, and 30-day minimum flow metrics. We chose to include all variables in our analysis to examine not only positive and negative trends but also differences in timing and magnitude of flows, as increasing or decreasing trends in minimum and maximum daily flows may have less of an impact on estuarine water quality than trends over longer timescales.
To examine downstream impacts of changes in climate and flow regimes, we looked at water quality metrics associated with freshwater discharge with implications for key estuarine habitats (seagrass and oysters): salinity, turbidity, and TSS. Within each of the four estuarine systems (St. Andrew, Choctawhatchee, Pensacola, and Perdido Bays), seasonal means were generated for parameters at each unique estuarine segment. This scale allows for the examination of trends over time and spatial area, not just using annual averages, but within specific seasons that are key to seagrass and oyster growth and recruitment. For example, water clarity declines during the seagrass growing season could lead to reductions in seagrass coverage and inhibit restoration efforts. Similarly, altered salinity regimes can shift community composition of seagrass, expose oysters to increased predation (high salinity), or reduce oyster recruitment and growth (low salinity).
Time-series data for the climatic, streamflow, and estuarine water quality parameters were analyzed with a Seasonal Mann-Kendall trend (Kendall, 1948; Meals et al., 2011) and Sen’s slope tests (Sen, 1968; Meals et al., 2011) using the “Trend” package in R (Pohlert, 2020). The Seasonal Mann-Kendall (SMK) trends test evaluates whether there is an upward or downward trend in a time-series dataset by conducting a Mann-Kendall trend for each time unit (i.e., month and season), then combining the results for each unit. For example, only July (for monthly) observations are compared to other July observations and summer (for seasonal) to other summer observations. The SMK test is robust, powerful, and recommended for water quality trend monitoring (Meals et al., 2011). The SMK test determines whether the trend is significant at a given significance level (e.g., at α = 0.05 or α = 0.10), and an estimate of the trend slope can be calculated using the Sen slope. The Mann-Kendall test is especially useful for examining trends among hydrologic data because it is a non-parametric statistical analysis, and thus does not assume normally distributed data (Helsel and Hirsch, 2002; Yue et al., 2003; Zhang et al., 2011).
In addition to testing whether a data set has a statistically significant upward or downward trend, the Mann-Kendall test also produces a standardized Z statistic which characterizes the consistency of the trend, thus making it a useful metric for comparing the trend “strength” among sites with varying Z values (Modarres and Rodriguez da Silva, 2007; Ficklin et al., 2016). Negative Z statistics correspond to downward trends, and positive values correspond to upward trends. Unlike the SMK test, which only provides a significant positive or negative trend, the non-parametric Sen’s slope (Sen, 1968) is a powerful tool to estimate the magnitude of trends in hydroclimatic time-series data (Tabari et al., 2011; Gocic and Trajkovic, 2013; Da Silva et al., 2015; Dawood, 2017).
Estuarine trends were analyzed using the best available continuous datasets. Date ranges (years and included seasons) were selected to maximize temporal coverage. Because seasonal means were calculated, any missing data was considered a gap and not estimated. Trends were considered short-term if the dataset contained 5–9 years of continuous data. Long-term trends were identified through the analysis of 10+ years of continuous data.
Significant trends in maximum temperature (Tmax) were observed at 11 of 17 sites (65%) in the study area (Figure 5). Seasonal change in Tmax showed an increasing tendency among most of those sites with significant Tmax trends (82%), with only two Alabama stations (CV-10 Greenville, AL and CV-13 Brewton, AL) displaying a significant declining trend (Figure 5). As indicated by the Sen’s slope, the maximum rate of seasonal increase in Tmax ranged from 0.03–0.11°C year−1, while the decreasing stations decreased at a rate of 0.07 and 0.04°C year−1, respectively (Supplementary Table S1).
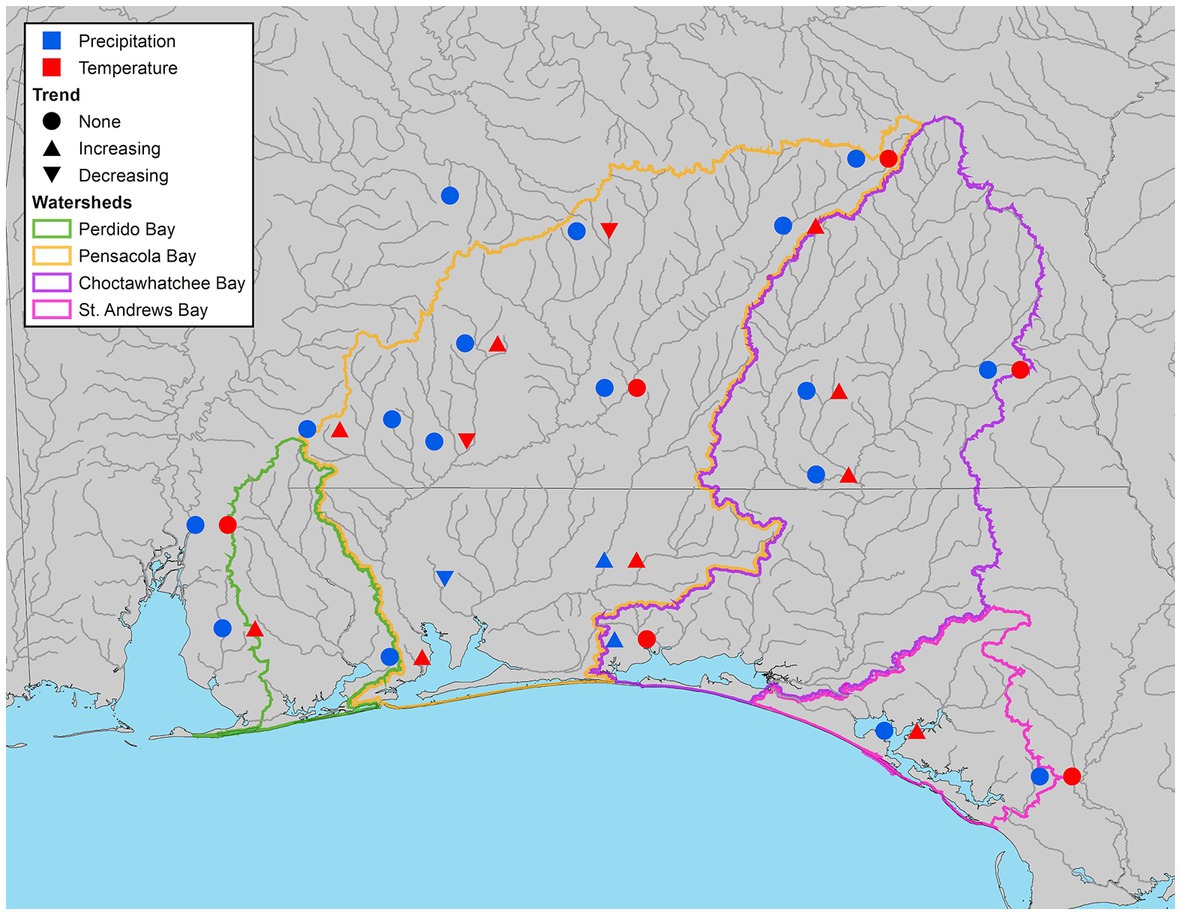
Figure 5. Climate stations illustrating significant increasing, decreasing, or no trend (α = 0.05) in both precipitation (blue) and maximum temperature (red).
Within each season, significant trends were observed most often in winter (5 stations), followed by fall (4 stations), spring (3 stations), and summer (2 stations; Supplementary Table S1). In the winter, only increasing trends were observed, indicating that higher maximum winter temperatures are occurring with frequency at 29% of the stations in the study area, and 45% of the stations with an overall significant trend. Crestview, FL (CV-7) was the only station to have a significant trend (increasing) in every season.
Analysis of median precipitation data via SMK and Sen’s slope tests yielded mixed results. An overall significant trend (α = 0.05) in precipitation occurred at 15% (3 of 20) of stations (Figure 5). Two stations in close proximity to one another, Niceville (CV-6) and Crestview, FL (CV-7) had significant increasing trends, while the neighboring station to the west, Milton, FL (CV-14) had a declining trend (Figure 5). One additional station observed an increasing trend for a season, and two had significant declining trends for a single season (Supplementary Table S2). All other stations (14 of 20) had no observed overall or seasonal trends (Supplementary Table S2).
Overall trends in daily minimum, 7-day, and 30-day minimum flows were significant at 31, 15, and 23% of stations, respectively. Most of the locations with significant daily minimum trends (3 of 4) had declining trends (Figure 6), indicating that minimum flows were decreasing across the study period. The station that displayed the most consistent declining trend, Eleven Mile Creek (G-11), had decreasing daily, 7-day, and 30-day minimum flows observed in all seasons (Table S3-5). Two stations had increasing minimum flow trends. Econfina Creek (G-1) had significant increasing trends for all three flow metrics and Yellow River (G-5) had significant increasing 30-day minimum flows (Supplementary Tables S3-S5).
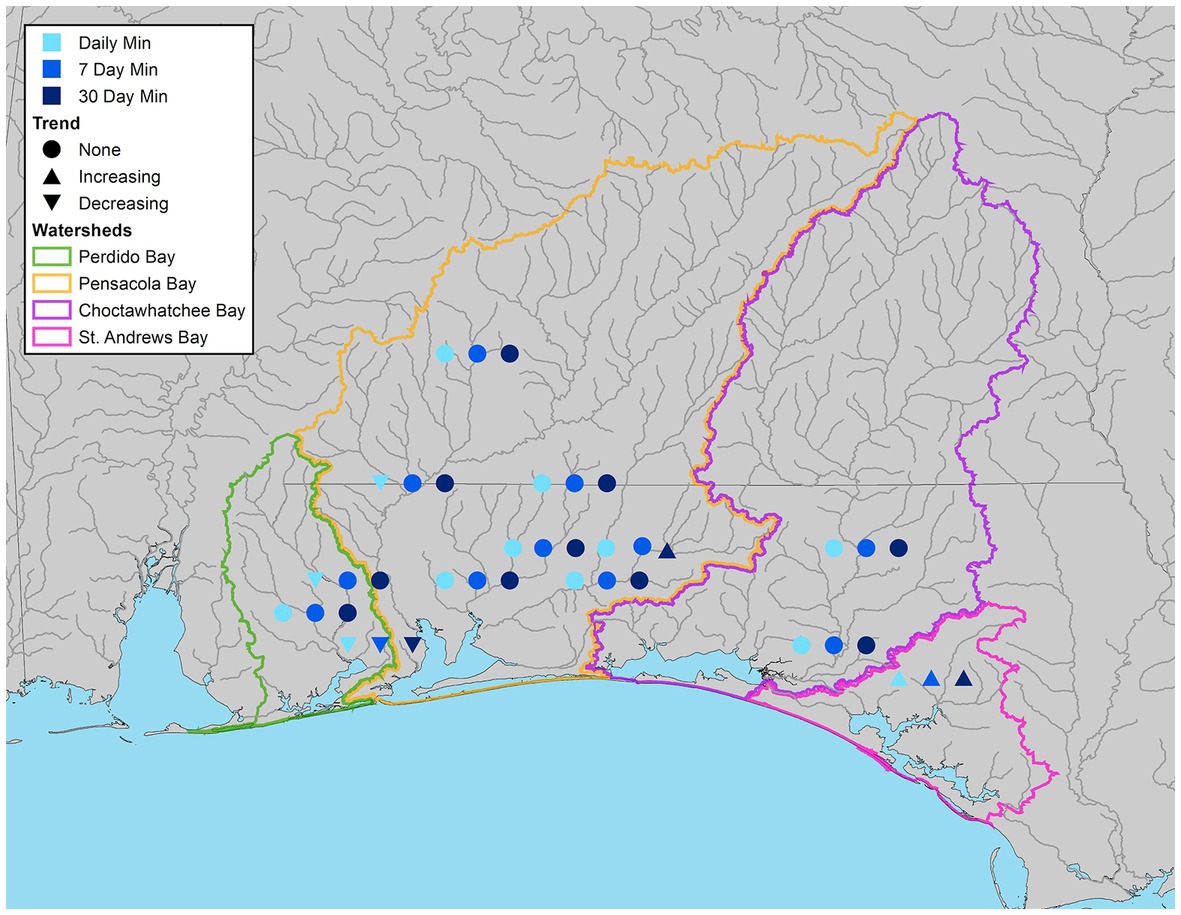
Figure 6. Streamflow gauges illustrating significant increasing, decreasing, or no trend (α = 0.05) for minimum daily (light blue), 7-day (blue), and 30-day (dark blue) flow.
Maximum flow characteristics were more variable. Econfina Creek (G-1) had increasing trends across all maximum flow metrics (Figure 7), with that trend largely being driven by increases in winter (Supplementary Tables S3-S5). Yellow River (G-5) and one of the Choctawhatchee River sites (G-2) also had an increasing winter trend in daily maximum flow. Eleven Mile Creek (G-11) had an overall significant decreasing 30-day maximum flow, which may be driven by decreases in spring as all three flow metrics had significant decreasing trends in the spring (Supplementary Tables S3-S5).
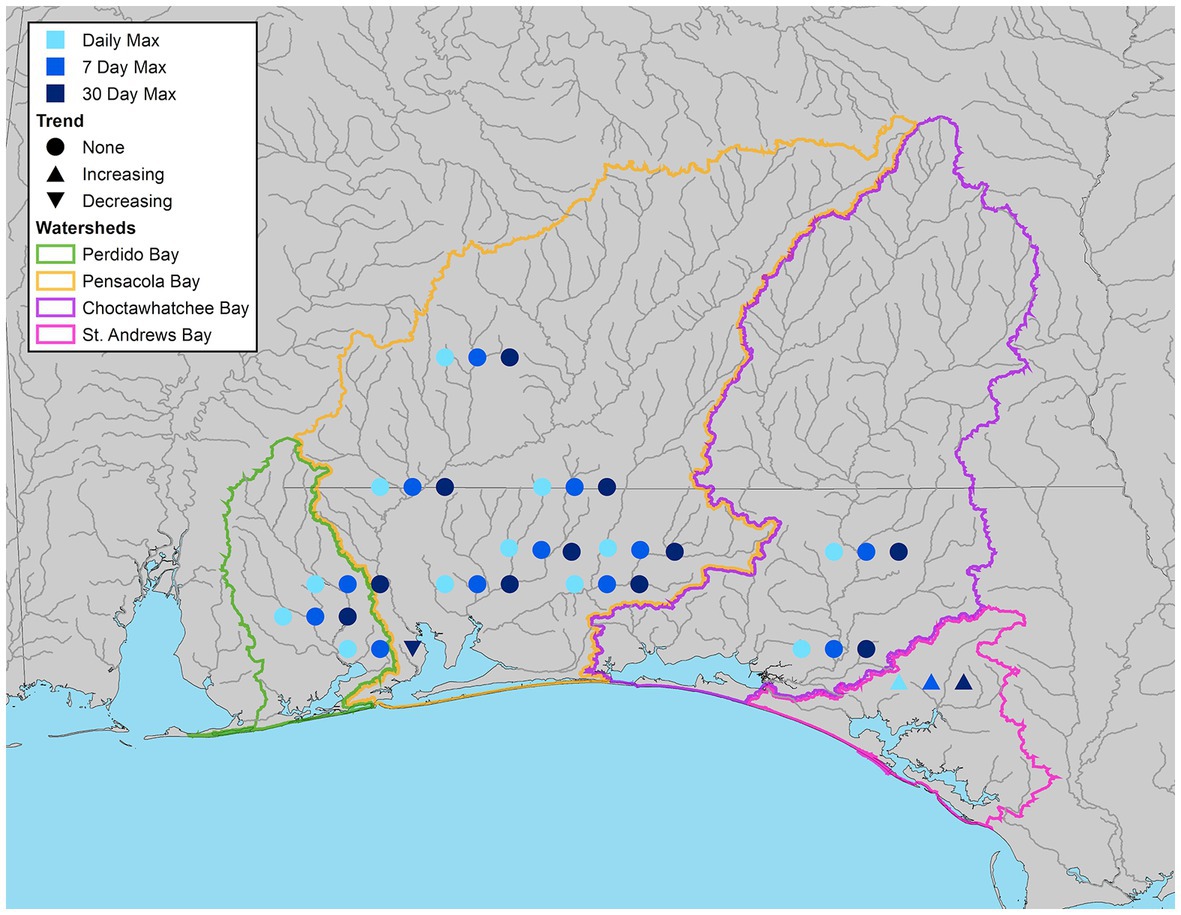
Figure 7. Streamflow gauges illustrating significant increasing, decreasing, or no trend (α = 0.05) for maximum daily (light blue), 7-day (blue), and 30-day (dark blue) flow.
There were 9 WBIDs with continuous seasonal data for at least one parameter across the study period. TSS had the lowest spatial (2 WBIDs) and temporal (10 years or less) coverage. Neither location had significant trends (Figure 8). Of the 5 waterbody segments with continuous turbidity data, only West Bay (SAB-2) had significant trends (Figure 8). These declining trends were observed in the overall, winter and spring values (Supplementary Table S6).
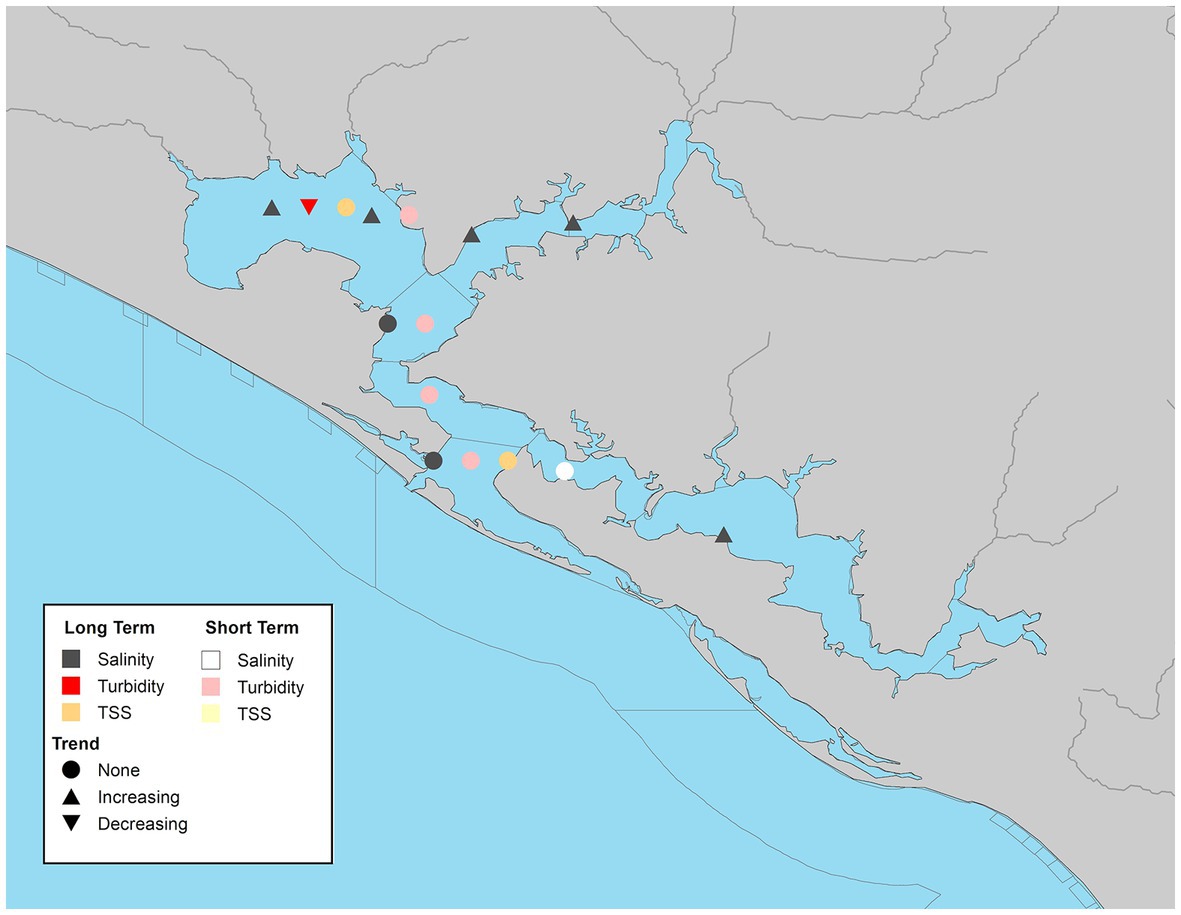
Figure 8. Waterbody identification (WBIDs) within St. Andrew Bay system with at least 10 years of data, illustrating significant increasing, decreasing, or no trend (α = 0.05) with long-term datasets indicated by darker symbols and short-term in lighter symbols for turbidity (red/pink), total suspended solids (orange/yellow), and salinity (dark gray/white).
Salinity trends were less variable. Significant increasing trends in salinity were observed in 55% of WBIDs (Figure 8). All of the stations with significant overall trends, had significant increasing winter trends and half of them had significant increasing spring trends (Table S6). Two WBIDs, St. Andrew Bay (SAB-5) and St. Andrew Bay middle (SAB-6) had decreasing seasonal trends which were observed in the summer and fall, respectively (Supplementary Table S6). Both of these sites had a declining overall trend, but neither of them were significant.
The Choctawhatchee Bay system had 19 WBIDs with continuous seasonal data distributed across the study period. TSS trends were analyzed for 14 WBIDs. Date ranges varied by site with most sites having continuous coverage for some period between 1999 to 2019. Most WBIDs (78%) had significant overall declining trends in TSS (Figure 9). Significant trends by season varied by waterbody, but they were all declining trends. Two WBIDs, Hogtown Bayou East (CB-7) and Lagrange Bayou (CB-10) had significant declining trends across all seasons, and another Rocky Bayou (CB-14) had declining trends across all seasons (Supplementary Table S7). While trends were observed in 4 WBIDs, spring had the fewest significant locations. Turbidity data was more variable. Of the 19 WBIDs, 6 had significant increasing trends and an additional segment had a significant declining trend (Figure 9). When significant seasonal trends were present, they matched the directionality of the corresponding overall trend (Supplementary Table S7).
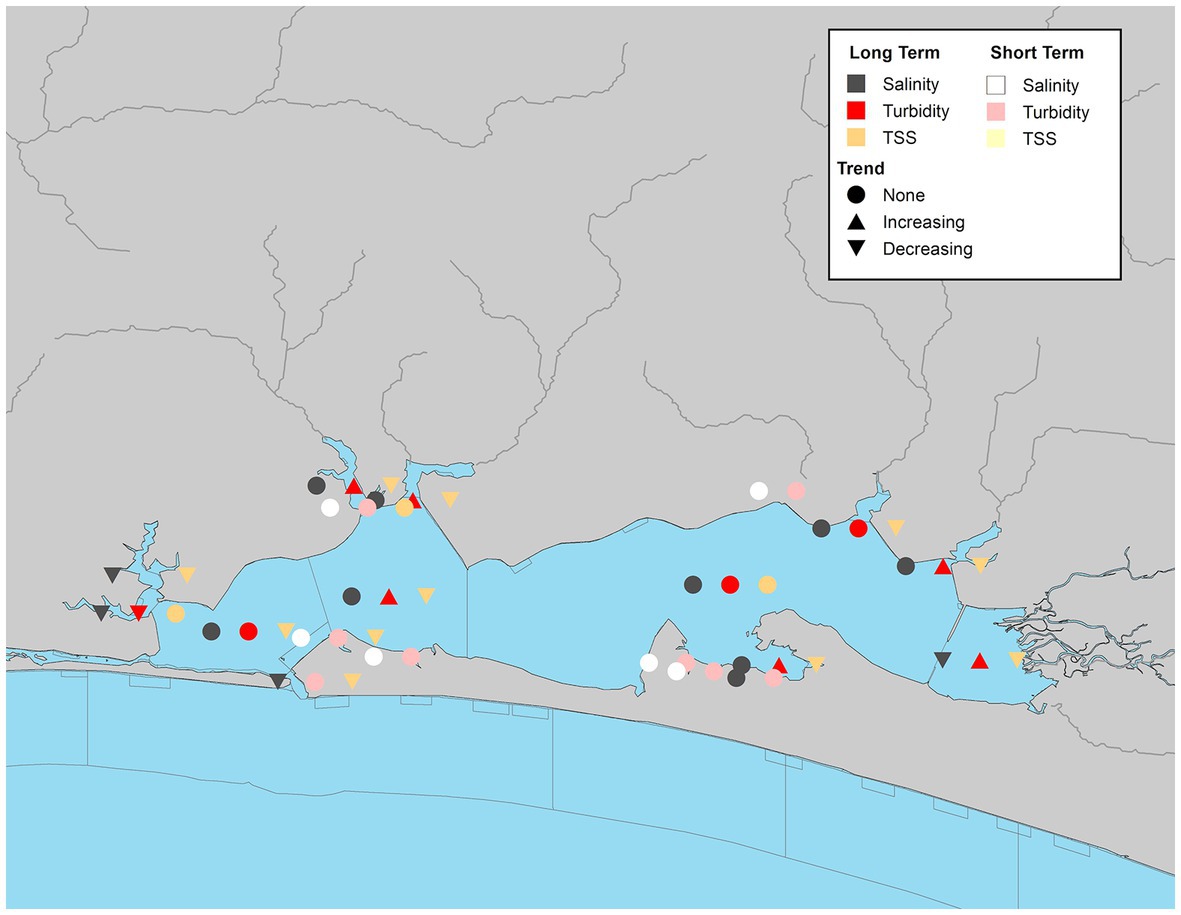
Figure 9. Waterbody identification within Choctawhatchee Bay system with at least 10 years of data, illustrating significant increasing, decreasing, or no trend (α = 0.05) with long-term datasets indicated by darker symbols and short-term in lighter symbols for turbidity (red/pink), total suspended solids (orange/yellow), and salinity (dark gray/white).
There were WBIDs in the Choctawhatchee Bay system with significant long-term declining trends in salinity (Figure 9; Supplementary Table S7). Some of these segments showed similar trends in either the summer or fall. Two additional WBIDs had declining trends in the fall. The only bay segment that had a significant positive trend was Choctawhatchee Bay middle (CB-17) in the fall (Supplementary Table S7).
The Pensacola Bay system had 13 WBIDs with continuous seasonal data. TSS coverage was limited to 7 waterbody segments with 10 years or less of continuous data, and only a single WBID, Pensacola Bay middle (PB-7) had a significant short-term increasing trend for its overall and summer values (Figure 10; Supplementary Table S8). Turbidity data was available at 11 waterbody segments. Only two WBIDs, East Bay (PB-2) and Liza Jackson Park in Santa Rosa Sound (PB-12) had significant overall short-term trends, both of which were declining (Figure 10). Declines were also observed in the fall at both East Bay (PB-2) and Pensacola Bay north (PB-6), and in the spring at Pensacola Bay mouth (PB-8; Supplementary Table S8).
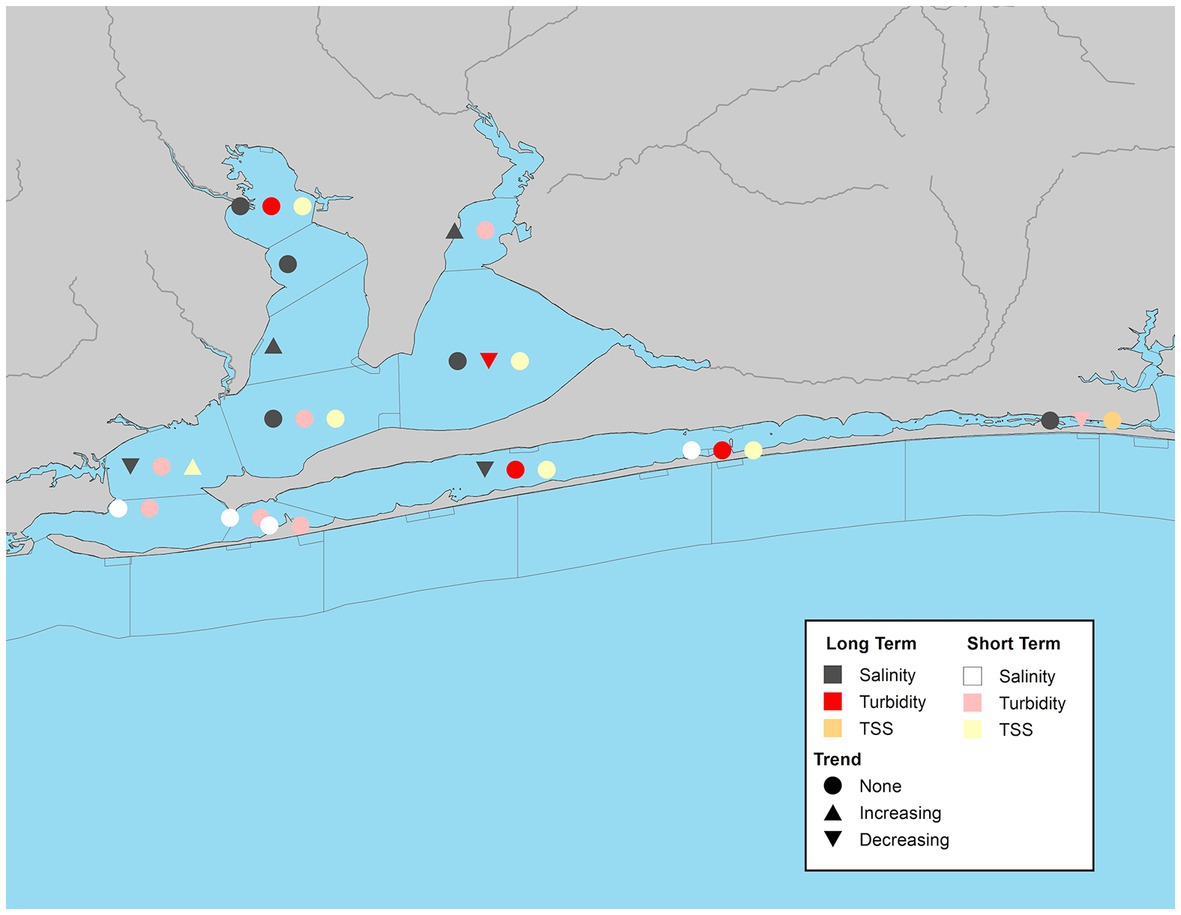
Figure 10. Waterbody identification within the Pensacola Bay system with at least 10 years of data, illustrating significant increasing, decreasing, or no trend (α = 0.05) with long-term datasets indicated by darker symbols and short-term in lighter symbols for turbidity (red/pink), total suspended solids (orange/yellow), and salinity (dark gray/white).
Over the study period, only 4 of 13 WBIDs had significant trends in salinity (Figure 10). Of those two had increasing trends, Blackwater Bay south (PB-1) and Escambia Bay south (PB-5) and two had decreasing trends, Pensacola Bay middle (PB-7) and Santa Rosa Sound (PB-9; Supplementary Table S8). The two significant seasonal trends, one positive in spring and one negative in the summer matched the corresponding overall trends (Supplementary Table S8).
The Perdido Bay system had the fewest total WBIDs per estuary (6) and suffered from episodic monitoring, thus trends within this system are harder to summarize across the study period. Overall TSS values declined in lower Perdido Bay (PDB-2), but increased in the Intracoastal Waterway (PDB-5; Figure 11). No significant trends in turbidity for overall or seasonal values were observed (Figure 11; Supplementary Table S9). Salinity increased at one station on the Alabama side of the bay (PDB-3) with significant trends observed in overall and fall values (Supplementary Table S9).
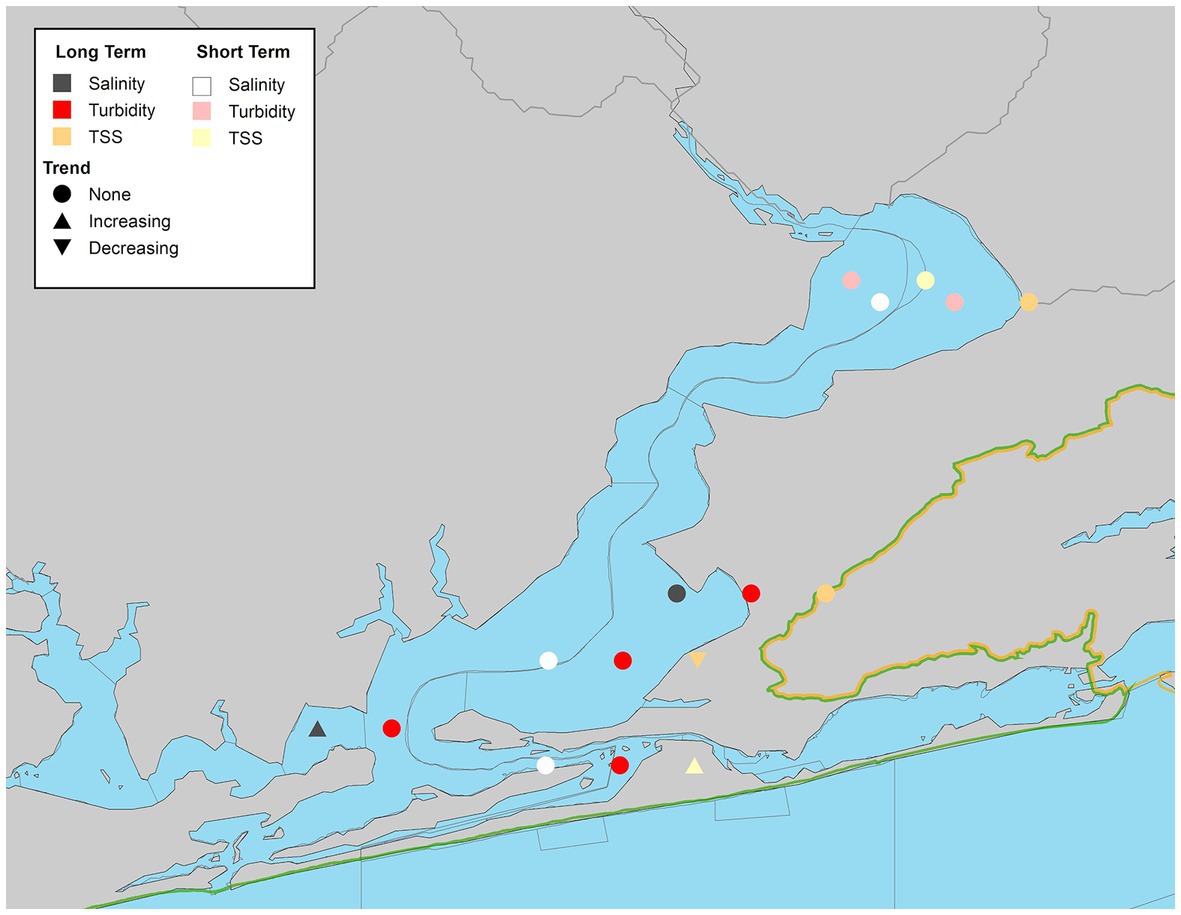
Figure 11. Waterbody identification within Perdido Bay system with at least 10 years of data, illustrating significant increasing, decreasing, or no trend observed (α = 0.05) with long-term datasets indicated by darker symbols and short-term in lighter symbols for turbidity (red/pink), total suspended solids (orange/yellow), and salinity (dark gray/white).
The results above highlight the complexity of interactions between climate characteristics and ecologically significant hydrologic variables in streams within the eastern Gulf Coastal Plain. In general, precipitation has not significantly increased or decreased at annual or seasonal scales, suggesting that total rainfall amounts have been the same over the past 36 years. These results mirror similar studies that found precipitation to be relatively stable in the late 20th and early 21st Centuries (Ficklin et al., 2016; Maleski and Martinez, 2017). This is seen despite changes in global multi-annual climate patterns such as El Nino-Southern Oscillation that could result in wetter conditions in summer and fall in El Nino years and drier conditions in La Nina years (Ropelewski and Halpert, 1986; Clark II et al., 2014). Trends in temperature were stronger with maximum temperature increasing at most sites, and especially in winter, but in other seasons as well. This contrasts to other studies of temperature trends within other river basins in the region that found relatively static high temperatures (Maleski and Martinez, 2017). This contrast may be due to differences in the period of analysis in both scale (118 years versus 36 years) and the influence of more contemporary temperature data. Warmer temperatures, especially during winter, can lead to meaningful changes in crop production (Parker and Abatzoglou, 2019), accelerated tree growth in pine forests (Harvey et al., 2020), and expansion of tropical species into subtropical regions (Osland et al., 2021). With forests comprising more than 50% of the project area (Le et al., 2015), increased high temperatures could amplify forest evapotranspiration, resulting in reduced streamflow especially during base flow conditions.
Increased forest evapotranspiration caused by higher temperatures may be a factor in the observed general declines in low-flow characteristics in streams throughout the project area. Significant declining trends were observed in both the Escambia and Perdido Rivers where the majority of their watershed is in upland forests (Figure 2; Northwest Florida Water Management District, 2017c,d). Further, while trends within season were mostly not significant at α = 0.05, only Econfina Creek (G-1) did not have a negative tendency across all seasons for daily and 7-day minimum flows. Eleven Mile Creek (G-11) had significant declining trends in all four seasons for all minimum flow metrics. Our results contrast broader, national-scale studies that described few trends among low base flow conditions in the Gulf Coastal Plain (Ficklin et al., 2016), or mixed and weak trends among low-flow conditions based on fewer sites in the region (Rice et al., 2016). The main difference between this study and those previous is related to the temporal resolution of low-flow conditions. Events such as daily, 7-day, and monthly low-flow values represent the driest conditions within each time interval, likely to occur between rain events when air temperature is high, and thus when evapotranspiration may be highest. Such especially low-flow conditions may have the greatest ecological significance because they represent the greatest stress placed on organisms over the time period (Obedzinski et al., 2018; Vander Vorste et al., 2020).
Results of peak flows analysis were less consistent. Only Econfina Creek (G-1) had a significant positive trend across all maximum flow metrics. While not significant, many gauged streams tended to have increasing tendencies in winter and negative tendencies in all other seasons. This tendency is less apparent at the 30-day time-scale indicating that changes to peak flows were not sustained over longer (i.e., monthly) time periods. These results corroborate larger-scale studies of storm flow indicating mixed directionality related to high-flow conditions (Groisman et al., 2004; Ficklin et al., 2016). One of the commonly described hydrologic variations expected in the 21st Century is an increase in variability, and specifically, more frequent and extreme low flow conditions and high flow conditions (Trenberth et al., 2014).
In addition to illustrating an overall declining trend in low flow among streams in the Gulf Coastal Plain, streamflow data from the region also potentially indicates the role of water management on low-flow conditions in the region. Streamflow at the site with the consistently strongest downward trend among the 13 studied—Eleven Mile Creek near Pensacola—is strongly influenced by water management operations. Eleven Mile Creek received discharge from a local industrial facility through the early 2000s; its discharge location was moved to a constructed wetland in 2012, and from 2012 to 2016, dry-season base flow was reduced by about 50 percent.
The most surprising anomaly in our analysis was that some of the larger river sites, had increasing tendencies in low-flow conditions. This anomaly may also reflect nearby land management and potentially shifts in seasonal climatic dynamics. This sensitivity to land management may be especially relevant in forested land, which is the predominant land cover type in catchments of the Florida Panhandle and southern Alabama (Le et al., 2015), and especially in the lower portions of the Escambia and Choctawhatchee River catchments. In addition to timber harvesting potentially leading to increased low-flow conditions, high-intensity hurricanes that altered forest cover in the 21st Century (Sharma et al., 2021) may also have led to reduced evapotranspiration and elevated low-flow conditions. Because strategic forest management in the Gulf Coastal Plain can lead to greater discharge through reducing evapotranspiration (McLaughlin et al., 2013), managed forests may have the capacity to buffer the effects of climate change on low-flow conditions in small streams throughout the region. Our results corroborate Rodgers et al. (2020) who found that seasonal streamflow decreased across the southern and southeastern US from 1950 to 2015. In their study, 88% of sites were influenced by factors other than climate variables such as management practices.
Estuarine responses to these changes in streamflow and precipitation varied with declines in salinity across most locations in all four estuaries. While Econfina Creek (G-1), the major inflow to St. Andrew Bay had increasing trends in maximum and minimum streamflow, most estuarine locations had increasing trends in salinity. In the other three estuaries, general declining tendencies in maximum and minimum seasonal flow by the major rivers (Choctawhatchee, Escambia, and Perdido) were observed as well as decreases in estuarine salinity at many WBIDs. Other factors such as stormwater runoff or increased heavy rainfall events induced by climate change may be causing system-wide reductions in salinity (Paerl et al., 2006).
Declines in salinity may initially benefit oysters due to reduction in predation (Powell et al., 1996; La Peyre et al., 2009), although extended declines and pulsed freshwater inputs have negative effects on growth and spat and larval survival (Powell et al., 2003; Powers et al., 2017). Long-term declines in salinity can result in complete loss of oyster reefs as larvae and spat are not able to recruit into the population and overtime as hard substrate (mainly from oyster shells) is lost from the system, making it harder to restore oyster populations and their associated ecosystem services (Parker et al., 2013). Additionally, freshwater pulses may also bring in contaminants including microbial pathogens and other pollutants that are a human health risk. In the Pensacola Bay system, declines in water quality due to microbial pathogens have affected oyster aquaculture and wild harvesting, resulting in expansions to the prohibited shellfish harvest areas in recent years (Birch et al., 2021; Florida Department of Agriculture and Consumer Services, 2022).
Submerged aquatic vegetation (SAV) in the oligohaline regions of estuaries may benefit from lower salinity and expand their coverage provided low salinity extends throughout the growing season. In the past, extended drought conditions and higher salinity has led to losses of submerged aquatic vegetation in Pensacola Bay (Lores and Sprecht, 2001). Like oysters, seagrass growth, particularly that of Thalassia testudinum, is inhibited by low salinity (Lirman and Cropper, 2003; Kahn and Durako, 2006). Thus, there is a need to understand the drivers of freshening of these estuarine systems.
Surprisingly, declines in salinity did not lead to increasing turbidity and total suspended solids, which can be expected with higher freshwater inputs. Particulates in estuaries may be more affected by deposition and resuspension within the estuary which results in a shorter residence time in the water column than freshwater, leading to lower particulates (TSS and turbidity) and higher water clarity. Another explanation is that pulsed events from the greater maximum streamflow observed in this study may not be captured by monitoring programs in the region, which primarily conduct quarterly sampling. A limitation of this study is the lack of frequent consistent estuarine monitoring, and the resulting mismatch between long-term records for flow and climate variables, and shorter-term estuarine variables. Regardless of the cause of increased water clarity, both oysters and seagrass can benefit from increased clarity.
Over the 36-year period 1985–2020, data from stream gauges in the Florida Panhandle and southern Alabama illustrate a decline in low-flow conditions, supporting the general prediction that increased hydrologic variability is likely in the 21st Century. The data do not, however, illustrate the same predominant trend of increased high-flow conditions. The decline in low flow we document above has not occurred in parallel with declining annual rainfall, occurrence of low precipitation, or increase in temperature; rather, our analysis suggests that declining low-flow conditions may be a result of a seasonal shift in the timing of precipitation in the region, with less rainfall during the late summer dry season and increased rainfall during the winter. Declining low-flow conditions may also be attributed to other factors such as changes in land management which can modify the partitioning of rainfall into different hydrological components, alterations in surface runoff due to changing land use, or increases in evapotranspiration. This analysis provides a more thorough exploration of the hydrologic trends in this biologically unique region than other recent studies can provide. For the water quality parameters, declining trends were observed in most water clarity metrics, indicating improved clarity, especially in winter. Salinity generally declined across the study area. Improved water clarity and reduced particulate levels may have a beneficial effect on SAV and oysters, although more research is needed to evaluate the linkage between water quality and habitat quality.
Maintaining the unique ecosystems of the Gulf Coastal Plain will likely be a major challenge for biologists and other resource managers in the coming decades, but it may be possible with thoughtful planning and resource management. Are there techniques in forest management or other management techniques that mitigate declining streamflow trends? Further studies involving correlations with catchment-scale variables such as land cover (and changes in land cover over time) and evapotranspiration may help to indicate land use types where best management practices could be most beneficial for reducing downward streamflow trends. Understanding how coastal and oceanic scale climate changes affect estuarine water quality in this region is also needed. Given the relatively short water quality data sets (compared to climate or streamflow) continued monitoring of these systems is critical. The ecosystems of this region will depend on monitoring, strategic management and targeted research to thrive through the 21st Century.
Publicly available datasets were analyzed in this study. This data can be found here: National Oceanic and Atmospheric Administration National Climatic Data Center (NOAA NCDC) Global Historical Climatology Network. Available: https://www.ncei.noaa.gov/products/land-based-station/global-historical-climatology-network-daily National Oceanic and Atmospheric Administration Climate Data Online (NOAA CDO). Available: https://www.ncdc.noaa.gov/cdo-web/ United States Environmental Protection Agency Water Quality Portal (USEPA WQP). Available: https://www.waterqualitydata.us United States Geological Survey National Water Information System (USGS NWIS). Available: https://waterdata.usgs.gov/nwis/sw.
MD and JC received funding that supported this manuscript. MD and AC contributed to conception and design of the study and wrote the first draft of the manuscript. MD, AC, and HG cleaned and organized the data. AC performed the statistical analysis. MD, AC, HG, and JC wrote sections of the discussion and conclusion. All authors contributed to manuscript revision, read, and approved the submitted version.
Funding support was provided by Florida RESTORE Act Center of Excellence Program grant 4710-1129-00-A.
The authors wish to thank the University of West Florida Center for Environmental Diagnostics and Bioremediation and the University of Florida (UF) Institute of Food and Agricultural Sciences (IFAS) Research and the UF IFAS West Florida Research and Education Center for support of this project, as well as two reviewers whose inputs greatly improved the quality of this manuscript.
The authors declare that the research was conducted in the absence of any commercial or financial relationships that could be construed as a potential conflict of interest.
All claims expressed in this article are solely those of the authors and do not necessarily represent those of their affiliated organizations, or those of the publisher, the editors and the reviewers. Any product that may be evaluated in this article, or claim that may be made by its manufacturer, is not guaranteed or endorsed by the publisher.
The Supplementary material for this article can be found online at: https://www.frontiersin.org/articles/10.3389/fevo.2023.1167767/full#supplementary-material
Bawden, A. J., Burn, D. H., and Prowse, T. D. (2015). Recent changes in patterns of western Canadian river flow and association with climatic drivers. Hydrol. Res. 46, 551–565. doi: 10.2166/nh.2014.032
Beche, L. A., Mcelravy, E. P., and Resh, V. H. (2006). Long-term seasonal variation in the biological traits of benthic-macroinvertebrates in two Mediterranean-climate streams in California, USA. Freshwater. Biol. 51, 56–75. doi: 10.1111/j.1365-2427.2005.01473.x
Birch, A., Brumbaugh, R., DeAngelis, B., Geselbracht, L., Graves, A., Blair, J., et al. (2021). Oyster fisheries and habitat management plan for the Pensacola bay system. Nature Conserv. 78. Available at: https://www.ppbep.org/PDFs/PBS_OysterFisheriesHabitatMgtPlan_18May2021_Final_ADA_corrected-11.22.2021.pdf
Blaustein, R. J. (2008). Biodiversity hotspot: the Florida panhandle. Bioscience 58, 784–790. doi: 10.1641/B580904
Browder, J. A., Fourqurean, J., Lirman, D., and Nuttle, W. K. (2013). “Benthic habitat: seagrasses. In integrated conceptual ecosystem model development for the Southeast Florida coastal marine ecosystem,” in NOAA technical Memorandum,OAR_AOML_103 and NOS-NCCOS-163. eds. W. K. Nuttle and P. J. Fletcher (Miami, Florida: National Oceanic and Atmospheric Administration), 84–93.
Chu, F. L. E., and Volety, A. K. (1997). Disease processes of the parasite Perkinsus marinus in eastern oyster Crassostrea virginica: minimum dose for infection initiation, and interaction of temperature, salinity, and infective cell dose. Dis. Aquat. Org. 28, 61–68. doi: 10.3354/dao028061
Clark, C. II, Nnaji, G., and Huang, W. (2014). Effects of el-niño and la-niña sea surface temperature anomalies on annual precipitations and streamflow discharges in southeastern United States. J. Coast. Res. SI 68, 113–120. doi: 10.2112/SI68-015.1
Congdon, V. M., Dunton, K. H., Brenner, J., Goodin, K. L., and Ames, K. W. (2018). “Ecological resilience indicators for seagrass ecosystems,” in Ecological resilience indicators for five northern Gulf of Mexico ecosystems. eds. K. L. Goodin, D. Faber-Langendoen, J. Brenner, S. T. Allen, R. H. Day, V. M. Congdon. et al. (Arlington, VA: NatureServe), 57.
Da Silva, R. M., Santos, C. A., Moreira, M., Corte-Real, J., Silva, V. C., and Medeiros, I. C. (2015). Rainfall and river flow trends using Mann–Kendall and Sen’s slope estimator statistical tests in the Cobres River basin. Nat. Hazards. 77, 1205–1221. doi: 10.1007/s11069-015-1644-7
Dawood, M. (2017). Spatio-statistical analysis of temperature fluctuation using Mann–Kendall and Sen’s slope approach. Clim. Dyn. 48, 783–797. doi: 10.1007/s00382-016-3110-y
Dennison, W. C., Orth, R. J., Morre, K. A., Stevenson, J. C., Carter, V., Kollar, S., et al. (1993). Assessing water quality with submersed aquatic vegetation. Bioscience 43, 86–94. doi: 10.2307/1311969
Estill, J. C., and Cruzan, M. B. (2001). Phytogeography of rare plant species endemic to the southeastern United States. Castanea 66, 3–23.
Ficklin, D., Robeson, S., and Knouft, J. (2016). Impacts of recent climate change on trends in baseflow and stormflow in United States watersheds. Geophys. Res. Lett. 43, 5079–5088. doi: 10.1002/2016GL069121
Florida Department of Agriculture and Consumer Services (2022). Pensacola bay #02: shellfish management information. Available at: https://www.fdacs.gov/Agriculture-Industry/Aquaculture/Shellfish-Harvesting-Area-Classification/Shellfish-Harvesting-Area-Information/Pensacola-Bay-02-Shellfish-Management-Information
Fox, T. R., Jokela, E. J., and Allen, H. L. (2007). The development of pine plantation silviculture in the southern United States. J. For. 105, 337–347.
Gocic, M., and Trajkovic, S. (2013). Analysis of changes in meteorological variables using Mann-Kendall and Sen’s slope estimator statistical tests in Serbia. Glob. Planet. Change. 100, 172–182. doi: 10.1016/j.gloplacha.2012.10.014
Groisman, P., Knight, R., Karl, T., Easterling, D., Sun, B., and Lawrimore, J. (2004). Contemporary changes of the hydrological cycle over the contiguous United States: trends derived from in situ observations. J. Hydrometeorol. 5, 64–85. doi: 10.1175/1525-7541
Gunter, G., and Geyer, R. A. (1955).Studies on fouling organisms of the Northwest Gulf of Mexico. Port Aransas: University of Texas Marine Science Institute, 38–67.
Hamilton, H., Smyth, R. L., Young, B. E., Howard, T. G., Tracey, C., Breyer, S., et al. (2022). Increasing taxonomic diversity and spatial resolution clarifies opportunities for protecting US imperiled species. Ecol. Appl. 32:2534. doi: 10.1002/eap.2534
Harrison, S., and Noss, R. (2017). Endemism hotspots are linked to stable climatic refugia. Ann. Bot. 119, 207–214. doi: 10.1093/aob/mcw248
Harvey, J. E., Smiljanić, M., Scharnweber, T., Buras, A., Cedro, A., Cruz-García, R., et al. (2020). Tree growth influenced by warming winter climate and summer moisture availability in northern temperate forests. Glob. Chang. Biol. 26, 2505–2518. doi: 10.1111/gcb.14966
Helsel, D.R., and Hirsch, R.M., (2002). Statistical methods in water resources. Techniques of water resources investigations of the United States geological survey, book 4, hydrologic analysis and investigation. United States Geological Survey, Washington, DC, USA.
Hollis, T. (2004). Florida's miracle strip: from redneck Riviera to Emerald Coast. Jackson Mississippi: Univ Press of Mississippi.
Kahn, A. E., and Durako, M. J. (2006). Thalassia testudinum seedling responses to changes in salinity and nitrogen levels. J. Exp. Mar. Biol. Ecol. 335, 1–12. doi: 10.1016/j.jembe.2006.02.011
Karnauskas, M., Schirripa, M. J., Kelble, C. R., Cook, G. S., and Craig, J. K. (2013). Ecosystem status report for the Gulf of Mexico. NOAA Technical Memorandum NMFS-SEFSC 653:52p.
La Peyre, M. K., Eberline, B. S., Soniat, T. S., and La Peyre, J. F. (2013). Differences in extreme low salinity timing and duration differentially affect eastern oyster Crassostrea virginica recruitment, size class growth and mortality in Breton sound, LA. Estuarine Coastal Shelf Sci. 135, 146–157. doi: 10.1016/j.ecss.2013.10.001
La Peyre, M. K., Gossman, B., and La Peyre, J. F. (2009). Defining optimal freshwater flow for oyster production: effects of freshet rate and magnitude of change and duration on eastern oysters and Perkinsus marinus infection. Estuar. Coasts 32, 522–534. doi: 10.1007/s12237-009-9149-9
La Peyre, M. K., Nickens, A. D., Volety, A. K., Tolley, S. G., and La Peyre, J. F. (2003). Environmental significance of freshets in reducing Perkinsus marinus infection in eastern oysters, Crassostrea virginica: potential management applications. Mar. Ecol. Prog. Ser. 248, 165–176. doi: 10.3354/meps248165
Le, C., Lehrter, J. C., Hu, C., Schaeffer, B., MacIntyre, H., Hagy, J. D., et al. (2015). Relation between inherent optical properties and land use and land cover across Gulf Coast estuaries: Gulf Coast estuaries optical dynamics. Limnol. Oceanogr. 60, 920–933. doi: 10.1002/lno.10065
Lirman, D., and Cropper, W. P. (2003). The influence of salinity on seagrass growth, survivorship, and distribution within Biscayne Bay, Florida: field, experimental, and modeling studies. Estuaries 26, 131–141. doi: 10.1007/BF02691700
Lirman, D., Deangelo, G., Serafy, J., Hazra, A., Smith, D., and Brown, A. (2008). Geospatial video monitoring of nearshore benthic habitats of western Biscyane Bay (Florida, USA) using the shallow-water positioning system (SWaPS). J. Coast. Res. 1, 135–145. doi: 10.2112/04-0428.1
Lockette, T . (2016). Drought highlights need for water plan, critics say. Alabama: LexisNexis Academic.Web
Lores, E. M., and Sprecht, D. T. (2001). Drought-induced decline of submerged aquatic vegetation in Escambia Bay, Florida. Gulf Mexico Sci. 19:8. doi: 10.18785/goms.1902.08
Maleski, J., and Martinez, C. (2017). Historical trends in precipitation, temperature and drought in the Alabama–Coosa–Tallapoosa and Apalachicola–Chattahoochee–Flint river basins. Int. J. Climatol. 37, 583–595. doi: 10.1002/joc.4723
Markos, P. D., Kaller, M. D., and Kelso, W. E. (2016). Channel stability and the structure of coastal stream aquatic insect assemblages. Fund. Appl. Limnol. 188, 187–199. doi: 10.1127/fal/2016/0865
Marshall, D. A., La Peyre, M. K., Palmer, T. A., Guillou, G., Sterba-Boatwright, B. D., Pollack, J. B., et al. (2021). Freshwater inflow and responses from estuaries across a climatic gradient: an assessment of northwestern Gulf of Mexico estuaries based on stable isotopes. Limnol. Oceanogr. 66, 3568–3581. doi: 10.1002/lno.11899
McLaughlin, D. L., Kaplan, D. A., and Cohen, M. J. (2013). Managing forests for increased regional water yield in the southeastern U.S. coastal plain. J. Am. Water Resour. Assoc. 49, 953–965. doi: 10.1111/jawr.12073
Meals, D.W., Spooner, J., Dressing, S.A., and Harcum, J.B. (2011). Statistical analysis for monotonic trends. National Nonpoint Source Montoring Program Tech Notes 6. Available at: https://www.epa.gov/polluted-runoff-nonpoint-source-pollution/nonpoint-source-monitoring-technical-notes
Modarres, R., and Rodriguez da Silva, V. D. P. (2007). Rainfall trends in arid and semi-arid regions of Iran. J. Arid Environ. 70, 344–355. doi: 10.1016/j.jaridenv.2006.12.024
National Marine Fisheries Service (2016). Fisheries economics of the United States, 2014. U.S. Dept. of commerce, NOAA Tech. Memo. NMFS-F/SPO-163, –237.
National Oceanic and Atmospheric Administration Climate Data Online (2022). Available at: https://www.ncdc.noaa.gov/cdo-web/
National Oceanic and Atmospheric Administration National Climatic Data Center Global Historical Climatology Network (2022). Available at: https://www.ncei.noaa.gov/products/land-based-station/global-historical-climatology-network-daily
Northwest Florida Water Management District (2017a). St. Andrew bay system surface water information and management plan. Program development series 17–08. Northwest Florida water Management District, Mariana, FL
Northwest Florida Water Management District (2017b). Choctawhatchee Bay surface water information and management plan. Program development series 17–05. Northwest Florida Water Management District, Mariana, FL
Northwest Florida Water Management District (2017c). Pensacola bay system surface water information and management plan. Program development series 17–06. Northwest Florida water Management District, Mariana, FL
Northwest Florida Water Management District (2017d). Perdido River and bay surface water information and management plan. Program development series 17–07. Northwest Florida Water Management District, Mariana, FL.
Noss, R. F., Platt, W. J., Sorrie, B. A., Weakley, A. S., Means, D. B., Costanza, J., et al. (2015). How global biodiversity hotspots may go unrecognized: lessons from the north American coastal plain. Divers. Distrib. 21, 236–244. doi: 10.1111/ddi.12278
Obedzinski, M., Nossaman Pierce, S., Horton, G. E., and Deitch, M. J. (2018). Effects of flow-related variables on oversummer survival of juvenile Coho salmon in intermittent streams. Trans. Am. Fish. Soc. 147, 588–605. doi: 10.1002/tafs.10057
Osland, M. J., Stevens, P. W., Lamont, M. M., Brusca, R. C., Hart, K. M., Waddle, J. H., et al. (2021). Tropicalization of temperate ecosystems in North America: the northward range expansion of tropical organisms in response to warming winter temperatures. Glob. Chang. Biol. 27, 3009–3034. doi: 10.1111/gcb.15563
Paerl, H. W., Valdes, L. M., Joyner, A. R., Peierls, B. L., Piehler, M. F., Riggs, S. R., et al. (2006). Ecological response to hurricane events in the Pamlico sound system, North Carolina, and implications for assessment and management in a regime of increased frequency. Estuar. Coasts 29, 1033–1045. doi: 10.1007/BF02798666
Parker, L. E., and Abatzoglou, J. T. (2019). Warming winters reduce chill accumulation for peach production in the southeastern United States. Climate 7:94. doi: 10.3390/cli7080094
Parker, M. L., Arnold, W. S., Geiger, S. P., Gorman, P., and Leone, E. H. (2013). Impacts of freshwater management activities on eastern oyster (Crassostrea virginica) density and recruitment: recovery and long-term stability in seven Florida estuaries. J. Shellfish Res. 32, 695–708. doi: 10.2983/035.032.0311
Pohlert, T. (2020). Trend. R package version. Available at: https://CRAN.R-project.org/package=trend
Poshtiri, M. P., and Pal, I. (2016). Patterns of hydrological drought indicators in major US River basins. Clim. Chang. 134, 549–563. doi: 10.1007/s10584-015-1542-8
Poshtiri, M. P., Towler, E., and Pal, I. (2018). Characterizing and understanding the variability of streamflow drought indicators within the USA. Hydrol. Sci. J. 63, 1791–1803. doi: 10.1080/02626667.2018.1534240
Powell, E. N., Klinck, J. M., and Hofmann, E. E. (1996). Modeling diseased oyster populations. II. Triggering mechanisms for Perkinsus marinus epizootics. J. Shellfish Res. 15, 141–165.
Powell, E. N., Klinck, J. M., Hofmann, E. E., and McManus, M. A. (2003). Influence of water allocation and freshwater inflow on oyster production: a hydrodynamic–oyster population model for Galveston Bay, Texas, USA. Environ. Manag. 31, 100–0121. doi: 10.1007/s00267-002-2695-6
Powers, S. P., Grabowski, J. H., Roman, H., Geggel, A., Rouhani, S., Oehrig, J., et al. (2017). Consequences of large-scale salinity alteration during the Deepwater horizon oil spill on subtidal oyster populations. Mar. Ecol. Prog. Ser. 576, 175–187. doi: 10.3354/meps12147
Rice, J. S., Emanuel, R. E., and Vose, J. M. (2016). The influence of watershed characteristics on spatial patterns of trends in annual scale streamflow variability in the continental US. J. Hydrol. 2016, 850–860. doi: 10.1016/j.jhydrol.2016.07.006
Rodgers, K., Roland, R., Hoos, A., Crowley-Ornelas, E., and Knight, R. (2020). An analysis of streamflow trends in the southern and southeastern US from 1950-2015. Water 12:3345. doi: 10.3390/w12123345
Ropelewski, C. F., and Halpert, M. S. (1986). North American precipitation and temperature patterns associated with the El Niño/south oscillation (ENSO). Mon. Weather Rev. 114, 2352–2362. doi: 10.1175/1520-0493(1986)114<2352:NAPATP>2.0.CO;2
Sen, P. K. (1968). Estimates of regression coefficient based on Kendall's tau. J. Am. Stat.Assoc. 63, 1379–1389. doi: 10.1080/01621459.1968.10480934
Sharma, A., Ojha, S. K., Dimov, L. D., Vogel, J. G., and Nowak, J. (2021). Long-term effects of catastrophic wind on southern US coastal forests: lessons from a major hurricane. PLoS One 16:e0243362. doi: 10.1371/journal.pone.0243362
Shepard, C., Brenner, J., Goodin, K. L., and Ames, K. W. (2018). “Ecological resilience indicators for oyster ecosystems,” in Ecological resilience indicators for five northern Gulf of Mexico ecosystems. eds. K. L. Goodin, D. Faber-Langendoen, J. Brenner, S. T. Allen, R. H. Day, V. M. Congdon. et al. (Arlington, VA: NatureServe), 40.
Soniat, T. M. (1996). Epizootiology of Perkinsus marinus disease of eastern oysters in the Gulf of Mexico. Oceanogr. Lit. Rev. 12:1265.
Tabari, H., Safar, M., Ali, A., Parisa, H., and Kurosh, M. (2011). Trend analysis of reference evapotranspiration in the Western half of Iran. Agric. 151, 128–136. doi: 10.1016/j.agrformet.2010.09.009
Trenberth, K. E., Dai, A., van der Schrier, G., Jones, P. D., Barichivich, J., Briffa, K. R., et al. (2014). Global warming and changes in drought. Nat. Clim. Chang. 4, 17–22. doi: 10.1038/nclimate2067
United States Army Corps of Engineers (2010). “Regional supplement to the Corps of Engineers Wetland Delineation Manual: Atlantic and gulf coastal plain region (version 2.0)” in Engineer research development center technical Report-10-20. eds. J. S. Wakeley, R. W. Lichvar, and C. V. Noble (Vicksburg, Mississippi: U.S. Army Engineer Research and Development Center)
United States Environmental Protection Agency Water Quality Portal (2022). Available at: https://www.waterqualitydata.us
United States Geological Survey National Water Information System (2022). Available at: https://waterdata.usgs.gov/nwis/sw
Vander Vorste, R., Obedzinski, M., Nossaman Pierce, S., Carlson, S. M., and Grantham, T. E. (2020). Refuges and ecological traps: extreme drought threatens persistence of an endangered fish in intermittent streams. Glob. Chang. Biol. 26, 3834–3845. doi: 10.1111/gcb.15116
Volety, A. K., Savarese, M., Tolley, S. G., Arnold, W. S., Sime, P., Goodman, P., et al. (2009). Eastern oysters Crassostrea virginica as an indicator for restoration of Everglades ecosystems. Ecol. Indic. 9, S120–S136. doi: 10.1016/j.ecolind.2008.06.005
Wakeford, A. , (2001). State of Florida conservation plan for gulf sturgeon. (No FMRI Technical Report TR-8) Florida Fish and Wildlife Conservation Commission.
Walls, S. C. (2014). Identifying monitoring gaps for amphibian populations in a north American biodiversity hotspot, the southeastern USA. Biodivers. Conserv. 23, 3341–3357. doi: 10.1007/s10531-014-0782-7
Warren, M. L. Jr., Burr, B. M., Walsh, S. J., Bart, H. L. Jr., Cashner, R. C., Etnier, D. A., et al. (2000). Diversity, distribution, and conservation status of the native freshwater fishes of the southern United States. Fisheries 25, 7–31. doi: 10.1577/1548-8446(2000)025<0007:DDACSO>2.0.CO;2
Wei, Q., Sun, C., Wu, G., and Pan, L. (2017). Haihe River discharge to Bohai Bay, North China: trends, climate, and human activities. Hydrol. Res. 48, 1058–1070. doi: 10.2166/nh.2016.142
Yue, S., Pilon, P., and Phinney, B. O. B. (2003). Canadian streamflow trend detection: impacts of serial and cross-correlation. Hydrol. Sci. J. 48, 51–63. doi: 10.1623/hysj.48.1.51.43478
Keywords: streamflow, precipitation, temperature, water clarity, salinity, estuary, Seasonal Mann-Kendall analysis, Gulf Coastal Plain
Citation: Croteau AC, Gancel HN, Gebremicael TG, Caffrey JM and Deitch MJ (2023) Implications of changing trends in hydroclimatic and water quality parameters on estuarine habitats in the Gulf Coastal Plain. Front. Ecol. Evol. 11:1167767. doi: 10.3389/fevo.2023.1167767
Edited by:
Marcus W. Beck, Tampa Bay Estuary Program, United StatesReviewed by:
Brandon Jarvis, United States Environmental Protection Agency (EPA), United StatesCopyright © 2023 Croteau, Gancel, Gebremicael, Caffrey and Deitch. This is an open-access article distributed under the terms of the Creative Commons Attribution License (CC BY). The use, distribution or reproduction in other forums is permitted, provided the original author(s) and the copyright owner(s) are credited and that the original publication in this journal is cited, in accordance with accepted academic practice. No use, distribution or reproduction is permitted which does not comply with these terms.
*Correspondence: Amanda C. Croteau, YWNyb3RlYXVAdXdmLmVkdQ==
Disclaimer: All claims expressed in this article are solely those of the authors and do not necessarily represent those of their affiliated organizations, or those of the publisher, the editors and the reviewers. Any product that may be evaluated in this article or claim that may be made by its manufacturer is not guaranteed or endorsed by the publisher.
Research integrity at Frontiers
Learn more about the work of our research integrity team to safeguard the quality of each article we publish.