 Yiqiao Liang
 Hongying Liu2*
 Jeffrey Chiwuikem Chiaka
 Chengtao Jiang
 Nannan Wei
- 1School of Management, Guangxi Minzu University, Nanning, China
- 2College of ASEAN Studies, Guangxi Minzu University, Nanning, China
- 3State Key Joint Laboratory of Environment Simulation and Pollution Control, School of Environment, Beijing Normal University, Beijing, China
- 4School of Geography, Nanjing Normal University, Nanjing, China
Tourism ecological security (TES) is an important index reflecting the sustainable development of the regional economy. The construction of the China and ASEAN Free Trade Area has increased the total tourist consumption of Guangxi province by 36.48%. Unfortunately, overconsumption of resources, air pollution, disturbance of indigenous life, and other environmental degradation problems emerged due to the significant increase in tourists. Measuring the resilience of the tourism ecosystem is an urgent need to promote the high-quality development of tourism in Guangxi. To explore the dynamic changes in TES and its driving mechanism, the DPSIR (driver–pressure–state–impact–response) model for the tourism ecosystem was developed. The dynamic changes in TES and its driving mechanism from 2010 to 2019 were analyzed using fuzzy matter-element analysis, Markov chains, Geodetector, and other methods. The results show that: (1) the TES value increased steadily by 72.73%; the improvement speed was Northeast > Southwest > Southeast > Northwest; (2) TES was negatively correlated with location, 14 cities developed independently; (3) the TES has a smaller probability to shift the lower level; (4) urbanization, water consumption, green area, tourism revenue, and the number of students in colleges had significant effects on TES. Four policies were proposed to improve TES: (1) developing forest tourism; (2) implementing greening projects in abandoned mining areas; (3) increasing tourism technical personnel; and (4) reducing clearance time for inbound tourists.
1. Introduction
Tourism ecological security (TES) is the key to ensuring the sustainable development of tourism (Tepelus and Córdoba, 2005; Liu et al., 2009). One requirement for the sound management of tourism as an intermediary between tourists and destination ecosystems is the need to ensure the sustainability of the resources on which they depend (Sati, 2018; Chiaka et al., 2022; Liang et al., 2023). In 1995, the Charter for Sustainable Tourism was adopted at the First World Conference on Sustainable Tourism (Gateway, 2008), which emphasized that the development of tourism must be based on the carrying capacity of the ecological environment. Tourism has always been considered an “environmentally friendly” industry (McCool and Lime, 2001; Li and Zhang, 2022), and tourism nature resource consumption dictates a dichotomy between tourism and the ecological environment (Hsiao et al., 2021). Tourism activities are a major proximate driver of habitat loss and fragmentation, waste discharge, resource overconsumption, and other environmental degradation, often with irreversible impacts on ecosystems (Laurance et al., 2014).
The purpose of studying TES is its importance in reconciling ecological conservation and tourism economic development (Paiano et al., 2020). In 2019, Guangxi’s tourism income was 102.44 billion CNY, accounting for 17.89% of the country’s total tourism spending. However, the percentage of days with air quality standards fell from 98.80% (2010) to 88.50% (2015), and sewage discharge reached its highest level in nearly two decades. Therefore, enhancing the tourism economy to reduce environmental pollution is an urgent problem in Guangxi. As the only province on China’s southwest border connected to the Association of Southeast Asian Nations (ASEAN) by land and sea, Guangxi is a key gateway in China’s “Belt & Road” initiative. It ranked first in China for the proportion of water quality, ecological quality of vegetation, and mangrove area. The forest coverage rate was 62.30%, while the proportion of good air quality days was 93.50%, all of which were in the higher rankings in China (Government, G, 2020). The advantages of ecological resources made it the most rapidly developing province for ecotourism in southwestern China. In 2022, the Chinese government emphasized that “Guangxi should make every effort to promote the construction of a strong cultural tourism province and a world tourism destination.” Guangxi, therefore, can serve as an example for improving the TES of the southwestern border provinces of China.
Ecological security belongs to the category of security. It was introduced by the International Institute for Applied Systems Analysis Institution in 1989 (Shi et al., 2006). Since the 1990s, research focuses on the impact of tourism on ecological security (Morrison and Selman, 1991; Ruan et al., 2019). TES is an important part of sustainable tourism development, a derivative concept introduced into tourism research by ecological security (Liu and Yin, 2022). The research initially focused on phenomenological description and relational analysis and introduced methods such as geospatial studies. Then, the research involved the evaluation and quantification of TES using several methods (Table 1). In the construction of evaluation indicators, most researchers consider refining specific indicators from the economic, social, and natural environment (Zheng et al., 2022), in particular, focussing on impact factors (Sun and Pratt, 2014; Pena-Alonso et al., 2018), spatial patterns (Ma et al., 2022), trend predictions (Xu et al., 2017), driving mechanisms (Liang et al., 2020; Biswas and Rai, 2022; Sampath et al., 2022), and integrated early warning construction (Bahraminejad et al., 2018; Jiao et al., 2021; Zou et al., 2022). Notably, as TES-related research is still in its infancy, there are some shortcomings in the above study. First, ignoring the comprehensive indicators and dynamic development (Tang et al., 2018), the results were unilateral. Second, exploring influences can identify barriers to TES, but there were fewer of such studies (Peng et al., 2018; Tang et al., 2018). Third, the systematic construction of driving mechanisms remains an unresolved issue.
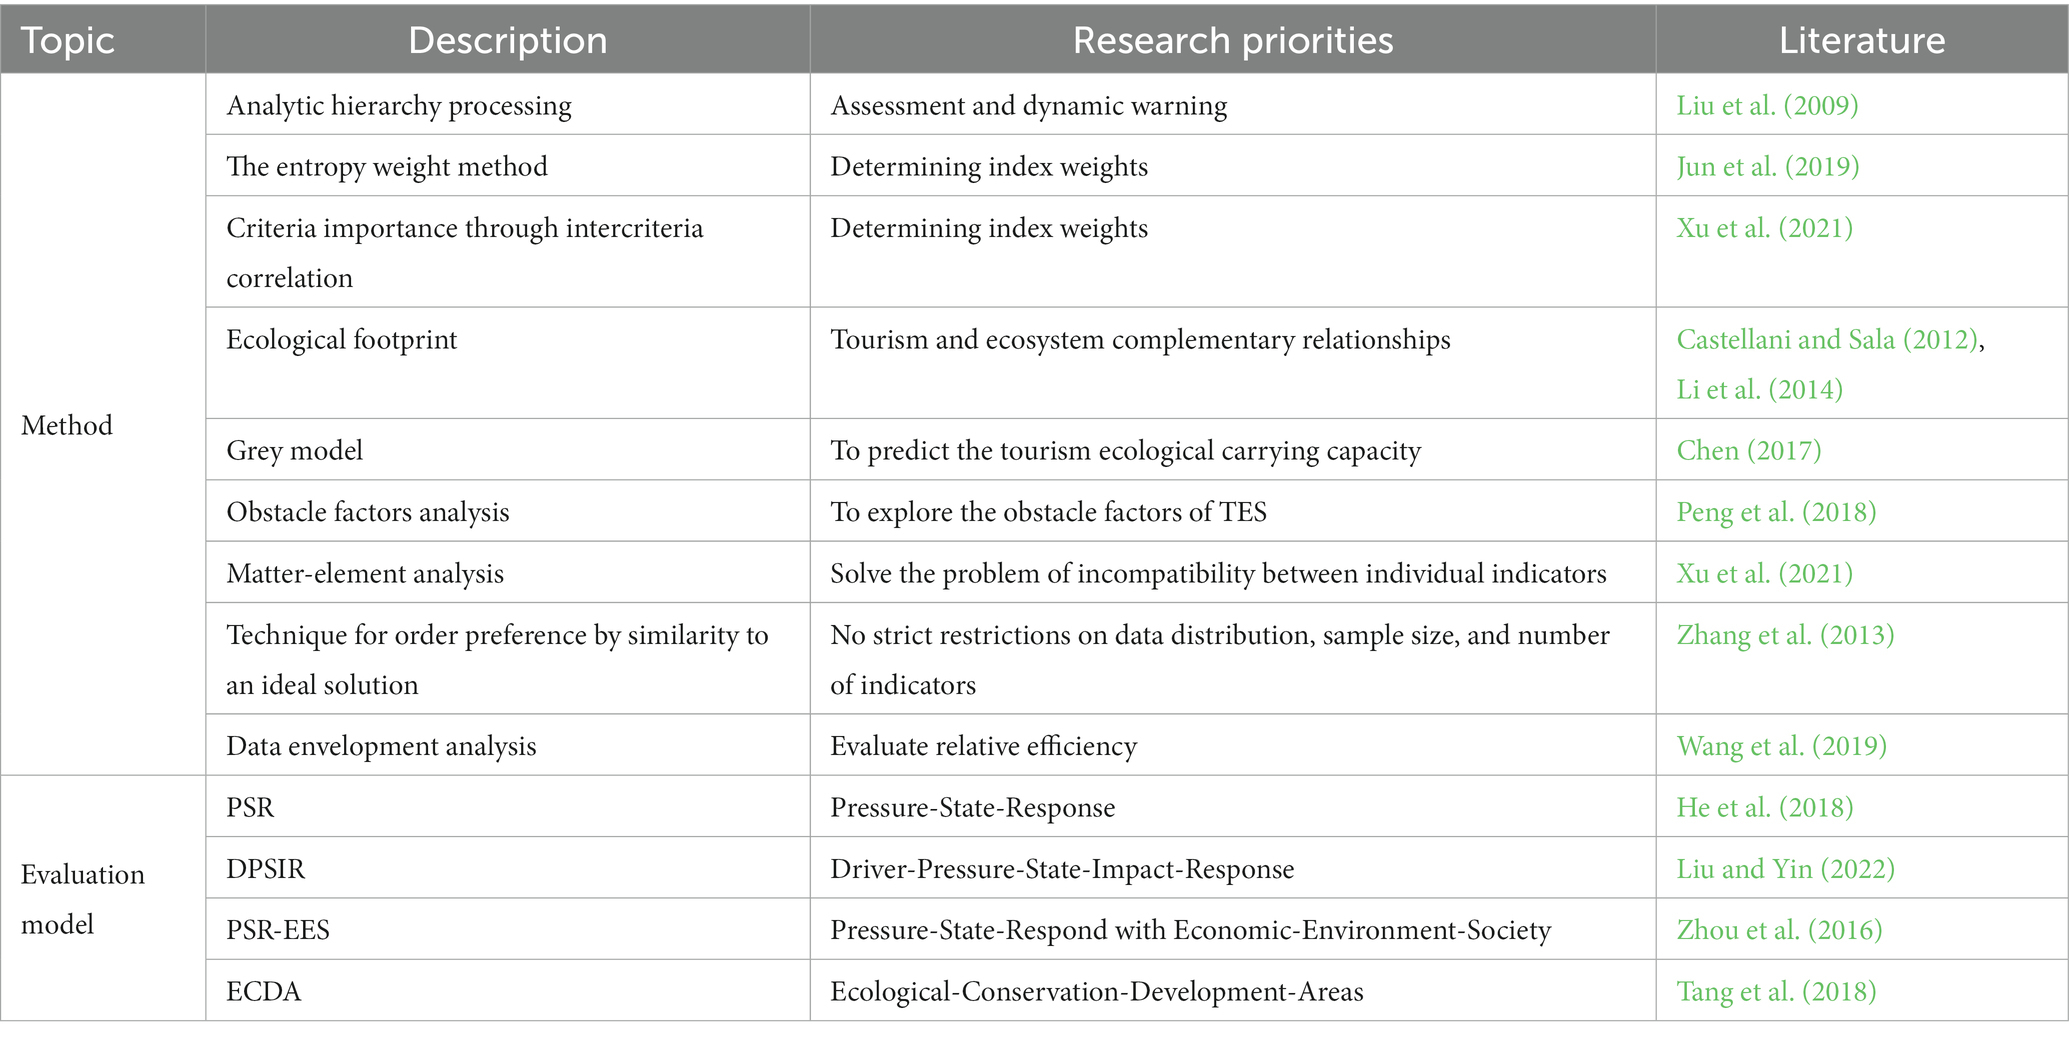
Table 1. Partial listing of research methods and models for tourism ecological security.
The necessity of this study to explore the innovation and key driving mechanism of the TES evaluation method was that the limitation of a single indicator was broken through and the problem of incompatibility among indicators was solved. Therefore, we used the DPSIR model that can objectively reflect the interaction and impact between tourism activities and the ecological environment (Kagalou et al., 2012; Asmelash and Kumar, 2019; He et al., 2022; Quevedo et al., 2023). It fully reflects the affinity between tourists, tourist destinations, and the environment, evaluating the multilevel characteristics of evaluation factors and paying attention to the characteristics of the dynamic development of the system. In addition, the fuzzy matter-element model used the fuzzy mathematical theory of affiliation to convert uncertainty into certainty, which can also be used in the TES (Xu et al., 2021). The model was used by our study to avoid the effects of uncertainty in the TES evaluation criteria and is important to estimate the inputs and outputs of tourism activities to the ecosystem. Finally, this study used the Geodetector to identify the core influencing factors of TES and constructed the driving mechanism of TES based on the DPSIR model in an all-round and multilevel manner, which is a key contribution.
The research objectives of this study were as follows: (1) developed the DPSIR model adapted to Guangxi province, combined with economic, social, ecological factors, and constructed an evaluation system for TES; (2) quantified the spatial and temporal evolution patterns, spatial correlation, and transfer laws of TES; and (3) analyzed the main influencing factors related to policy implementation and construct a driving mechanism for TES.
2. Materials and methods
2.1. Study area
Guangxi province is the intersection of the South China Economic Circle, the Southwest China Economic Circle, and the ASEAN Economic Circle. It is located on China’s southwestern border and serves as an important bridge between China and Southeast Asia (Figure 1). There are 14 cities in Guangxi, which are Nanning, Liuzhou, Guilin, Wuzhou, Beihai, Fangchenggang, Qinzhou, Guigang, Yulin, Baise, Hezhou, Hechi, Laibin, and Chongzuo. The administrative area covers 237,600 km2. In 2019, there were 49,820 thousand people in Guangxi, a gross domestic product (GDP) of 2,124 billion CNY, and 557 scenic spots of grade A and above. Guangxi has 29 longevity villages, the most in China, because of its rich natural resources and unique environmental advantages. Ecological tourism is the focus of tourism development in Guangxi.
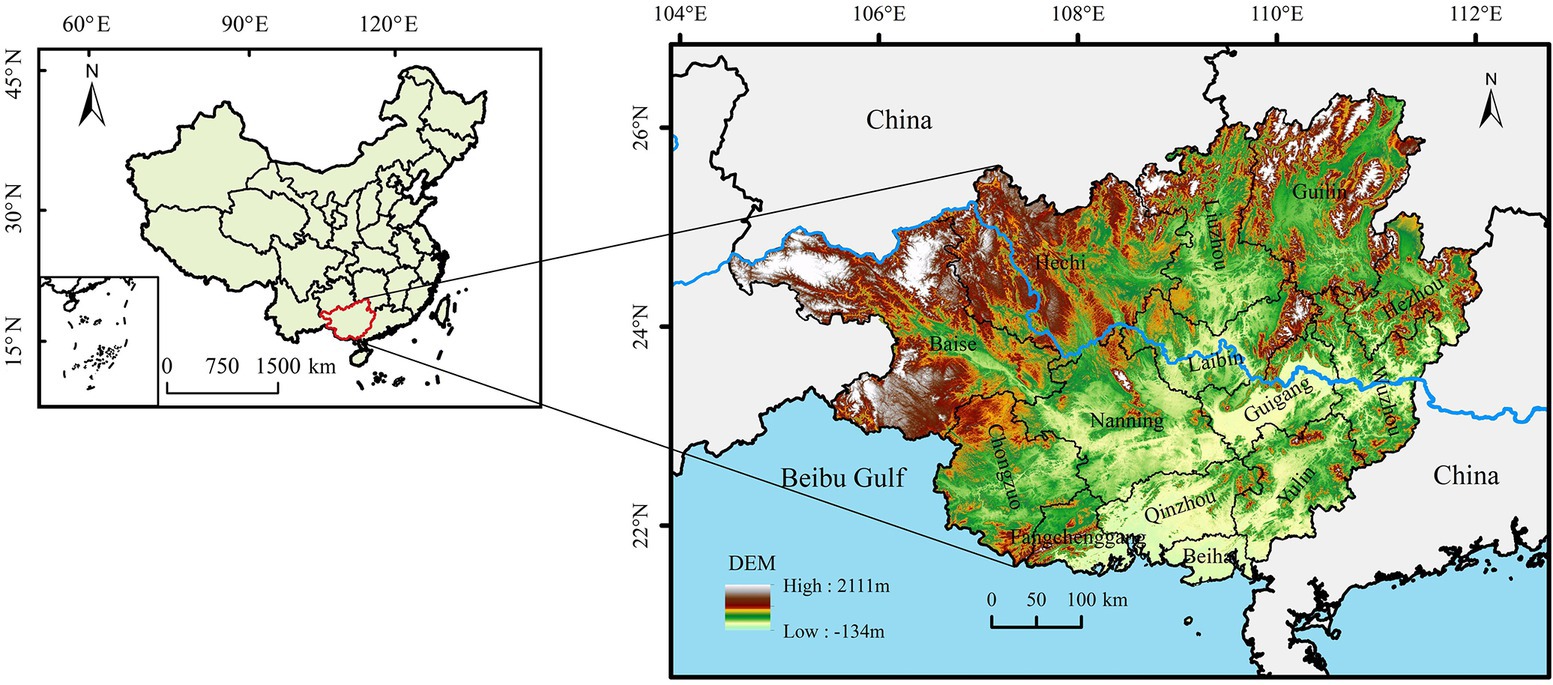
Figure 1. Location and DEM of the study area.
2.2. Index selection
The DPSIR model was improved and developed from the PSR model proposed by the European environment agency and includes the driver (D), pressure (P), state (S), impact (I), response (R) sub-systems (Svarstad et al., 2008; Ness et al., 2010; Benitez-Capistros et al., 2014). The model was comprehensive and logical (Ehara et al., 2018), which could effectively measure the operation of the tourism ecosystem in Guangxi. The ecological models and ecosystem theory stressed that the internal elements of tourism ecosystems were functioning in a state of interaction and cyclicality. The response sub-system should be based on the principle of sustainable development, emphasizing the maximum use of resources and minimum damage to the ecosystem, which in turn has a cyclic feedback effect on the driver, pressure, state, and impact sub-system (Qiu et al., 2022). By upgrading or controlling the key factors, each sub-system ensures the stable operation of local TES as a whole (Xu et al., 2022).
Because Guangxi was located on the southwest border of China, 26 factors that could reflect its ecological environment and tourism development were selected from three dimensions of social, economic, and tourism development to construct the TES comprehensive evaluation system, while generic factors, such as disposable income per capita and national A-grade scenic spots, could be ignored in the selection of indicators (Table 2) (Liu N. et al., 2023).
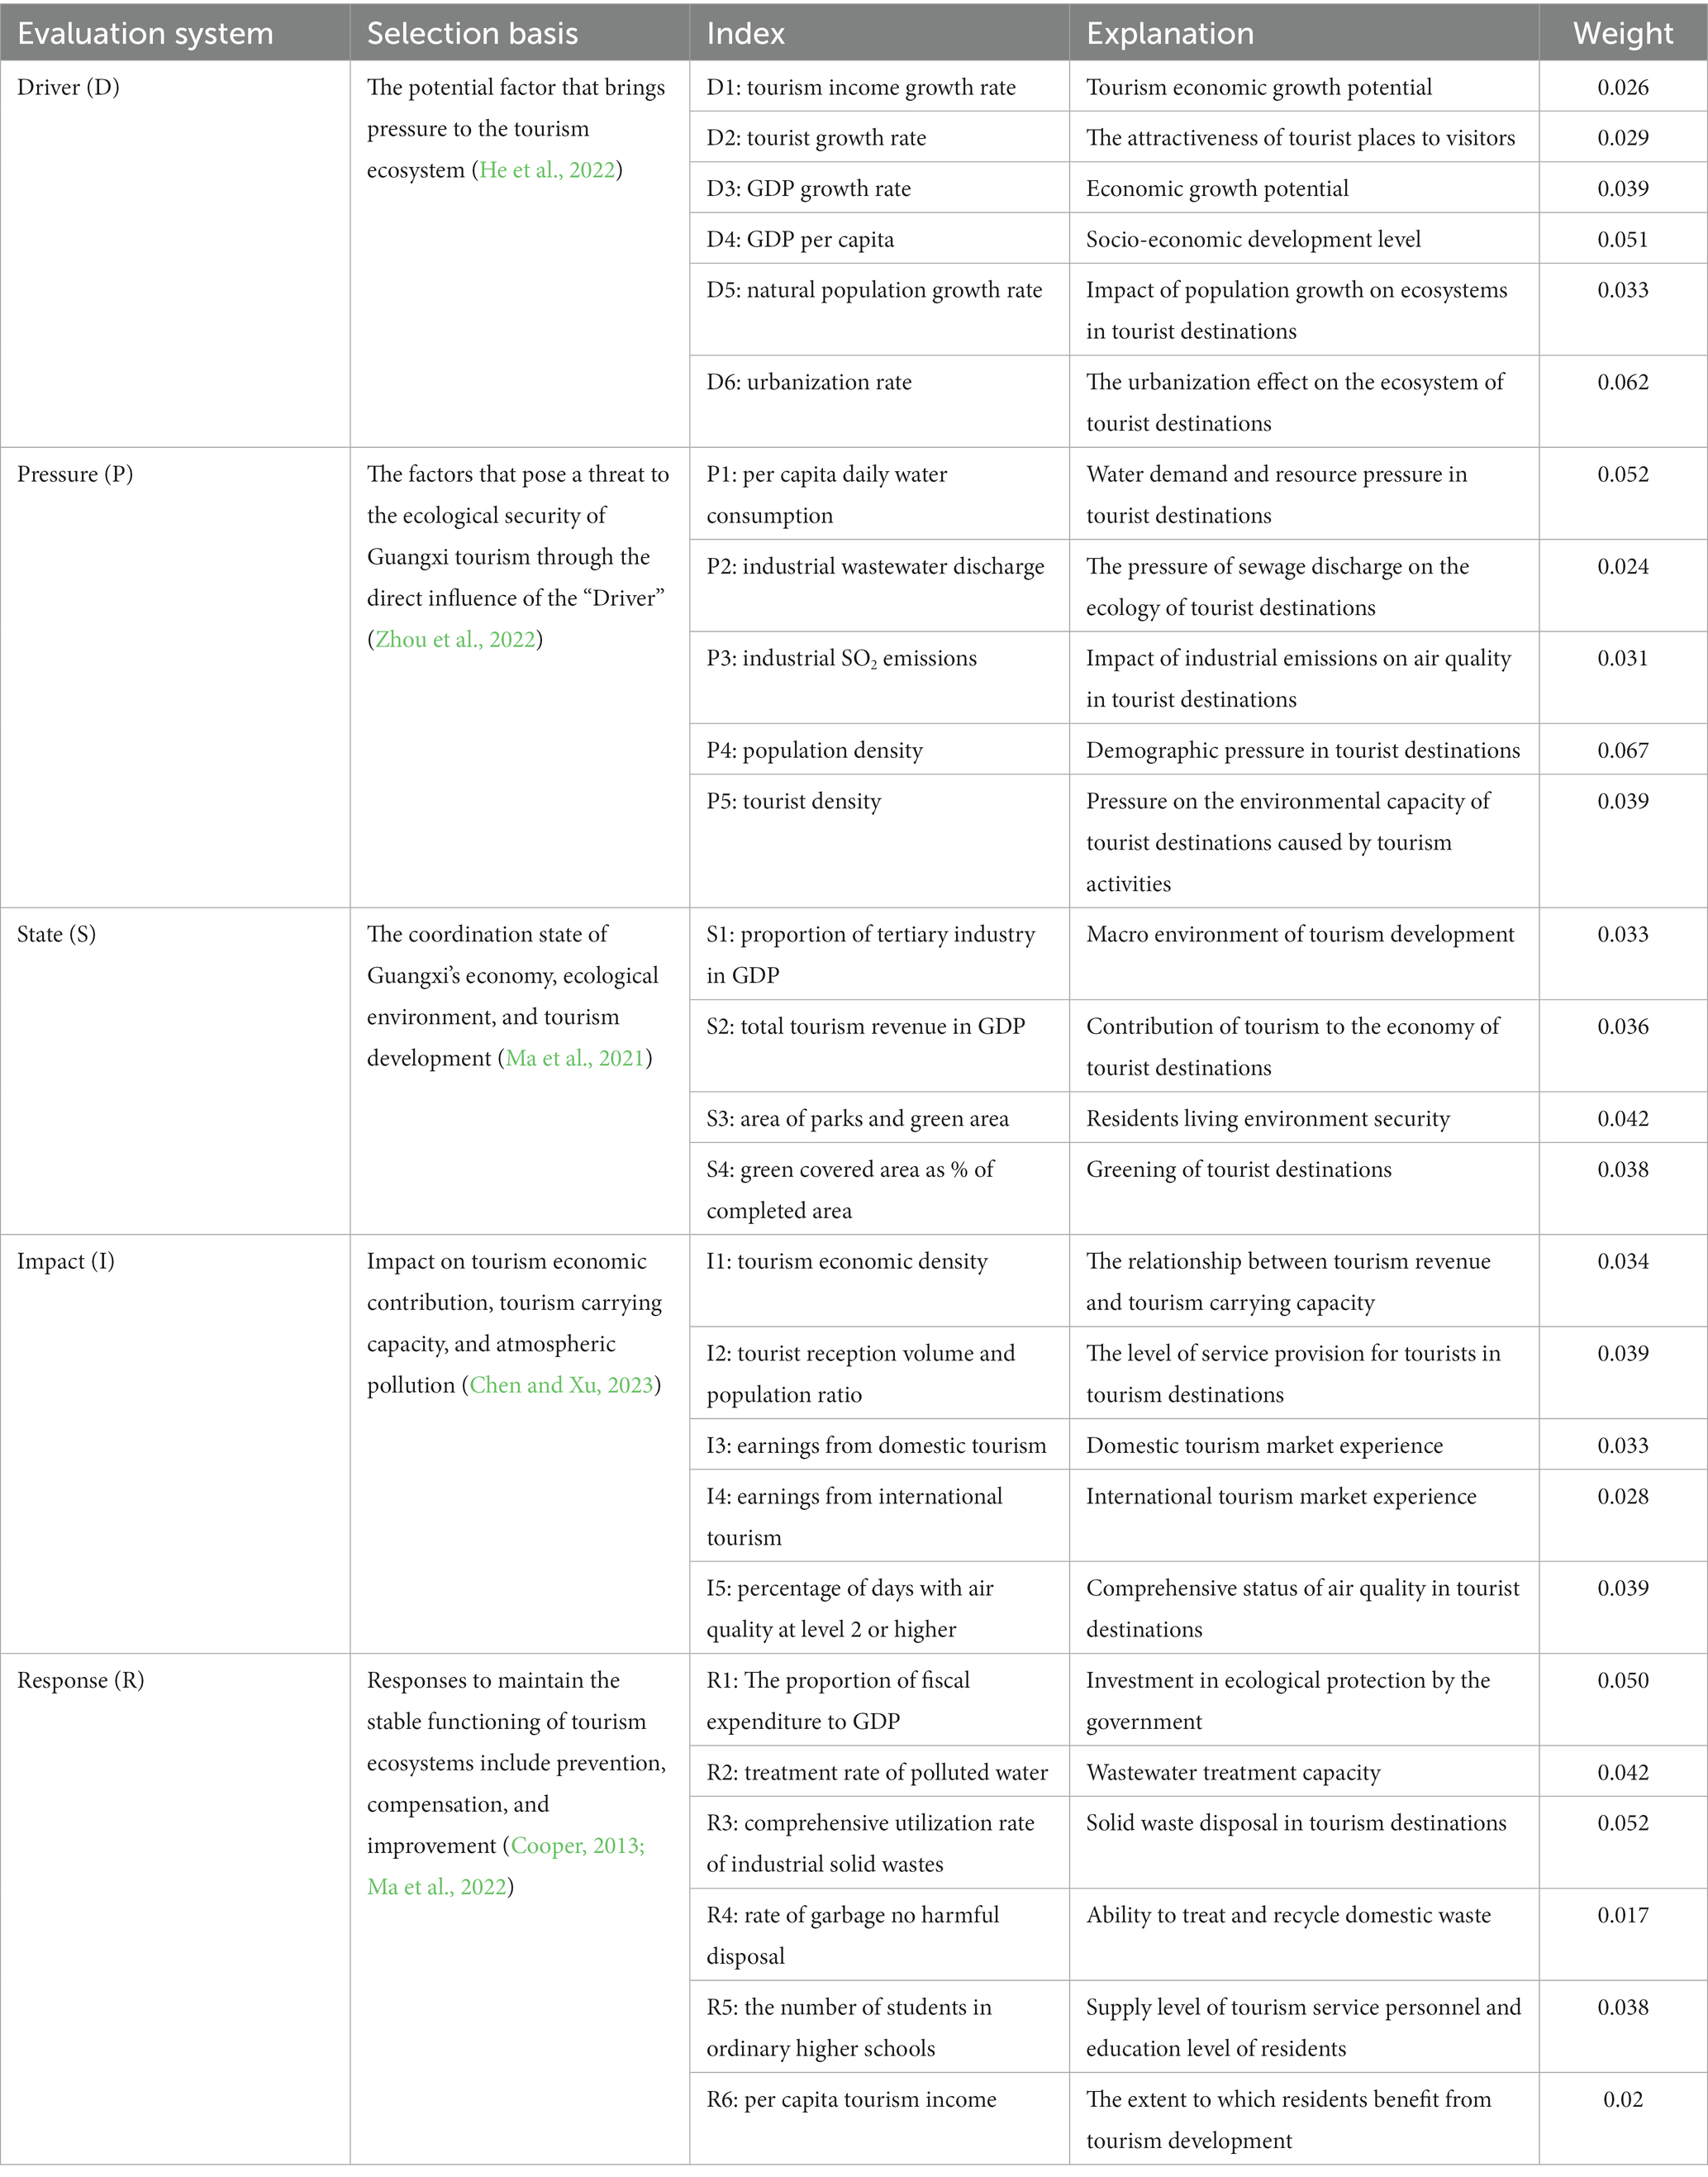
Table 2. Guangxi tourism ecological security DPSIR model.
2.3. Methods
The DPSIR model was used as the core of this study, and five research methods were adopted to measure the Guangxi TES evaluation system, among which Criteria Importance Through Intercrieria Correlation (CRITIC) was used to reduce the limitations brought by statistical data and calculate the comprehensive weight of each index of TES evaluation system (Diakoulaki et al., 1995; Zhong et al., 2023); the fuzzy matter-element model was utilized to solve the problem of incompatibility among individual indicators (Cai, 1999; Gong et al., 2012; Zhang et al., 2017), and its results characterize the composite index of TES to the degree of the Euclid approach (Han et al., 2019); Moran’s I was employed to explain its internal spatial correlation (Zhang et al., 2023); Markov chains measured its horizontal transfer probability and revealed the dynamic transfer characteristics (Mu et al., 2022). The Geodetector was mainly adopted to detect the differences in geographical elements and the influencing factors of spatial distribution and to measure the degree of influence of each index within the system on the TES of Guangxi through q-values (Wang and Xu, 2017; Liu K. et al., 2023).
2.3.1. Ecological security measurements
The TES was measured in five steps. First, the comprehensive weight of TES in Guangxi was calculated using the CRITIC method (Figure 2). Second, according to the matter element formula , construct the compound fuzzy object element . Third, the values of each index were normalized depending on the principle of subordinate affiliation, from which the optimal fuzzy membership matrix can be constructed. Fourth, maximum and minimum values for each evaluation index affiliation in the optimal fuzzy membership matrix form the standard substance element matrix . Fifth, the standard deviation squared fuzzy matter-element matrix was to calculate the variance components of each of the optimal fuzzy membership matrix and standard matter element. Then, the Euclid approach degree of TES was calculated based on the results of matrix by the formula. The above were calculated by the equations in Figure 2.
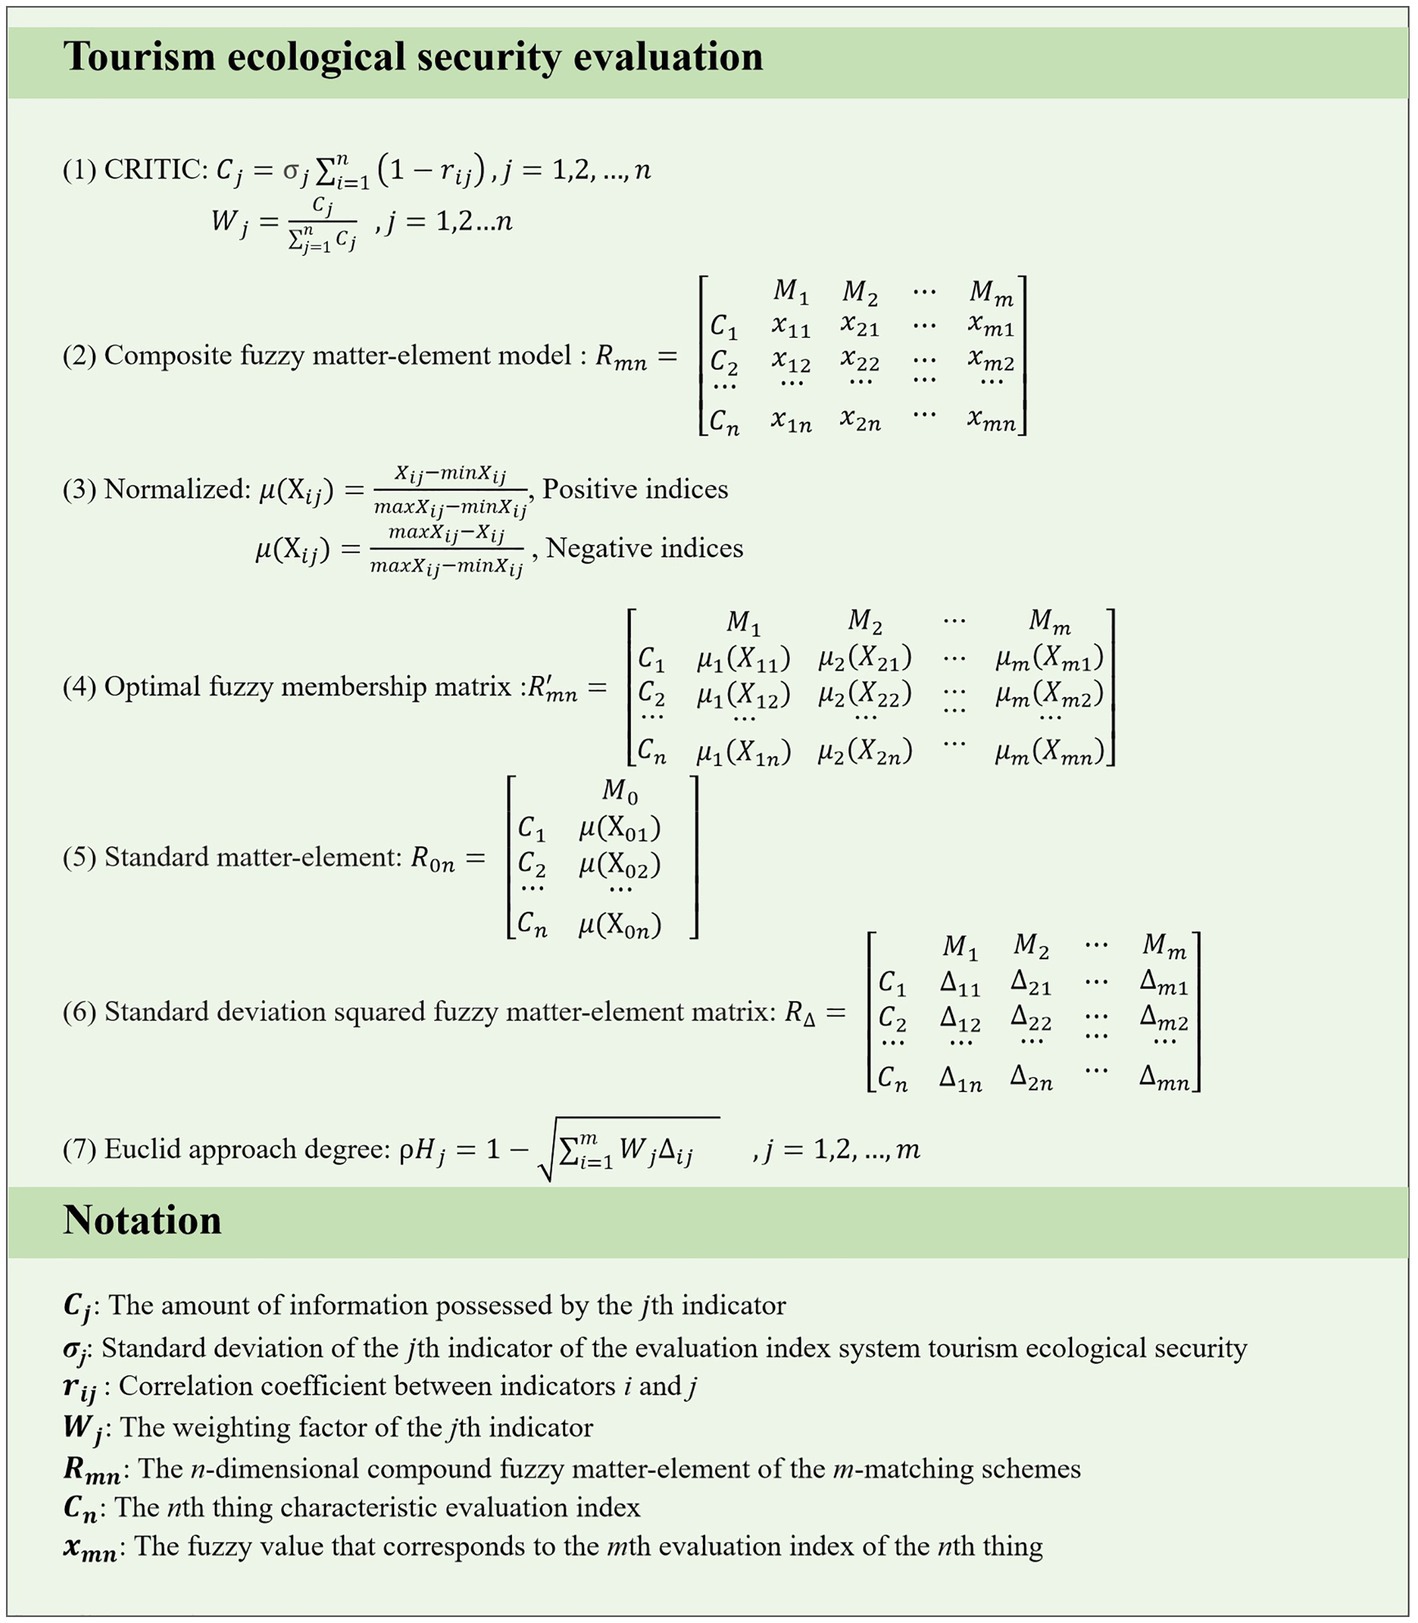
Figure 2. Equations for CRITIC and fuzzy matter-element model.
2.3.2. Spatial–temporal pattern measurement
The global spatial autocorrelation was used to measure the spatial agglomeration characteristics of TES in Guangxi, and Moran’s I was employed to show the results (Michael, 2002). Refer to Eqs 1 and 2:
The n in the equations denotes the total number of grids, is the spatial weight matrix, Xi and Xj are the attribute values on the i and j study units, respectively; is the average value, and Moran’s I value ranges from [−1,1], where positive values indicate a positive correlation, negative values indicate a negative correlation, and 0 indicates random distribution.
Using Markov chains, TES data were discretized into k types, and then, the probability distribution and transfer of each type were calculated. The probability distribution of TES types in year t is expressed as a state probability vector , denoted as , and the transfer between TES classes in different years can be represented by an of the matrix to represent. The composite matrix was as shown in Eq. 3:
where is the probability that the city of type in the year moves to type in the year .
2.3.3. Driving factor analysis
The Geodetector is mainly used to detect differences in geographic elements and factors influencing their spatial distribution. The degree of influence of the independent variable on the dependent variable can be calculated by using the divergence and factor detection modules. Using the q-value metric (Wang and Hu, 2012), the larger the q-value, the more influential the factor is on the DPSIR model, the expression is as shown in Eq. 4:
where denotes the sample size of the whole region, denotes the sample size of the stratum , denotes the variance of TES of the whole region, and denotes the variance of TES of the stratum .
2.4. Data sources and processes
In 2010, the China and ASEAN Free Trade Area was launched in Guangxi, and tourism began to develop rapidly. However, the advent of COVID-19 in 2020 had a great impact on tourism, which came to a halt. Given that TES should reflect the characteristics of its system operation, 2010–2019 was chosen as the study period. Air quality data were collected from the China Air Quality Online Inspection and Analysis platform.1 The natural population growth, rate urbanization rate, green covered area as % of completed area, industrial wastewater discharge, industrial SO2 emissions, and the comprehensive utilization rate of industrial solid wastes were collected from the Chinese urban statistical yearbook (2010–2019).2 Land area, GDP per capita, total population, per capita daily water consumption, GDP, tertiary industry GDP, tourism earnings (earnings from international tourism and earnings from domestic tourism), area of parks and green area, central public budget expenditure, treatment rate of polluted water, rate of garbage no harmful disposal, and the number of students in ordinary higher schools were collected from the Guangxi statistical yearbook (2010–2019).3 The tourism income growth rate, tourist growth rate, and GDP growth rate were calculated based on the growth rate formula “growth rate = incremental volume/original total”. Population density and tourist density were calculated by the formula “population density = the number of people/land area”. The per capita tourism income was calculated by “per capita tourism income = tourism earnings/population”. Missing data in “industrial SO2 emissions” and “percentage of days with air quality at level 2 or higher” were supplemented by linear interpolation.
A global autocorrelation analysis was performed using the spatial autocorrelation (Moran’s I) module in ArcGIS10.9; the spatial module was used for visualization as well as for data discretization; MATLAB R2022a software was used for Markov chains analysis; the impact factor q-values were calculated with the help of factor detector block of the Geodetector.
TES was divided into seven levels, namely, deterioration, risk, sensitive, critical safety, general safety, comparative safety, and very safe (Table 3) (Xu et al., 2017). This was the same in Guangxi in this study.
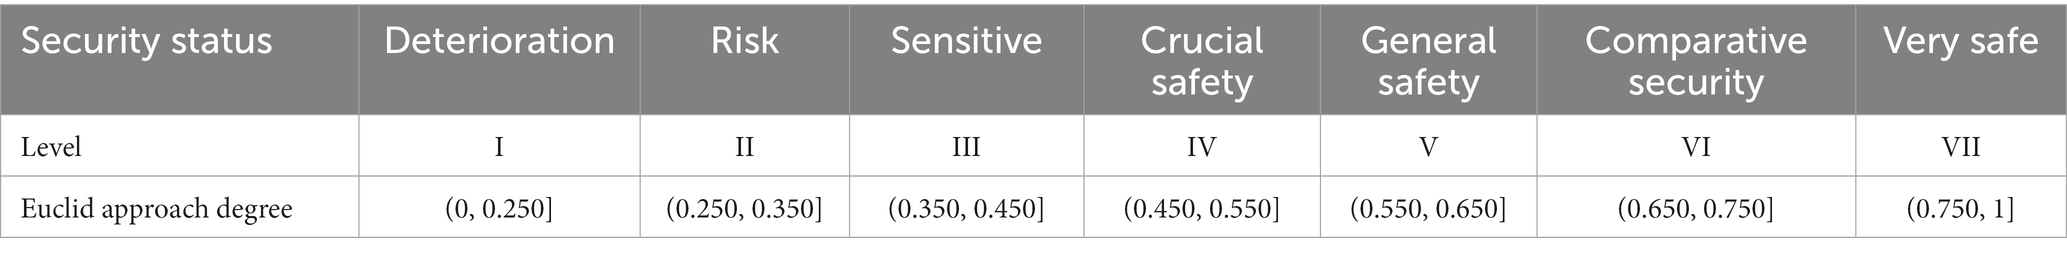
Table 3. Tourism ecological security level standard.
3. Results and analysis
3.1. Spatiotemporal patterns
3.1.1. Spatial and temporal characterization
From 2010 to 2019, the TES in Guangxi steadily increased by 72.73% from 0.20–0.30 to 0.30–0.40 (Figure 3). Economic growth and the emphasis on environmental protection have led to an increase in the TES level. By 2019, the total tourism consumption in Guangxi (1024.14 billion CNY) increased by 34.40% compared to 2018 (761.99 billion CNY). The ratio of good days of urban air quality was 91.70%, the rate of harmless urban domestic waste disposal was over 99.00%, and the TES of all cities had reached the risk tier and above. Meanwhile, the TES index was an obvious difference among 14 cities (Figure 4). More economically developed Nanning and Guilin had a higher TES index, showing a decreasing trend outward from the two cities.
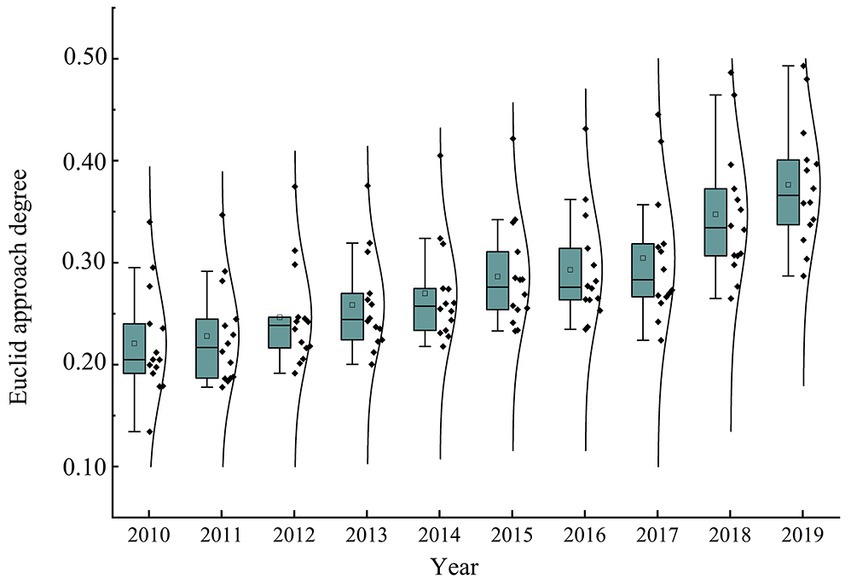
Figure 3. Box map for tourism ecological security in Guangxi.
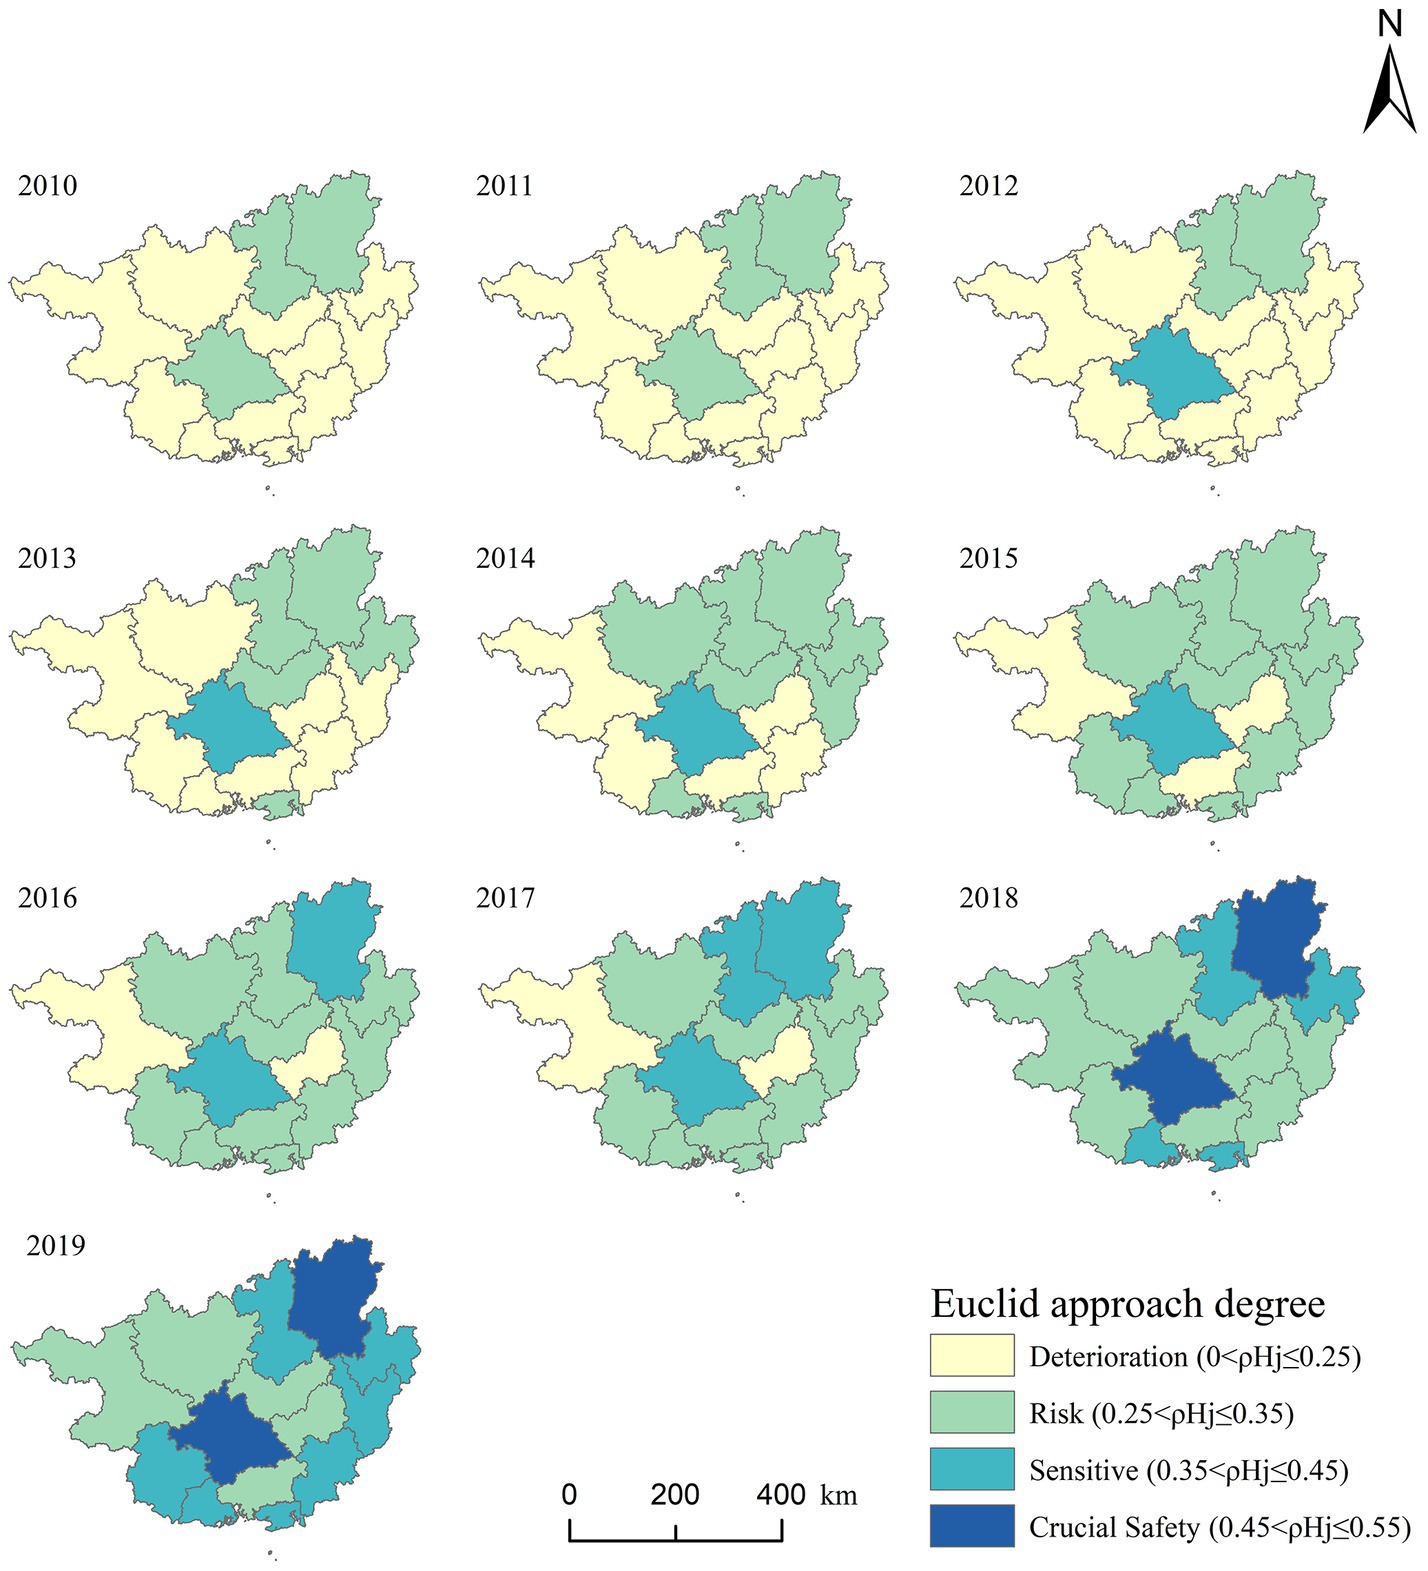
Figure 4. Spatial patterns of tourism ecological security in Guangxi from 2010 to 2019.
As an ethnic autonomous region in China, Guangxi was able to develop its economy rapidly with the support of the government’s superior ethnic policies, such as prioritizing construction projects, increasing financial support, and preferential taxation. Due to Nanning’s location in the capital of Guangxi, and the construction of the China and ASEAN Free Trade Area, the economic development rate is higher than that of other cities, and the per capita GDP was 44.32% higher than the average of Guangxi (42,778 CNY cap−1). The TES index of Nanning had been at the highest level in Guangxi, increasing from 0.34 to 0.49. Followed by Guilin, which increased from 0.30 to 0.48, a higher increase than Nanning. Guilin had a greater impact on TES in the surrounding areas than Nanning. With the “creating an international tourism mecca in Guilin” policy issued by the Chinese government (Government, C, 2009), Guilin’s total consumption of tourism has increased tenfold from 16.83 to 187.43 billion CNY. The rapid rise of tourism led to the development of related industries in the surrounding cities. Beihai and Fangchenggang, located in the coastal area, have rapidly improved their TES, while Beihai increased by 66.67% from 0.24, and Fangchenggang increased by 95.00% from 0.20. In 2017, the Chinese government released the “Beibu Gulf urban cluster development plan” under the “Belt & Road” initiative, Beihai and Fangchenggang, as the major cities in the China–ASEAN port city cooperation network, rapid economic development has been accompanied by a great improvement in TES. Industrial waste has been ranked as a highly environmentally unfriendly source of pollution that tends to limit the growth of some cities. The TES of environmentally unfriendly cities such as Baise was at the lowest level and increased slowly in Guangxi. Since the eleventh five-year plan of China, the comprehensive utilization rate of industrial solid waste in Baise (17.32–58.43%) has been the lowest in Guangxi, which was greatly lower than the other 13 cities (>90%). In addition, tourism resources also limit the improvement of TES in some cities, for example, Guigang had relatively few tourism resources and the total tourism consumption only accounted for 34.77% of GDP (2019), which was lower in Guangxi. The lack of tourism attractiveness leads to a tourist reception-to-population ratio of only 8.59% (2019), which was much lower than the average value of 22.09% in Guangxi.
Notably, TES in Guangxi was rising faster in the plains than in the mountains, along the coast than inland, and in capital cities than other areas. Therefore, the tourism development in each region was ranked as follows: Northeast (Guilin, Liuzhou, Laibin) > Southwest (Nanning, Chongzuo, Qinzhou, Beihai, Fangchenggang) > Southeast (Hezhou, Guigang, Yulin, Wuzhou) > Northwest (Baise, Hechi).
The results showed that the degree of TES in Guangxi all between grades I (deterioration) − IV (crucial safety). From 2010 to 2011, the TES level was dominated by deterioration, accounting for 85.71% of the total area. However, there was no longer a deterioration level area in 2018, the risk level area rose to 57.14%. Fortunately, Nanning and Guilin cities reaching the crucial safety level. In 2019, the coastal cities of Qinzhou, Guigang, Hezhou, Hechi, and Laibin were at the risk level; the seven inland cities of Liuzhou, Wuzhou, Beihai, Fangchenggang, Yulin, Baise, and Chongzuo were in the sensitive level; and the two economically good cities of Nanning and Guilin were in the crucial safety level. The overall level of TES has improved significantly since 2010 and has been raised to level II (risk).
To reflect the general change trend of TES in Guangxi, the natural fracture method was used to analyze the nuclear density of TES in 2010, 2013, 2016, and 2019 (Figure 5). It showed that the center of the overall distribution curve and the change interval moved to the right, which indicated that the TES improved steadily every year and without a declining stage. In 2010, the right-trailing characteristics of the curve were obvious, which showed that most of the cities gather in low-value TES and a small number of cities are close to high-value TES. From 2013 to 2019, the right tail of the core density curve of TES in Guangxi increased slightly, indicating that the higher level units of TES had an expanding trend. In 2019, the height of the main peak of the curve decreased and the wave peak widened, indicating that the TES was in a gradual smooth trend, and the gap between the values of TES in various cities narrowed.
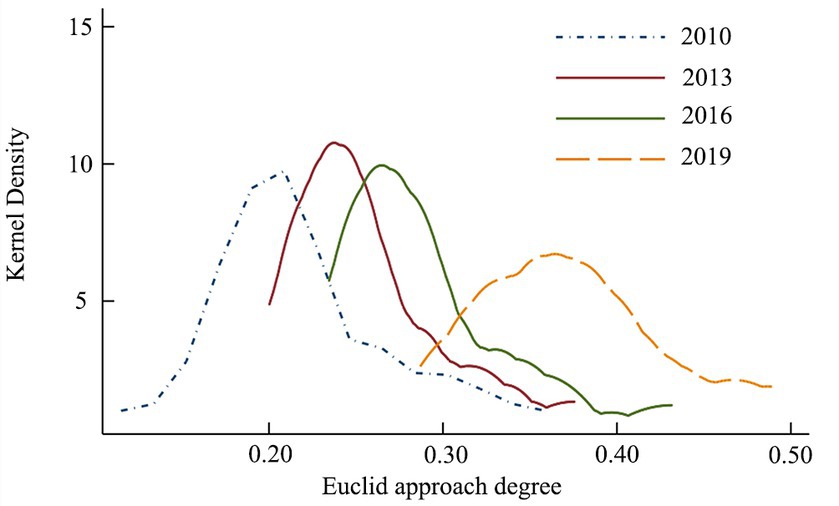
Figure 5. Kernel density estimation for tourism ecological security in Guangxi.
3.1.2. Global spatial autocorrelation
The values of Moran’s I for TES in Guangxi were negative (Table 4) and the normal statistics of values for all years were not significant (Li et al., 2018). The fluctuation of Moran’s I value with time evolution indicated that TES showed a random distribution of spatial characteristics from 2010 to 2019. Its distribution trend fluctuates and changes with time, and the spatial correlation effect was negative. There were significant differences in the economic, social, and environmental development of the cities in Guangxi province, which also affected the overall TES. For example, Nanning was the most economically developed city in Guangxi, and the TES value was always at the highest level in Guangxi, while its impact on the surrounding cities was not significant. Nanning increased by 20.59% from 0.34 to 0.41 between 2010 and 2014. The TES level of Qinzhou and Guigang, which were adjacent to Nanning, was always in the I level. The value of Qinzhou was increased from 0.19 to 0.23, while Guigang was increased from 0.20 to 0.22. As a result, it was the municipalities’ resource allocation and economic development that was the key factor in TES, rather than spatial location. This was due to improved transportation and changes in consumption habits in the tourism market. The TES level in Guangxi was less influenced by the surrounding areas, the internal circularity was stronger, and no spatial spillover effect occurred during the study time.
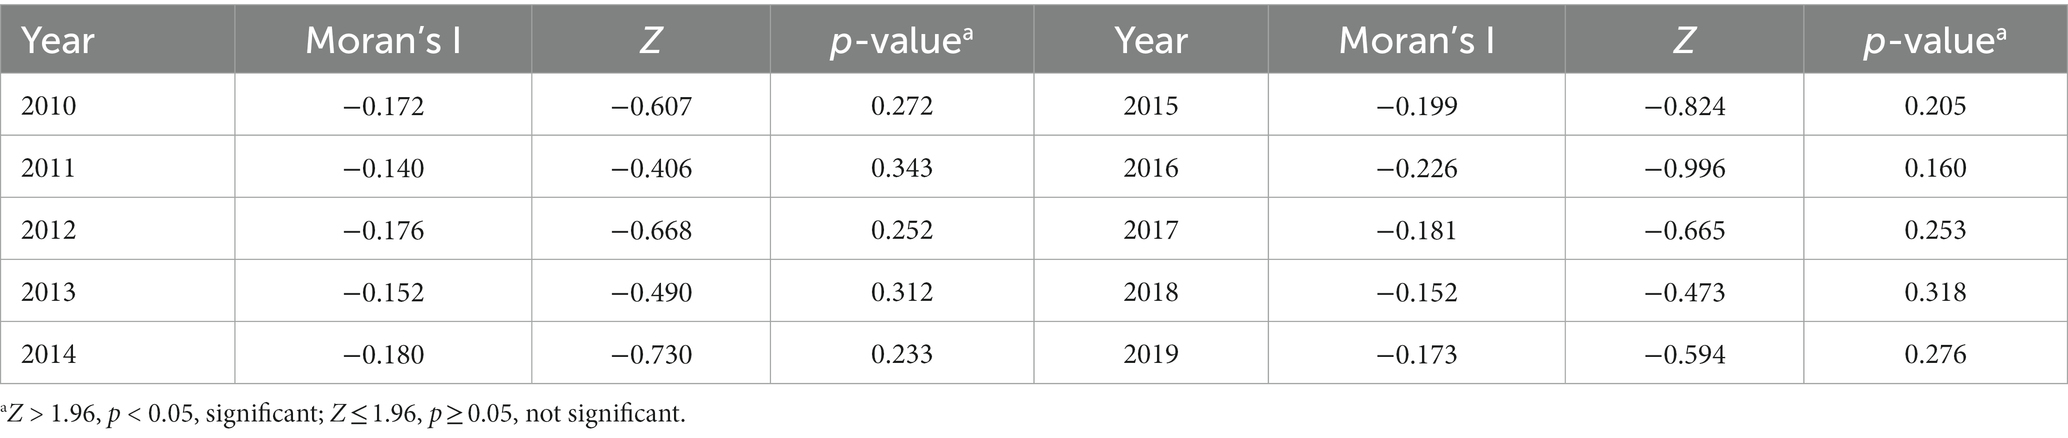
Table 4. Overall Moran’s I index of tourism ecological security in Guangxi from 2010 to 2019.
3.1.3. Markov transition probability matrix
The values on the diagonal in the Markov chains (Table 5) indicated the probability of no shift in the TES level, and the values on the non-diagonal indicate the probability of a shift in the security level.
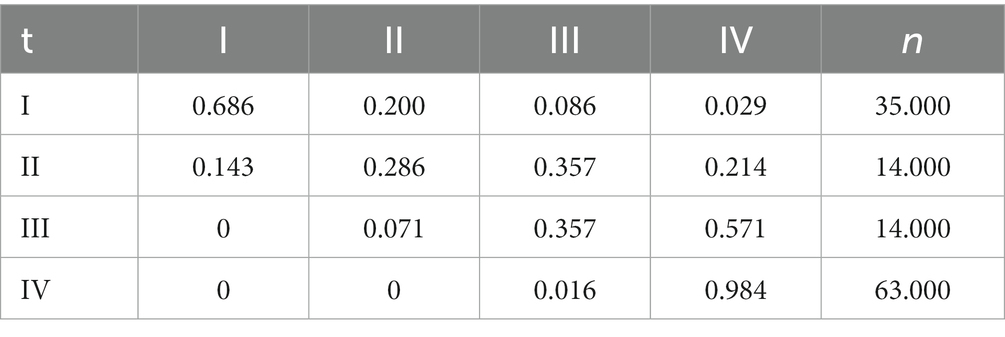
Table 5. Markov transition probability matrix of tourism ecological security types in Guangxi from 2010 to 2019.
From the matrix of Guangxi TES transfer in the table, the values of I level (Deterioration) and IV level (Crucial Safety) on the diagonal line (0.686, 0.984) were larger than the non-diagonal line, which means that both levels I and IV have “path dependence” and “self-locking” effects. It means that if the TES level of a region was at level I and level IV, the probability of maintaining this level at a later stage was as high as 68.60 and 98.40%, respectively. This can also explain the fact that from 2010 to 2011, the areas in level I accounted for 85.71% of all Guangxi, while until 2014, the areas in level I still accounted for 35.71%, which was improved slowly.
The probability of positive transfer of diagonal values was greater than the probability of negative transfer, indicating that the overall level of TES in Guangxi was more likely to be raised, with the probability of upward transfer of level III being 57.10%, reflecting the urgency of upward upgrade of TES in level III cities. By 2019, a total of seven cities in Guangxi, including Liuzhou, Wuzhou, Beihai, Fangchenggang, Yulin, Hezhou, and Chongzuo, had reached the TES level of III, which means that more attention should be paid to the systematic and synergistic development of special planning, ecological environmental protection, and territorial spatial development planning in these regions.
Elements equal to 0 were far from diagonal. On this chart, the diagonal values showed the probability of staying at the same level. The value, which was adjacent to and on the next higher level of the diagonal value, was higher than values on other levels. For example, if a city was in level II, the probability of remaining at level II was 28.60%, transferring to level III was 35.70%, transferring across ranks to level IV was 21.40%, and transferring to level I in the opposite direction was 14.30%. It indicated that the TES level of Guangxi was usually shifted between adjacent levels. The probability of cross-grade transfer was low, and the probability of reverse transfer was extremely low.
3.2. Driving mechanism
3.2.1. Factor detection
To investigate its driving mechanism and influencing factors, this study examined the influence effects of 26 evaluation indicators in the DPSIR model of TES in Guangxi (Figure 6).
1. Driver consists of indicators D1 to D6, with the largest changes in D1 (tourism income growth rate) and D5 (natural population growth rate). The q-value of D1 reached the lowest point of 0.024 in 2014, then peaked at 0.741 in 2015, indicating that the impact of D1 on TES in Guangxi was the highest in 2015, and then gradually decreased. In 2015, Guangxi, a major province of the Chinese tourism economy, took the initiative to integrate itself into the Chinese “Belt & Road” initiative, and the tourism industry in various cities has since developed rapidly. The tourism economy promotes the willingness of these regions to invest more resources to keep the tourism ecosystem in good working order. The degree of impact of D5 fluctuates upward, from 0.076 in 2010 to 0.690 in 2016, and then begins to fall again, reflecting the support or coercion of population growth on the ecosystem maintenance of tourist sites. While the q-value of D3 (GDP growth rate) decreased from 0.532 in 2010 to 0.124 in 2019. These indicate that the economic dynamics have a diminishing impact on the TES of Guangxi, while the social drive was gradually increasing. D6 (urbanization rate) kept a high impact indicating that the rapid expansion of cities has brought great impact and influence on TES.
2. Pressure was made up of indicators P1 to P5. The q-value of P3 (industrial SO2 emissions) reached the highest level of 0.719 in 2014. Air quality caused great concern in China after the Copenhagen Summit. Data released by the Guangxi Environmental Protection Department revealed that the annual average concentration of respirable particulate matter (PM 10) in ambient air in Guangxi rose by 7.81% in 2014 (0.069 mg m−3) compared with 2013 (0.064 mg m−3) (Bureau, 2015). However, with the improvement of environmental protection, air quality has not become a constraint for tourists to travel. The q-values of P1 (per capita daily water consumption) and P5 (tourist density) were relatively large. Tourist density reflects the number of visitors to the city, once the tourist density exceeds the maximum carrying capacity of the destination environment, it will cause a local ecological imbalance. Tourists are an uncontrollable variable with subjective consciousness in the tourism ecosystem. For example, due to an individual’s conscious or unconscious demand, some tourists will deviate from the norm, which may cause environmental pollution and will cause a series of knock-on effects on the local tourism ecosystem. In addition, the per capita daily water consumption reflected the level of local water consumption, and its increase would put pressure on the local ecological environment.
3. State was composed of indicators S1 to S4. The q-value of S1 (proportion of tertiary industry in GDP) decreases from 0.734 (2010) to 0.443 (2019). The tertiary sector of the economy is less constrained by resources such as land and has a larger capacity for employment. In 2010, Guangxi’s TES began to improve in general, and the tertiary industry began to develop rapidly, with S1 having a greater influence on it. With the steady improvement of TES, the influence of each factor tends to be balanced, and the influence of S1 gradually weakens. The park green area has a significant contribution to the tourism ecosystem, and its increase in quantity helps to guarantee ecological balance. Urban green space can play the function of purifying air, regulating atmospheric temperature, absorbing dust and sterilizing, reducing noise, and other functions. Therefore, S3 (area of parks and green area) has a greater influence on the TES of Guangxi.
4. Impact was composed of indicators I1 to I5. The q-values of most impact factors showed a decrease. However, the q-value of I4 (earnings from international tourism) improved by 229.00% from 0.383 to 0.876. This meant that the cross-border tourism in Guangxi’s TES impact could not be ignored. Tourism economic development was still an important driving force affecting TES, which was reflected in I3 (earnings from domestic tourism) maintaining a high q-value. Guangxi is trying to build an international tourist destination, in which each city has distinctive tourist attractions and products, and tourism revenues have increased significantly in the context of industrial structure reform and innovative development.
5. Response consists of indicators R1 to R6. The degree of influence of all impact factors in this sub-system was lower, and the q-values were smaller compared to the others. Only R5 (the number of students in ordinary higher schools) accounts for a higher percentage, reflecting the significant role of talent investment in improving TES and promoting the green transformation of the tourism industry. The cultivation of talents will not only affect the application of ecological management and innovative technology but also indirectly improve the environmental awareness and social responsibility of tourists. In recent years, as Guangxi attaches great importance to the training of talents, the training of tourism professionals has gradually increased, and the influence on TES has gradually increased.
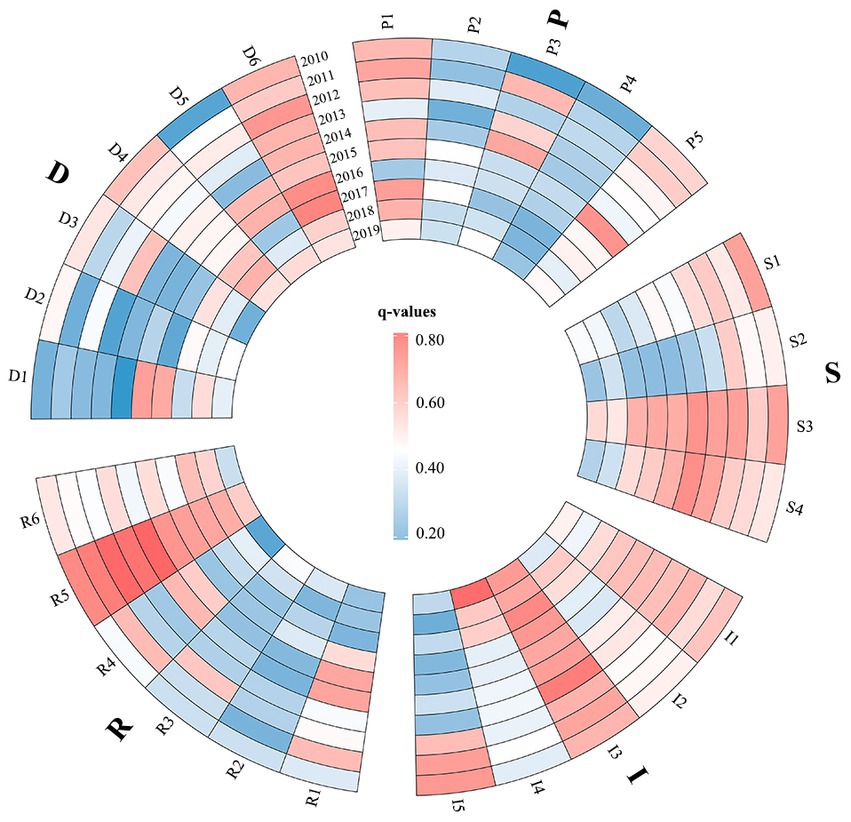
Figure 6. Guangxi tourism ecological security impact factor q-values detection.
3.2.2. Driving mechanism
Based on the DPSIR model and the detection of its influencing factors, the driving mechanism of TES in Guangxi was derived (Figure 7). The internal elements of the Guangxi tourism ecosystem were in a state of mutual influence and cyclic operation, and the enhancement or control of key elements was helpful to maintain the stable operation of the tourism ecosystem. Driven by the level of economic development and the growth of the tertiary industry in Guangxi cities, the driver sub-system (D) has changed the speed of regional tourism development. With the rapid development of tourism, a series of resource consumption, and pollutant emissions caused by tourism activities have also brought about population, resource consumption, and environmental pressure. Pressure sub-system (P) internal structure and state changes produce disturbance and impact on the state sub-system (S) of the Guangxi tourism ecosystem, like the total tourism income and park green area. The change of state sub-system (S) has many impacts (I) on Guangxi’s TES, which caused the increase or decrease of factors such as the tourism revenue growth rate. To continue the positive effect and preserve the sustainable development of tourism and the ecological environment, positive responses (R), such as increasing financial investment, improving the rate of pollutant treatment, and increasing the training of tourism talents, have been adopted by the Guangxi provincial government. The response sub-system, however, in turn, impedes or regulates pressure while improving or inhibiting the driver sub-system’s results. In addition, the implemented response policy might have the effect of maintaining or enhancing the factors in the state sub-system. Driver, pressure, state, impact, and response individual sub-system and through the internal integration of each element produced Guangxi TES overall system to produce a virtuous cycle.

Figure 7. Driving mechanism of tourism ecological security system based on the DPSIR model.
4. Discussion
4.1. Model uncertainties
The study provided a DPSIR model to adapt to the TES of Guangxi. We explored the spatial and temporal distribution patterns and key drivers of its TES level and constructed a model of the driving mechanism of TES development. Our results can contribute to TES management and reduce key influencing factors for environmental damage in tourism activities while serving as a model for other areas. However, our model has uncertainties in the following aspects. First, we only choose the most representative 26 indicators according to the characteristics of Guangxi tourism development in the DPSIR model, while the number of hotels and scenic spots was ignored. Second, as some data from the statistical yearbook were missing, we supplemented the data using linear interpolation.
Reducing the uncertainties will use the comparative method. In terms of the output results and trends of TES, the output results were similar to other studies (Li et al., 2017a,b; Liu and Yin, 2022), which proves the reliability of our model. Furthermore, we found that TES in Guangxi showed an increasing trend, which was similar to the other tourism provinces in China, such as Yunnan and Guizhou (Qin and Cheng, 2019; Zhao et al., 2021). This is related to the development of tourism in Guangxi province following the ecological tourism resources of different places to create unique tourist attractions. The ecological region centered on Guilin focuses on the development of forest land ecotourism relying on scenic spots; the ecological region centered on Nanning focuses on the protection of tourism natural resources and the development of coastal ecotourism; and the ecological region centered on Baise focuses on the development of ecotourism to limit high water consumption and reduce pollution (Government, G, 2007). Of course, our results are within the range of the results of other studies (Li et al., 2017; Liu and Yin, 2022). In addition, the economic development, social effects, environmental governance and protection, and system response had significant positive effects on TES in Guangxi, this is similar to the other studies (Castellani and Sala, 2012; Li et al., 2014; Peng et al., 2018; Xu et al., 2021).
4.2. Policy implications
Government policies improved the level of TES and stimulated the transformation of the tourism industry, with four types of policies playing a role. First is the development of forest tourism resources, with Guangxi government implementing the “Forest Tourism Development Strategy” (Government, G, 2022). Forestry ecotourism resource richness has more attraction compared with others. Adding one forest ecotourism area will bring 1.61 million tourists and increase 1.67 billion CNY tourism revenue. The development of forest tourism also has three benefits, which are to disperse urban tourists, reduce the pressure on other urban scenic spots, and improve the TES. The second policy is the greening of abandoned mines. In 2019, Guilin has completed the ecological restoration of 42 abandoned mines, including 21 greening mines in the Lijiang area, which increased tourism revenue by 12 million CNY. Greening of abandoned mines has also increased the built-up areas, which has a positive impact on enhancing the regional TES. By 2022, Guangxi still had 237 km2 of abandoned mines (Daily, 2023), and the space for ecological restoration and enhancement is enormous. The third policy is training tourism technical personnel. Tourism ecosystem drivers were shifting from GDP growth to population growth rates. Impact and response factors further corroborate that talent development was a key measure of TES. Policies should be based on short-term environmental inputs and long-term talent outputs. Only approximately ten thousand people were employed in star-rated hotels and A-grade scenic spots in Chongzuo in 2019, while the tourism reception was 460.72 million people. Each tourism technical personnel could ease the local tourism reception pressure of 4,600 people and promote the growth of the tourism economy. Therefore, accelerating the establishment of a long-term talent pool and strengthening education and training and human resource management are the keys to promoting the improvement of TES in Guangxi. The fourth policy is to reduce clearance time for inbound tourists. Earnings from international tourism became one of the most influencing factors on the TES of Guangxi. The increase in inbound tourists can increase earnings from international tourism and TES level. This study focuses on the evolution of TES in Guangxi from 2010 to 2019, while COVID-19 had impacts on tourism in 2020 that brought tourism to a standstill. However, with the changing entry policy of the Chinese government, reducing the clearance time for tourists has become an effective way to revive inbound tourism. Fangchenggang Dongxing Port implemented a new clearance process on June 18th, 2018, which shortened the clearance time to less than 30 minutes (Government, G, 2018). The policy was implemented with an increase of inbound tourists of 11,485 per day compared with 2017.
4.3. Limitations and future research
The limitations of this study include the following. First, limited by the blurred boundaries and high crossover of the tourism industry, it is difficult to strip out the data on environmental pollution and ecological damage directly caused by tourism. The future study can improve the basis of index selection, broaden the research data sources, and explore how to establish a more standardized and effective evaluation mechanism based on the operational characteristics of TES. Second, due to lack of data, this study only takes province and city scales, however, the driving mechanisms of TES that may interact between tourism ecosystems at the county level may be more pronounced. Future research can investigate the spatial correlation and driving mechanisms of the county scale of TES. In addition, the Geodetector was used in this study to carry out the test of key drivers of TES in Guangxi, and a theoretical model of its driving mechanism was established. However, the conduction channels and the mechanism of action among the elements of the Guangxi tourism ecosystem have not been thoroughly tested. The model is still in a hypothetical state and will be validated using structural equation modeling (SEM) in the future. It is worthwhile to note that tourism activities were tourist-oriented, relying on statistical data alone cannot thoroughly quantify the damage to the ecological environment in tourism activities due to the uncertainty of behavior caused by the autonomy of tourist groups. Adding questionnaire data in future studies will make the results more reasonable to facilitate the prediction and early warning of TES, and the development of corresponding control strategies.
Notably, previous studies focused on improving TES in terms of ecological conservation and ignored the impact of tourism itself. Our study took into account tourism sustainability and paid attention to ecological conservation while adopting effective methods to maximize the tourism economy within the tourism carrying capacity. In future studies, the model could be used to provide a measure of the level of TES and serve as an example for other regions in China.
5. Conclusion
In this study, the spatial–temporal pattern measurement evolution characteristics and driving mechanisms of TES in Guangxi were systematically and thoroughly studied. Based on the DPSIR model, we used the fuzzy matter-element model to measure TES in Guangxi from 2010 to 2019. The results showed that TES in Guangxi improved annually, but the overall development was unbalanced, which was related to the different geographical positions and development priorities.
1. Spatial–temporal evolution: The overall TES in Guangxi was improved continuously, but there were differences in the enhancement speed of each city. The speed of upgrading was Northeast > Southeast > Southwest > Northwest. Guilin had a greater impact on neighboring cities than Nanning, while coastal cities improved more quickly than inland cities. The biggest change was in Fangchenggang, followed by Guilin. Baise and Guigang had the least significant change. By 2019, the TES level of Guangxi had been upgraded to II (risk).
2. Global spatial autocorrelation: For the random distribution of spatial characteristics of TES in Guangxi, Moran’s I was negative and insignificant. Description of the inputs and outputs in the internal system of TES indicates less influence and disturbance by the external ecosystem. The spatial location was not the main reason to restrict the TES, however, economic development, environmental protection efforts, and the resource allocation of each city were the key factors to influence the TES.
3. Dynamic transfer: The probability of Guangxi TES’s gradual upgrading was high and would hardly decline. The TES with levels (I, II) will maintain the present state while level III will be raised to the next state.
4. Driving mechanism: There were significant differences in the decision-making levels of TES impact factors. The key influencing factors include tourism income growth rate, natural population growth rate, per capita daily water consumption, tourist density, area of parks and green area, earnings from domestic tourism, earnings from international tourism, and the number of students in ordinary higher schools. Economic and ecological indicators have a significant positive impact on the TES of Guangxi, and not only short-term investment in ecological construction but also talent training must be areas of focus.
Driver (D) was composed of both economic and social aspects and generates a series of environmental pressures, pressure (P) changes the state (S) of the TES of Guangxi, thus causing a series of impacts (I) on it, and each stakeholder of Guangxi tourism further responds (R) according to the impacts. Response policies adopted by the government can effectively improve the driving force while reducing the pressure, making the TES system a virtuous cycle.
Data availability statement
The raw data supporting the conclusions of this article will be made available by the authors, without undue reservation.
Author contributions
YQL: conceptualization, investigation, methodology, validation, and writing – original draft. HYL: resources, funding acquisition, methodology. YHL: supervision, validation, and writing – review and editing. JC: writing – review and editing. CTJ and NNW: software, visualization. All authors contributed to the article and approved the submitted version.
Funding
This research was funded by the Project of Improving Scientific Research Basic Ability of Young and Middle-aged Teachers in Guangxi Universities (Grant No. 2021KY0157), the Guangxi Philosophy and Social Science Planning Research Project of “Innovative Utilization and Tourism Activation of Ethnic Festival Resources in Guangxi” (Grant No. 21FMZ032), and the Innovation Project of Guangxi University for Nationalities Graduate Education (Grant No. gxun-chxps202094, gxun-chxps202092).
Conflict of interest
The authors declare that the research was conducted in the absence of any commercial or financial relationships that could be construed as a potential conflict of interest.
Publisher’s note
All claims expressed in this article are solely those of the authors and do not necessarily represent those of their affiliated organizations, or those of the publisher, the editors and the reviewers. Any product that may be evaluated in this article, or claim that may be made by its manufacturer, is not guaranteed or endorsed by the publisher.
Footnotes
References
Asmelash, A. G., and Kumar, S. (2019). Assessing progress of tourism sustainability: developing and validating sustainability indicators. Tourism Manage. 71, 67–83. doi: 10.1016/j.tourman.2018.09.020
Bahraminejad, M., Rayegani, B., Jahani, A., and Nezami, B. (2018). Proposing an early-warning system for optimal management of protected areas (case study: Darmiyan protected area, eastern Iran). J. Nat. Conserv. 46, 79–88. doi: 10.1016/j.jnc.2018.08.013
Benitez-Capistros, F., Huge, J., and Koedam, N. (2014). Environmental impacts on the Galapagos Islands: identification of interactions, perceptions and steps ahead. Ecol. Indic. 38, 113–123. doi: 10.1016/j.ecolind.2013.10.019
Biswas, T., and Rai, A. (2022). Analysis of spatial patterns and driving factors of domestic medical tourism demand in north East India. Geo. J. doi: 10.1007/s10708-022-10798-y
Bureau, T. G. Z. A. R. E. P. (2015) 2014 Guangxi Zhuang Autonomous Region Environmental Status Bulletin. Available at: (http://sthjt.gxzf.gov.cn/zfxxgk/zfxxgkgl/fdzdgknr/hjzljc/hjzkgb/t3611501.shtml)
Cai, W. (1999). Extension theory and its application. Chin. Sci. Bull. 44, 1538–1548. doi: 10.1007/BF02886090
Castellani, V., and Sala, S. (2012). Ecological Footprint and Life Cycle Assessment in the sustainability assessment of tourism activities. Ecol. Indic 16:135–147. doi: 10.1016/j.ecolind.2011.08.002
Chen, H.-S. (2017). Evaluation and analysis of eco-security in environmentally sensitive areas using an Emergy ecological footprint. Int. J. Environ. Res. Public Health 14:136. doi: 10.3390/ijerph14020136
Chen, B. Q., and Xu, X. T. (2023). The north–south gap and spillover effect of Chinese service industry green development. Front. Ecol. Evol. 10. doi: 10.3389/fevo.2022.1094646
Chiaka, J. C., Zhen, L., and Xiao, Y. (2022). Changing food consumption patterns and land requirements for food in the six geopolitical zones in Nigeria. Foods 11:150. doi: 10.3390/foods11020150
Cooper, P. (2013). Socio-ecological accounting: DPSWR, a modified DPSIR framework, and its application to marine ecosystems. Ecol. Econ. 94, 106–115. doi: 10.1016/j.ecolecon.2013.07.010
Daily, G. (2023) Guangxi Increases Funding Year by Year to Accelerate Ecological Restoration of Abandoned Mines. Available at: http://www.gxzf.gov.cn/gxyw/t15673291.shtml (accessed January 25, 2023).
Diakoulaki, D., Mavrotas, G., and Papayannakis, L. (1995). Determining objective weights in multiple criteria problems: the CRITIC method. Comput. Oper. Res. 22, 763–770. doi: 10.1016/0305-0548(94)00059-H
Ehara, M., Hyakumura, K., Sato, R., Kurosawa, K., Araya, K., Sokh, H., et al. (2018). Addressing maladaptive coping strategies of local communities tochanges in ecosystem service provisions using the DPSIR framework. Ecol. Econ. 149, 226–238. doi: 10.1016/j.ecolecon.2018.03.008
Gateway, T. S. T. (2008) Charter for Sustainable Tourism. Available at: http://www.gdrc.org/uem/eco-tour/charter.html (Accessed January 15, 2023).
Gong, J., Liu, Y., and Chen, W. (2012). Land suitability evaluation for development using a matter-element model: a case study in Zengcheng, Guangzhou, China. Land Use Pol. 29, 464–472. doi: 10.1016/j.landusepol.2011.09.005
Government, C. (2009) Several Opinions of the State Council on Further Promoting the Economic and Social Development of Guangxi. Available at: http://www.gov.cn/gongbao/content/2009/content_1487010.htm (accessed January 15, 2023).
Government, G. (2007) Outline of Ecological Guangxi Construction Plan (2006–2025). Available at: http://www.gxzf.gov.cn/zfwj/zzqrmzfwj_34845/t1508743.shtml (accessed January 15, 2023).
Government, G (2018) Dongxing Port Tourist Clearance Time Reduced to 30 Minutes. Available at: http://www.gxzf.gov.cn/gxydm/dmly/t1221038.shtml (accessed January 3, 2023).
Government, G. (2020) Guangxi Advantage – Ecological Advantage. Available at: http://tzcjj.gxzf.gov.cn/tzgx/tzzn/gxgkzrjjqwd/t808943.shtml (accessed January 15, 2023).
Government, G (2022). Guangxi Forestry Ecotourism Consumption Annual Income Exceeded 200 Billion Yuan. Available at: http://www.gxzf.gov.cn/gxyw/t12796335.shtml (accessed December 25, 2022).
Han, H., Li, H. M., and Zhang, K. Z. (2019). Urban water ecosystem health evaluation based on the improved fuzzy matter-element extension assessment model: case Study from Zhengzhou City, China. Math. Probl. Eng. 2019, 1–14. doi: 10.1155/2019/7502342
He, G., Yu, B., Li, S., and Zhu, Y. (2018). Comprehensive evaluation of ecological security in mining area based on PSR-ANP-GRAY. Environ. Technol. 39, 3013–3019. doi: 10.1080/09593330.2017.1371250
He, N., Zhou, Y., Wang, L., Li, Q., Zuo, Q., Liu, J. Y., et al. (2022). Spatiotemporal evaluation and analysis of cultivated land ecological security based on the DPSIR model in Enshi autonomous prefecture, China. Ecol. Indic. 145:109619. doi: 10.1016/j.ecolind.2022.109619
Hsiao, C. Y., Kuo, C. M., and Tuan, C. L. (2021). Island ecological tourism: constructing indicators of the tourist service system in the Penghu national scenic area. Front. Ecol. Evol. 9:708344. doi: 10.3389/fevo.2021.708344
Jiao, M. Y., Wang, Y. F., Hu, M. M., and Xia, B. C. (2021). Spatial deconstruction and differentiation analysis of early warning for ecological security in the Pearl River Delta, China. Sust. Cities Soc. 64:102557. doi: 10.1016/j.scs.2020.102557
Jun, Y., Zi, H., and Shan, F. (2019). Research on tourism economic development from the perspective of ecological security: a case study of Xi'an. IOP Conf. Ser. Earth Environ. Sci. 237:052006. doi: 10.1088/1755-1315/237/5/052006
Kagalou, I., Leonardos, I., Anastasiadou, C., and Neofytou, C. (2012). The DPSIR approach for an integrated river management framework. A preliminary application on a mediterranean site (Kalamas River-NW Greece). Water Resour. Manag. 26, 1677–1692. doi: 10.1007/s11269-012-9980-9
Laurance, W. F., Clements, G. R., Sloan, S., O’Connell, C. S., Mueller, N. D., and Goosem, M. (2014). A global strategy for road building. Nature 513, 229–232. doi: 10.1038/nature13717
Li, X., Tian, M., Wang, H., Wang, H., and Yu, J. (2014). Development of an ecological security evaluation method based on the ecological footprint and application to a typical steppe region in China. Ecol. Indic. 39, 153–159. doi: 10.1016/j.ecolind.2013.12.014
Li, X., Wu, Q., and Zhou, Y. (2017a). Spatio-temporal pattern and spatial effect of chinese provincial tourism eco-security. Economic Geography 37, 210–217. doi: 10.15957/j.cnki.jjdl.2017.03.028
Li, X., Wu, L., and Zhou, Y. (2017b). Evaluation on tourism ecological security and diagnosis of its obstacle indicators in china. Ecological Economy 33, 90–95.
Li, C. H., Xu, M., Wang, X., and Tan, Q. (2018). Spatial analysis of dual-scale water stresses based on water footprint accounting in the Haihe River basin, China. Ecol. Indic. 92, 254–267. doi: 10.1016/j.ecolind.2017.02.046
Li, Y. Y., and Zhang, Y. (2022). Spatial-temporal evolution and influencing factors of tourism eco-efficiency in China’s Beijing-Tianjin-Hebei region. Front. Environ. Sci. 10:1067835. doi: 10.3389/fenvs.2022.1067835
Liang, Y. H., Zhang, Y. Q., Wang, Y. Y., Kong, X. G., Cai, Z. C., and Wang, Y. H. (2023). Increasing nitrogen losses due to changing food consumption patterns in Bayannur City, China. Foods 12:752. doi: 10.3390/foods12040752
Liang, Y. H., Zhen, L., Zhang, C. S., and Hu, Y. F. (2020). Consumption of products of livestock resources in Kazakhstan: characteristics and influencing factors. Environ. Dev. 34, 100492. doi: 10.1016/j.envdev.2019.10049
Liu, N. N., Chen, Y. Y., and Su, F. (2023). Research on the spatial differences and influencing factors of integrated urban-rural development in the Yangtze River Delta. Front. Sustain. Cities. 4. doi: 10.3389/frsc.2022.1077653
Liu, K., Xue, Y. T., Chen, Z. F., and Miao, Y. (2023). The spatiotemporal evolution and influencing factors of urban green innovation in China. Sci. Total Environ. 857:159426. doi: 10.1016/j.scitotenv.2022.159426
Liu, X. L., Yang, Z. P., Di, F., and Chen, X. G. (2009). Evaluation on tourism ecological security in nature heritage sites —case of kanas nature reserve of Xinjiang, China. Chin. Geogr. Sci. 19, 265–273. doi: 10.1007/s11769-009-0265-z
Liu, D. D., and Yin, Z. Y. (2022). Spatial-temporal pattern evolution and mechanism model of tourism ecological security in China. Ecol. Indic. 139:108933. doi: 10.1016/j.ecolind.2022.108933
Li, X. B., Wu, Q., and Zhou, Y. (2017). Spatio-temporal pattern and spatial effect of chinese provincial tourism eco-security. Economic Geography 37:210–217. doi: 10.15957/j.cnki.jjdl.2017.03.028
Ma, X. B., Sun, B., Hou, G. L., Zhong, X., and Li, L. (2021). Evaluation and spatial effects of tourism ecological security in the Yangtze River Delta. Ecol. Indic. 131:108190. doi: 10.1016/j.ecolind.2021.108190
Ma, X. K., Yang, Z. P., and Zheng, J. H. (2022). Analysis of spatial patterns and driving factors of provincial tourism demand in China. Sci. Rep. 12:2260. doi: 10.1038/s41598-022-04895-8
McCool, S. F., and Lime, D. W. (2001). Tourism carrying capacity: tempting fantasy or useful reality? J. Sustain. Tour. 9, 372–388. doi: 10.1080/09669580108667409
Michael, T. (2002). The Saddlepoint approximation of Moran’s I and local Moran’s I lis reference distributions and their numerical evaluation. Geogr. Anal. 34, 187–206. doi: 10.1353/geo.2002.0018
Morrison, P., and Selman, P. (1991). Tourism and the environment: a case study from Turkey. Environmentalist 11, 113–129. doi: 10.1007/BF01266631
Mu, X. Q., Guo, X. Y., Ming, Q. Z., and Hu, C. (2022). Dynamic evolution characteristics and driving factors of tourism ecological security in the Yellow River Basin. Acta Geograph. Sin. 77, 714–735. doi: 10.11821/dlxb202203015
Ness, B., Anderberg, S., and Olsson, L. (2010). Structuring problems in sustainability science: the multi-level DPSIR framework. Geoforum 41, 479–488. doi: 10.1016/j.geoforum.2009.12.005
Paiano, A., Crovella, T., and Lagioia, G. (2020). Managing sustainable practices in cruise tourism: the assessment of carbon footprint and waste of water and beverage packaging. Tourism Manage. 77:104016. doi: 10.1016/j.tourman.2019.104016
Pena-Alonso, C., Ariza, E., Hernandez-Calvento, L., and Perez-Chacon, E. (2018). Exploring multi-dimensional recreational quality of beach socio-ecological systems in the Canary Islands (Spain). Tourism Manage. 64, 303–313. doi: 10.1016/j.tourman.2017.09.008
Peng, J., Yang, Y., Liu, Y., Hu, Y. N., Du, Y., Meersmans, J., et al. (2018). Linking ecosystem services and circuit theory to identify ecological security patterns. Sci. Total Environ. 644, 781–790. doi: 10.1016/j.scitotenv.2018.06.292
Qin, X., and Cheng, Y. (2019). Evaluation and type classification on chinese tourist urban ecological security system: Based on the network deamodel with nodeweight. Scientia Geographica Sinica 39:156–163. doi: 10.13249/j.cnki.sgs.2019.01.018
Qiu, M., Zuo, Q. T., Wu, Q. S., Yang, Z. L., and Zhang, J. W. (2022). Water ecological security assessment and spatial autocorrelation analysis of prefectural regions involved in the Yellow River Basin. Sci. Rep. 12:5105. doi: 10.1038/s41598-022-07656-9
Quevedo, J. M. D., Lukman, K. M., Ulumuddin, Y. I., Uchiyama, Y., and Kohsaka, R. (2023). Applying the DPSIR framework to qualitatively assess the globally important mangrove ecosystems of Indonesia: a review towards evidence-based policymaking approaches. Mar. Pol. 147:105354. doi: 10.1016/j.marpol.2022.105354
Ruan, W. Q., Li, Y. Q., Zhang, S. N., and Liu, C. H. (2019). Evaluation and drive mechanism of tourism ecological security based on the DPSIR-DEA model. Tourism Manag. 75, 609–625. doi: 10.1016/j.tourman.2019.06.021
Sampath, D. M. R., Freitas, J. G., and Dias, J. A. (2022). Extending the DPSIR framework to analyse driver-pressure-state-impact-response of sand dune management in Manawatu-Whanganui (New Zealand) since the 19th century. Ocean Coastal Manag. 230:106348. doi: 10.1016/j.ocecoaman.2022.106348
Sati, V. P. (2018). Carrying capacity analysis and destination development: a case study of Gangotri tourists/pilgrims’ circuit in the Himalaya. Asia Pac. J. Tour. Res. 23, 312–322. doi: 10.1080/10941665.2018.1433220
Shi, X., Zhao, J., and Zhiyun, O. (2006). Assessment of eco-security in the knowledge grid e-science environment. J. Syst. Softw. 79, 246–252. doi: 10.1016/j.jss.2005.04.031
Sun, Y. Y., and Pratt, S. (2014). The economic, carbon emission, and water impacts of Chinese visitors to Taiwan: eco-efficiency and impact evaluation. J. Travel Res. 53, 733–746. doi: 10.1177/0047287513517420
Svarstad, H., Petersen, L. K., Rothman, D., Siepel, H., and Waetzold, F. (2008). Discursive biases of the environmental research framework DPSIR. Land Use Pol. 25, 116–125. doi: 10.1016/j.landusepol.2007.03.005
Tang, C., Wu, X., Zheng, Q., and Lyu, N. (2018). Ecological security evaluations of the tourism industry in ecological conservation development areas: a case study of Beijing's ECDA. J. Clean. Prod. 197, 999–1010. doi: 10.1016/j.jclepro.2018.06.232
Tepelus, C. M., and Córdoba, R. C. (2005). Recognition schemes in tourism─from ‘eco’ to ‘sustainability’? J. Clean. Prod. 13, 135–140. doi: 10.1016/j.jclepro.2003.12.015
Wang, J. F., and Hu, Y. (2012). Environmental health risk detection with GeogDetector. Environ. Model. Softw. 33, 114–115. doi: 10.1016/j.envsoft.2012.01.015
Wang, J. F., and Xu, C. D. (2017). Geodetector: principle and prospective. Acta Geograph. Sin. 72, 116–134. doi: 10.11821/dlxb201701010
Wang, S., Zhang, J., Fan, F., Lu, F., and Yang, L. (2019). The symbiosis of scientific and technological innovation efficiency and economic efficiency in China - an analysis based on data envelopment analysis and logistic model. Technol. Anal. Strateg. Manage 31(1), 67–80. doi: 10.1080/09537325.2018.1485889
Xu, M., Liu, C., Li, D., and Zhong, X. L. (2017). Tourism ecological security early warning of Zhangjiajie, China based on the improved TOPSIS method and the grey GM (1,1) model. J. Appl. Ecol. 28, 3731–3739. doi: 10.13287/j.1001-9332.201711.017
Xu, J., Wang, H. Y., Zhao, K. Y., and Li, Z. (2022). Evaluation of provincial carbon-neutral capacities in the Yellow River basin using DPSIR. Sci. Rep. 12:18180. doi: 10.1038/s41598-022-23105-z
Xu, S. G., Zuo, Y. F., and Zhang, M. (2021). Evaluation of tourism ecological security and diagnosis of obstacle factors in China based on fuzzy object element model. Sci. Geogr. Sin. 41, 33–43. doi: 10.13249/j.cnki.sgs.2021.01.004
Zhao, S., Bai, M., Ruan, M., and Qian, H. (2021). Spatio-temporal Evolution Characteristics and Obstacle Factors of Coordinated Development of Tourism Resources and Ecological Security in Yunnan Province. Scientia Geographica Sinica, 41(1), 493–503. doi: 10.13249/j.cnki.sgs.2021.03.014
Zhang, L. M., Ding, L. Y., Wu, X. G., and Skibniewski, M. J. (2017). An improved Dempster-Shafer approach to construction safety risk perception. Knowledge-Based Syst. 132, 30–46. doi: 10.1016/j.knosys.2017.06.014
Zhang, L. F., Fang, C. L., Zhao, R. D., Zhu, C., and Guan, J. Y. (2023). Spatial-temporal evolution and driving force analysis of eco-quality in urban agglomerations in China. Sci. Total Environ. 866:161465. doi: 10.1016/j.scitotenv.2023.161465
Zhang, G., Liu, Z., and Wang, X. (2013). Analysis and forecast of coupling degree between tourism-oriented development and eco-environment in coastal region of China. Ecol. Environ. Sci. 22, 792–800. doi: 10.12118/j.issn.1000-6060.2020.04.30
Zheng, Q. Q., Chen, Q. H., and Kong, D. Y. (2022). Performance evaluation of the development of eco-cultural tourism in Fujian Province based on the method of fuzzy comprehensive evaluation. Front. Environ. Sci. 10:1022349. doi: 10.3389/fenvs.2022.1022349
Zhong, S. H., Chen, Y. Y., and Miao, Y. J. (2023). Using improved CRITIC method to evaluate thermal coal suppliers. Sci. Rep. 13:195. doi: 10.1038/s41598-023-27495-6
Zhou, J. D., Wang, X. L., Lu, D. L., Dan, S. F., Kang, Z. J., Xu, Y. P., et al. (2022). Ecological security assessment of Qinzhou coastal zone based on driving forces-pressure-state-impact-response (DPSIR) model. Front. Mar. Sci. 9. doi: 10.3389/fmars.2022.1009897
Zhou, B., Yu, H., Zhong, L., and Chen, T. (2016). Developmental trend forecasting of tourism ecological security trends: the case of mount Putuo Island. Acta Ecol. Sin. 36, 7792–7803. doi: 10.5846/stxb201510232147
Keywords: tourism ecological security, DPSIR model, fuzzy matter-element analysis, Geodetector, driving mechanism, Guangxi province
Citation: Liang Y, Liu H, Chiaka JC, Jiang C, Wei N and Liang Y (2023) Spatiotemporal patterns and driving mechanism of tourism ecological security in Guangxi, China. Front. Ecol. Evol. 11:1163498. doi: 10.3389/fevo.2023.1163498
Edited by:
Wei Song, Chinese Academy of Sciences (CAS), ChinaReviewed by:
Kai Liu, Shandong Normal University, ChinaSolomon Tesfamariam, Arba Minch University, Ethiopia
Copyright © 2023 Liang, Liu, Chiaka, Jiang, Wei and Liang. This is an open-access article distributed under the terms of the Creative Commons Attribution License (CC BY). The use, distribution or reproduction in other forums is permitted, provided the original author(s) and the copyright owner(s) are credited and that the original publication in this journal is cited, in accordance with accepted academic practice. No use, distribution or reproduction is permitted which does not comply with these terms.
*Correspondence: Hongying Liu, aG1wbGFuNjEwNUBvdXRsb29rLmNvbQ==; Yihang Liang, eWloYW5nbGlhbmdAZm94bWFpbC5jb20=