 Joseph Jones
 Ewan Hunter
 Bastian Hambach1
 Clive N. Trueman
95% of researchers rate our articles as excellent or good
Learn more about the work of our research integrity team to safeguard the quality of each article we publish.
Find out more
ORIGINAL RESEARCH article
Front. Ecol. Evol. , 13 June 2023
Sec. Ecophysiology
Volume 11 - 2023 | https://doi.org/10.3389/fevo.2023.1161105
This article is part of the Research Topic New Frontiers in the Application of Stable Isotopes to Ecological and Ecophysiological Research View all 16 articles
Introduction: Individual metabolism has been identified as a key variable for predicting responses of individuals and populations to climate change, particularly for aquatic ectotherms such as fishes. Predictions of organism standard metabolic rate (SMR), and the thermal sensitivity of metabolic rate are typically based on allometric scaling rules and respirometry-based measures of respiratory potential under laboratory conditions. The relevance of laboratory-based measurement and theoretical allometric rules to predict performance of free-ranging animals in complex natural settings has been questioned, but determining time averaged metabolic rate in wild aquatic animals is challenging.
Methods: Here we draw on stable isotope compositions of aragonite in fish otoliths to estimate time averaged experienced temperature and expressed field metabolic rate (FMR) simultaneously and retrospectively at an individual level. We apply the otolith FMR proxy to a population of European plaice (Pleuronectes platessa) from the North Sea during a period of rapid warming between the 1980s to the mid-2000s, sampling otolith tissue grown in both juvenile and adult stages.
Results: Among-individual variations in realized mass-specific FMR were large and independent of temperature and scaled positively with body size in adult life stages, contradicting simplistic assumptions that FMR follows scaling relationships inferred for standard metabolic rates (SMR). In the same individuals, FMR in the first summer of life co-varied positively with temperature.
Discussion: We find strong evidence for the presence of consistent metabolic phenotypes within the sampled population, as FMR in the first year of life was the strongest single predictor for among individual variation in FMR at the point of sampling. Nonetheless, best fitting models explained only 20% of the observed variation, pointing to large among-individual variation in FMR that is unexplained by body mass, temperature or metabolic phenotype. Stable isotope-derived estimates of field metabolic rate have great potential to expand our understanding of ecophysiology in general and especially mechanisms underpinning the relationships between animal performance and changing environmental and ecological conditions.
The physiological performance of wild fishes reflects the interaction between the individual phenotype and the availability of resources (Killen et al., 2016; Metcalfe et al., 2016; Duncan et al., 2020). Population growth, size and distribution (and consequently fisheries production) depends on the energetic efficiency with which individuals can acquire and assimilate the available resources (Andersen, 2018). In a changing climate, fish production also depends on the ability of a population to either adapt their physiology to changing conditions or migrate toward more favorable habitats (Dulvy et al., 2008; Perry et al., 2011; Violle et al., 2012; Blowes et al., 2019). The relationship between fish physiology and environmental conditions is inherently complex, drawing on multiple interactive internal and external processes, which are difficult to simulate under laboratory conditions (Jutfelt, 2020; Lindmark et al., 2022). Consequently, attempts to produce field-relevant predictions of how fish performance will respond to environmental change has been a contentiously debated topic within the field of fisheries sciences for several decades (Mieszkowska et al., 2009; Albouy et al., 2013; Halsey et al., 2018; Pauly, 2021).
External water temperature is one of the most commonly measured environmental drivers in fish ecophysiology (Deutsch et al., 2015; Andersen, 2018; Pauly, 2021). The internal body temperature of ectothermic fishes closely matches ambient water temperature, and therefore influences fish physiology directly (Schulte et al., 2011), and through the inverse relationship between temperature and oxygen solubility (Pörtner et al., 2017). Changes in water temperature may produce complex physiological responses, including behavioral changes (e.g., long-distance- or local migratory responses), changes in feeding intensity, activity levels or physiological effects such as metabolic responses or changes to allocation of energy resources (Rijnsdorp, 1990; Murawski, 1993; MacKenzie et al., 2011; Little et al., 2020; McKenzie et al., 2021). Responses are likely to vary depending on the magnitude and rate of experienced temperature variation relative to the long term climate average in the population’s home range (Schulte et al., 2011; Jutfelt, 2020), and are likely to vary locally, e.g., based on the availability of resources (Vinton and Vasseur, 2022). From a physiological perspective, metabolic effects of temperature have received the most attention in terms of attempting to explain fish distributions and predict changes to fish production and distributions under future ocean conditions (Cheung et al., 2013; Petrik et al., 2020; Deutsch et al., 2022).
Metabolic rate represents the sum of all energetic activity in an organism, and is a useful trait as a proxy for whole animal performance (Andersen, 2018). Whole-organism metabolic rate is the combination of the rates of energy-consuming chemical reactions (enzyme-mediated oxidation of food resources), and in ectotherms is directly influenced by the external temperature. At temperatures below an individual’s thermal optimum, metabolism is thought to be limited by the thermodynamics of enzyme kinetic reactions (Ern, 2019). Above the thermal optimum metabolic rates decline with increasing temperature due to either declining performance of enzyme proteins due to structural effects associated with denaturing limiting enzymatic reaction rate (Schulte, 2015; Ern, 2019), or due to limitations on the capacity to acquire, process and distribute resources, especially oxygen, through the body. Thermal response curves for metabolism can be determined under laboratory conditions, and used to infer likely physiological responses to external temperatures, and thus predict spatial distributions of populations (Lamine et al., 2010; Rutterford et al., 2015). Predictions of fish responses to temperature change based on laboratory-determined metabolic performance curves may not however, be directly applicable to in situ fish communities. The realized thermal sensitivity of fish physiological performance in wild conditions reflects a combination of direct thermodynamic effects on reaction rates, limitations to performance from capacity to supply oxygen and nutrients, and behavioral energetic trade-offs, all moderated through the phenotypic and genotypic adaptive capacity of the population (Skelly et al., 2007; Hofmann and Todgham, 2010; Healy and Schulte, 2012; Norin et al., 2014; Holt and Jørgensen, 2015).
Teleost fish also typically increase body size over orders of magnitude during growth, with strong selection pressure acting to maximize growth in early life, but less in later life. Changes in energy allocation across life stages could potentially induce ontogenetic differences in the thermal sensitivity of field metabolic rate across life history stages in an individual fish (Andersen, 2018; Dahlke et al., 2020). Laboratory studies have suggested higher thermal sensitivity for metabolic rates in early juvenile life stages of fishes (Dahlke et al., 2020), potentially linked to observed reduction in thermal tolerance limits associated with increased activity (Deutsch et al., 2020). To better understand population dynamics, and improve predictions of the responses of wild fish populations under rising seawater temperatures, we need to understand how in-situ energy use varies with temperature and with life stage. Specifically, we need to identify if field metabolic rate (FMR), the energetic response of the entire organism to the physical and ecological environment) varies with temperature in a similar manner to laboratory-based measurements of metabolic rate, as predictive models use respiratory potential data to estimate biogeography.
Field metabolic rate is arguably the most ecologically relevant measure of energy consumption (Speakman, 1999; Pontzer et al., 2021), but has proven challenging to estimate especially in aquatic organisms (Payne et al., 2016; Treberg et al., 2016). Where direct calorimetry is impractical, metabolic rate is typically inferred from the rate of consumption of oxygen or of production of carbon dioxide, both of which can be traced via isotopic labeling of oxygen and hydrogen (Speakman, 1998) or carbon (Welch et al., 2016; Urca et al., 2021). Where natural isotope compositions of metabolic and environmental sources differ either for oxygen or carbon, there is potential to infer rates of oxidation of dietary substrates (and production of carbon dioxide) from isotope markers expressed in tissues. Drawing on natural isotope markers has the advantage that no prior intervention is needed, and all individuals are effectively labeled naturally. Here we apply an emerging method for deriving simultaneous estimates of experienced temperature and expressed field metabolic rate from the stable isotope composition of carbon and oxygen in otolith aragonite (Chung et al., 2019a,b; Martino et al., 2020).
Oxygen in otolith aragonite is deposited at, or close to, isotopic equilibrium with the ambient water, with a temperature-dependent fractionation such that the temperature of otolith precipitation can be estimated from knowledge of the isotopic compositions of the ambient water and the otolith (Campana and Thorrold, 2001). Carbon in otolith aragonite is not in isotopic equilibrium with the surrounding dissolved inorganic carbon (DIC) (Kalish, 1991; Gauldie, 1996; Solomon et al., 2006). Rather, carbon in the blood is a mixture of carbon derived from dissolved inorganic carbonate and carbon released from respiration of food. The stable isotope composition of these sources is very different: seawater carbon (δ13Csw) values typically range between c.1 and −7% globally, while respiratory carbon (δ13Cresp) values generally vary between c. −10 to −25% in marine fishes. Otolith carbonate biomineral is formed from a mixture of these sources of HCO3– ions transported from blood into the biomineralising medium (endolymph fluid within the inner ear sacculus). The isotopic composition of inorganic carbon in blood, the endolymph fluid and otolith aragonite mineral is a weighted average of the relative contribution of respiratory carbon and seawater dissolved carbon (McConnaughey et al., 1997; Schwarcz et al., 1998; Solomon et al., 2006; Tohse and Mugiya, 2008). Critically, blood carbonate levels must be regulated to maintain optimum pH, therefore as the rate of respiration of food sources increases, the relative proportion of respiratory carbon in blood increases (Chung et al., 2019a). The proportion of respiratory carbon in otolith aragonite (otolith Cresp) can be determined from isotopic mass balance given estimates of the isotopic composition of diet and seawater carbon sources, providing a proxy measure of FMR averaged over the timeframe of otolith growth (Weidman and Millner, 2000; Jamieson et al., 2004; Trueman et al., 2013; Sinnatamby et al., 2015; Trueman et al., 2016).
The relationship between Cresp values and oxygen consumption rates can be estimated in laboratory experiments, using temperature to manipulate metabolic rates (Chung et al., 2019b; Martino et al., 2020). Experiments to date suggest an exponential limited relationship between Cresp values and oxygen consumption rates (Chung et al., 2019a; Martino et al., 2020) however, it is likely that the non-linear portion of the relationship (at high induced metabolic rates) is influenced by experimental artifacts associated with metabolic demands other than SMR contributing to oxygen consumption at high temperatures (Alewijnse, 2022). Many studies have demonstrated relationships between δ13C values of otoliths and relative metabolic rates (Kalish, 1991; Weidman and Millner, 2000; Sherwood and Rose, 2003; Nelson et al., 2011; Trueman et al., 2013; Sinnatamby et al., 2015; Alewijnse et al., 2021; Smoliński et al., 2021; Sakamoto et al., 2022), but to date, few studies have explored individual-level variations in expressed field metabolic rates within a single population. In this study we use otolith isotope-derived estimates of field metabolic rate to quantify the relationship between experienced temperature and expressed field metabolic rate across life stages in a single population of free-roaming wild fish.
The European plaice Pleuronectes platessa (henceforth, plaice) is an abundant north east Atlantic flatfish which supports an extensive fishery throughout the North Sea and surrounding areas. The fishery has existed in some form for hundreds of years, and has been commercially monitored from the 1800s. Otoliths are routinely removed from North Sea plaice for age and growth studies, and the UK fisheries laboratory CEFAS have maintained an otolith archive with (incomplete) sampling dating to the early 1900s. Due to their commercial value, plaice have been well- studied (Engelhard et al., 2011; Rutterford et al., 2023), with annual fisheries surveys [ICES, (Datras: Survey descriptions, accessed 2023)] estimating mortality and stock spawning biomass. Extensive data on plaice biology, behavior and population structure within the North Sea coupled with the availability of otolith archives, make North Sea plaice attractive as a model species.
Plaice otoliths were obtained from archived otolith collections held in the CEFAS fisheries otolith archive. Plaice were sampled from research fishery cruises conducted as part of ICES co-ordinated bottom trawling surveys in the North Sea. Otolith selection was designed to capture seasonal variations and potential differences between years with warm and cold mean water temperatures. Fish sampled were caught in each of four fishing monthly quarters and from North Sea ICES areas IVB and IVC (Figure 1A). Otoliths were selected from survey years with high sample coverage (Table 1). To minimize age-dependent metabolic variability and sample fish with a relatively high growth rate and therefore larger volumes of otolith available for sampling, sample selection targeted individuals assessed to have been spawned 4 years prior to capture. All otoliths were pre-aged by CEFAS otolith readers.
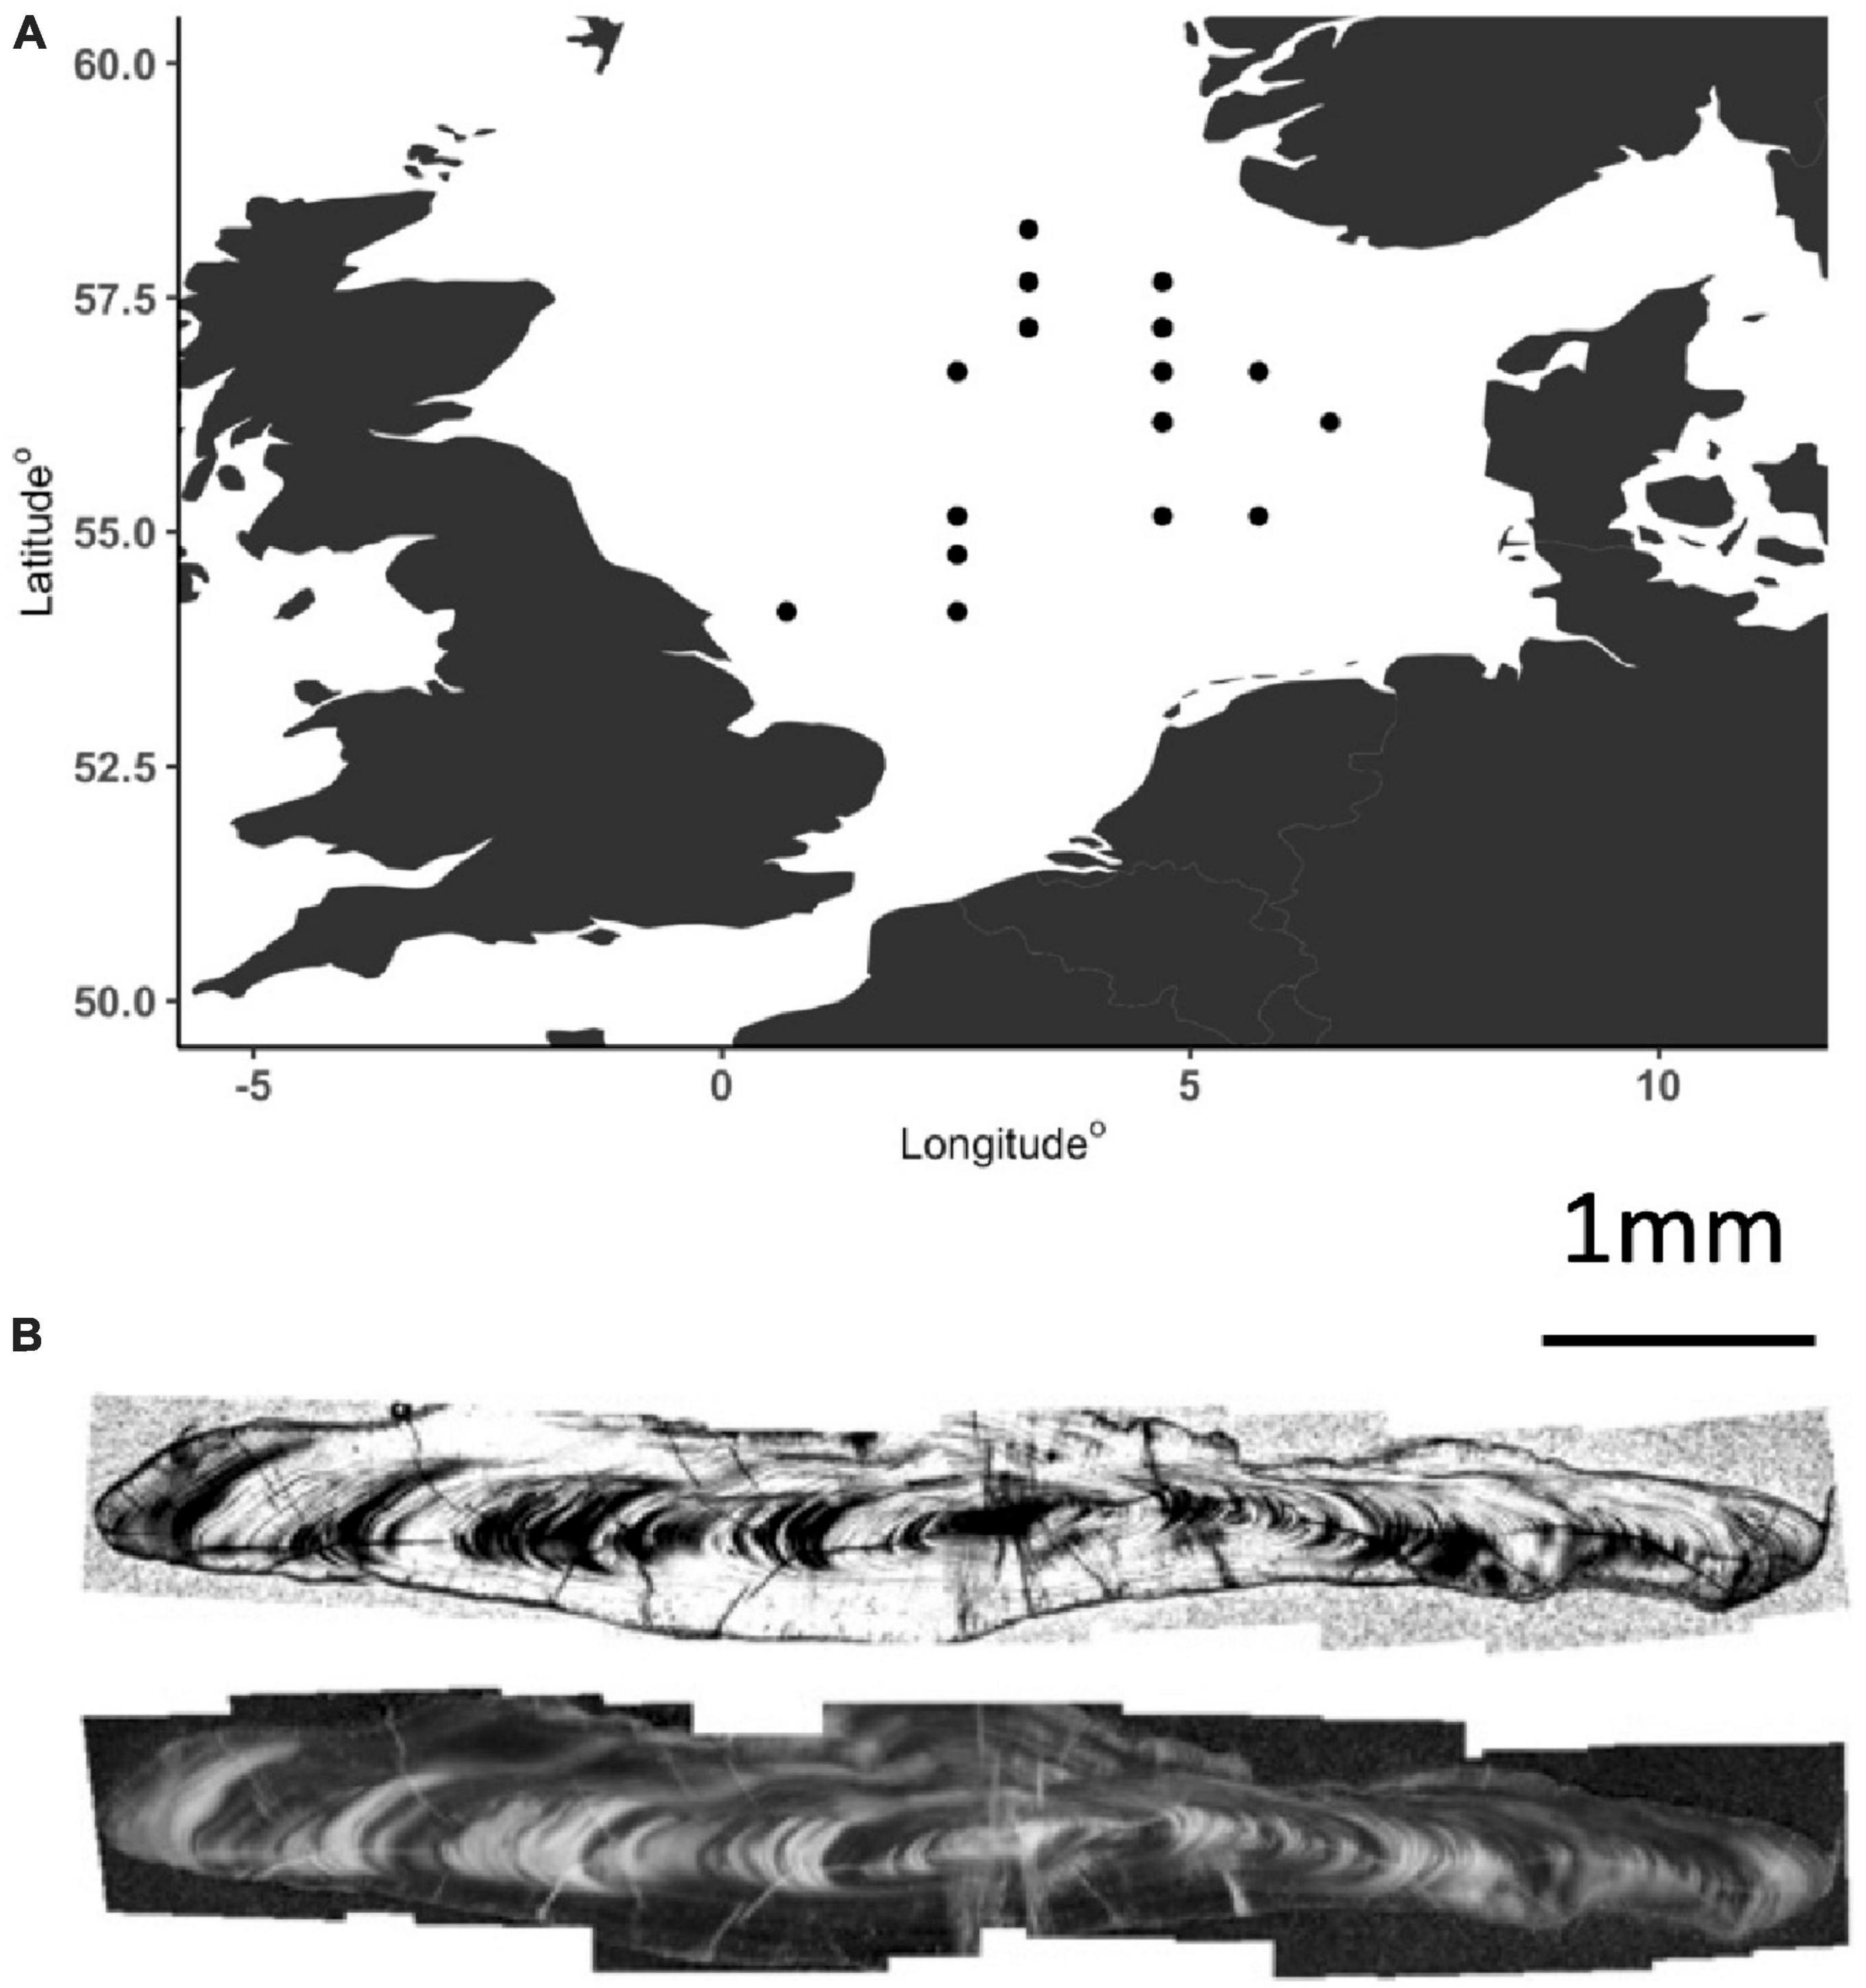
Figure 1. (A) Sample capture locations for fish. (B) Longitudinal section through a plaice otolith viewed with transmitted light and the same image with enhanced contrast.
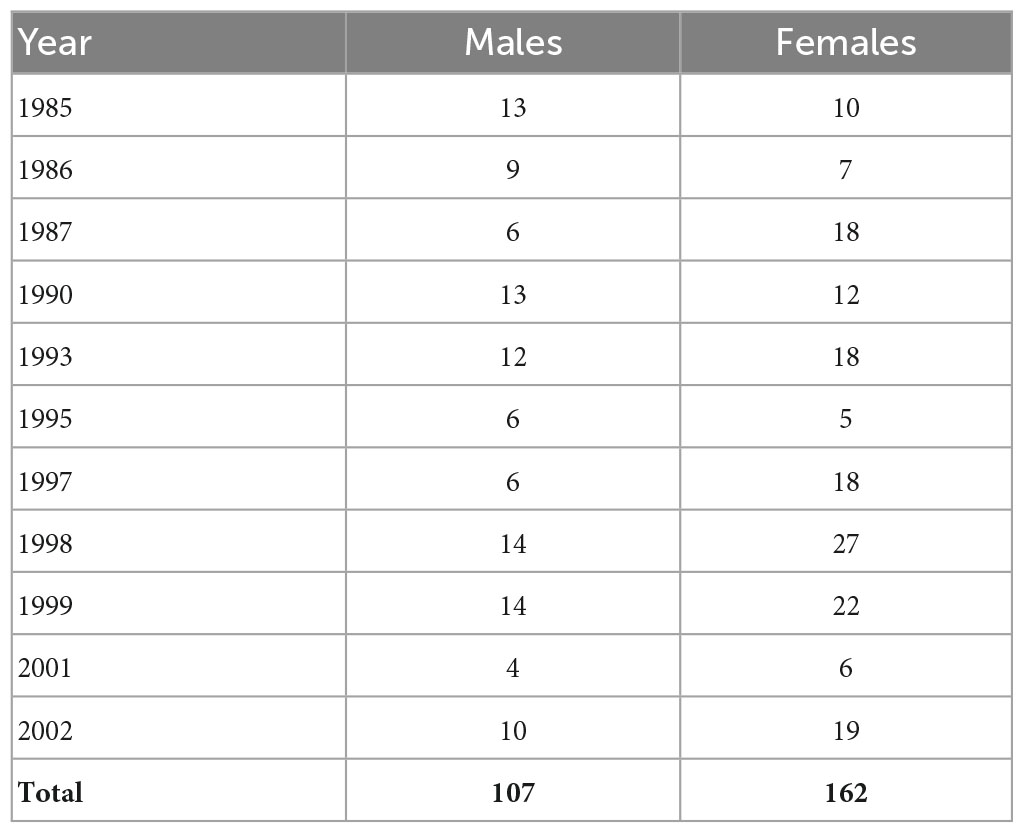
Table 1. Numbers of sampled male and female plaice assigned to sub-group A and used for subsequent analyses.
Annual average water temperature in the North Sea experienced a significant period of warming within ICES areas IVB and IVC between 1980 and 2010 (Núñez-Riboni and Akimova, 2015), otoliths were therefore selected from years reflecting colder (pre 1990) and warmer (post 1990) periods as well as periods with relatively high and low plaice abundance. The full list of ICES rectangles sampled and individual distribution across each quarter is provided within the Supplementary Material. The sample years selected were 1984, 1985, 1986, 1987, 1990 1993, 1995, 1997, 1998, 1999, 2001, and 2002. In total, 558 individual otolith samples were selected and analyzed, this sample suite was restricted to fish inhabiting high salinity waters (see below).
The otolith preparation protocol followed previous work (Shephard et al., 2007; Chung et al., 2019b; Alewijnse et al., 2021). Otolith sampling was designed to provide sufficient powder while averaging over the smallest time interval possible, targeting the regions of fastest growth of the otolith. Initially otoliths were cleaned with fresh water to remove any residual tissue, and fixed to an epoxy (Struers EopFix resin) mount with the proximal (sulcus) surface uppermost. The external otolith surface area representing the most recent period of aragonite deposition was then sampled using a Dremel 4,000 rotary engraving tool, with straight sided, cylindrical diamond-encrusted dental bits. Milling aimed to remove a target mass of c.50 μg of aragonite powder. Following external edge sampling, a subset of 101 otoliths were sectioned to approximately 20 micron thickness at the University of Southampton Rock Preparation and Thin-Sectioning Laboratories (National Oceanography Centre, UK). Otolith sections were used to visually estimate the depth of external milling and therefore the time period of sampled otolith growth over which FMR and temperature is integrated, and to provide access to the first year of growth for analyses of FMR and temperature during juvenile life stages (Figure 1B). Otolith growth representing the second half of the first year of life was sampled using an ESI New Wave Micromill either by milling trenches or from multiple drill holes. The time integrated period for juvenile otolith sampling was kept to a minimum, estimated from otolith growth analyses to represent a maximum period of a month.
The stable isotope compositions of carbon and oxygen in otolith aragonite were measured at the Stable Isotope Ratio Mass Spectrometry (SIRMS) Laboratory (University of Southampton, National Oceanography Centre, Southampton, UK), with a Kiel IV Carbonate Device coupled with a MAT253 isotope ratio mass spectrometer (both Thermo Fisher Scientific, Bremen, Germany). Approximately 20–70 μg of aragonite powder was accurately weighed into borosilicate glass reaction vessels prior to evolution of CO2 through reaction with 106% phosphoric acid at a constant 70°C temperature. The calibration standards used were NBS 19 and NBS 18 (IAEA, Vienna, Austria), as well as a quality control GS1 (Internal Carrara marble standard produced by the SIRMS laboratory). Results are reported as δ13C and δ18O values in permille (‰) units relative to Vienna Pee Dee Belemnite. Accuracy and precision determined from long-term analyses of internal carbonate standards of known composition is 0.02% for both δ13C and δ18O values in otolith aragonite. Standard deviations of repeated measures of δ13C and δ18O values in internal standards in each run contributing to the results discussed here are presented in the Supplementary Materials.
We estimated the proportion of respiratory carbon in otolith aragonite (Cresp) from a two-component mixing model (Chung et al., 2019a):
where δ13Coto represents the δ13C value of the sampled otolith aragonite, δ13CDIC represents the δ13C value of dissolved inorganic carbon in seawater, and δ13C values δ13Cdiet represents the δ13C value of individual diet (Chung et al., 2019a). δtotal is the total isotopic fractionation from DIC and diet to blood, blood to endolymph and endolymph to otolith (Solomon et al., 2006). The absolute value of δtotal may vary among species (Solomon et al., 2006; Tohse and Mugiya, 2008; Nelson et al., 2011; Smoliński et al., 2021), and requires further laboratory experimentation to calculate. Within this study, we assume that δtotal does not vary systematically among individuals of the same species and is set to 0 (Solomon et al., 2006; Chung et al., 2019a). δ13Cdiet values were estimated based on 72 individual plaice within a compilation of stable isotope data from fishes from the North Sea (Jennings and Cogan, 2015), with data from plaice ranging from −19.4 to −14.5%, averaging −16.8%.
δ13CDIC values across the North Sea are relatively positive compared to average seawater (Burt et al., 2016), likely reflecting intense photosynthetic production. We drew on these data to estimate a median likely δ13CDIC value of c. 1% and applied an uncertainty (standard deviation) of 0.25% to this value. We estimated uncertainty associated with mass balance solutions for Cresp values (equation 1) from 100 Monte Carlo resampling rounds with applied uncertainties and resulting parameter uncertainty estimates presented in Table 2.
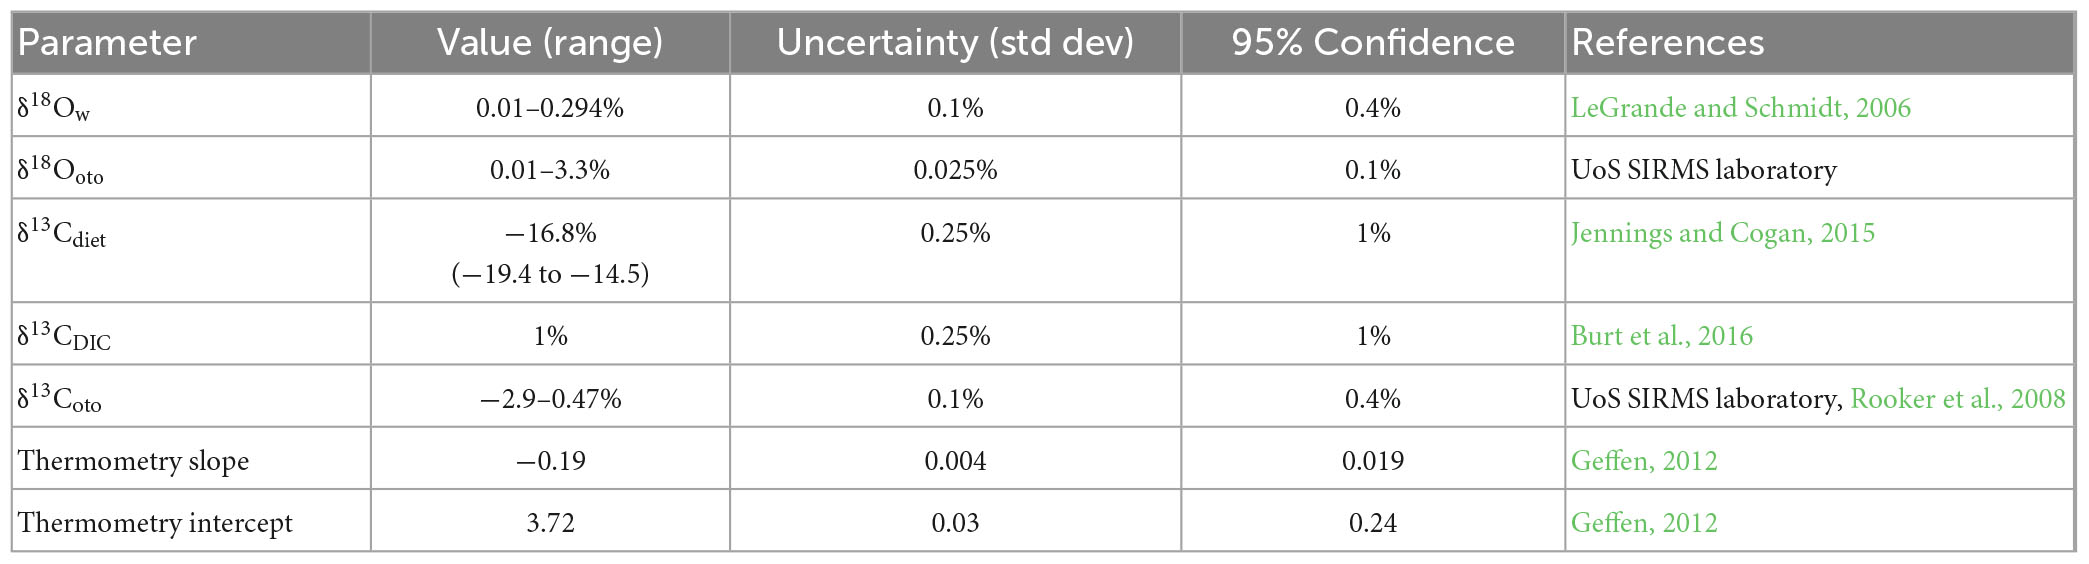
Table 2. Parameter values, uncertainties and sources employed in Monte Carlo resampling to estimate uncertainties in inferred temperatures and Cresp values.
To assist with comparisons with alternative measures of metabolic rate, the Cresp expression was converted into oxygen consumption rate based on the linear form of a statistical relationship between measured oxygen consumption associated with resting (fed) metabolic rate and Cresp values in juvenile cod (Chung et al., 2019a).
This experimental calibration above is based on the observed relationship between Cresp and resting metabolic rate in 80 individual cod assigned to 4 experimental temperatures.
Time averaged experienced temperature was reconstructed using a species-specific otolith isotope temperature equation (Geffen, 2012):
δ18O values of ambient sea water (δ18Ow) vary largely according to salinity, as freshwater inputs have lower δ18Ow values than seawater. In the North Sea salinity varies considerably in space and time, complicating the use of oxygen isotope thermometry (see below. δ18Ow values of the ambient sea water were initially estimated from LeGrande and Schmidt (2006), with model outputs presented in Figure 2. The location (and therefore expected δ18Ow values) experienced by individuals in the first year of life are unknown, but the sampled population spawns in the central North Sea, with juveniles unlikely to experience the relatively low salinity conditions seen in the extreme south-eastern North Sea. To infer experienced temperatures during juvenile life stages we assume a δ18Ow value of 0.1% ± 0.2% (Table 2).
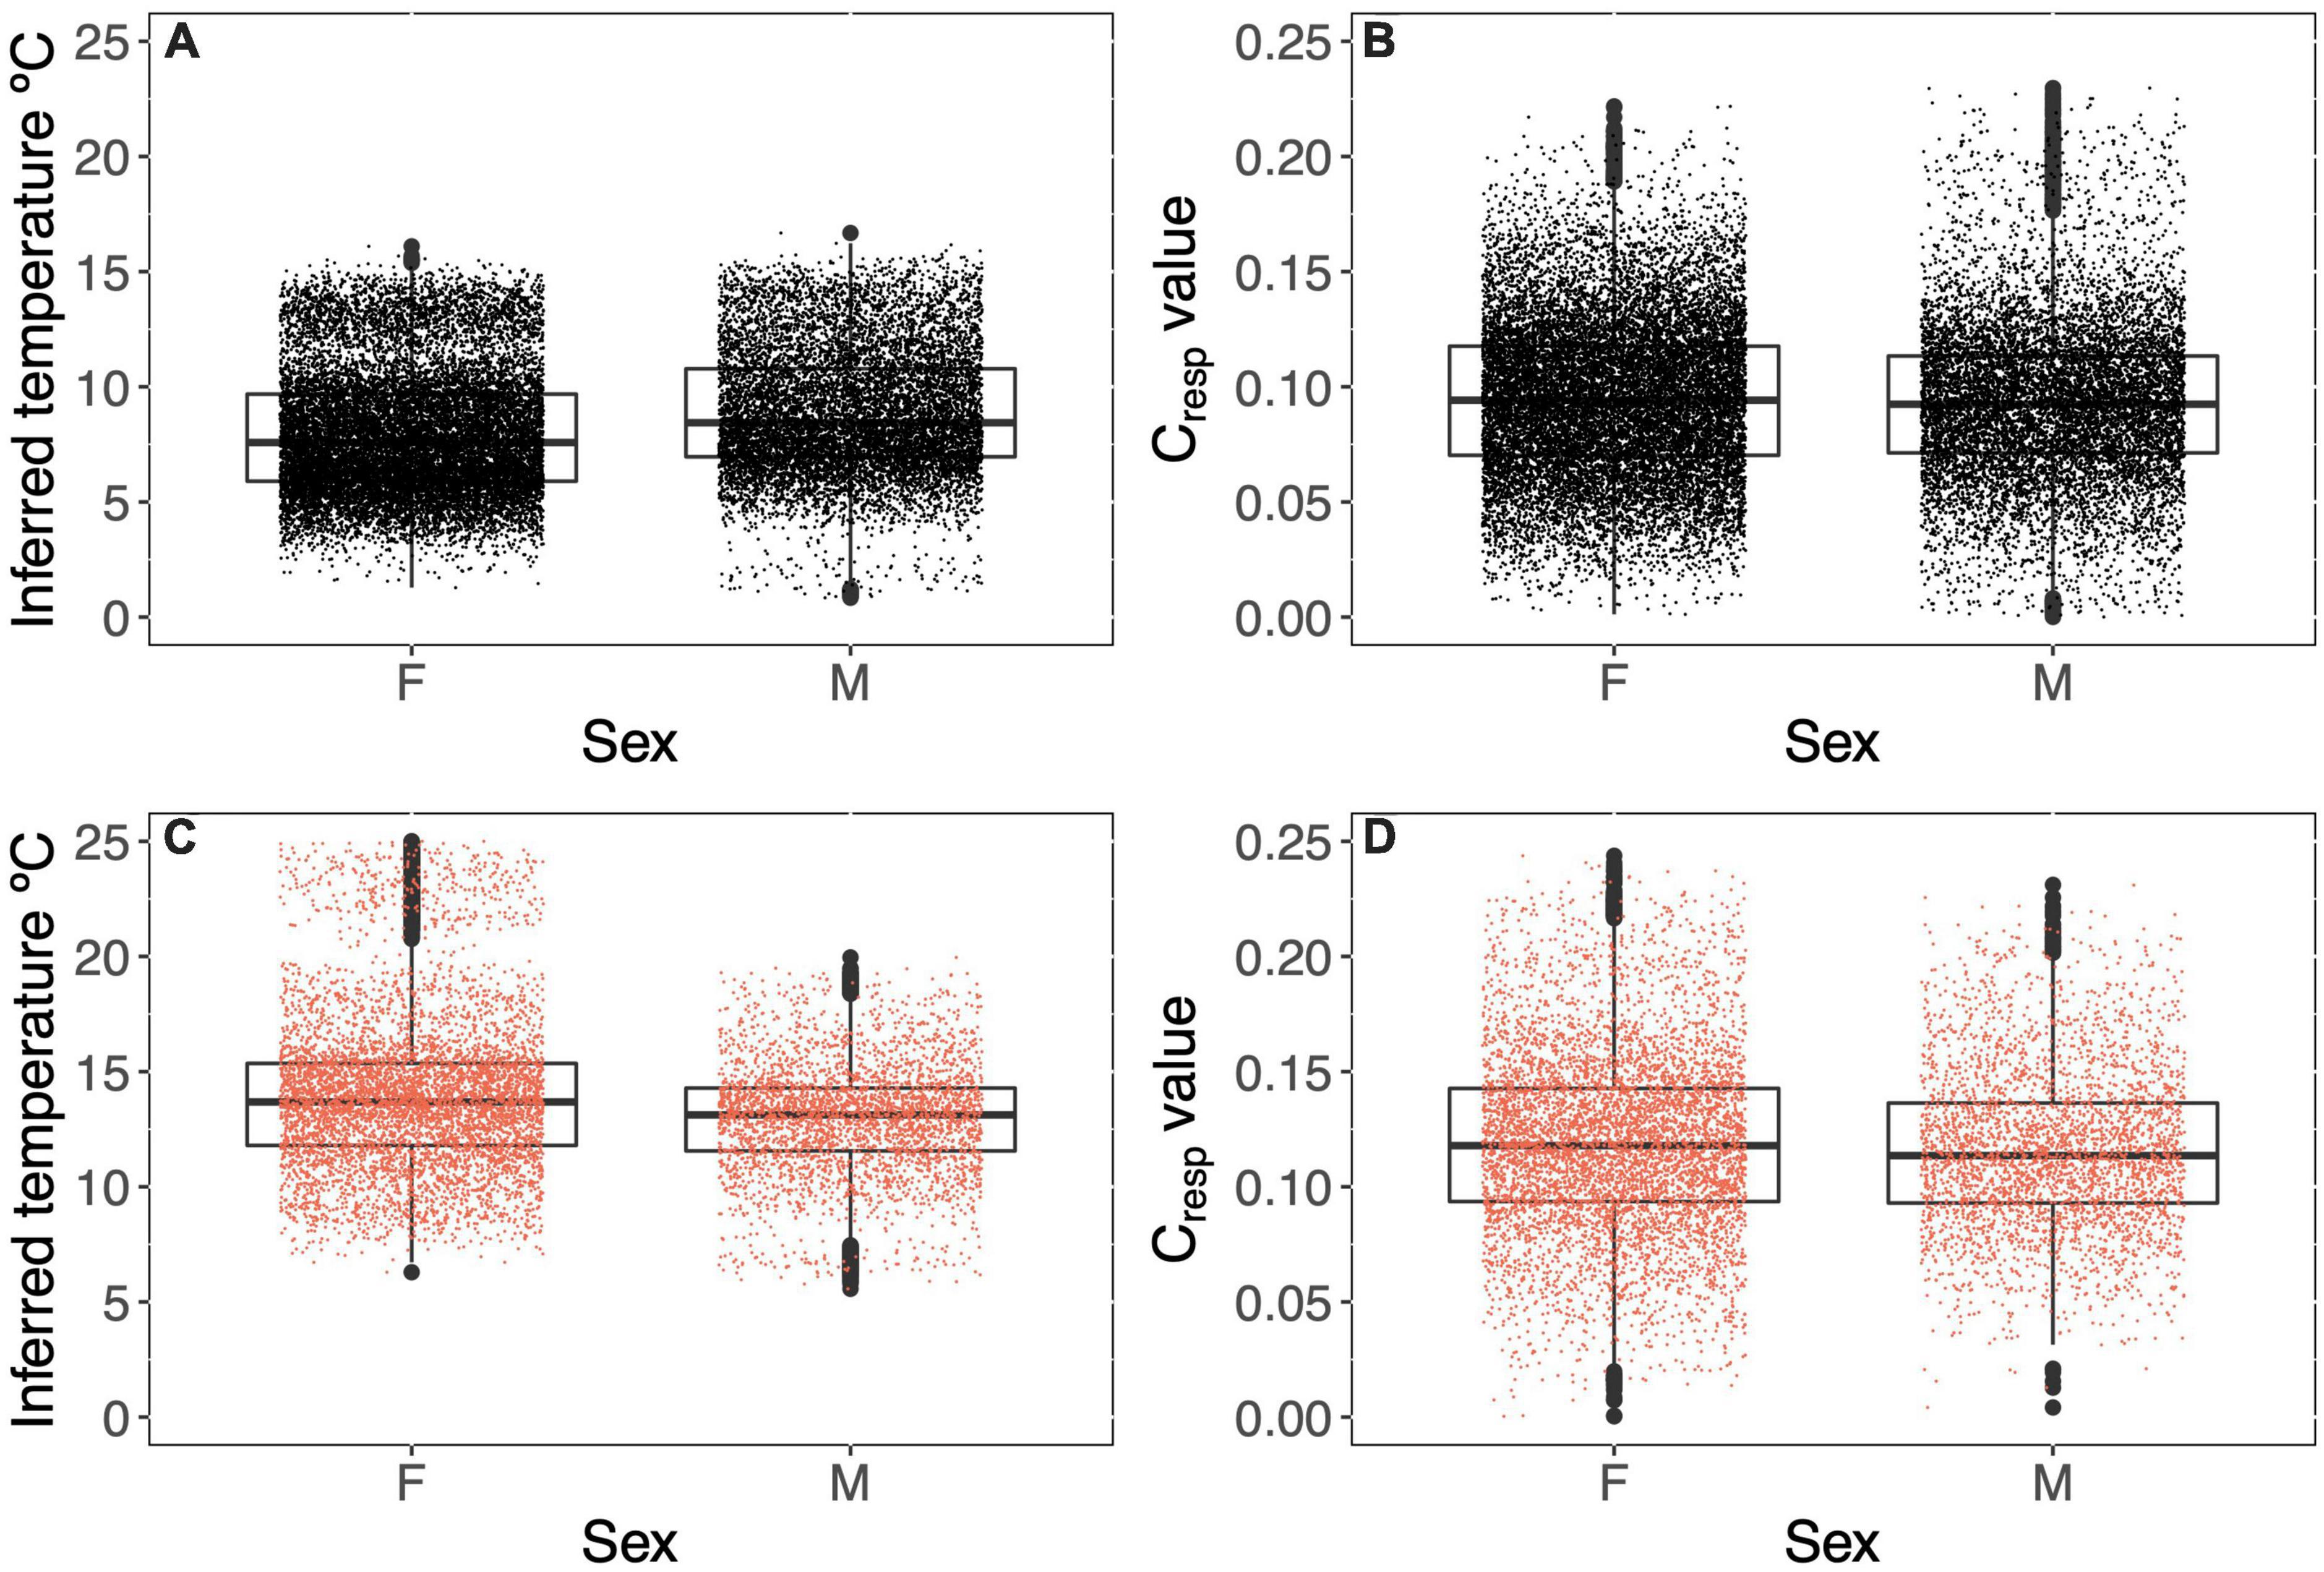
Figure 2. Otolith-inferred temperatures (A,C) and Cresp values (B,D) experienced by sampled plaice at the point of capture as adults (A,B, black points) and during the first summer of life (C,D, red points). Points represent Monte Carlo resampling of the 281 (A,B) and 95 (C,D) otoliths.
Plaice in the North Sea are divided into three groups based primarily on summer feeding locations, and the three groups experience differing and variable salinity environments, resulting in characteristic combinations of δ18Ooto values and water temperature (Darnaude et al., 2014). Of the three identified groups, group (A) experiences the least variable water conditions with fluctuations in δ18Ow values limited to less than 1.5‰ (reflecting salinities between 34.5 and 36%). We therefore aimed to target individuals from group A for subsequent analyses and developed a sample selection pipeline as follows based on information in Darnaude et al. (2014): Individuals captured north of 56oN are likely to belong to group A, and are therefore included, however, individuals from populations B or C could potentially have recently moved north of 56°N. We therefore excluded data from any fish captured N of 56°N which expressed reconstructed temperatures values (>14°C), as this would imply recent movement from waters with low salinity and/or low δ18Ow values. Similarly, population A fish recently moving south of 56°N would be expected to express anomalously high δ18Ooto values, reflecting cold and saline water. We therefore included individuals caught at latitudes lower than 56°N, but with δ18Ooto values in excess of 2.3% (Darnaude et al., 2014).
The relationship between oxygen consumption, experienced temperature (as inferred from δ18O data), weight, sex and year of sampling was investigated using linear mixed effects modeling. Sex and year were treated as random effects. All continuous variables were z-scored prior to modeling. REML structure was applied to all linear mixed effects models. The potential influence of within-individual metabolic phenotype was explored by adding oxygen consumption at year 1 as an additional fixed effect. Linear mixed effects models were performed in R using the “lme4” package and models were compared using AIC values.
A total of 95% confidence intervals in estimates of experienced temperature and Cresp values were calculated as 4× the mean standard deviation over the 100 Monte Carlo resampled values drawing on estimates of uncertainty in source values expressed in Table 2. Uncertainties were estimated for individuals identified as belonging to population A. Estimated 95% confidence intervals were 2.4°C for experienced temperature and 0.05 in Cresp values (translating to an 95% confidence interval in individual oxygen consumption rates of 57 mgO2–1Kg–1hr–1).
We successfully recovered stable isotope data from 459 individual fish. From the overall sampled population, 269 fish were assigned to population A with known sex. The distribution of samples throughout sexes and years is presented in Table 1. From these, 101 fish were selected at random, sectioned and sampled to recover δ18O and δ13C values representing growth in the first summer of life, resulting in data successfully recovered from 95 individuals.
The time period integrated during milling will vary according to seasonal changes in otolith growth rate, and was estimated from thin sectioned otoliths. Where the sampled zone was clearly visible within thin section as a trench, the time period over which isotopic values are averaged was estimated to the nearest month based on the relative depth of sampled trench and distance from the intact edge of the otolith to the last annulus. Average estimated sampling duration by month of capture ranged between 1 and 2.3 months with longer time integration periods in winter months. Sampling of otolith growth during the first year of life targeted the first translucent band (representing the first summer of life). The time integration period for first year sampling is estimated to be 1 month.
Time averaged experienced temperature reconstructed from δ18O values of the otolith outer edge ranged between 1.38 to 17.29°C with an average of 8.02°C (Figures 2A, C and Table 3). These values are consistent with previous estimates of experienced temperature for North Sea plaice ranging between 4 and 14°C over the annual cycle (Darnaude et al., 2014). We found no significant difference in experienced temperature between sexes (Kruskal–Wallis t = 0.4).
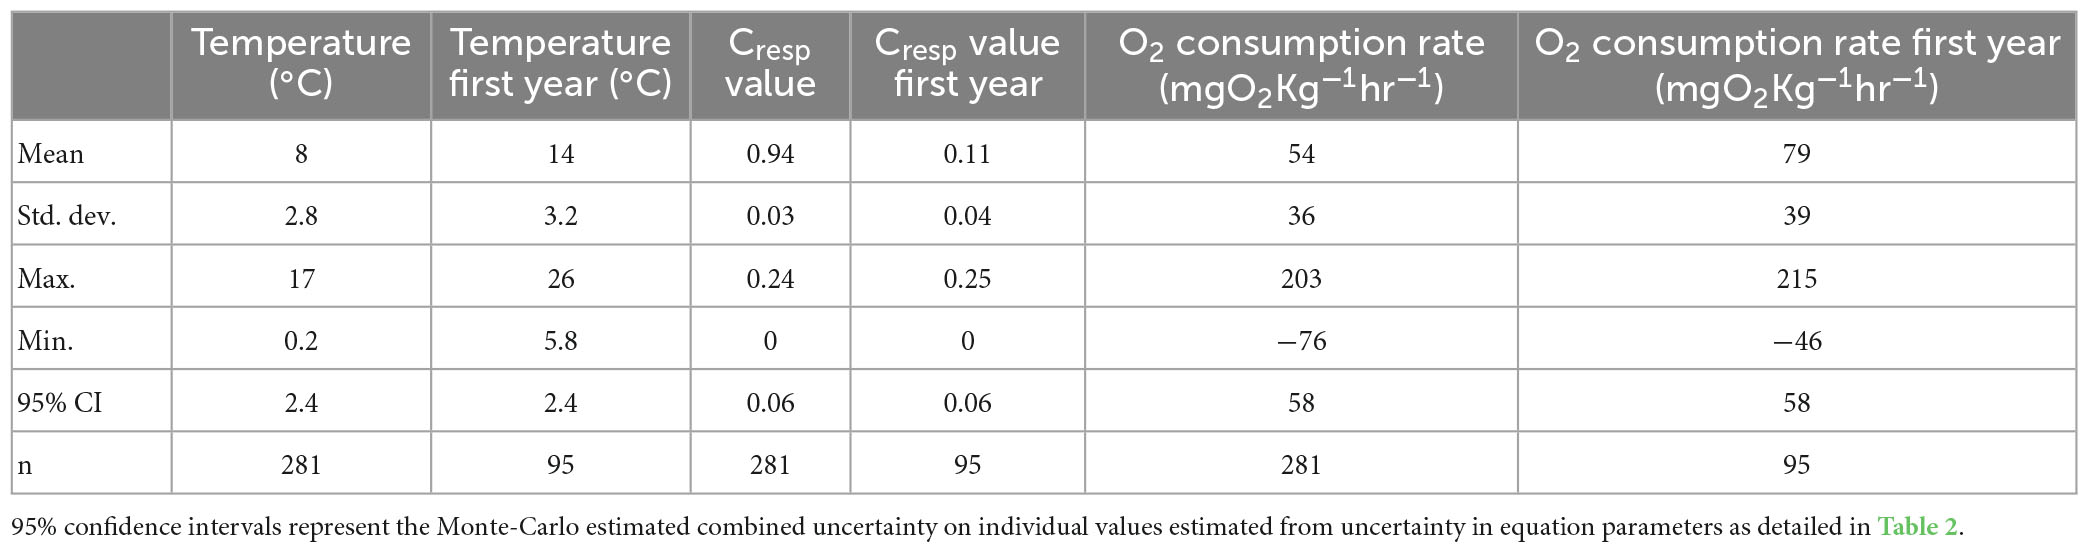
Table 3. Summary statistics for estimated experienced temperatures, Cresp values and inferred oxygen consumption rates for plaice otoliths sampled to reflect conditions at the point of capture and in the first year of life.
The time integrated experienced temperature during the second half of the first year of life of 95 individuals ranged between 5.8 and 26°Cwith an average of 14°C (+−3.2). These temperatures are comparable to sea surface temperatures seen in the Wadden Sea and German Bight, which typically range between 2 and 20°C (Núñez-Riboni and Akimova, 2015). We saw no difference in experienced temperature between sexes (Kruskal–Wallis p-value of 0.481) or among years (Kruskal–Wallis p-value of 0.48).
Adult Cresp values range between 0.03 and 0.22, with an average of 0.12. There is no significant difference between adult Cresp values by sex with a Kruskal–Wallis p-value of 0.481, or between sample years, with a Kruskal–Wallis p-value of 0.134. These Cresp values are consistent with data from other pleuronectiformes (Alewijnse, 2022), suggesting relatively low field metabolic rates for this order compared to other sampled teleosts when body mass and temperature are controlled.
Inferred mass-specific oxygen consumption rates ranged between 0 and 203 mgO2–1Kg–1hr–1, averaging 54 mgO2–1Kg–1hr–1 (Figures 2B, D and Table 3). Estimated oxygen consumption rates inferred within this study are similar to standard metabolic rates based on laboratory respirometry, and are therefore lower than expected. However, we are unsure of the appropriate parameters used to convert Cresp values to oxygen consumption for plaice without prior experimentation, therefore we are drawing on calibration parameters derived for Atlantic cod. Oxygen consumption rates in plaice measured via respirometry in laboratory conditions range between 13 and 202 mgO2–1Kg–1hr–1over comparable temperatures (5–20°C) and body masses (27–632 g) as the samples presented within this study (data compiled from Fish base).
Cresp values expressed during the first year of life in individuals from sub-population A range between 0 and 0.25 with an average of 0.1. There is no expressed significant difference in Cresp values between sexes during juvenile life stages (Kruskal–Wallis p-value = 0.481). When comparing years there is a significant difference, with a Kruskal–Wallis p-value of 0.0161, and years with warmer average temperatures resulting in higher Cresp averages for juvenile populations.
Mass-specific basal (standard) metabolic rate is expected to decrease with body mass and to increase with temperature. We drew on linear mixed effects models to assess the potential effect of temperature and body mass on expressed field metabolic rates. The full model structure used to explore variations in adult oxygen consumption rate was:
The retrospective nature of otolith analyses allows us to test for a potential effect of individual metabolic phenotype. We included oxygen consumption in the first year as an additional explanatory variable and compared the two model performance using AIC scores:
The model with FMR in the first year of life included as a fixed effect performed better (AIC −5,505 compared to −4,260). We estimated the goodness of fit drawing on marginal and conditional R2 values (Nakagawa and Schielzeth, 2013), as implemented in the MuMIn package (Bartoń, 2023). The full model explained approximately 20% of the total among-individual variance in FMR, with fixed effects accounting for 11% of the total variance. By contrast, the model without FMR in the first year of life explained 12% of the total variation in among individual FMR, and fixed effects accounted for only 4% of variance. A summary of model outputs is provided in Tables 4, 5. We further explored the relationship between FMR at year 0 and FMR at year 4 by comparing residuals from the relationships between FMR and temperature (age 0) and body mass (Age 3–6). Residuals were positively correlated, and variation in temperature-corrected FMR at age 0 explained c. 20% of the expressed variation in among mass-corrected FMR at age 3–6 (Figure 3).
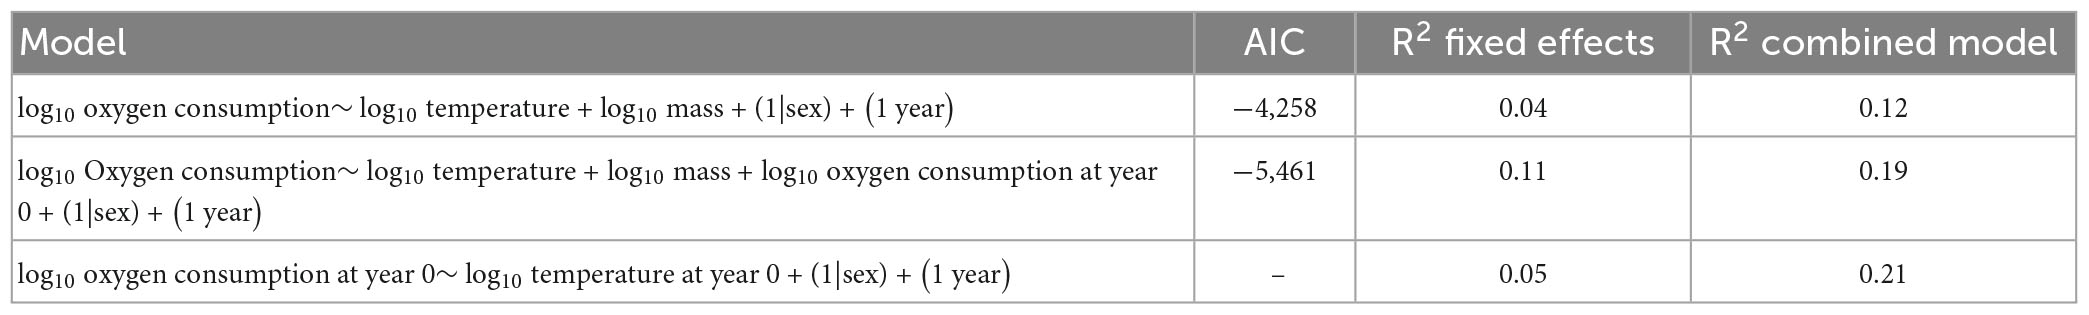
Table 4. Model fits for linear mixed effects model. Marginal (combined) and conditional (fixed) R2 values (Nakagawa and Schielzeth, 2013) were determined using the MuMIn package (Bartoń, 2023).
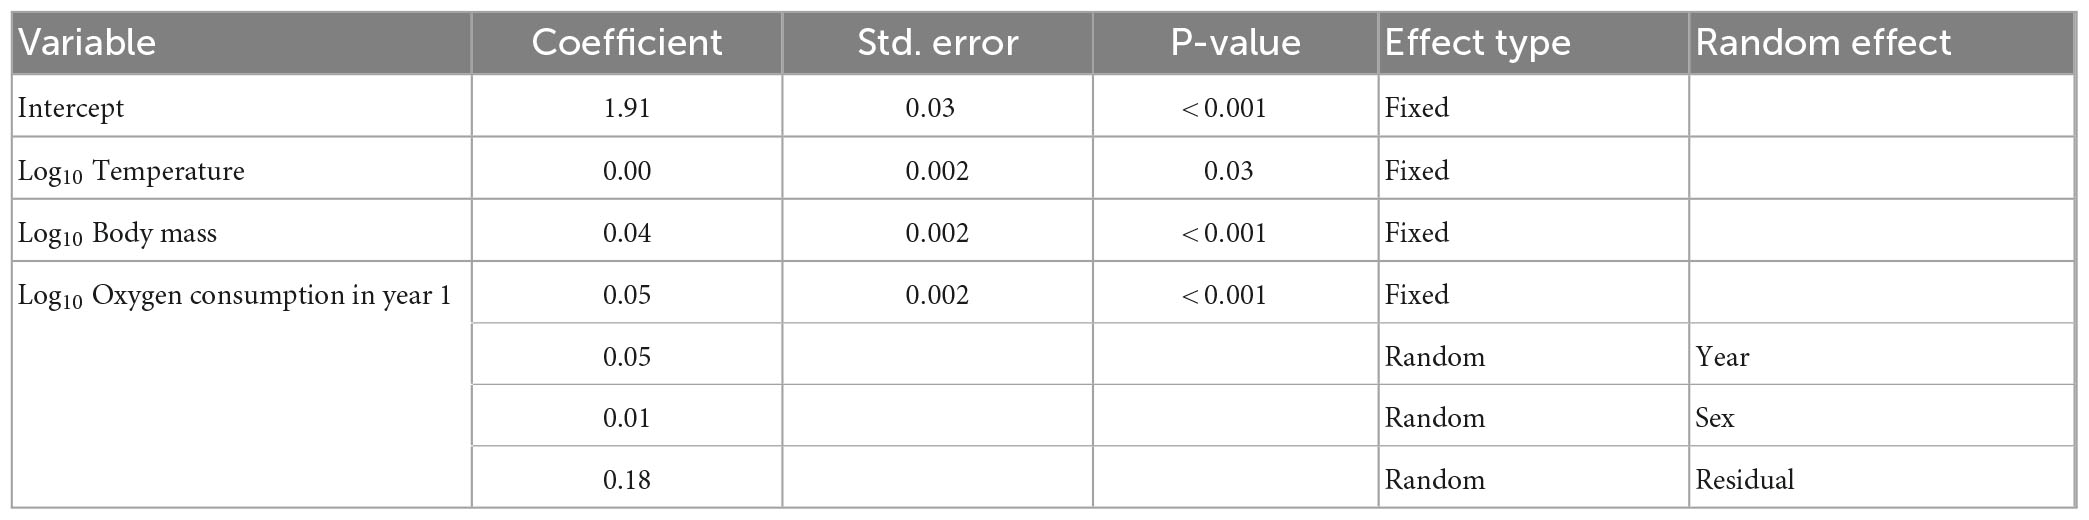
Table 5. Parameter terms from the best fitting mixed effects model (Equation 5), Parameter effects visualized in Figure 3.
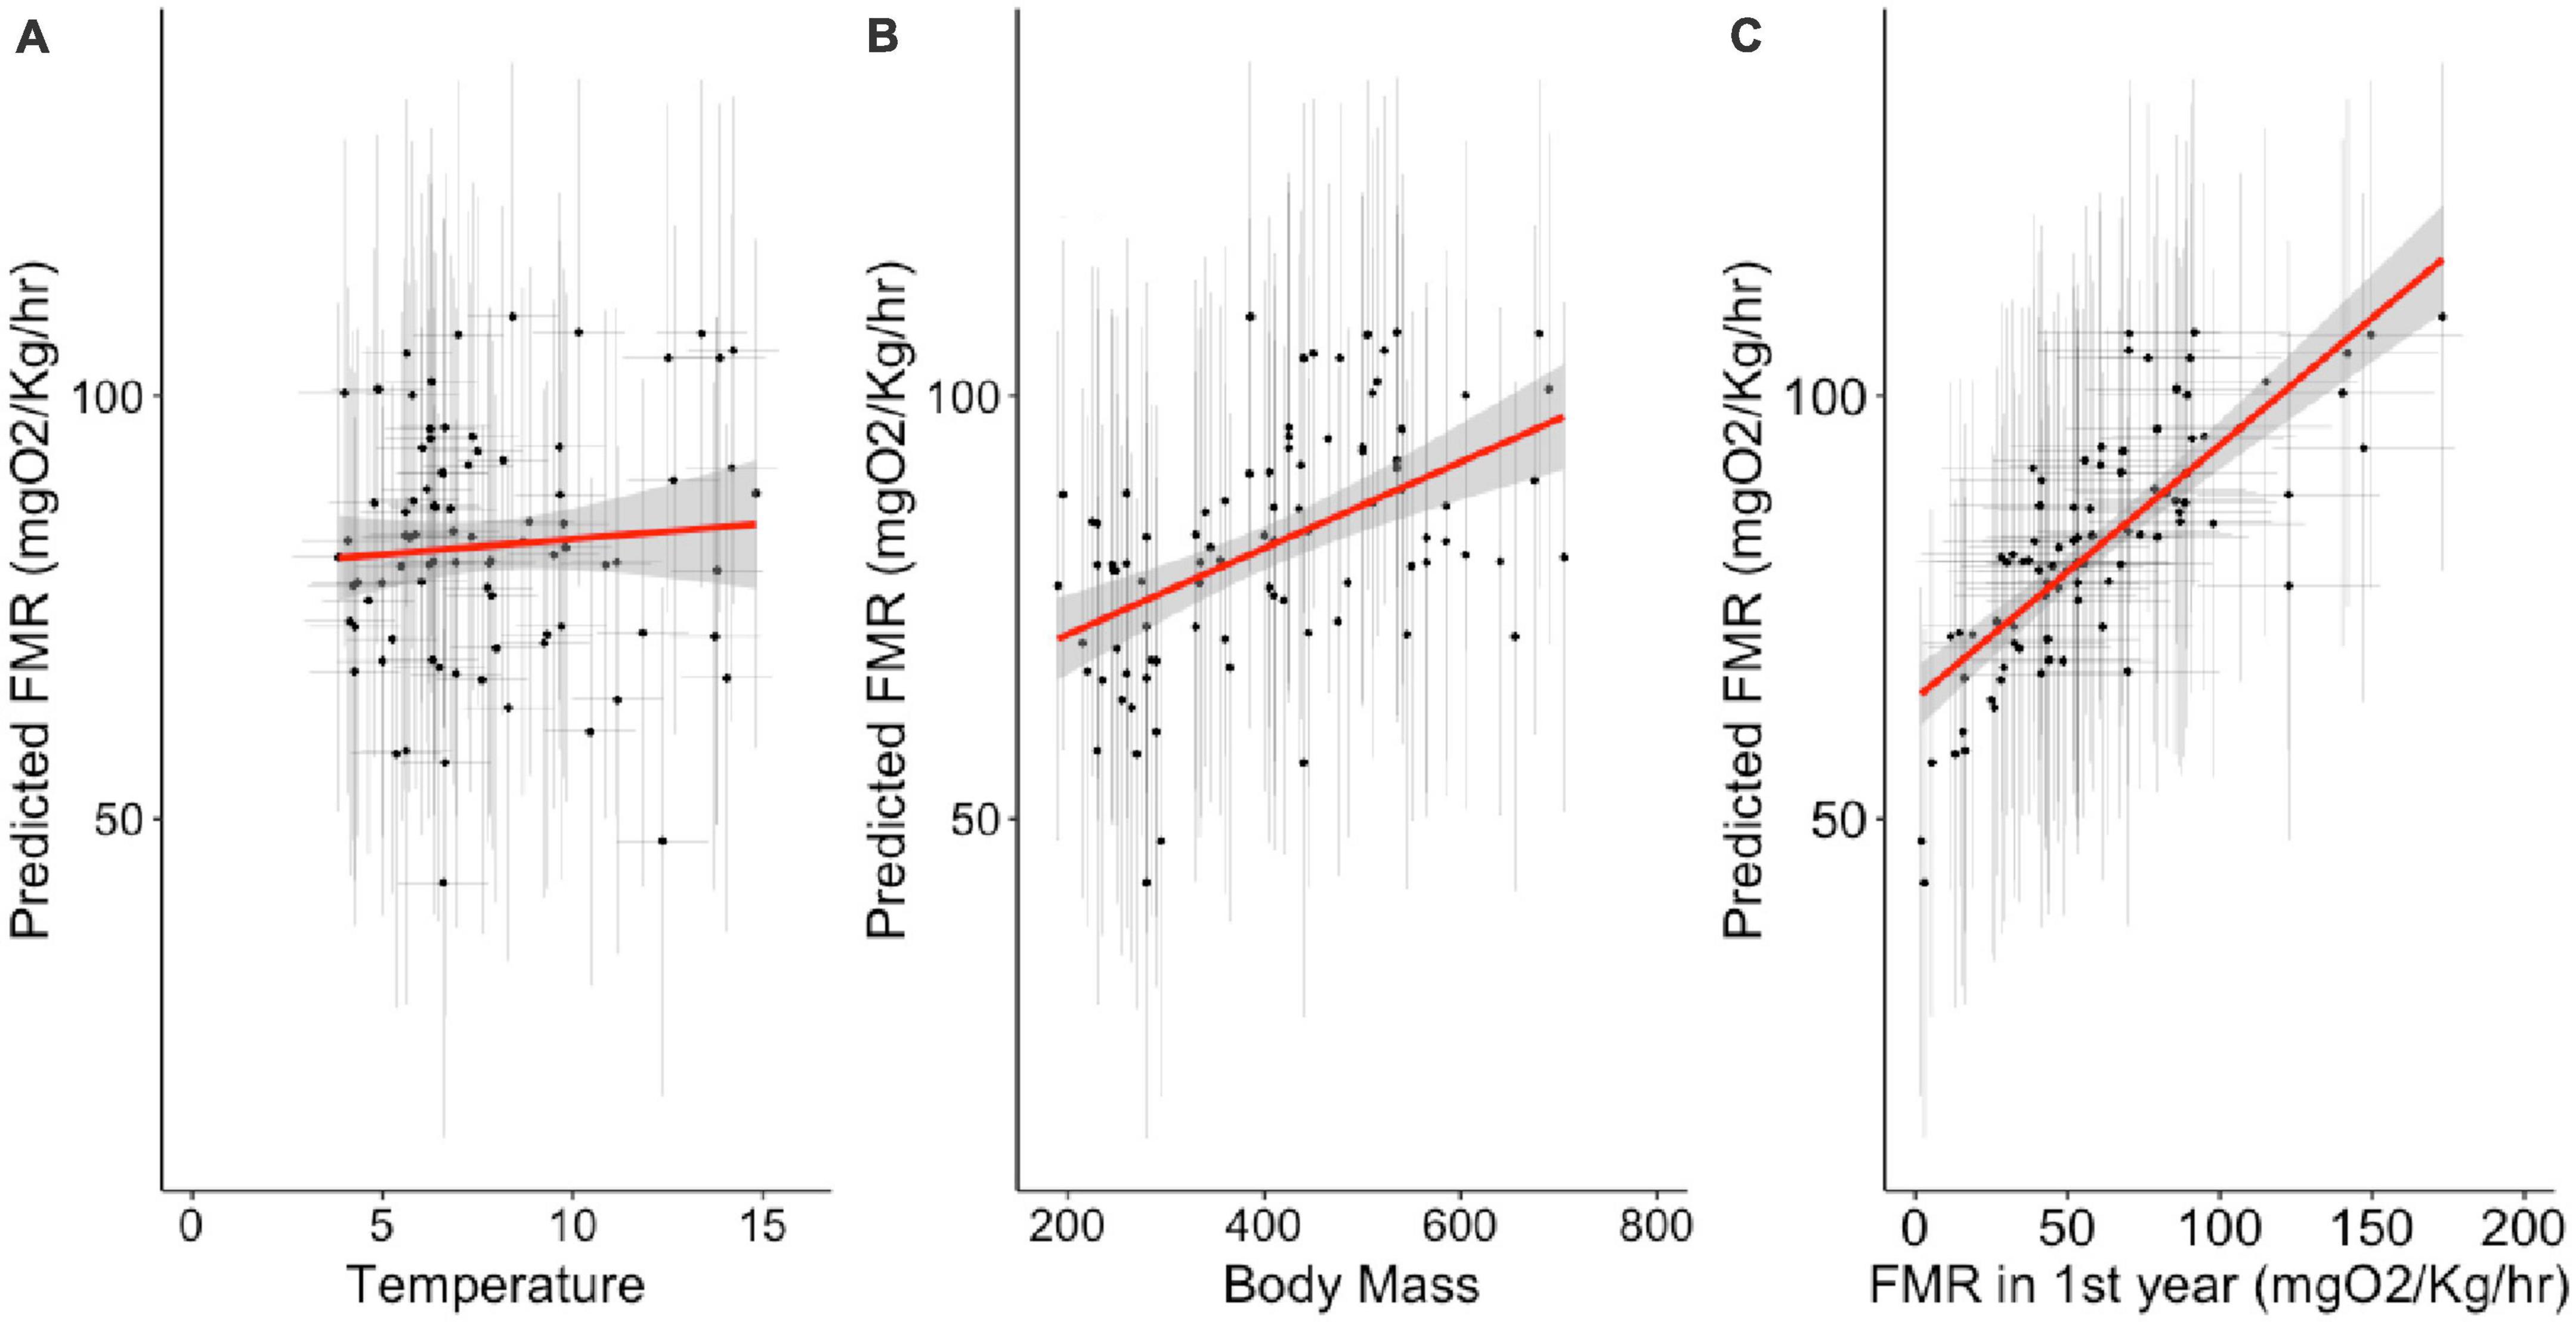
Figure 3. Relationship between fixed effects of temperature (A), body mass (B), and FMR during the first year of life (C) and oxygen consumption rates in the best fitting mixed effects model (Equation 5); model fit is described in Table 4 and best fitting parameters given in Table 5. Error bars represent 95% confidence intervals around individual estimates calculated from Monte Carlo resampling.
To visualize the relationship between the fixed effects and oxygen consumption rates at capture, we used the best fitting model to predict oxygen consumption rates as a function of fixed and random parameters (Figure 4). At the point of sampling (median age 4), temperature has a non-significant influence on inferred FMR, body mass has a positive influence, but FMR in the first year of life has the strongest positive covariance with among-individual variation in FMR in later life stages. The relationship between temperature and oxygen consumption rate also varies between the two time points of sampling (for the same individual fish), temperature having a stronger positive influence on FMR in early life stages (Figure 5).
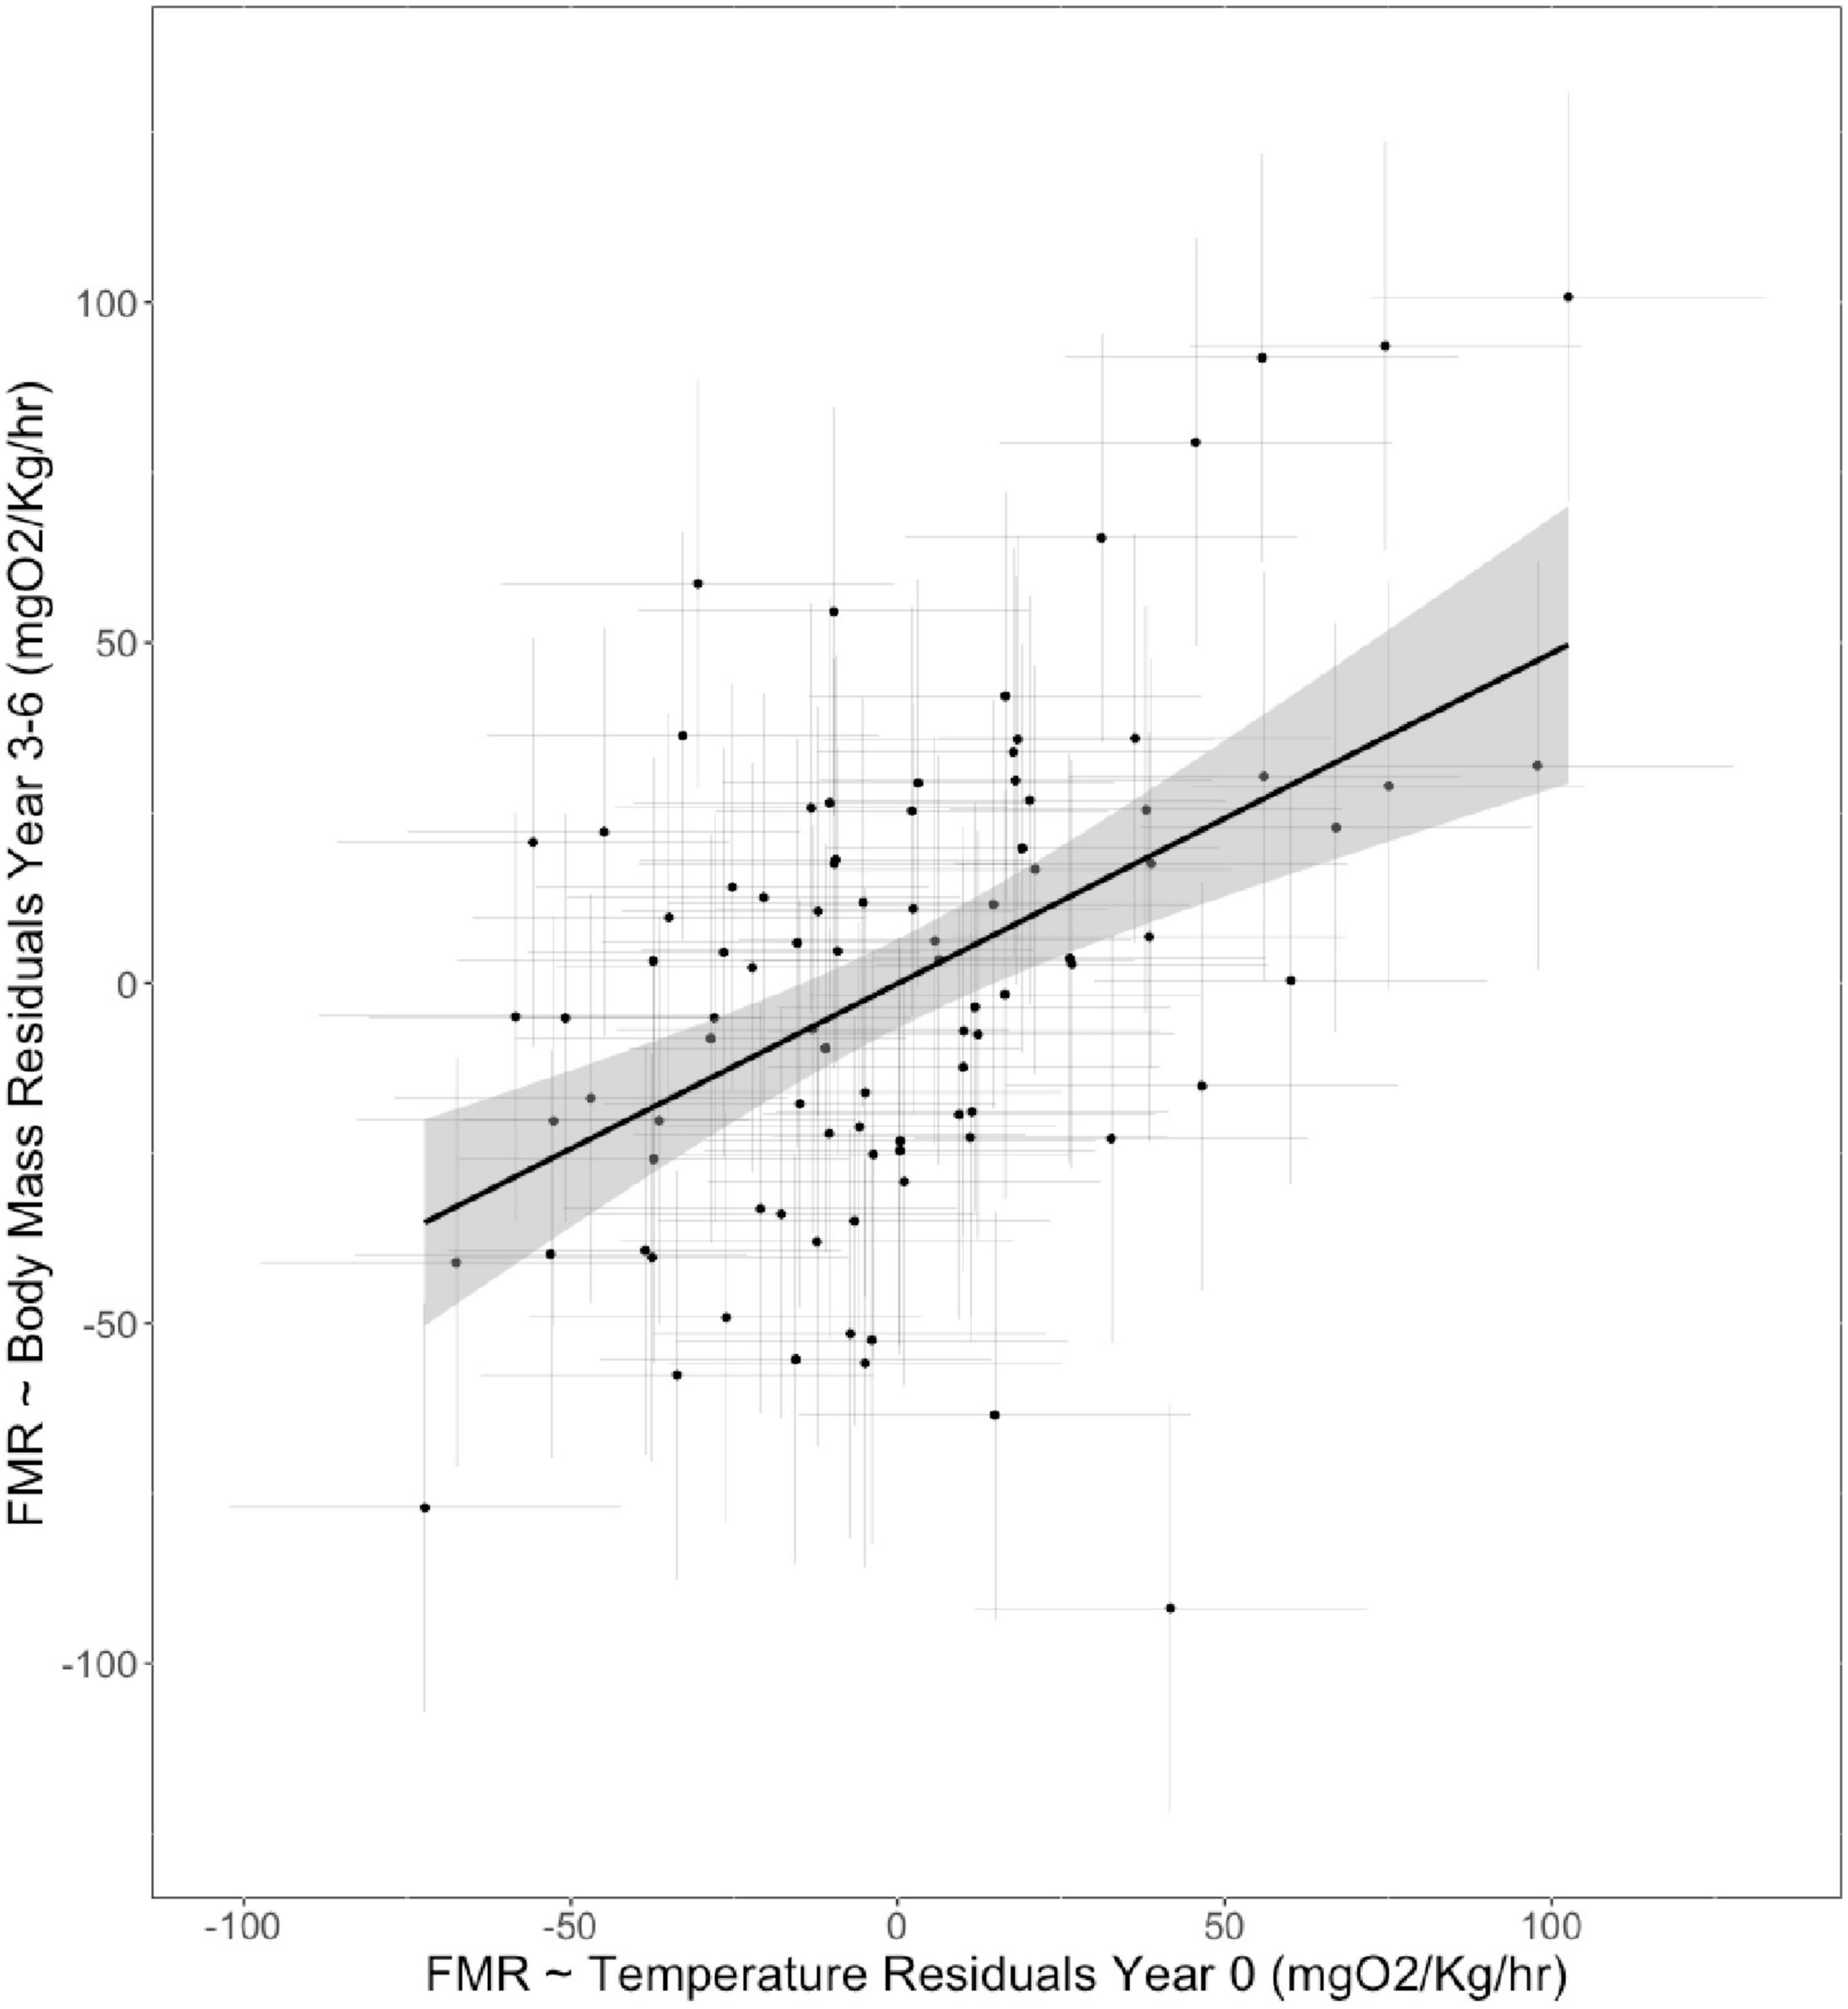
Figure 4. Relationship between residuals of linear mixed effects models between otolith-inferred FMR and experienced temperature for otolith aragonite grown during the first year of life and FMR and body mass for otolith aragonite formed immediately prior to sampling (3–6 year of life).
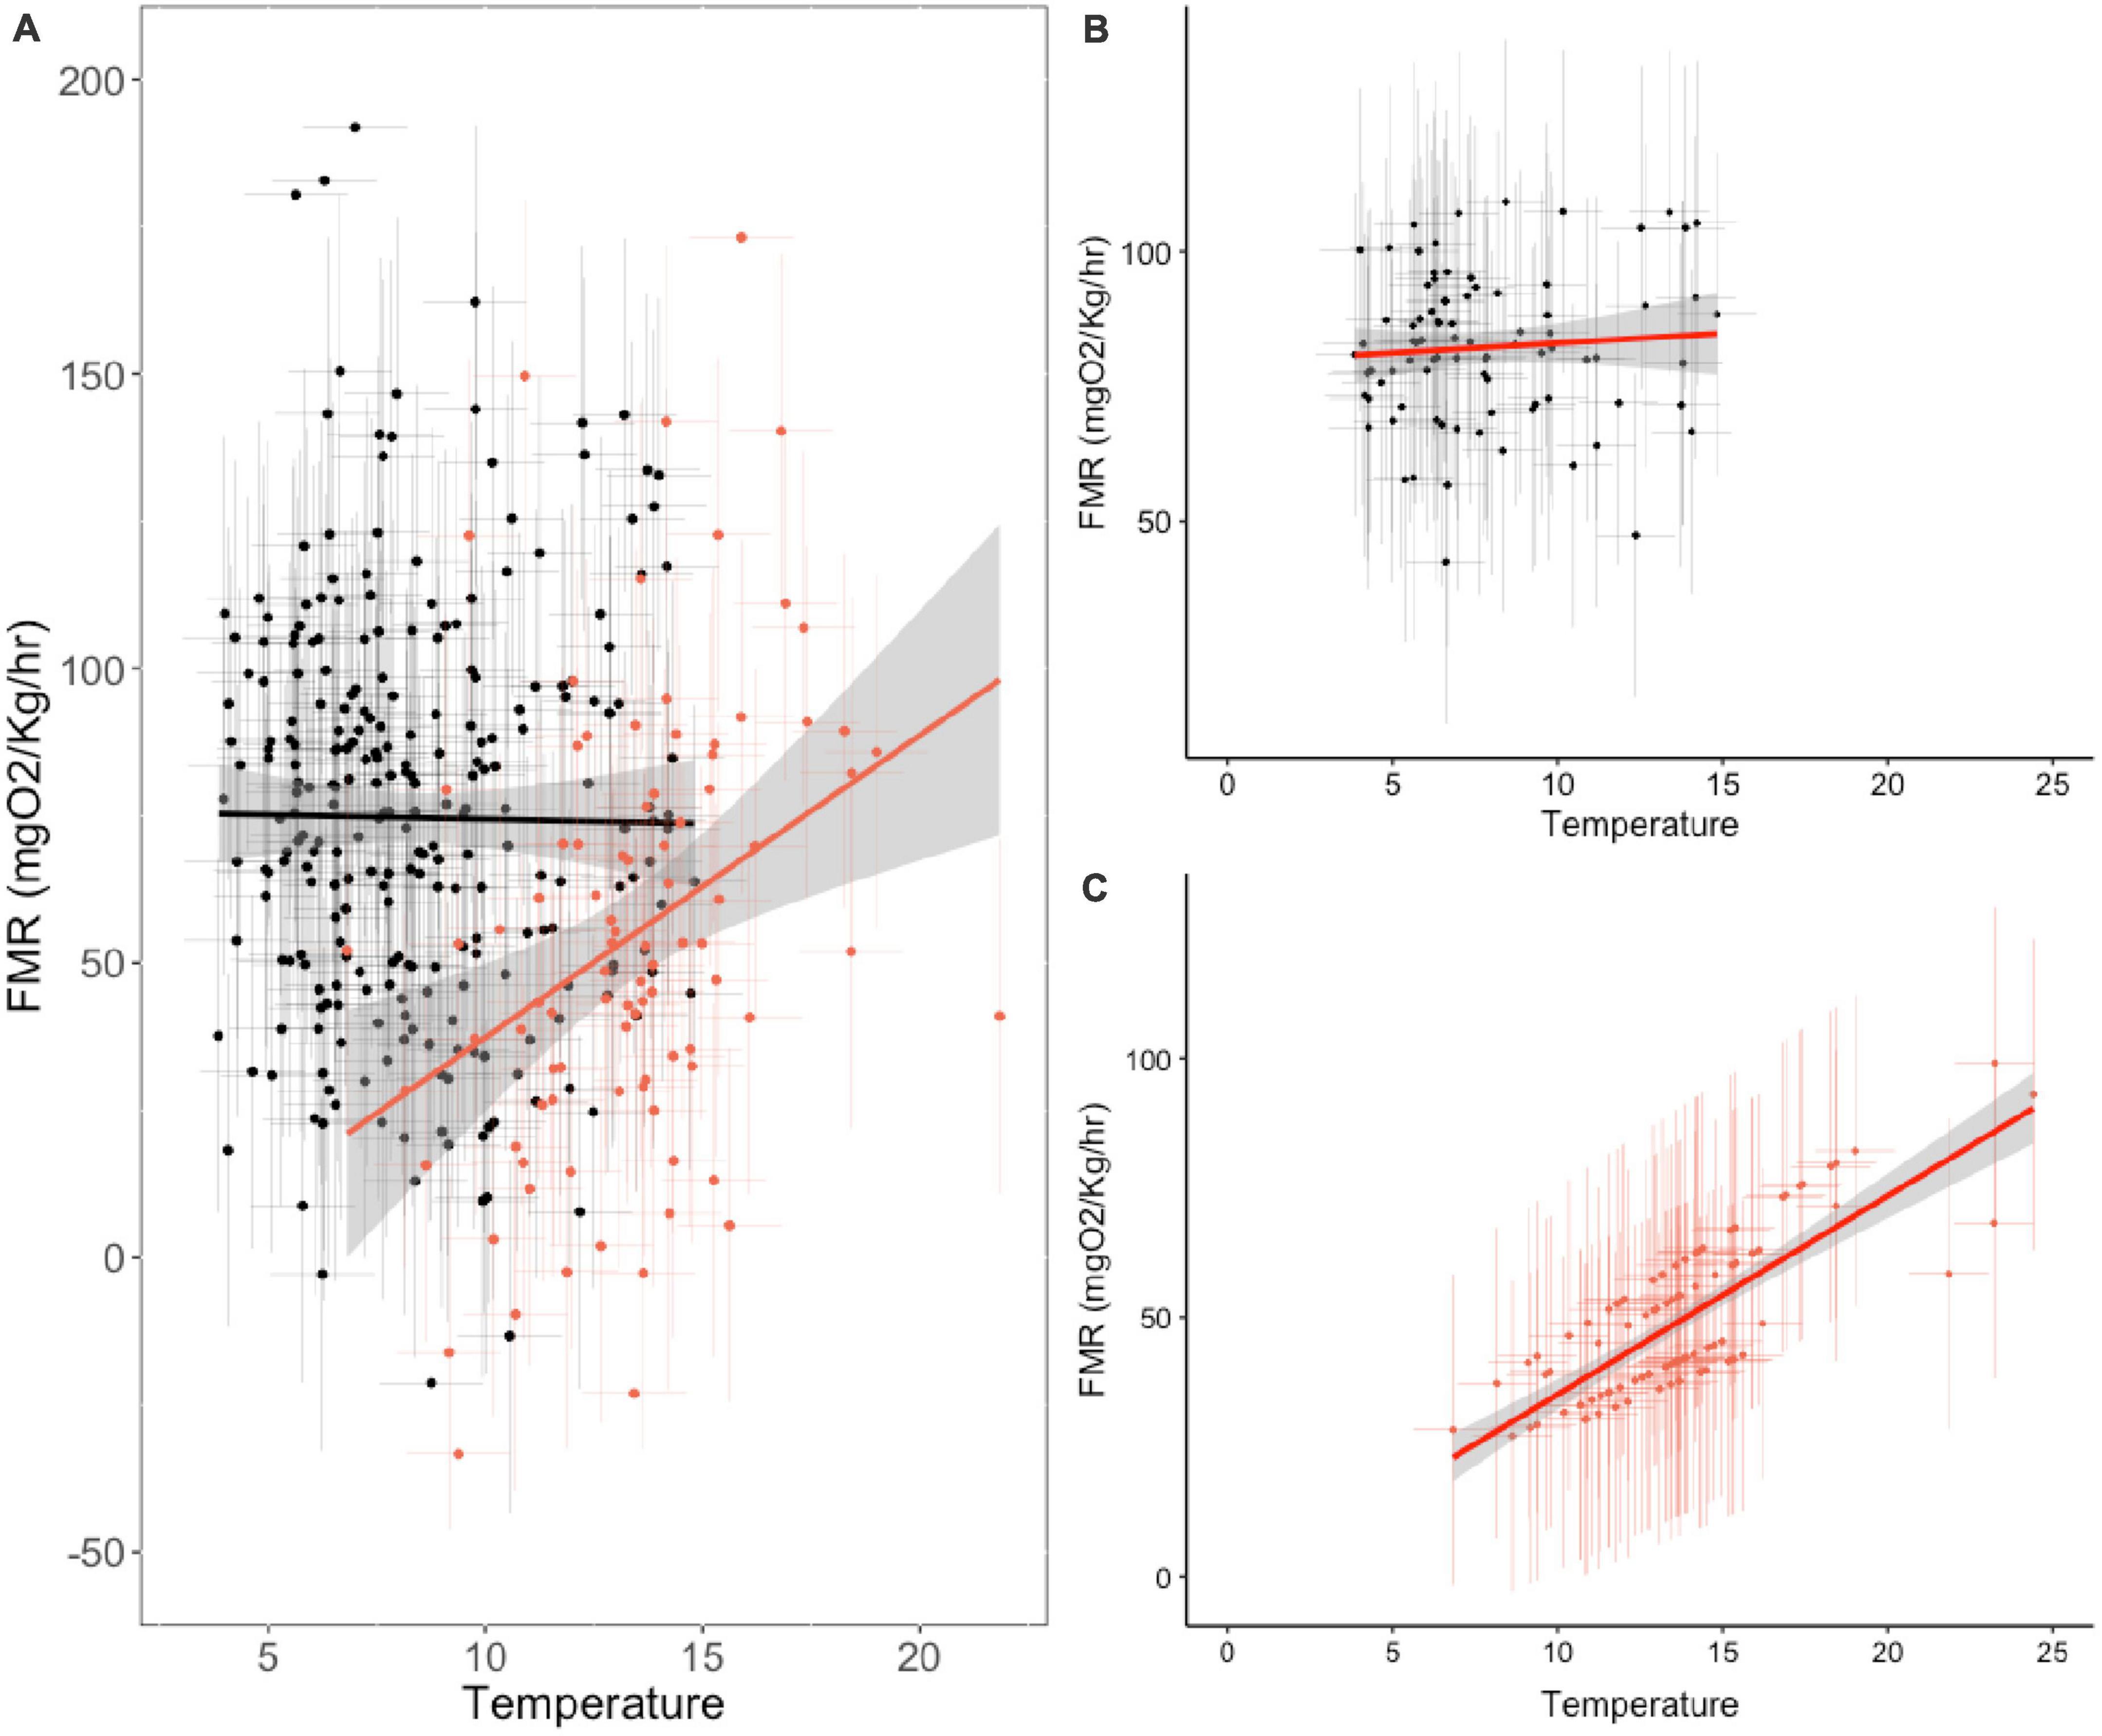
Figure 5. Thermal sensitivity of field metabolic rate across life stages of wild living plaice. (A) Isotope-inferred temperature and oxygen consumption rates at capture (year 3–6, black) and in the first year of life (red). (B,C) Partial effects of temperature on oxygen consumption rates as predicted from best fitting linear mixed effects models (i.e., accounting for random effects of sex and year of sampling, and fixed effect of mass at capture) at age 3–6 (B) and in the first summer of life (C). Error bars represent 95% confidence intervals on individual estimates calculated from Monte Carlo resampling.
We used a new indirect respirometry approach to retrospectively infer field metabolic rates from the otoliths of wild living plaice, and explored the thermal sensitivity of FMR across life stages between and within individuals. The experienced temperatures and FMR estimates from otolith stable isotope compositions are comparable to those expected for plaice in the North Sea based on archival tag data and laboratory respirometry, adding confidence to a growing literature deriving ecophysiological information about wild ranging fishes based on the stable isotope composition of incrementally-grown otolith aragonite (Jamieson et al., 2004; Shephard et al., 2007; Sinnatamby et al., 2015; Alewijnse et al., 2021; Chung et al., 2021; Smoliński et al., 2021; Sakamoto et al., 2022).
In our dataset of 281 wild roaming adult plaice, Cresp values varied by 2–5× among individuals. Individual body mass varied between approximately 200 and 800 g, and experienced temperatures varied over 12 degrees. Body size and temperature contributed to the regression models best describing variance in inferred FMR, but the associated coefficients are small compared to those expected based on allometric scaling or metabolic theory, and compared to co-variances between body mass and FMR seen in other studies employing otolith δ13C values (Shephard et al., 2007; Trueman et al., 2016; Chung et al., 2019a,b; Alewijnse, 2022). Uncertainties around δ13C values of carbon sources likely account for some of the unexplained variance in inferred FMR values, but we suggest that energy consuming processes independent of body size and temperature also contribute strongly to variation in individual-level FMR in wild ranging adult plaice in the North Sea. Plaice are known to make use of environmental transport (selective tidal stream transport) which may reduce energy costs associated with directed movement (Metcalfe et al., 1990, 2006). Variations in the degree to which activity costs are reduced via tidal stream transport may contribute greatly to the high among-individual variation, and relatively low absolute FMR values recorded in plaice. Seasonal variations in energy allocation may influence observed relationships between body mass, temperature and FMR. Additionally, among-individual variations in feeding intensity (including specific dynamic action), and reproductive investment likely elicit large variations in energy expenditure, and for fishes operating within their aerobic scope, body size and temperature may be poor predictors for daily energy expenditure (Neubauer and Andersen, 2019).
In the first year of life, experienced temperature positively co-varied with FMR. Age 0 fish are under strong selective pressure to partition all available energy into somatic growth, potentially with fewer behavioral energetic trade-offs. Consequently external temperature is likely to be a more reliable predictor of fish performance in early life stages, provided fish are operating within their aerobic scope. Distributions of plaice in the North Sea have changed significantly over the 90 year period for which fishery catch and effort data are available, with a marked shift toward more northerly and deeper (i.e., cooler) waters (Dulvy et al., 2008; Engelhard et al., 2011) with distribution shifts more closely correlated with climate drivers than with fishery effects. In 1989, in an attempt to rebuild falling plaice populations, the main distribution area for undersized plaice in the North Sea was closed to large fishing vessels (a region along the continental coast of the south eastern North Sea termed the “Plaice Box”). However, in the intervening time, the distribution of small plaice changed, leading to inferences that previous coastal nursery areas have become unsuitable for juvenile plaice (van Keeken et al., 2007). Our results imply a greater thermal sensitivity for metabolic rate in plaice in the first year of life, compared to later life stages, potentially supporting suggestions that conditions in the first year of life are particularly important for the distribution of juvenile plaice and subsequent recruitment rates.
Individual variation has been used to measure population stability in previous studies, as a high degree of phenotypic variation increases the population’s capacity to absorb environmental instability (Nussey et al., 2007; Rutterford et al., 2015). Drawing on the otoliths incremental growth, we explored the potential for phenotypic effects at the population level by assessing the extent to which among-individual variation in FMR expression at year 4 was related to variation in FMR in the first year of life for the same individuals. We also tested for an individual level effects (the relationship between temperature-corrected FMR at age 0 and mass corrected FMR at age 3–6). In our sub-sample of 95 fish for which we obtained estimates of FMR in the first year of life and at capture, FMR in the first year of life explained more of the variation in adult FMR than either body size or temperature, accounting for c.20% of the variation in mass-corrected FMR at age 3–6. These data imply a major role for individual phenotypic variability in energy use in wild plaice. However, individual energy use did not covary with body size, so we did not see a clear lifetime growth advantage related to relatively high sustained individual-level FMR.
Ontogenetically-persistent among-individual variation in metabolic rate could arise through genetic differences, or could reflect canalization of energy metabolism traits based on conditions experienced in early life stages. Previous studies have demonstrated the existence of metabolic phenotypes through controlled selective breeding under laboratory conditions, where individuals of elevated or suppressed energetic demand are selected to reproduce (Metcalfe et al., 2016; Jutfelt, 2020; Wootton et al., 2021); here we infer similar persistent phenotypic metabolic traits expressed within wild populations. Diversity in metabolic phenotypic expression could be a measure of the resilience of the population to environmental instability. Populations where individual level energetic demand is closely centered around the population level mean are thought to be more vulnerable to extrinsic variability. With increased individual level deviance there is a greater chance that a section of a population will survive and be better suited to environmental re-structuring, therefore the population is more stable. Our sampled population lies toward the warm edge of the range of plaice. We were not able to assess whether sub-groups of plaice (or plaice at cold or mid- range edges) express a similar degree of phenotypic variation in energy use.
External temperature, either directly through its effect on enzyme efficiency or indirectly via effects on resource supply/demand ratios appears to play a critical role in defining limits of species persistence (Deutsch et al., 2015). Consequently laboratory derived measures of physiologically limiting temperatures may be effective at constraining species ranges in current and future conditions. However, within an organism’s optimal thermal range, the relationship between external temperature and physiological performance is much less clear. In laboratory conditions, physiological performance typically describes a thermal performance curve displaying an optimum temperature at which either physiological performance or aerobic scope is maximized. Such optimal temperatures (or preferred temperatures slightly below optimal temperatures) have been suggested as predictors for species’ core ranges (Pörtner, 2021). However, the thermal sensitivity of physiological performance in the laboratory does not fully describe the range of behavioral and ecological responses to changes in temperature (and associated physiological trade-offs) observed in natural conditions. Critically the thermal sensitivity of physiological performance in wild conditions may differ markedly from laboratory observation due to either buffering or exaggerating local environmental and ecological contexts. It has been suggested that field physiological data is needed to improve our understanding of realized responses of populations to climate change, hence the need to measure metabolic responses in wild populations (Jager and Zimmer, 2012; Nisbet et al., 2012). Further, as populations respond to change over multi-generational time scales, the role of phenotypic diversity in modulating population sensitivity to external environmental drivers is important to quantify (Violle et al., 2012; Metcalfe et al., 2016; Jutfelt, 2020).
Drawing ecophysiological inferences from biochemical proxy data in field-derived samples has obvious value in terms of recording the external temperature experienced by individual fish, and the individual-level metabolic response. But natural sampling creates a number of limitations. Firstly, to reconstruct experienced temperature, we are forced to make assumptions about the isotopic composition of the external water. In full salinity marine conditions, estimates of δ18Ow values can be drawn relatively robustly from existing data. However, in coastal areas or restricted basins with fluctuating river water input, confidence in assumed δ18Ow values, and associated experienced temperatures is reduced. In the current study we limited our analyses to plaice assumed to restrict movements within regions of the North Sea with relatively stable δ18Ow values, at least over the time integration window. However, for retrospective analyses of juveniles, we have no direct knowledge of the location of individuals, which may inhabit lower salinity coastal waters, and consequently estimates of experienced temperature are more uncertain. Nonetheless, our inferred temperatures lie within the temperatures expected to be experienced by plaice within the North Sea.
Estimates of FMR based on otolith δ13C values are subject to similar assumptions around the isotopic compositions of carbon sources (diet and DIC) and the calibration between the proportion of respiratory carbon in the otolith and oxygen consumption rates. The overall proportion of metabolic (diet) carbon in otolith aragonite is typically between 10 and 30% except for high metabolic fish such as tuna (Kalish, 1991; Sherwood and Rose, 2003; Chung et al., 2019a; Alewijnse, 2022), so estimates of Cresp values are relatively insensitive to variations in diet δ13C values. As no soft tissues for the individuals sampled from otolith archives were available, we drew on compilations of δ13C values for plaice sampled from the North Sea to estimate likely diet δ13C values. Plaice otolith δ13C values varied between 0.5 and −2.9%. Applying the medians of estimated likely ranges of δ13C values for DIC and diet to mixing models, c.4% of otolith carbon derives from diet. Therefore variations in diet δ13C values have relatively minor effects – for instance, holding DIC and otolith δ13C values constant and varying potential δ13C diet values across the whole 5‰ range reported in Jennings and Cogan (2015) results in a range in Cresp values of 0.02, which is considerably lower than the 95% confidence range we apply to each individual inferred Cresp value. Inferred Cresp values are much more sensitive to variations in δ13C values of DIC, and we drew on a single dataset of spatially averaged δ13C values of DIC (Burt et al., 2016). It is likely that we did not capture true variations in δ13CDIC values, as we were unable to directly recover potentially large local scale spatial and seasonal variability in δ13CDIC values, which probably accounts for some of the unexplained variation in inferred FMR values. We attempted to quantify the effect of uncertainty in water δ18O and carbon source δ13C values with a Monte Carlo resampling approach. Undoubtedly, having matched measurements of the isotopic composition of carbon sources and their spatial and temporal variability will reduce uncertainty in estimates of metabolic rates derived from carbonate biominerals and allow identification of more subtle ecological or environmental drivers of variation. However, such matched values are unlikely to be available for historic, archived otolith samples.
The calibration between Cresp values and oxygen consumption rates is based on cod. As long as this calibration is statistical rather than mechanistic there is a valid criticism that species-specific calibration terms could apply – i.e., that different species maintain different proportions of respiratory carbon in blood for a given rate of oxygen consumption. Species-specific variations in optimum blood carbonate concentrations could potentially contribute to relatively low estimates of apparent oxygen consumption rates in plaice. However, we feel it is unlikely that the slope of the calibration term will vary systematically across species given the stoichiometric relationship between oxygen consumption and carbon production through respiration. Increasing oxygen consumption rates (and therefore increasing production of respiratory CO2) must increase the proportion of respiratory carbon in blood–as long as blood carbonate concentrations are physiologically regulated. Most marine teleost fishes regulate chronic blood bicarbonate levels to common levels to maintain pH balance. Therefore we expect a relatively common relationship between Cresp values and oxygen consumption rates and we do not expect this relationship to be strongly or systematically influenced by body mass age.
While acknowledging the limitations stated above, the stable isotope composition of carbonate biominerals, and fish otoliths in particular, offer unique insights into individual-level temperature preference and energy use in free-ranging, wild fishes. Natural tags have the advantage that large numbers of individuals can be analyzed, recording among-individual variation. Furthermore, the relative ease of sampling and individual-level of analysis can provide insights specific to the local ecological context and draw on a specific population adapted over multiple generations to the fluctuating environmental conditions experienced– these aspects of ecophysiology are difficult to account for in laboratory contexts. Finally, the incremental nature of many carbonate biominerals also allows recovery of metabolic information over the lifespan of the individual (while recognizing that uncertainty regarding reference isotopic compositions of carbon and oxygen sources increases with increasing time intervals between capture and growth of the sampled portion of the biomineral).
Consequently, otolith stable isotope analyses compliment ecophysiological information obtained from laboratory experimentation, telemetry and tagging. Together, these approaches can refine estimates of population responses to climate change at spatial scales relevant to fisheries and ecosystem managers.
The original contributions presented in this study are included in the article/Supplementary material, further inquiries can be directed to the corresponding authors.
The animal study was reviewed and approved by the University of Southampton Research Ethics.
CT, EH, and JJ conceived and designed the project and drafted the manuscript, with contributions from MW and BH. JJ, MW, and BH conducted the analyses. JJ and CT analyzed the data. All authors contributed to the article and approved the submitted version.
This work was funded from NERC Case award NE/P009700/1.
We would like to thank all skippers, crew and scientists involved in the ICES IBTS survey, and all CEFAS staff involved in collection, processing and curation of historic otolith samples and associated metadata.
The authors declare that the research was conducted in the absence of any commercial or financial relationships that could be construed as a potential conflict of interest.
All claims expressed in this article are solely those of the authors and do not necessarily represent those of their affiliated organizations, or those of the publisher, the editors and the reviewers. Any product that may be evaluated in this article, or claim that may be made by its manufacturer, is not guaranteed or endorsed by the publisher.
The Supplementary Material for this article can be found online at: https://www.frontiersin.org/articles/10.3389/fevo.2023.1161105/full#supplementary-material
Albouy, C., Guilhaumon, F., Leprieur, F., Lasram, F. B. R., Somot, S., Aznar, R., et al. (2013). Projected climate change and the changing biogeography of coastal Mediterranean fishes. J. Biogeogr. 40, 534–547. doi: 10.1111/jbi.12013
Alewijnse, S. R. (2022). Macroecological study of otolith-derived field metabolic rates of marine fishes. Ph.D. Southampton: University of Southampton.
Alewijnse, S. R., Stowasser, G., Saunders, R., Belcher, A., Crimmen, O., Cooper, N., et al. (2021). Otolith-derived field metabolic rates of myctophids (Family Myctophidae) from the Scotia Sea (Southern Ocean). Mar. Ecol. Progr. Ser. 675, 113–131. doi: 10.3354/meps13827
Andersen, K. H. (2018). Fish ecology, evolution, and exploitation. Princeton, NJ: Princeton University Press.
Bartoń, K. (2023). _MuMIn: Multi-Model Inference. R package version 1.47.5. Available online at: https://CRAN.R-project.org/package=MuMIn
Blowes, S., Supp, S., Antão, L., Bates, A., Bruelheide, H., Chase, J., et al. (2019). The geography of biodiversity change in marine and terrestrial assemblages. Science 366, 339–345. doi: 10.1126/science.aaw1620
Burt, W. J., Thomas, H., Hagens, M., Pätsch, J., Clargo, N. M., Salt, L. A., et al. (2016). Carbon sources in the North Sea evaluated by means of radium and stable carbon isotope tracers. Limnol. Oceanogr. 61, 666–683. doi: 10.1002/lno.10243
Campana, S. E., and Thorrold, S. R. (2001). Otoliths, increments, and elements: Keys to a comprehensive understanding of fish populations? Can. J. Fish. Aquat. Sci. 58, 30–38. doi: 10.1139/f00-177
Cheung, W. W. L., Sarmiento, J. L., Dunne, J., Frölicher, T. L., Lam, V. W. Y., Palomares, M. L. D., et al. (2013). Shrinking of fishes exacerbates impacts of global ocean changes on marine ecosystems. Nat. Clim. Change 3, 254–258. doi: 10.1038/nclimate1691
Chung, M.-T., Jørgensen, K.-E. M., Trueman, C. N., Knutsen, H., Jorde, P. E., and Grønkjær, P. (2021). First measurements of field metabolic rate in wild juvenile fishes show strong thermal sensitivity but variations between sympatric ecotypes. Oikos 130, 287–299. doi: 10.1111/oik.07647
Chung, M.-T., Trueman, C., Godiksen, J., Holmstrup, M., and Grønkjær, P. (2019a). Field metabolic rates of teleost fishes are recorded in otolith carbonate. Commun. Biol. 2:24. doi: 10.1038/s42003-018-0266-5
Chung, M.-T., Trueman, C. N., Godiksen, J. A., and Grønkjær, P. (2019b). Otolith δ13C values as a metabolic proxy: Approaches and mechanical underpinnings. Mar. Freshw. Res. 70:1747. doi: 10.1071/mf18317
Dahlke, F., Wohlrab, S., Butzin, M., and Pörtner, H. (2020). Thermal bottlenecks in the life cycle define climate vulnerability of fish. Science 369, 65–70. doi: 10.1126/science.aaz3658
Darnaude, A., Sturrock, A., Trueman, C., Mouillot, D., Eimf Campana, E., et al. (2014). Listening in on the past: What can ctolith δ18O values really tell us about the environmental history of fishes? PLoS One 9:e108539. doi: 10.1371/journal.pone.0108539
Deutsch, C., Ferrel, A., Seibel, B., Pörtner, H., and Huey, R. (2015). Climate change tightens a metabolic constraint on marine habitats. Science 348, 1132–1135. doi: 10.1126/science.aaa1605
Deutsch, C., Penn, J. L., and Seibel, B. (2020). Metabolic trait diversity shapes marine biogeography. Nature 585, 557–562. doi: 10.1038/s41586-020-2721-y
Deutsch, C., Penn, J., Verberk, W. E., Inomura, K., Endress, M., and Payne, J. (2022). Impact of warming on aquatic body sizes explained by metabolic scaling from microbes to macrofauna. Proc. Nat. Acad. Sci. U.S.A. 119:e2201345119. doi: 10.1073/pnas.2201345119
Dulvy, N. K., Rogers, S. I, Jennings, S., Stelzenmüller, V., Dye, S. R., and Skjoldal, H. R. (2008). Climate change and deepening of the North Sea fish assemblage: A biotic indicator of warming seas. J. Appl. Ecol. 45, 1029–1039. doi: 10.1111/j.1365-2664.2008.01488.x
Duncan, M. I., James, N. C., Potts, W. M., and Bates, A. E. (2020). Different drivers, common mechanism; the distribution of a reef fish is restricted by local-scale oxygen and temperature constraints on aerobic metabolism. Conserv. Physiol. 8:coaa090. doi: 10.1093/conphys/coaa090
Engelhard, G. H., Pinnegar, J. K., Kell, L. T., and Rijnsdorp, A. D. (2011). Nine decades of North Sea sole and plaice distribution. ICES J. Mar. Sci. 68, 1090–1104. doi: 10.1093/icesjms/fsr031
Ern, R. (2019). A mechanistic oxygen- and temperature-limited metabolic niche framework. Philos. Trans. R. Soc. Lond. B Biol. Sci. 374:20180540. doi: 10.1098/rstb.2018.0540
Gauldie, R. W. (1996). Biological factors controlling the carbon isotope record in fish otoliths: Principles and evidence. Comp. Biochem. Physiol. B 115, 201–208. doi: 10.1016/0305-0491(96)00077-6
Geffen, A. J. (2012). Otolith oxygen and carbon stable isotopes in wild and laboratory-reared plaice (Pleuronectes platessa). Environ. Biol. Fishes 95, 419–430. doi: 10.1007/s10641-012-0033-2
Halsey, L. G., Killen, S. S., Clark, T. D., and Norin, T. (2018). Exploring key issues of aerobic scope interpretation in ectotherms: Absolute versus factorial. Rev. Fish Biol. Fish. 28, 405–415. doi: 10.1007/s11160-018-9516-3
Healy, T. M., and Schulte, P. M. (2012). Thermal acclimation is not necessary to maintain a wide thermal breadth of aerobic scope in the common killifish (Fundulus heteroclitus). Physiol. Biochem. Zool. 85, 107–119. doi: 10.1086/664584
Hofmann, G. E., and Todgham, A. E. (2010). Living in the now: Physiological mechanisms to tolerate a rapidly changing environment. Annu. Rev. Physiol. 72, 127–145. doi: 10.1146/annurev-physiol-021909-135900
Holt, R. E., and Jørgensen, C. (2015). Climate change in fish: Effects of respiratory constraints on optimal life history and behaviour. Biol. Lett. 11:20141032. doi: 10.1098/rsbl.2014.1032
Jager, T., and Zimmer, E. I. (2012). Simplified Dynamic Energy Budget model for analysing ecotoxicity data. Ecol. Model. 225, 74–81. doi: 10.1016/j.ecolmodel.2011.11.012
Jamieson, R. E., Schwarcz, H. P., and Brattey, J. (2004). Carbon isotopic records from the otoliths of Atlantic cod (Gadus morhua) from eastern Newfoundland, Canada. Fish. Res. 68, 83–97. doi: 10.1016/j.fishres.2004.02.009
Jennings, S., and Cogan, S. M. (2015). Nitrogen and carbon stable isotope variation in northeast Atlantic fishes and squids. Ecology 96, 2568–2568. doi: 10.1890/15-0299.1
Jutfelt, F. (2020). Metabolic adaptation to warm water in fish. Funct. Ecol. 34, 1138–1141. doi: 10.1111/1365-2435.13558
Kalish, J. M. (1991). 13 C and 18 O isotopic disequilibria in fish otoliths: Metabolic and kinetic effects. Mar. Ecol. Progr. Ser. 75, 191–203.
Killen, S., Glazier, D., Rezende, E., Clark, T., Atkinson, D., Willener, A. T., et al. (2016). Ecological influences and morphological correlates of resting and maximal metabolic rates across teleost fish species. Am. Nat. 187, 592–606. doi: 10.1086/685893
Lamine, E., Schickele, A., Guidetti, P., Allemand, D., Hilmi, N., and Raybaud, V. (2010). Large-scale redistribution of maximum fisheries catch potential in the global ocean under climate change. Global Change Biol. 16, 24–35. doi: 10.1111/j.1365-2486.2009.01995.x
LeGrande, A. N., and Schmidt, G. A. (2006). Global gridded data set of the oxygen isotopic composition in seawater. Geophys. Res. Lett. 33:L12604. doi: 10.1029/2006gl026011
Lindmark, M., Audzijonyte, A., Blanchard, J. L., and Gårdmark, A. (2022). Temperature impacts on fish physiology and resource abundance lead to faster growth but smaller fish sizes and yields under warming. Global Change Biol. 28, 6239–6253. doi: 10.1111/gcb.16341
Little, A. G., Loughland, I., and Seebacher, F. (2020). What do warming waters mean for fish physiology and fisheries? J. Fish Biol. 97, 328–340. doi: 10.1111/jfb.14402
MacKenzie, K., Palmer, M., Moore, A., Ibbotson, A., Beaumont, W. C., Poulter, D. S., et al. (2011). Locations of marine animals revealed by carbon isotopes. Sci. Rep. 1:21. doi: 10.1038/srep00021
Martino, J. C., Doubleday, Z., Chung, M., and Gillanders, B. (2020). Experimental support towards a metabolic proxy in fish using otolith carbon isotopes. J. Exp. Biol. 223:jeb217091. doi: 10.1242/jeb.217091
McConnaughey, T. A., Burdett, J., Whelan, J. F., and Paull, C. K. (1997). Carbon isotopes in biological carbonates: Respiration and photosynthesis. Geochim. Cosmochim. Acta. 61, 611–622.
McKenzie, D. J., Geffroy, B., and Farrell, A. P. (2021). Effects of global warming on fishes and fisheries. J. Fish Biol. 98, 1489–1492. doi: 10.1111/jfb.14762
Metcalfe, J. D., Arnold, G. P., and Webb, P. W. (1990). The energetics of migration by selective tidal stream transport: An analysis for plaice tracked in the southern North Sea. J. Mar. Biol. Assoc. U.K. 70, 149–162. doi: 10.1017/S0025315400034275
Metcalfe, J. D., Hunter, E., and Buckley, A. A. (2006). The migratory behaviour of North Sea plaice: Currents, clocks and clues. Mar. Freshw. Behav. Physiol. 39, 25–36. doi: 10.1080/10236240600563404
Metcalfe, N. B., Van Leeuwen, T. E., and Killen, S. S. (2016). Does individual variation in metabolic phenotype predict fish behaviour and performance? J. Fish Biol. 88, 298–321. doi: 10.1111/jfb.12699
Mieszkowska, N., Genner, M., Hawkins, S., and Sims, D. (2009). Chapter 3. Effects of climate change and commercial fishing on atlantic cod Gadus morhua. Adv. Mar. Biol. 56, 213–273. doi: 10.1016/S0065-2881(09)56003-8
Murawski, S. A. (1993). Climate change and marine fish distributions: Forecasting from historical analogy. Trans. Am. Fish. Soc. 122, 647–658.
Nakagawa, S., and Schielzeth, H. (2013). A general and simple method for obtaining R2 from generalized linear mixed-effects models. Meth. Ecol. Evol. 4, 133–142. doi: 10.1111/j.2041-210x.2012.00261.x
Nelson, J., Hanson, C., Koenig, C., and Chanton, J. (2011). Influence of diet on stable carbon isotope composition in otoliths of juvenile red drum Sciaenops ocellatus. Aquat. Biol. 13, 89–95. doi: 10.3354/ab00354
Neubauer, P., and Andersen, K. H. (2019). Thermal performance of fish is explained by an interplay between physiology, behaviour and ecology. Cons. Physiol. 7:coz025. doi: 10.1093/conphys/coz025
Nisbet, R., Jusup, M., Klanjscek, T., and Pecquerie, L. (2012). Integrating dynamic energy budget (DEB) theory with traditional bioenergetic models. J. Exp. Biol. 215, 892–902. doi: 10.1242/jeb.059675
Norin, T., Malte, H., and Clark, T. D. (2014). Aerobic scope does not predict the performance of a tropical eurythermal fish at elevated temperatures. J. Exp. Biol. 217, 244–251. doi: 10.1242/jeb.089755
Núñez-Riboni, I., and Akimova, A. (2015). Monthly maps of optimally interpolated in situ hydrography in the North Sea from 1948 to 2013. J. Mar. Sys. 151, 15–34. doi: 10.1016/j.jmarsys.2015.06.003
Nussey, D. H., Wilson, A. J., and Brommer, J. E. (2007). The evolutionary ecology of individual phenotypic plasticity in wild populations. J. Evol. Biol. 20, 831–844. doi: 10.1111/j.1420-9101.2007.01300.x
Pauly, D. (2021). The gill-oxygen limitation theory (GOLT) and its critics. Sci. Adv. 7:eabc6050. doi: 10.1126/sciadv.abc6050
Payne, N. L., Smith, J., van der Meulen, D., Taylor, M., Watanabe, Y., Takahashi, A., et al. (2016). Temperature dependence of fish performance in the wild: Links with species biogeography and physiological thermal tolerance. Funct. Ecol. 30, 903–912. doi: 10.1111/1365-2435.12618
Perry, C., Salter, M., Harborne, A., Crowley, S. F., Jelks, H., and Wilson, R. (2011). Fish as major carbonate mud producers and missing components of the tropical carbonate factory. Proc. Natl. Acad. Sci. U.S.A. 108, 3865–3869. doi: 10.1073/pnas.1015895108
Petrik, C., Stock, C., Andersen, K., van Denderen, P., and Watson, J. (2020). Large pelagic fish are most sensitive to climate change despite pelagification of ocean food webs. Front. Mar. Sci. 7:588482. doi: 10.3389/fmars.2020.588482
Pontzer, H., Yamada, Y., Sagayama, H., Ainslie, P., Andersen, L., Anderson, L., et al. (2021). Daily energy expenditure through the human life course. Science 373, 808–812.
Pörtner, H. O., Bock, C., and Mark, F. C. (2017). Oxygen- and capacity-limited thermal tolerance: Bridging ecology and physiology. J. Exp. Biol. 220, 2685–2696. doi: 10.1242/jeb.134585
Pörtner, H.-O. (2021). Climate impacts on organisms, ecosystems and human societies: Integrating OCLTT into a wider context. J. Exp. Biol. 224(Pt Suppl 1):jeb238360. doi: 10.1242/jeb.238360
Rijnsdorp, A. D. (1990). The mechanism of energy allocation over reproduction and somatic growth in female North Sea plaice, Pleuronectes platessa L. Neth. J. Sea Res. 25, 279–289. doi: 10.1016/0077-7579(90)90027-E
Rooker, J. R., Secor, D., DeMetrio, G., Kaufman, A., Belmonte Ríos, A., and Ticina, V. (2008). Evidence of trans-Atlantic movement and natal homing of bluefin tuna from stable isotopes in otoliths. Mar. Ecol. Progr. Ser. 368, 231–239. doi: 10.3354/meps07602
Rutterford, L. A., Genner, M. G., Engelhard, G. H., Simpson, S. D., and Hunter, E. (2023). Fishing impacts on age-structure may conceal environmental drivers of body-size in exploited fish populations. ICES J. Mar. Sci. 80, 848–860. doi: 10.1093/icesjms/fsad014
Rutterford, L. A., Simpson, S. D., Jennings, S., Johnson, M. P., Blanchard, J. L., Schön, P. J., et al. (2015). Future fish distributions constrained by depth in warming seas. Nat. Clim. Change 5, 569–573. doi: 10.1038/nclimate2607
Sakamoto, T., Takahashi, M., Chung, M., Rykaczewski, R., Komatsu, K., Shirai, K., et al. (2022). Contrasting life-history responses to climate variability in eastern and western North Pacific sardine populations. Nat. Commun. 13:5298. doi: 10.1038/s41467-022-33019-z
Schulte, P. M. (2015). The effects of temperature on aerobic metabolism: Towards a mechanistic understanding of the responses of ectotherms to a changing environment. J. Exp. Biol. 218, 1856–1866. doi: 10.1242/jeb.118851
Schulte, P. M., Healy, T. M., and Fangue, N. A. (2011). Thermal performance curves, phenotypic plasticity, and the time scales of temperature exposure. Integr. Comp. Biol. 51, 691–702. doi: 10.1093/icb/icr097
Schwarcz, H. P., Gao, Y., Browne, D., Knyf, M., and Brand, U. (1998). Stable carbon isotope variations in otoliths of Atlantic cod (Gadus morhua). Can. J. Fish. Aquat. Sci. 55, 1798–1806. doi: 10.1139/f98-053
Shephard, S., Trueman, C., Rickaby, R., and Rogan, E. (2007). Juvenile life history of NE Atlantic orange roughy from otolith stable isotopes. Deep Sea Res. 54, 1221–1230. doi: 10.1016/j.dsr.2007.05.007
Sherwood, G. D., and Rose, G. A. (2003). Influence of swimming form on otolith delta 13C in marine fish. Mar. Ecol. Progr. Ser. 258, 283–289.
Sinnatamby, R. N., Brian Dempson, J., Reist, J. D., and Power, M. (2015). Latitudinal variation in growth and otolith-inferred field metabolic rates of Canadian young-of-the-year Arctic charr. Ecol. Freshw. Fish. 24, 478–488. doi: 10.1111/eff.12166
Skelly, D. K., Joseph, L., Possingham, H., Freidenburg, L., Farrugia, T., Kinnison, M., et al. (2007). Evolutionary responses to climate change. Conserv. Biol. 21, 1353–1355. doi: 10.1111/j.1523-1739.2007.00764.x
Smoliński, S., Denechaud, C., von Leesen, G., Geffen, A., Grønkjær, P., Godiksen, J., et al. (2021). Differences in metabolic rate between two Atlantic cod (Gadus morhua) populations estimated with carbon isotopic composition in otoliths. PLoS One 16:e0248711. doi: 10.1371/journal.pone.0248711
Solomon, C. T., Weber, P., Cech, J. Jr., LIngram, B., Conrad, M., Machavaram, M., et al. (2006). Experimental determination of the sources of otolith carbon and associated isotopic fractionation. Can. J. Fish. Aquat. Sci. 63, 79–89. doi: 10.1139/f05-200
Speakman, J. R. (1998). The history and theory of the doubly labeled water technique. Am. J. Clin. Nutr. 68, 932S–938S. doi: 10.1093/ajcn/68.4.932S
Speakman, J. R. (1999). “The cost of living: Field metabolic rates of small mammals,” in Advances in ecological research, eds A. H. Fitter and D. G. Raffaelli (Cambridge, MA: Academic Press), 177–297. doi: 10.1016/S0065-2504(08)60019-7
Tohse, H., and Mugiya, Y. (2008). Sources of otolith carbonate: Experimental determination of carbon incorporation rates from water and metabolic CO2, and their diel variations. Aquat. Biol. 1, 259–268. doi: 10.3354/ab00029
Treberg, J., Killen, S., MacCormack, T., Lamarre, S., and Enders, E. (2016). Estimates of metabolic rate and major constituents of metabolic demand in fishes under field conditions: Methods, proxies, and new perspectives. Comp. Biochem. Physiol. A Mol. Integr. Physiol. 202, 10–22. doi: 10.1016/j.cbpa.2016.04.022
Trueman, C. N., Chung, M.-T., and Shores, D. (2016). Ecogeochemistry potential in deep time biodiversity illustrated using a modern deep-water case study. Philos. Trans. R. Soc. Lond. B Biol. Sci. 371:20150223. doi: 10.1098/rstb.2015.0223
Trueman, C. N., Rickaby, R. E. M., and Shephard, S. (2013). Thermal, trophic and metabolic life histories of inaccessible fishes revealed from stable-isotope analyses: A case study using orange roughy Hoplostethus atlanticus: Hoplostethus atlanticus life history. J. Fish Biol. 83, 1613–1636. doi: 10.1111/jfb.12267
Urca, T., Levin, E., and Ribak, G. (2021). Insect flight metabolic rate revealed by bolus injection of the stable isotope 13C. Proc. Biol. Sci. 288:20211082. doi: 10.1098/rspb.2021.1082
van Keeken, O. A., van Hoppe, M., Grift, R. E., and Rijnsdorp, A. D. (2007). Changes in the spatial distribution of North Sea plaice (Pleuronectes platessa) and implications for fisheries management. J. Sea Res. 57, 187–197. doi: 10.1016/j.seares.2006.09.002
Vinton, A. C., and Vasseur, D. A. (2022). Resource limitation determines realized thermal performance of consumers in trophodynamic models. Ecology Letters 25, 2142–2155. doi: 10.1111/ele.14086
Violle, C., Enquist, B., McGill, B., Jiang, L., Albert, C. H., Hulshof, C., et al. (2012). The return of the variance: Intraspecific variability in community ecology. Trends Ecol. Evol. 27, 244–252. doi: 10.1016/j.tree.2011.11.014
Weidman, C. R., and Millner, R. (2000). High-resolution stable isotope records from North Atlantic cod. Fish. Res. 46, 327–342. doi: 10.1016/S0165-7836(00)00157-0
Welch, K., Péronnet, F., Hatch, K., Voigt, C. C., and McCue, M. D. (2016). Carbon stable-isotope tracking in breath for comparative studies of fuel use. Ann. N. Y. Acad. Sci. 1365, 15–32. doi: 10.1111/nyas.12737
Keywords: ecophysiology, metabolic theory, biomineral, fisheries, carbon isotope (δ13C)
Citation: Jones J, Hunter E, Hambach B, Wilding M and Trueman CN (2023) Individual variation in field metabolic rates of wild living fish have phenotypic and ontogenetic underpinnings: insights from stable isotope compositions of otoliths. Front. Ecol. Evol. 11:1161105. doi: 10.3389/fevo.2023.1161105
Received: 07 February 2023; Accepted: 17 May 2023;
Published: 13 June 2023.
Edited by:
Keith Alan Hobson, Western University, CanadaReviewed by:
Steven Y. Litvin, Monterey Bay Aquarium Research Institute (MBARI), United StatesCopyright © 2023 Jones, Hunter, Hambach, Wilding and Trueman. This is an open-access article distributed under the terms of the Creative Commons Attribution License (CC BY). The use, distribution or reproduction in other forums is permitted, provided the original author(s) and the copyright owner(s) are credited and that the original publication in this journal is cited, in accordance with accepted academic practice. No use, distribution or reproduction is permitted which does not comply with these terms.
*Correspondence: Clive N. Trueman, dHJ1ZW1hbkBzb3Rvbi5hYy51aw==
Disclaimer: All claims expressed in this article are solely those of the authors and do not necessarily represent those of their affiliated organizations, or those of the publisher, the editors and the reviewers. Any product that may be evaluated in this article or claim that may be made by its manufacturer is not guaranteed or endorsed by the publisher.
Research integrity at Frontiers
Learn more about the work of our research integrity team to safeguard the quality of each article we publish.