 Xizhi Nong
 Xianjie Yi1
 Dongguo Shao
94% of researchers rate our articles as excellent or good
Learn more about the work of our research integrity team to safeguard the quality of each article we publish.
Find out more
ORIGINAL RESEARCH article
Front. Ecol. Evol., 18 April 2023
Sec. Interdisciplinary Climate Studies
Volume 11 - 2023 | https://doi.org/10.3389/fevo.2023.1159187
This article is part of the Research TopicHydrological and Hydrochemical Processes in Fragile EcosystemsView all 9 articles
The impact of the operation of inter-basin water diversion projects on the integrity and stability of regional ecosystems cannot be ignored. In this study, water quality samplings were conducted monthly at 16 national monitoring sites in the mid-downstream of the Hanjiang River (HJR, the downstream of the water source of the South-to-North Water Diversion Project of China) over 3 years, covering seven physiochemical water quality indicators and six heavy metal elements. The water quality index (WQI) and multivariate statistical techniques were introduced to comprehensively evaluate water quality status and understand the corresponding driving factors of water quality variations. The heavy metal risks were evaluated using the Nemerow Pollution Index (Pn), the Heavy Metal Pollution Index (HPI), and the human health risk assessment model. The results showed that after the operation of the Middle Route of the South-to-North Water Diversion Project of China (MRSNWDPC), water quality in the mid-downstream of the HJR was generally at a “good” status, with the average WQI of 86.37, showing no water quality deterioration trends. The operation of the MRSNWDPC did significantly decrease the monthly flow in the HJR by about 4.05–74.27%, and the flow variation processes also became more stable than before. Most water quality indicators and WQIs have no correlations with the flow and water level changes. The human health risks of all heavy metal elements caused by dermal exposure and ingestion pathways increased over time. The average individual health risk caused by carcinogenic heavy metal Cr was the highest. Chromium is the major carcinogenic factor and should be a critical indicator to pay special attention to for water risk management in the HJR. This study provides a scientific reference for the water quality safety management of HJR under the influence of a water diversion project.
With rapid population growth, economic development, and industrialization observed in the past few decades, the water scarcity issue in human societies has become a global challenge of critical importance (Oki et al., 2003). It is projected that by the end of the year 2050, industrial development and population growth alone may result in at least 1.8 billion people living under moderate stress of water resources shortage worldwide, 80% of which will be in developing countries (Schlosser et al., 2014). Inter-basin water diversion projects have been proven effective in solving the uneven water resource distribution issue (Guo et al., 2020). For instance, one of the longest world-renowned inter-basin water diversion projects, i.e., the Middle Route of the South-to-North Water Diversion Project of China (MRSNWDPC), which has supplied more than 50 billion m3 of water resources to North China since December 2014, benefiting more than 100 million people (Jing et al., 2022). However, despite the significant economic and social benefits, such mega hydro-projects have made the environmental and ecological effects on the water source area and downstream river systems more complicated than ever before (Zhou et al., 2014). Hence, the various arguments have been continuously controversial (Zhang C. et al., 2021).
Related debates above are mainly focused on the possible adverse impacts of the construction and operation of inter-basin water diversion projects on the integrity of the regional environmental ecosystem and the stability of water quality (Wang et al., 2019; Alnahit et al., 2020; Mishra et al., 2021). It is generally believed that the hydrodynamic condition changes of downstream rivers caused by the water diversion activities could directly affect the riverbed topography and the self-purification capacity of water bodies, which in turn change the regional hydro-ecosystem (Dai et al., 2018; Jiang et al., 2020; Zhao et al., 2020). Additionally, the downstream water resources reduction would make it hard to improve water quality by diluting pollutants in river systems (Yuan et al., 2021). Many experts were more concerned that those negative impacts or trends may be lagging and coupling, and it is difficult to thoroughly figure them out in the early stage of project construction and operation (Nong et al., 2020). Therefore, the water quality regimes and related driving factors in the downstream regions need to be systematically monitored and explored after the project operation, which is vital for making scientific engineering management policies and guidelines (Noori et al., 2019).
Hanjiang River (HJR) is the longest tributary of the Yangtze River (the third longest river in the world), where the Danjiangkou Reservoir (DJKR) was built on the HJR’s trunk stream and served as the core water source of the MRSNWDPC. Over the years, a large body of studies has been conducted on the water environment issues in this typical region (Zhu et al., 2008; Qi et al., 2019). One of the most critical concerns is the possible water quality deterioration caused by the water diversion campaign (Xia et al., 2020). It has been reported that the operation of the MRSNWDPC could lead to a significant decrease in both the annual flow discharge and the water environment capacity of the middle and lower reaches of the HJR and an increase in the risks of ecosystem degradation and water pollution (Chen and Zhang, 2015; Kalogianni et al., 2017; Jing et al., 2019). However, previous studies were mainly focused on limited physiochemical indicators and/or trace elements in specific sections of the trunk or several tributaries, while comprehensive studies with physiochemical indicators and heavy metals have seldom been reported (Cheng et al., 2021; Zhang J. H. et al., 2021). In addition, owing to the limitations of monitoring economic costs and the availability of a full suite of water quality indicator data, most of the studies were conducted in a few monitoring sites and sampled within a short study period or early before the operation of water diversion (Li et al., 2008). In other words, the above limitations of the dataset and indicators directly lead to representativeness and comprehensiveness insufficiency of achievements in water quality risk analysis. There is still a lack of comprehensive research on the water quality variations under the influence of water diversion project operations in this typical high-population density region (Liu et al., 2018).
The water quality index (WQI) method has been widely used to evaluate surface water quality in different water bodies. Several WQI models have been developed in the past decades, e.g., the Horton index, CCME-WQI, NSF-WQI, and OWQI (Rana et al., 2018; Ashwin et al., 2022; Maansi Jindal and Wats, 2022; Marselina et al., 2022). Compared with the traditional water quality evaluation method, the WQI can combine multiple parameters and effectively transforms them into a single value reflecting the water quality status. Therefore, the WQI method is an effective tool that can provide comprehensive water quality information for water quality management (Wu et al., 2018). The heavy metal pollution index (HPI) has been widely used for evaluating heavy metal pollution in different water bodies. It can provide a comprehensive understanding of the specific impact of each heavy metal on water quality (Sharma et al., 2020). The Nemerow Pollution Index was widely used to convert available heavy metal monitoring data into a classification score to evaluate the degree of contamination. It is relatively easy to apply, and its results are easy to interpret by professionals and nonexperts (Haque et al., 2020). The health risk assessment method combines water pollution risk with human health, effectively reflecting the regional water environment to human health (Adimalla et al., 2019; Varol et al., 2021). Combining those indicators can provide informative ways of evaluating surface water quality (Shakeri et al., 2022).
Considering the above gaps and influencing factors, this article takes the HJR, a typical area affected by the operation of large-scale inter-basin water diversion projects, as a study case. Based on 16 national water quality sampling sites, 13 water quality parameters were collected and analyzed during a 3-year monitoring period. The aims of this research were (1) to analyze and illustrate the spatiotemporal variations of water quality in the middle and lower reaches of the HJR after the operation of the MRSNWDPC, (2) to identify and understand the key driving factors affecting water quality variation, and (3) to evaluate the human health risks and heavy metal pollution regimes for resident drinking water from the DJKR. This study will provide a scientific basis and informative reference for understanding the impact of inter-basin water diversion projects on the water source area and downstream river systems, as well as contributing to regional water environmental and ecological protection and management for similar projects worldwide.
HJR is the longest tributary of the Yangtze River, with a total river basin area covering 168,400 km2. The DJKR, located in the dividing point between the middle and upper reaches of the HJR, has served as the core water source for the MRSNWDPC since December 2014. The trunk from the DJKR to Wuhan City (capital of the Hubei Province) is collectively referred to as the middle and lower reaches of the HJR. The above region is one of the most critical grain-producing regions and the hub eco-economic zone in China, with an average annual crop production of 2.4 × 10⁷ t, accounting for more than 12% of the national production (Wang Y. et al., 2018). The water quality safety of the middle and lower reaches of the HJR is directly related to the domestic drinking water healthy of 27 million residents and the food production security in this region (Feng et al., 2016). Especially in the past two decades, the rapid development of agricultural and social activities has raised the discharge of domestic sewage and nutrient inputs, which has increased the pollution loading of the mid-downstream of the HJR, resulting in the deterioration of the water environment. Considering that most anthropogenic activities are concentrated in the middle and lower reaches of the HJR and the importance of water quality protection in these regions, this study mainly focus on the effect of inter-basin water diversion project operation changes on the water quality in the mid-downstream of the HJR. Detailed information regarding the DJKR, river systems, water quality samples sites, and hydrometeorological monitoring stations is shown in Figure 1 and Table 1.
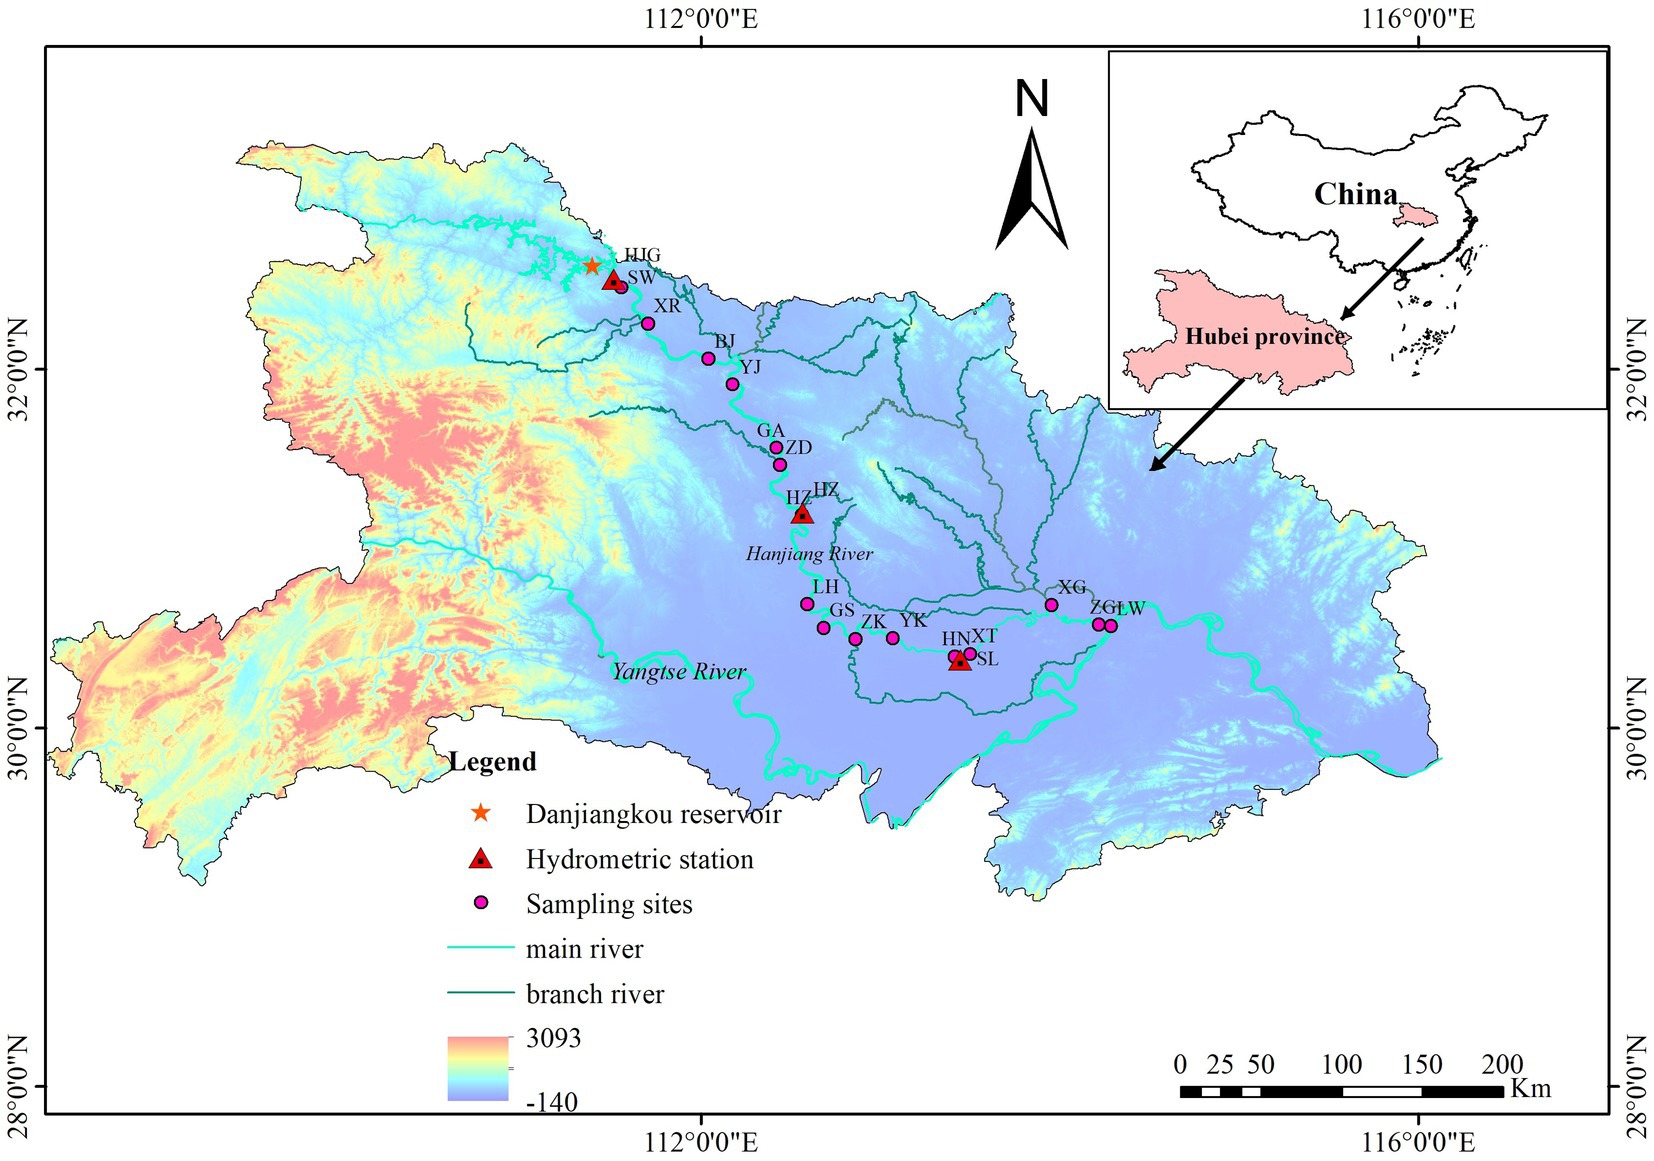
Figure 1. Locations of water quality sampling sites and hydrometeorological monitoring stations in this study.
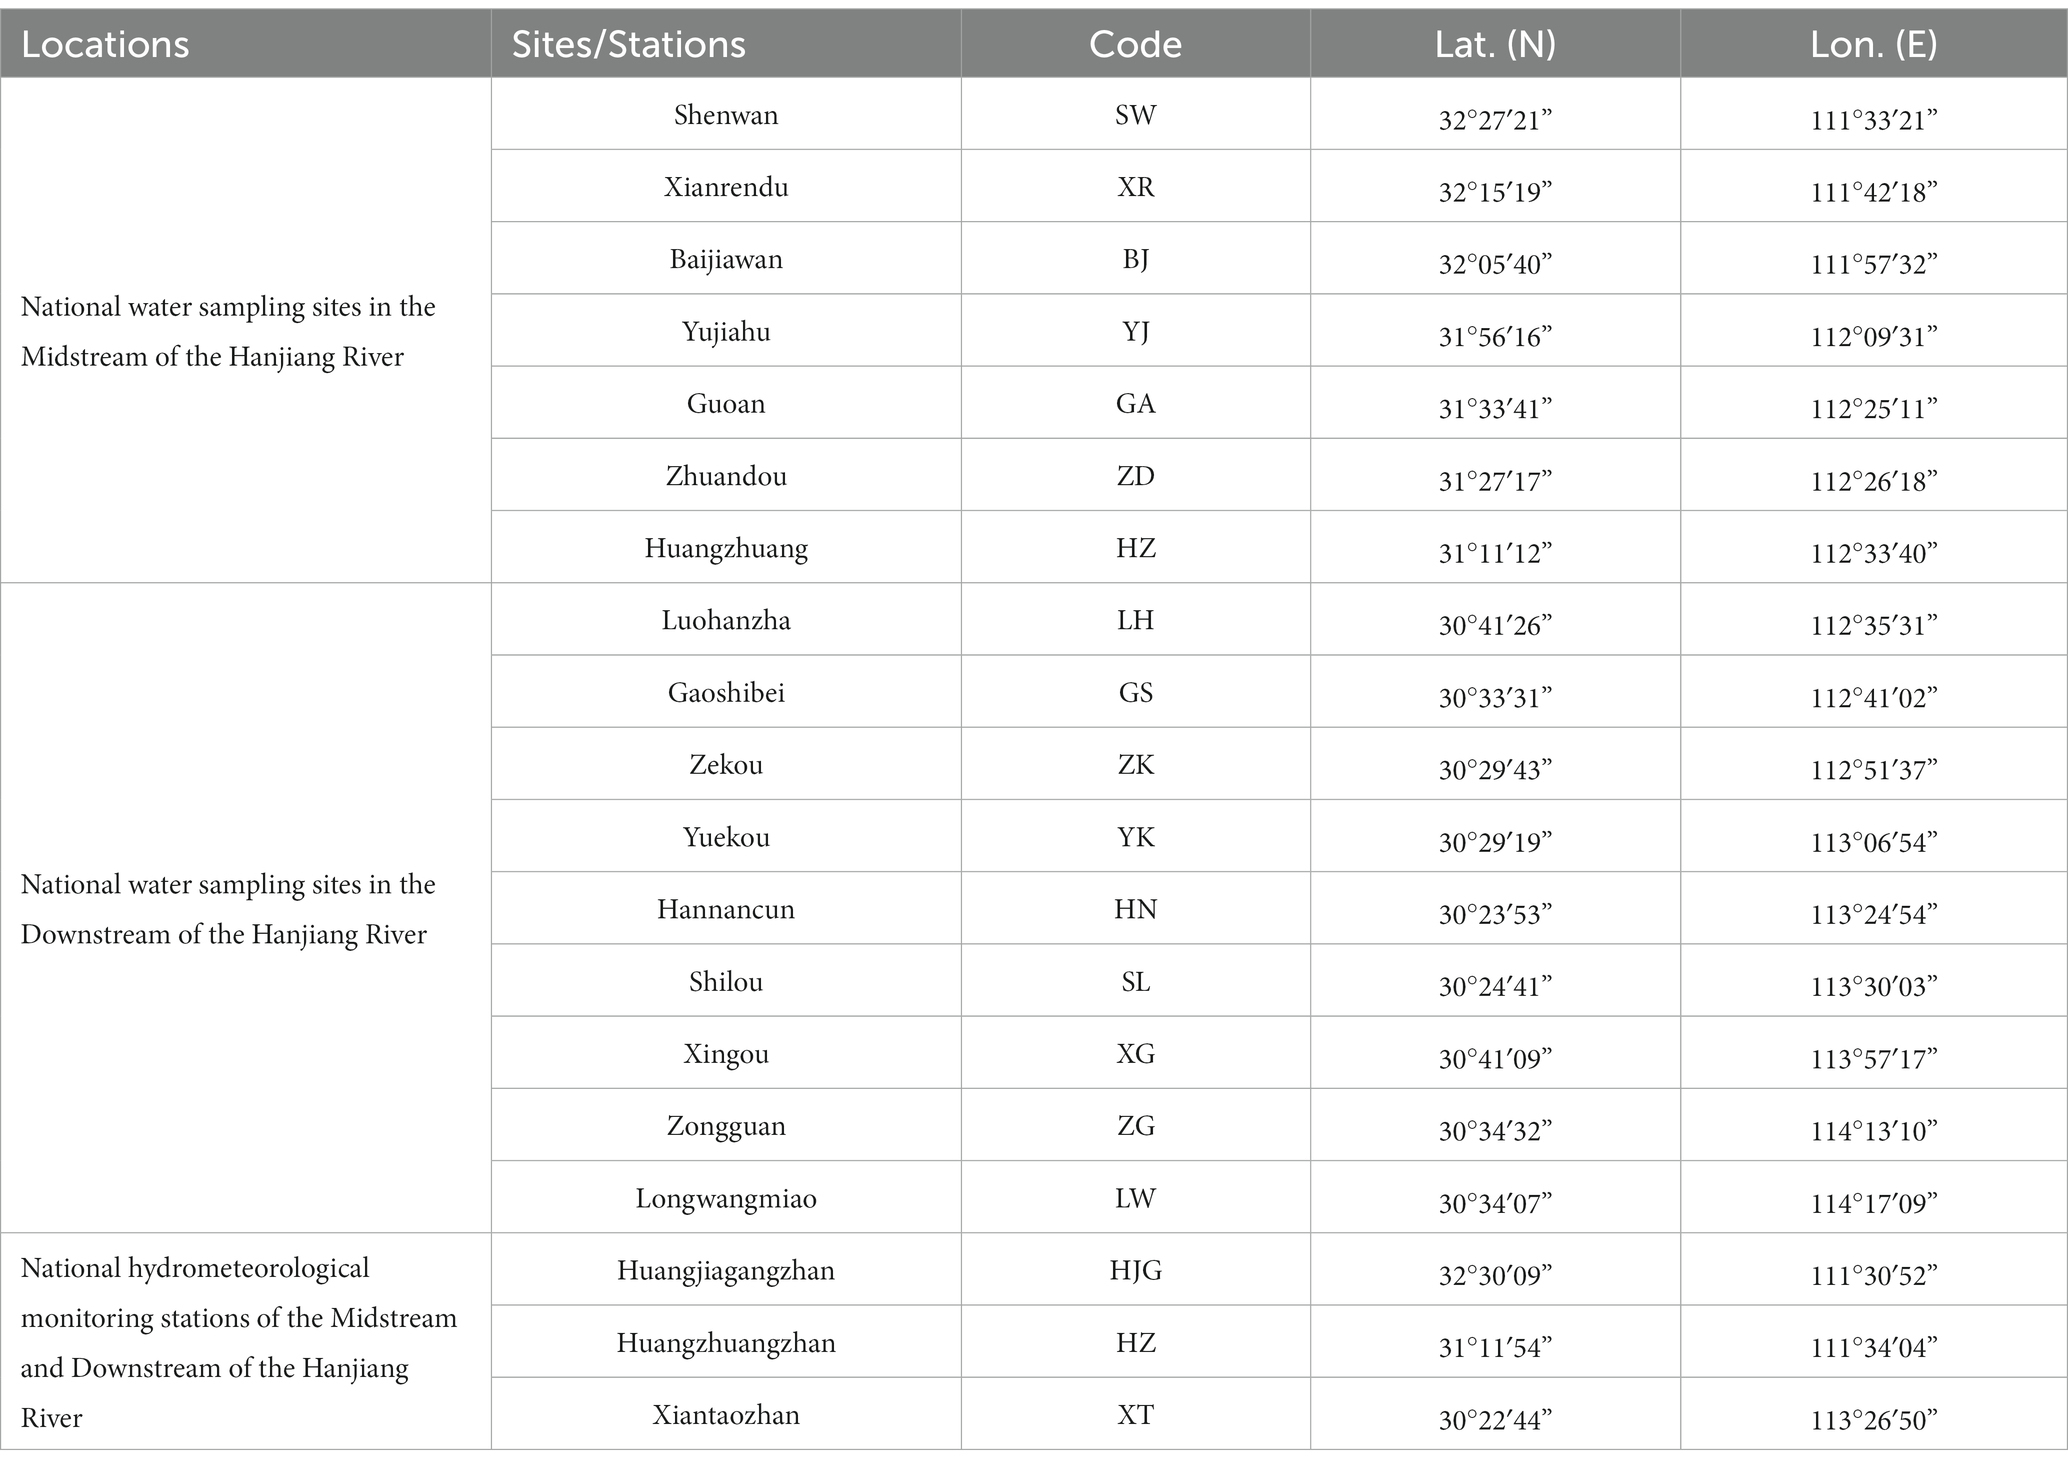
Table 1. Geographic coordinates and locations the water quality sampling sites and hydrometeorological monitoring stations in midstream and downstream of the Hanjiang River.
In this study, water samples were monitored and collected monthly by the Hubei Provincial Bureau of Hydrology and Water Resources (HPBHWR) from 16 national water quality monitoring sites in the middle and lower reaches of the HJR from January 2015 to December 2017, with 13 water quality parameters in total (Table 2). Additionally, four hydrological and meteorological items from three national hydrometeorological monitoring stations (located in the SW, HZ, and SL sampling sites) were recorded synchronously, i.e., the discharge (Q, m3/s), water level (WL, m), rainfall (RF, mm), and air temperature (AT, °C). As part of the national monitoring program, the HPBHWR has a comprehensive quality control/quality assurance system in place to ensure that data generated by the national monitoring program are reliable and of sufficient accuracy and precision (see Supplementary Table S1 for more detail). The monitoring standards and methods for sampling and analyses in detail can be found in the Ministry of Ecology and Environment of China (in Chinese)1 and (Wu et al., 2018). The season periods in this study are defined as follows: March to May as “spring,” June to August as “summer,” September to November as “autumn,” and December to February of the next year as “winter,” respectively.
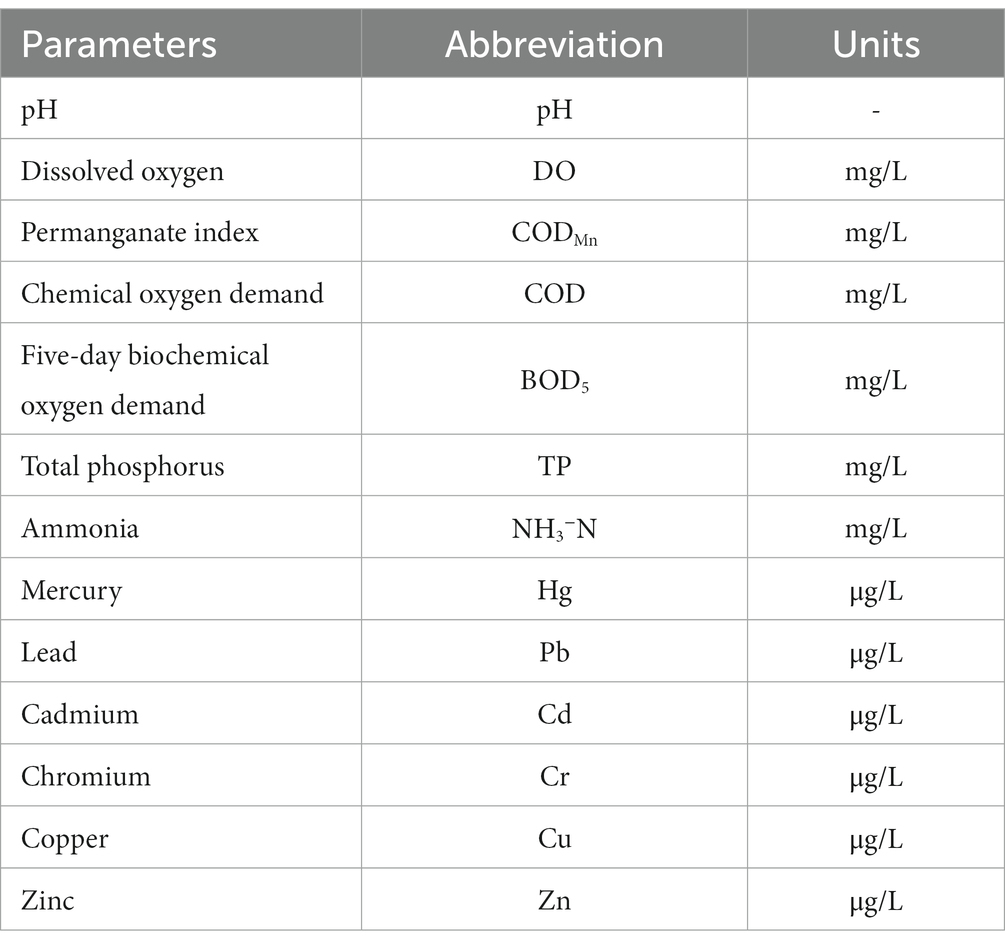
Table 2. The 13 water quality parameters monitored in this study.
In this study, the Mann-Kendall (M-K) test was used to analyze the temporal trends of water quality indicators (|Z| > 1.96, p < 0.05) (Guclu, 2018). The one-way ANOVA (p < 0.05) was used to verify the spatial variations of water quality indicators in different sites (Tolley et al., 2006). Cluster analysis methods were used to classify the monitoring sections spatially and to identify spatial variations characteristic of specific indicators (Hill and Lewicki, 2006; Wang et al., 2012). Pearson correlation analysis and Spearman correlation analysis were applied to studying the possible correlation and homologous/heterogeneous characteristics between multi-indicators (Noori et al., 2010; Panda et al., 2018). The stepwise multiple linear regression method was used to select and determine the key factors affecting the water quality variations. The data used above were pre-processed by the log transformation (i.e., lg(x + 1)) (Prathumratana et al., 2008).
In this study, the Nemerow pollution index ( ) and heavy metal pollution index (HPI) were applied to assess the impact of heavy metals in water bodies on human health risks (Reza and Singh, 2010; Yang et al., 2014; Hu et al., 2018; Yin et al., 2020). According to the value, the water quality rating is classified into five levels, i.e., “safe (< 0.7),” “precaution (0.7 to 1.0),” “slightly pollution (1.0 to 2.0),” moderate pollution (2.0–3.0),” “heavy pollution (> 3.0),” respectively (Yang et al., 2022). Details of parameters are shown in Supplementary Tables S2, S3. The classification of water pollution can be defined as four levels according to the HPI values, i.e., “low pollution (<15),” “moderate pollution (15 to 30),” “moderate to heavy pollution (30 to 100),” “heavy pollution (> 100),” respectively (Qu et al., 2018; Wu et al., 2020).
The specific human health risks of ingestion and dermal exposure pathways for adults and children were calculated based on the health risk evaluation models (Zhao and Li, 2022). In this study defined the Cr and Cd as the “carcinogenic” elements, and the Cu, Zn, Hg, and Pb as the “non-carcinogenic” elements, respectively. Details of human health risk assessment parameters are shown in Supplementary Table S4.
To assess non-carcinogenic risks associated with metals, hazard quotients (HQs) were calculated. Only Cr has specific carcinogenic slope factor among the elements in this study thus the carcinogenic risk was calculated using the Cr (Varol and Tokatli, 2023). Detailed information on all the parameters can be found in Supplementary Tables S5, S6.
The water quality index method was used to evaluate the water quality (Pesce and Wunderlin, 2000). Detailed information on weight selection is shown in Supplementary Table S7. The classification of water quality status can be defined as five levels according to the WQI values, i.e., “excellent (91 to 100),” “good (71 to 90),” “medium (51 to 70),” “bad (26 to 50),” and “very bad (0 to 25),” respectively.
Seasonal variations of the 13 water quality indicators were showed in Figure 2. It can be found that the DO exhibited a seasonality variation pattern of highest concentration in winter and lowest in summer every year. Starting from the spring of 2016, the seasonal average concentrations of BOD5 continuously decreased while the seasonal pH values raised in fluctuation. Other physiochemical indicators and heavy metal elements showed no obvious pattern in terms of seasonal changes by year, while the seasonal average concentrations of Cr, Cu, Zn, and Hg in the year 2016 and 2017 were higher than those of 2015.
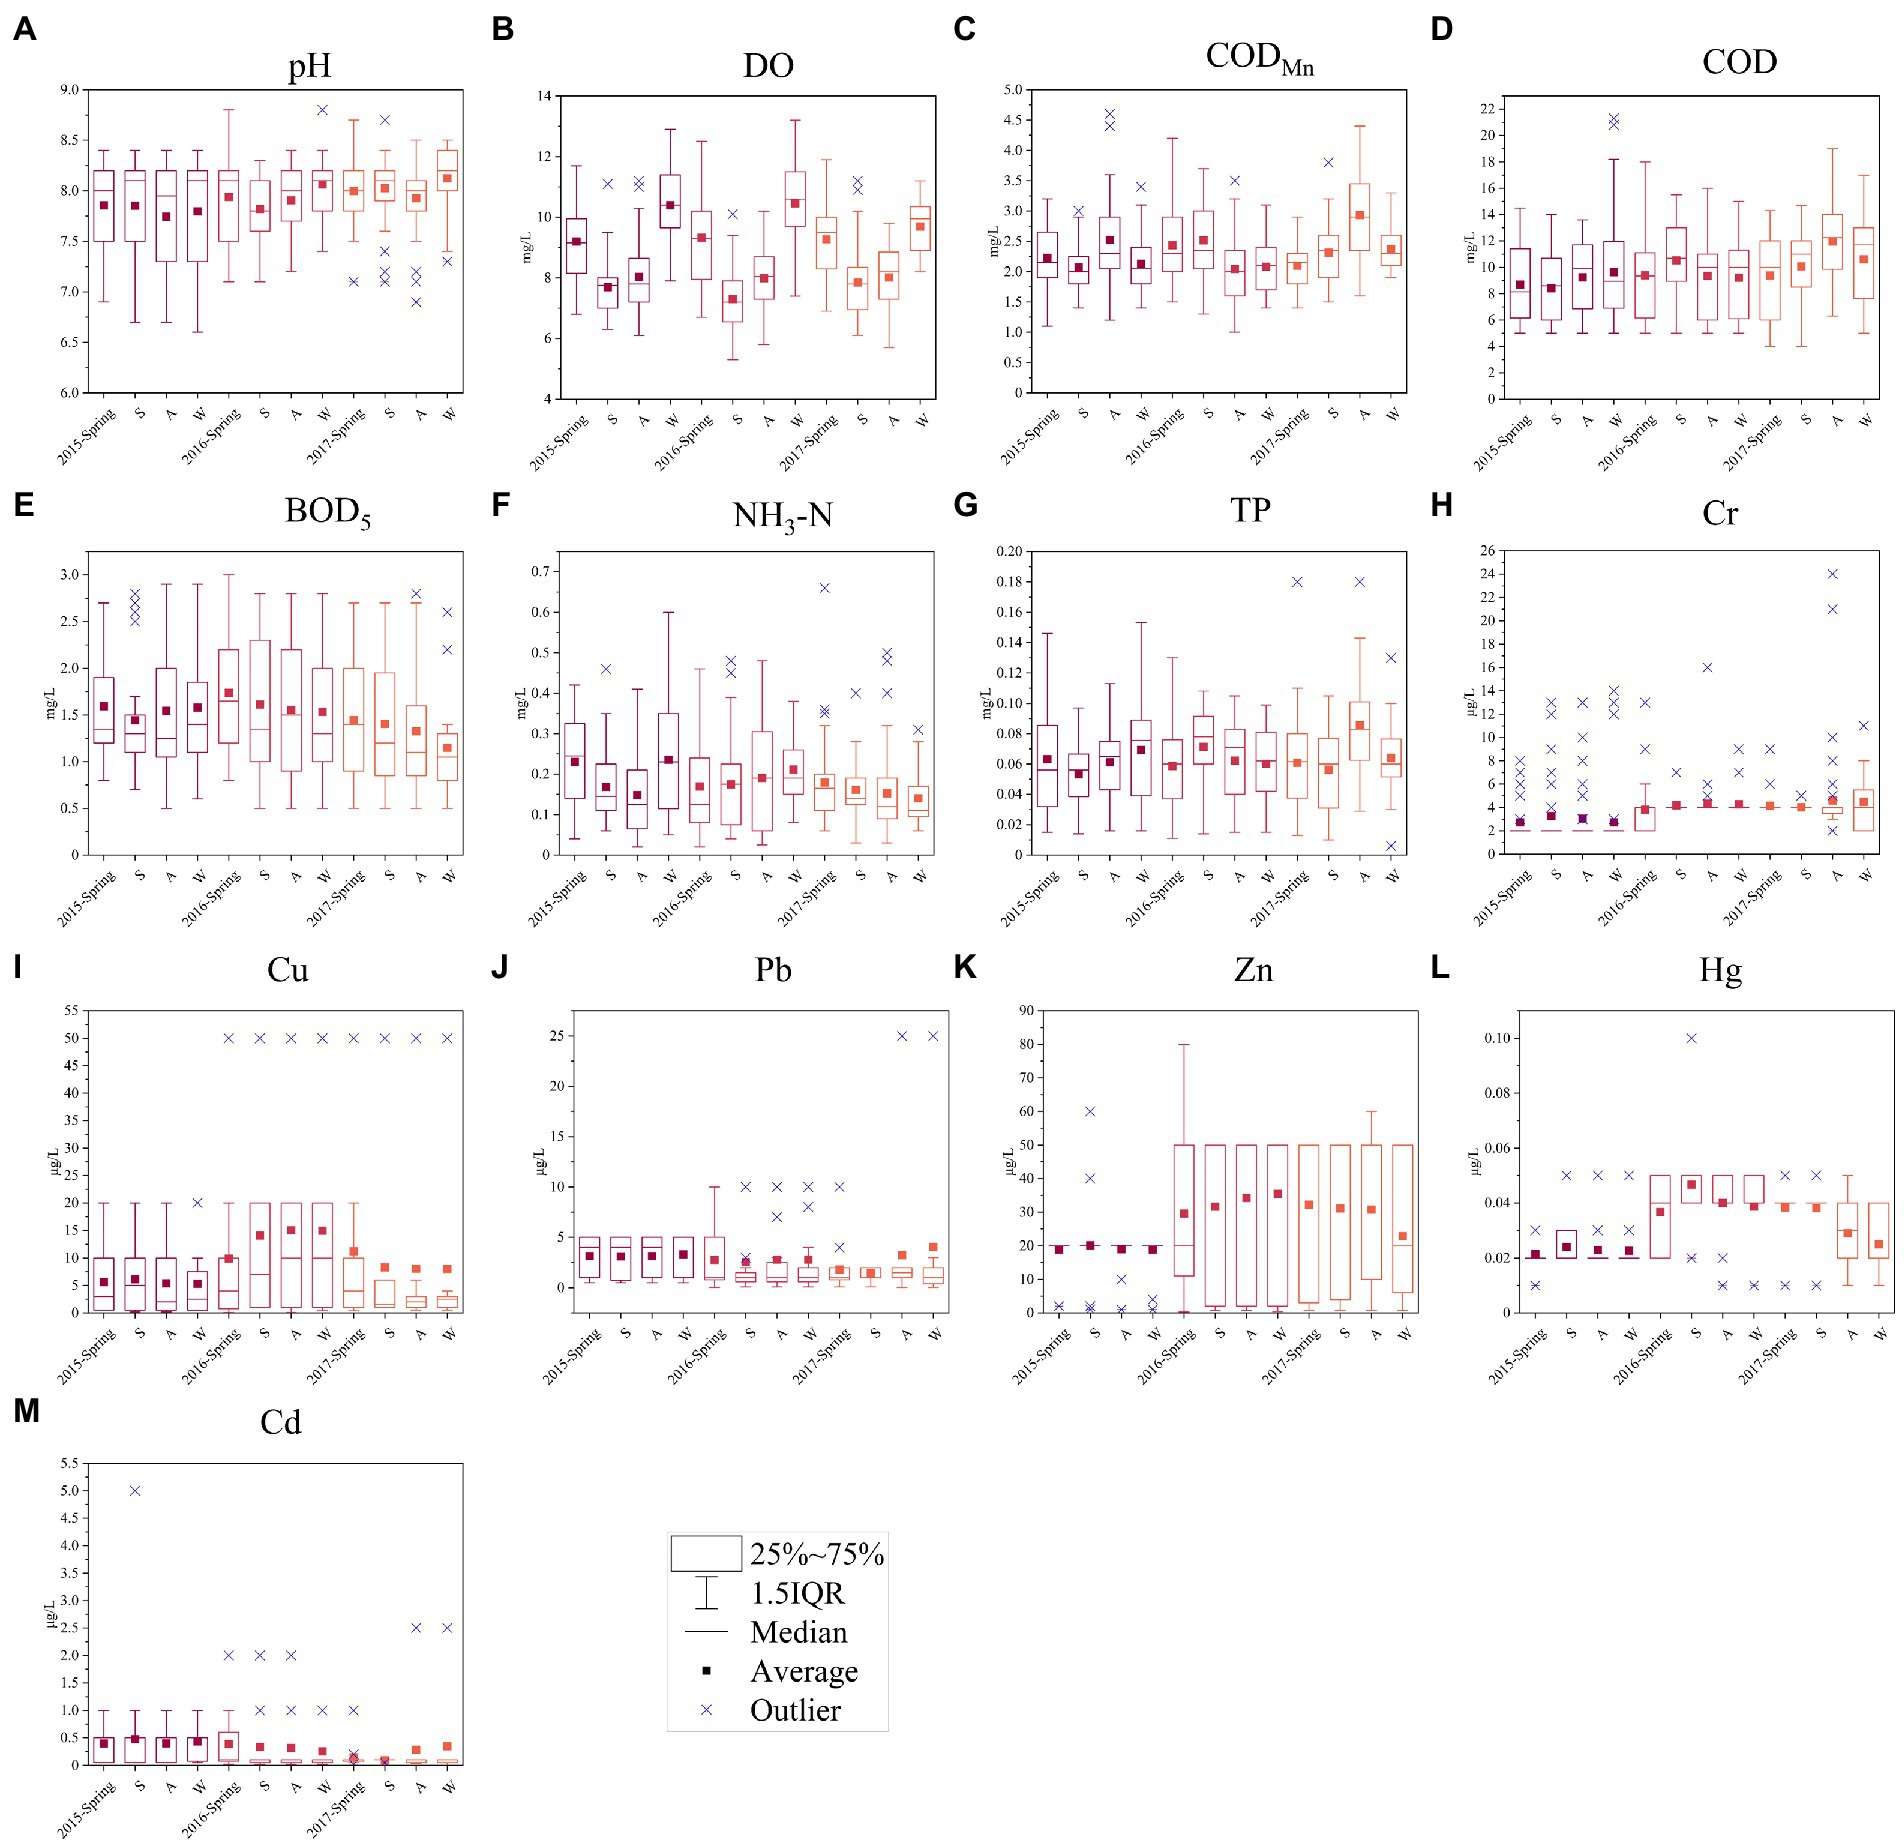
Figure 2. Seasonal variations of 13 water quality indicators in the Hanjiang River from 2015 to 2017 at 16 sampling sites: (A) pH, (B) DO, (C) CODMn, (D) COD, (E) BOD5, (F) NH3-N, (G) TP, (H) Cr, (I) Cu, (J) Pb, (K) Zn, (L) Hg, (M) Cd (Note: the S, A, and W in the X axis represent summer, autumn, and winter, respectively).
The temporal trends of each water quality indicator of 16 sampling sites based on the M-K test were presented in Figure 3. There were six monitoring sites (XR, ZD, HZ, and three consecutive sections from YK to SL) that have significantly increasing trends of pH, while two sites (GA & GS) displayed decreasing trends. A total of four sites (HN and three consecutive sections of XG to LW) showed significant increasing trends of COD, and sites YK to LW showed significant decreasing trends of BOD5. Only one site (XR) showed a significant upward trend of the NH3−N, while most sites (11/16) showed a downward trend. Most of the sampling sites showed significant upward trends in Cu, Zn, Hg, and Cr (10/16, 11/16, 12/16, and 13/16, respectively), while only five different sites have significant increasing trends in Cd and Pb.
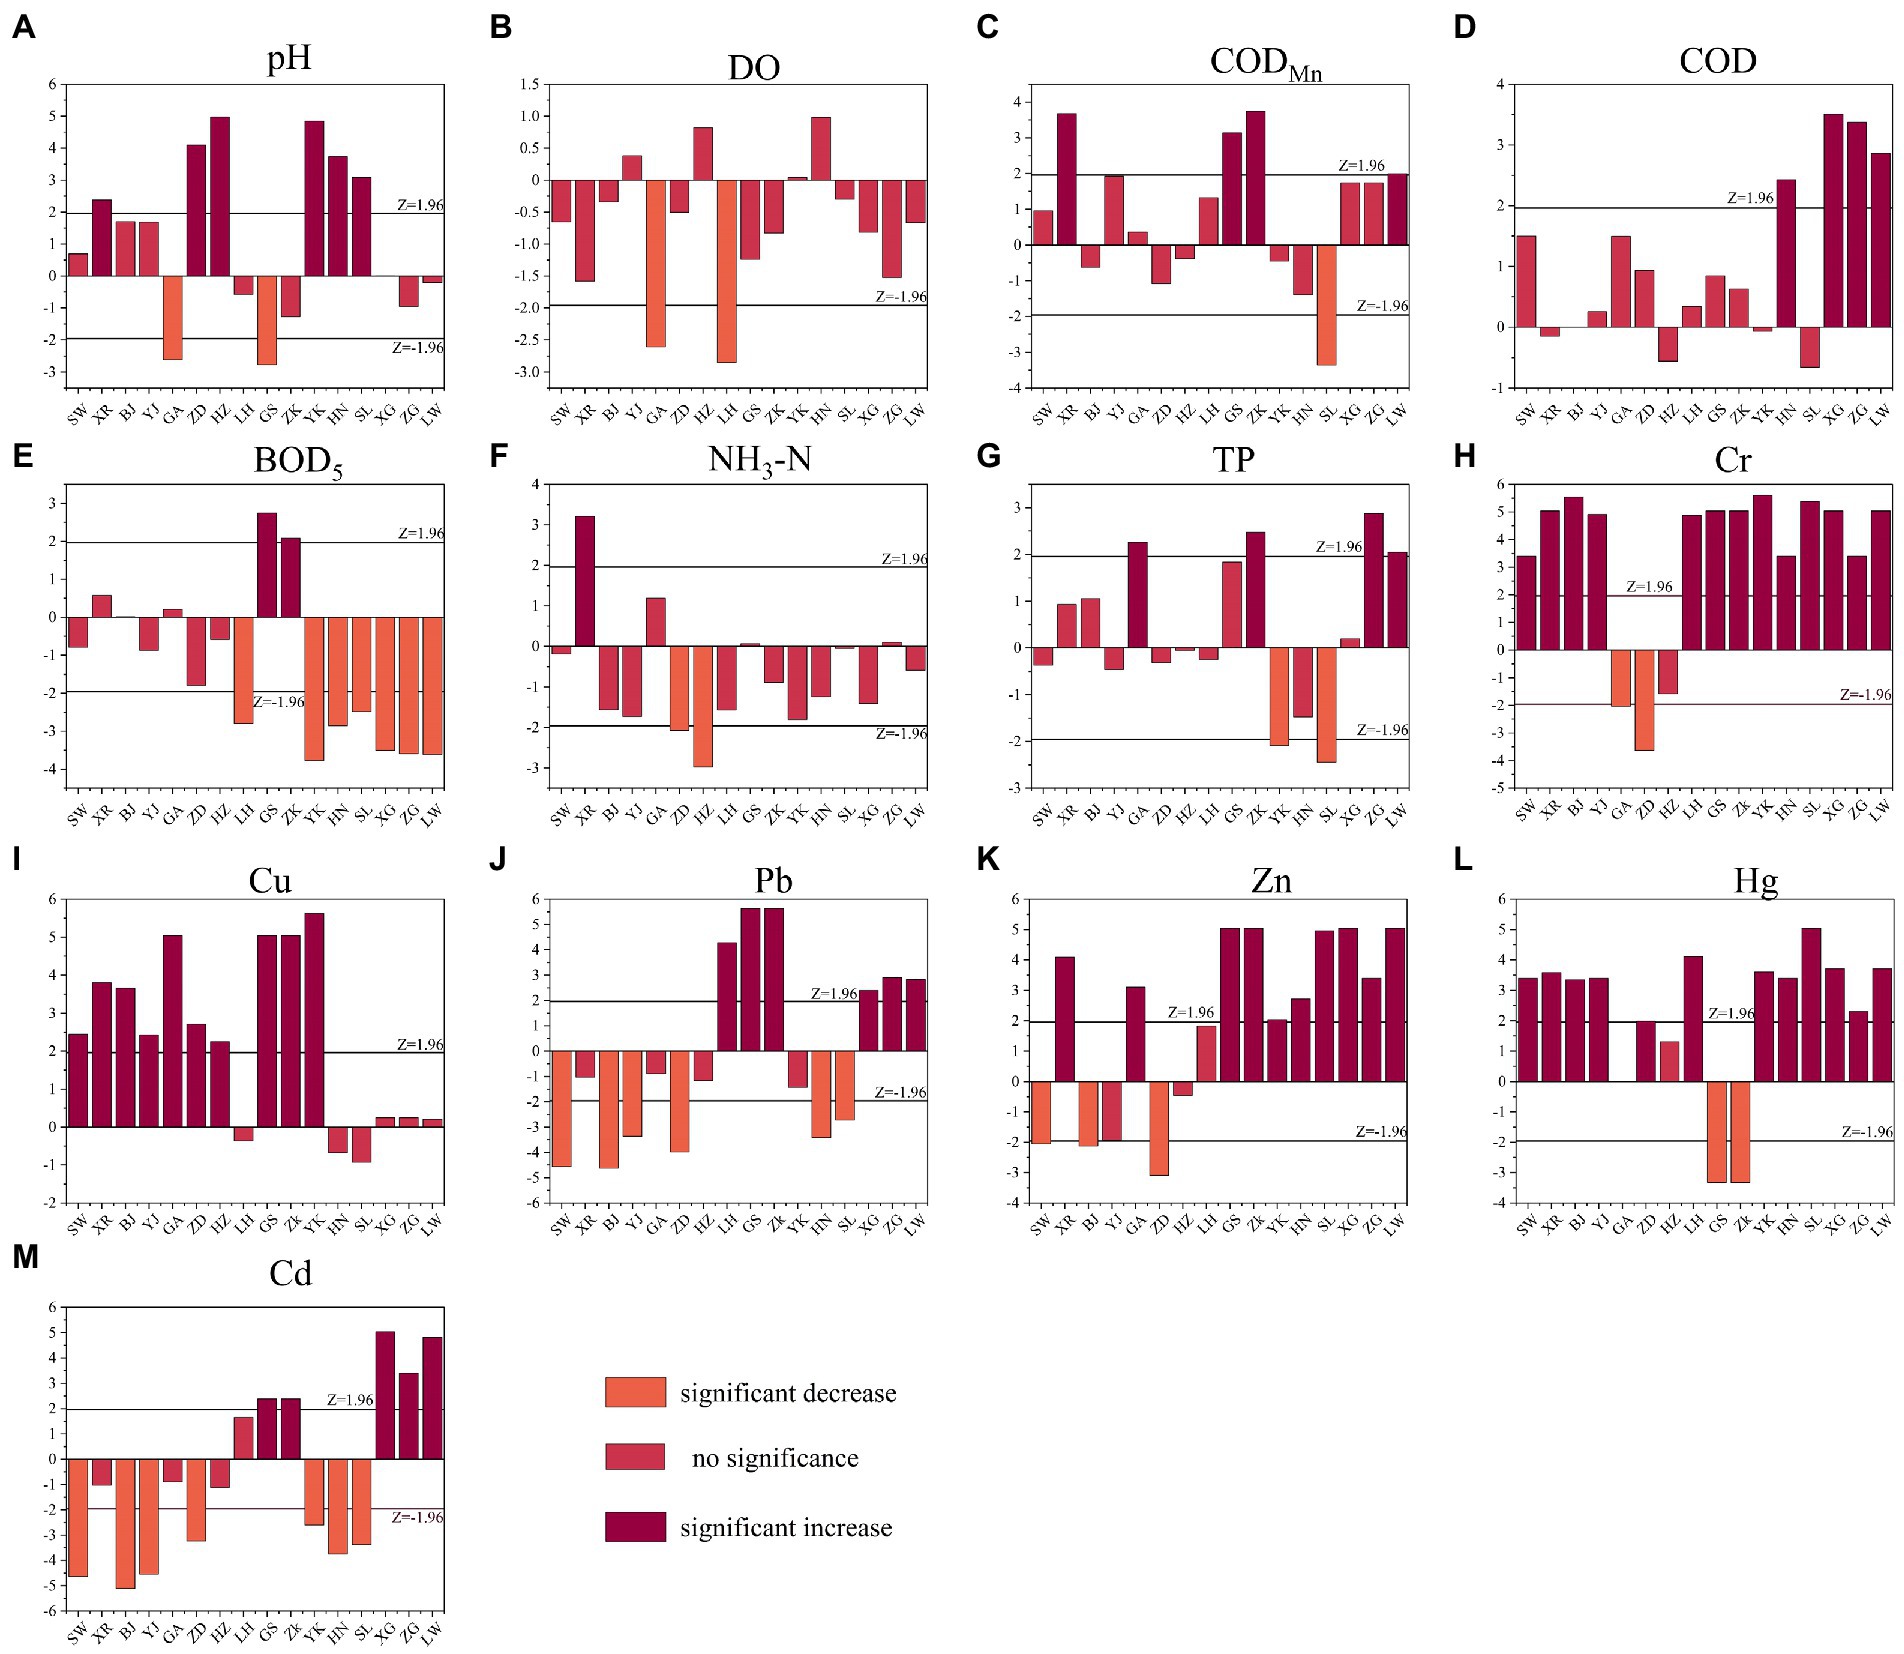
Figure 3. The Mann-Kendall test results of water quality indicators at different sites in the Hanjiang River: (A) pH, (B) DO, (C) CODMn, (D) COD, (E) BOD5, (F) NH3-N, (G) TP, (H) Cr, (I) Cu, (J) Pb, (K) Zn, (L) Hg, (M) Cd.
The statistical summary of the monitored water quality indicators in each site can be found in Table 3. The results showed that the highest average pH value (8.21) was observed in BJ and LH, while the lowest was in YK (7.46), indicating that the HJR was kept in a weak alkaline status in general. The average concentrations of DO in all sampling sites ranged from 8.12 to 9.73 mg/L, and all met Class I of the surface water quality standard in China (China, 2002). All the sampling sites have average CODMn concentrations higher than 2.0 mg/L, except for the SW and XR. The average COD concentrations showed a fluctuating increase trend, and the sections from HN to LW had higher COD (>11.30 mg/L) than the others. The average concentrations of BOD5 in all sites were less than 3.0 mg/L and all in line with Class I standard. The average concentrations of NH3−N from BJ to LH exceeded 0.2 mg/L, while the highest average concentrations were measured in YJ (0.31 mg/L). Although the average TP concentrations were generally higher than 0.07 mg/L from site HZ to LW (except for YK), those of which detected samples still met the Class II standard (<0.1 mg/L). The average concentrations of Cr, Pb, Hg, Zn, and Cd met the Class I standard, while Cu met Class I or II. Additionally, the one-way ANOVA results showed significant spatial heterogeneity (p < 0.01) of each water quality indicator. Generally, each water quality indicator in the middle and lower reaches of the HJR met the Class I or II standards.
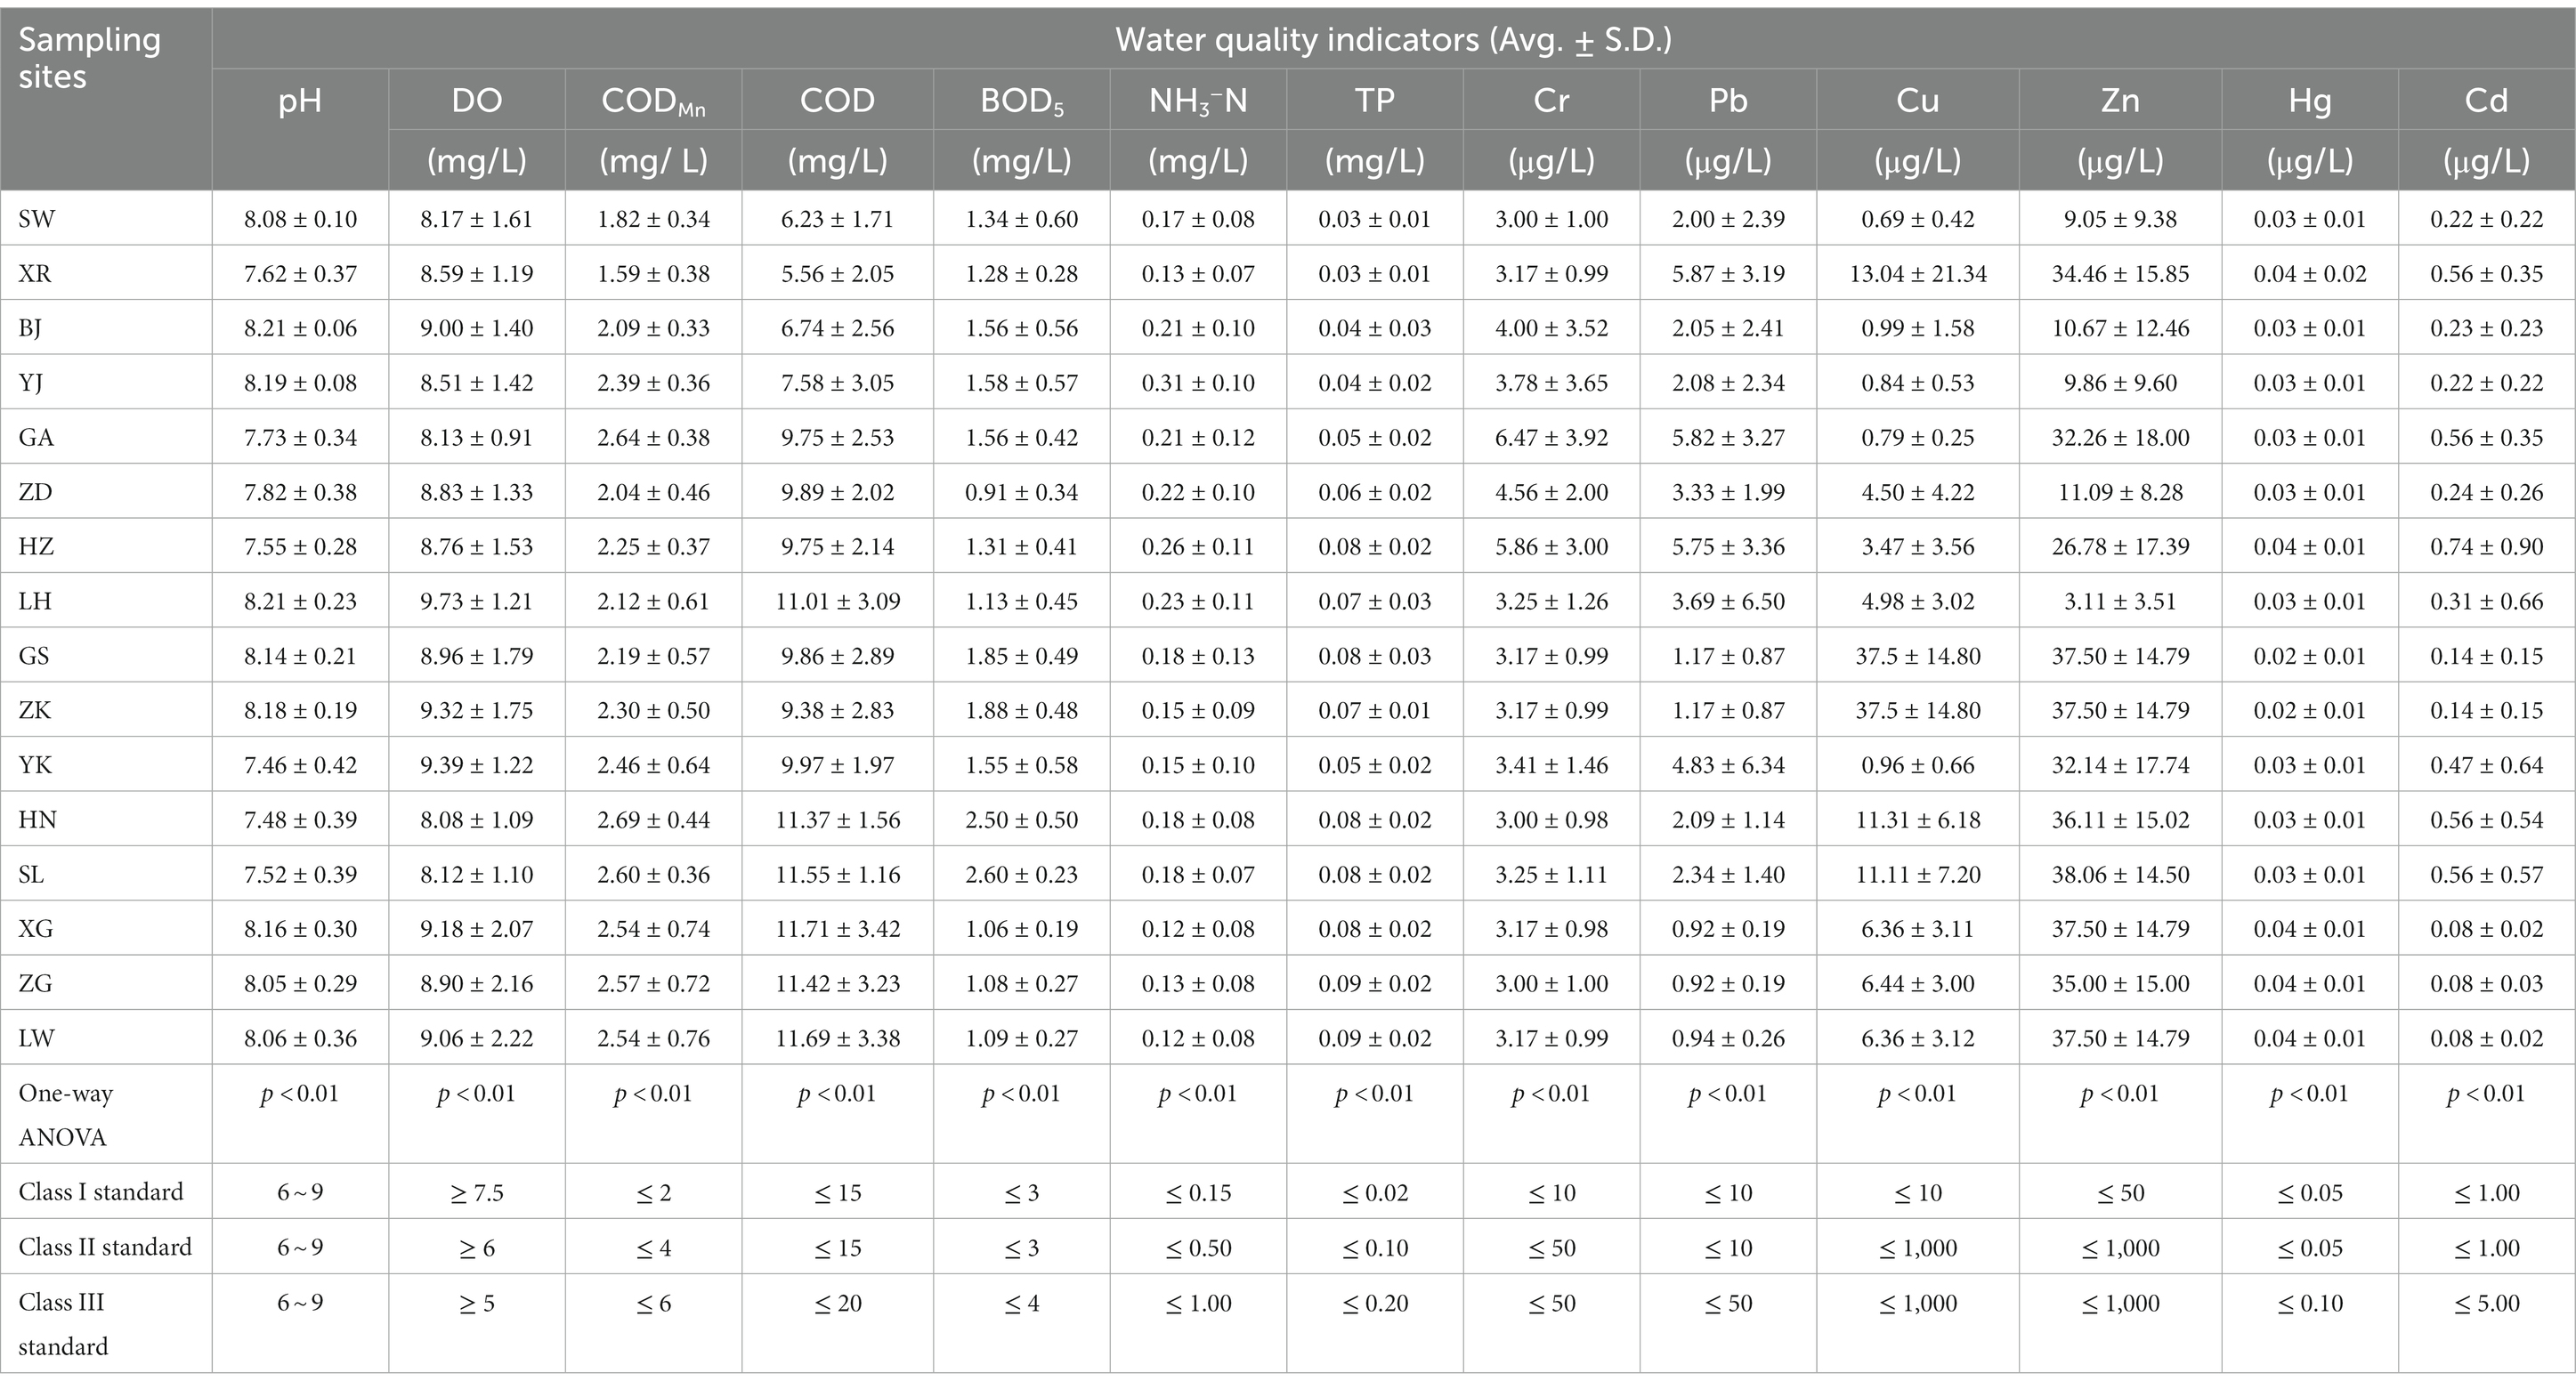
Table 3. Water quality summarized as the average and standard deviation for the 16 sampling sites in the middle and downstream of the Hanjiang River (Avg.: Average; S.D.: standard deviation).
The 16 water quality sampling sites can be divided into six spatial cluster categories (groups), i.e., “cluster a” (sites SW and XR), “cluster b” (sites BJ and YJ), “cluster c” (sites GA to HZ), “cluster d” (sites GS to YK), “cluster e” (sites HN and SL), and “cluster f” (sites LH, ZG to LW) based on the cluster analysis (Figure 4), respectively. All six spatial cluster categories basically depended on the adjacent sites’ geographical locations. From the clustering results of water quality indicators, NH3−N, TP, and six heavy metal elements were in the same levels (< 2). CODMn and BOD5 were in another range from “2 to 5”, and the rest of the physiochemical parameters (i.e., COD, pH, and DO) were higher than “6”, which can reflect the spatial characteristics of regional water quality variation.
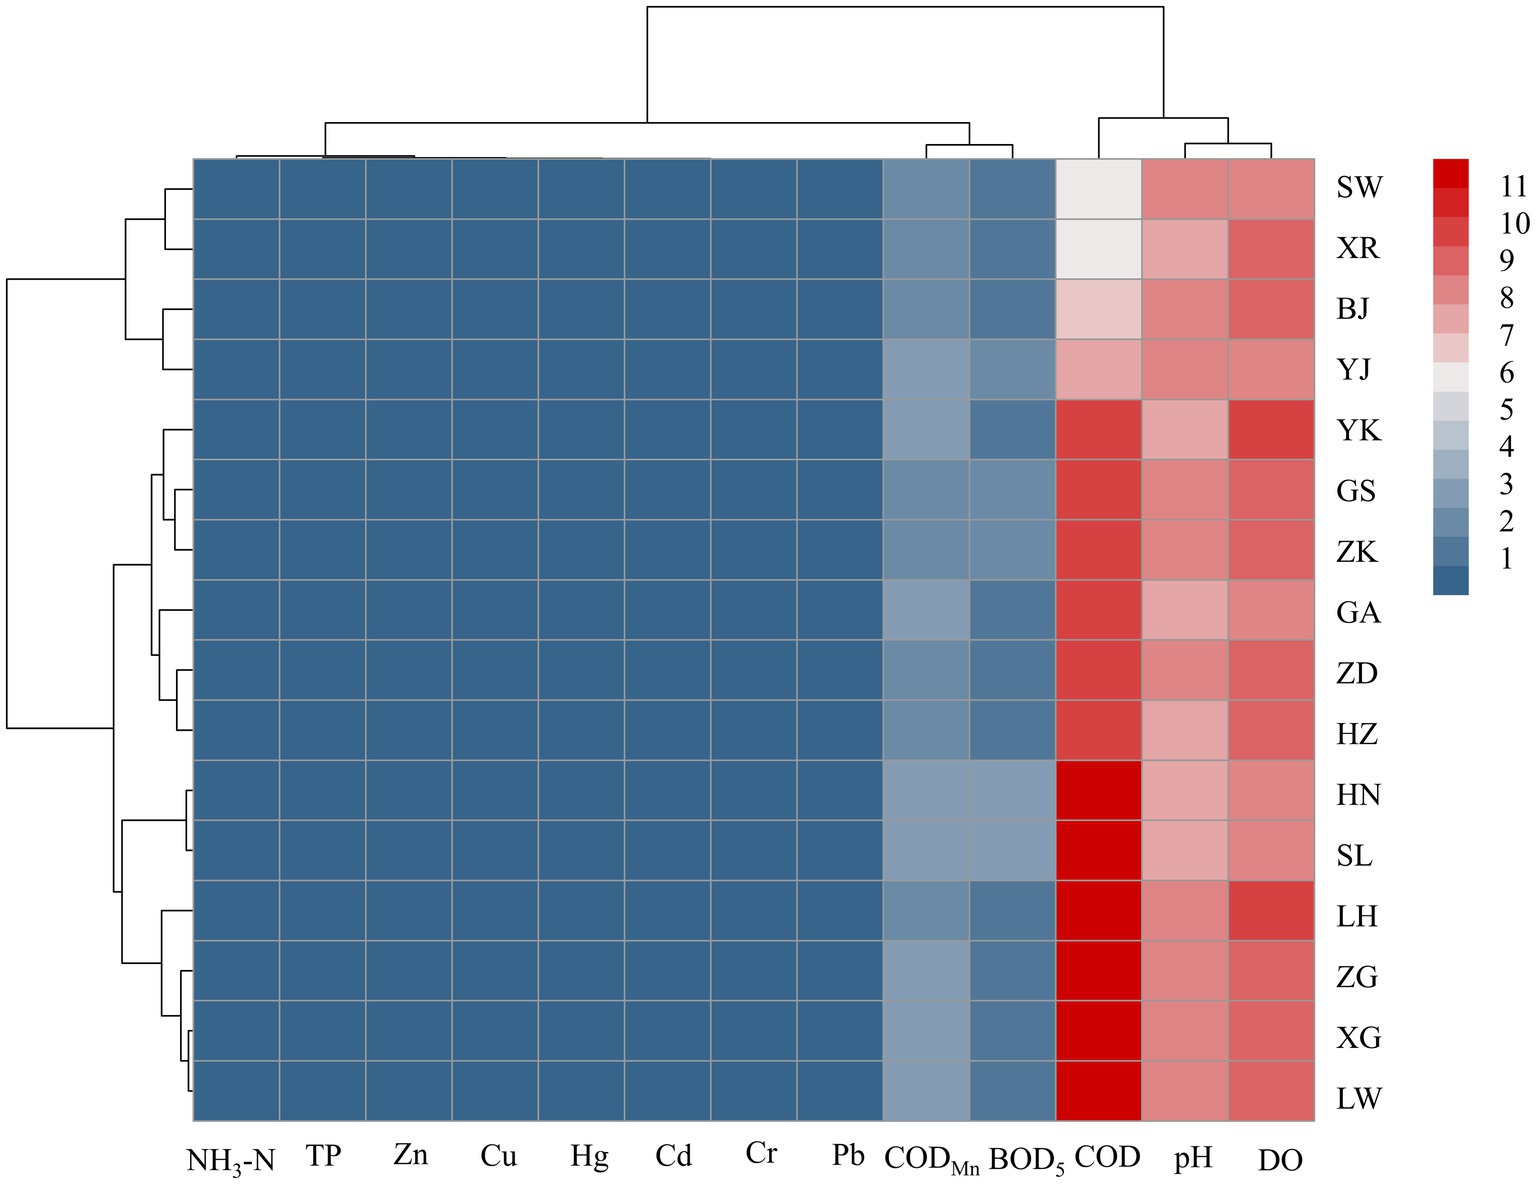
Figure 4. Cluster analysis results of water quality indicators and sampling sites.
According to the spatial clustering, the results of Pearson correlations of different water quality indicators were shown in Figure 5. The pairs of “Cr–Hg,” “Pb–Cu,” and “Zn–Cd” in “cluster a” showed a significantly strong positive (r = 0.656 to 0.993) correlations; The pair of “Pb–Cd,” “Pb–Hg” in “cluster b” showed a significant strong positive (r = 0.997) and negative (r = −0.817) correlation, respectively. Similar significant strong positive and/or negative correlations of heavy metal elements can also be found from “cluster c” to “cluster f,” e.g., the pair of “Pb–Cd” (r = 0.950, cluster d), “Zn–Cd” (r = 0.989, cluster f). For another aspect, the correlations between the physiochemical water quality indicators of each cluster varied with weak and/or moderate coefficients, e.g., the pair of “NH3−N–pH” from “cluster a” to “cluster f.”
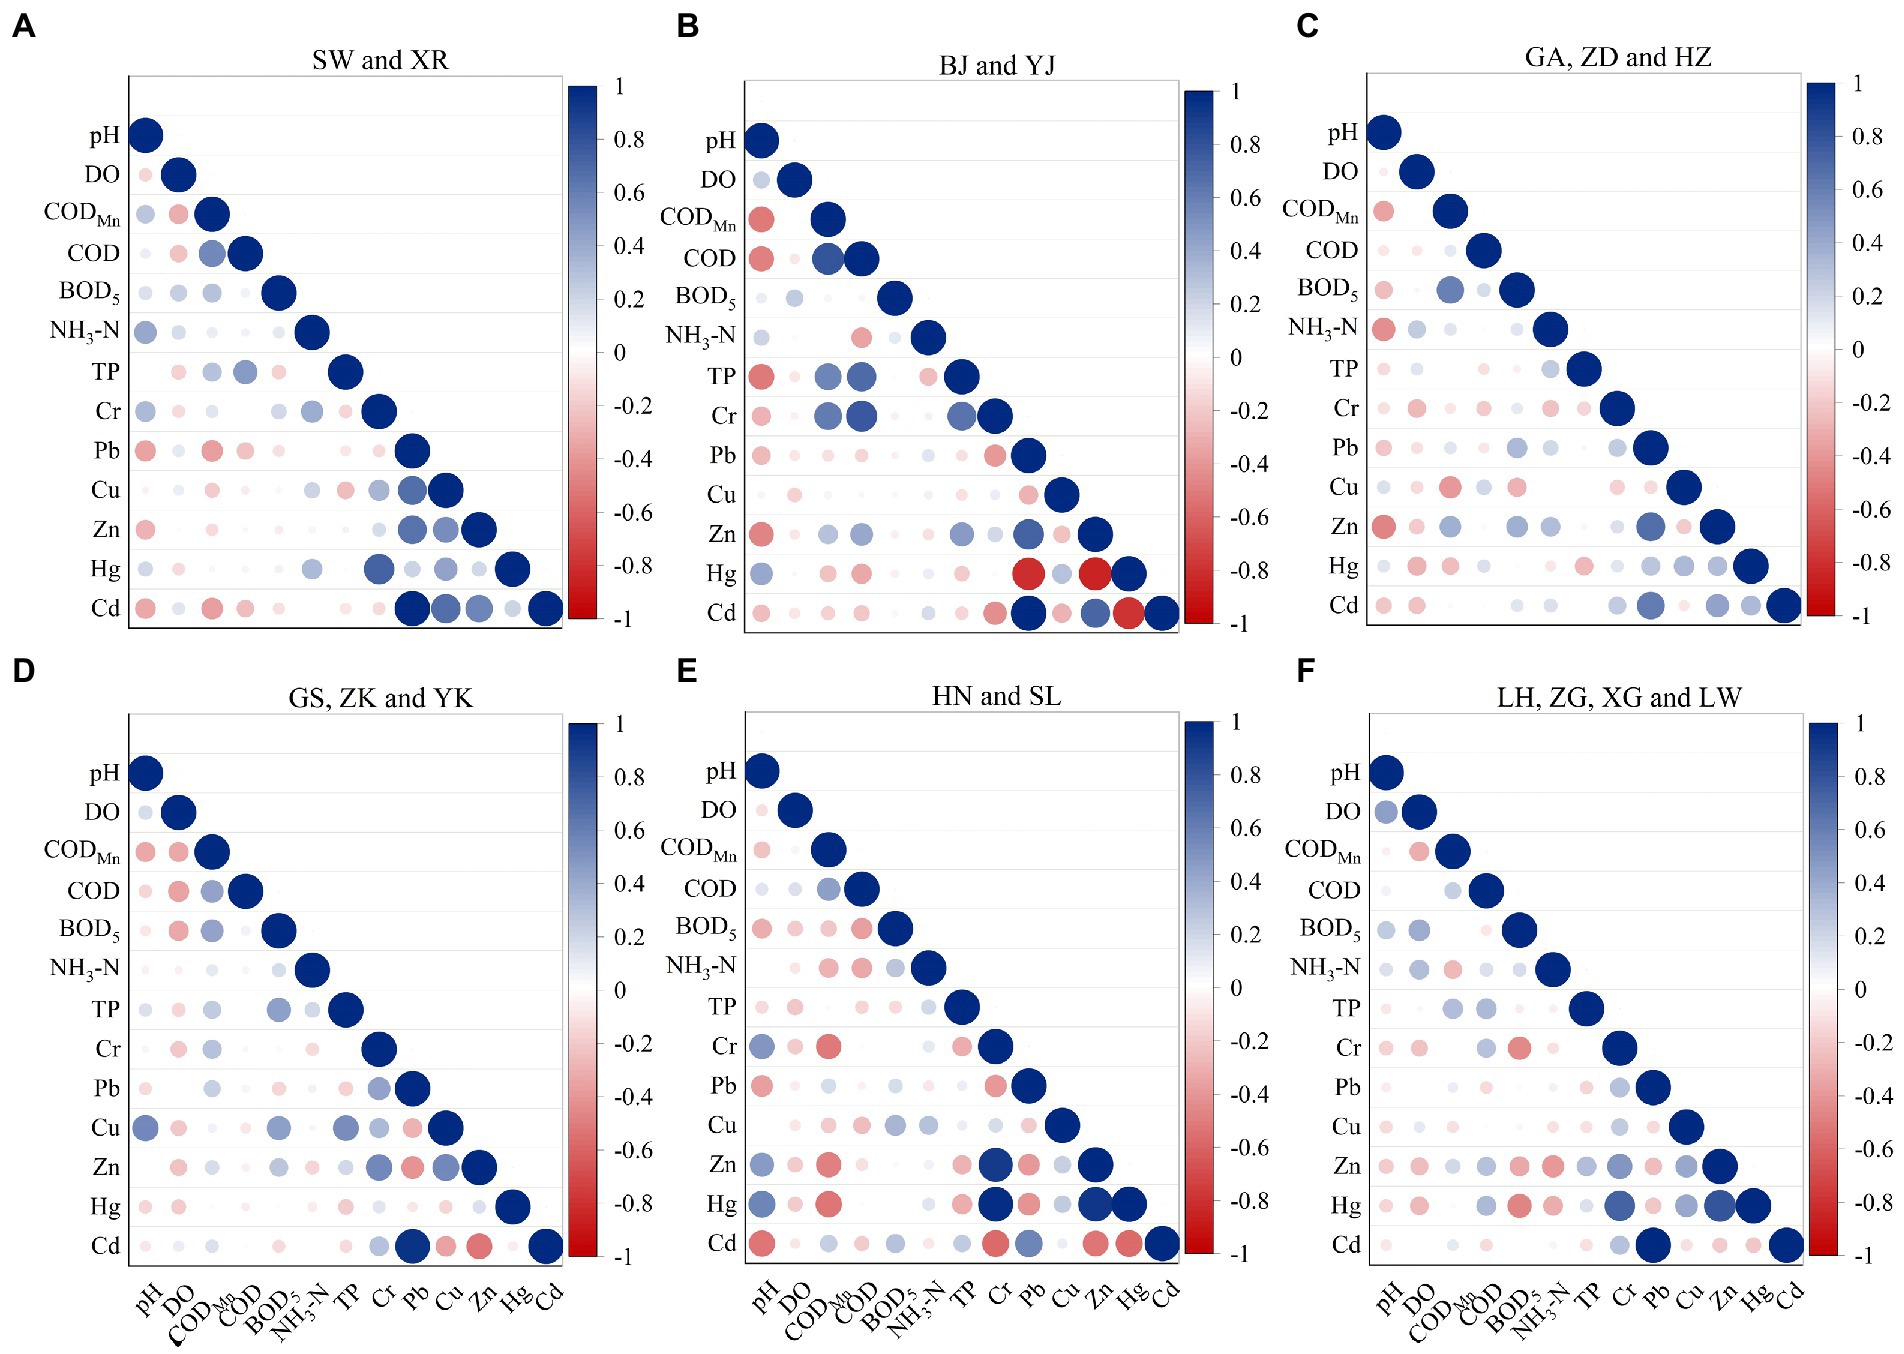
Figure 5. Pearson correlation analysis of water quality indicators based on different cluster groups: (A) SW and XR, (B) BJ and YJ, (C) GA, ZD and HZ, (D) GS, ZK and YK, (E) HN and SL, (F) LH, ZG, XG and LW.
The spatiotemporal variations of water quality regimes using the WQI model are presented in Figure 6 and Supplementary Table S8. In general, the water quality of each sampling site was kept in a “good (71–90)” status, with the overall average WQI in the study area being 86.37, and the maximum (88.47) and minimum (83.53) WQI in the sites SW and HZ, respectively (Figure 6A). During The seasonal characteristics of WQIs were the same during the monitoring periods, i.e., the WQI values of spring and winter were relatively higher than those of summer and autumn, indicating water quality degradation events is more likely to occur in summer or autumn. When the WQI model parameters without heavy metal elements, the overall average WQI decreased to 83.42, and the station WQIs ranged from 81.08 to 87.79, which can be attributive to the low concentrations of the heavy metal elements measured in the HJR and the relatively high assigned weight (“2” or “4”). In this situation, the parameter degradation was hidden or “eclipsed” by the aggregation process and increased WQI values (Figure 6B).
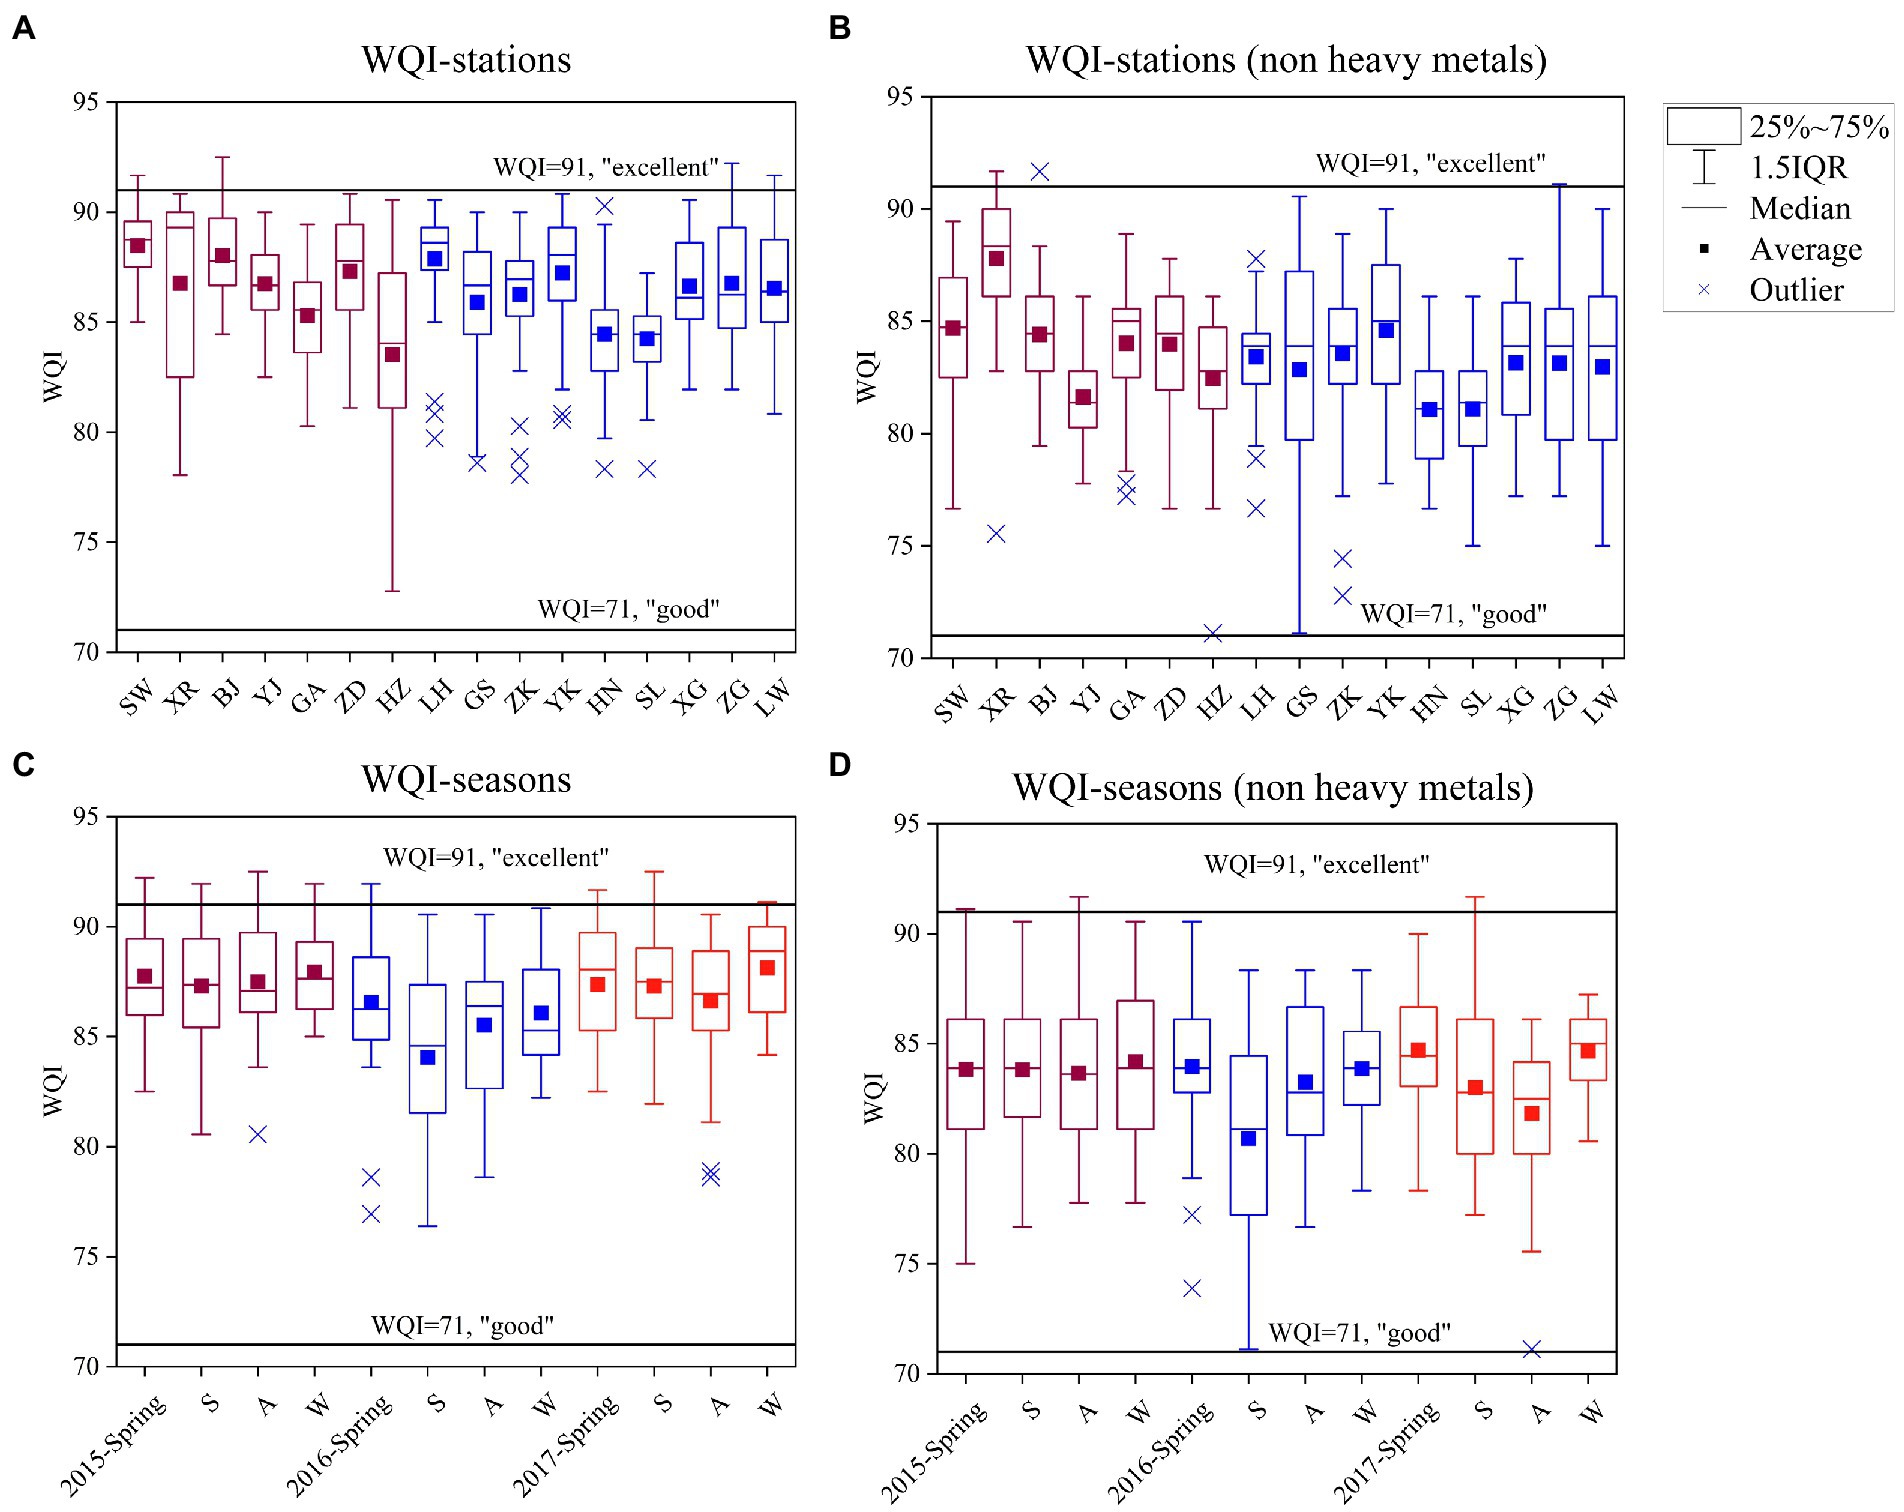
Figure 6. Evaluation of water quality using the WQI methods in the HJR during the year 2015 to 2017: (A) WQI-stations, (B) WQI-stations without heavy metals, (C) WQI-seasons, (D) WQI-seasons without heavy metals.
The hydrological condition changes before and after water diversion operations from three national monitoring stations are presented in Figure 7. It can be seen that the operation of the MRSNWDPC has significantly changed the hydrological situation in the middle and lower reaches of the HJR. Before the project’s operation, the trunk’s peak flow discharge generally occurs from August to September yearly. However, after the MRSNWDPC operation, the peak flows of HJR will be advanced or delayed due to the joint regulation of the project. After the project began to supply water regularly in 2016 (December 2014 to December 2015 was the trial operation period), except for the extreme flood (reservoir discharge event) in October 2017, the monthly average flow from 2016 to 2017 in HJR decreased by about 4.05–74.27%. In addition, it can be found that there is no significant correlation between the WQI and the hydrometeorological factors (i.e., flow discharge, water level, rainfall, and air temperature) in the three sites SW, HZ, and SL based on the Spearman correlation matrix in Supplementary Tables S9–S11. Only a few water quality indicators were significantly correlated with the changes of flow discharge and/or water levels (e.g., “DO–W” in SW, −0.41*), while those pairs of indicators were not consistent at different stations.
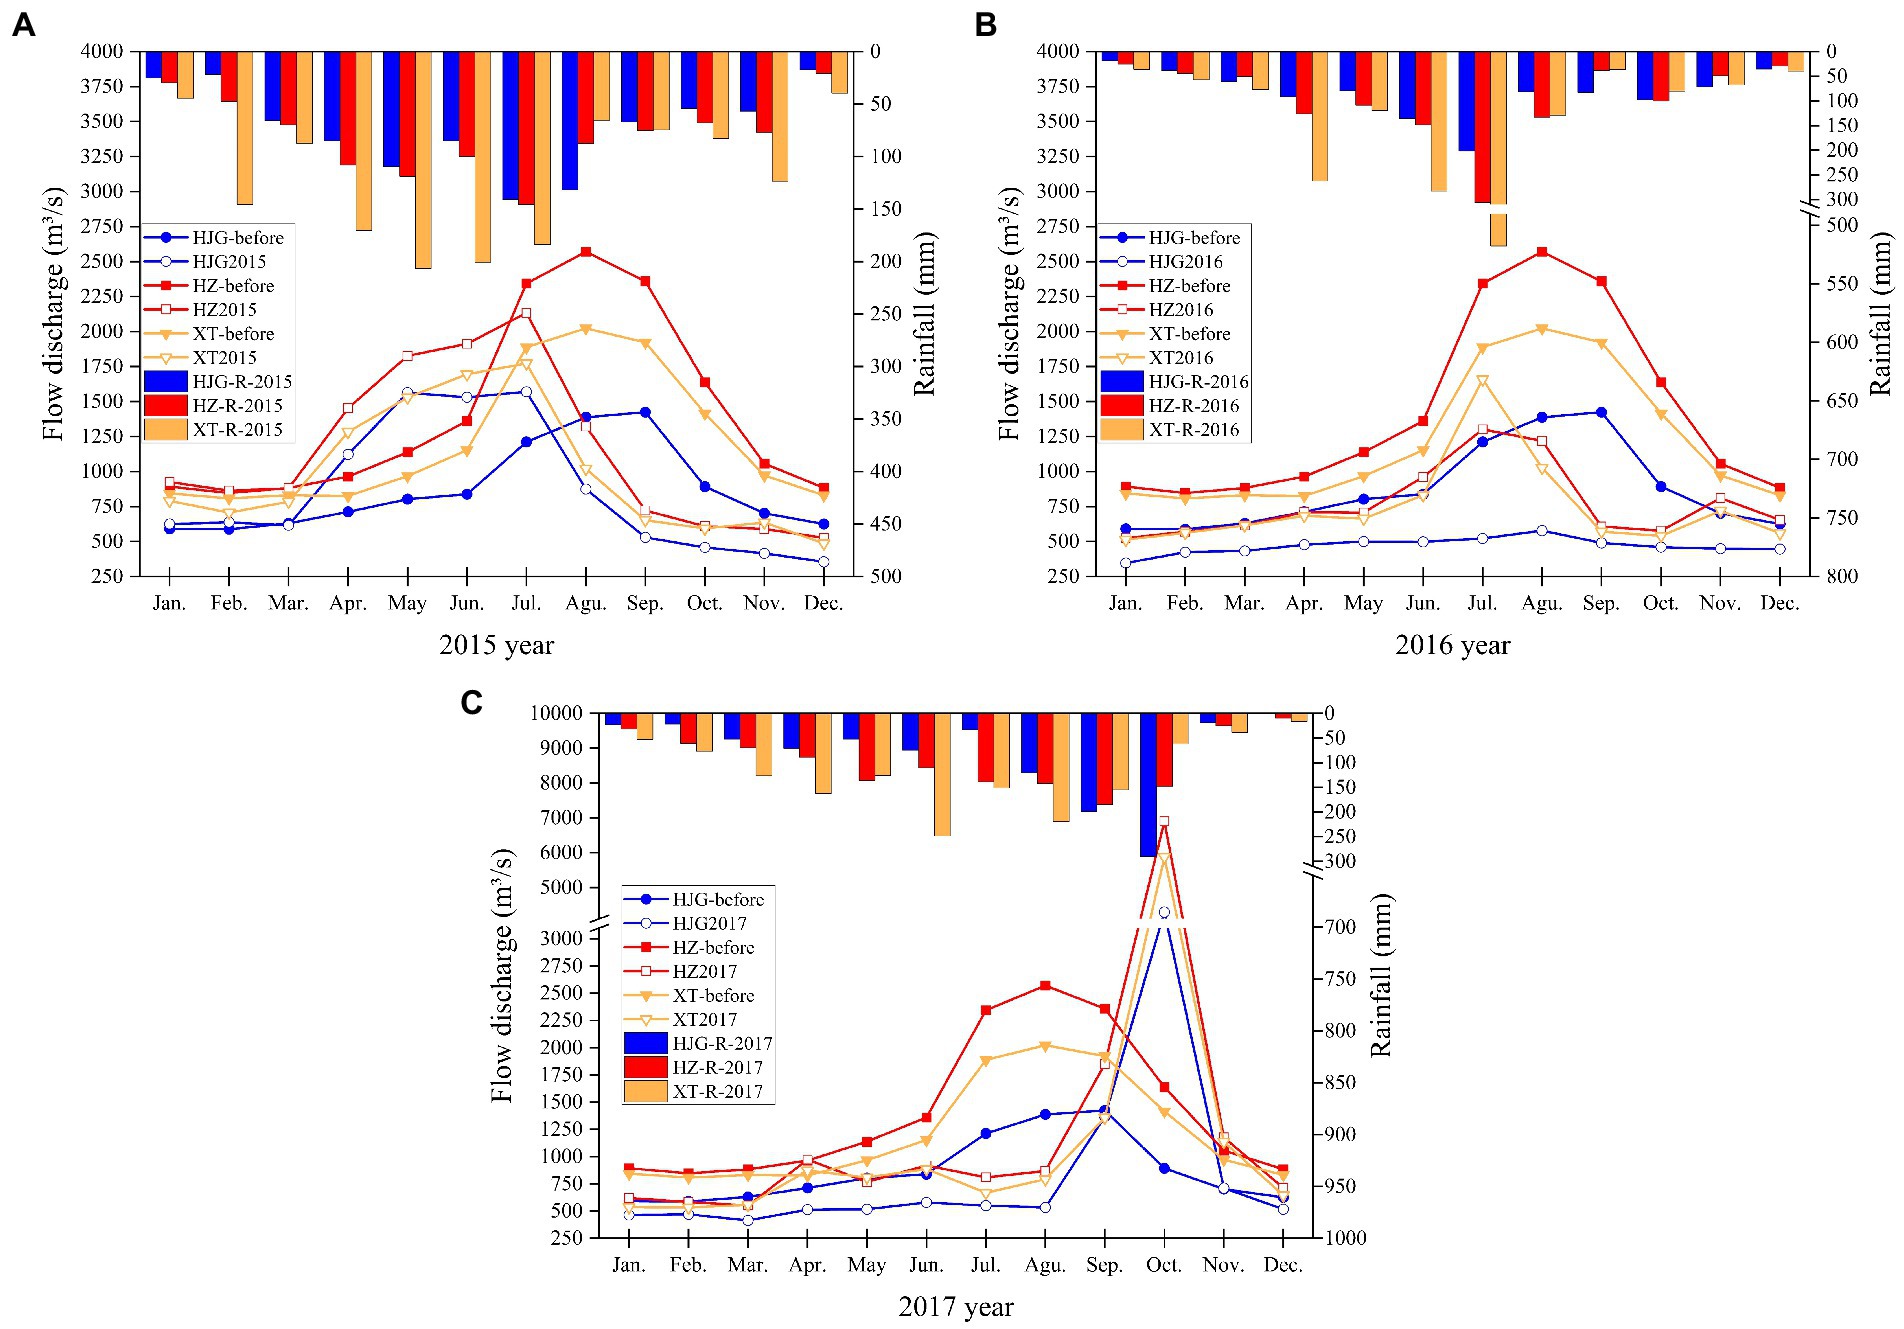
Figure 7. Comparison of hydrometeorological conditions before and after the operation of the MRSNWDPC: (A) the year 2015, (B) the year 2016, (C) the year 2017 (Note: “HJG” station locates in the sampling site “SW”, “HZ” station locates in the sampling site “HZ”, and “XT” station locates in the sampling site “SL”, respectively).
The critical driving factors affecting water quality variations were identified based on the stepwise multiple regression method. The data from 2015 to 2016 were used for model training, and the data from 2017 were used for testing. The results of indicator selections and model evaluations are shown in Table 4, and the corresponding regression model can be found in Supplementary Table S12. The DO and NH3−N were selected as the key indicators explained for water quality changes at three sampling sites, while the whole combinations of driving factors at different locations were not consistent. It can be seen that the water quality of the sites HZ and SL, located in the downstream and densely populated areas, was more significantly affected by the combination of heavy metals Cd, Hg, Zn, Cu, and/or Cr. The regression model of SW, located at the DJKR, was more concise than those and only contained one heavy metal Zn. The WQImin model, which was composed of the selected key indicators, showed good prediction performance of water quality evaluation in all three sites, indicating the best combinations of “DO, NH3−N, Zn, and BOD5” in SW, “DO, Cd, Zn, and Hg” in HZ, and “DO, Cd, NH3−N, Cu, CODMn, and pH” in SL based on the evaluations of the coefficient of determination (R2), Root Mean Square Error (RMSE), and Percentage Error (PE), respectively. Additionally, no hydrometeorological factors could be selected into any regression model and explain the WQI variations.

Table 4. The indicator selection results of the WQImin models using the stepwise multiple linear regression.
Based on the calculation results of the Nemerow index ( ) and HPI (Figure 8), it can be seen that the maximum single-factor pollution index of the six elements was 0.85 (Hg), appeared in the “cluster e” and “cluster f” (the year 2017) and located on the downstream, while the minimum was 5 × 10⁻⁵ (Cu), appeared in “cluster a” and “cluster d” (the year 2016), respectively. The showed no significant increasing or decreasing trends, with a maximum value of 0.62 (2017) and a minimum value of 0.141 (2016). The HPI ranged from 2.56 to 8.87 (Class I, low pollution), and the downstream (cluster f) had significantly higher HPI than that of the others from the year 2016 to 2017.
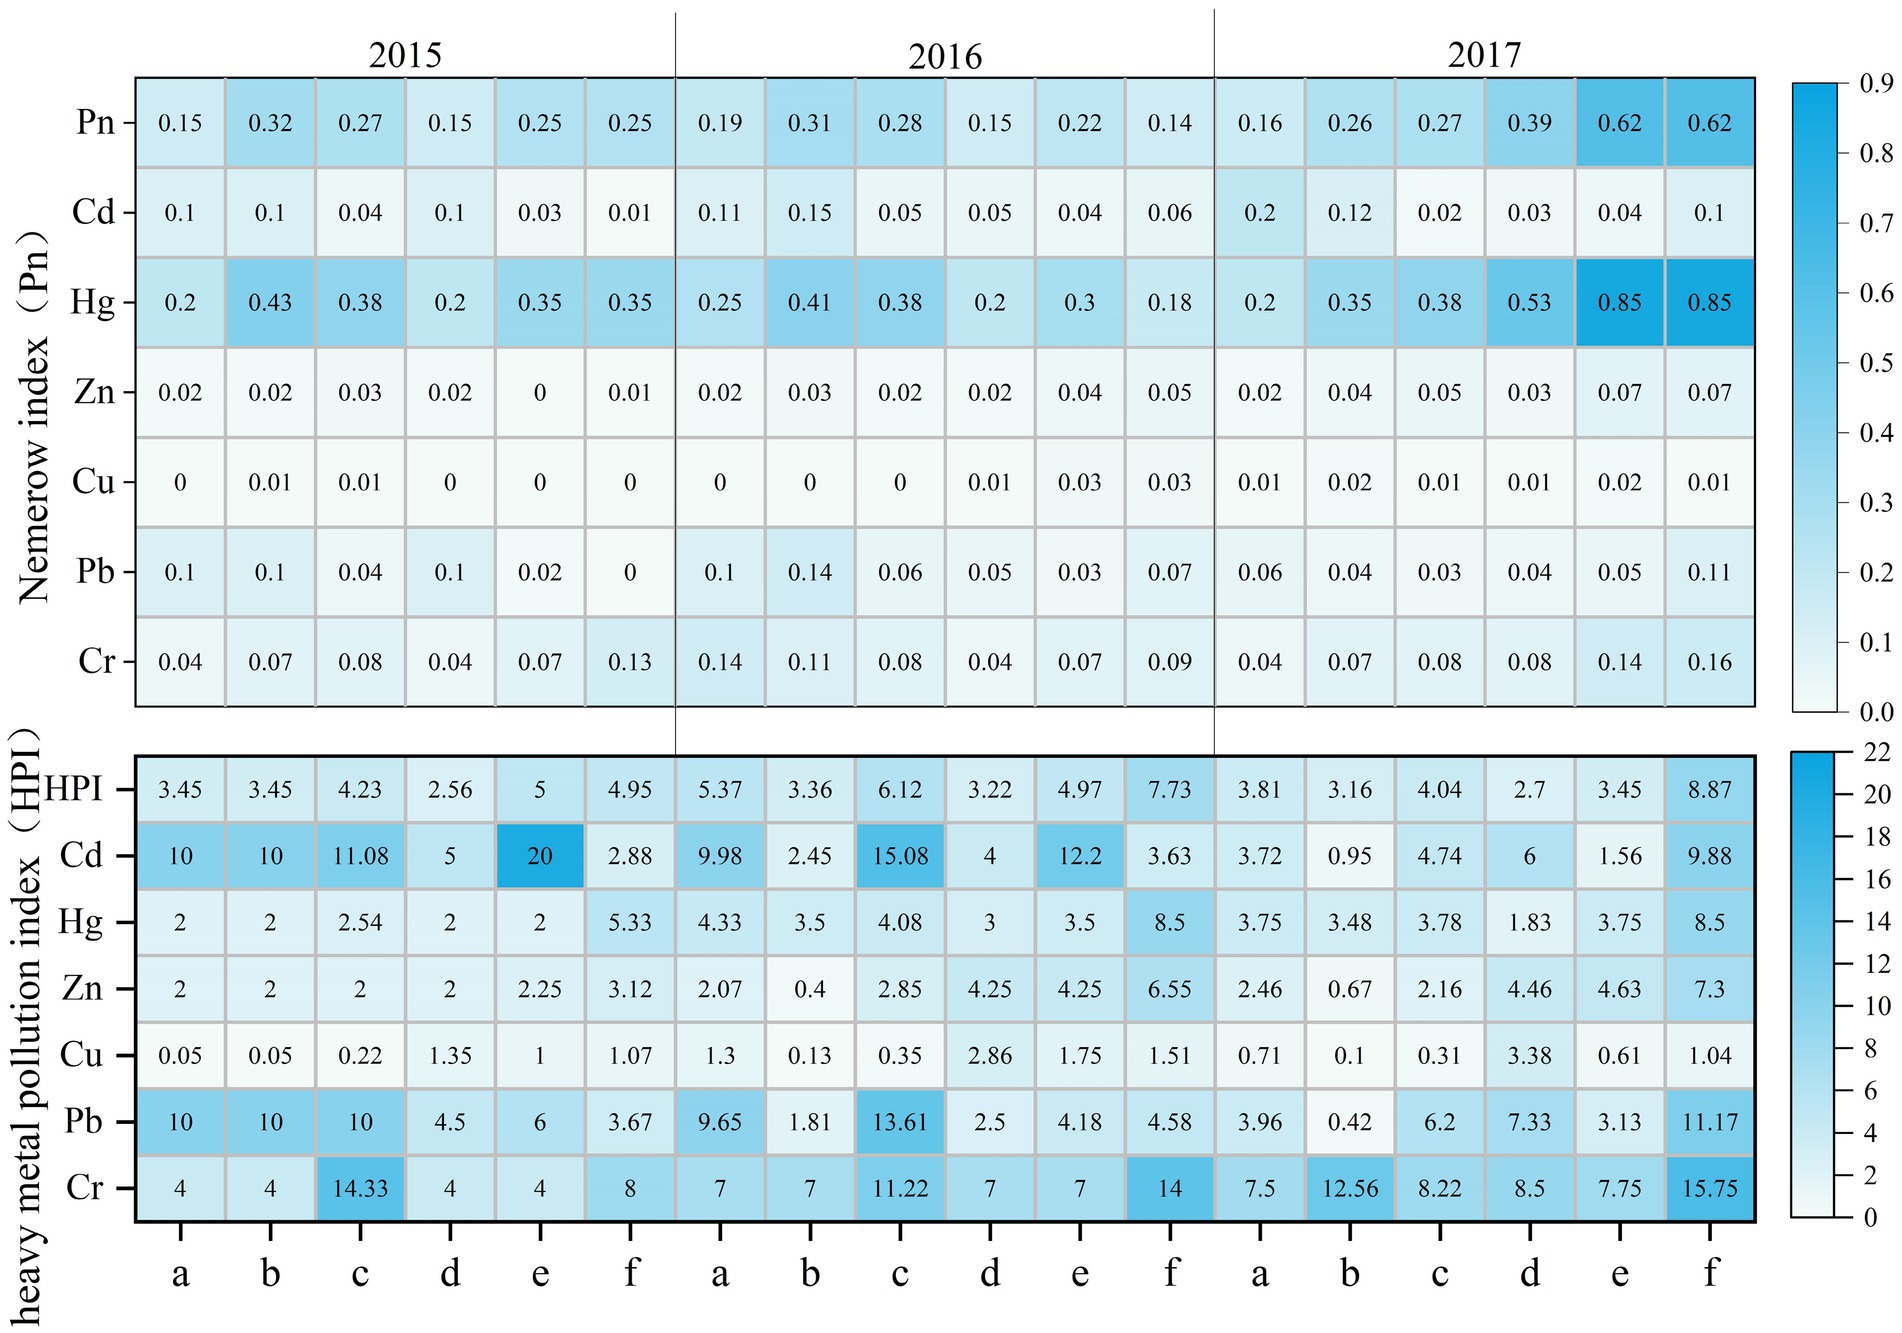
Figure 8. Inter-annual variation of the Nemerow pollution index ( ) and heavy metal pollution index (HPI) in the Hanjiang River from 2015 to 2017 (Note: a = sites SW and XR, b = sites BJ and YJ, c = sites GA, ZD, and HZ, d = sites GS, ZK, and YK, e = sites HN and SL, f = sites LH, XG, ZG, and LW).
The maximum individual human health risks caused by the six heavy metals for adults and children were observed at “cluster c” (Cr) in the year 2015 (Supplementary Tables S13–S15), with the risks of 1.1 × 10⁻⁴/yr. and 1.7 × 10⁻⁴/yr., respectively, which exceeded the maximum “acceptable” level of 1.00 × 10⁻⁴/yr. recommended by the US EPA (Tengan and Akoto, 2022). The average health risks of all elements were followed by the order: Cr > Cd > Pb > Cu > Hg > Zn, which basically maintained at an “acceptable” level. In general, the human health risks caused by the ingestion pathway were higher than those by the dermal exposure pathway, and the health risk of adults was lower than that of children. The risks of non-carcinogenic elements, i.e., the Pb, Cu, Zn, and Hg, varied in the range of 10−9 to 10−14, which were relatively lower than those of carcinogenic elements.
The hazard quotients (HQs) and carcinogenic risk (CR) of heavy metals in the HJR were listed in Supplementary Tables S16, S17. In general, the highest average HQs of the six elements was in Cd (0.11, ingestion pathway), which was way below the acceptable threshold (<1). For all heavy metals, the HQs of the two pathways of adults were lower than that of children. Since only the Cr has a carcinogenic slope factor in this study, thus the total carcinogenic risk (TCR) was calculated based on the Cr (Supplementary Table S18). The results showed that the TCR value was 2.45 × 10⁻⁵/yr., within the “acceptable” range of 1 × 10⁻⁶ to 1 × 10⁻⁴/yr. In addition, the CR values of the ingestion pathway were significantly higher than that of the dermal exposure, which was consistent with previous research. The Cr and Cd should be considered important health risk factors to be monitored from both sites GA to HZ and sites HN to SL sections.
In general, after the operation of the MRSNWDPC, the water quality indicators in the middle and lower reaches of the HJR met the national Class I or II standards and showed no water quality deterioration trends compared with the status before the project operation (Table 5). Some observed water samples were slightly worse in downstream sites (e.g., ZG and LW) though still met the Class III standard. Nonetheless, since the HJR’s tributaries flow through several large cities with more than one million residents, the urban industrial and domestic activities could cause the nutrient loadings of the tributaries of the HJR raised up. For instance, the overall NH3−N concentration at the YJ site located in Xiangyang City, a large city with a population of more than 5 million, was kept at a high level, with the contribution of surrounding pollutants exceed 50% (Zeng et al., 2014). Those flows contained with high concentrations of COD, BOD5, NH3−N, and/or TP finally input the HJR (Wang P. et al., 2018). Therefore, under the joint influence of anthropogenic activities and natural processes, the water quality variations at different monitoring sites showed spatial differences (Kuo et al., 2019).
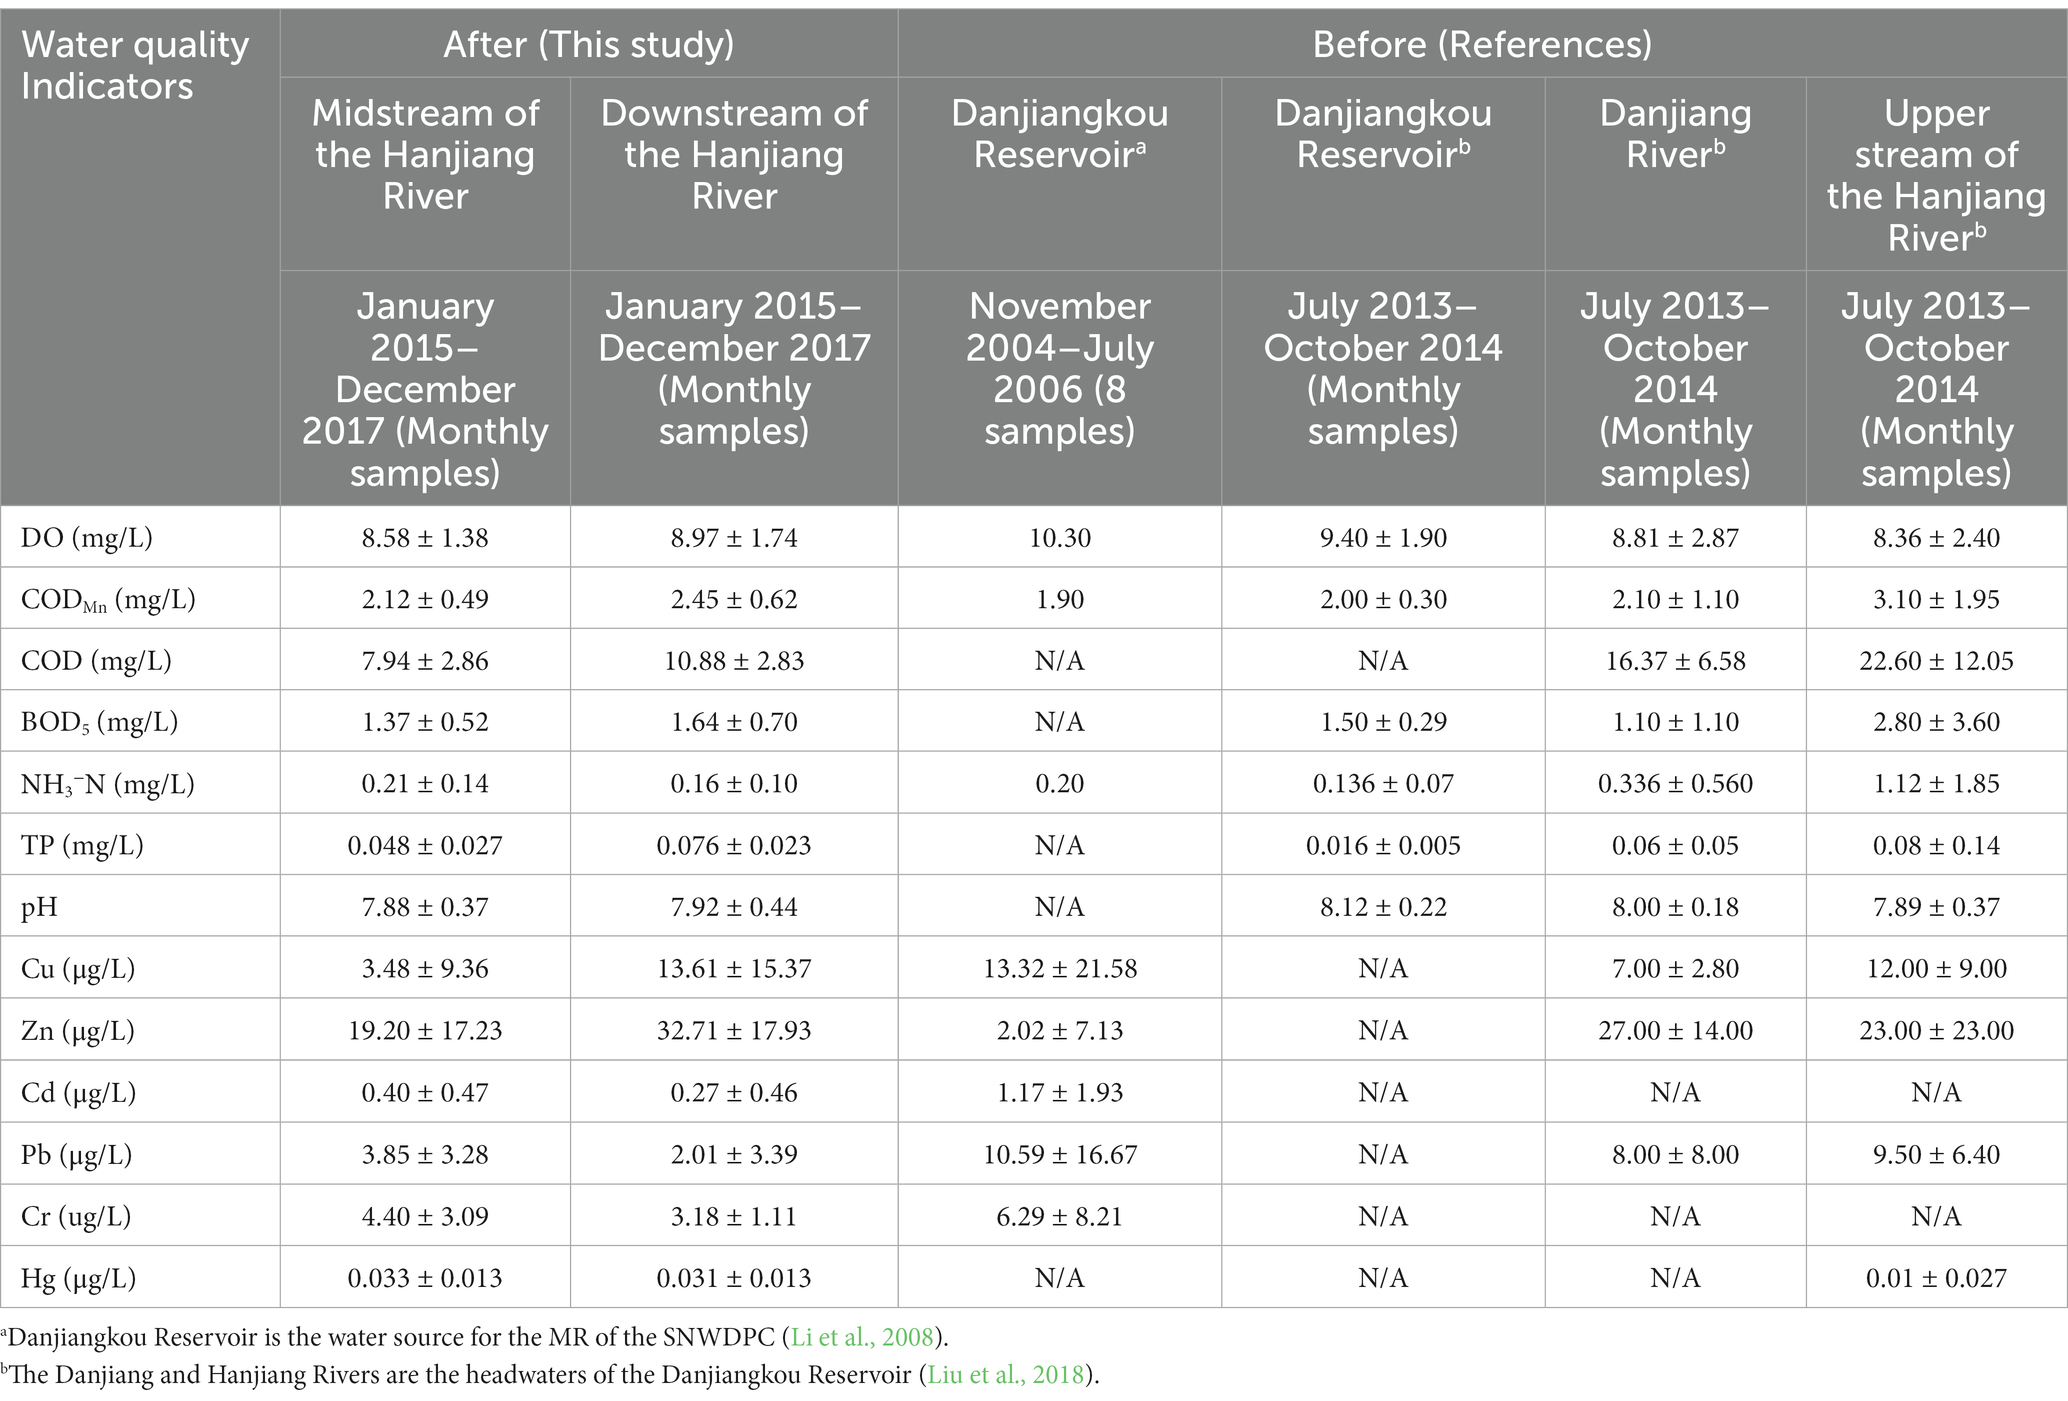
Table 5. Comparison of water quality regimes before and after the operation of the MRSNWDPC.
From the aspect of the spatial geographical influence on water quality changes, the cluster analysis results showed proximity classifications of the geographical consecutive sampling sites, except for the “cluster f” (site LH was geographically close to “cluster c”). This phenomenon revealed the intensity difference of human activities along the HJR (Wang et al., 2016). For instance, in “cluster b,” TP was negatively correlated with pH (p < 0.01) and positively correlated with CODMn and COD (p < 0.01). In another cluster, TP has almost no correlation with other water quality parameters, and other water quality parameters have similar phenomena, indicating that water quality indicators are significantly affected by regional factors. The pair of “Pb–Cd” were positively correlated in all six cluster groups, indicating that those two elements may have the same or similar anthropogenic activities input sources from industrial discharges and urban traffic pollutions (Wang et al., 2020). Additionally, some pairs such as “Cr–Hg” (“cluster e”) and “Zn–Hg” (“cluster f”) also showed high positive correlations, indicating the same source or compound pollution and similar transformation or transport processes, which could be ascribed them to intensive anthropogenic inputs such as fertilizers, and paint and mineral industries in the downstream of HJR (Kukrer et al., 2014). In contrast, the low correlation (r < 0.6) between Cu and different heavy metals suggests that they may not have a common source of contamination (Hao et al., 2021). The concentrations of specific indicators such as the CODMn and TP basically showed an increasing trend on the downstream side, indicating that the self-purification capacity of the water body decreased and pollutants accumulate along the trunk and are vulnerable to cause non-point source pollution (Zhang J. H. et al., 2022). Another phenomenon that needs to be focused on is that all six heavy metals showed a significant increasing trend at downstream (sites XG to LW), indicating that the accumulation of heavy metals on those sides may be related to the intensive human activities in the cities along the HJR.
There were significant seasonal variations of some physiochemical and/or nutrient indicators have been observed in many rivers and lakes around the world (Ouyang et al., 2006; Daneshvar et al., 2010; Olkowska et al., 2014; Wu et al., 2018), while most heavy metal elements generally did not show significant seasonal variation in river and lake water bodies (Cukrov et al., 2008). In this study, except for the DO, most of the water quality indicators did not show clear seasonality patterns, a reasonable explanation is that the natural turnover of the river ecosystem in the study case has been changed by human activities, i.e., the natural flow variations are no longer the main driving factors compared to the influences of hydro project operations and nutrient input loadings (Hayes et al., 2018).
Another critical issue that needs to be discussed is whether the change in hydrological conditions caused by water diversion activities has significantly impacted the water quality deterioration in the HJR. Some researchers pointed out that high flows can improve water quality in the HJR by diluting pollutants and enhancing the self-purification capacity of the water column (Liu et al., 2021). Still, it has also been suggested that during the reservoir water discharge, high-flow pulses could promote the suspension and release processes of heavy metals from sediments, resulting in concentration raised in the water column, causing ecological risks in downstream (Zhang J. et al., 2022). Previous studies have reported both phenomena, and the final result depends on the research scale and which role is dominant. Fortunately, in this study, during the flood period (July to October) of the HJR, the concentrations of heavy metal elements did not increase simultaneously, indicating that the HJR flow regulated by the DJKR had no significant effect on the heavy metal concentration variations in the water column, reflecting the special characteristics of the water environment in the middle and lower reaches of the HJR. This study also proves that although the operation of the MRSNWDPC did significantly reduce the flow in the middle and lower reaches of the HJR, the flow variation processes also became more stable than that before. Therefore, it can be seen that most water quality indicators and WQIs have no correlations with the flow and water level changes. For this typical intensive human activity area, the water quality deterioration caused by non-point source pollution is a more critical factor (Zhang J. H. et al., 2022).
Additionally, it should be noted that within 30 years from 1990 to the present, nearly more than 20 algal bloom events have been recorded in the study region, including two algal bloom events that happened in the XT stations from 22nd February to 2nd March and 24th February to 9th March 2016 during our monitoring period (Xin et al., 2020), corresponding to which the concentrations of COD, TP, and CODMn on the downstream were also significantly higher than those on the upstream side, showing increasing trends. It has been reported that the low flow discharge (< 900 m3/s) and high water level (> 14 m) conditions of the HJR can provide a suitable environment for diatom blooms (dominant species: Stephanodiscus hantzschii) (Shen et al., 2021), and the increased concentrations of COD, NH3−N, and TP due to human activities could also simultaneously increase the risk of algal bloom outbreaks (Whitehead et al., 2009). Our study revealed that the flow discharge in the XT station in the HJR after the water diversion active was 5.65 to 39.20% lower than that before from January to March every year (Figure 7), and it happened to be in the low discharge condition of algal bloom (Wang et al., 2011), indicating that the HJR should strength the prevention and control of water quality deterioration caused by eutrophication in specific month.
The single-factor pollution index based on the Nemerow pollution index method of all heavy metals was less than 1.0, and the was less than 0.7, indicating that the heavy metal pollution in the HJR was at a “clean” level (Yang et al., 2022). Notably, the single factor pollution index of Hg on the downstream side relatively increased over time. Since the Hg in water bodies is easily transferred and accumulates in the food chain of aquatic systems and may threaten human health (Nong et al., 2019), the changes of Hg concentrations in the HJR still need special attention (Wu et al., 2020).
The human health risks of two exposure pathways, i.e., ingestion and dermal exposure, showed increasing trends and had a relatively high degree of the downstream side. The average ingestion risk for children was 1.55 times higher than for adults, indicating that children are more vulnerable to heavy metal pollution in water drinking, consistent with previous findings (Li and Zhang, 2010; Shukla et al., 2022). The average annual human health risk of carcinogenic heavy metal Cr was the highest, with the overrate of 16.67% (> 10−4/yr.) for children and 5.56% for adults, respectively, indicating that Cr is the major carcinogenic factor and is a crucial indicator for decision management of regional water environment risk, which is consistent with the results of Huang et al. (2021). The health risk levels of all non-carcinogenic heavy metals are still in the order of 10−14 to 10−9/yr., which were way below the threshold (10−6/yr.) of acceptable risk levels (recommended by the Swedish EPA, the Ministry of Construction and Environmental Protection of the Netherlands, and the Royal Society of the UK), and indicating almost negligible non-carcinogenic heavy metal risks in the HJR (Zhao et al., 2019). The HQs values in this study were all less than 1, indicating that heavy metals in this area had no obvious non-carcinogenic risk to humans. The carcinogenic risk is increasing yearly, especially on the downstream side (“cluster f”). The region is located in Wuhan City, i.e., the capital of Hubei Province, serving as a core political and economic center and an industrial base of 10 million population. Therefore, further monitoring the concentration of carcinogenic heavy metals and ensuring drinking water safety is the focus of future research.
From the perspective of water quality and quantity, our research can explain and respond to some criticisms of the water diversion project, proving reliable evidence that the water quality of downstream rivers after the project operation is excellent and stable, which is different from some conclusions of previous studies that only rely on the water quality investigation without hydrological data monitoring. Certainly, as with all scientific research, this study has obvious limitations. Due to the relevant government confidentiality permission and the actual operation of the project, there is an interval and time lag from the monitoring period to the year 2023. However, compared with the latest data from January 2021 to December 2022 of the Hanjiang River (Supplementary Table S19), the water quality of the Hanjiang River is well maintained at an excellent status, similar to the year 2015 to 2017 in this article, indicating the continuous efforts and management made by China government in protecting the water quality of Hanjiang River. Meanwhile, despite the data’s time lag, this study can still provide a valuable reference for studying relationships between water quantity and quality with abundant indicators. More in-depth studies on water quality changes combined with long-term monitoring of hydrological data are needed in future research design.
Based on multivariate statistical techniques and health risk assessment methods, this research comprehensively studied the spatial and temporal variation characteristics of water quality and evaluated human health risks in the middle and lower reaches of the HJR from 2015 to 2017 after the operation of the Middle Route of the South-to-North Water Diversion Project of China. The main conclusions are as follows:
1. After the operation of the MRSNWDPC, the annual average concentrations/contents of 13 water quality indicators at 16 water quality sampling sites still met the Class I or II of the national surface water quality standard. The overall water quality in the middle and lower reaches of the HJR was kept in “good” status, with the average WQI in the study area being 86.37 and ranging from 83.53 to 88.47, showing no water quality deterioration trends.
2. All water quality indicators showed significant spatial heterogeneity, but the intra- and inter-annual temporal variation patterns were not significant; Cu, Zn, Hg, and Cr of all sampling sites basically showed a significant upward trend, while Cd and Pb showed a significant downward trend, and there were significant homology characteristics of the heavy metal elements in different sampling sites. The water quality of the downstream and densely populated areas was more significantly affected by the combination of heavy metals Cd, Hg, Zn, Pb, and/or Cr.
3. The operation of the MRSNWDPC has significantly changed the hydrological situation in the middle and lower reaches of the HJR. The monthly average flow from 2016 to 2017 in HJR decreased by about 4.05–74.27%. There are no significant correlations between the WQI and the hydrometeorological factors, and only a few water quality indicators were significantly correlated with the changes of flow discharge and/or water levels. There is no significant result to prove that the reduction of water quantity caused by diversion regulation directly leads to the deterioration of water quality.
4. The heavy metal pollution in the HJR was at a “clean” level and “low pollution,” with the Pn < 0.7 and HPI < 15, respectively. The degree of human health risks from dermal exposure and the ingestion pathway for all six heavy metals showed an increasing trend over time. The average individual health risk caused by the carcinogenic heavy metal Cr was the highest. The Cr and Cd should be priority monitored from both sites GA to HZ and sites HN to SL sections for regional water environment risk management.
This study can provide a scientific reference for the eco-environmental protection and water quality safety management under the operation of inter-basin water diversion projects. Considering the long-term nature and importance of inter-basin water diversion project operation, local governments should take more preventive measures to strictly control the total amount of industrial pollutant emissions, and construct the basin-scale water environmental database and emergency water environment early-warning system for the HJR of future research.
The original contributions presented in the study are included in the article/Supplementary material, further inquiries can be directed to the corresponding authors.
XN: funding acquisition, data collection, investigation, conceptualization, methodology, software, formal analysis, and writing–original draft. XY: software, formal analysis, and writing–original draft. LC: funding acquisition and draft review and editing. DS: funding acquisition, data collection, investigation, draft review and editing, and supervision. CZ: draft review and editing. All authors contributed to the article and approved the submitted version.
This research was funded by the National Natural Science Foundation of China (No. U21A20156), the Specific Research Project of Guangxi for Research Bases and Talents (No. AD22035185), the visiting scholars’ fund at the WRHES (No. 2021NSG02), and the National Natural Science Foundation of China (No. 51669003).
The authors would like to thank the editors and the reviewers for their valuable suggestions and contributions which significantly improved this article, and would also need to acknowledge the Hubei Provincial Bureau of Hydrology and Water Resources that supported the data collection.
The authors declare that the research was conducted in the absence of any commercial or financial relationships that could be construed as a potential conflict of interest.
All claims expressed in this article are solely those of the authors and do not necessarily represent those of their affiliated organizations, or those of the publisher, the editors and the reviewers. Any product that may be evaluated in this article, or claim that may be made by its manufacturer, is not guaranteed or endorsed by the publisher.
The Supplementary material for this article can be found online at: https://www.frontiersin.org/articles/10.3389/fevo.2023.1159187/full#supplementary-material
Adimalla, N., Li, P. Y., and Qian, H. (2019). Evaluation of groundwater contamination for fluoride and nitrate in semi-arid region of Nirmal Province, South India: a special emphasis on human health risk assessment (HHRA). Hum. Ecol. Risk. Assess. 25, 1107–1124. doi: 10.1080/10807039.2018.1460579
Alnahit, A. O., Mishra, A. K., and Khan, A. A. (2020). Quantifying climate, streamflow, and watershed control on water quality across southeastern US watersheds. Sci. Total Environ. 739:139945. doi: 10.1016/j.scitotenv.2020.139945
Ashwin, K. R. N., Arulmozhi, S., Gopalan, A., Mageshkumar, P., Rangaraj, A., Panneerselvam, M., et al. (2022). Correlation, regression analysis, and spatial distribution mapping of WQI for an urban Lake in Noyyal River basin in the textile Capital of India. Adv. Mater. Sci. Eng. 2022, 1–10. doi: 10.1155/2022/3402951
Chen, Y. F., and Zhang, X. (2015). Long-term trends and sustainability trends of water quality in the middle and lower reaches of Han jiang main stream. Resour. Environ. Yangtze Basin 24, 1163–1167. doi: 10.11870/cjlyzyyhj201507012
Cheng, B.-F., Zhang, Y., Xia, R., Zhang, N., and Zhang, X.-F. (2021). Temporal and spatial variations in water quality of Hanjiang River and its influencing factors in recent years. Huanjing kexue 42, 4211–4221. doi: 10.13227/j.hjkx.202012074
Cukrov, N., Cmuk, P., Mlakar, M., and Omanovic, D. (2008). Spatial distribution of trace metals in the Krka River, Croatia: an example of the self-purification. Chemosphere 72, 1559–1566. doi: 10.1016/j.chemosphere.2008.04.038
Dai, J. Y., Wu, S. Q., Wu, X. F., Xue, W. Y., Yang, Q. Q., Zhu, S. L., et al. (2018). Effects of water diversion from Yangtze River to Lake Taihu on the phytoplankton habitat of the Wangyu River channel. Water 10:759. doi: 10.3390/w10060759
Daneshvar, A., Svanfelt, J., Kronberg, L., Prevost, M., and Weyhenmeyer, G. A. (2010). Seasonal variations in the occurrence and fate of basic and neutral pharmaceuticals in a Swedish river-lake system. Chemosphere 80, 301–309. doi: 10.1016/j.chemosphere.2010.03.060
Feng, G., Li, W., Zhou, L., and Chen, D. (2016). Influence of flow process variation on river health in middle and lower reaches of Hanjiang River. J. China Hydrol. 36, 46–50. doi: 10.3969/j.issn.1000-0852.2016.01.008
Guclu, Y. S. (2018). Multiple Sen-innovative trend analyses and partial Mann-Kendall test. J. Hydrol. 566, 685–704. doi: 10.1016/j.jhydrol.2018.09.034
Guo, C. B., Chen, Y. S., Xia, W. T., Qu, X., Yuan, H., Xie, S. G., et al. (2020). Eutrophication and heavy metal pollution patterns in the water suppling lakes of China's south-to-north water diversion project. Sci. Total Environ. 711:134543. doi: 10.1016/j.scitotenv.2019.134543
Hao, J. X., Ren, J., Fang, H. B., and Tao, L. (2021). Identification sources and high-risk areas of sediment heavy metals in the Yellow River by geographical detector method. Water 13:14. doi: 10.3390/w13081103
Haque, M. M., Niloy, N. M., Nayna, O. K., Fatema, K. J., Quraishi, S. B., Park, J. H., et al. (2020). Variability of water quality and metal pollution index in the Ganges River, Bangladesh. Environ. Sci. Pollut. Res. 27, 42582–42599. doi: 10.1007/s11356-020-10060-3
Hayes, D. S., Brandle, J. M., Seliger, C., Zeiringer, B., Ferreira, T., and Schmutz, S. (2018). Advancing towards functional environmental flows for temperate floodplain rivers. Sci. Total Environ. 633, 1089–1104. doi: 10.1016/j.scitotenv.2018.03.221
Hill, T., and Lewicki, P. (2006). Statistics: Methods and Applications: A Comprehensive Reference for Science, Industry, and Data Mining. Tulsa, OK: StatSoft, Inc
Hu, B. F., Zhao, R. Y., Chen, S. C., Zhou, Y., Jin, B., Li, Y., et al. (2018). Heavy metal pollution delineation based on uncertainty in a coastal Industrial City in the Yangtze River Delta, China. Int. J. Environ. Res. Public Health 15:13. doi: 10.3390/ijerph15040710
Huang, H. W., Xiao, H., Wang, D. Q., Xi, B. D., and Li, X. K. (2021). Pollution characteristics and health risk assessment of heavy metals in the water of Lijiang River basin. Huanjing Kexue 42, 1714–1723. doi: 10.13227/j.hjkx.202008068
Jiang, C. J., Zhou, J. N., Wang, J. C., Fu, G. S., and Zhou, J. R. (2020). Characteristics and causes of long-term water quality variation in Lixiahe abdominal area, China. Water 12:18. doi: 10.3390/w12061694
Jing, Z., Chen, H., Cao, H. Q., Tang, X. Q., Shang, Y. M., Liang, Y. H., et al. (2022). Spatial and temporal characteristics, influencing factors and prediction models of water quality and algae in early stage of middle route of south-north water diversion project. Environ. Sci. Pollut. Res. 29, 23520–23544. doi: 10.1007/s11356-021-16917-5
Jing, Z., Xia, J., Zhang, X., Wang, Q., Shi, W., and Ma, X. (2019). Spatial and temporal distribution and variation of water quality in the middle and downstream of Hanjiang River. Res. Environ. Sci. 32, 104–115. doi: 10.13198/j.issn.1001-6929.2018.07.25
Kalogianni, E., Vourka, A., Karaouzas, I., Vardakas, L., Laschou, S., and Skoulikidis, N. T. (2017). Combined effects of water stress and pollution on macroinvertebrate and fish assemblages in a Mediterranean intermittent river. Sci. Total Environ. 603-604, 639–650. doi: 10.1016/j.scitotenv.2017.06.078
Kukrer, S., Seker, S., Abaci, Z. T., and Kutlu, B. (2014). Ecological risk assessment of heavy metals in surface sediments of northern littoral zone of Lake Cildir, Ardahan, Turkey. Environ. Monit. Assess. 186, 3847–3857. doi: 10.1007/s10661-014-3662-4
Kuo, Y. M., Liu, W. W., Zhao, E. M., Li, R., and Munoz-Carpena, R. (2019). Water quality variability in the middle and down streams of Han River under the influence of the middle route of south-north water diversion project, China. J. Hydrol. 569, 218–229. doi: 10.1016/j.jhydrol.2018.12.001
Li, S. Y., Xu, Z. F., Cheng, X. L., and Zhang, Q. F. (2008). Dissolved trace elements and heavy metals in the Danjiangkou reservoir, China. Environ. Geol. 55, 977–983. doi: 10.1007/s00254-007-1047-5
Li, S. Y., and Zhang, Q. F. (2010). Risk assessment and seasonal variations of dissolved trace elements and heavy metals in the upper Han River, China. J. Hazard. Mater. 181, 1051–1058. doi: 10.1016/j.jhazmat.2010.05.120
Liu, W. W., Kuo, Y. M., and Zhao, E. M. (2021). Influence of the south-to-north water transfer and the Yangtze River mitigation projects on the water quality of Han River, China. Environ. Earth Sci. 80:13. doi: 10.1007/s12665-021-09534-5
Liu, L. H., Peng, W. Q., Wu, L. X., and Liu, L. S. (2018). Water quality assessment of Danjiangkou reservoir and its tributaries in China. IOP Conf. Series Earth Environ. Sci. 112:012008. doi: 10.1088/1755-1315/112/1/012008
Maansi Jindal, R., and Wats, M. (2022). Evaluation of surface water quality using water quality indices (WQIs) in Lake Sukhna, Chandigarh, India. Appl. Water Sci. 12:14. doi: 10.1007/s13201-021-01534-x
Marselina, M., Wibowo, F., and Mushfiroh, A. (2022). Water quality index assessment methods for surface water: a case study of the Citarum River in Indonesia. Heliyon 8:10. doi: 10.1016/j.heliyon.2022.e09848
Mishra, A., Alnahit, A., and Campbell, B. (2021). Impact of land uses, drought, flood, wildfire, and cascading events on water quality and microbial communities: a review and analysis. J. Hydrol. 596:125707. doi: 10.1016/j.jhydrol.2020.125707
Nong, X. Z., Shao, D. G., Xiao, Y., and Zhong, H. (2019). Spatio-temporal characterization analysis and water quality assessment of the south-to-north water diversion project of China. Int. J. Environ. Res. Public Health 16:23. doi: 10.3390/ijerph16122227
Nong, X. Z., Shao, D. G., Zhong, H., and Liang, J. K. (2020). Evaluation of water quality in the south-to-north water diversion project of China using the water quality index (WQI) method. Water Res. 178:115781. doi: 10.1016/j.watres.2020.115781
Noori, R., Berndtsson, R., Hosseinzadeh, M., Adamowski, J. F., and Abyaneh, M. R. (2019). A critical review on the application of the national sanitation foundation water quality index. Environ. Pollut. 244, 575–587. doi: 10.1016/j.envpol.2018.10.076
Noori, R., Sabahi, M. S., Karbassi, A. R., Baghvand, A., and Zadeh, H. T. (2010). Multivariate statistical analysis of surface water quality based on correlations and variations in the data set. Desalination 260, 129–136. doi: 10.1016/j.desal.2010.04.053
Oki, T., Entekhabi, D., and Harrold, T. I. (2003). The Global Water Cycle. 23rd General Assembly of the International-Union-of-Geodesy-and Geophysics. Amer Geophysical Union: Sapporo, pp. 225–237.
Olkowska, E., Kudlak, B., Tsakovski, S., Ruman, M., Simeonov, V., and Polkowska, Z. (2014). Assessment of the water quality of Klodnica River catchment using self-organizing maps. Sci. Total Environ. 476-477, 477–484. doi: 10.1016/j.scitotenv.2014.01.044
Ouyang, Y., Nkedi-Kizza, P., Wu, Q. T., Shinde, D., and Huang, C. H. (2006). Assessment of seasonal variations in surface water quality. Water Res. 40, 3800–3810. doi: 10.1016/j.watres.2006.08.030
Panda, P. K., Dash, P. K., and Panda, R. B. (2018). The study of water quality and Pearson's correlation coefficients among different Physico-chemical parameters of river Salandi, Bhadrak, Odisha. India. Am. J. Water Resour. 6, 146–155. doi: 10.12691/ajwr-6-4-1
Pesce, S. F., and Wunderlin, D. A. (2000). Use of water quality indices to verify the impact of Cordoba City (Argentina) on Suquia River. Water Res. 34, 2915–2926. doi: 10.1016/S0043-1354(00)00036-1
Prathumratana, L., Sthiannopkao, S., and Kim, K. W. (2008). The relationship of climatic and hydrological parameters to surface water quality in the lower Mekong River. Environ. Int. 34, 860–866. doi: 10.1016/j.envint.2007.10.011
Qi, W. H., Li, H. R., Zhang, Q. F., and Zhang, K. R. (2019). Forest restoration efforts drive changes in land-use/land-cover and water-related ecosystem services in China's Han River basin. Ecol. Eng. 126, 64–73. doi: 10.1016/j.ecoleng.2018.11.001
Qu, L. Y., Huang, H., Xia, F., Liu, Y. Y., Dahlgren, R. A., Zhang, M. H., et al. (2018). Risk analysis of heavy metal concentration in surface waters across the rural-urban interface of the wen-Rui Tang River, China. Environ. Pollut. 237, 639–649. doi: 10.1016/j.envpol.2018.02.020
Rana, R., Ganguly, R., and Gupta, A. K. (2018). Indexing method for assessment of pollution potential of leachate from non-engineered landfill sites and its effect on ground water quality. Environ. Monit. Assess. 190:23. doi: 10.1007/s10661-017-6417-1
Reza, R., and Singh, G. (2010). Heavy metal contamination and its indexing approach for river water. Int. J. Environ. Sci. Technol. 7, 785–792. doi: 10.1007/BF03326187
Schlosser, C. A., Strzepek, K., Gao, X., Fant, C., Blanc, E., Paltsev, S., et al. (2014). The future of global water stress: an integrated assessment. Earth Future 2, 341–361. doi: 10.1002/2014EF000238
Shakeri, A., Hosseini, H., Mehr, M. R., and Barmaki, M. D. (2022). Groundwater quality evaluation using water quality index (WQI) and human health risk (HHR) assessment in Herat aquifer, West Afghanistan. Hum. Ecol. Risk. Assess. 28, 711–733. doi: 10.1080/10807039.2022.2075316
Sharma, A., Ganguly, R., and Gupta, A. (2020). Impact assessment of leachate pollution potential on groundwater: an indexing method. J. Environ. Eng. 146:16. doi: 10.1061/(ASCE)EE.1943-7870.0001647
Shen, L. S., Dou, M., Xia, R., Li, G. Q., and Yang, B. H. (2021). Effects of hydrological change on the risk of riverine algal blooms: case study in the mid-downstream of the Han River in China. Environ. Sci. Pollut. Res. 28, 19851–19865. doi: 10.1007/s11356-020-11756-2
Shukla, S., Khan, R., Varshney, S. K., Ganguly, R., Amiri, V., Hussain, C. M., et al. (2022). Appraisal of groundwater chemistry, its suitability for crop productivity in Sonipat district and human health risk evaluation. Hum. Ecol. Risk. Assess. 29, 507–528. doi: 10.1080/10807039.2022.2137779
Tengan, B. M., and Akoto, O. (2022). Comprehensive evaluation of the possible impact of roofing materials on the quality of harvested rainwater for human consumption. Sci. Total Environ. 819:10.doi: 10.1016/j.scitotenv.2022.152966
Tolley, S. G., Volety, A. K., Savarese, M., Walls, L. D., Linardich, C., and Everham, E. M. (2006). Impacts of salinity and freshwater inflow on oyster- reef communities in Southwest Florida. Aquat. Living Resour. 19, 371–387. doi: 10.1051/alr:2007007
Varol, M., Karakaya, G., and Sunbul, M. R. (2021). Spatiotemporal variations, health risks, pollution status and possible sources of dissolved trace metal(loid)s in the Karasu River, Turkey. Environ. Res. 202:111733. doi: 10.1016/j.envres.2021.111733
Varol, M., and Tokatli, C. (2023). Evaluation of the water quality of a highly polluted stream with water quality indices and health risk assessment methods. Chemosphere 311:10. doi: 10.1016/j.chemosphere.2022.137096
Wang, X. Z., Cai, Q. H., Ye, L., and Qu, X. D. (2012). Evaluation of spatial and temporal variation in stream water quality by multivariate statistical techniques: a case study of the Xiangxi River basin, China. Quat. Int. 282, 137–144. doi: 10.1016/j.quaint.2012.05.015
Wang, Y., Di, F., and Xin, L. (2018). The status and problems of grain production in the main grain production areas of China and policy suggestions. Res. Agricult. Modern. 39, 37–47. doi: 10.13872/j.1000-0275.2017.0127
Wang, Y. Z., Duan, X. J., and Wang, L. (2020). Spatial distribution and source analysis of heavy metals in soils influenced by industrial enterprise distribution: case study in Jiangsu Province. Sci. Total Environ. 710:134953. doi: 10.1016/j.scitotenv.2019.134953
Wang, X., Hao, F. H., Cheng, H. G., Yang, S. T., Zhang, X., and Bu, Q. S. (2011). Estimating non-point source pollutant loads for the large-scale basin of the Yangtze River in China. Environ. Earth Sci. 63, 1079–1092. doi: 10.1007/s12665-010-0783-0
Wang, P., Qin, G. U., Peng, Y., and Songbing, L. I. (2018). Study on water pollutant discharge standards in the middle and lower reaches of Hanjiang River in Hubei Province. Environ. Sci. Technol. 41, 197–204. doi: 10.19672/j.cnki.1003-6504.2018.S2.036
Wang, J. N., Zhang, Z. L., and Johnson, B. (2019). Low flows and downstream decline in phytoplankton contribute to impaired water quality in the lower Minnesota River. Water Res. 161, 262–273. doi: 10.1016/j.watres.2019.05.090
Wang, Y. G., Zhang, W. S., Zhao, Y. X., Peng, H., and Shi, Y. Y. (2016). Modelling water quality and quantity with the influence of inter-basin water diversion projects and cascade reservoirs in the middle-lower Hanjiang River. J. Hydrol. 541, 1348–1362. doi: 10.1016/j.jhydrol.2016.08.039
Whitehead, P. G., Wilby, R. L., Battarbee, R. W., Kernan, M., and Wade, A. J. (2009). A review of the potential impacts of climate change on surface water quality. Hydrol. Sci. J. 54, 101–123. doi: 10.1623/hysj.54.1.101
Wu, J., Lu, J., Zhang, C., Zhang, Y. X., Lin, Y. C., and Xu, J. (2020). Pollution, sources, and risks of heavy metals in coastal waters of China. Hum. Ecol. Risk. Assess. 26, 2011–2026. doi: 10.1080/10807039.2019.1634466
Wu, Z. S., Wang, X. L., Chen, Y. W., Cai, Y. J., and Deng, J. C. (2018). Assessing river water quality using water quality index in Lake Taihu Basin, China. Sci. Total Environ. 612, 914–922. doi: 10.1016/j.scitotenv.2017.08.293
Xia, R., Wang, G. S., Zhang, Y., Yang, P., Yang, Z. W., Ding, S., et al. (2020). River algal blooms are well predicted by antecedent environmental conditions. Water Res. 185:116221. doi: 10.1016/j.watres.2020.116221
Xin, X. K., Zhang, H., Lei, P., Tang, W. Z., Yin, W., Li, J., et al. (2020). Algal blooms in the middle and lower Han River: characteristics, early warning and prevention. Sci. Total Environ. 706:9. doi: 10.1016/j.scitotenv.2019.135293
Yang, X., Guan, J., Duan, J., Wang, L., Pei, X., Luo, Y., et al. (2014). Heavy metal pollution and related health risk of Weihe River in Xi'an section. Bullet. Soil Water Conservat. 34:152. doi: 10.13961/j.cnki.stbctb.2014.02.033
Yang, L., Ren, Q., Zheng, K. X., Jiao, Z. Q., Ruan, X. L., and Wang, Y. Y. (2022). Migration of heavy metals in the soil-grape system and potential health risk assessment. Sci. Total Environ. 806:8. doi: 10.1016/j.scitotenv.2021.150646
Yin, X., Zhang, J. Y., and Chen, J. (2020). The impact of multi-projects on the alteration of the flow regime in the middle and lower course of the Hanjiang River, China. Water 12:21. doi: 10.3390/w12082301
Yuan, Q. S., Wang, P. F., Chen, J., Wang, C., Liu, S., and Wang, X. (2021). Influence of cascade reservoirs on spatiotemporal variations of hydrogeochemistry in Jinsha River. Water Sci. Eng. 14, 97–108. doi: 10.1016/j.wse.2021.06.008
Zeng, Z. X., Zhang, H., Shan, B. Q., and Yang, H. G. (2014). Analysis of industrial pollution sources of the middle and lower reaches of Hanjiang river basin. Resour. Environ. Yangtze Basin 23, 252–259. doi: 10.1870/cjlyzyyhj201402014
Zhang, J. H., Guo, L. Q., Huang, T., Zhang, D. D., Deng, Z. M., Liu, L. S., et al. (2022). Hydro-environmental response to the inter-basin water resource development in the middle and lower Han River, China. Hydrol. Res. 53, 141–155. doi: 10.2166/nh.2021.090
Zhang, J. H., Li, X. C., Guo, L. Q., Deng, Z. M., Wang, D. W., and Liu, L. S. (2021). Assessment of heavy metal pollution and water quality characteristics of the reservoir control reaches in the middle Han River, China. Sci. Total Environ. 799:149472. doi: 10.1016/j.scitotenv.2021.149472
Zhang, C., Nong, X. Z., Shao, D. G., Zhong, H., Shang, Y. M., and Liang, J. K. (2021). Multivariate water environmental risk analysis in long-distance water supply project: a case study in China. Ecol. Indic. 125, 70–82. doi: 10.1016/j.ecolind.2021.107577
Zhang, J., Wang, K., Yi, Q. T., Zhang, T., Shi, W. Q., and Zhou, X. F. (2022). Transport and partitioning of metals in river networks of a plain area with sedimentary resuspension and implications for downstream lakes. Environ. Pollut. 294:118668. doi: 10.1016/j.envpol.2021.118668
Zhao, R., Guan, Q. Y., Luo, H. P., Lin, J. K., Yang, L. Q., Wang, F. F., et al. (2019). Fuzzy synthetic evaluation and health risk assessment quantification of heavy metals in Zhangye agricultural soil from the perspective of sources. Sci. Total Environ. 697:12. doi: 10.1016/j.scitotenv.2019.134126
Zhao, P., Li, Z. G., Zhang, R. Q., Pan, J. F., and Liu, Y. (2020). Does water diversion project deteriorate the water quality of reservoir and downstream? A case-study in Danjiangkou reservoir. Glob. Ecol. Conserv. 24:e01235. doi: 10.1016/j.gecco.2020.e01235
Zhao, Y., and Li, F. (2022). Characteristics and risk assessment of heavy metal pollution in Weinan segment of Weihe River Basin. Journal of Yangtze River Scientific Research Institute 39, 35–42. doi: 10.11988/ckyyb.20201203
Zhou, Y., Khu, S. T., Xi, B. D., Su, J., Hao, F. H., Wu, J. Y., et al. (2014). Status and challenges of water pollution problems in China: learning from the European experience. Environ. Earth Sci. 72, 1243–1254. doi: 10.1007/s12665-013-3042-3
Keywords: water quality variation, health risk assessment, heavy metal pollution, Hanjiang River, multivariate statistical techniques
Citation: Nong X, Yi X, Chen L, Shao D and Zhang C (2023) Impact of inter-basin water diversion project operation on water quality variations of Hanjiang River, China. Front. Ecol. Evol. 11:1159187. doi: 10.3389/fevo.2023.1159187
Edited by:
Chengcheng Xia, Sichuan University, ChinaReviewed by:
Kunal Singh, Geological Survey of India, IndiaCopyright © 2023 Nong, Yi, Chen, Shao and Zhang. This is an open-access article distributed under the terms of the Creative Commons Attribution License (CC BY). The use, distribution or reproduction in other forums is permitted, provided the original author(s) and the copyright owner(s) are credited and that the original publication in this journal is cited, in accordance with accepted academic practice. No use, distribution or reproduction is permitted which does not comply with these terms.
*Correspondence: Xizhi Nong, bm9uZ3hpemhpQGd4dS5lZHUuY24=; Lihua Chen, eGRzbGNsaEBneHUuZWR1LmNu
Disclaimer: All claims expressed in this article are solely those of the authors and do not necessarily represent those of their affiliated organizations, or those of the publisher, the editors and the reviewers. Any product that may be evaluated in this article or claim that may be made by its manufacturer is not guaranteed or endorsed by the publisher.
Research integrity at Frontiers
Learn more about the work of our research integrity team to safeguard the quality of each article we publish.