
94% of researchers rate our articles as excellent or good
Learn more about the work of our research integrity team to safeguard the quality of each article we publish.
Find out more
ORIGINAL RESEARCH article
Front. Ecol. Evol., 12 May 2023
Sec. Environmental Informatics and Remote Sensing
Volume 11 - 2023 | https://doi.org/10.3389/fevo.2023.1159152
This article is part of the Research TopicPath, Method and Theory of Carbon Neutralization in the Context of Artificial IntelligenceView all 9 articles
 Wenhui Wang1,2*
 Jian Zhang1*
Land use patterns significantly impact urban development by exerting production-living-ecological functions (PLEFs). Scientifically measuring the relationships among PLEFs is essential to support regional high-quality and sustainable development. However, the current identification methods of PLEFs are biased, and researches on the spatial distribution of coordination and conflict and their influencing factors in metropolitan are insufficient. This study proposed an improved PLEFs identification method to analyze the PLEFs in Beijing from 2000 to 2020 at a grid scale. Then, the coupling coordination degree (CCD) of PLEFS was estimated by employing spatiotemporal data and spatial statistical models. Finally, the impacts of the socioeconomic and natural factors on the CCD were quantified by the geographically weighted regression model (GWR). The results showed that from 2000 to 2020, (1) the areas with high CCD gathered in the plain areas with high PF and LF, and the low CCD areas clustered in the mountainous areas with low PF and LF; (2) the EF presented a closer positive relationship with CCD in the plain areas, while the positive impact of PF and LF on CCD was more substantial than EF in the mountainous areas; and (3) the population and GDP factors had high positive effects on CCD in the north and west mountain areas, and the altitude and slope factors negatively affected CCD in most areas of Beijing, except for a few areas in the southeast. Therefore, formulating a regional differentiation strategy to achieve the sustainable development of PLEFs in Beijing was crucial.
Land use change is one of the main determinants of global change (Verburg et al., 2009; Steinhäußer et al., 2015). Different products and services provided by land use types determine their multiple functions (Zhang, 2005; Bach et al., 2015; Verstegen et al., 2016), and they are often classified as production, living and ecological functions (PLEFs) (Peng et al., 2016; Zhou et al., 2017; Ji et al., 2020). The production function (PF) provides agricultural, industrial, and service products. The living function (LF) gives living and public services to human beings. Additionally, the ecological function (EF) generates ecological products and services and maintains environmental quality (Liu et al., 2018; Li et al., 2021). Since the PLEFs reflect the status and performance of regional land use, analyzing the PLEFs of land is an effective way to assess land use conversion and its impact on sustainability (Ma et al., 2014; Zhang et al., 2015; Zhou et al., 2017). The coordinated development of land use functions is of great significance to the healthy, efficient, and sustainable development of human-land relationship. Therefore, regulating the PLEFs can coordinate socioeconomic growth and promote efficient and sustainable land use (Steinhäußer et al., 2015; Li et al., 2021). Currently, land use patterns have shifted dramatically due to global urbanization and industrialization (Mukul and Saha, 2017; Song and Deng, 2017; Yu et al., 2020). However, the rapid shift causes problems such as unbalanced and uncoordinated land development, which brings significant challenges to the sustainable development of China (Steinhäußer et al., 2015; Deng and Yang, 2021; Zhu C. et al., 2021). These problems are confirmed to be closely related to the incoordination of PLEFs, especially in populous regions in metropolitan areas (Deng and Yang, 2021; Li et al., 2021; Zhu C. et al., 2021). The uncoordinated development of PLEFs restricts the sustainable development of land use (Wiggering and Steinhardt, 2015; Feng et al., 2022). Therefore, it is urgent to understand the interaction of PLEFs and to clarify the influencing factors to achieve the best use of land multifunction.
The identification of PLEFs is the basis of exploring the relationship among PLEFs. Researchers have conducted much work on identifying and assessing PLEFs (Fu et al., 2021; Yin et al., 2021). There are two main methods for identifying PLEFs: one is based on the quantitative analysis of the index systems and the other is based on the land use classification. The first method evaluates PLEFs by constructing an index system that could reflect the performance of each function, and it focuses on the output of PLEFs (Andersen et al., 2013; Wiggering and Steinhardt, 2015; Zhang et al., 2015; Tavora and Turetta, 2016; Zhang and Li, 2022). However, the lack of a systematic index system and the complex calculation process make this method inconvenient (Yin et al., 2021). Moreover, it cannot be flexibly applied to multiscale functional evaluation since the scope of data collection is often based on administrative units (Yin et al., 2021). The second method evaluates PLEFs by scoring the multifunction diversity of land use with standards (Zhang et al., 2015; Hu et al., 2016; Duan et al., 2021; Zou et al., 2021). Although the multifunction identification method of land use is simple and convenient, and it can also be applied to multiscale research, it fails to reflect the practical output benefits of PLEFs (Wei et al., 2021; Xie et al., 2021). Furthermore, the division of the research scale also affects the accuracy of the results (Deng and Yang, 2021; Yin et al., 2021). A more extensive range means more blurred and homogenized results. At present, the scope of research on PLEFs is mainly based on administrative boundaries. However, it is challenging for such a method to use administrative boundaries to portray more internal and precise characteristics. Therefore, it is necessary to adopt an optimized method to identify PLEFs at a smaller scale and analyze their spatial characteristics.
Land use activities create PLEFs, and they interact spatially and temporally (Zhu C. et al., 2021; Zhu Y. et al., 2021). The interactions of PLEFs are usually manifested in coupling coordination, which plays a vital role in balancing the regional spatial structure and ensuring regional stability and development (Zhou et al., 2017; Li et al., 2021; Yao et al., 2021). Originating from physical science, coupling refers to the phenomenon that multiple systems combine through diverse interactions (Li et al., 2021). In addition, coordination refers to the cooperative relationship among systems in the development process and reflects the efficacy or synergistic effect of the whole system (Li et al., 2021). The coupling coordination degree (CCD) can accurately reflect the synergism relationships among systems by quantifying both coupling and coordination. Although the coupling coordination degree model (CCDM) has been gradually improved and widely applied in geography, environmental science, ecology, and other fields (Yang et al., 2021; Liu and Nie, 2022; Qi et al., 2022), few studies have used CCDM in PLEFs research. Due to the differences in socioeconomic and natural factors, PLEFs and their interactions may be heterogeneous in space and may change with time (Boone et al., 2018; Zhu C. et al., 2021). Therefore, it is critical to explore the CCD of PLEFs and its influencing factors to deepen our understanding of PLEF interactions and provide scientific support for decision-making in optimizing territorial spatial patterns.
A good overview of studies has shown that PLEFs and their interrelationships are related to human activities and natural changes (Carreno et al., 2012; Zhu et al., 2020b; Li et al., 2021; Zhu C. et al., 2021). Urbanization and industrialization drastically change land use, which has profoundly affected agriculture and natural ecosystems (Lu et al., 2013; Wei and Ye, 2014; Zhu et al., 2020a). Topography, temperature, and precipitation affect the interaction of PLEFs by changing climate, soil, and vegetation (Yang et al., 2020; Shen et al., 2022; Tran et al., 2022). Additionally, the influence of various factors on urban development has spatial heterogeneity. Therefore, exploring the geographical heterogeneity of the influence of various factors can help us accurately reveal the influencing mechanism (Zhu et al., 2020b). Recently, there are many data mining methods used to detect the impact of influencing factors, including Support Vector Machine (SVM), Decision Tree, and Random Forest (Yang and Zhou, 2020; Cai et al., 2022; Oukawa et al., 2022). However, these methods mostly stand on the perspective of global assumption, which assumes that the relationship of variables are fixed and do not change with the spatial location (Moghadam et al., 2018; Deng and Yang, 2021; Zhu C. et al., 2021). This premise assumption violates the fact of heterogeneity or non-stationary spatial relationships in the real geographical world (Pourmohammadi et al., 2021; Ma et al., 2022). Fortunately, geographically weighted regression (GWR) can obtain coefficient calculation results with spatial heterogeneity, which uses the information of adjacent space to estimate the independent coefficients of each calculation unit (Casolani et al., 2020; Zhu et al., 2020b; Shen et al., 2022; Tran et al., 2022). Therefore, GWR has better applicability in exploring the special differences of influencing factors across space.
Currently, Beijing is undergoing dramatic changes in PLEFs, and few studies have explored the coupling and coordination of PLEFs in Beijing (Feng et al., 2022). As the capital of China, Beijing has experienced rapid urbanization since the Reform and Opening-up, resulting in tremendous farmlands and ecological lands being converted into construction lands to support economic development and population growth (Li et al., 2018; Yin et al., 2021). Consequently, the rapid change in land use has exacerbated the conflict among PLEFs (Liu et al., 2020). Notably, the two policies adopted by the Beijing government have significantly impacted the spatial alteration of PLEFS. The Reduction Development Policy has relieved Beijing of functions nonessential to its role, which promotes the transfer of extensive industries to surrounding areas, especially the plain areas (Li et al., 2019; Liu et al., 2022). In addition, the Plain Afforestation Policy has enabled the conversion of plentiful agricultural lands into forestlands in plain areas (Hu et al., 2020; Jin et al., 2021; Wang Y. et al., 2022). These policies greatly affected the land use pattern and the development of PLEFs, which changed the coupling and coordination relationship of PLEFs. Accordingly, optimizing the PLEFs has become a vital issue for Beijing’s sustainable development.
This study aimed to reveal the spatiotemporal variations of CCD based on an optimized identification of PLEFs and discover the influencing factors of the CCD in Beijing. To achieve this goal, this study (1) identified PLEFs by an improved method that incorporated multifunctional land use attributes and functional output benefits at a grid scale, (2) calculated the CCD of PLEFs and explored their spatiotemporal heterogeneity, and (3) detected the impacts of socioeconomic and natural factors on CCD by employing GWR models. These analyses may contribute to the coordinated development of PLEFs by providing a scientific basis for optimizing land use and governance.
Beijing is the capital and one of the largest cities of China, which is located from 39.4° N to 41.6° N and 115.7°E to 117.4°E with an area of 16,410 km2.1 The terrain is high in the northwest and low in the southeast. Beijing is surrounded by mountains in the west, north, and northeast, and the southeast is a plain gently inclined to the Bohai Sea (Figure 1). In 2020, the gross domestic product (GDP) of Beijing was 3610.26 billion CNY, accounting for 3.56% of the total GDP of China. The shares of primary, secondary and tertiary industries in GDP accounted for 0.40, 15.80, and 83.80%, respectively. The population was 21.89 million, of which the urban population accounted for 87.55% by the end of 2020. Recently, the Reduction Development Policy and the Plain Afforestation Policy have brought about considerable changes in land use and PLEFs (Li et al., 2019; Jin et al., 2021). The imbalance and heterogeneity of development in Beijing are increasingly prominent and have emerged as the primary obstacle to the region’s sustainable development (Yang et al., 2020).
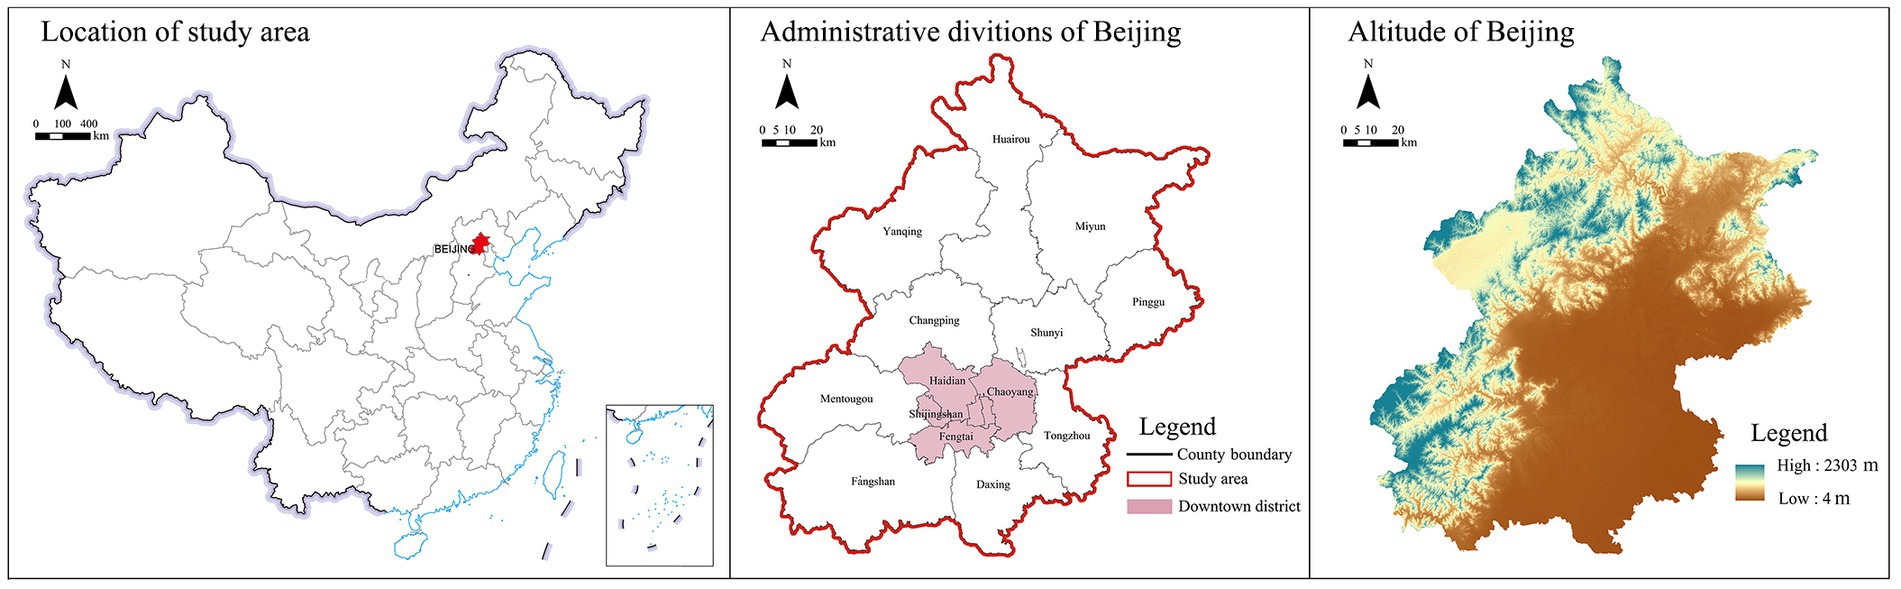
Figure 1. The study area of Beijing.
The primary data for this research included land use data, social and economic data, and administrative boundary data in 2000, 2005, 2010, 2015, and 2020. The land use data were obtained from the Resource and Environment Science and Data Center of the Chinese Academy of Sciences.2 The land use data were interpreted from Landsat TM images with a spatial resolution of 30 m (With the progress of image processing technology, the interpreted results will be more optimized; Ning et al., 2022, 2023). The social and economic data were obtained from the Statistical Yearbook of Beijing, the Regional Statistical Yearbook of Beijing, and the statistical yearbooks of related districts and counties. The administrative boundary data came from the Bigemap GIS Office.3
We proposed a research framework of “multifunction identification fundamental-multifunction optimization identification-characteristic analysis” (Figure 2). The basic ideas are as follows: First, preliminarily identify the multifunction attributes of land use, and establish a multifunctional output benefits evaluation system; Secondly, the preliminary evaluation values of land multifunction attribute are modified by the weights of output benefits, and the comprehensive identification results of PLEFs are calculated. Finally, the coupling coordination is analyzed based on the comprehensive value of functions.
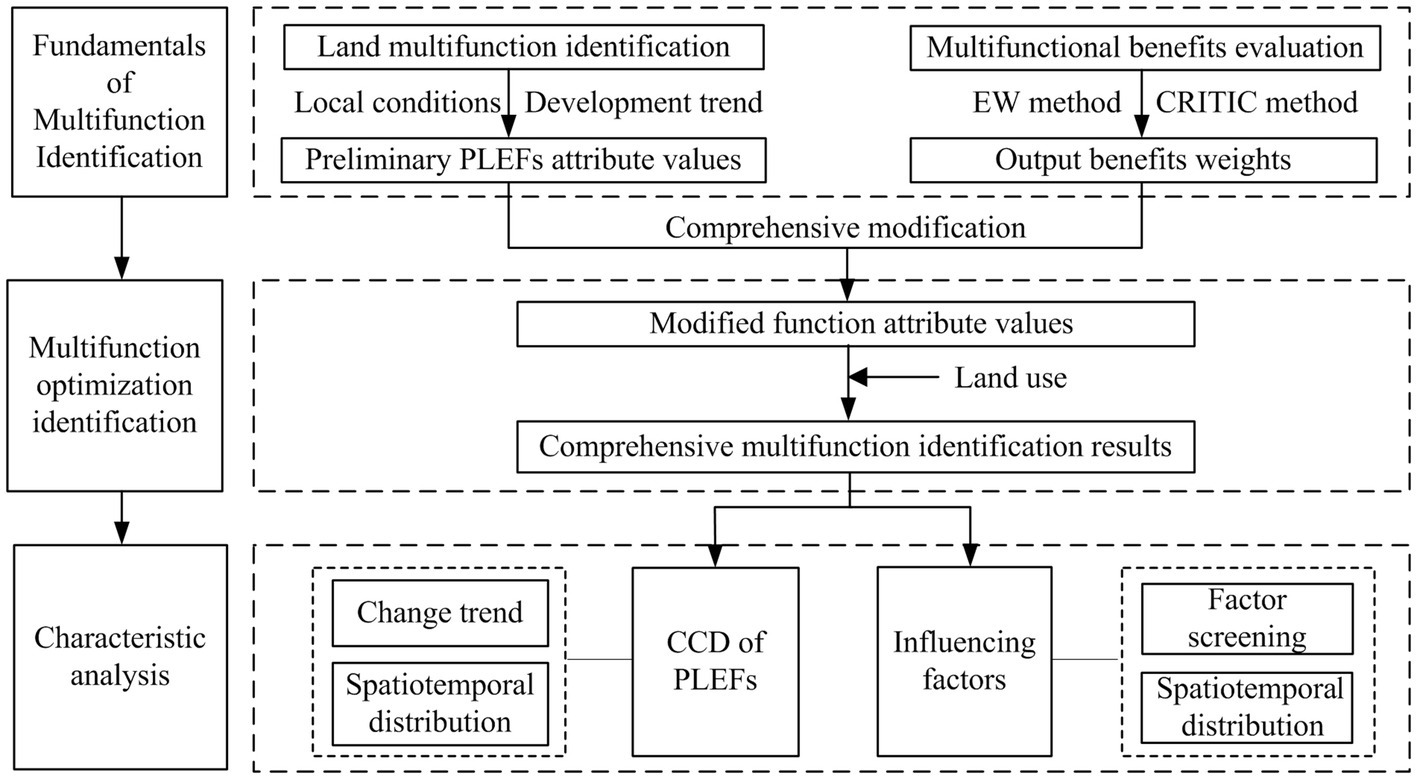
Figure 2. The research framework.
The index system and land classification are complementary when identifying the PLEFs. Therefore, this study proposed an improved PLEFs identification method by combining the two methods, which could not only reflect the output benefits of PLEFs but also reveal more details at the land use level. Here, this study made a preliminary understanding of the PLEFs attribute values first. Then, established an output benefits index system of PLEFs to analyze the weights of each function. Finally, modified the PLEFs attribute values of land use by the weights of functions’ output benefits, and calculated the comprehensive value of PLEFs (Figure 3). It is worth noting that this optimization method can be flexibly mastered according to the range of data obtained. According to the scale of the study area and feasibility of data acquisition, we chose to use the output benefit data at the administrative district level to realize the modification.
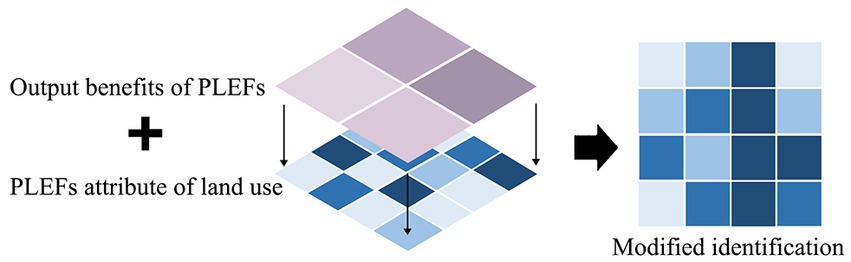
Figure 3. The basic steps of improved identification of production-living-ecological functions (PLEFs).
Production-living-ecological functions of land use have different functional intensities. It is crucial to consider not only the difference among functions in the same kind of land use but also the development and change of functions with time variation to identify the PLEFs of the land (Ji et al., 2020). Based on previous studies (Liu et al., 2017; Deng and Yang, 2021), this study presented a modified identification and quantification of PLEFs attributes in various land use types in Beijing (Table 1). The score reflected the strength of the function. The higher the score, the stronger the function. It is worth mentioning that we optimized the score in two aspects according to the situation in Beijing.
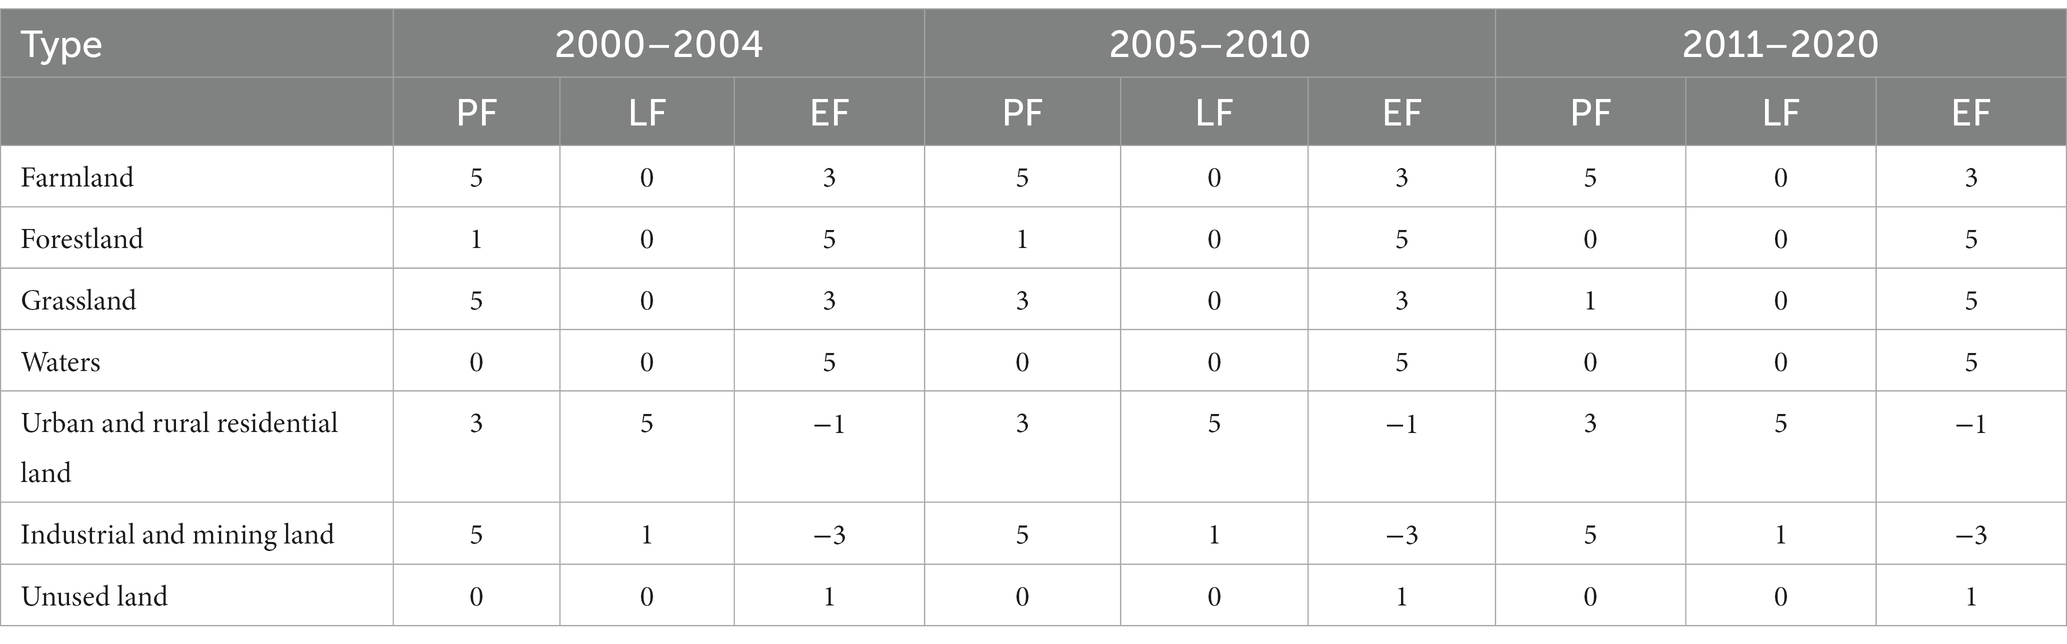
Table 1. Preliminary PLEFs attribute values of land use in Beijing from 2000 to 2020.
First, it highlighted regional characteristics and development dynamics. Beijing has vigorously promoted the construction of ecological civilization, which has given more prominence to the ecological value of forestland and grassland and restricted the development of production functions (Ji et al., 2020). Therefore, we modified the values of the PF and EF of forestland and grassland across various periods. Compared with static evaluation (Zhang et al., 2015; Liu et al., 2017; Cui et al., 2018), the quantitation in this study reflected the dynamic characteristics by adapting measures to local conditions and advancing with time.
Second, the value of EF in construction land was modified. Previous studies only identified the PF and LF of construction land but ignored its ecological repercussions. The expansion of construction land and the massive discharge of pollutants have harmed the environment (Kong et al., 2021; Yao et al., 2021). Therefore, construction land should have a negative value on EF. According to the difference in the reduction degree of the ecosystem by different types of construction land (Ji et al., 2020; Li et al., 2021), we determined that the EF values of urban and rural residential land were −1, and industrial and mining construction land were −3.
The social development indicators reflect the practical effects of PLEFs. Therefore, we established a scientific index system to measure the output benefits of the PLEFs. As one of the megacities in China, Beijing’s production function system ranges widely, thus the production function should include indicators representing the primary industry, secondary industry, and tertiary industry (Feng et al., 2022). The living function represents the ability to provide basic conditions and welfare benefits, which are contributed by the population, income, consumption capacity, and public service facilities (Yu et al., 2020; Wei et al., 2021; Yin et al., 2021). The ecological function includes the supply capacity of ecological resources and the ability to maintain the ecological quality, and thus the ecological function indicators should be able to reflect all the needs above (Zhou et al., 2017; Wei et al., 2021). To sum up, based on the principles of authenticity and typicality, this study selected the 18 most important and representative indicators to fully reflect the PLEFs’ output benefits of Beijing in accordance with the existing researches, and then calculated the PLEFs’ output benefits weights (Table 2).

Table 2. The output benefits index system of PLEFs.
Based on the above index system, this study used the entropy weight (EW) method and the criteria importance through intercriteria correlation (CRITIC) method to calculate the comprehensive output benefits weights of each function. The EW method determines the weight of the indicators by judging the sensitivity of each factor in the overall decision-making based on objective data (He et al., 2017). However, some studies have shown that although the EW method can use the dispersion degree between indicators to determine the weight, it cannot compare the conflict between indicators (Fu and Chu, 2020). Fortunately, The CRITIC method makes a way to measure the contrast and conflict between indicators (Fu and Chu, 2020). Therefore, this study proposed the EW-CRITIC method to give weight to each function, since the integrated use of the two methods could make the results more scientific and accurate. Considering the EW and CRITIC are equally important, so they account for 50%, respectively. The formula is as follows:
Where is the EW of indicator , is the standard value of indicator , is the CRITIC of indicator , is the standard deviation of indicator , is the average center of indicator , is the correlation coefficient between indicator and indicator , and is the EW-CRITIC weight.
An appropriate unit is the basis for the evaluation of PLEFs. Since the grid units have less differentiation than the administrative units, the research results are more accurate and targeted by applying grid units (Deng and Yang, 2021; Li et al., 2021; Yin et al., 2021). Meanwhile, the grid units should be divided according to the research scale (Yin et al., 2021). If the unit was too large or too small, the characters of the results were homogenized or could not be extracted (Yin et al., 2021). Currently, the 1–5 km grid, 500 m–3 km grid, and 300–500 m grid are generally used in province, city, and village, respectively. Considering the scale of the Beijing Plain area, 500 m and 1–3 km grids were established for comparison experiments, and a 1 km × 1 km grid was selected as the optimal unit for Beijing. Then, the PLEFs values were calculated according to the quantity of various land use types in the grid units and their PLEFs attribute values. The formula is as follows:
where is the modified function attribute value of land ; is the preliminary function attribute value of land ; is the number of indicators in the function; is the comprehensive identification results of PLEFs; and is the area of land in the unit. According to the calculation results, the PLEFs values in Beijing were divided into five types by Natural Breakpoint Class: high, medium-high, medium, medium-low, and low.
The coupling coordination degree (CCD) measures the level of interaction among systems as well as their coordination (Zhou et al., 2017; Yu et al., 2020). Based on the application in relevant fields (Yang et al., 2021; Liu and Nie, 2022; Qi et al., 2022), the improved CCDM was constructed for PLEFs. The formula is as follows:
where is the CCD of PLEFs, with a value range of [0,1]; is the coupling degree among PLEFs, with a value range of [0,1]; the higher the value is, the stronger the interaction; , and represent the values of PF, LF and EF, respectively; is the integrated degree of PLEF; , and are the importance coefficients of PF, LF, and EF. Most studies use equal importance coefficients for PF, LF and EF, considering they are equally important for human social development (Yang et al., 2020; Wei et al., 2021). A few studies use different equal coefficients, mainly considering the difference in outputs of the PLEFs (Yu et al., 2020). However, this study considers that the unequal importance of PLEFs is an objective fact, which does not mean that such a fact is the criterion of coordination. Therefore, this study prefers that PF, LF, and EF are of equal importance with the coefficients were determined as .
To better judge the CCD, this study subordinated the CCD with an equal interval to the following types (Table 3).
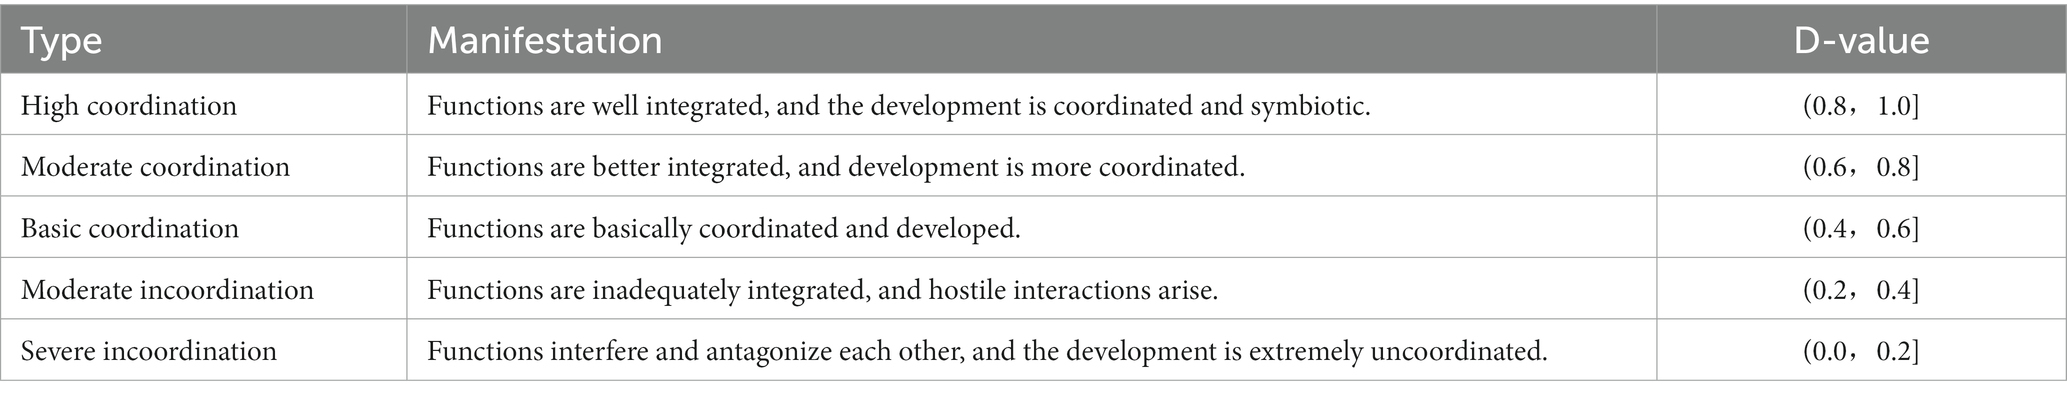
Table 3. Classifications of CCD among PLEFS.
The geographically weighted regression model (GWR) enhanced the ordinary least squares model (OLS) by allowing for spatial non-stationary, which caused the correlations between the variables to change with location (Casolani et al., 2020; Zhu et al., 2020b). The GWR model could provide a set of local regression coefficients in each unit for revealing the spatial difference of the influence of independent variables on dependent variables (Casolani et al., 2020). The calculation formula is as follows:
where is the dependent variable value for the unit ; is the intercept; is the regression coefficient for the -th covariate for the unit ; is the value of the -th covariate for the unit ; and is the random error.
Bandwidth selection might severely influence GWR estimation, and the optimum bandwidth should be carried out carefully (Casolani et al., 2020). The Akaike information criterion (AIC) obtains the minimum value through continuous iteration of sample data, which is widely used to determine the optimal bandwidth of GWR (Zhu et al., 2020b). In this study, we employed AIC to obtain the optimum bandwidth. Additionally, a significant spatial correlation between the spatial distributions of CCD was a prerequisite for applying the GWR model (Zhu Y. et al., 2021). If the spatial correlation was insignificant, the spatial location had little impact on the CCD (Zhu Y. et al., 2021). Therefore, the spatial autocorrelation model was applied to examine whether the observed values in the spatial units were related to those observed in adjacent spatial units (Zhu Y. et al., 2021). The calculation formula is as follows:
where is the global Moran’s I index; and are the CCD values of unit and unit , respectively; is the number of regions; is the mean CCD value of the entire region; and represents the spatial weight matrix, which can be obtained from spatial relationships. Since the grid generates relationships by sharing edges and corners, it would be efficient to calculate a spatial weight matrix by defining spatial relationships in terms of whether edges and corners are adjacent (cf. the GIS manual for the choose of spatial relationship conceptualization method). This would be achieved with the help of the Contiguity (Edges and Corners) tool in Arcgis10.8 (Esri, United States). The range of Moran’s I was [−1, 1]. When I > 0, the CCD shows a positive correlation state in space. When I < 0, the CCD shows a negative correlation state in space. When I = 0, the CCD is utterly unrelated to another CCD of an adjacent region.
Socioeconomic and natural factors significantly influenced the PLEFs (Wiggering et al., 2006; Fan et al., 2021; Li et al., 2021). Considering the availability and representativeness of data, the population and gross domestic product (GDP) were proposed as socioeconomic factors (Yang et al., 2020; Zhu et al., 2020a; Yao et al., 2021; Zhu C. et al., 2021). Altitude, slope, precipitation, and temperature were chosen as natural factors (Zhou et al., 2017; Yang et al., 2020). The factors values were calculated by the total number of factors in each grid.
Before using GWR, it was necessary to diagnose the statistical significance and multicollinearity of the factors through the probability value (p) and variance inflation factor (VIF; Liu et al., 2021; Zhu Y. et al., 2021). Then, we screened out the factors with significant influence and no collinearity for GWR analysis.
Figure 4 displays the dynamic changes and spatial distribution of the PLEFs in Beijing. Overall, Beijing experienced a decrease in PF and EF and an increase in LF from 2000 to 2020. Furthermore, EF was always above PF, followed by LF. The PF decreased sharply in the past 20 years, except for a slight increase from 2005 to 2010. Additionally, LF and EF both reached a turning point in 2015 but showed the opposite trend: LF first increased by 0.54 and then declined by 0.18, and EF first dropped by 0.32 and then rose by 0.13.
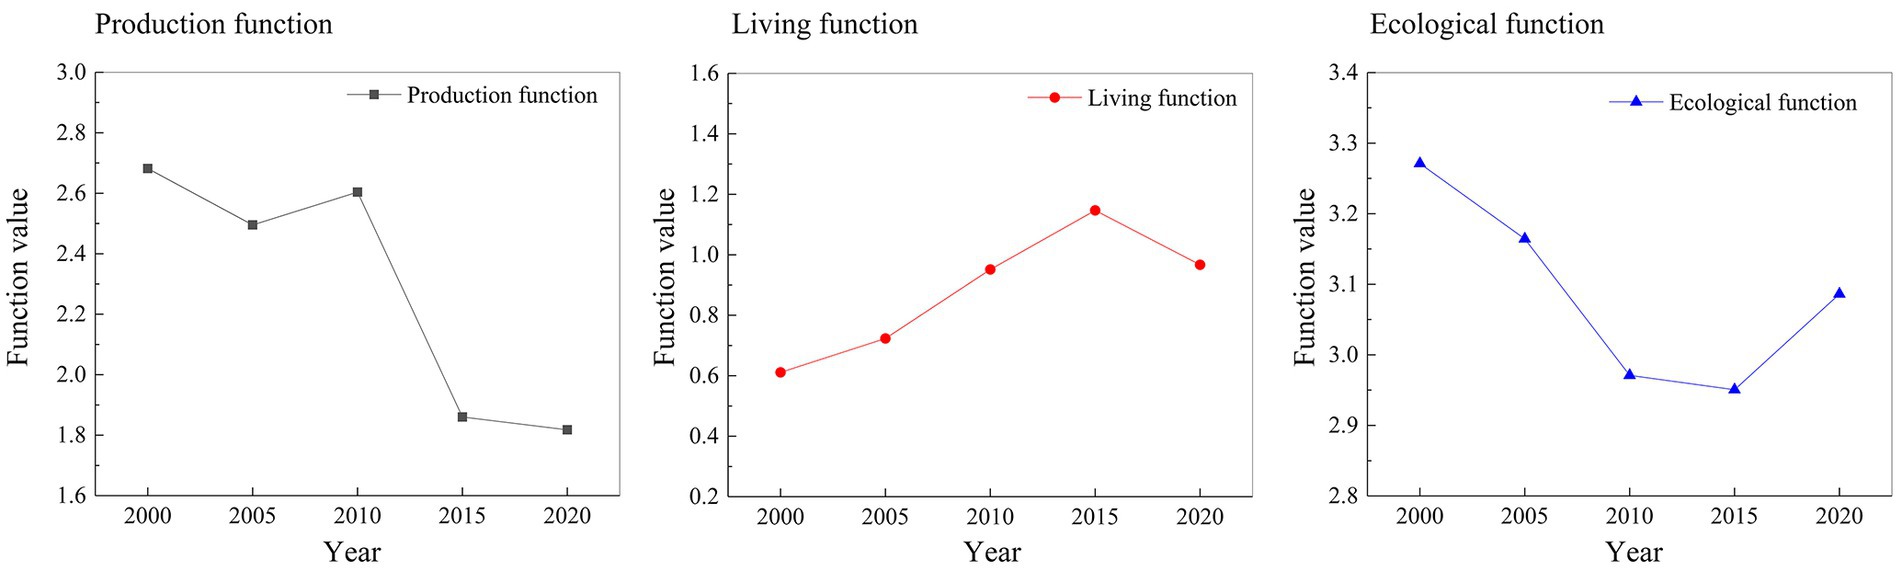
Figure 4. Evolution trend of PLEFs in Beijing during 2000–2020.
The spatiotemporal pattern of the PLEFs in Beijing was visualized using Arcgis10.8 (Esri, United States; Figure 5). The high-value areas of the PF were mainly concentrated in the southeast, which was plain. The decreasing trend of PF primarily existed in the mountainous areas and suburbs in the plain areas. The LF generated a highly dense pattern in the downtown and district centers with high urbanization, which had convenient transportation and enough facilities. The LF increased to different degrees in most plain areas over the research period, especially in the downtown area. However, the EF was inverse to the LF with distributions. The high-value area gathered in the mountainous areas, and the low-value areas clustered in the plain areas. The EF dropped across the plain areas and rose in the mountainous areas. The spread of urban construction presumably caused the extension of the low-value areas of EF.
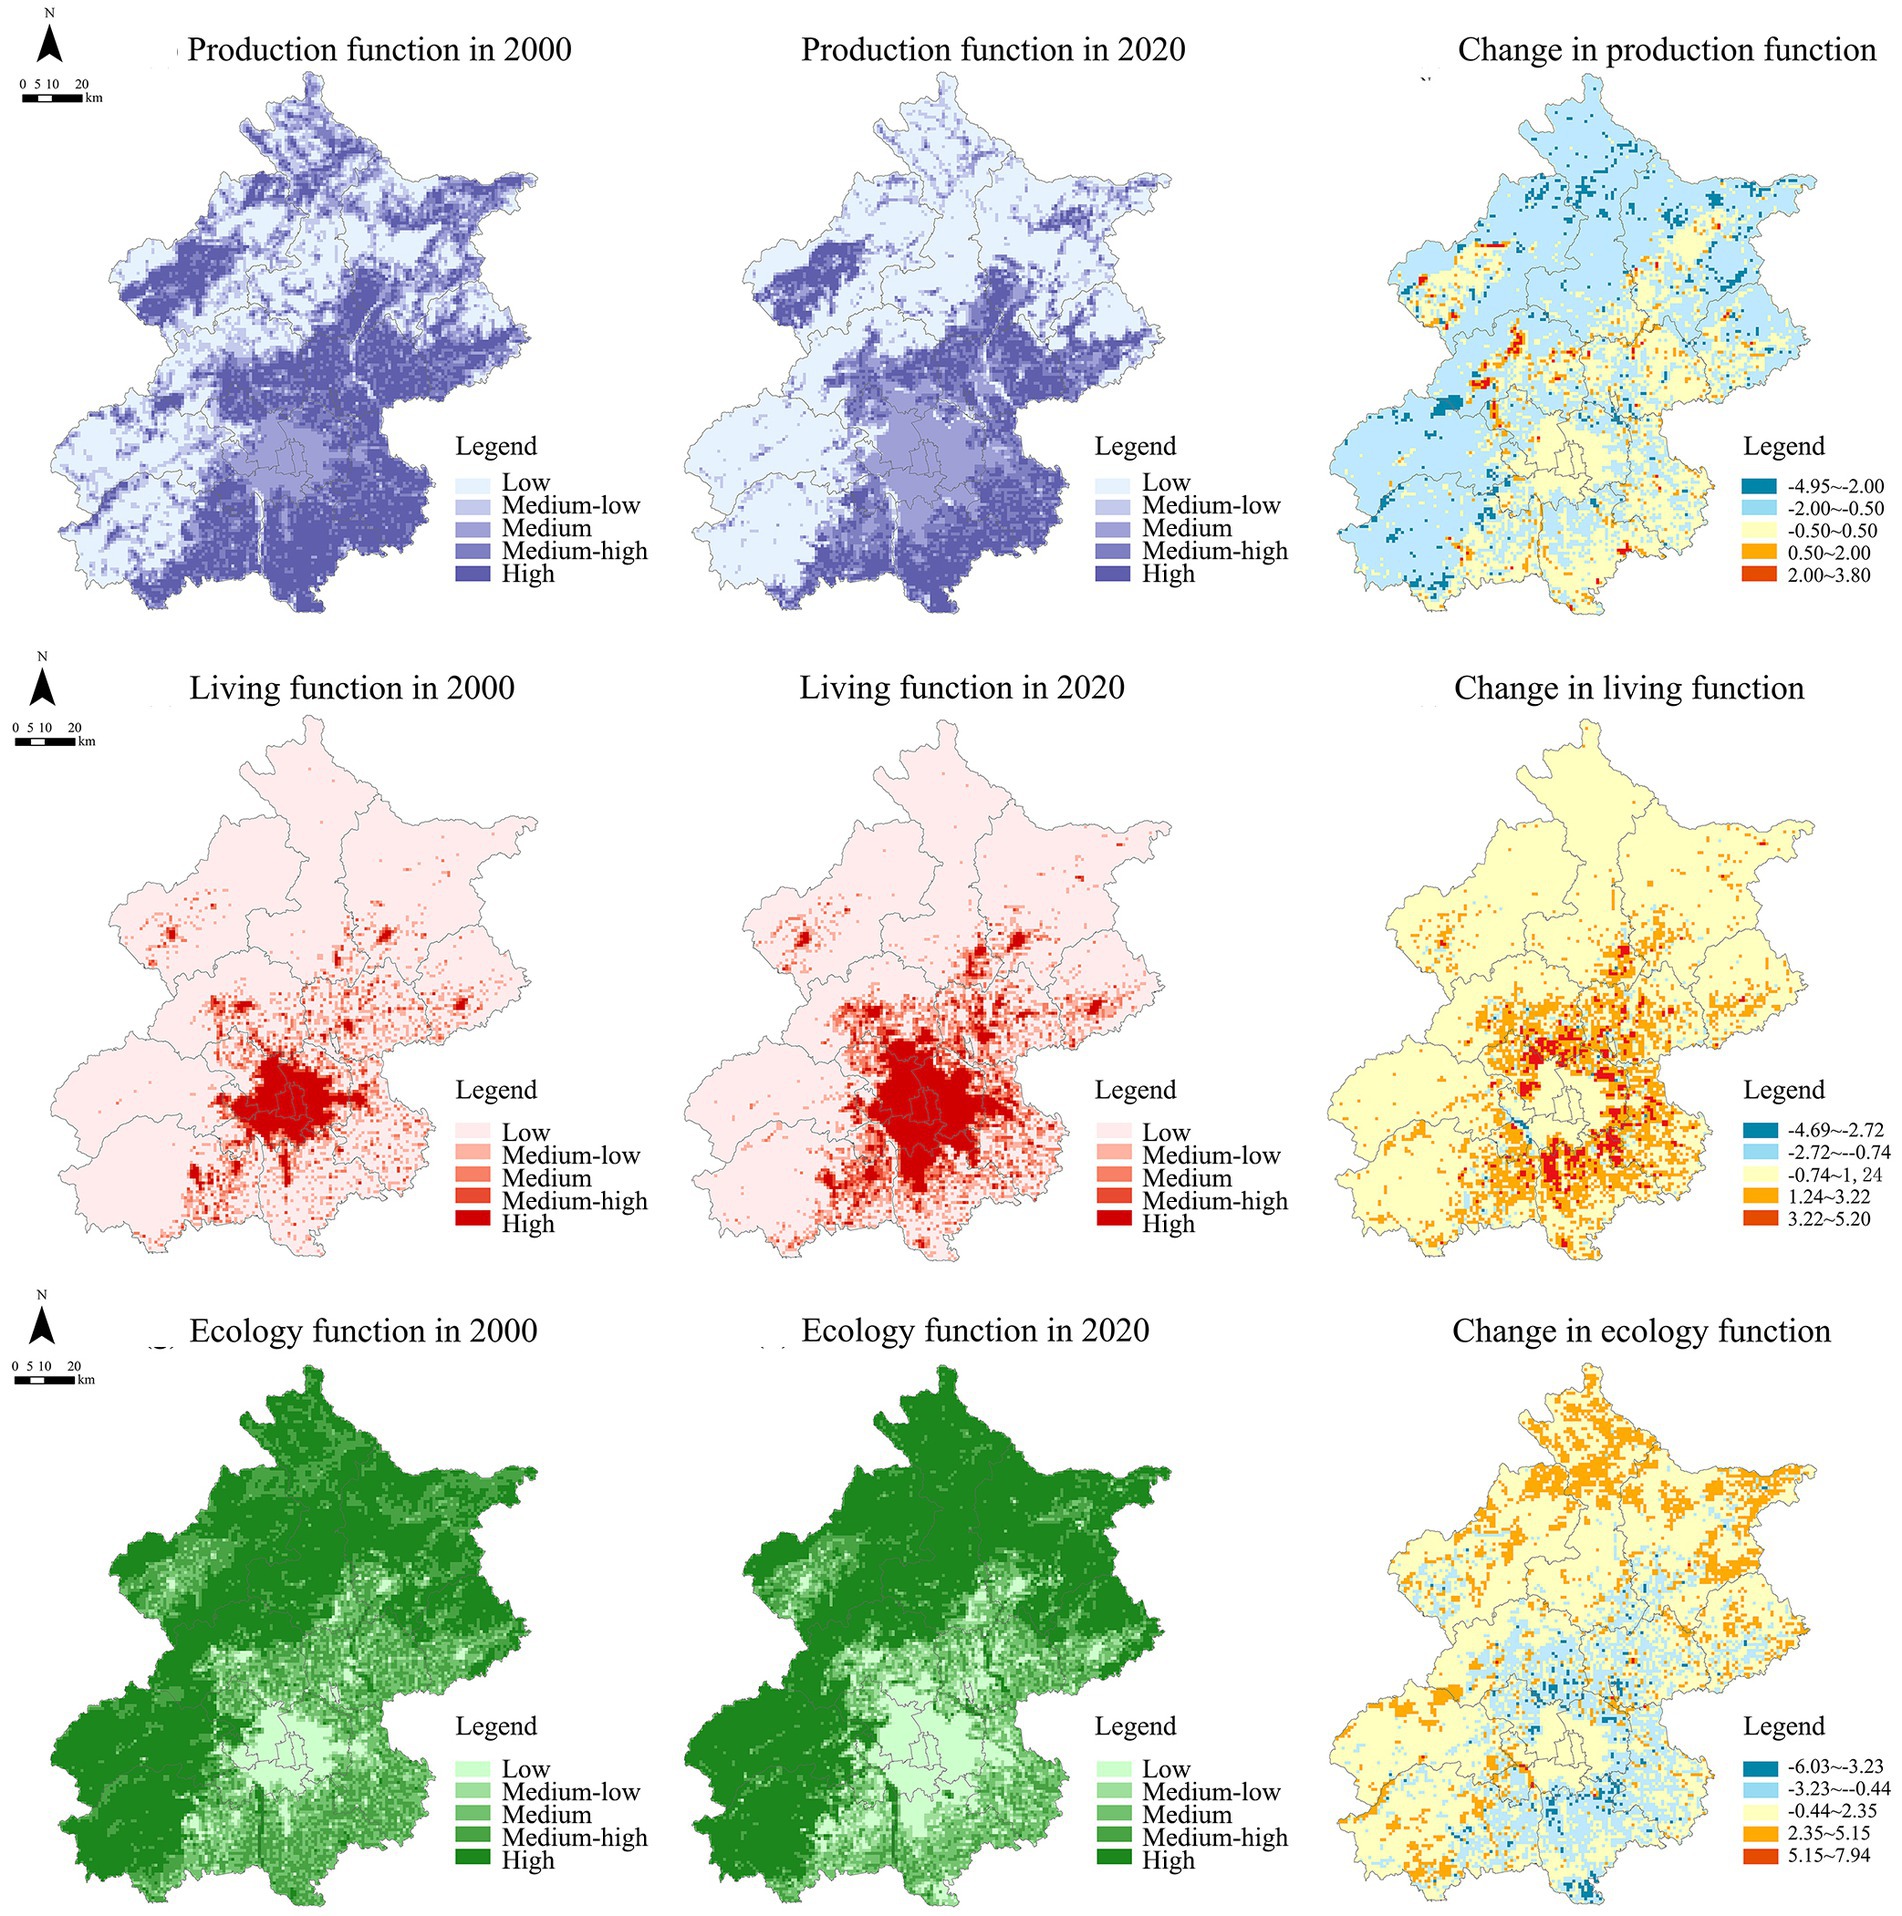
Figure 5. Spatiotemporal patterns of PLEFs and their changes during 2000–2020.
Figure 6 illustrates that the average value of CCD first remained stable at approximately 0.48 from 2000 to 2005 and then decreased to 0.45 in 2020 with a slowed downtrend. The proportion of moderate coordination CCD areas increased from 27.92% in 2000 to 35.69% in 2015 and then decreased to 34.31% in 2020. In contrast, the proportion of basic coordination areas decreased from 29.98% in 2000 to 16.17% in 2015 and increased to 17.26% in 2020. Additionally, the ratio of moderate and severe incoordination areas fluctuated approximately 41.26–47.04% and 1–2% (Figure 7), respectively. Regarding the spatial distribution, the CCD presented a sharp declining trend from the plain areas to the mountainous areas, and formed an opposite development trend (Figure 8). In summary, the CCD of the PLEFs was polarized with the improvement in the plain areas and the deterioration in the mountainous areas.
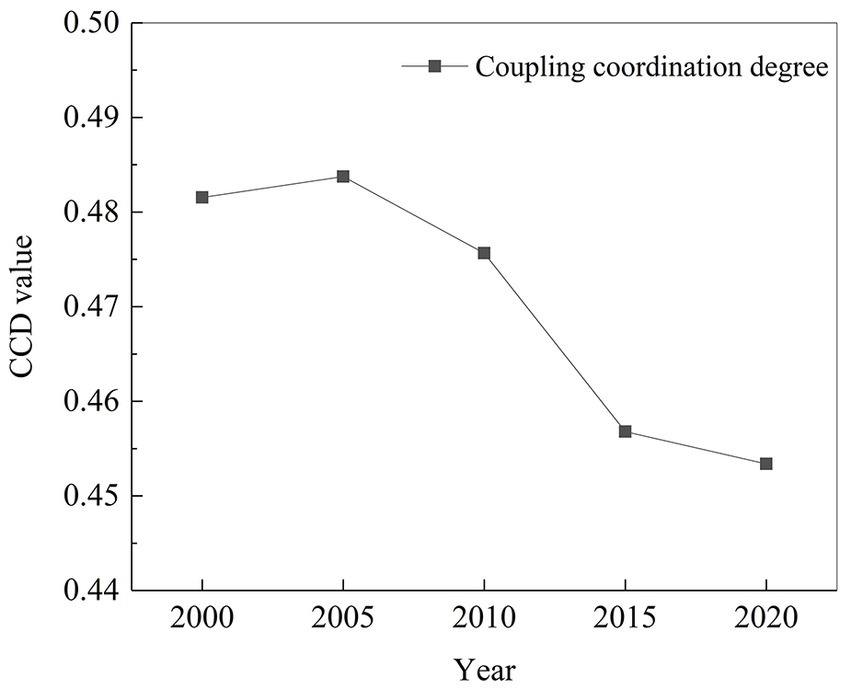
Figure 6. Temporal variation of CCD during 2000–2020.
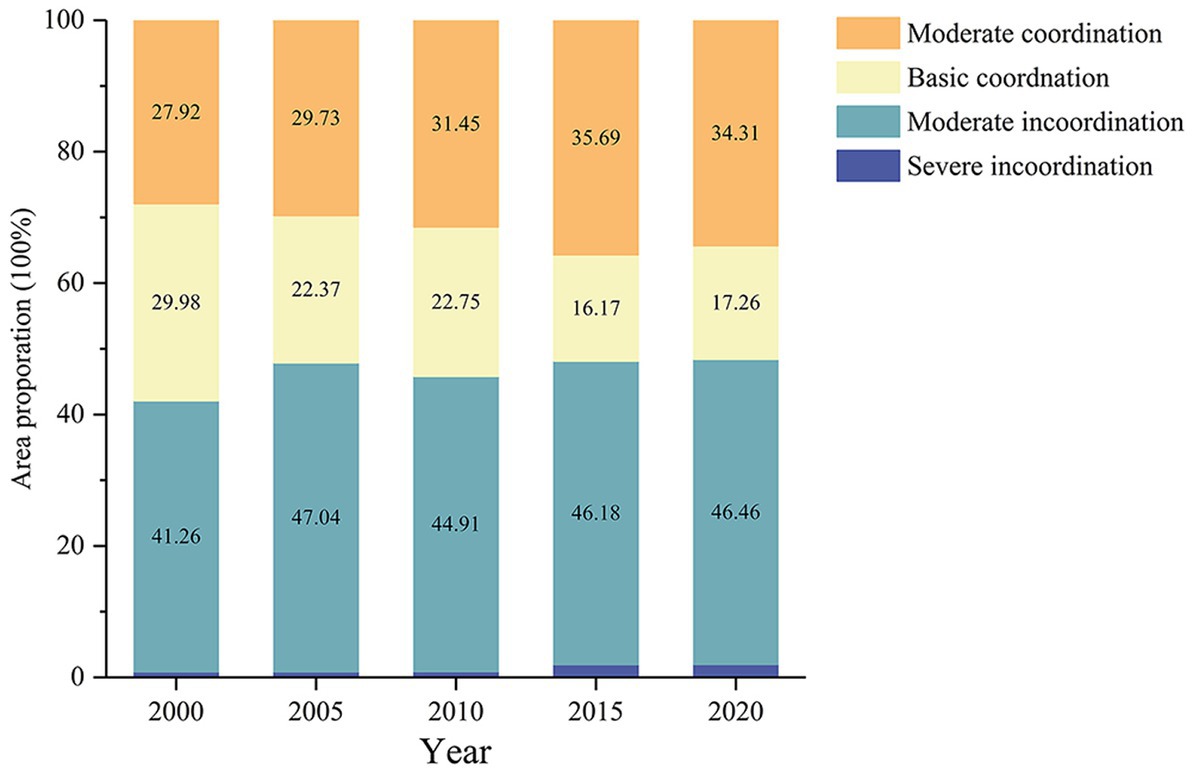
Figure 7. Type statistics of CCD during 2000–2020.
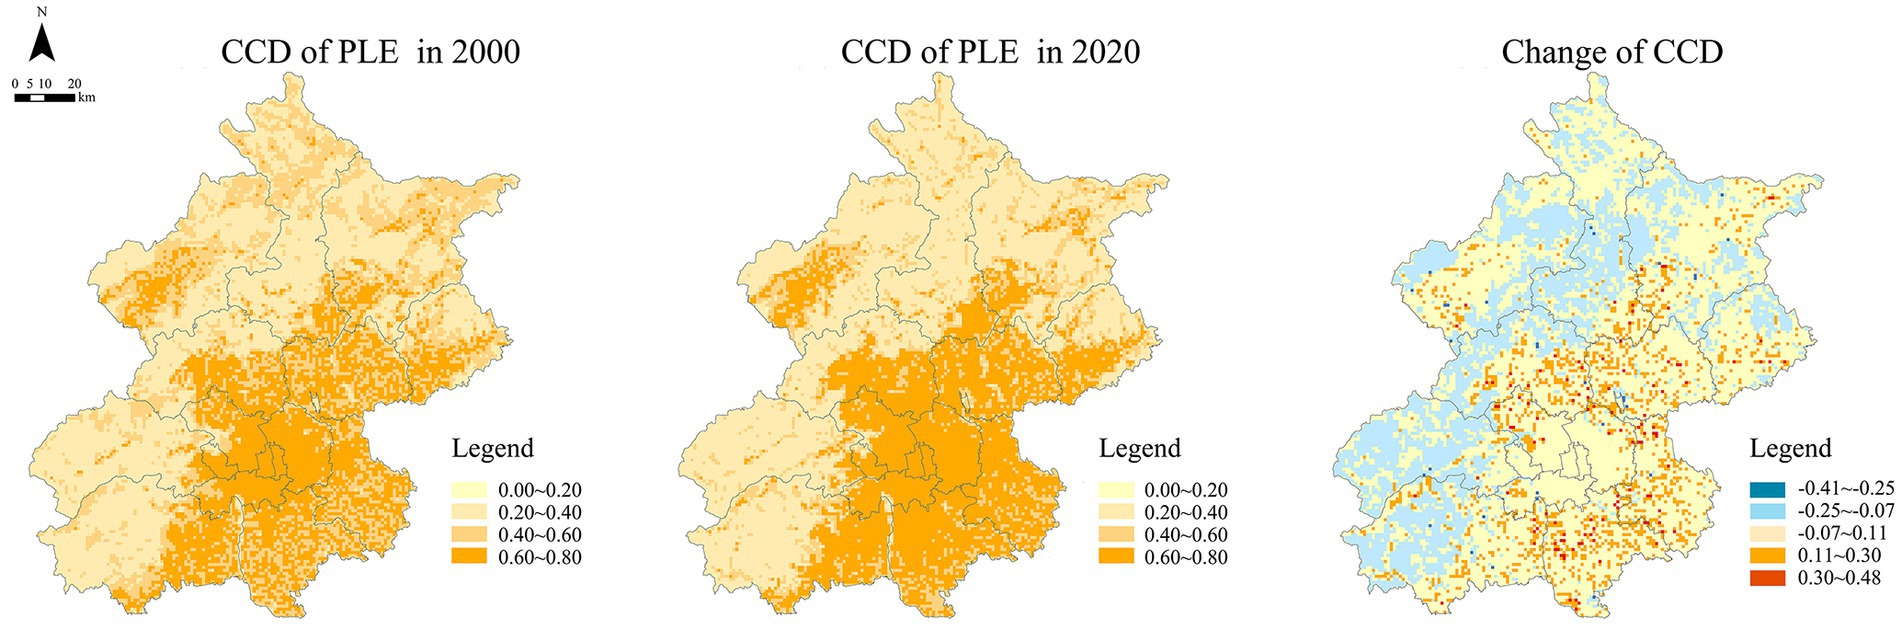
Figure 8. Spatiotemporal patterns of CCD during 2000–2020.
Table 4 shows the global autocorrelation analysis on the CCD of PLEFs in Beijing in 2000 and 2020. Moran’s I statistics were significantly positive, indicating that the CCD in Beijing was spatially interrelated. Accordingly, we constructed the GWR model to determine socioeconomic and natural factors affected CCD in Beijing.
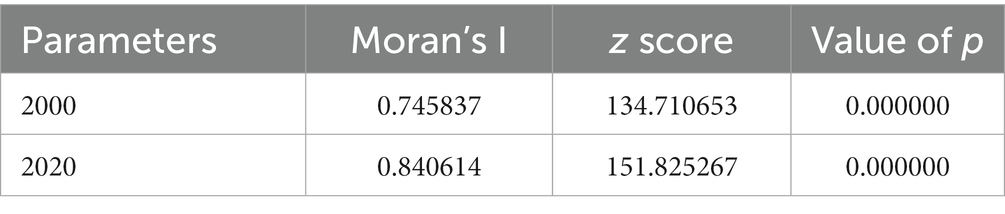
Table 4. The results of spatial autocorrelation model.
Table 5 demonstrates that all the factors passed the significance test with a value of p of 0, and the VIF values of population, GDP, altitude, and slope were under 7.5, which could be chosen for independent variables.
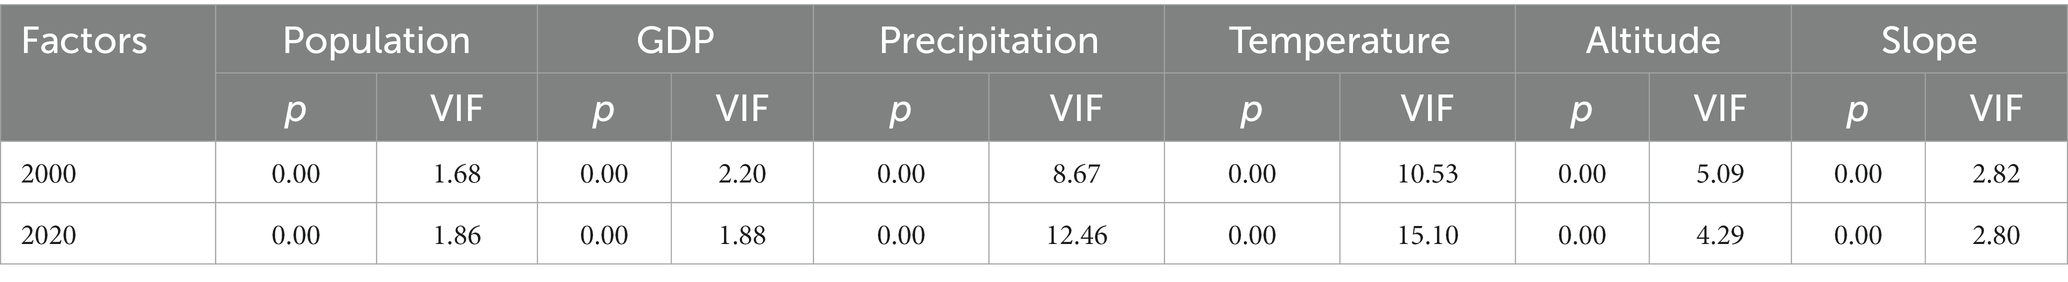
Table 5. The results of value of p and VIF of diagnoses.
The GWR model detected the spatial differences in the factors’ impacts on the CCD of PLEFs in Beijing. The proportions of positive and negative regression coefficients of factors were calculated to reflect the comprehensive effect of factors (Figure 9), and the regression coefficients of each factor were visualized with ArcGIS 10.8 (Esri, United States; Figure 10).
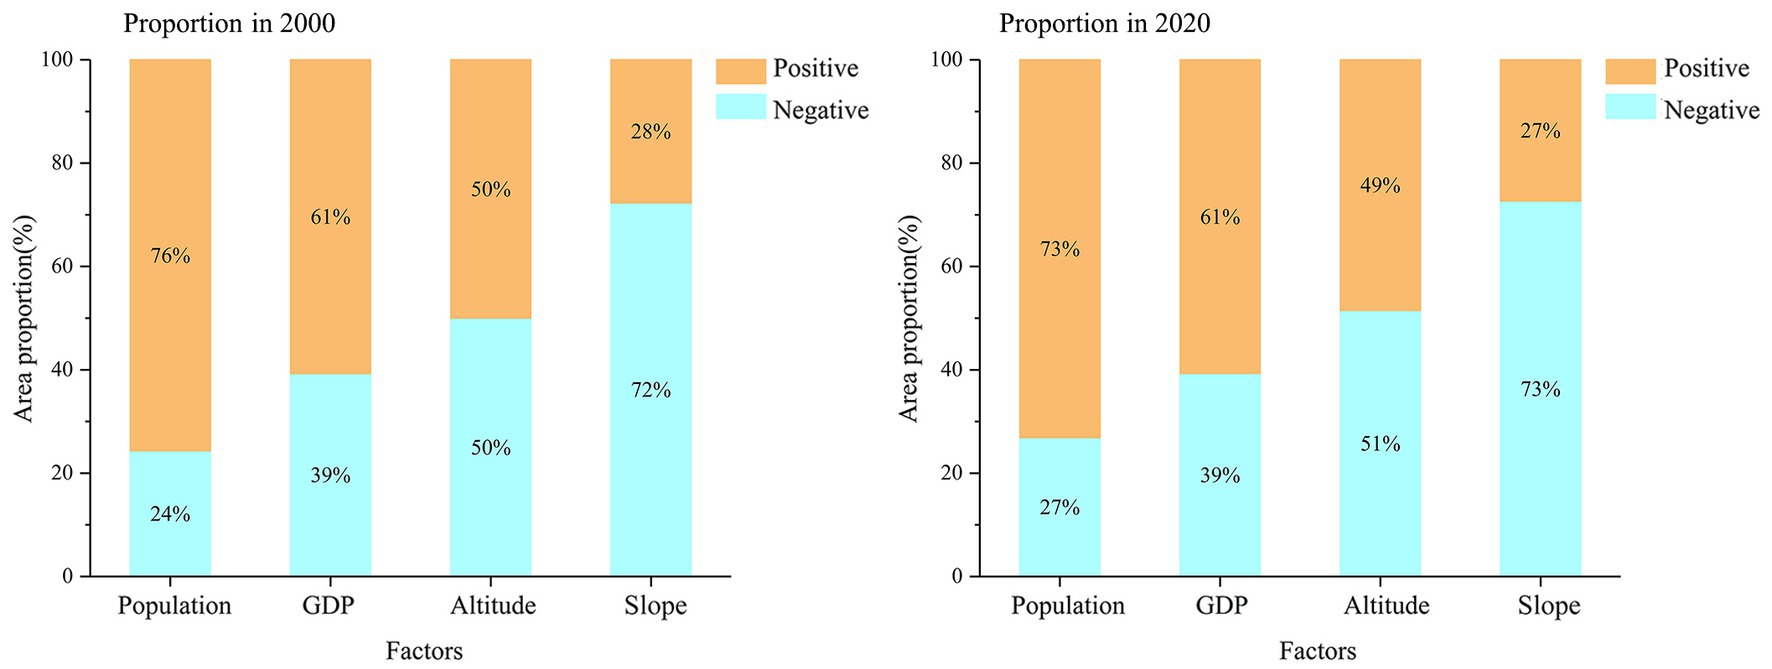
Figure 9. Proportion of positive and negative values of regression coefficients in 2000 and 2020.
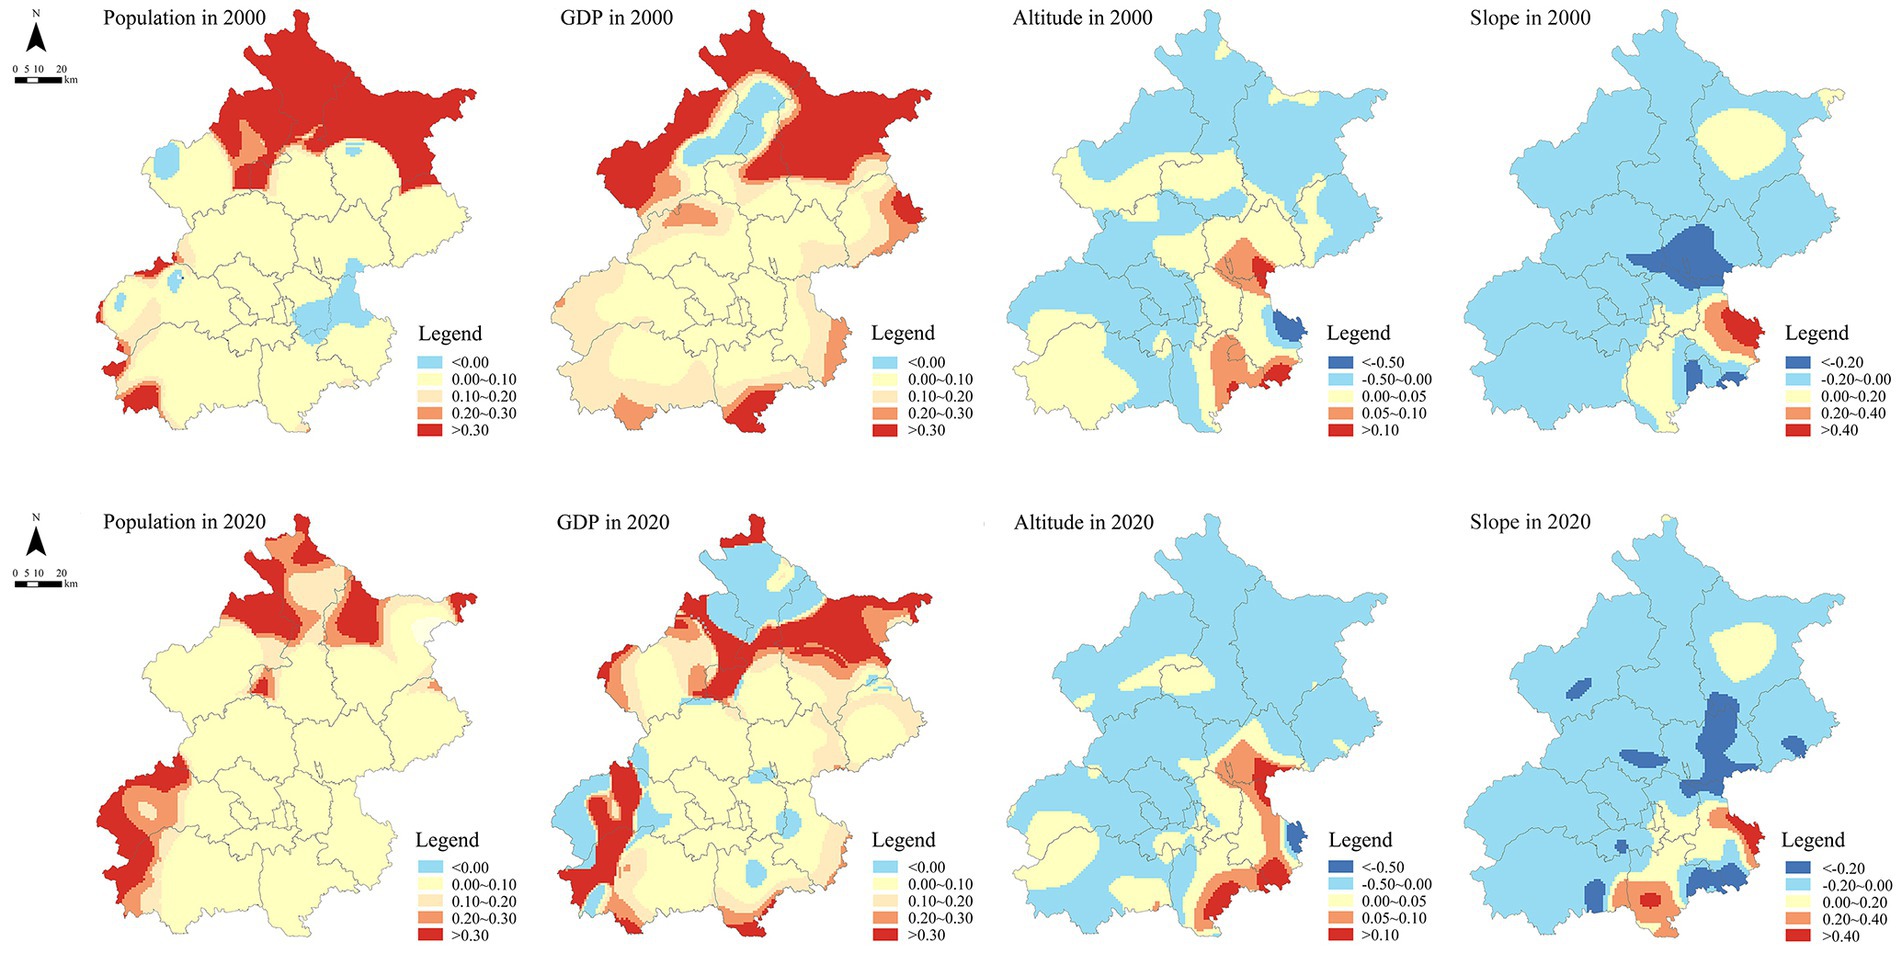
Figure 10. Regression coefficients of influencing factors in 2000 and 2020.
For the population factor, areas with positive values dominated above 95% of the whole in both 2000 and 2020. The absolute advantage of areas with positive values proved that population had a positive impact on CCD in Beijing. However, according to the spatial differentiation, we found that the high-value areas decreased, indicating that the positive effect of population on CCD was weakening. Most high-value areas clustered in the northern and southwestern mountainous areas, whereas the area shrunk in 2020.
Regarding the GDP factor, the positive–negative structure of the regression coefficient had a distinct change in the period. In 2000, the positive–negative structure was 96 and 4%; in 2020, the positive–negative structure was 85 and 15%. The proportion of areas with positive values dominated, which suggested that GDP growth encouraged the improvement of CCD in general. Notwithstanding, the decrease in positive areas hinted that the GDP’s promotion effect on CCD was waning. The areas with positive and negative values crisscrossed in the northern and western mountains making the spatial differentiation of GDP complicated. Overall, the positive effect of GDP was greater than that of the negative impact in the mountainous areas.
Concerning the altitude factor, the areas with positive and negative coefficients were 43 and 57% in 2000, and 29 and 71% in 2020, respectively. In addition, the spatial differentiation demonstrated that the positive-value areas were concentrated in Shunyi, Tongzhou, and Daxing in the southeast, whereas these high-value areas decreased in 2020. The negative value areas were distributed in the north and east mountainous areas and expanded in 2020. The increasing number of negative areas demonstrated that altitude had a broader negative effect on the CCD, further confirming the decline in CCD in the mountainous areas.
Regarding the slope factor, the positive–negative structure was nearly 15 and 85% in 2000 and 14 and 86% in 2020. According to the spatial differentiation, negative-value areas covered most areas except the center of Miyun, Daxing, and southern Tongzhou. The results showed that slope had a steady negative impact on the geographical distribution of the CCD of PLEFs since they were largely consistent with those from 2000.
Due to the adoption of the improved method, the identification of PLEFs in Beijing comprehensively reflected the multifunction of land use and the practical output benefits, which promoted the accuracy of the research results. The changes in PLEFs and CCD were significantly varied in time and space. In general, the decrease in PF and EF and the increase in LF led to a reduction in CCD, and the spatial distribution showed a different trend between the plain and mountainous areas (Figures 4–8). This phenomenon also exists in other metropolitan areas (Zhou et al., 2017; Yu et al., 2020; Zhu C. et al., 2021). The difference may come from the terrain, which shows that the terrain had a critical impact on land use (Li et al., 2021). Since the plain areas are flat and suitable for construction activities, they attract PF and LF to gather intensively (Qiang and Hu, 2022). However, due to the distance from the city center and the terrain restrictions, human development and construction activities are limited in the mountainous areas, resulting in a high EF and low PF and LF (Wang A. et al., 2022). Furthermore, the heterogeneity of PLEFs also led to a higher CCD in the plain areas than in the mountainous areas (Figures 5, 8). Therefore, to improve CCD in different terrain areas, promoting EF in the plain areas and enhancing PL and LF in the mountainous areas would be more critical.
In addition, the GWR analysis results further supported the above statements. Population and GDP growth strongly impacted the CCD of the northern and western mountain areas, indicating that these two factors benefitted the coordinated development of PLEFs in the mountainous area (Figures 9, 10). These results may be connected to low-density human activities in mountainous areas. PF and EF originate from human activities, and where human activities are intensive, the PF and LF are also remarkable (Luo et al., 2018; Wu et al., 2021). However, Beijing’s mountainous areas were essential as ecological barriers, restraining the ability to flourish economically there (Figure 5). As a result, people relocated from mountainous areas to plain areas in search of better lives and employment, which caused the PF in the mountainous areas to decline. In contrast, given that the population in the plain areas was already relatively dense, an increase in population would not significantly increase the CCD but rather exacerbate urban problems (Figure 10). Therefore, it is unwise to indiscriminately recruit the population in the whole of Beijing to improve the CCD, which is only effective in the northern and western mountain areas (Figure 10). Meanwhile, developing industries appropriate for the resource endowment of mountainous areas in accordance with local conditions is also crucial for improving CCD based on safeguarding the ecological function. In addition, the negative effects of altitude and slope factors further proved the above assertion about the influence of terrain on PLEFs and CCD differentiation (Figures 8, 10).
Furthermore, by comparing the changing trend of PLEFs and CCD in Beijing, it could be found that PF negatively impacted CCD in the plain areas, and the EF showed a negative relationship with CCD in the mountainous areas (Figures 5, 8). Interestingly, according to the CCD calculation formula, PF, LF, and EF should be positively correlated with CCD. This deviation may result from the trade-offs between the PLEFs (Carreno et al., 2012; Turner et al., 2014; Fu et al., 2022), which dovetailed with the research results in the Yellow River Basin, the Yangtze River Delta, and Denmark. In other words, due to limited resources, inappropriate promotion of one function will lead to the decline of other functions, and bring counterproductive effects on CCD. Therefore, we believe the government should take measures carefully to improve functions according to local conditions and reduce the conflict among them, maximizing the positive impact on CCD and reducing the damage to other functions.
The change in PLEFs resulted from land use change driven by policies. Beijing has put several measures that have a significant impact on the PLEFs, such as the “Relieve Noncapital Functions” and “Plain Afforestation.” The implementation of these projects has increased the area of forestland and decreased the construction land (Feng et al., 2022). It has also changed the structure of the PLEFs, offering a way to enhance the CCD. Therefore, policies can be developed in accordance with regional circumstances to promote the optimal development of PLEFs.
The spatiotemporal variation in PLEFs and CCD in Beijing showed the essential impact of changes in disadvantaged functions driven by policies (Liu et al., 2020). The research results showed that the CCD obviously increased in the plain areas, where “Plain Afforestation” was implemented. Compared with PF and LF, EF was much less functional in the plain areas (Figure 5). However, “Plain Afforestation” significantly improved the EF from 2015 to 2020, and the CCD also improved accordingly in the plain areas (Figures 4, 8). Therefore, adopting ecological projects and protection measures could enhance the CCD of PLEFs in plain areas. However, the EF could not exert dramatic effects to improve the CCD in the mountainous areas, where the EF was generally high (Figures 5, 8). Due to the small population and underdeveloped industries, the low PF and LF restricted the improvement of the CCD (Figures 5, 10). This finding was in line with the high positive coefficients of socioeconomic factors and low negative coefficients of natural factors in the northwest mountainous area (Figures 9, 10). Therefore, it should be considered to enhance the CCD in mountainous areas by initiating policies to attract the population and encourage the environmentally friendly high-quality industry.
Here, we suggest that the top priority for future policy-making is implementing differentiation strategies to improve PLEFs and CCD according to local conditions in Beijing. Ecological restoration and environmental protection policies should continue to be implemented in the plain areas. Meanwhile, The CCD would be optimized in mountainous areas through population attraction and industrial upgrading.
Coordinating PLEFs has become a vital issue for resolving the conflict between humans and nature and realizing the sustainable development of the environment. Quantitative analysis of the coupling coordination of PLEFs and the influencing factors will benefit the optimization of land use patterns. This study proposed an improved PLEFs identification method based on multifunctional land use and output benefits index system to analyze the PLEFs of Beijing from 2000 to 2020 at a grid scale, which promoted the accuracy and reliability of the research results. The CCDM was used to estimate the coupling and coordination of PLEFs first. The results showed that the high CCD areas gathered in the plain areas and EF had a noticeable positive impact on CCD, since EF was fragile there. Additionally, the low CCD areas were mainly distributed in the mountainous areas, and PF and LF had a higher positive effect on CCD as they were less developed there. Therefore, to improve CCD effectively, promoting EF in the plain areas and enhancing PL and LF in the mountainous areas would be more critical. In addition, the promotion of functions should be careful to avoid damage to other functions caused by the trade-offs among PLEFs, which would be counterproductive to the CCD.
Then, the geographically weighted regression model (GWR) was used to detect the correlation between CCD and socioeconomic and natural factors. The correlation showed that population and GDP factors had positive effects to varying degrees in most areas, and altitude and slope had negative effects except for a few areas in the southeast. In addition, population and GDP had high positive effects in the northwest mountainous area, consistent with the positive impact of PF and LF on CCD in the mountainous areas. Therefore, it is unwise to promote CCD by blindly increasing the population density and GDP for all of Beijing, which is just effective in the northern and western mountainous areas. To sum up, it is critical to formulate regional differentiation strategies for improving CCD in Beijing, such as implementing ecological construction and protection policies in plain areas and industrial structure optimization, industrial efficiency improvement, and population transfer development strategies in mountainous areas.
The original contributions presented in the study are included in the article/supplementary material, further inquiries can be directed to the corresponding authors.
WW and JZ contributed to the conception and design of the study. WW organized the database, performed the statistical analysis, and wrote the original draft. JZ was responsible for the administration and supervision of the project. Both authors contributed to the article and approved the submitted version.
This research was funded by the Science & Technology Program of Hebei, grant number 20556104D and Construction Plan of New-type Urbanization Demonstration Plot in Beijing City Sub-center (Tongzhou District) during the “Fourteenth Five Year Plan.”
We are grateful to the experts, editors, and reviewers for their valuable comments and suggestion in improving this manuscript.
The authors declare that the research was conducted in the absence of any commercial or financial relationships that could be construed as a potential conflict of interest.
All claims expressed in this article are solely those of the authors and do not necessarily represent those of their affiliated organizations, or those of the publisher, the editors and the reviewers. Any product that may be evaluated in this article, or claim that may be made by its manufacturer, is not guaranteed or endorsed by the publisher.
Andersen, P. S., Vejre, H., Dalgaard, T., and Brandt, J. (2013). An indicator-based method for quantifying farm multifunctionality. Ecol. Indic. 25, 166–179. doi: 10.1016/j.ecolind.2012.09.025
Bach, P. M., Staalesen, S., Mccarthy, D. T., and Deletic, A. (2015). Revisiting land use classification and spatial aggregation for modelling integrated urban water systems. Landsc. Urban Plan. 143, 43–55. doi: 10.1016/j.landurbplan.2015.05.012
Boone, R. B., Conant, R. T., Sircely, J., Thornton, P. K., and Herrero, M. (2018). Climate change impacts on selected global rangeland ecosystem services. Glob. Chang. Biol. 24, 1382–1393. doi: 10.1111/gcb.13995
Cai, L., Wang, H., Liu, Y., Fan, D., and Li, X. (2022). Is potential cultivated land expanding or shrinking in the dryland of China? Spatiotemporal evaluation based on remote sensing and SVM. Land Use Policy 112:105871. doi: 10.1016/j.landusepol.2021.105871
Carreno, L., Frank, F. C., and Viglizzo, E. F. (2012). Tradeoffs between economic and ecosystem services in Argentina during 50 years of land-use change. Agric. Ecosyst. Environ. 154, 68–77. doi: 10.1016/j.agee.2011.05.019
Casolani, N., Cartone, A., Postiglione, P., and Liberatore, L. (2020). Climate variability in agriculture and crop water requirement: spatial analysis of Italian provinces. J. Clean. Prod. 262:121331. doi: 10.1016/j.jclepro.2020.121331
Cui, J., Gu, J., Sun, J., and Luo, J. (2018). The spatial pattern and evolution characteristics of the production, living and ecological space in Hubei Provence. China Land Sci. 32, 67–73. doi: 10.11994/zgtdkx.20180723.121720
Deng, Y., and Yang, R. (2021). Influence mechanism of production-living-ecological space changes in the urbanization process of Guangdong Province, China. Landscape 10:1357. doi: 10.3390/land10121357
Duan, Y., Wang, H., Huang, A., Xu, Y., Lu, L., and Ji, Z. (2021). Identification and spatial-temporal evolution of rural “production-living-ecological” space from the perspective of villagers’ behavior – a case study of Ertai town, Zhangjiakou City. Land Use Policy 106:105457. doi: 10.1016/j.landusepol.2021.105457
Fan, Y., Gan, L., Hong, C., Jessup, L. H., Jin, X., Pijanowski, B. C., et al. (2021). Spatial identification and determinants of trade-offs among multiple land use functions in Jiangsu Province, China. Sci. Total Environ. 772:145022. doi: 10.1016/j.scitotenv.2021.145022
Feng, C., Zhang, H., Xiao, L., and Guo, Y. (2022). Land use change and its driving factors in the rural& ndash; urban fringe of Beijing: a production& ndash; living& ndash; ecological perspective. Landscape 11:314. doi: 10.3390/land11020314
Fu, W., and Chu, L. (2020). Research on the evaluation of high quality development of manufacturing industry from the perspective of integration of the Yangtze River Delta—TOPSIS evaluation model based on improved CRITICAL-entropy weight method. J. Indus. Technol. Econ. 39, 142–152. doi: 10.3969/j.issn.1004-910X.2020.09.018
Fu, J., Bu, Z., Jiang, D., Lin, G., and Li, X. (2022). Sustainable land use diagnosis based on the perspective of production–living–ecological spaces in China. Land Use Policy 122:106386. doi: 10.1016/j.landusepol.2022.106386
Fu, C., Tu, X., and Huang, A. (2021). Identification and characterization of production-living-ecological space in a central urban area based on POI data: a case study for Wuhan, China. Sustainability 13:7691. doi: 10.3390/su13147691
He, J. Q., Wang, S. J., Liu, Y. Y., Ma, H. T., and Liu, Q. Q. (2017). Examining the relationship between urbanization and the eco-environment using a coupling analysis: case study of Shanghai, China. Ecol. Indic. 77, 185–193. doi: 10.1016/j.ecolind.2017.01.017
Hu, T., Li, X., Gong, P., Yu, W., and Huang, X. (2020). Evaluating the effect of plain afforestation project and future spatial suitability in Beijing. Sci. Chin. Earth Sci. 63, 1587–1598. doi: 10.1007/s11430-019-9636-0
Hu, W., Wang, L., and Shu, M. (2016). Reflections on delimiting the three basic spaces in the compilation of urban and rural plan. City Plan. Rev. 40, 21–26. doi: 10.11819/cpr20160504a
Ji, Z., Liu, C., and Xu, Y. (2020). Identification and optimal regulation of the production-living-ecological space based on quantitative land use functions. Trans. Chin. Soc. Agric. Eng. 36, 222–231. doi: 10.11975/j.issn.1002-6819.2020.18.027
Jin, J., Sheppard, S. R. J., Jia, B., and Wang, C. (2021). Planning to practice: impacts of large-scale and rapid urban afforestation on greenspace patterns in the Beijing plain area. Forests 12:316. doi: 10.3390/f12030316
Kong, D., Chen, H., and Wu, K. (2021). The evolution of "production-living-ecological" space, eco-environmental effects and its influencing factors in China. J. Nat. Resour. 36, 1116–1135. doi: 10.31497/zrzyxb.20210503
Li, T. K., Liu, Y., Wang, C. R., Olsson, G., Wang, Z. S., and Wang, H. (2019). Decentralization of the non-capital functions of Beijing: industrial relocation and its environmental effects. J. Clean. Prod. 224, 545–556. doi: 10.1016/j.jclepro.2019.03.247
Li, J., Sun, W., Li, M., and Linlin, M. (2021). Coupling coordination degree of production, living and ecological spaces and its influencing factors in the Yellow River Basin. J. Clean. Prod. 298:126803. doi: 10.1016/j.jclepro.2021.126803
Li, C. X., Wu, K. N., and Wu, J. Y. (2018). Urban land use change and its socio-economic driving forces in China: a case study in Beijing, Tianjin and Hebei region. Environ. Dev. Sustain. 20, 1405–1419. doi: 10.1007/s10668-017-9928-6
Liu, Y., Geng, W., Shao, J., Zhou, Z., and Zhang, P. (2021). Land use change and ecosystem service nValue response from the perspective of “ecological-production-living spaces”: a case study of the lower Yellow River. Areal Res. Dev. 40, 1382–1392. doi: 10.3969/j.issn.1003-2363.2021.04.023
Liu, J., Liu, Y., and Li, Y. (2017). Classification evaluation and spatial-temporal analysis of "production-living-ecological" spaces in China. J. Geogr. Sci. 2017:7. doi: 10.11821/dlxb201707013
Liu, H., Liu, J., Yang, W., Chen, J., and Zhu, M. (2020). Analysis and prediction of land use in Beijing-Tianjin-Hebei region: a study based on the improved convolutional neural network model. Sustain. For. 12:3002. doi: 10.3390/su12073002
Liu, X. M., and Nie, W. D. (2022). Study on the coupling coordination mechanism of green technology innovation, environmental regulation, and green finance. Environ. Sci. Pollut. Res. 29, 71796–71809. doi: 10.1007/s11356-022-20905-8
Liu, C., Xu, Y., Huang, A., Liu, Y., Wang, H., Lu, L., et al. (2018). Spatial identification of land use multifunctionality at grid scale in farming-pastoral area: a case study of Zhangjiakou City, China. Habitat Int. 76, 48–61. doi: 10.1016/j.habitatint.2018.05.010
Liu, R., Zhao, H., Yang, C., and Yang, H. (2022). Feature recognition of urban industrial land renewal based on POI and RS data: the case of Beijing. Front. Environ. Sci. 10:890571. doi: 10.3389/fenvs.2022.890571
Lu, S.-S., Liu, Y.-S., Long, H.-L., and Guan, X.-H. (2013). Agricultural production structure optimization: a case study of major grain producing areas, China. J. Integr. Agric. 12, 184–197. doi: 10.1016/S2095-3119(13)60218-X
Luo, J., Zhang, X., Wu, Y., Shen, J., Shen, L., and Xing, X. (2018). Urban land expansion and the floating population in China: for production or for living? Cities 74, 219–228. doi: 10.1016/j.cities.2017.12.007
Ma, S., Huang, H., Cai, Y., and Nian, P. (2014). Theoretical framework with regard to comprehensive sub-areas of China's land spaces based on the functional optimization of production, life and ecology. Nat. Res. Econ. Chin. 321, 31–34.
Ma, S., Kumakoshi, Y., Koizumi, H., and Yoshimura, Y. (2022). Determining the association of the built environment and socioeconomic attributes with urban shrinking in Yokohama City. Cities 120:103474. doi: 10.1016/j.cities.2021.103474
Moghadam, A. S., Soltani, A., Parolin, B., and Alidadi, M. (2018). Analysing the space-time dynamics of urban structure change using employment density and distribution data. Cities 81, 203–213. doi: 10.1016/j.cities.2018.04.009
Mukul, S. A., and Saha, N. (2017). Conservation benefits of tropical multifunctional land-uses in and around a Forest protected area of Bangladesh. Landscape 6:2. doi: 10.3390/land6010002
Ning, X., Tian, W. J., He, F., Bai, X., Sun, L., and Li, W. J. (2023). Hyper-sausage coverage function neuron model and learning algorithm for image classification. Pattern Recogn. 136:109216. doi: 10.1016/j.patcog.2022.109216
Ning, X., Tian, W. J., Yu, Z. Y., Li, W. J., Bai, X., and Wang, Y. B. (2022). HCFNN: high-order coverage function neural network for image classification. Pattern Recogn. 131:108873. doi: 10.1016/j.patcog.2022.108873
Oukawa, G. Y., Krecl, P., and Targino, A. C. (2022). Fine-scale modeling of the urban heat island: a comparison of multiple linear regression and random forest approaches. Sci. Total Environ. 815. doi: 10.1016/j.scitotenv.2021.152836
Peng, J., Ma, J., Du, Y., Zhang, L., and Hu, X. (2016). Ecological suitability evaluation for mountainous area development based on conceptual model of landscape structure, function, and dynamics. Ecol. Indic. 61, 500–511. doi: 10.1016/j.ecolind.2015.10.002
Pourmohammadi, P., Strager, M. P., Dougherty, M. J., and Adjeroh, D. A. (2021). Analysis of land development drivers using geographically weighted ridge regression. Remote Sens. 13:1307. doi: 10.3390/rs13071307
Qi, Y. Y., Farnoosh, A., Lin, L., and Liu, H. (2022). Coupling coordination analysis of China's provincial water-energy-food nexus. Environ. Sci. Pollut. Res. 29, 23303–23313. doi: 10.1007/s11356-021-17036-x
Qiang, H., and Hu, L. (2022). Population and capital flows in metropolitan Beijing, China: empirical evidence from the past 30 years. Cities 120:103464. doi: 10.1016/j.cities.2021.103464
Shen, Y., De Hoogh, K., Schmitz, O., Clinton, N., Tuxen-Bettman, K., Brandt, J., et al. (2022). Europe-wide air pollution modeling from 2000 to 2019 using geographically weighted regression. Environ. Int. 168:107485. doi: 10.1016/j.envint.2022.107485
Song, W., and Deng, X. (2017). Land-use/land-cover change and ecosystem service provision in China. Sci. Total Environ. 576, 705–719. doi: 10.1016/j.scitotenv.2016.07.078
Steinhäußer, R. S. R., Steinführer, A., and Hellmich, M. (2015). National and regional land-use conflicts in Germany from the perspective of stakeholders. Land Use Policy 49, 183–194. doi: 10.1016/j.landusepol.2015.08.009
Tavora, G. S. G., and Turetta, A. P. D. (2016). An approach to map landscape functions in Atlantic Forest-Brazil. Ecol. Indic. 71, 557–566. doi: 10.1016/j.ecolind.2016.07.005
Tran, D. X., Pearson, D., Palmer, A., Lowry, J., Gray, D., and Dominati, E. J. (2022). Quantifying spatial non-stationarity in the relationship between landscape structure and the provision of ecosystem services: an example in the New Zealand hill country. Sci. Total Environ. 808:152126. doi: 10.1016/j.scitotenv.2021.152126
Turner, K. G., Odgaard, M. V., Bocher, P. K., Dalgaard, T., and Svenning, J.-C. (2014). Bundling ecosystem services in Denmark: Trade-offs and synergies in a cultural landscape. Landscape and Urban Planning 125:89–104. doi: 10.1016/j.landurbplan.2014.02.007
Verburg, P. H., Van De Steeg, J., Veldkamp, A., and Willemen, L. (2009). From land cover change to land function dynamics: a major challenge to improve land characterization. J. Environ. Manag. 90, 1327–1335. doi: 10.1016/j.jenvman.2008.08.005
Verstegen, J. A., Karssenberg, D., Van Der Hilst, F., and Faaij, A. P. C. (2016). Detecting systemic change in a land use system by Bayesian data assimilation. Environ. Model. Softw. 75, 424–438. doi: 10.1016/j.envsoft.2015.02.013
Wang, Y., Feng, Z., and Ma, W. (2022). Analysis of tree species suitability for plantation forests in Beijing (China) using an optimal random Forest algorithm. Forests 13:820. doi: 10.3390/f13060820
Wang, A., Liao, X., Tong, Z., Du, W., Zhang, J., Liu, X., et al. (2022). Spatial-temporal dynamic evaluation of the ecosystem service value from the perspective of “production-living-ecological” spaces: a case study in Dongliao River basin, China. J. Clean. Prod. 333:130218. doi: 10.1016/j.jclepro.2021.130218
Wei, Y. D., and Ye, X. Y. (2014). Urbanization, urban land expansion and environmental change in China. Stoch. Env. Res. Risk A. 28, 757–765. doi: 10.1007/s00477-013-0840-9
Wei, L., Zhang, Y., Wang, L., Mi, X., Wu, X., and Cheng, Z. (2021). Spatiotemporal evolution patterns of “production-living-ecological” spaces and the coordination level and optimization of the functions in Jilin Province. Sustain. For. 13:13192. doi: 10.3390/su132313192
Wiggering, H., Dalchow, C., Glemnitz, M., Helming, K., Muller, K., Schultz, A., et al. (2006). Indicators for multifunctional land use - linking socio-economic requirements with landscape potentials. Ecol. Indic. 6, 238–249. doi: 10.1016/j.ecolind.2005.08.014
Wiggering, H., and Steinhardt, U. (2015). A conceptual model for site-specific agricultural land-use. Ecol. Model. 295, 42–46. doi: 10.1016/j.ecolmodel.2014.08.011
Wu, R., Li, Z., and Wang, S. (2021). The varying driving forces of urban land expansion in China: insights from a spatial-temporal analysis. Sci. Total Environ. 766:142591. doi: 10.1016/j.scitotenv.2020.142591
Xie, X., Li, X., Fan, H., and He, W. (2021). Spatial analysis of production-living-ecological functions and zoning method under symbiosis theory of Henan, China. Environ. Sci. Pollut. Res. 28:69111. doi: 10.1007/s11356-021-15714-4
Yang, Y., Bao, W., and Liu, Y. (2020). Coupling coordination analysis of rural production-living-ecological space in the Beijing-Tianjin-Hebei region. Ecol. Indic. 117:106512. doi: 10.1016/j.ecolind.2020.106512
Yang, Y., Wang, R., Tan, J., and Calvo-Rolle, J. L. (2021). Coupling coordination and prediction research of tourism industry development and ecological environment in China. Discret. Dyn. Nat. Soc. 2021, 1–15. doi: 10.1155/2021/6647781
Yang, W., and Zhou, S. (2020). Using decision tree analysis to identify the determinants of residents' CO2 emissions from different types of trips: a case study of Guangzhou, China. J. Clean. Prod. 277:124071. doi: 10.1016/j.jclepro.2020.124071
Yao, J. D., Xu, P. P., and Huang, Z. J. (2021). Impact of urbanization on ecological efficiency in China: an empirical analysis based on provincial panel data. Ecol. Indic. 129:107827. doi: 10.1016/j.ecolind.2021.107827
Yin, Z., Liu, Y., and Pan, Y. (2021). Evaluation and classification of rural multifunction at a grid scale: a case study of Miyun District, Beijing. Sustain. For. 13:6362. doi: 10.3390/su13116362
Yu, Z., Xu, E., Zhang, H., and Shang, E. (2020). Spatio-temporal coordination and conflict of production-living-ecology land functions in the Beijing-Tianjin-Hebei region, China. Landscape 9:170. doi: 10.3390/land9050170
Zhang, Y. (2005). Multiple-use forestry vs. forestland-use specialization revisited. Forest Policy Econ. 7, 143–156. doi: 10.1016/S1389-9341(03)00028-5
Zhang, Q., and Li, F. (2022). Correlation between land use spatial and functional transition: a case study of Shaanxi Province, China. Land Use Policy 119:106194. doi: 10.1016/j.landusepol.2022.106194
Zhang, H., Xu, E., and Zhu, H. (2015). An ecological-living-industrial land classification system and its spatial distribution in China. Resour. Sci. 37, 1332–1338. doi: 10.5814/j.issn.1674-764x.2017.02.002
Zhou, D., Xu, J., and Lin, Z. (2017). Conflict or coordination? Assessing land use multi-functionalization using production-living-ecology analysis. Sci. Total Environ. 577, 136–147. doi: 10.1016/j.scitotenv.2016.10.143
Zhu, C., Dong, B., Li, S., Lin, Y., Shahtahmassebi, A., You, S., et al. (2021). Identifying the trade-offs and synergies among land use functions and their influencing factors from a geospatial perspective: a case study in Hangzhou, China. J. Clean. Prod. 314:128026. doi: 10.1016/j.jclepro.2021.128026
Zhu, Y., Wang, Z., and Zhu, L. (2021). Spatiotemporal effects of renewable energy technology innovation on industrial cleaner production: a geographically temporally weighted analysis. J. Clean. Prod. 312:127783. doi: 10.1016/j.jclepro.2021.127783
Zhu, C., Zhang, X., Wang, K., Yuan, S., Yang, L., and Skitmore, M. (2020a). Urban–rural construction land transition and its coupling relationship with population flow in China's urban agglomeration region. Cities 101:102701. doi: 10.1016/j.cities.2020.102701
Zhu, C., Zhang, X., Zhou, M., He, S., Gan, M., Yang, L., et al. (2020b). Impacts of urbanization and landscape pattern on habitat quality using OLS and GWR models in Hangzhou, China. Ecol. Indic. 117:106654. doi: 10.1016/j.ecolind.2020.106654
Keywords: production-living-ecological functions, coupling coordination degree, influencing factors, geographically weighted regression, Beijing
Citation: Wang W and Zhang J (2023) Measuring the coupling coordination of land use functions and influencing factors: a case study in Beijing. Front. Ecol. Evol. 11:1159152. doi: 10.3389/fevo.2023.1159152
Edited by:
Xin Ning, Chinese Academy of Sciences (CAS), ChinaReviewed by:
Jafar A. Alzubi, Al-Balqa Applied University, JordanCopyright © 2023 Wang and Zhang. This is an open-access article distributed under the terms of the Creative Commons Attribution License (CC BY). The use, distribution or reproduction in other forums is permitted, provided the original author(s) and the copyright owner(s) are credited and that the original publication in this journal is cited, in accordance with accepted academic practice. No use, distribution or reproduction is permitted which does not comply with these terms.
*Correspondence: Wenhui Wang, d2FuZ3doQGVtYWlscy5ianV0LmVkdS5jbg==; Jian Zhang, emhhbmdqaWFuQGJqdXQuZWR1LmNu
Disclaimer: All claims expressed in this article are solely those of the authors and do not necessarily represent those of their affiliated organizations, or those of the publisher, the editors and the reviewers. Any product that may be evaluated in this article or claim that may be made by its manufacturer is not guaranteed or endorsed by the publisher.
Research integrity at Frontiers
Learn more about the work of our research integrity team to safeguard the quality of each article we publish.