 Hanyu Li
 Wenke He
 Tonghang Wang
 Chong Cui
 Jie Zhang
 Xiaohong Chen
95% of researchers rate our articles as excellent or good
Learn more about the work of our research integrity team to safeguard the quality of each article we publish.
Find out more
ORIGINAL RESEARCH article
Front. Ecol. Evol. , 05 April 2023
Sec. Ecophysiology
Volume 11 - 2023 | https://doi.org/10.3389/fevo.2023.1159037
This article is part of the Research Topic Amphibian Adaptation to Extreme Environments View all 5 articles
Sexual size dimorphism (SSD) is widespread among animals and is characterized by differences in body size between sexes. Previous studies suggested SSD might reflect the adaptations of particular sexes to their specific reproductive or ecological roles. The large green cascade frogs (Odorrana graminea) exhibit obvious SSD that females are nearly twice the body size of males. However, the molecular mechanisms underlying SSD of O. graminea are still unknown. In the present study, we first obtained nearly 5 Gb of the transcriptome data through Illumina sequencing, and the de novo transcriptome assembly produced 189,868 unigenes of O. graminea. A total of 774 significantly sex-differentially expressed genes (DEGs) were identified. Of which, 436 DEGs showed significantly higher expression levels in females than those in males, whereas 338 DEGs showed significantly lower expression in females than those in males. We also found 10 sex-differentially expressed genes related to energy metabolism between sexes of O. graminea, and these DEGs were related to the estrogen signaling pathway, oxidative phosphorylation, fatty acid biosynthesis, gastric acid secretion, and nitrogen metabolism. We found that the differences in energy metabolism and steroid hormone synthesis might be the main driving force leading to the sexual growth dimorphism of O. graminea. In addition, a total of 63,269 potential EST-SSR loci and 4,669 EST-SSR loci were detected and validated in different populations of O. graminea and other species within Odorrana. The assembled transcriptome will facilitate functional genomic studies of O. graminea and the developed EST-SSR markers will contribute to the population genetics of the species within Odorrana. The sex-differentially expressed genes involved in energy metabolism might provide insights into the genetic mechanisms underlying the SSD of O. graminea.
Sexual size dimorphism (SSD), also known as sexual growth dimorphism, is widespread among animals and is characterized by differences in body size and growth rate between female and male individuals (Wang et al., 2018; Chen et al., 2021). The driving force leading to SSD has attracted the interests of evolutionary biologists and ecologists. It is generally thought that SSD was attributed to differential selection of the sexes and reflected the adaptations of particular sexes to their specific reproductive or ecological roles (Kubièka et al., 2017). The growth of the animals is a complex polygenic trait and is regulated by a series of factors, e.g., environment, nutrients, energy metabolism and reproduction activity (Wang et al., 2018). The genetic mechanism of SSD is essential for understanding of the sex-specific adaptive evolution and is still a major challenge due to the complexity of the growth mechanisms and the sexual influences.
Sexual size dimorphism has been described in many amphibian species (Fei et al., 2009). The large green cascade frogs (Odorrana graminea) belong to the family Ranidae and inhabit cold swift boulder-strewn areas and montane streams throughout Southern China and Southeast Asia (Fei et al., 2009; Frost, 2022). Moreover, these frogs have obvious sexual size dimorphism (SSD) that females are nearly twice the body size of males (Fei et al., 2009; Liao et al., 2013; Li et al., 2023), and therefore these frogs are ideal models for using in investigating the mechanisms of SSD. Previous analyses suggested that sex-specific differences in energy allocation to growth might contribute to SSD (Starostová et al., 2013; Luo et al., 2021). Amphibians consumed lots of energy in the process of reproduction for the development of male’s secondary sexual characteristics, courtship calls, egg development, oviposition, etc. (Basto-Riascos et al., 2017; Ethier et al., 2021). The differences in reproductive behavior might lead to the differences in energy acquisition and allocation between sexes during the breeding season (Li, 1988; Reading, 2007). Increasing evidences suggested the important role of the neuronal networks within brain in the regulation of energy metabolism and growth (Aiello and Wheeler, 1995; Magistretti and Allaman, 2015; Wang et al., 2018; Yagound et al., 2022). Thus, investigating brain gene regulation could facilitate our understanding of SSD in O. graminea. However, the brain gene expression profiles between sexes of O. graminea are still unknown.
In addition, the lack of morphologically diagnosable characteristics between O. graminea and its affinities posed a confusing and controversial problem to taxonomists (Chen et al., 2020; Frost, 2022). Three major mtDNA lineages were revealed within the O. graminea sensu stricto, whereas the nuclear data showed a discordant genetic structure (Chen et al., 2020). Simple Sequence Repeat (SSR), also called microsatellite DNA, has been proposed as useful molecular markers for studies of population genetics, phylogeography, and demography due to their high polymorphism (Antoniou et al., 2018; Qiao et al., 2018; Wu et al., 2019). Recent advances in RNA sequencing (RNA-seq) technology provides an excellent strategy for development of SSR markers and a series of the expressed sequence tag-Simple Sequence Repeat (EST-SSR) have been identified in frogs, e.g., Rana omeimontis (Huang et al., 2016), Pelophylax nigromaculatus (Huang et al., 2016), O. margaretae (Qiao et al., 2018), and R. arvalis (Shu et al., 2018).
Here, we sequenced and de novo assembled the brain transcriptomes between sexes of O. graminea with Illumina sequencing. The differential gene expression profiles between sexes of O. graminea were determined and the candidate genes involved in the sexual size dimorphism were identified. In addition, a series of EST-SSR markers were characterized and validated in O. graminea and other species in the genus Odorrana. The assembled transcriptome will facilitate functional genomic studies of O. graminea and the developed EST-SSR markers will contribute to the population genetics of the species within Odorrana. The sex-differentially expressed genes involved in energy metabolism might provide insights into the genetic mechanisms underlying the SSD of O. graminea.
Eight adult individuals (four males and four females) of O. graminea were collected from the Huangshan Mountain, Anhui province (30°08′N, 118°15′E), China in April 2015. They were randomly divided into two male (named M1 and M2) and two female (named F1 and F2) groups for Illumina sequencing. Each male and female group contained two individuals, respectively. Six other individuals (three females and three males) collected from the same location in April 2021 were used for quantitative real-time PCR (qRT-PCR) verification. In addition, 26 individuals of O. graminea from Jingxi, Guangxi province (23°00′N, 106°39′E) and 27 individuals of the other nine species in the genus Odorrana (e.g., O. rotodora, O. chloronota, O. leporipes, O. schmackeri, O. hejiangensis, O. tianmuii, O. tormota, O. chapaensis and O. versabilis) were used to test the polymorphism of EST-SSR markers. The brain and muscle tissues of these frogs were collected after they were immediately killed with 1% aqueous solution of tricaine methanesulfonate (MS-222, Sigma-Aldrich, Darmstadt, Germany). These tissues were frozen in liquid nitrogen for 3 h and then stored at −80°C. The sampling and animal-use protocols of this study were approved by the Institutional Care and Ethics Committee of Henan Normal University, and complies with the ethical guidelines in China and ARRIVE guidelines for reporting in vivo Experiments.
First, according to the manufacturer’s protocol, we extracted total RNA of each sample from whole brains by using TRIzol Reagent (Invitrogen, Carlsbad, CA, USA). Second, we collected the same amount of total RNA from each individual for each group (e.g., F1, F2, M1, and M2), and then used the mixed RNA for library construction and sequencing. The RNA quality and concentration were measured by Agilent Bioanalyzer 2100 (Agilent Technologies, Santa Clara, CA, USA) and Qubit® RNA Assay Kit in Qubit® 2.0 Fluorometer (Life Technologies, Carlsbad, CA, USA). Third, the sequencing libraries were constructed for the RNA samples with an RNA integrity number (RIN) greater than seven using NEBNext® Ultra™ RNA Library Prep Kit for Illumina® (New England Biolabs, Ipswich, MA, USA). Finally, the prepared libraries were sequenced through the Illumina HiSeq™ 2500 platform and the paired-end reads were generated. The library was constructed and sequenced at OE Biotech Co., Ltd., Shanghai, China.
We used FASTQC 0.11.7 software1 to evaluate the raw reads quality. NGS QC Toolkit v2.3.3 software (Patel and Jain, 2012) was used to remove adaptors, reads containing poly-N and low-quality reads. The data filtering conditions were set according to the following requirements: (1) filtered low-quality reads with a quality threshold of 20 and a length threshold of 70%, (2) removed low quality bases from the 3’ end, (3) cut out the sequences containing N with a length threshold of 35 bp. The high-quality clean data was determined by Q30 and GC-content, and then it was used in the subsequent analyses. As no reference genome sequence for O. graminea, the Trinity software2 was used to de novo assemble the total high-quality clean reads from all samples with default parameters (Grabherr et al., 2011). TGICL software (Pertea et al., 2003) was used to remove the redundancy sequences and produced the longest unigenes. We combined all the unigenes from the four groups as the reference sequences for subsequent analyses.
We used BLASTx to align the assembled reference sequences with NCBI NR (non-redundant protein database), Swiss-Prot (manually annotated and reviewed protein sequence database),3 and KOG (eukaryotic Ortholog Groups).4 We submitted the best BLASTx hit of each unigene from the NR database to the Blast2GO (Conesa et al., 2005), and obtained GO (Gene Ontology) terms based on annotations between GO terms and gene names. The KEGG pathway annotation and assignments were performed through KEGG (the Kyoto Encyclopedia of Genes and Genomes) Automatic Annotation Server (KAAS) (Moriya et al., 2007).
We used the false discovery rate (FDR) (Benjamini and Yekutieli, 2005) to estimate the p-value threshold and FPKM (Fragment Per Kilo Bases per Million reads) method (Trapnell et al., 2010) to estimate the gene expression levels. Based on the screening criteria of a fold change greater than two (| log2Fold Change| > 1) and p-value (FDR) less than 0.05, we used DEGseq R package to filter the differentially expressed genes (DEGs) (Anders and Huber, 2012). Further, the hierarchical cluster analysis was performed on DEGs to analyze the gene expression patterns in different groups. In order to elucidate the biological significance of the DEGs and reveal whether those DEGs are related to sexual size dimorphism, the GO and KEGG pathway enrichment analysis of the DEGs were performed. We conducted GO enrichment analysis of the DEGs by using the GOseq R packages according to the Wallenius’ non-central hypergeometric distribution, which could adjust for transcript length bias. The KOBAS software5 was used to test the KEGG pathway enrichment analysis of the DEGs. We identified the significant GO categories and KEGG enrichment pathway based on Fisher’s exact test, and used FDR to correct the p-values (Kanehisa et al., 2008). The threshold of significance was defined by p-value < 0.05.
To confirm the reliability of our transcriptome expression profiles obtained with RNA-seq, we randomly selected five DEGs for qRT-PCR. We firstly used Oligo v7 software to design specific primers (Supplementary Table 1). Then the qRT-PCR was performed on LightCycler96 Real Time system (Roche, Switzerland) in a total volume of 10 μl containing 5 μl TB Green® Premix EX Taq™ II (TaKaRa, Beijing, China). The following cycling parameters were used: 95°C for 30 s, followed by 40 cycles of 95°C for 10 s and 60°C for 30 s. Three biological replicates were performed in females and males, respectively, with the GADPH (glyceraldehydes-3-phosphate dehydrogenase) as the reference for internal standardization. Each sample was detected in triplicate. The relative gene expression levels were calculated using the 2–Δ Δ Ct method and presented as fold changes for the calibrator (Yuan et al., 2006). Besides, we analyzed the significances for qRT-PCR data through the Unpaired Student’s t-test using Graphpad prism v8.0. Finally, visualization of the results was performed with Graphpad prism v8.0.
The MISA software was used to search for the EST-SSR loci with the criteria mononucleotide repeats ≥10, dinucleotide repeats ≥6, and trinucleotide to hexanucleotide repeats ≥5. The interrupted composite EST-SSR loci was also selected. The dinucleotide repeats (e.g., AT/TA and CT/GA) were treated as the same type of repeat motif. The EST-SSR primers were designed by Primer v3 (Untergasser et al., 2012) and synthesized at Sangon Biological Engineering Technology (Shanghai, China). The reverse primers were labeled with a fluorescent dye (FAM, HEX or TAMRA).
Genomic DNA was extracted from muscles using a standard phenol-chloroform extraction protocol followed by ethanol precipitation. The reaction system and cycling parameters of PCR amplification were performed followed Qiao et al. (2015). Each EST-SSR locus was amplified separately. The PCR products were visualized on 2% agarose and then sent to Sangon Biological Engineering Technology (Shanghai, China) for genotyping. The genotyping data was read by GeneMarker® ID v1.95 software. The Hardy-Weinberg equilibrium (HWE), linkage disequilibrium (LD), and population genetic parameters were analyzed by online Genepop v4.2.6 The number of alleles (Na), expected (He) and observed (Ho) heterozygosity, polymorphism information content (PIC) was calculated by Cervus v3.0.7 (Kalinowski et al., 2007). A sequential Bonferroni correction was applied for multiple tests. The null alleles and possible scoring errors were assessed by Micro-Checker v2.2.3 (van Oosterhout et al., 2004).
Our Illumina sequencing produced 73,299,912 raw reads for F1, 69,294,478 raw reads for F2, 68,822,550 raw reads for M1 and 80,015,958 raw reads for M2 (Table 1). After raw data filtering, 282,461,782 clean reads were obtained for all samples. The Q30 values of four samples were all over 90%, showing the high-quality of our sequencing data. The GC-contents were 44.5% in female group and 45.0% in male group, respectively (Table 1). We obtained 189,868 unigenes with 89,061 unigenes ≥500 bp and 34,096 unigenes ≥1,000 bp (Supplementary Table 2). Most of the unigenes were between 300 and 2,000 bp and the detailed length distribution of all unigenes is shown in Supplementary Figure 1. The values of N50 (sequence length of the shortest transcript at 50% of the total genome length), max, min, and average unigene length were 981, 27,452, 301 and 787 bp, respectively. The sequencing results were shown in Table 1. All raw sequence reads data have been deposited in the NCBI Sequence Read Archive (SRA) database under the accession number BioProject: PRJNA931772.
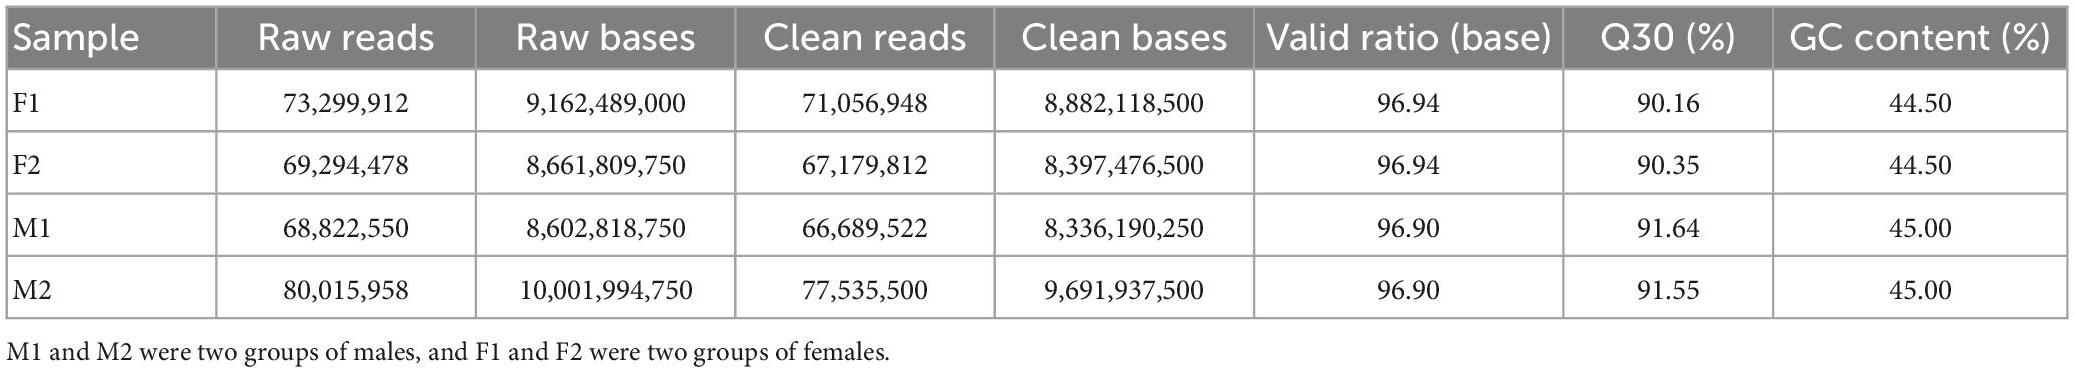
Table 1. Results of quality pretreatment.
After aligned to the five public databases based on a 10–5 e-value cut-off value, a total of 36,865 unigenes were annotated to the NR (19.42% of the total unigenes), 27,820 unigenes to Swiss-Prot (14.65% of the total unigenes), 20,541 unigenes to KOG (10.82% of the total unigenes), 9,252 unigenes to KEGG (4.87% of the total unigenes), and 18,345 unigenes to GO (9.66% of the total unigenes) databases (Table 2). The species distribution of NR BLAST matches was shown in Supplementary Figure 2, and the top three matched species were Xenopus tropicalis (53.26%), X. laevis (10.02%), and Larimichthys crocea (4.07%).
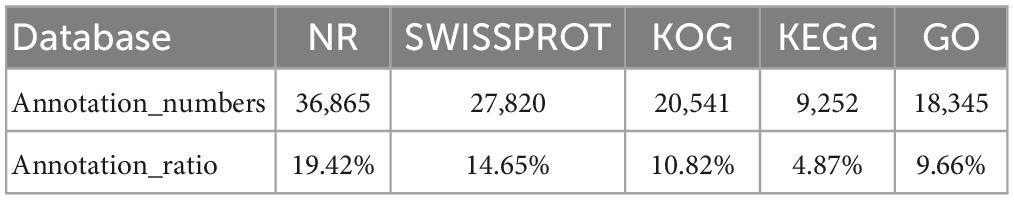
Table 2. The statistical results of annotation proportions of each database.
The KOG annotation analysis showed that 10.82% (20,541 of 189,868) of the annotated unigenes was classified into 25 KOG categories. Among them, the largest group was “General function prediction”, followed by “Signal transduction mechanisms” and “Posttranslational modification, protein turnover, chaperones” (Figure 1). Additionally, 9.66% (18,345 of 189,868) of the unigenes were categorized into 64 subcategories of GO terms under three major categories: Biological Process (BP), Cellular Component (CC), and Molecular Function (MF). The predominant group in each of BP, CC and MF was cellular process (10,644 unigenes, 58.02%), cell (9,395 unigenes, 51.21%), and cell part (9,395 unigenes, 51.21%), and binding (9,951 unigenes, 54.24%), respectively (Figure 2).
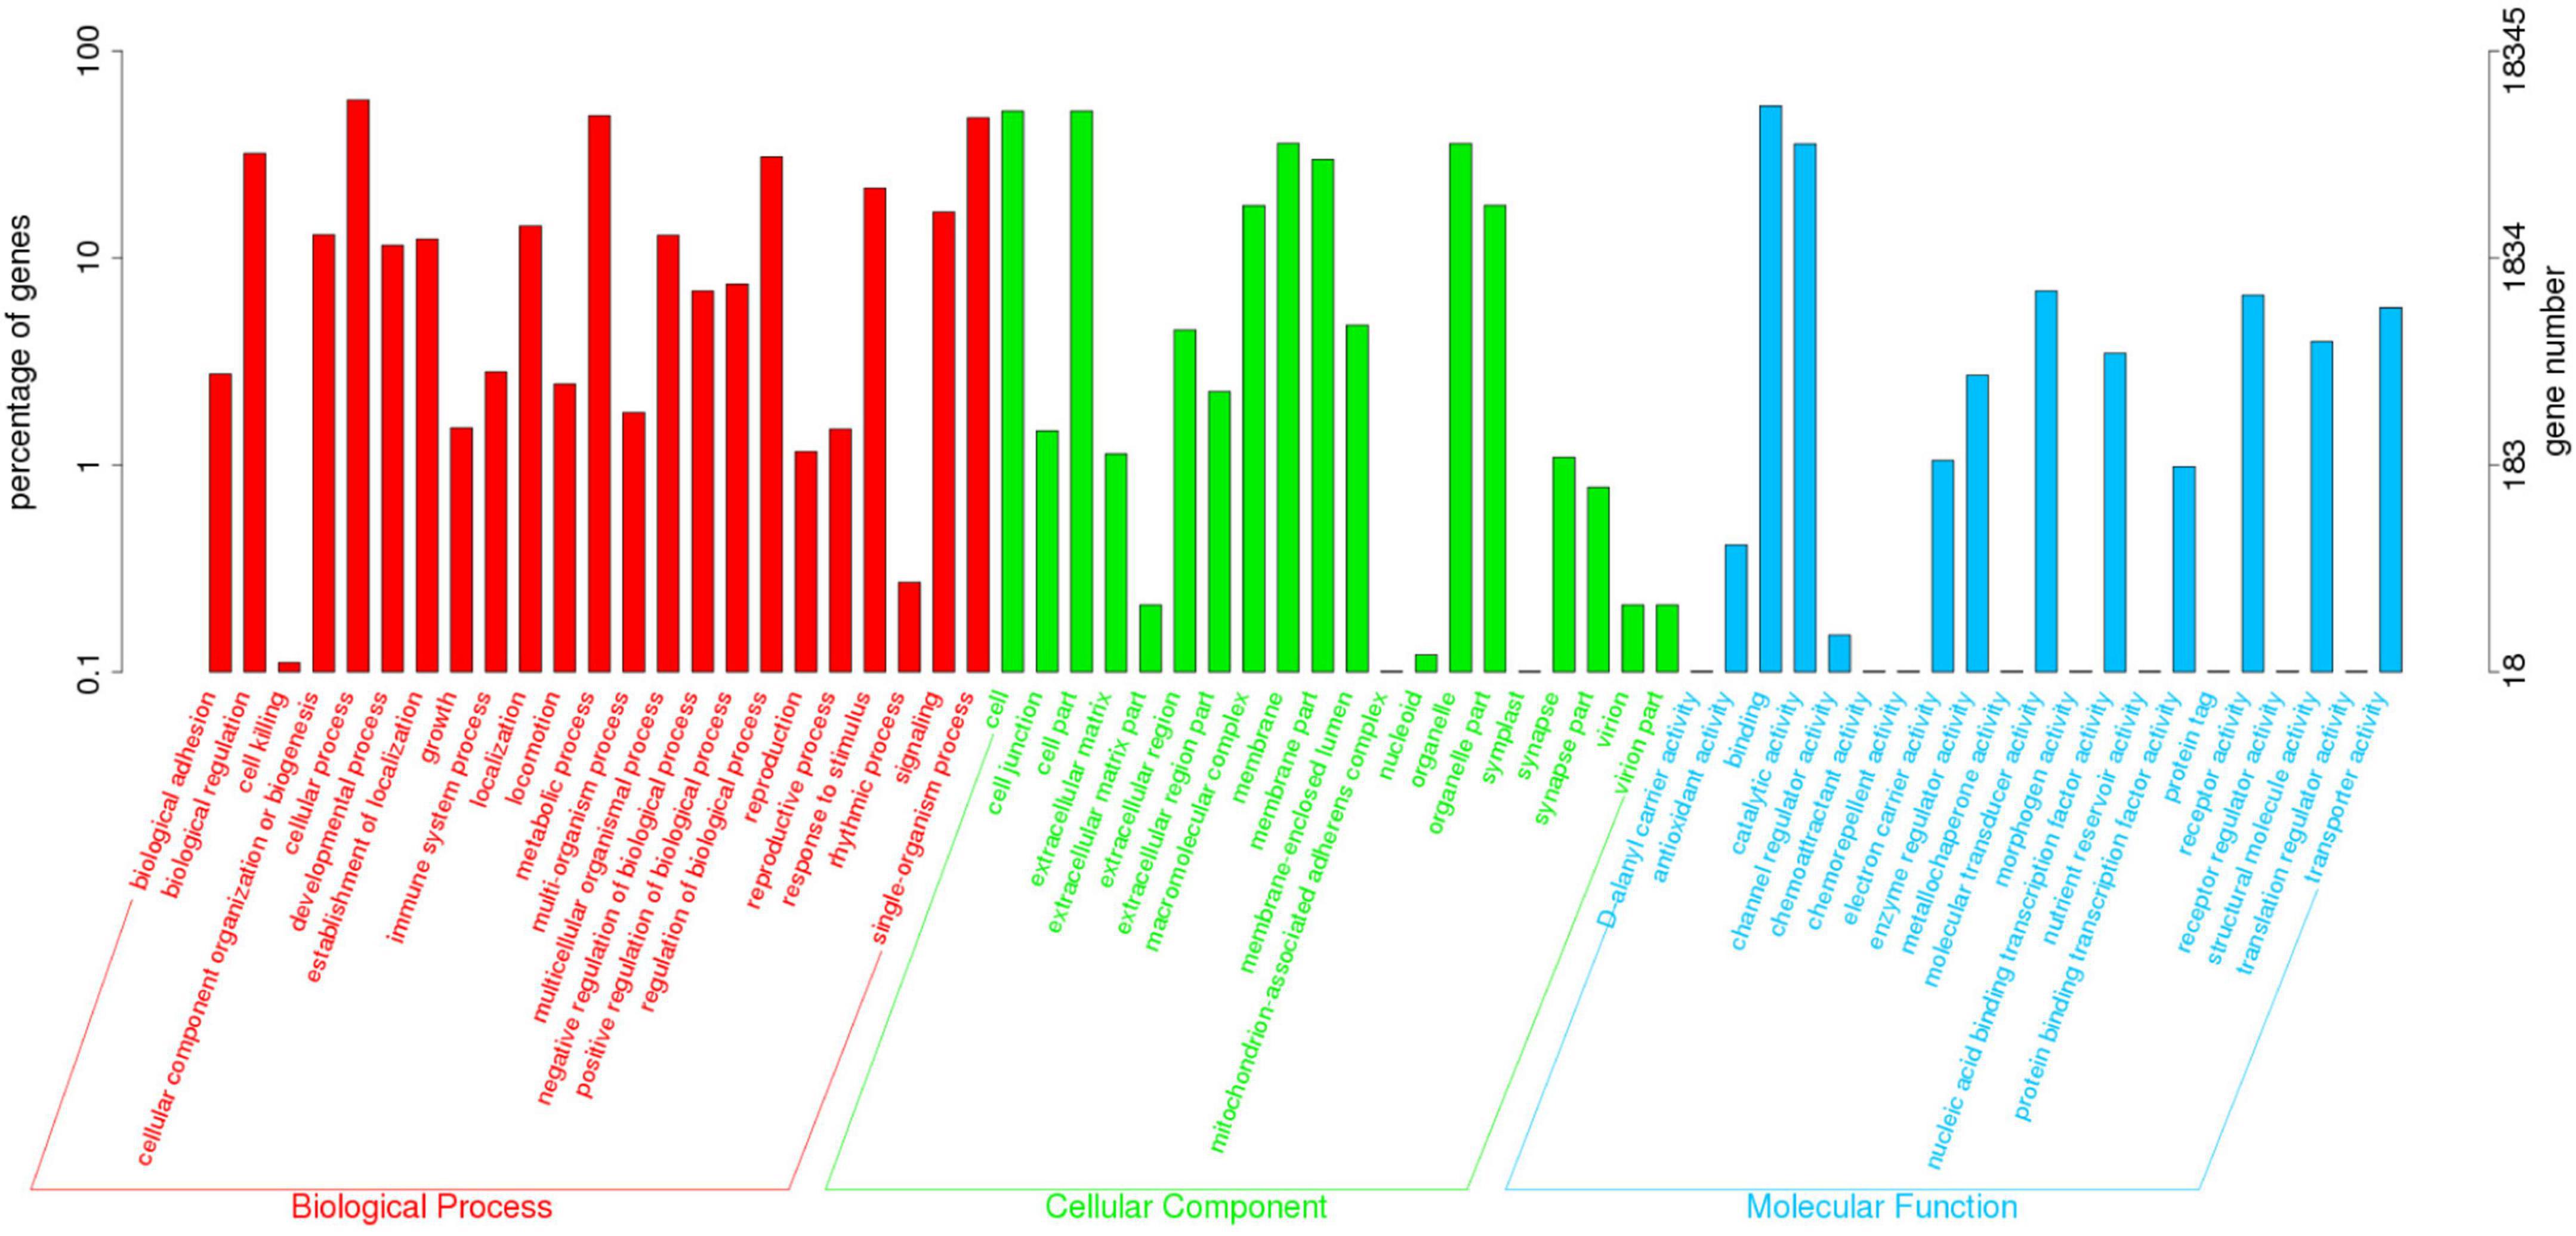
Figure 1. Eukaryotic Ortholog Group (KOG) classification of the Unigenes in O. graminea. Different letters and colors were used to represent different KOG function classes, and the vertical axis represented the number of genes.
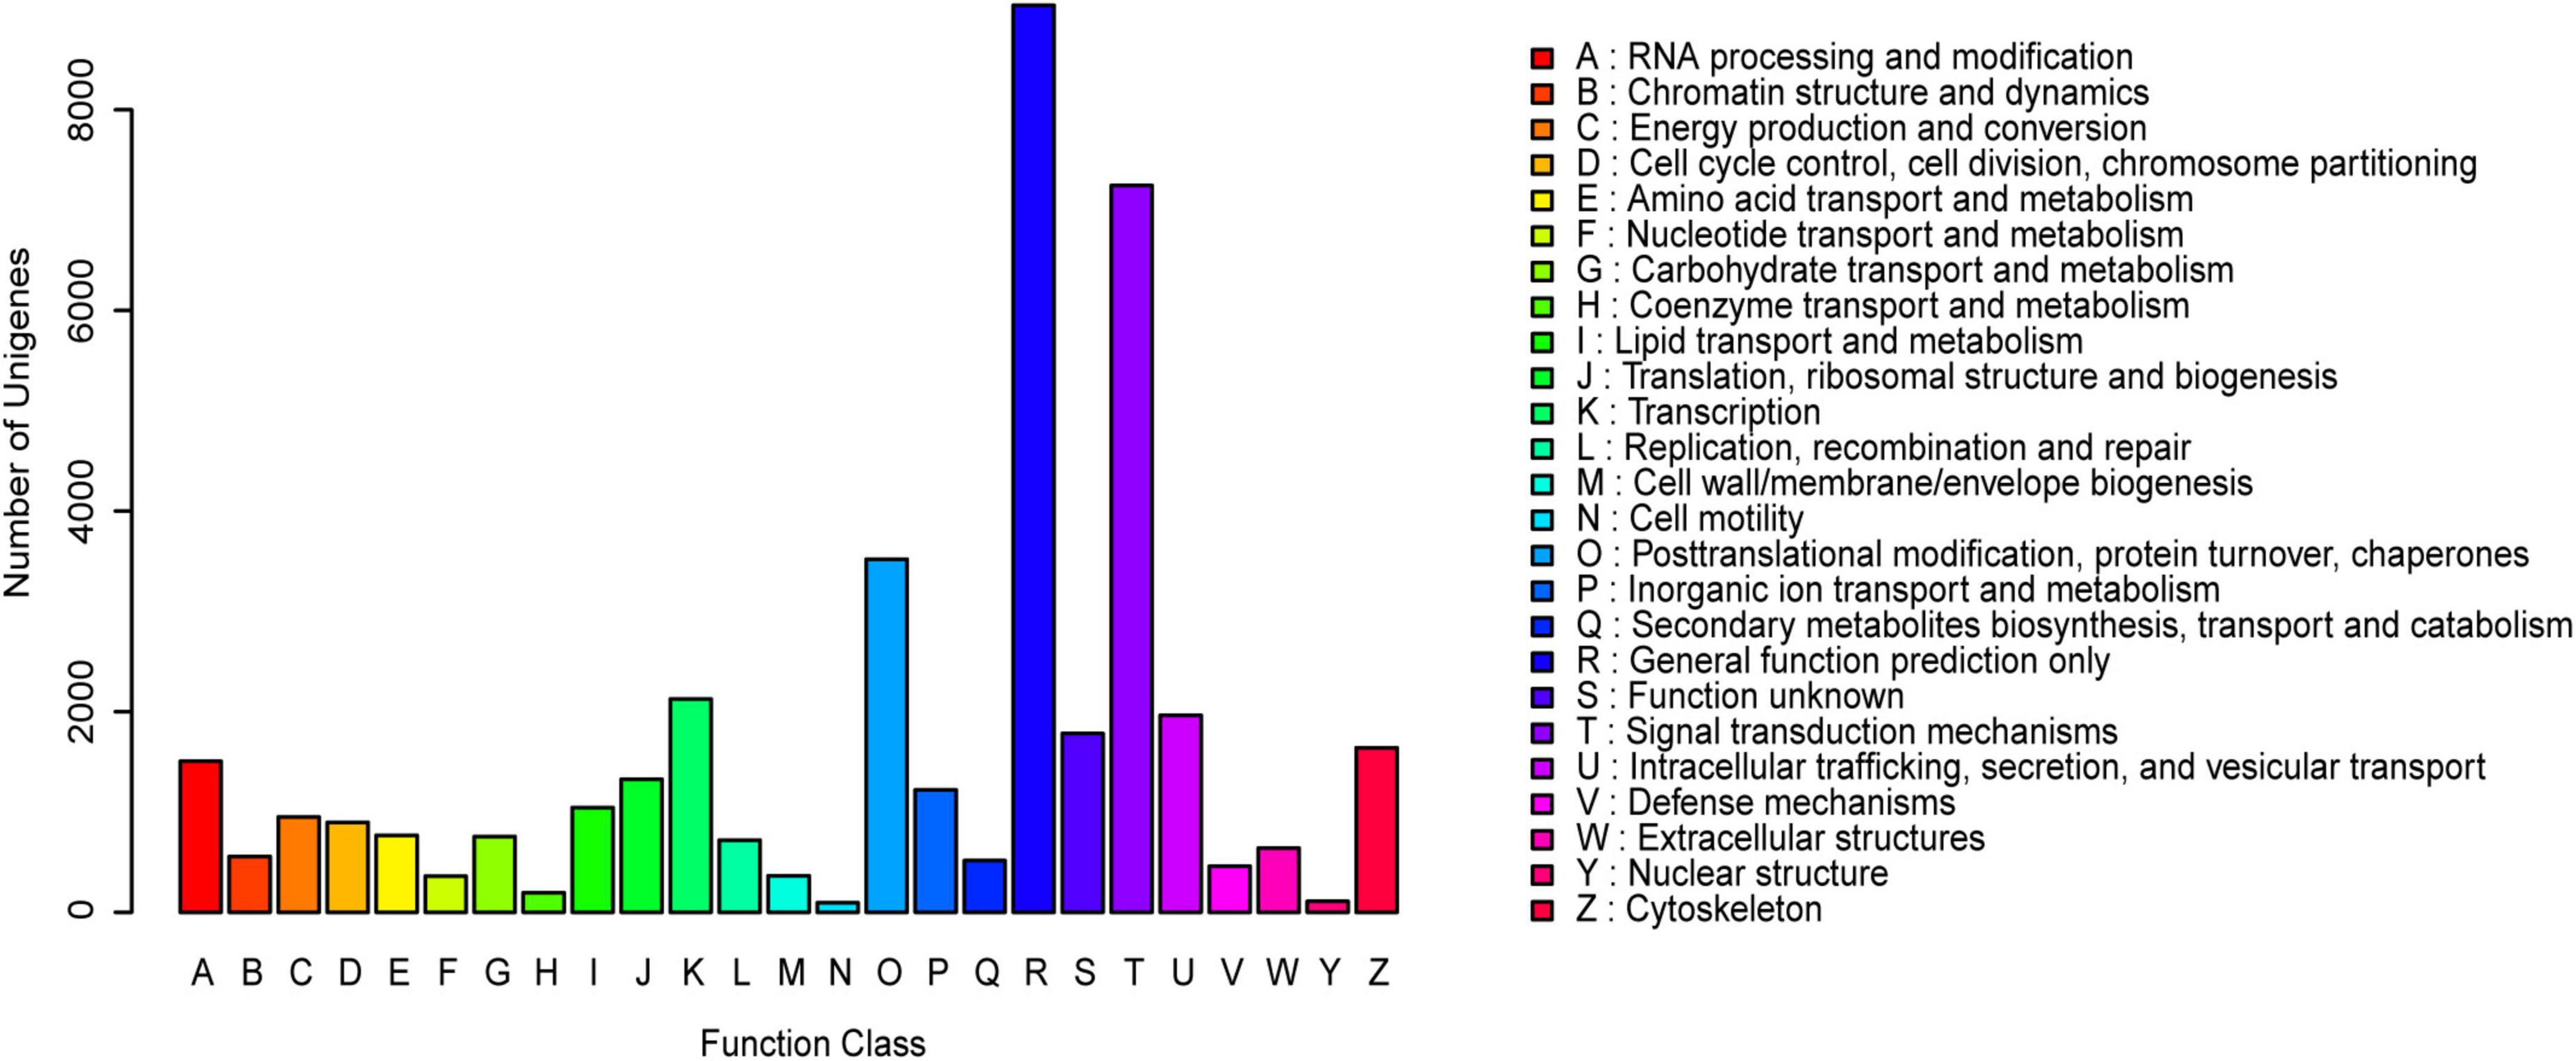
Figure 2. Gene ontology (GO) classification of the assembled unigenes. The three main GO categories were displayed in different colors (Red represented the biological processes, green represented the cell components, and blue represented the molecular functions). The horizontal axis represented GO terms name, and the vertical axis represented the gene number and percentage of unigenes.
To further determine the biological functions and interactions of the transcripts, a total of 9,252 unigenes were mapped to 344 KEGG pathways and assigned to six major categories: Cellular Processes, Environmental Information Processing, Genetic Information Processing, Human Diseases, Metabolism and Organismal Systems. The most abundant category was “signal transduction,” followed by “infectious diseases,” “cancers,” “endocrine system,” and “immune system” (Figure 3). The annotation and predicted pathways will aid the understanding of the gene functions in O. graminea.
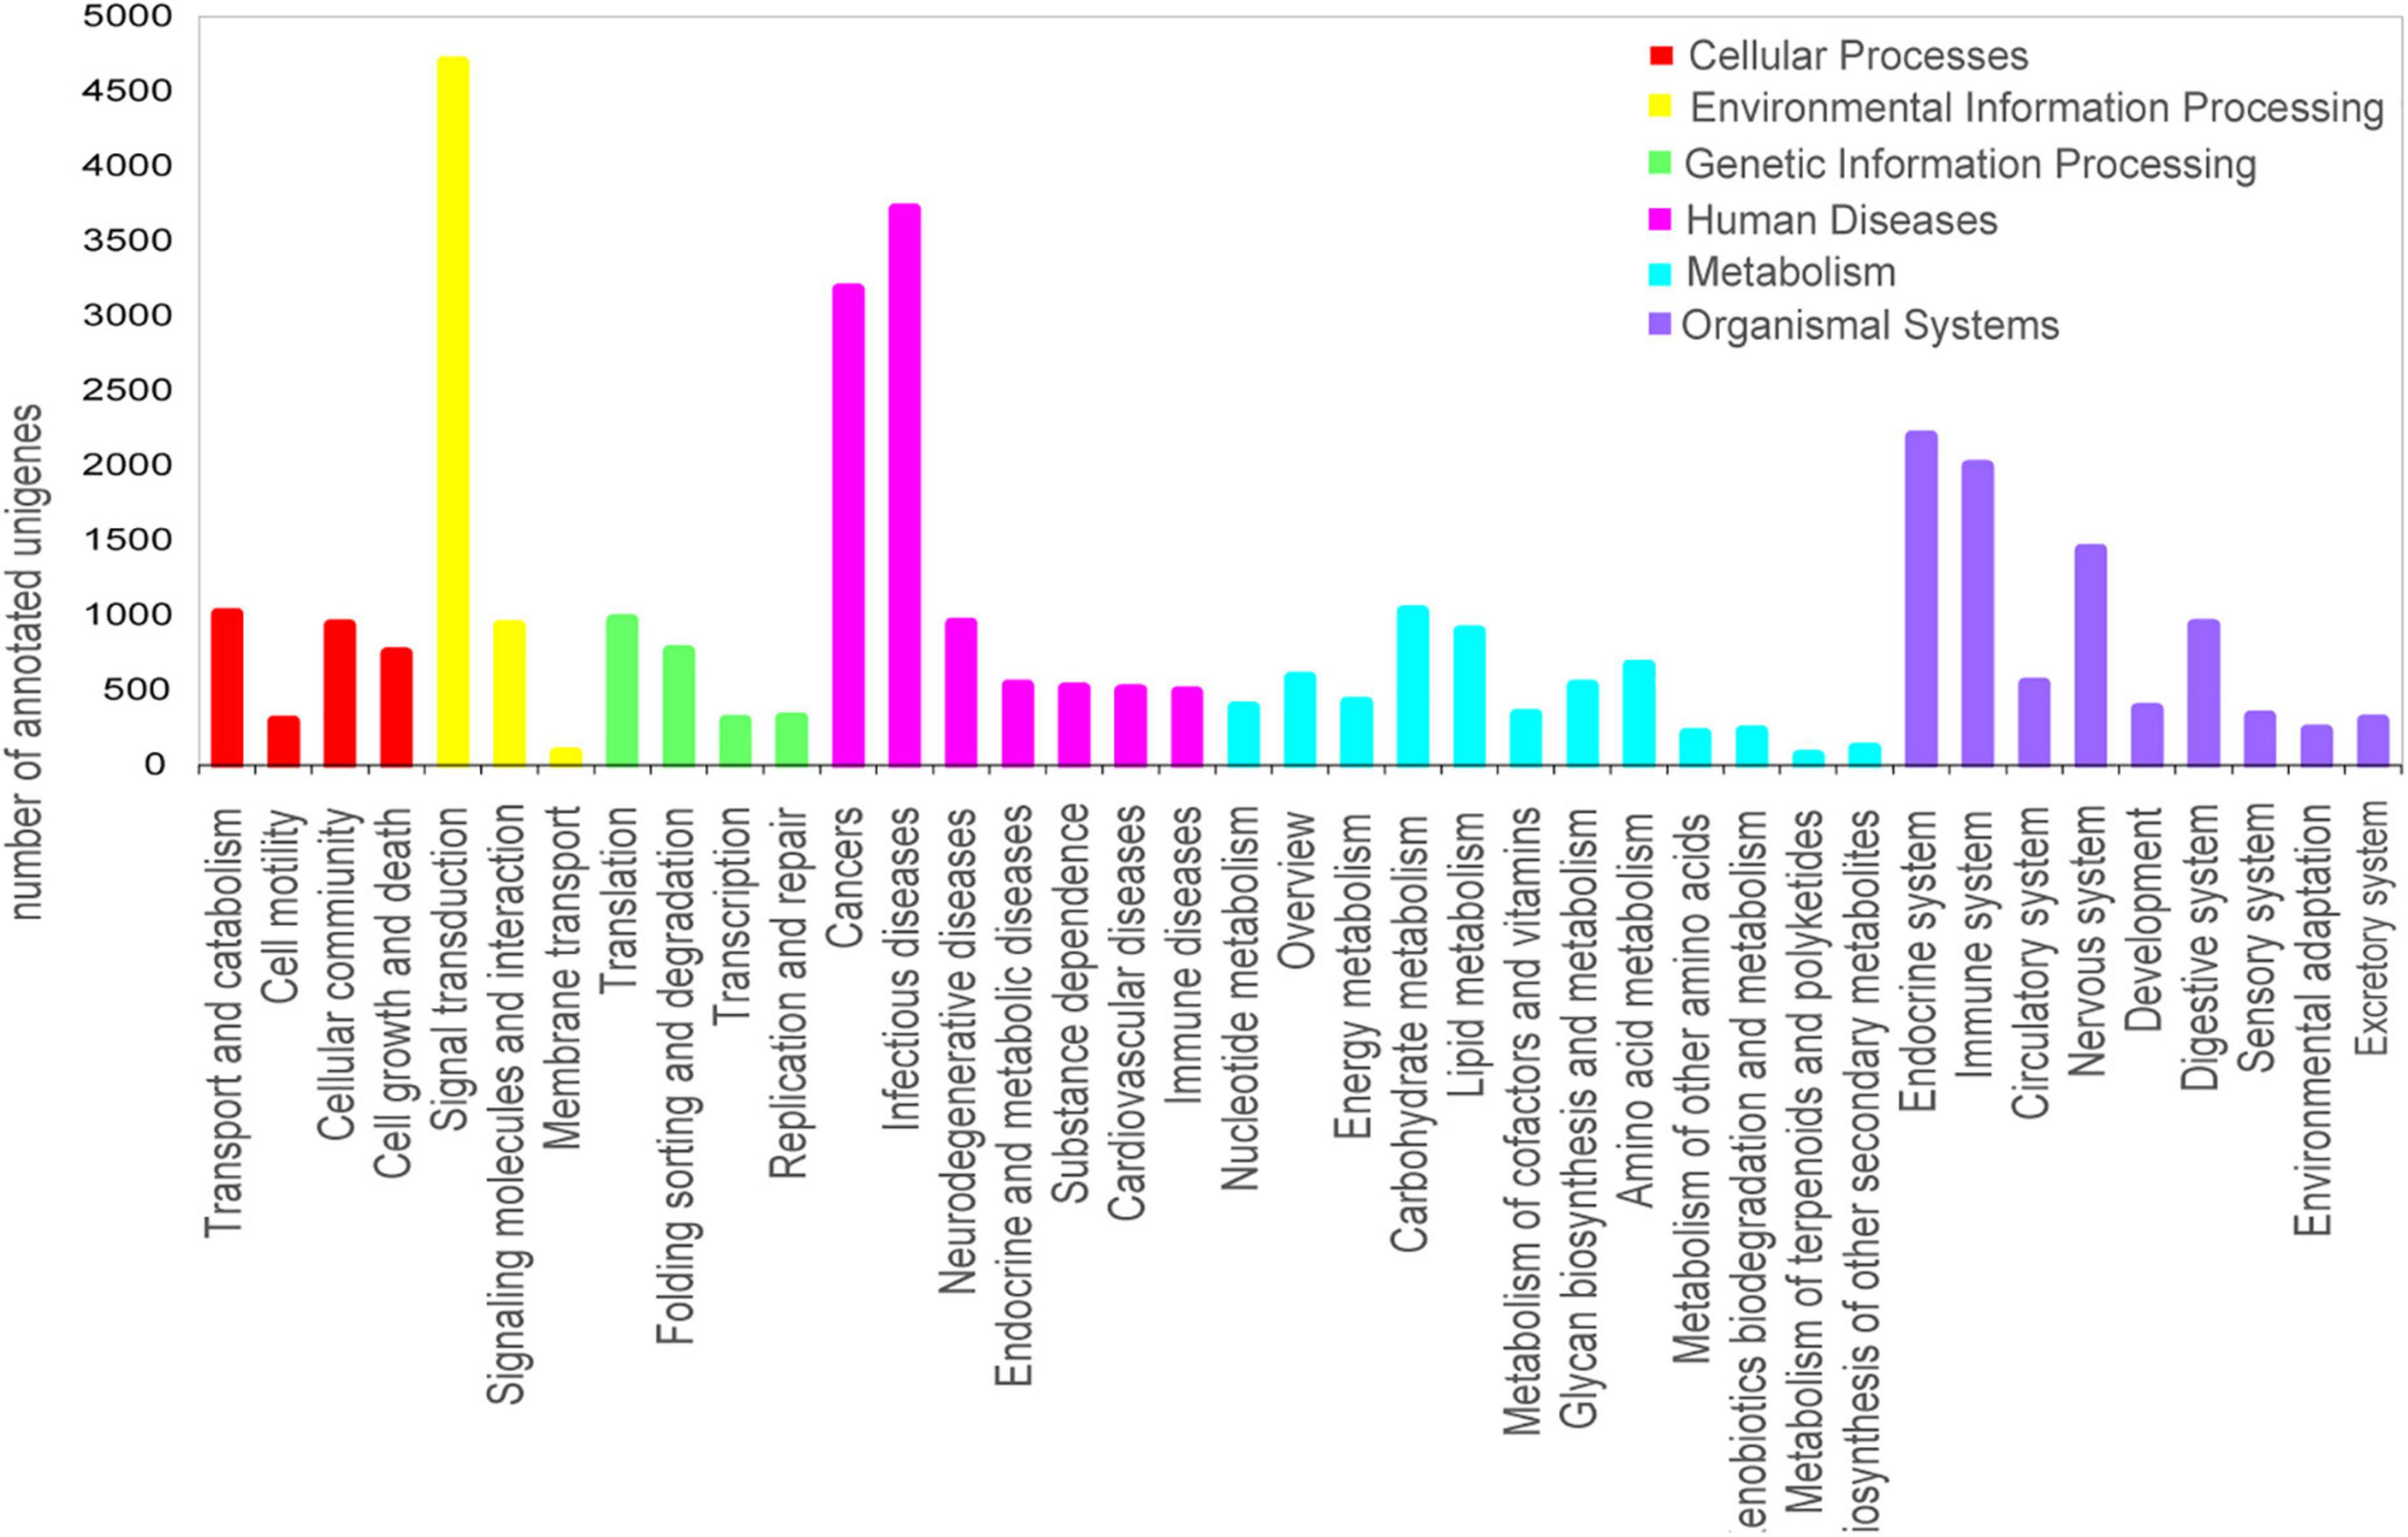
Figure 3. Histogram of Kyoto Encyclopedia of Genes and Genomes (KEGG) pathway annotation of the unigenes in O. grminea. The six main KEGG classifications were displayed in different colors. The x-axis represented the annotated pathway, and the y-axis represented the number of annotated unigenes.
To identify DEGs between female and male groups, we compared relative transcript abundance in each unigene through the FPKM algorithm. The results of hierarchical clustering analysis showed that the DEGs in the same gender had higher similarity and formed a sister-group relationship (Supplementary Figure 3). Under the standard of | log2Fold Change| > 1 and p-value (adjusted FDR) < 0.05, we identified 774 significant sex-differentially expressed unigenes in O. graminea. We found 436 unigenes showed significantly higher expression levels in females than those in males and 338 unigenes showed significantly lower expression in females than those in males (Supplementary Table 3).
Based on the standard of the p-value (adjusted FDR) less than 0.05, we found 272 sex-differential GO terms (Supplementary Table 4). These terms were allocated to 152 terms of “biological process” ontology (55.88% of total terms), 34 terms of “cellular component” ontology (12.50% of total terms) and 86 terms of “molecular function” ontology (31.62% of total terms). The GO annotation of the DEGs indicated that the DEGs in the brain were related to the regulation of oxidoreductase activity, hormone activity, regulation of cell growth, muscle organ development, growth factor binding, lipid catabolic process, ATP metabolic process, etc. (Supplementary Table 4). In addition, based on the same filtering criteria, 13 sex-differential KEGG pathways were identified (Supplementary Table 5 and Figure 4). According to their functions, these pathways were divided into four categories including “metabolism” (including two subcategories), “cellular processes” (including one subcategories), “organismal systems” (including five subcategories), and “human diseases” (including two subcategories). The KEGG annotation of the DEGs showed that the DEGs in the brain were related to phagosome, estrogen signaling pathway, oxidative phosphorylation, etc. (Supplementary Table 5).
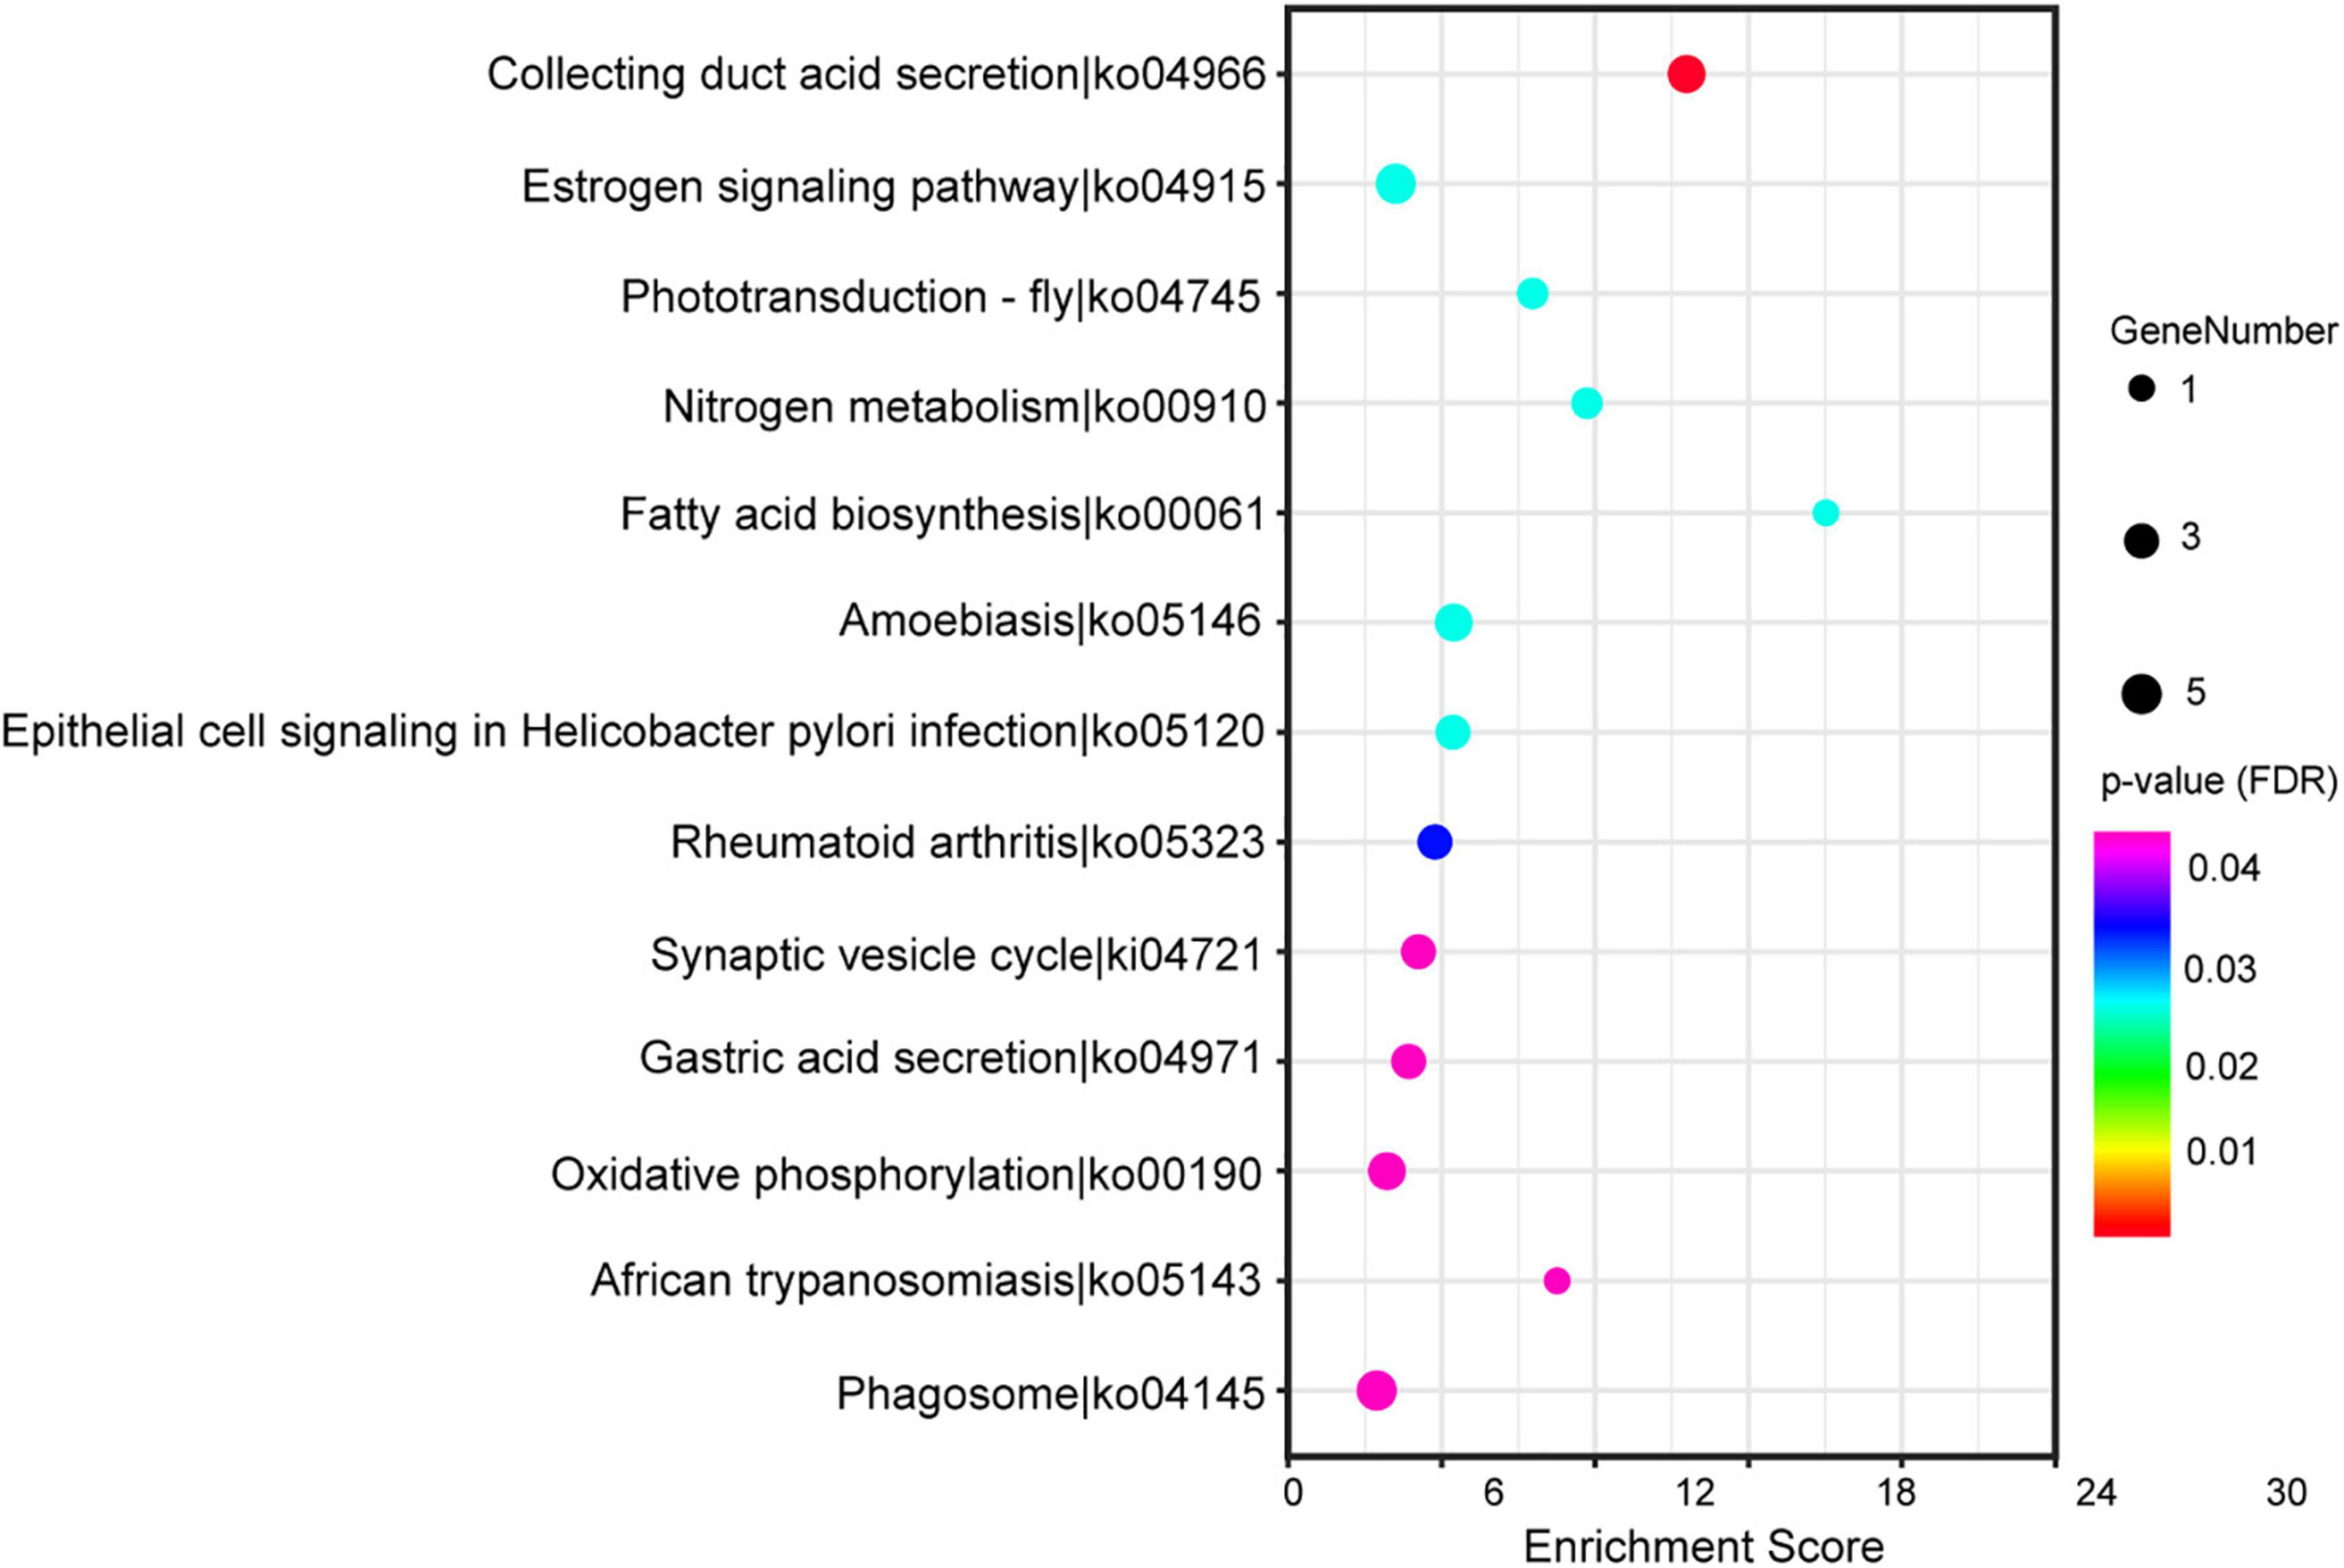
Figure 4. The top 20 of the Kyoto Encyclopedia of Genes and Genomes (KEGG) pathways significantly enriched in differentially expressed genes (DEGs). The horizontal and vertical axis showed the enrichment scores of DEGs and the specific pathways, respectively. The color of each dot represented the corrected p-value for the corresponding pathway, and the dot size indicated the number of the DEGs associated with each corresponding pathway.
Among 13 sex-differential KEGG pathways, the SSD-related pathways in the brain were mainly contained the duct acid secretion (ko04966), fatty acid biosynthesis (ko00061), oxidative phosphorylation (ko00190), estrogen signaling pathway (ko04915), gastric acid secretion (ko04971) and nitrogen metabolism (ko00910) (Supplementary Table 5). Furthermore, the estrogen signaling pathway genes (Hsp90, Hsp70, and Prkcd), oxidative phosphorylation-related genes (ATP4A, ATP6V1G3, and ATP6V1B1), nitrogen metabolism-related gene (Ca12) were upregulated in females, whereas gastric acid secretion-related gene (PLCB2), fatty acid biosynthesis-related gene (ACSL5) and estrogen signaling pathway gene (JUN) were upregulated in males (Supplementary Table 3). The regulatory pathway of the SSD-related genes revealed in this study were shown in Figure 5.
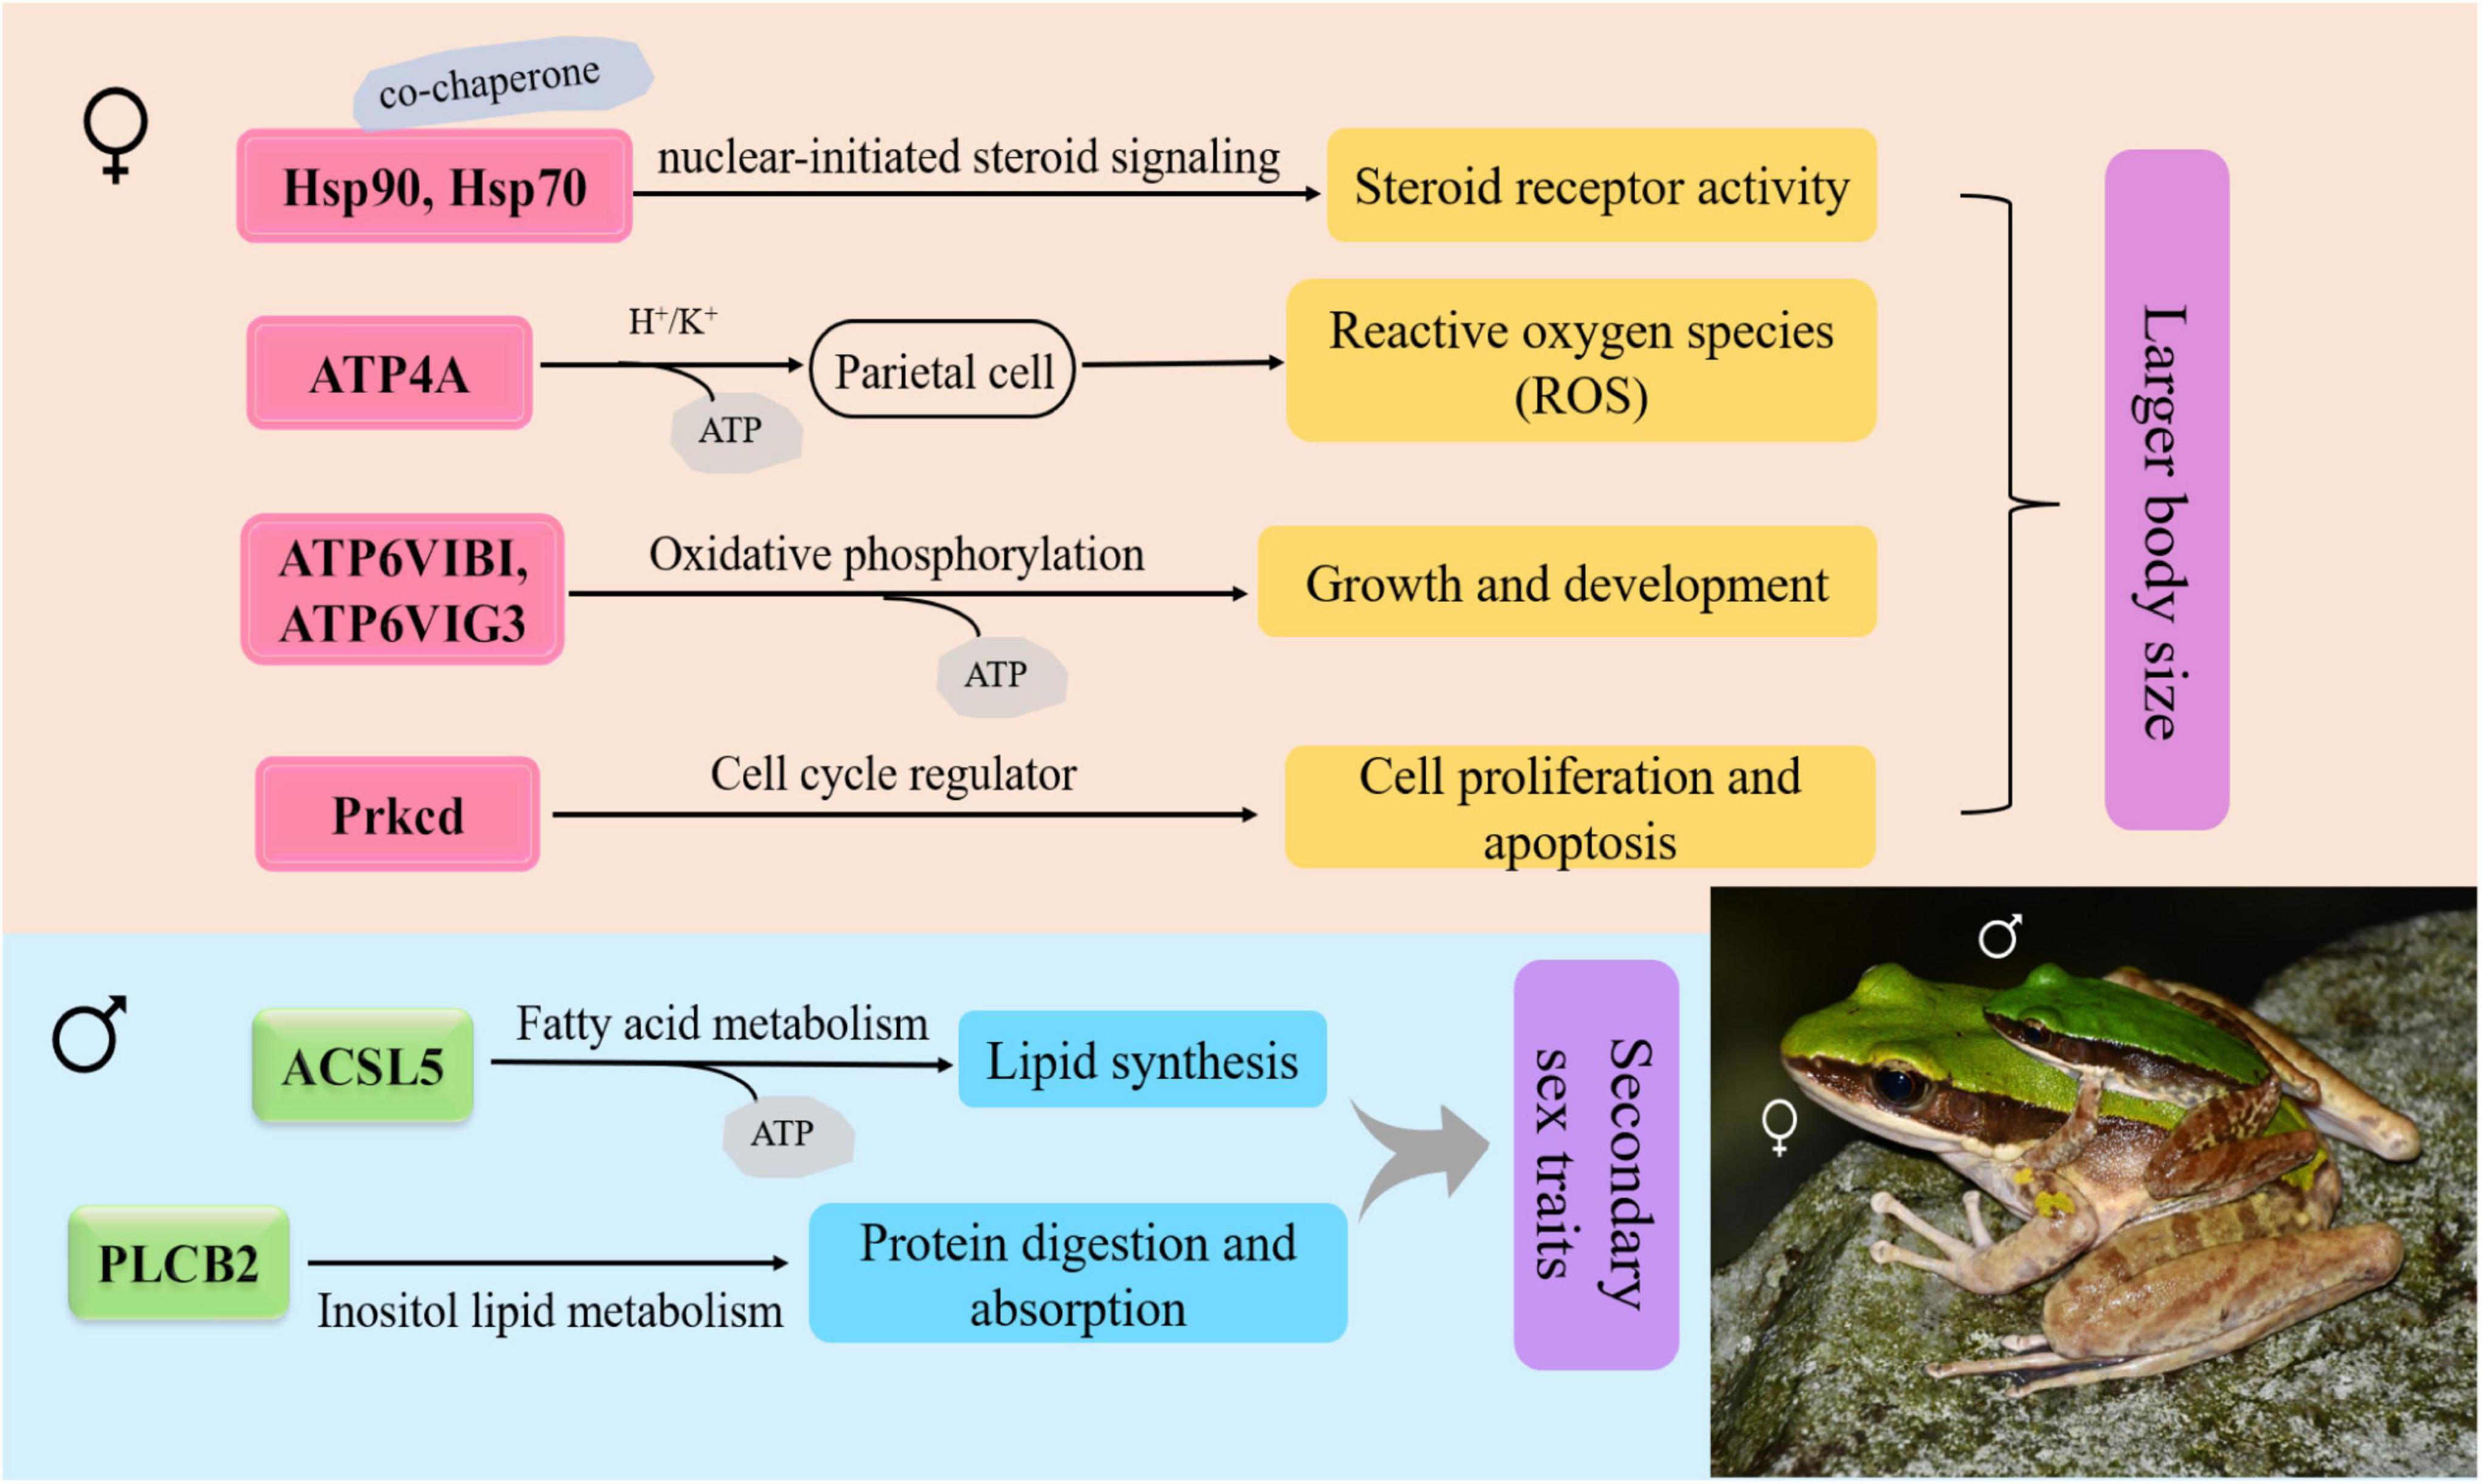
Figure 5. Schematic diagram for the functions of the sexual size dimorphism (SSD)-related differentially expressed genes (DEGs) between sexes in O. graminea. Red showed the upregulated DEG of females, green showed the upregulated DEGs, and the arrow showed the upregulated genes.
To test the accuracy of the expression profiles of DEGs, we randomly selected five DEGs (e.g., OTOL, comp185285_c0_seq5, ACSL5, TEKT3, and comp197617_c0_seq1) for qRT-PCR. As shown in Figure 6, the expression of TEKT3 and OTOL were upregulated in females, while ACSL5, comp197617_c0_seq1 and comp185285_c0_seq5 were upregulated in males. The expression patterns of the RNA-Seq results is in consistent with the results of qRT-PCR validation (Figure 6), indicating the accuracy and reliability of transcriptome data in this study.
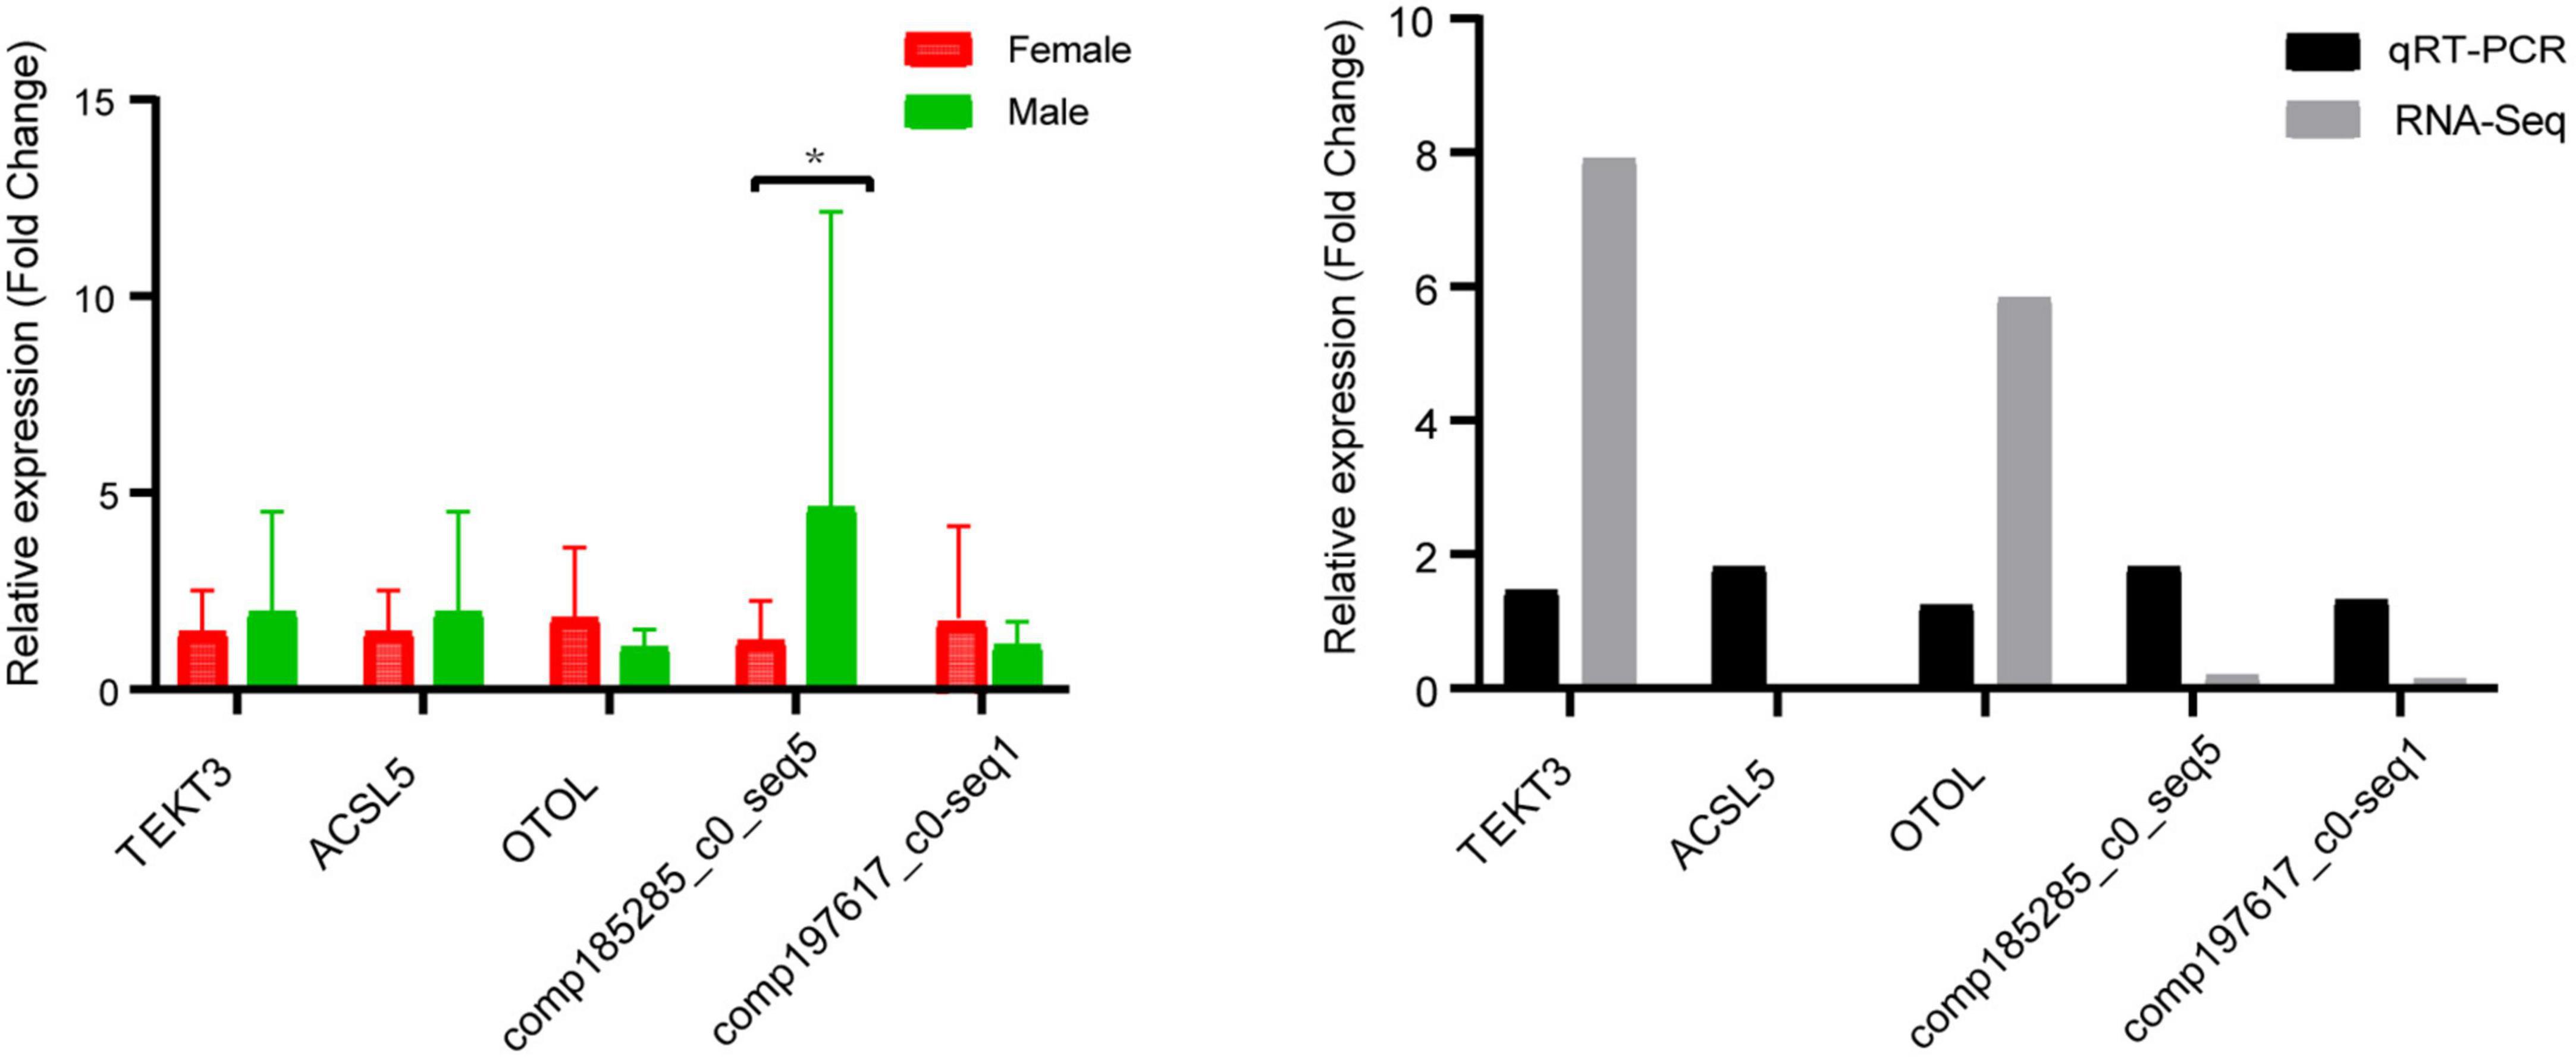
Figure 6. Quantitative real-time PCR (qRT-PCR) validation of transcriptome data. The X and Y axis represented gene name and the relative expression level of RT-qPCR, respectively. All data represented the average of three student replicates. Error bars indicated the standard error of three replicates. *Significant level p < 0.05.
We found 63,269 potential EST-SSR loci from 45,217 sequences and 4,669 EST-SSR loci in the compound formation (Table 3). The occurrence rate of EST-SSR loci was 23.81% (the ratio of the amount of SSR-contained unigenes to the total amount of unigenes), and the distribution rate (the ratio of SSR quantity to total unigenes quantity) was 33.32%. The average distance of EST-SSR loci was 2.36 kb (the ratio of total length of unigenes to SSR quantity) (Table 3).
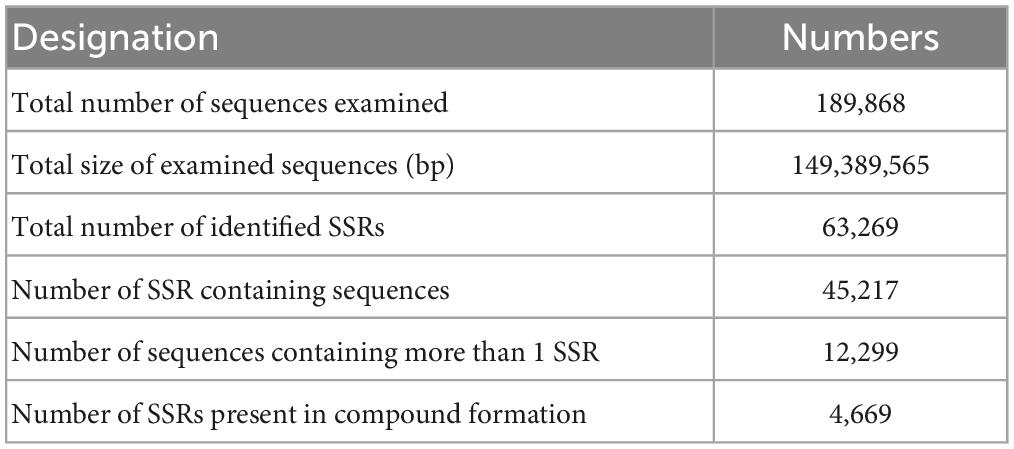
Table 3. The statistical results of microsatellite search.
Six repeat types (e.g., one, two, three, four, five, and six nucleotides repeat units) were identified for EST-SSRs of O. graminea (Table 4). Expect mononucleotides repeat unit and dinucleotides were the most abundant type (6,699, accounting for 70.50% of 9502), followed by trinucleotide (2,379, accounting for 25.04%), and tetranucleotide (407, accounting for 4.28%) repeat units (Table 4). The total ratio of mononucleotide, dinucleotides and trinucleotide repeat units was 99.33%, whereas the remaining repeat units accounted for 0.67%. The number of repeat units showed a decline trend as the quantity of unit length increased. Additionally, the number of repetitions of EST-SSR repeat units was ranged from 5 to 24 (those over 11 times were not listed in Table 4). A total of 33,723 (accounting for 53.30%) EST-SSRs repetitions were less than 11 and 29,546 (accounting for 46.70%) EST-SSRs repetitions were over eleven. The EST-SSRs with 10 repetitions were the most abundant (15,416, accounting for 24.37%), followed by 11 (9,584, accounting for 15.15%) and 12 (6,338, accounting for 10.02%) (Table 4).
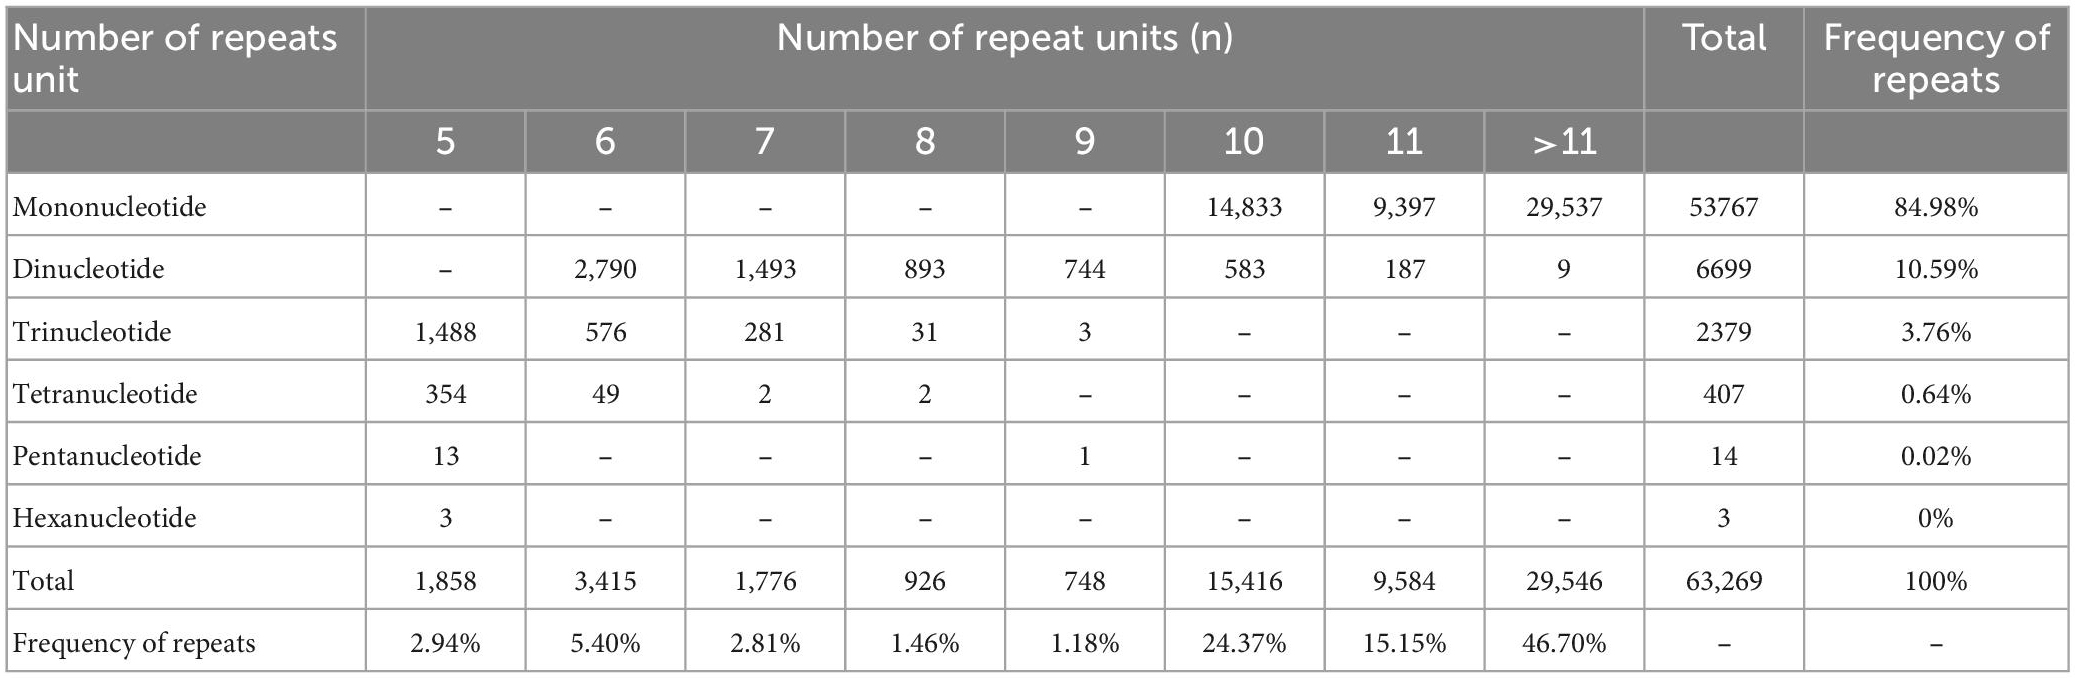
Table 4. The statistical results of expressed sequence tag-Simple Sequence Repeats (EST-SSRs) different repeat type.
In total, 54 types of repeat units were detected in EST-SSRs, mononucleotide, dinucleotide, trinucleotide, tetranucleotide, pentanucleotide, and hexanucleotide repeat units had two, four, 10, 23, 12, and three types, respectively (Supplementary Table 6). In mononucleotide unit, A/T was the most frequent which reached up to 46,797 accounting for 73.97% of 63,269. The AC/GT (accounting for 3.37%) and AT/AT (accounting for 4.93%) were dominant in dinucleotide units. Among trinucleotide unit, AAT/ATT was the most frequent which added up 730 accounting for 1.15%. For tetranucleotide unit, AGAT/ATCT was the most abundant (153, accounting for 0.24%), followed by AAAT/ATTT (67, accounting for 0.11%), and AAAG/CTTT (42, accounting for 0.07%). For pentanucleotide unit, the number of AATCT/AGATT and AGAGG/CCTCT were equal. Three kinds of types in hexanucleotide repeat units with same frequency were also identified (Supplementary Table 6).
A total of 169 primer pairs were randomly designed to determine the polymorphism of EST-SSRs among different populations of O. graminea. Thirteen primer pairs were successfully amplified and eight primer pairs of them were polymorphic with the expected size products, whereas the other five primer pairs were monomorphic. After Bonferroni correction (Rice, 1989) and Micro-Checker analysis, only one locus (213,074) significantly deviated from HWE. No significant pairwise linkage disequilibrium was shown between any of the loci, indicating the independent behavior of all loci. The number of alleles per polymorphic locus ranged from 3 to 36. The observed heterozygosities (Ho) ranged from 0.148 to 0.852, and the expected heterozygosities (He) ranged from 0.142 to 0.865. The polymorphism information content (PIC) ranged from 0.133 to 0.831 (Supplementary Table 7).
Loci 177957, 190011, 208970, 212884, and 213074 were successfully amplified in O. rotodora, O. chloronota, O. leporipes, O. schmackeri, O. hejiangensis, O. tianmuii, O. tormota, O. chapaensis, and O. versabilis. For locus 214363, seven species could be successfully amplified. For locus 100238, O. rotodora, O. chloronota, O. leporipes, O. schmackeri, O. hejiangensis, and O. tianmuii could be successfully amplified (Supplementary Table 7). The polymorphism of locus 203080 was the highest, followed by locus 213077, and their pic values were greater than 0.5 (Supplementary Table 7).
In this study, we compared the gene expression patterns between male and female of O. graminea, and identified ten potential sexual size dimorphism-related candidate genes involved in the regulation of cell cycle, metabolic process, ATP metabolic process, lipid catabolic process, and other related regulatory function. Furthermore, the expression patterns of ten DEGs showed that seven were highly expressed in females and three were highly expressed in males. The highly expressed genes in females were involved in the pathways of the estrogen signaling pathway, oxidative phosphorylation, and nitrogen metabolism, while the highly expressed genes in males were involved in the gastric acid secretion and fatty acid metabolism. Our results will provide insights for understanding of the genetic changes underlying the sexual difference of energy metabolism and SSD in O. graminea. In addition, we have developed EST-SSR molecular markers that can be used for population genetics researches for Odorrana.
Among terrestrial vertebrates, amphibians have high repetitive DNA content and the largest reported variation in genome size, with the estimates ranging from 0.93 to 137 Gb and typical sizes of ∼2–8 Gb for anurans, ∼5–10 Gb for caecilians, and ∼20–60 Gb for salamanders (Liedtke et al., 2018; Weisrock et al., 2018). For this reason, only a few Amphibian genomic data was available to date. For non-model organisms, RNA-seq-based de novo transcriptome analysis was an attractive alternative to examine the properties of a transcriptome as a proxy for the whole genome.
In this study, through Illumina sequencing, we got 189,868 unigenes of O. graminea which were greater than O. margaretae (54,093 unigenes) (Huang et al., 2016), Rhacophorus dennysi (63,614 unigenes) (Huang et al., 2016), R. omeimontis (55,841 unigenes) (Huang et al., 2016), Polypedates megacephalus (69,425 unigenes) (Huang et al., 2016), P. nigromaculatus (61,691 unigenes) (Huang et al., 2016), R. arvalis (124,071 unigenes) (Shu et al., 2018), and H. chinensis (148,510 unigenes) (Che et al., 2014). The average unigene length of O. graminea (787 bp) was longer than in O. margaretae (687 bp), R. dennysi (770 bp), R. omeimontis (626 bp), P. megacephalus (699 bp), P. nigromaculatus (690 bp) (Huang et al., 2016), R. arvalis (728 bp) (Shu et al., 2018), and H. chinensis (580 bp) (Che et al., 2014), but shorter than in Megophrys sangzhiensis (868 bp) and Leptobrachium boringii (840 bp) (Huang et al., 2016). The differences of the mean unigene length could be related to the genome size, sampling organization, biological attribute of species, different parameters setting during sequence assembly. In general, the assembly length reflected the quality of transcriptome sequencing and it suggested that the transcriptome of O. graminea was assembled efficiently.
The oxidative phosphorylation provides most ATP for animals and plants to maintain the homeostasis in life and energy metabolism (Wilson, 2017). Vertebrate growth is regulated by the “hypothalamic-pituitary-liver” axis and a variety of energy metabolic processes (e.g. glycolysis/gluconeogenesis and oxidative phosphorylation) (Michaeloudes et al., 2017). The main physiological functions of the glycolysis and gluconeogenesis are the decomposition and synthesis of sugars, respectively. They are the central pathway of most organisms, providing energy in the form of ATP (Plaxton, 1996; Roosterman et al., 2018). Three differentially expressed genes (e.g., ATP4A, ATP6V1B1, and ATP6V1G3) revealed in the present study were involved in the oxidative phosphorylation pathway (ko00190) (Supplementary Table 3). The ATP4A gene catalyzed the hydrolysis of ATP, combined with the exchange of H+ and K+ ions through the plasma membrane, and is responsible for the acid production in the stomach (Castro et al., 2013; Barnawi et al., 2020). Previous analyses have shown that the ATP4Ap.R703C mutation can cause the gastric acid poisoning in mouse, and also destroy the acid-base balance in the parietal cells and affect the mitochondrial biogenesis (Benítez et al., 2020). Mitochondrial dysfunction activates ROS signaling pathway and triggers Caspase-3-mediated apoptosis of parietal cells. The ATP6V1B1 gene is a subunit of the V1 complex of vacuolar (H+)-ATPase (V-ATPase) (Vasanthakumar and Rubinstein, 2020; Wang et al., 2020). V-ATPase is responsible for acidifying and maintaining the pH of the intracellular compartments and it is targeted to the plasma membrane in some cell types, where it is responsible for acidifying the extracellular environment (Vasanthakumar and Rubinstein, 2020). These three DEGs were significantly upregulated in females O. graminea compared with males, and they were involved in the ATP biosynthetic process (ATP4A), vacuolar proton-transporting V-type ATPas (ATP6V1G3), and ATP metabolic process (ATP6V1B1) (Supplementary Tables 3, 4). Therefore, the higher metabolic levels of females O. graminea might provid more energy for growth, and females grown faster and were larger than males, as in Misgurnus anguillicaudatus (Luo et al., 2021).
Another three DEGs (e.g., Hsp90, Hsp70, and Prkcd) were significantly upregulated in female O. graminea, and they were found to be involved in the Estrogen signaling pathway (Supplementary Tables 3, 5). Heat shock protein-90 (Hsp90) is a molecular chaperone responsible for maintaining the stability and activity of a large number of different proteins, known as the clients. The ability of Hsp90 to accompany about 300 client proteins is strictly dependent on its ATP hydrolysis activity (Biebl and Buchner, 2019). Recently, Hsp90 co-chaperone network have been found to increase the affinity of steroid hormone receptors, glucocorticoid receptors and estrogen receptors with their ligands in higher organisms (Backe et al., 2022). Heat shock protein-70 (Hsp70) played an important role in regulating the reproductive function (Xu et al., 2021). Hsp70 binding protein 1 (HspBP1) and Bcl2-associated athanogene 1 (BAG-1), the functional orthologous nucleotide exchange factors of the heat shock protein 70 kilodalton (Hsc70/Hsp70) chaperones, catalyze the release of ADP from Hsp70 while inducing different conformational changes of the ATPase domain of Hsp70. Studies have shown that BAG-1M and HspBP1 have different effects on the dynamic composition and the receptor function of the steroid receptor folding complex. The Hsp70 binding to the ligand-binding domain of the glucocorticoid receptor (GR) was reduced in the presence of HspBP1 but not in the presence of BAG-1M (Knapp et al., 2014). In addition, Prkcd is calcium-independent, phospholipid- and diacylglycerol (DAG)-dependent serine/threonine-protein kinase. It plays contrasting roles in cell death and cell survival by functioning as a pro-apoptotic protein during DNA damage-induced apoptosis, but acting as an anti-apoptotic protein during cytokine receptor-initiated cell death. It is required for oxygen radical production by NADPH oxidase and acts as positive or negative regulator in platelet functional responses (Hamaguchi et al., 2003). Therefore, the differential expression of these three DEGs in the estrogen signaling pathway between male and female might lead to the phenotypic differentiation.
Fatty acids are regarded as the main energy source, secondary metabolites, and nutritional contents. With an adequate supply of oxygen, fatty acids can be degraded into H2O and CO2, and large amounts of energy are released in the form of adenosine triphosphate (ATP), which is then used by organisms. They are directly or indirectly involved in almost every process of our physiology. Acyl-coa synthetase long chain (ACSL) protein is a key participant in fatty acid metabolism in skeletal muscle, catalyzed the conversion of long-chain fatty acids into their active form acyl-CoAs to synthesize cellular lipids and β-oxidation degradation (Klett et al., 2017). It can activate exogenous fatty acids to synthesize triacylglycerol for intracellular storage (Mashek et al., 2006). Mammalian ACSL5 is present in the brown adipose tissue, skeletal muscle, liver, brain and is involved in the pro-apoptotic induction of cells (Mashek et al., 2006). In addition, PLCB2 gene plays a role in the fatty acid metabolism (Park et al., 1992; Tall et al., 1997). The ACSL5 and PLCB2 were highly expressed in males of O. graminea (Supplementary Table 3) and it suggested that males O. graminea might obtain large amounts of energy through fatty acid metabolism for the development and reproduction of secondary sexual characteristics.
The growth and development of amphibians are influenced by multiple physiological pathways that regulate the material and energy metabolism. Previous studies have shown that the differences in the energy metabolism might be the main causes of sexual growth dimorphisms (Starostová et al., 2013; Luo et al., 2021). Odorrana graminea have obvious growth sexual dimorphism that females are nearly twice the body size of males (Fei et al., 2009; Liao et al., 2013; Li et al., 2023). It is often assumed that the growth difference is mediated by the differences in the expression of genes present in both sexes (Connallon and Knowles, 2005; Rinn and Snyder, 2005). In anurans, female body size is related to fertility and larger females have more offspring (Liao and Lu, 2011; Nali et al., 2014). Females need to gain more capacity for the size growth (Luo et al., 2021). The female-biased growth dimorphism of O. graminea may be partially attributed to the sexually dimorphic metabolism in the brain.
During the breeding season, males had obvious secondary sex characteristics, such as the paired subgular vocal sacs located at corners of throat, the gray-white pads on dorsal surface of first finger, and the pinkish lineae masculine on dorsal side (Fei et al., 2009). Due to O. graminea inhabiting in turbulent streams, males had to resist the impact of running water for a long time and their forelimbs were extremely strong (Liu and Hu, 1961; Fei et al., 2009). It was the development of secondary sexual characteristics that might cause males to consume more energy during breeding season (Li, 1988). Odorrana graminea also performed axillary amplexus that males used his forelimbs to tightly hold female’s armpit (Fei et al., 2009). Therefore, we speculate that males might need more energy for reproduction. Moreover, in our field studies, we found that the sex ratio tends to be skewed toward a surplus of males, so that males expend energy in the intense reproductive competition.
The average distance of EST-SSR in O. graminea was 2.36 Kb with a 23.81% occurrence rate (Table 3), which were higher than that (2.69 Kb and 21.54%) in Chinese salamander (Che et al., 2014) and (4.53 Kb and 20.23%) in the Chinese swamp buffalo (Deng et al., 2016), but lower than that (1.2 Kb and 58.66%) in the yellow sisoridae catfish (Du et al., 2018) and (2.14 Kb and 45.25%) in the anadromous fish (Fang et al., 2015). The differences in the abundance estimation and frequency of EST-SSRs among various species could be partially due to the SSR search criteria, the size of the unigene assembly dataset, the database-mining tools and the sequence redundancy as well as the actual differences between species (Varshney et al., 2005). The EST-SSRs identified in this study were not uniformly distributed in the transcriptome database. When the mononucleotide repeats were excluded, the dinucleotide, trinucleotide and tetranucleotide repeat units were the top three of O. graminea (Table 4), which was consistent with that in O. margaretae (Qiao et al., 2013), and was different with the Chinese salamander that the dinucleotide repeats accounted for 40.41% (3,525), followed by tetranucleotide (2,088, accounting for 23.93%) and trinucleotide (1,747, accounting for 20.03%) (Che et al., 2014). The SSR search parameters and search algorithms might contributed to this difference.
Compared to genomic-SSRs, the expressed sequence tags (EST) EST-SSRs were reported to provide higher levels of transferability across the related species, because EST-SSR loci were identified in the coding regions of the genome and the identified sequences are more conserved among homologous genes (Wu et al., 2014). These features lead to the highly variable of the EST-SSR loci and were useful for distinguishing closely related populations or varieties compared to genomic-SSRs. Transcriptome sequencing provided a fast, reliable and cost-effective tool for identifying and developing large-scale EST-SSR markers. The results of cross-species amplification showed that it was successful in many species of Odorrana (Supplementary Table 5). Furthermore, based on these markers, the population genetic structure of O. graminea was successfully analyzed and the gene flow between populations was revealed (Chen et al., 2020).
In conclusion, we successfully identified the DEGs related to the sexual size dimorphisms and EST-SSR loci in O. graminea by using comparative transcriptome analysis. We found that the DEGs were mainly involved in the oxidative phosphorylation, estrogen signaling pathway, and fatty acid biosynthesis. Our results suggest that the differences in the energy metabolism, estrogen hormone synthesis, and fatty acid biosynthesis abilities might be the important factors leading to the sexual dimorphisms in frogs. Specifically, females grown faster and have higher levels of energy metabolism, while males had greater fatty acid biosynthesis abilities than females. Our study not only indicates the direction for us to further investigate the molecular mechanisms of sexual growth dimorphisms of frogs, but also provides essential gene information for future functional studies. The developed EST-SSR markers will also contribute to the population genetics of the species within Odorrana.
All raw sequence reads data have been deposited in the NCBI Sequence Read Archive (SRA) database under the accession number BioProject: PRJNA931772 (https://dataview.ncbi.nlm.nih.gov/object/PRJNA931772?reviewer=a59ntosdhq8m786eak76q3gap).
This animal study was reviewed and approved by the Institutional Care and Ethics Committee of Henan Normal University.
HL designed the study, analysed the results, and wrote the manuscript. CC performed the experiments. WH and TW collected the samples. JZ and XC conceived and designed the study and revised the manuscript. All authors reviewed and approved the submitted version of the manuscript.
This work was supported by the National Natural Science Foundation of China (NSFC) (Grant nos. U21A20192, 31872220, and U1404306), the Natural Science Foundation of Henan Province (202300410222), the Key Scientific Research Project in University of Henan Province (21A240002), and the Key Project of Science and Technology of Henan Province (172102310619 and 202102110258).
The authors thank Yanjun Zhu, Xiaofei Zhai, and Yao Liu for the sample collection in the field. The authors also thank Yao Liu for data analysis.
The authors declare that the research was conducted in the absence of any commercial or financial relationships that could be construed as a potential conflict of interest.
All claims expressed in this article are solely those of the authors and do not necessarily represent those of their affiliated organizations, or those of the publisher, the editors and the reviewers. Any product that may be evaluated in this article, or claim that may be made by its manufacturer, is not guaranteed or endorsed by the publisher.
The Supplementary Material for this article can be found online at: https://www.frontiersin.org/articles/10.3389/fevo.2023.1159037/full#supplementary-material
Aiello, L., and Wheeler, P. (1995). The expensive-tissue hypothesis: The brain and the digestive system in human and primate evolution. Curr. Anthropol. 36, 199–221.
Anders, S., and Huber, W. (2012). Differential expression of RNA-Seq data at the gene level-the DESeq package. Oakland, CA: University of California.
Antoniou, A., Frantzis, A., Alexiadou, P., Paschou, N., and Poulakakis, N. (2018). Evidence of introgressive hybridization between Stenella coeruleoalba and Delphinus delphis in the Greek Seas. Mol. Phylogenet. Evol. 129, 325–337. doi: 10.1016/j.ympev.2018.09.007
Backe, S. J., Sager, R. A., Regan, B. R., Sit, J., Major, L. A., Bratslavsky, G., et al. (2022). A specialized Hsp90 co-chaperone network regulates steroid hormone receptor response to ligand. Cell Rep. 40:111039. doi: 10.1016/j.celrep.2022.111039
Barnawi, E. A., Doherty, J. E., Ferreira, P. G., and Wilson, J. M. (2020). Extra-gastric expression of the proton pump H+/K+ -ATPase in the gills and kidney of the teleost Oreochromis niloticus. J. Exp. Biol. 223:jeb214890. doi: 10.1242/jeb.214890
Basto-Riascos, M. C., López-Caro, J., and Vargas-Salinas, F. (2017). Reproductive ecology of the glass frog Espadarana prosoblepon (Anura: Centrolenidae) in an urban forest of the Central Andes of Colombia. J. Natl. Hist. 51, 2535–2550. doi: 10.1080/00222933.2017.1371805
Benítez, J., Marra, R., Reyes, J., and Calvete, O. (2020). A genetic origin for acid-base imbalance triggers the mitochondrial damage that explains the autoimmune response and drives to gastric neuroendocrine tumours. Gastric Cancer 23, 52–63. doi: 10.1007/s10120-019-00982-4
Benjamini, Y., and Yekutieli, D. (2005). False Discovery Rate-Adjusted Multiple confidence intervals for selected parameters. J. Am. Stat. Assoc. 100, 71–81. doi: 10.1198/016214504000001925
Biebl, M. M., and Buchner, J. (2019). Structure, function, and regulation of the Hsp90 machinery. Cold Spring Harbor Perspect. Biol. 11:a034017. doi: 10.4103/2319-4170.113230
Castro, L. F., Gonçalves, O., Mazan, S., Tay, B. H., Venkatesh, B., and Wilson, J. M. (2013). Recurrent gene loss correlates with the evolution of stomach phenotypes in gnathostome history. Proc. Biol. Sci. 281:20132669. doi: 10.1098/rspb.2013.2669
Che, R., Sun, Y., Wang, R., and Xu, T. (2014). Transcriptomic analysis of endangered Chinese salamander: Identification of immune, sex and reproduction-related genes and genetic markers. PLoS One 9:e87940. doi: 10.1371/journal.pone.0087940
Chen, H., Jiang, D., Li, Z., Wang, Y., Yang, X., Li, S., et al. (2021). Comparative physiological and transcriptomic profiling offers insight into the sexual dimorphism of hepatic metabolism in size-dimorphic spotted scat (Scatophagus argus). Life 11:589. doi: 10.3390/life11060589
Chen, Z., Li, H., Zhai, X., Zhu, Y., He, Y., Wang, Q., et al. (2020). Phylogeography, speciation and demographic history: Contrasting evidence from mitochondrial and nuclear markers of the Odorrana graminea sensu lato (Anura, Ranidae) in China. Mol. Phylogenet. Evol. 144:106701. doi: 10.1016/j.ympev.2019.106701
Conesa, A., Götz, S., García-Gómez, J. M., Terol, J., Talón, M., and Robles, M. (2005). Blast2GO: A universal tool for annotation, visualization and analysis in functional genomics research. Bioinformatics 21, 3674–3676. doi: 10.1093/bioinformatics/bti610
Connallon, T., and Knowles, L. (2005). Intergenomic conflict revealed by patterns of sex-biased gene expression. Trends Genet. 21, 495–499. doi: 10.1016/j.tig.2005.07.006
Deng, T., Pang, C., Lu, X., Zhu, P., Duan, A., Tan, Z., et al. (2016). De Novo Transcriptome Assembly of the Chinese Swamp Buffalo by RNA Sequencing and SSR Marker Discovery. PLoS One 11:e0147132. doi: 10.1371/journal.pone.0147132
Du, M., Li, N., Niu, B., Liu, Y., You, D., Jiang, D., et al. (2018). De novo transcriptome analysis of Bagarius yarrelli (Siluriformes: Sisoridae) and the search for potential SSR markers using RNA-Seq. PLoS One 13:e0190343. doi: 10.1371/journal.pone.0190343
Ethier, J. P., Fayard, A., Soroye, P., Choi, D., Mazerolle, M. J., and Trudeau, V. L. (2021). Life history traits and reproductive ecology of North American chorus frogs of the genus Pseudacris (Hylidae). Front. Zool. 18:40. doi: 10.1186/s12983-021-00425-w
Fang, D. A., Zhou, Y. F., Duan, J. R., Zhang, M. Y., Xu, D. P., Liu, K., et al. (2015). Screening potential SSR markers of the anadromous fish Coilia nasus by de novo transcriptome analysis using Illumina sequencing. Genet. Mol. Res. 4, 11418–14181. doi: 10.4238/2015.November.13.1
Fei, L., Hu, S. Q., Ye, C. Y., and Huang, Y. Z. (2009). Fauna Sinica, Amphibia, Vol. 3. Anura Ranidae (In Chinese). Beijing: Science Press.
Frost, D. R. (2022). Amphibian Species of the World: an Online Reference. Version 6.1. New York, NY: American Museum of Natural History.
Grabherr, M. G., Haas, B. J., Yassour, M., Levin, J. Z., Thompson, D. A., Amit, I., et al. (2011). Full-length transcriptome assembly from RNA-Seq data without a reference genome. Nat. Biotechnol. 29, 644–652. doi: 10.1038/nbt.1883
Hamaguchi, A., Suzuki, E., Murayama, K., Fujimura, T., Hikita, T., Iwabuchi, K., et al. (2003). Sphingosine-dependent protein kinase-1, directed to 14-3-3, is identified as the kinase domain of protein kinase C delta. J. Biol. Chem. 278, 41557–41565. doi: 10.1074/jbc.M305294200
Huang, L., Li, J., Anboukaria, H., Luo, Z., Zhao, M., and Wu, H. (2016). Comparative transcriptome analyses of seven anurans reveal functions and adaptations of amphibian skin. Sci. Rep. 6:24069. doi: 10.1038/srep24069
Kalinowski, S. T., Taper, M. L., and Marshall, T. C. (2007). Revising how the computer program CERVUS accommodates genotyping error increases success in paternity assignment. Mol. Ecol. 16, 1099–1106. doi: 10.1111/j.1365-294X.2007.03089.x
Kanehisa, M., Araki, M., Goto, S., Hattori, M., Hirakawa, M., Itoh, M., et al. (2008). KEGG for linking genomes to life and the environment. Nucleic Acids Res. 36, D480–D484. doi: 10.1093/nar/gkm882
Klett, E. L., Chen, S., Yechoor, A., Lih, F. B., and Coleman, R. A. (2017). Long-chain acyl-CoA synthetase isoforms differ in preferences for eicosanoid species and long-chain fatty acids. J. Lipid Res. 58, 884–894. doi: 10.1194/jlr.M072512
Knapp, R. T., Wong, M. J., Kollmannsberger, L. K., Gassen, N. C., Kretzschmar, A., Zschocke, J., et al. (2014). Hsp70 cochaperones HspBP1 and BAG-1M differentially regulate steroid hormone receptor function. PLoS One 9:e85415. doi: 10.1371/journal.pone.0085415
Kubièka, L., Schoøálková, T., Èervenka, J., and Kratochvíl, L. (2017). Ovarian control of growth and sexual size dimorphism in a male-larger gecko. J. Exp. Biol. 220, 787–795. doi: 10.1242/jeb.146597
Li, D. H. (1988). Preliminary observation on the reproduction of clams chinensis in the suburbs of Guiyang. Chin. J. Zool. 20–23. doi: 10.13859/j.cjz.1988.03.007
Li, H. Y., Cui, C., Shen, H. J., Zhu, Y. J., Chen, Z., and Chen, X. H. (2023). Morphological variation and its correlation with bioclimatic factors in Odorrana graminea sensu stricto. Front. Ecol. Evol. 11:1139995. doi: 10.3389/fevo.2023.1139995
Liao, H. H., Xu, F., and Yang, W. K. (2013). Sexual size dimorphism of amphibians and reptiles: A review. Chin. J. Ecol. 32, 3082–3093. doi: 10.13292/j.1000-4890.2013.0478
Liao, W. B., and Lu, X. (2011). comparison of reproductive output of the Omei Treefrog (Rhacophorus omeimontis) between high and low elevations. Anim. Biol. 61, 263–276. doi: 10.1163/157075511X584218
Liedtke, H. C., Gower, D. J., Wilkinson, M., and Gomez-Mestre, I. (2018). Macroevolutionary shift in the size of amphibian genomes and the role of life history and climate. Nat. Ecol. Evol. 2, 1792–1799. doi: 10.1038/s41559-018-0674-4
Luo, L. F., Xu, Z. S., Elgazzar, E. A. B. E., Du, H., Li, D. Y., Zhou, X. Y., et al. (2021). Comparative Transcriptome Analysis Revealed Genes Involved in Sexual and Polyploid Growth Dimorphisms in Loach (Misgurnus anguillicaudatus). Biology 10, 935. doi: 10.3390/biology10090935
Magistretti, P. J., and Allaman, I. (2015). A cellular perspective on brain energy metabolism and functional imaging. Neuron 86, 883–901. doi: 10.1016/j.neuron.2015.03.035
Mashek, D. G., Li, L. O., and Coleman, R. A. (2006). Rat long-chain acyl-CoA synthetase mRNA, protein, and activity vary in tissue distribution and in response to diet. J. Lipid Res. 47, 2004–2010. doi: 10.1194/jlr.M600150-JLR200
Michaeloudes, C., Kuo, C. H., Haji, G., Finch, D. K., Halayko, A. J., Kirkham, P., et al. (2017). Metabolic re-patterning in COPD airway smooth muscle cells. Eur. Respir. J. 50, 1700202. doi: 10.1183/13993003.00202-2017
Moriya, Y., Itoh, M., Okuda, S., Yoshizawa, A. C., and Kanehisa, M. (2007). KAAS: An automatic genome annotation and pathway reconstruction server. Nucleic Acids Res. 35, W182–W185. doi: 10.1093/nar/gkm321
Nali, R. C., Zamudio, K. R., Haddad, C. F. B., and Prado, C. P. A. (2014). Size-dependent selective mechanisms on males and females and the evolution of sexual size dimorphism in frogs. Am. Nat. 184, 727–740. doi: 10.1086/678455
Park, D., Jhon, D. Y., Kriz, R., Knopf, J., and Rhee, S. G. (1992). Cloning, sequencing, expression, and Gq-independent activation of phospholipase C-beta 2. J. Biol. Chem. 267, 16048–16055. doi: 10.1111/j.1432-1033.1992.tb17174.x
Patel, R. K., and Jain, M. (2012). NGS QC Toolkit: A toolkit for quality control of next generation sequencing data. PLoS One 7:e30619. doi: 10.1371/journal.pone.0030619
Pertea, G., Huang, X., Liang, F., Antonescu, V., Sultana, R., Karamycheva, S., et al. (2003). TIGR Gene Indices clustering tools (TGICL): A software system for fast clustering of large EST datasets. Bioinformatics 19, 651–652. doi: 10.1093/bioinformatics/btg034
Plaxton, W. (1996). The organization and regulation of plant glycolysis. Annu. Rev. Plant Physiol. 47, 185–214. doi: 10.1146/annurev.arplant.47.1.185
Qiao, L., Wen, G., Qi, Y., Lu, B., Hu, J., Song, Z., et al. (2018). Evolutionary melting pots and reproductive isolation: A ring-shaped diversification of an odorous frog (Odorrana margaratea) around the Sichuan Basin. Mol. Ecol. 27, 4888–4900. doi: 10.1111/mec.14899
Qiao, L., Yang, W., Fu, J., and Song, Z. (2013). Transcriptome profile of the green odorous Frog (Odorrana margaretae). PLoS One 8:e75211. doi: 10.1371/journal.pone.0075211
Qiao, L., Yang, W., Nie, H., and Hu, J. (2015). Isolation and characterization of 17 microsatellite DNA Loci for Odorrana margaretae (Anura: Ranidae). Asian Herpetol. Res. 6, 156–158. doi: 10.16373/j.cnki.ahr.140076
Reading, C. J. (2007). Linking global warming to amphibian decline through its effects on female body condition and survivorship. Oecologia 151, 125–131. doi: 10.1007/s00442-006-0558-1
Rice, W. R. (1989). Analyzing tables of statistical tests. Evolution 43, 223–225. doi: 10.1111/j.1558-5646.1989.tb04220.x
Rinn, J., and Snyder, M. (2005). Sexual dimorphism in mammalian gene expression. Trends Genet. 21, 298–305. doi: 10.1016/j.tig.2005.03.005
Roosterman, D., Meyerhof, W., and Cottrell, G. (2018). Proton transport chains in glucose metabolism: Mind the proton. Front. Neurosci. 12:404. doi: 10.3389/fnins.2018.00404
Shu, L., Qiu, J., and Räsänen, K. (2018). De novo oviduct transcriptome of the moor frog Rana arvalis: A quest for maternal effect candidate genes. PeerJ 6:e5452. doi: 10.7717/peerj.5452
Starostová, Z., Kubièka, L., Golinski, A., and Kratochvíl, L. (2013). Neither male gonadal androgens nor female reproductive costs drive development of sexual size dimorphism in lizards. J. Exp. Biol. 216, 1872–1880. doi: 10.1242/jeb.079442
Tall, E., Dormán, G., Garcia, P., Runnels, L., Shah, S., Chen, J., et al. (1997). Phosphoinositide binding specificity among phospholipase C isozymes as determined by photo-cross-linking to novel substrate and product analogs. Biochemistry 36, 7239–7248. doi: 10.1021/bi9702288
Trapnell, C., Williams, B. A., Pertea, G., Mortazavi, A., Kwan, G., van Baren, M. J., et al. (2010). Transcript assembly and quantification by RNA-Seq reveals unannotated transcripts and isoform switching during cell differentiation. Nat. Biotechnol. 28, 511–515. doi: 10.1038/nbt.1621
Untergasser, A., Cutcutache, I., Koressaar, T., Ye, J., Faircloth, B. C., Remm, M., et al. (2012). Primer3-new capabilities and interfaces. Nucleic Acids Res. 40:e115. doi: 10.1093/nar/gks596
van Oosterhout, C., Hutchinson, W. F., Wills, D. P. M., and Shipley, P. (2004). MICRO-CHECKER: Software for identifying and correcting genotyping errors in microsatellite data. Mol. Ecol. Notes 4, 535–538. doi: 10.1111/j.1471-8286.2004.00684.x
Varshney, R. K., Graner, A., and Sorrells, M. E. (2005). Genic microsatellite markers in plants: Features and applications. Trends Biotechnol. 23, 48–55. doi: 10.1016/j.tibtech.2004.11.005
Vasanthakumar, T., and Rubinstein, J. L. (2020). Structure and roles of V-type ATPases. Trends Biochem. Sci. 45, 295–307. doi: 10.1016/j.tibs.2019.12.007
Wang, L., Wu, D., Robinson, C. V., Wu, H., and Fu, T. M. (2020). Structures of a complete human V-ATPase reveal mechanisms of its assembly. Mol. Cell 80, 501–511. doi: 10.1016/j.molcel.2020.09.029
Wang, N., Wang, R., Wang, R., and Chen, S. (2018). Transcriptomics analysis revealing candidate networks and genes for the body size sexual dimorphism of Chinese tongue sole (Cynoglossus semilaevis). Funct. Integr. Genomics 18, 327–339. doi: 10.1007/s10142-018-0595-y
Weisrock, D. W., Hime, P. M., Nunziata, S. O., Jones, K. S., Murphy, M. O., Hotaling, S., et al. (2018). “Surmounting the large-genome “Problem” for genomic data generation in salamanders,” in Population genomics: wildlife, eds P. Hohenlohe and O. P. Rajora (Cham: Springer).
Wilson, D. (2017). Oxidative phosphorylation: Unique regulatory mechanism and role in metabolic homeostasis. J. Appl. Physiol. 122, 611–619. doi: 10.1152/japplphysiol.00715.2016
Wu, J., Cai, C. F., Cheng, F. Y., Cui, H. L., and Zhou, H. (2014). Characterisation and development of EST-SSR markers in tree peony using transcriptome sequences. Mol. Breed. 34, 1853–1866. doi: 10.1007/s11032-014-0144-x
Wu, J., Wang, W., Deng, D., Zhang, K., Peng, S., Xu, X., et al. (2019). Genetic diversity and phylogeography of Daphnia similoides sinensis located in the middle and lower reaches of the Yangtze River. Ecol. Evol. 9, 4362–4372. doi: 10.1002/ece3.4880
Xu, G., Li, J., Zhang, D., Su, T., Li, X., and Cui, S. (2021). HSP70 inhibits pig pituitary gonadotrophin synthesis and secretion by regulating the corticotropin-releasing hormone signaling pathway and targeting SMAD3. Domest. Anim. Endocrinol. 74:106533. doi: 10.1016/j.domaniend.2020.106533
Yagound, B., West, A. J., Richardson, M. F., Selechnik, D., Shine, R., and Rollins, L. A. (2022). Brain transcriptome analysis reveals gene expression differences associated with dispersal behaviour between range-front and range-core populations of invasive cane toads in Australia. Mol. Ecol. 31, 1700–1715. doi: 10.1111/mec.16347
Keywords: Odorrana graminea, sexual size dimorphisms, transcriptome, sex-differentially expressed genes, EST-SSR markers
Citation: Li H, He W, Wang T, Cui C, Zhang J and Chen X (2023) Comparative transcriptome analysis revealed genes involved in the sexual size dimorphisms and expressed sequence tag-Simple Sequence Repeat loci validation in Odorrana graminea. Front. Ecol. Evol. 11:1159037. doi: 10.3389/fevo.2023.1159037
Received: 05 February 2023; Accepted: 15 March 2023;
Published: 05 April 2023.
Edited by:
Liming Chang, Chengdu Institute of Biology (CAS), ChinaCopyright © 2023 Li, He, Wang, Cui, Zhang and Chen. This is an open-access article distributed under the terms of the Creative Commons Attribution License (CC BY). The use, distribution or reproduction in other forums is permitted, provided the original author(s) and the copyright owner(s) are credited and that the original publication in this journal is cited, in accordance with accepted academic practice. No use, distribution or reproduction is permitted which does not comply with these terms.
*Correspondence: Xiaohong Chen, eGhjaGVuX3h4QDE2My5jb20=; Jie Zhang, emhhbmdqaWUtMjAwNUAxNjMuY29t
Disclaimer: All claims expressed in this article are solely those of the authors and do not necessarily represent those of their affiliated organizations, or those of the publisher, the editors and the reviewers. Any product that may be evaluated in this article or claim that may be made by its manufacturer is not guaranteed or endorsed by the publisher.
Research integrity at Frontiers
Learn more about the work of our research integrity team to safeguard the quality of each article we publish.