 Chunsheng Wang
 Rui Zhang
 Lili Chang3
- 1International Institute for Earth System Science, Nanjing University, Nanjing, China
- 2Key Laboratory of Remote Sensing of Gansu Province, Heihe Remote Sensing Experimental Research Station, Northwest Institute of Eco-Environment and Resources, Chinese Academy of Sciences, Lanzhou, China
- 3Institute of Geophysics and Geomatics, China University of Geosciences, Wuhan, China
With the intensification of global change, the overall functions and structures of ecosystems in sub-humid to arid transition regions have changed to varying degrees. The Loess Plateau, as a typical case of such regions, plays a great role in the study of net primary productivity (NPP) for estimating the sustainability of the Earth’s carrying capacity in terrestrial ecosystem process monitoring. In the research on contrasting response mechanisms and ecological stress of NPP, the main innovations of this study are as follows. On the basis of the indicator system constructed from satellite imagery and meteorological data, we introduced deep multiple regressive models to reveal the relationship between NPP and the identified driving factors and then creatively proposed ecological stress (ES) evaluation models from the perspective of vegetation productivity. The findings are as follows: 1) From 2000 to 2019, the changes in driving factors presented a clear regional character, and the annual NPP maintained a fluctuating increasing trend (with a value of 4.57 g·m2·a−1). From the perspective of spatial distribution, the growth rate of NPP gradually increased from arid to sub-humid regions. 2) The effects of different driving factors on NPP changes and specific NPPs varied greatly across different regions. Arid and semi-arid regions were mainly controlled by precipitation (20.49%), temperature (15.21%), and other related factors, whereas sub-humid regions were mainly controlled by solar radiation, such as net surface solar radiation (NSSR) (8.71%) and surface effective radiation (SER) (7.93%). The main driving factors of NPP change varied under different soil conditions. 3) The spatio-temporal patterns of NPP approximated those of ES, but the effects of the latter significantly differed across ecological functional regions and land uses. This research on the Loess Plateau can serve as a valuable reference for future research on realizing ecosystem restoration and protection in sub-humid to arid transition regions.
1 Introduction
The eco-environment is a dynamic and balanced system of energy exchange and material circulation between the natural and human environments; it is also the essential condition for humankind’s survival and development and the foundation of socially sustainable development (Celiz et al., 2009; Mamat et al., 2014; Chang et al., 2019). The drastic changes in eco-environmental elements caused by global climate change have led to variations in solar radiation absorption by the underlying surface (Dale, 1997; Hadi et al., 2014), ultimately affecting the moisture and energy exchange between the atmosphere–earth systems in this region (Tapley et al., 2019). The current process of environmental degradation and ecological destruction has been aggravated by global climate change and human activities. Furthermore, environmental disasters and ecological catastrophes caused by environmental degradation and ecological destruction remain unmitigated, thereby posing major challenges to sustainable development. Therefore, mitigating the adverse effects of global climate change and human activities by changing the vulnerability of human–earth systems has become an important goal of global sustainable development (Guo et al., 2011; Wang et al., 2014).
The dramatic changes in hydrothermal conditions resulting from global change have dramatically affected some ecologically transitional regions, such as arid, semi-arid, and sub-humid regions (Carpenter et al., 1992). Both observations and modeling studies indicate that drying trends may occur most significantly in semi-arid and arid regions. The largest expansion of drylands has occurred in semi-arid regions since the early 1960s, which accounts for more than half of the total dryland expansion. The area of semi-arid regions in 1990–2004 is 7% larger than that during the years of 1948–1962 (Huang et al., 2016). The dryland expansion rate resulted in the drylands covering half of the global land surface by the end of this century (Feng and Zhang, 2015). As a result of global warming, dryland expansion further intensifies hydrological cycles, in which climatologically wet regions become wetter and dry regions become drier (Castello and Macedo, 2016; Schmeller et al., 2018). The largest expansion of drylands that has occurred in semi-arid regions since the early 1960s accounts for more than half of the total dryland expansion (Bouras et al., 2019). The ecosystems in such regions are fragile and sensitive to strong interactions between human activities and climate change (Hussain et al., 2018). The key consideration in reasonably monitoring ecological changes is to scientifically understand the driver-response mechanisms and spatio-temporal variations in ecological vulnerability (Ding et al., 2016).
Initially, climate change research in sub-humid to arid transition regions mainly focused on long-term scale variations, the relationship between climate change and human activities, and the development trends of climate change (Lyu et al., 2019; Tang and Hailu, 2020). The influence of radiation factors is mainly due to seasonal variations, the intervention effects of the climate system, and estimation methods. In recent years, research on the distribution and variation trend of net surface solar radiation and surface effective radiation has gained popularity. Affected by global change, climate variability has increased globally in the middle-high latitudes as the meteoric water line moves northward. In arid and semi-arid regions, the soil texture is relatively loose (Ragab and Prudhomme, 2002). Soil is the world’s most extensive terrestrial carbon sink system. Soil moisture conditions affect water uptake by plant roots and leaf transpiration, subsequently affecting dry matter accumulation. As rainfall intensity and total rainfall continue to increase, some areas now suffer from erosion, which is extremely detrimental to vegetation growth. Overall, climate change is mainly affected by changes in solar–terrestrial thermal radiation over the years, gradually intensifying in modern times due to human engineering activities (Maher, 2016; Gang et al., 2018; Li et al., 2019). Consequently, the scope of research on solar radiation, climatic factors, soil moisture factors, and land use in sub-humid to arid transition regions has become more extensive.
To quantify the status of the eco-environment, we introduced the concept of “ecological stress” (ES) in this study. ES is caused by disturbance—whether from human activities or natural events—that affects the standard structure and function of ecosystems (Dakos and Soler-Toscano, 2017). These disturbances often exceed ecosystem resilience, resulting in irreversible changes or even the collapse of entire ecosystems (Mumby and Van Woesik, 2014; Karaouzas et al., 2018). In a broad sense, ESs can be summarized as the factors causing ecosystem change, reaction, or dysfunction. The ecological stress index (ESI) is a function of ecosystem sensitivity and adaptability to environmental changes (Seddon et al., 2016; Zhu et al., 2021). On the one hand, we refer to “sensitivity” as the degree to which a system is affected by disturbances during normal operation. For example, an ecosystem that is highly sensitive to changes in temperature may experience significant changes in the distribution and abundance of species if the climate warms or cools rapidly (Shi et al., 2018). On the other hand, we define “adaptability” as the ability of ecosystems to restore or maintain their structures from external disturbances (Zhang et al., 2021). Within a certain period, the variability tendency of an ecosystem can be used to measure its degree of deviation from the steady state. Increased variability indicates that a system is adapting to environmental changes and experiencing greater ES (Guan et al., 2017).
Net primary productivity (NPP) is an important index for measuring the functions and fluctuations of ecosystems (Huang, 2019; Xiao et al., 2019). The NPP of vegetation is the remaining portion of the total organic dry matter produced by photosynthesis on per unit time and unit area by green plants after deducting autotrophic respiration; it includes the production of plant branches, leaves, and roots and the dead fraction of plants (Naeem et al., 2021). As a key quantity to characterize vegetation vigor, NPP serves as the basis of not only energy and material cycling in organisms but also energy and material flow in ecosystems. NPP is also a crucial parameter of terrestrial ecological processes and is used to estimate the sustainability of the Earth’s carrying capacity (Sun et al., 2015). Many scholars in China and abroad have used different methods to study the impacts of ES on NPP. This approach allows us to demonstrate the ability of the ecosystem to respond to changes in solar radiation, climatic factors, soil moisture factors, and land uses and determine the magnitude and range of such changes.
Several important places in China require NPP research. The Loess Plateau in sub-humid to arid transition regions, which features crisscrossing ravines and gullies (Chen et al., 2007), is a unique geographical unit in China and the world (Li et al., 2009). The eco-environment problems in the Loess Plateau are complicated. Under the influence of global change (Jorda-Capdevila et al., 2019; Weber et al., 2019), the heat and moisture exchanges in the region have been dramatically altered, and the exchange process has become more complex. The eco-environmental drivers that have caused such an impact (Zheng et al., 2019; Feng et al., 2020), including biological productivity and other factors, have resulted in varying degrees of responses (Hessel et al., 2003; Yurui et al., 2021). In this process, the driving factors play varying roles in NPP at different time scales. Therefore, a systematic, long-term, and predictable evaluation system for the Loess Plateau from an overall perspective must be established using existing remote sensing technology. Understanding the influence of global change mechanisms on NPP change is important because it allows us to grasp the trends of NPP change and take practical actions to mitigate its negative impacts.
The objectives of our study are as follows: 1) to explore the spatio-temporal pattern and evolution process of NPP in sub-humid to arid transition regions; 2) to elucidate the response mechanism between NPP and driving factors consisting of land use and radiation, climate, soil, and moisture factors; and 3) to determine the ES of ecological functional regions and land use in the study area.
2 Study area and data
2.1 Study area
The Loess Plateau (33°43′–41°16′N, 104°54′–114°33′E) has an area of 6.4 × 10⁵ km2 (Huang et al., 2008). It covers most parts of the provinces of Gansu, Shaanxi, and Shanxi; the autonomous region of Ningxia Hui; and parts of Qinghai, Henan, and Inner Mongolia (Figures 1A, B). The plateau has a complicated topography, varying in elevation from 61 to 5,181 m. Several large tributaries of the Yellow River, such as the Wei River and Fen River, run through the study area (Figure 1B). The climate in the area has typical continental characteristics and can be subcategorized as arid, semi-arid, and sub-humid continental climatic zones from northwest to southeast (Figure 1C). Both annual mean temperature and annual total precipitation showed a spatial distribution gradient pattern of high southeast and low northwest, decreasing from 19.29°C to 1.94°C and 838.07 to 132.45 mm. During the summer months, most of the annual precipitation (55%–78%) occurs in the form of heavy rainstorms (Zhao et al., 2013). The part of the Loess Plateau covered by the study area has six landform types: Gully Region, Irrigated Region, Rocky Mountain Region, Tibba and Desert Region, and Valley Plain Region (Figure 1D). The spatial precipitation distribution shows a high southeast and low northwest distribution, corresponding to a decrease from 838.07 to 132.45 mm (Feng et al., 2016). The natural vegetation has low coverage, and the complex edaphic and hydrothermal conditions of the plateau contribute to the complexity of its ecological environment, further aggravating the ES in the area (Sun, 2002; Zheng, 2006).
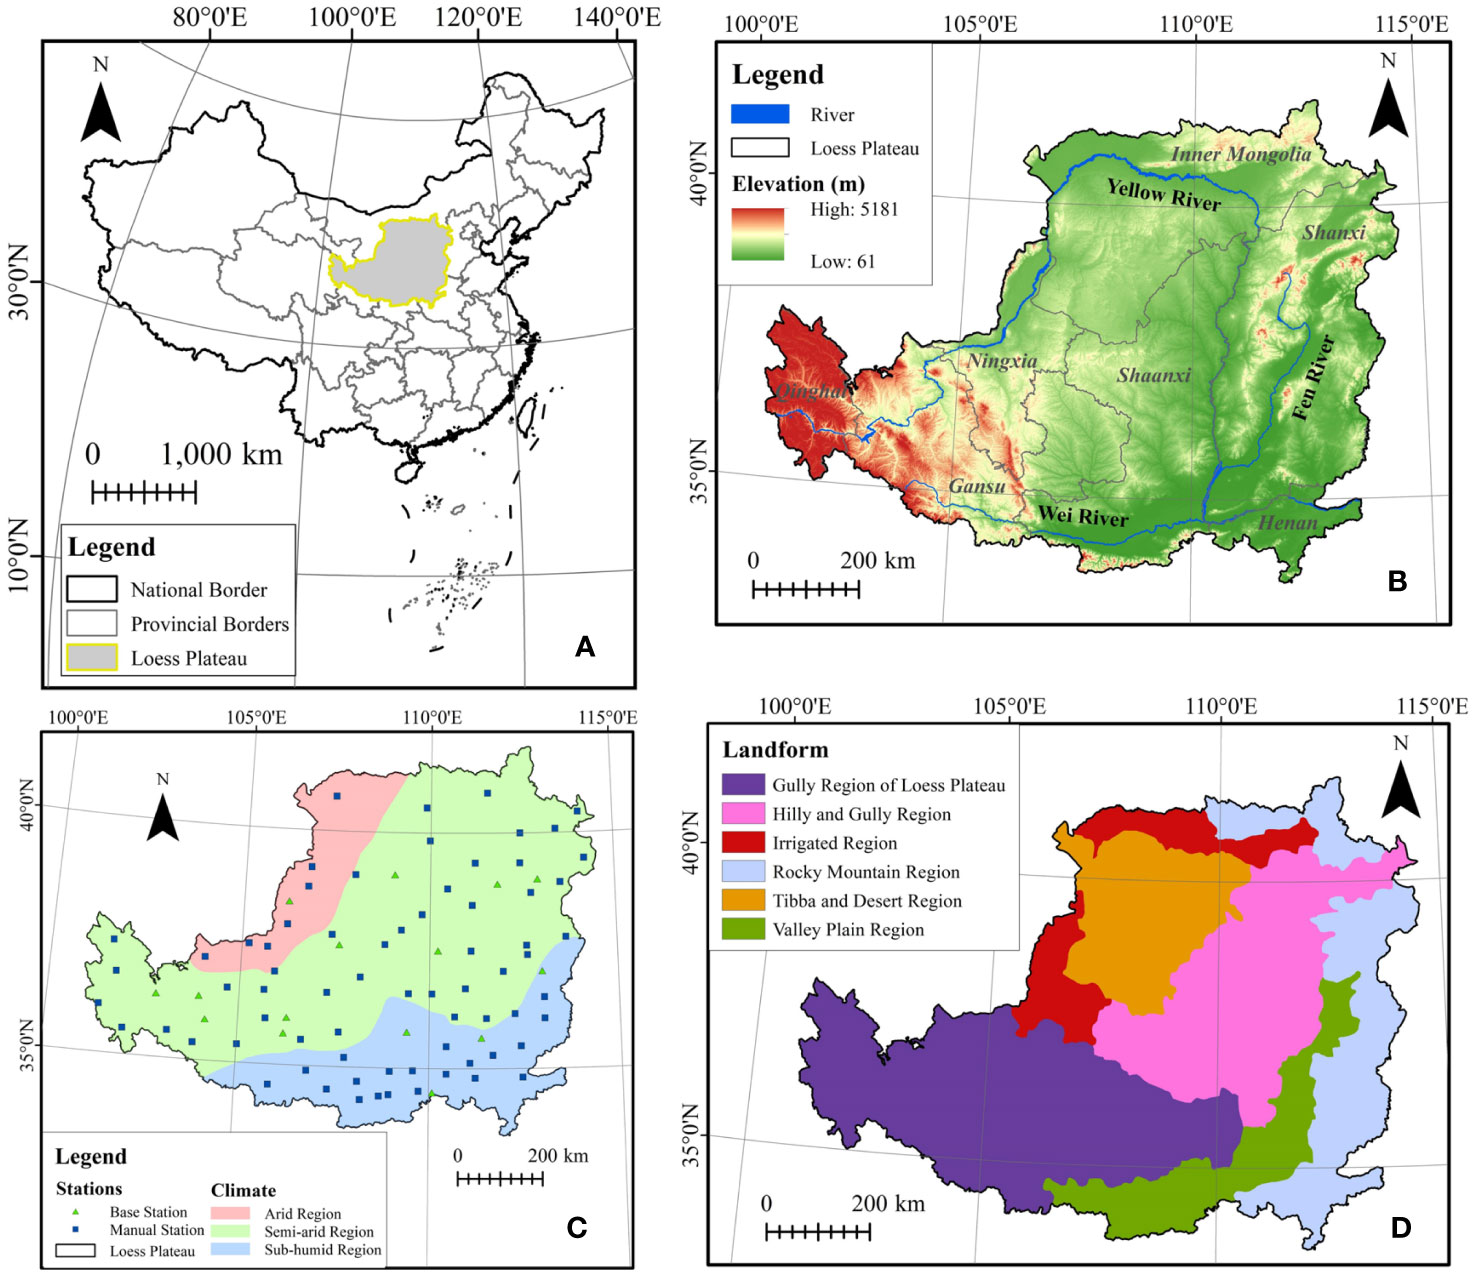
Figure 1 Overview of the Loess Plateau. (A) Location of the plateau, (B) distribution of major river systems and topography, (C) major climate regional distribution, and (D) landform of the plateau.
2.2 Data sources
2.2.1 Remote sensing datasets
Among the numerous data download platforms, Google Earth Engine (GEE) has a data catalog of remote sensing images and geospatial and other environmental datasets that are available to the public and can be freely accessed online (Xiong et al., 2017; Tamiminia et al., 2020). Cloud-based computing platforms have allowed remote sensing data to become more accessible (Ramírez-Cuesta et al., 2018; Zhao et al., 2019; Jiao and Mu, 2022). In terrestrial ecosystem monitoring, MODIS has been widely used in ecological environment remote sensing monitoring and ground physiological parameter inversion (Zhang et al., 2003). MODIS is carried on Terra and Aqua satellite platforms for monitoring the terrestrial ecosystem from the NASA Earth Observing System (EOS) program. MODIS provides near-global coverage in 1–2 days and has 36 spectral bands covering the spectral range from 0.4 to 15 μm, which can study the ecological pressure on the Loess Plateau as a large-scale and long time series (Justice et al., 2002; Xiong and Barnes, 2006). The global land data assimilation system (GLDAS) ingests satellite and ground-based observational data products. It generates optimal fields of land surface states and fluxes using advanced land surface modeling and data assimilation techniques, which are used to process the soil moisture data products.
MODIS multiband data can provide information on surface conditions and biogeographic characteristics; it can also be used to observe NPP on the Loess Plateau (Remer et al., 2005; Ghimire et al., 2018). We extracted the soil moisture and bare soil evaporation data for NPP correlation analysis. Then, the images selected for downloading and processing included MYD09GA, MOD11A2, MCD12Q1, MCD43A3, and MOD17A3HGF of MODIS (Table 1) and SoilMoi0_10cm_inst and ESoil_tavg of GLDAS (Table 2). Tables 1, 2 also demonstrate the inversions and applications of the above products. Therefore, MODIS was primarily involved in the construction of solar radiation and land use, while GLDAS was applied to the soil moisture factors. In the case the data sources for different driving factors are not consistent, we resampled the images with resolutions of 250 and 1,000 m to a uniform resolution of 500 m for NPP calculations.

Table 1 MODIS image products of different levels and their applications.
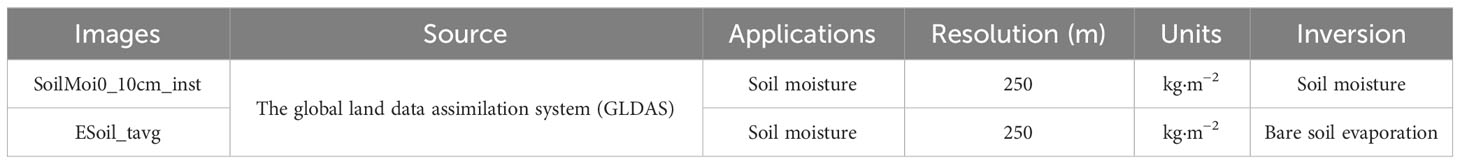
Table 2 GLDAS image products of different levels and their applications.
2.2.2 Atmospheric data
The dataset downloaded from the China Meteorological Data Service Center (CMDSC) (http://data.cma.cn/) included daily observation data, such as temperature, evaporation, and precipitation, obtained by the National Meteorological Information Center through the domestic communication system at the China Ground International Exchange Station (Lam et al., 2005; Ying et al., 2014). The study area has 86 meteorological stations, ranging in altitude from 333 to 2,850 m. The meteorological data were obtained daily from 2000 to 2019. First, the missing values from the meteorological data were excluded, which are not involved in the calculation of the climatic factors. After that, the daily data were accumulated or calculated to the monthly data. On this basis, the temporal resolution of the meteorological data for each station was set to annual based on the calculations of yearly data. Meanwhile, using ArcGIS Pro geographic information software, kriging interpolation analysis on the data of each station was conducted to eliminate the effects of missing values. To harmonize with other driving factors, the resolution of climatic factors was set to 500 m. The distribution of the observation stations is presented in Figure 1C.
2.3 Driving factors
To comprehensively evaluate the response mechanism and ES of NPP, we established an indicator system that consisted of different driving factors: solar radiation, climatic factors, soil moisture factors, and land use based on system science theory (Eckholm, 1975; Walter et al., 2013; Lin et al., 2020). In the process, the resampling methods take into account the contributions of different factors to standardize the spatial resolutions of various driving factors to a uniform resolution for subsequent data processing and analysis. Detailed descriptions of the indicator system are provided in Figure 2 and Table 3.
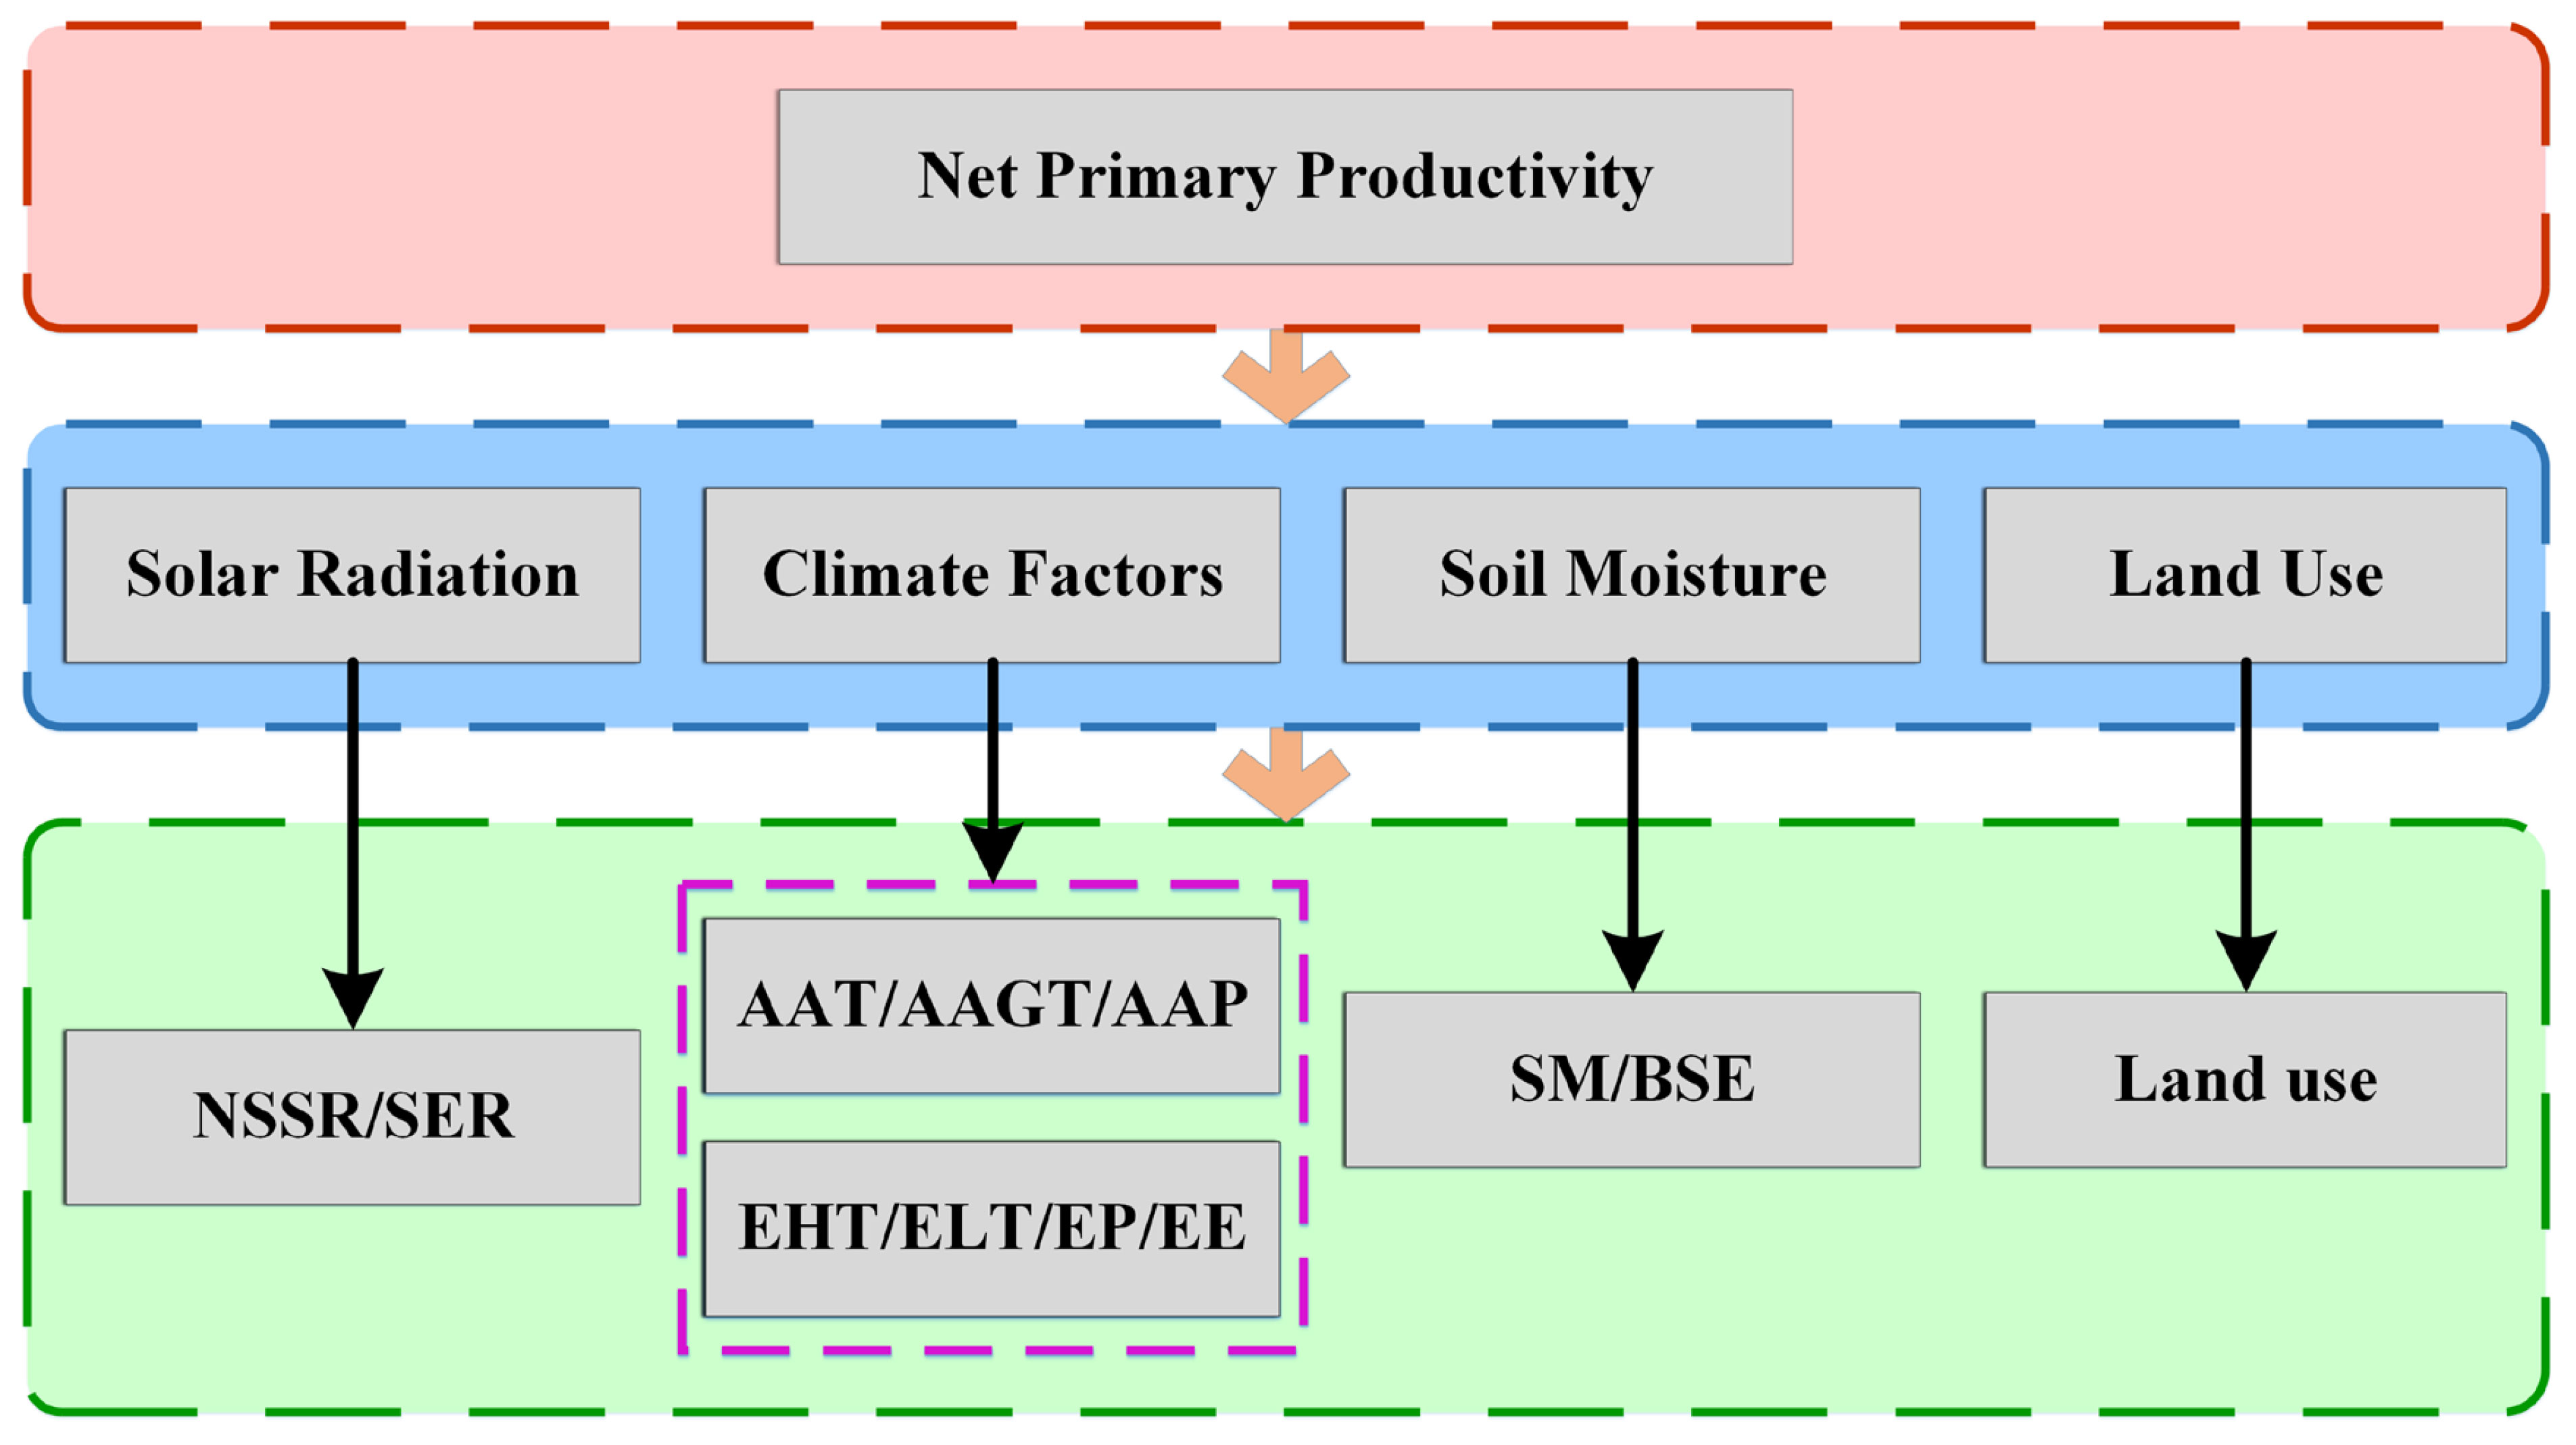
Figure 2 Indicator system constructed for comparing the response mechanisms of net primary productivity (NPP).
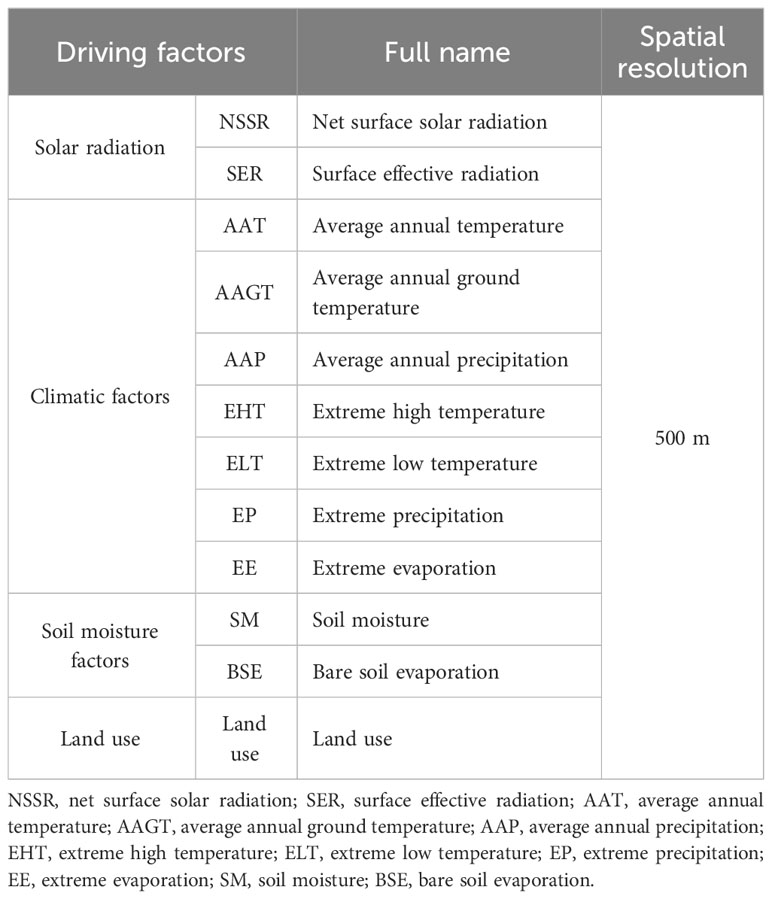
Table 3 Key parameters of the driving factors.
1) Solar radiation: the drastic change in solar radiation affects the moisture and energy exchange between the atmosphere and earth systems. As shown in Eqs. (1) and (2), we selected net surface solar radiation (NSSR) (Figure 3A) and surface effective radiation (SER) (Figure 3B) to quantify the changing processes of radiation factors (Qu Scotto et al., 1988; Kaufman et al., 1997). NSSR refers to the balance between the amount of sunlight absorbed by the Earth’s surface and the amount of sunlight reflected back into the atmosphere (Alados et al., 2003).
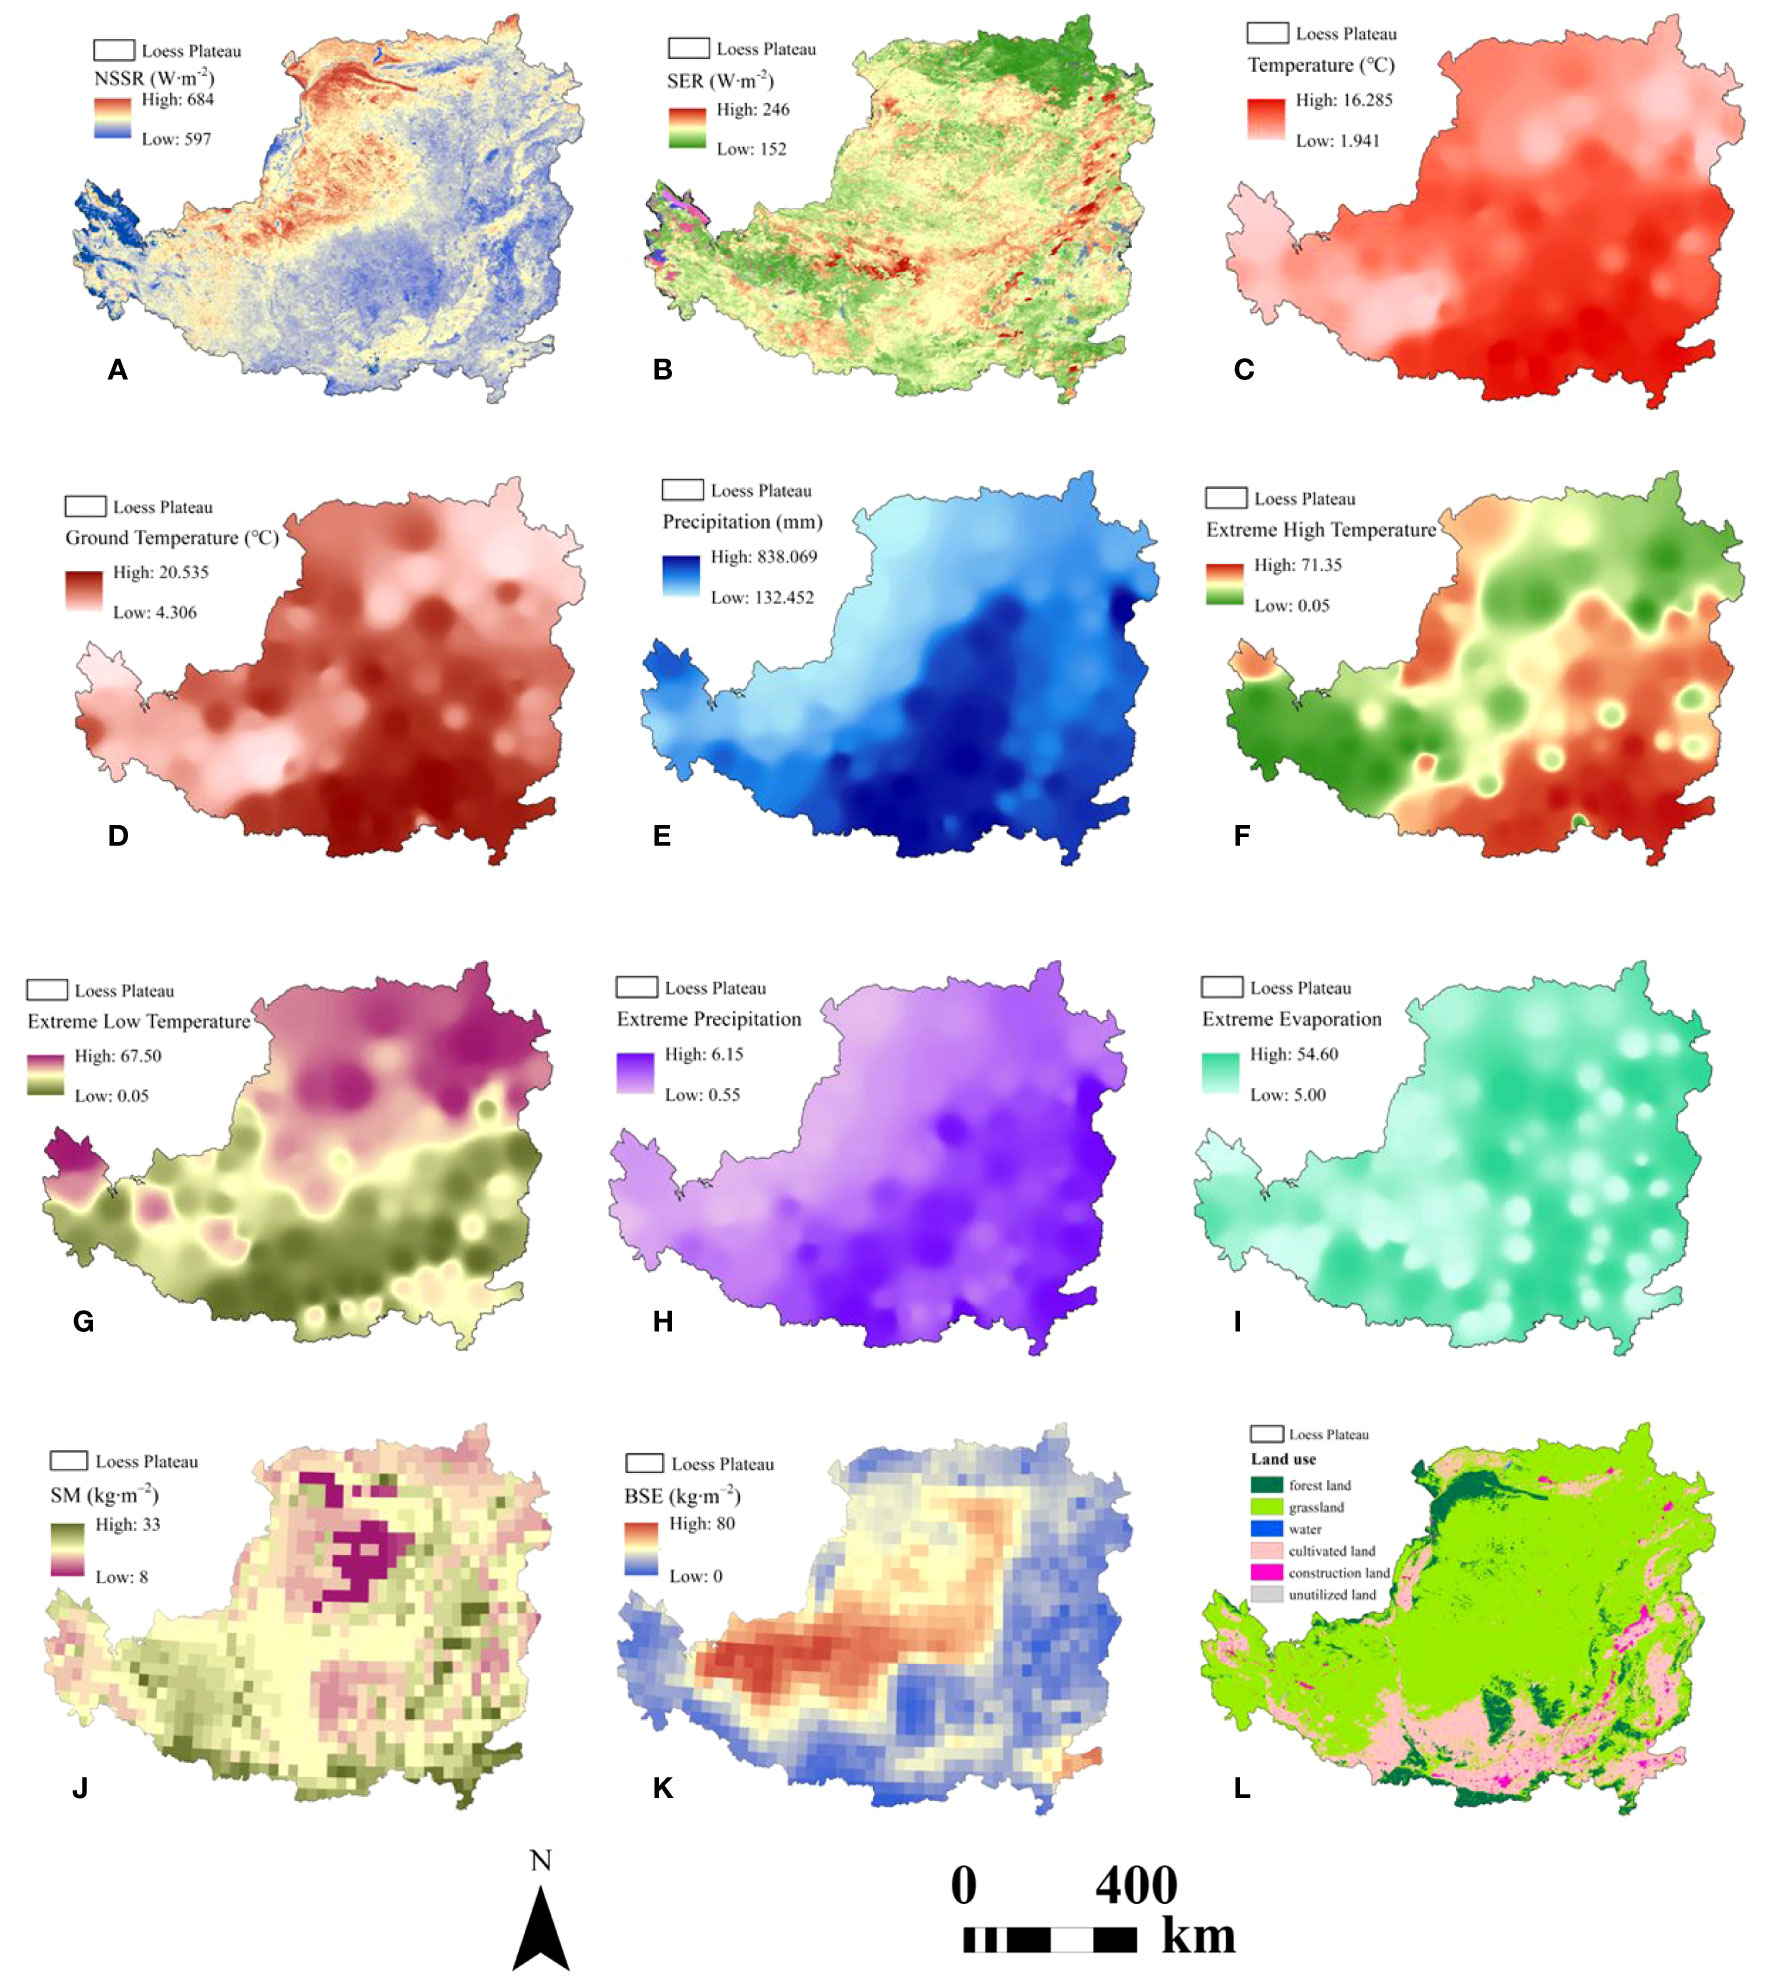
Figure 3 Driving factors consisting of solar radiation, climatic factors, and land use. (A) NSSR, (B) SER, (C) AAT, (D) AAGT, (E) AAP, (F) EHT, (G) ELT, (H) EP, (I) EE, (J) SM, (K) BSE, and (L) land use. NSSR, net surface solar radiation; SER, surface effective radiation; AAT, average annual temperature; AAGT, average annual ground temperature; AAP, average annual precipitation; EHT, extreme high temperature; ELT, extreme low temperature; EP, extreme precipitation; EE, extreme evaporation; SM, soil moisture; BSE, bare soil evaporation.
where is the instantaneous NSSR; and are the downward atmospheric short-wave and long-wave radiation, respectively; is the upward atmospheric long-wave radiation; and albedo is the land surface albedo. SER represents the difference between long-wave radiation and atmospheric inverse radiation, i.e., the actual heat loss of the ground through long-wave radiation exchange (Sievenpiper, 2005).
where is the Stefan–Boltzmann constant, is the air temperature in K, is the mean vapor pressure (mm), and is the percentage of sunshine.
2) Climatic factors: we assessed six climatic factors, four associated with temperature and two associated with the hydrologic cycle (Stevens et al., 2018; Hoegh-Guldberg et al., 2019). We interpolated the meteorological factors by kriging with a spatial resolution of 500 m. The selected climate indexes, including average annual temperature (AAT; Figure 3C), average annual ground temperature (AAGT; Figure 3D), and average annual precipitation (AAP; Figure 3E), can be calculated annually (Leifeld and Menichetti, 2018; Su et al., 2020). In addition, we selected extreme high temperature (EHT; Figure 3F), extreme low temperature (ELT; Figure 3G), extreme precipitation (EP; Figure 3H), and extreme evaporation (EE; Figure 3I) to better understand the changes in extreme climate events. Here, the units of EHT and ELT are days, and the units of EP and EE are percentages (%).
3) Soil moisture factors: soil moisture is directly related to the dynamic changes in plant photosynthesis and respiration; it is the water resource used by vegetation for growth. Especially in transition regions, soil moisture provides favorable conditions for the sustainable growth of plants. Thus, soil moisture is more important than the impact of a single precipitation event on plants. Furthermore, soil moisture profoundly affects the structures of vegetation communities and ecological functions. Therefore, understanding the spatio-temporal variations in soil moisture is crucial for regulating vegetation productivity and controlling terrestrial carbon uptake. Soil moisture conditions can be divided into soil moisture (SM; Figure 3J) and bare soil evaporation (BSE; Figure 3K).
4) Land use: land use change is an important factor affecting global climate change (Figure 3L). It directly affects the energy and material exchange between the atmosphere and land surface and the physical properties and energy balance of the land surface (Chen et al., 2001). Thus, land use change has an important influence on climate change (Ostwald and Chen, 2006; Wang et al., 2011). Land use changes with large-scale vegetation characteristics indirectly affect the albedo of the Earth’s surface and further cause changes in the physical characteristics of the Earth’s surface, such as long-wave radiation from the surface to the atmosphere and soil moisture, which can represent changes in NPP of terrestrial ecosystems.
3 Methods
This section describes the problem of multiple linear regression from the perspective of deep learning. Thus, deep multiple regression models are introduced to reveal the relationship between the driving factors and NPP. Then, an ES evaluation model established from the perspective of NPP is discussed.
3.1 Response relation model
We used the deep multiple regression model to solve the problem of NPP fitting by multiple drivers (Sun et al., 2016; Zhang et al., 2019). The algorithm used in this study was the stacked denoising auto-encoder (SDAE), which was developed based on a denoising auto-encoder (DAE) that could learn the original data’s characteristics through encoding and decoding and identify the more complex variation characteristics of the driver factors (Fazio et al., 2020). The SDAE is a typical deep learning model (Figure 4) with a learning process that is divided into two parts: an encoding process and a decoding process. When parameters are inputted into the stochastic gradient descent (SGD) algorithm, they are updated in the opposite direction of the gradient, and then relevant errors are derived until convergence is reached. The auto-encoder can realize the feature transformation of the original input through unsupervised learning, especially since various types of information in the real world have certain noise levels. The top layer of the SDAE can join classifiers or regressions to achieve supervised learning tasks. Furthermore, the SDAE can reconstruct the original input data from multiple driving factors with noise. Past works have shown that this approach is robust and can perform various tasks.
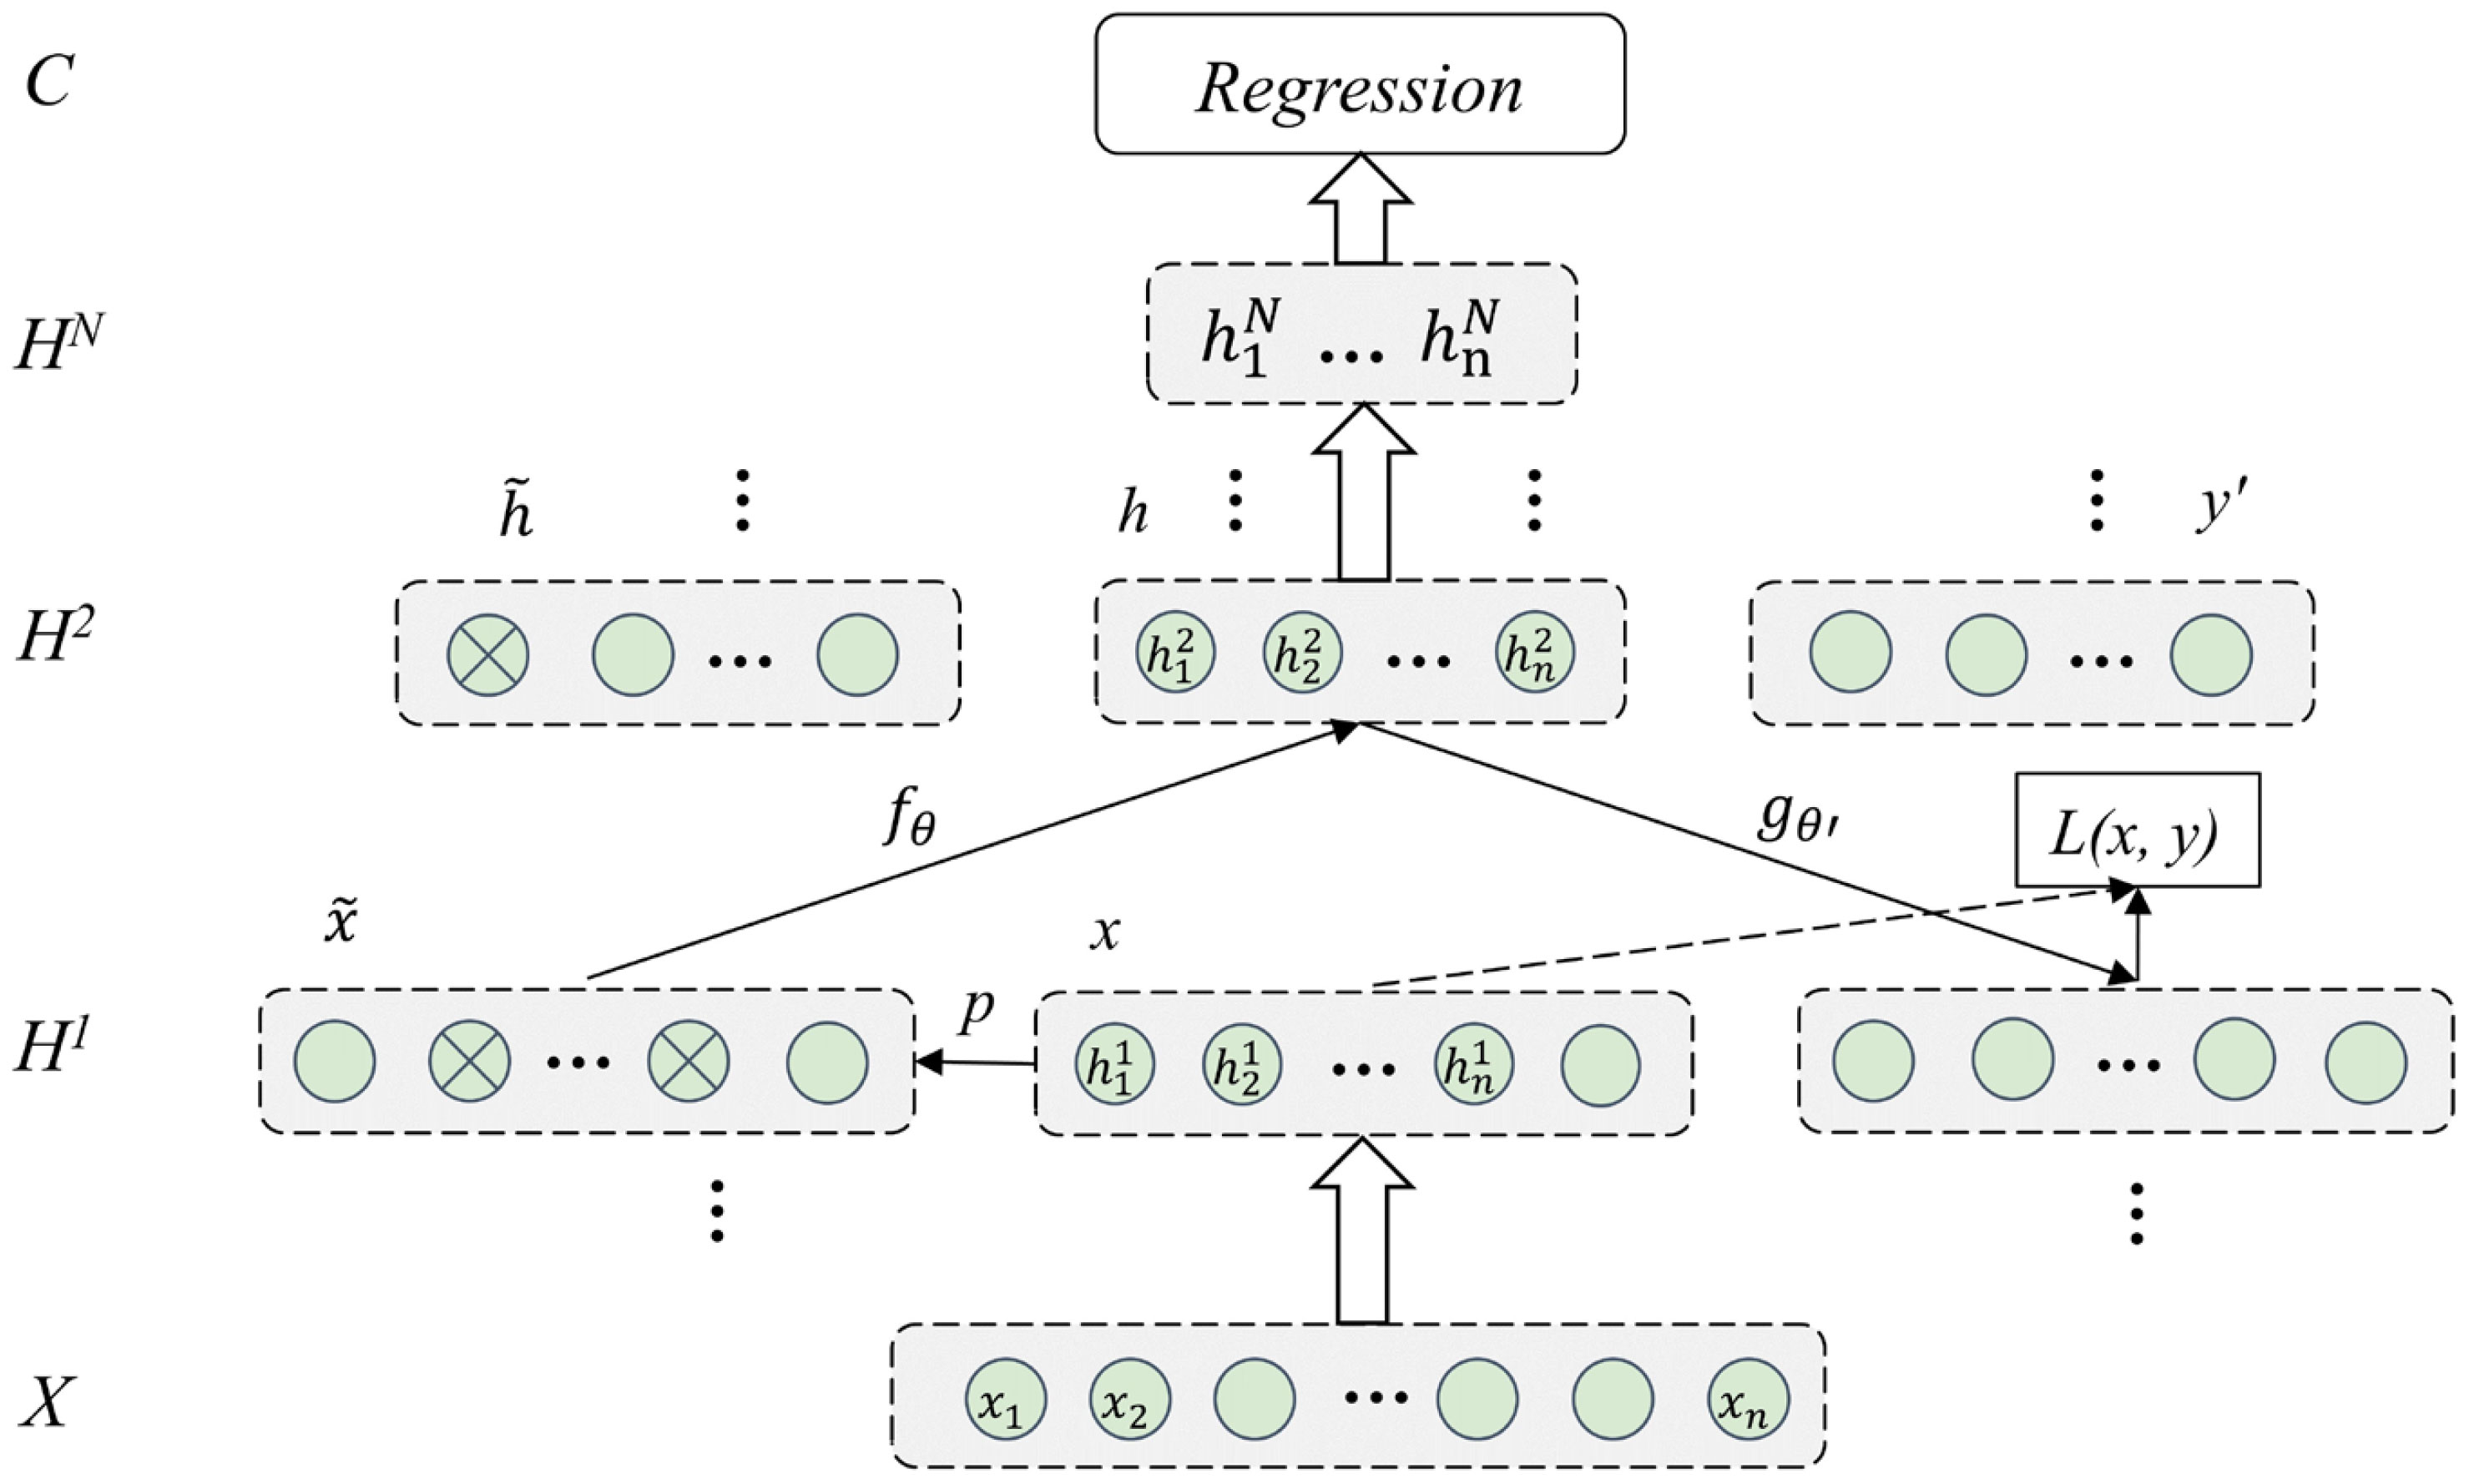
Figure 4 Structural network diagram of the SDAE. SDAE, stacked denoising auto-encoder.
We conducted a single-correlation analysis of the NPP and driving factors in the Loess Plateau. The variables included radiation factors, climatic factors, soil moisture factors, and land use. Normalized deviation (ND) and root mean square error (RMSE) were employed to evaluate the single-correlation coefficients, with the calculation procedure given by Eqs. (3) and (4), respectively. Relative contribution rate (RCR) is the degree to which a variable contributes to the total amount of change in the whole process of change, and it is used to analyze the degree to which each variable contributes to the whole dataset. As shown in Eq. (5), the higher the relative contribution of the independent variable, the more it explains the dependent variable.
where is the real value; is the predicted median value for item i at time t, with the sums integrating all items and all time points in the prediction period; T is the total time; is the initial time; denotes the absolute value of the trend in NPP; and d represents each driving factor.
We also introduced the multiple-correlation coefficient to study the comprehensive correlation between NPP and significant correlation drivers (Lu et al., 2017). A complex correlation represents a correlation of a single element with several variables (Wang et al., 2019). In practical applications, complex correlation analysis is often associated with multiple-correlation analysis. Here, the multiple-correlation coefficient is expressed as , as shown in Eq. (6). It is also known as the product moment coefficient of correlation, a statistical indicator that expresses the degree and direction of linear correlation between two variables. The multiple-correlation coefficient is a dimensionless statistical indicator that takes values in the range [−1, 1]. The larger the , the closer the correlation between NPP and the driving factors, which is also tested for the t significance test.
where is the correlation coefficient between NPP and each driving factor for the Loess Plateau; and are the drivers and NPP values in year i, respectively; and and are the average values of the drivers and NPP of n years, respectively. When p < 0.05 of the t significance test, the NPP shows a significant correlation with driving factors.
3.2 Ecological stress evaluation model
The Loess Plateau is in the sub-humid to arid transition region. Under the action of the driving factors, each factor in the ecosystem will have a reaction, and the comprehensive response results of each factor have a final impact on the eco-environment of the plateau (Walter et al., 2013; Yao et al., 2019). On the basis of the driving factors of the eco-environment, we comprehensively evaluated the stress level of the Loess Plateau’s eco-environment under the action of different driving factors. Subsequently, we established a comprehensive quantification process of system sensitivity and adaptability.
In this study, we set NPP as an ecosystem function characteristic quantity. Therefore, the interannual fluctuation in NPP represents the adaptability of the ecosystem from 2000 to 2019, thereby reflecting the degree of dispersion of NPP to the mean value (Jorda-Capdevila et al., 2019). Ecosystem adaptation is expressed as the slope of the linear fitting trend line of the interannual change in NPP from 2000 to 2019. To calculate and analyze the regional differences in vulnerability, we standardized the calculation results of sensitivity and adaptability. The ESI formula can be expressed as:
where V is the ESI of the ecosystem; S is the sensitivity of the system; A is the adaptability of the system; i denotes year i; represents the value of NPP in period i; represents the average NPP in period N; x is the time series of the ecosystem; and y is the interannual variability of NPP.
4 Results
4.1 Spatio-temporal variation analysis of the driving factors and NPP
4.1.1 Analysis of the driving factors in the past 20 years
To facilitate the statistical analysis, we assigned 86 meteorological stations for the values of NSSR and SER. The abovementioned factors were analyzed in July of each year (Figures 5A, B). The results indicate that the values of all meteorological stations fluctuated in the past 20 years, with the values of different regions showing great variations. In particular, 33 stations have an increase greater than 0.05 W·m−2·a−1, while 21 stations have an increase between 0 and 0.05 W·m−2·a−1. The maximum increase is 0.3628 W·m−2·a−1. SER is the actual heat loss of the ground through long-wave radiation exchange; here, was calculated on the basis of the AAT and AAP. The results revealed the values on a downtrend; however, there were two stations in the study area where decreased by more than 5 W·m−2·a−1, while 38 stations showed an increase of more than 5 W·m−2·a−1.
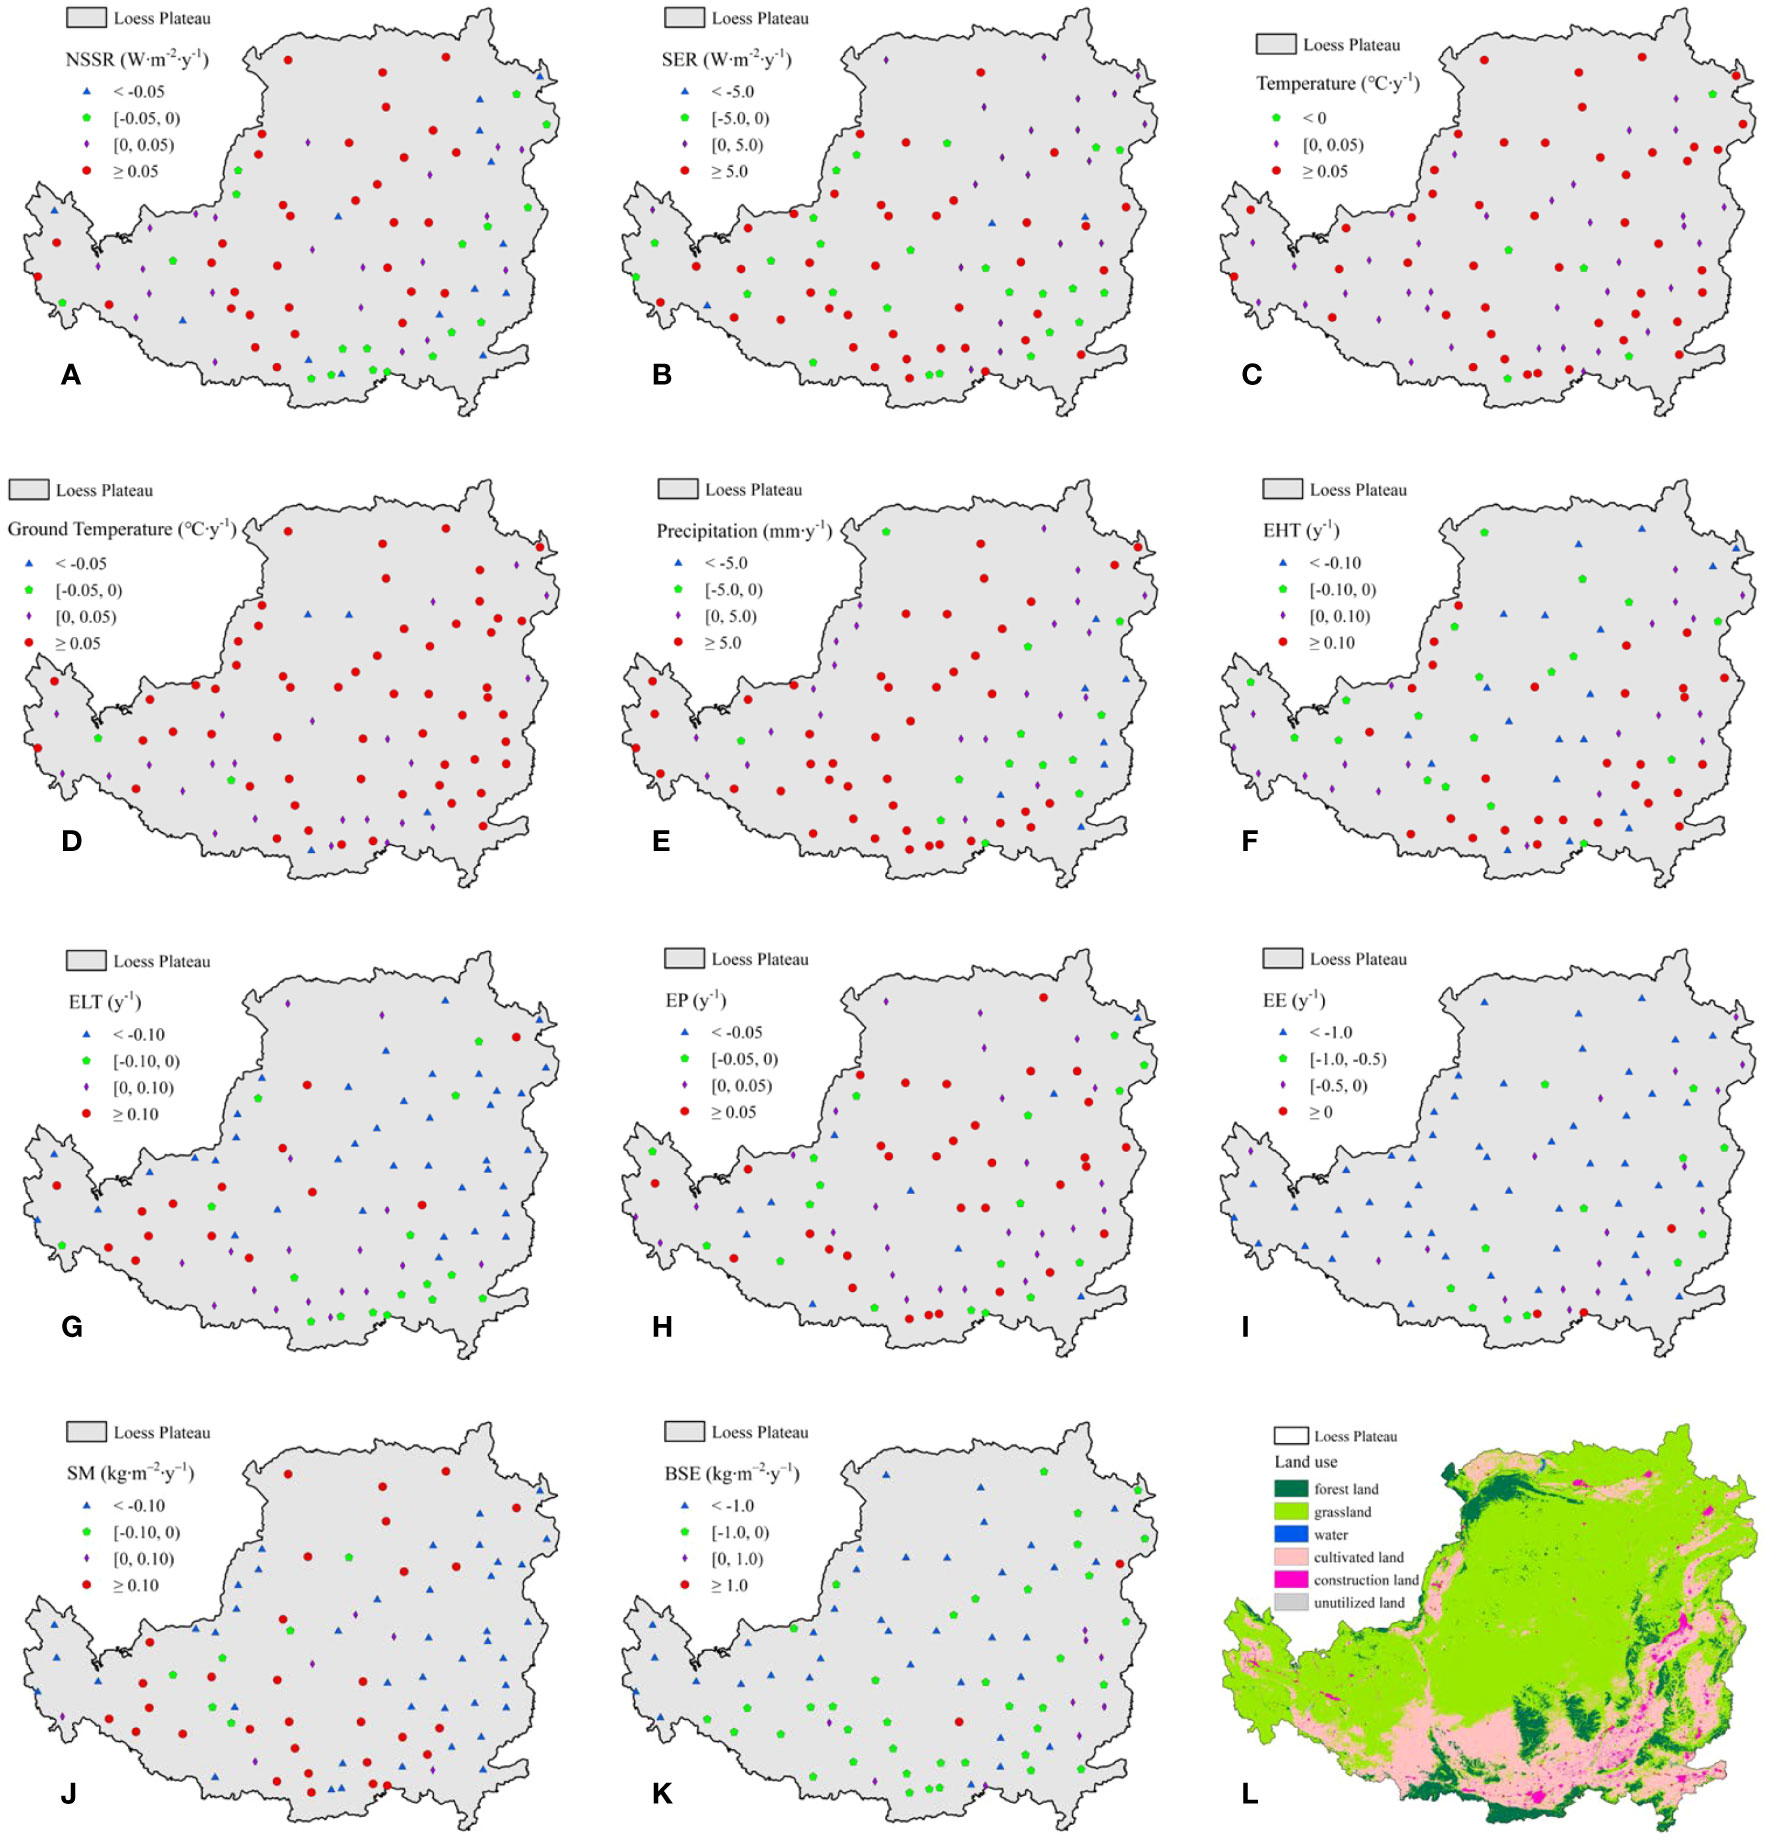
Figure 5 Changes in the driving factors consisting of solar radiation, climatic factors, soil moisture factors, and land use. (A) NSSR, (B) SER, (C) AAT, (D) AAGT, (E) AAP, (F) EHT, (G) ELT, (H) EP, (I) EE, (J) SM, (K) BSE, and (L) land use. NSSR, net surface solar radiation; SER, surface effective radiation; AAT, average annual temperature; AAGT, average annual ground temperature; AAP, average annual precipitation; EHT, extreme high temperature; ELT, extreme low temperature; EP, extreme precipitation; EE, extreme evaporation; SM, soil moisture; BSE, bare soil evaporation.
Over the 20 years from 2000 to 2019, the change rates of AAT, AAGT, and AAP were 0.0337°C·a−1, 0.0623°C·a−1, and 4.0701 mm·a−1, as shown in Figures 5C–E, respectively. Among 86 stations, only five showed a decline in AAT over 20 years. Conversely, the AAT increase was greater than 0.02°C·a−1 at 44 stations, with the largest increase being 0.1394°C·a−1. The change trend of AAGT was similar to that of AAT; only a small number of stations showed a downtrend, and 57 stations had a rate of change greater than 0.02°C·a−1.
In the last 20 years, the AAP values and change rates in the west and south of the study area were generally greater than those in other regions. The temperature and precipitation fluctuations in the Loess Plateau increased along with changes in ground temperature, evaporation, and relative humidity. Under extreme climatic factors, we calculated the frequency of each extreme factor and the corresponding extreme value. The comprehensive EHT (Figure 5F) and ELT (Figure 5G), similar to the overall temperature in the study area, increased. The extreme low-temperature weather was gradually reduced, and the extreme high temperature in the study area did not show an uptrend. However, the change in extreme weather across different regions was obvious. The maximum value of EP (Figure 5H) generally showed a downtrend, although its frequency was increasing. By contrast, EE (Figure 5I) first decreased and then increased.
On the Loess Plateau, the retention capacity of soil moisture (Figure 5J) in the study area increased, whereas evaporation from bare land decreased (Figure 5K). From 2000 to 2019, the land use structure (Figure 5L) of the plateau did not change significantly. Among them, the areas of cultivated land, grassland, water, and unutilized land decreased, while the areas of forestland and construction land increased. This phenomenon demonstrates the overall change in characteristics of land use on the plateau. The proportions of cultivated land, forestland, grassland, water, construction land, and unutilized land in the total area changed from 32.79%, 14.76%, 42.18%, 1.43%, 1.97%, and 6.87% in 2000 to 32.13%, 15.41%, 41.52%, 1.41%, 2.94%, and 6.59% in 2019, respectively. Overall, the changes in land use and macro-ecological conditions in the Loess Plateau were mainly driven by human activities and climate change in the early stage and then exacerbated by the impact of ecological engineering.
4.1.2 Spatio-temporal variations in NPP
The annual NPP (ANPP) in the Loess Plateau was the lowest in 2000 at 179 g·m2·a−1 and the highest in 2018 at 304 g·m2·a−1. The annual average NPP (AANPP) value over 20 years was 246 g·m2·a−1, in which the AANPP value for 2000–2009 was lower than that for 2010–2019. After 2007, ANPP generally maintained an uptrend, increasing significantly from 2000 to 2019 (Figure 6A). This phenomenon represents an overall uptrend over 20 years, with an annual growth rate of 4.57 g·m2·a−1. This result also indicates that the carbon sequestration capacity of vegetation was enhanced. The proportion of areas with NPPs of 100–200, 200–500, and greater than 500 g·m2·a−1 increased from 31.45%, 19.27%, and 1.34% in 2000 to 46.93%, 30.29%, and 4.63% in 2019, respectively (Figure 6B). In summary, the NPP values show an uptrend.
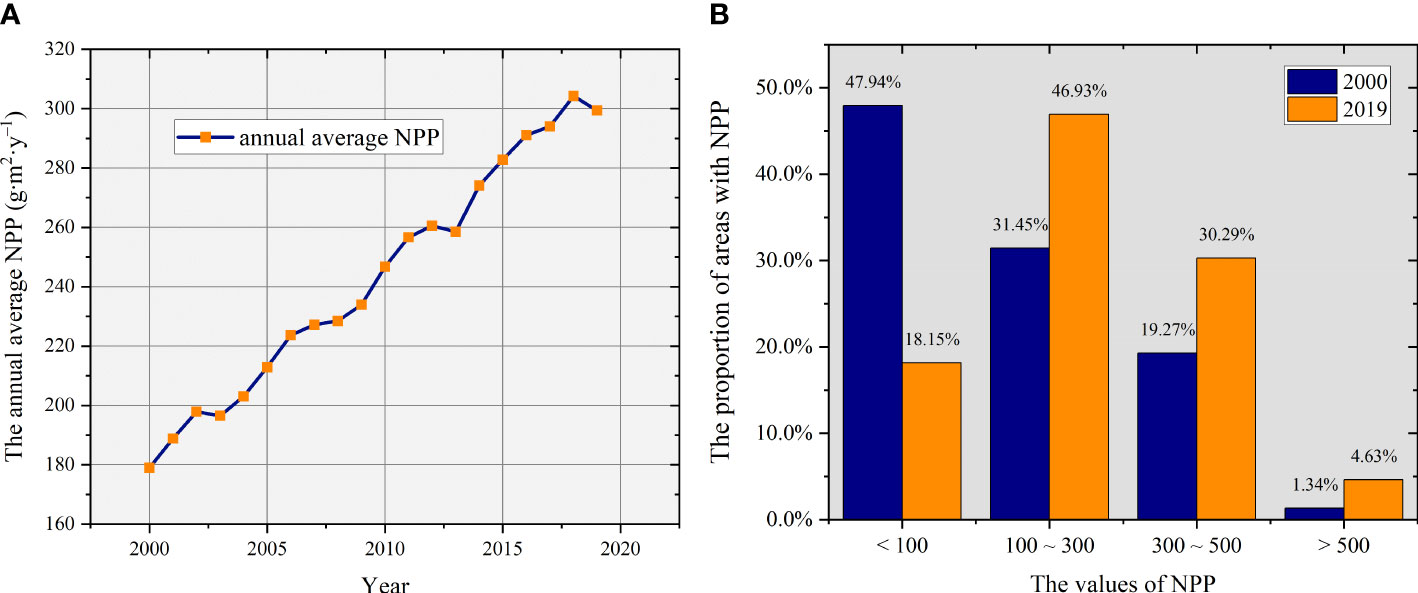
Figure 6 Temporal variations in NPP. (A) Annual average NPP of the Loess Plateau in 2000–2019 and (B) area distribution of NPP in different intervals between 2000 and 2019. NPP, net primary productivity.
From the perspective of spatial distribution, the ANPP in the northwest of the Loess Plateau, including Gansu Province and Ningxia Hui Autonomous Region, was less than 200 g·m2·a−1, accounting for approximately 10.35% of the study area. Meanwhile, the natural forest in Southern Shaanxi Province had the highest NPP in the Loess Plateau (Figure 7A). The growth rate of NPP (GRNPP) in the plateau gradually increased from arid to sub-humid regions (Figure 7B). Notably, 87.34% of the Loess Plateau revealed an increasing trend, while 37% of the region increased significantly, with a GRNPP of 6.97 g·m2·a−1. These areas are mainly distributed in Shaanxi Province, most of Qinghai Province, Southern Gansu Province, and the Southern Ningxia Hui Autonomous Region. Only 12.66% of the Loess Plateau decreased insignificantly. These areas are mainly distributed in deserts and bare land in arid areas with sparse vegetation cover and harsh environments.
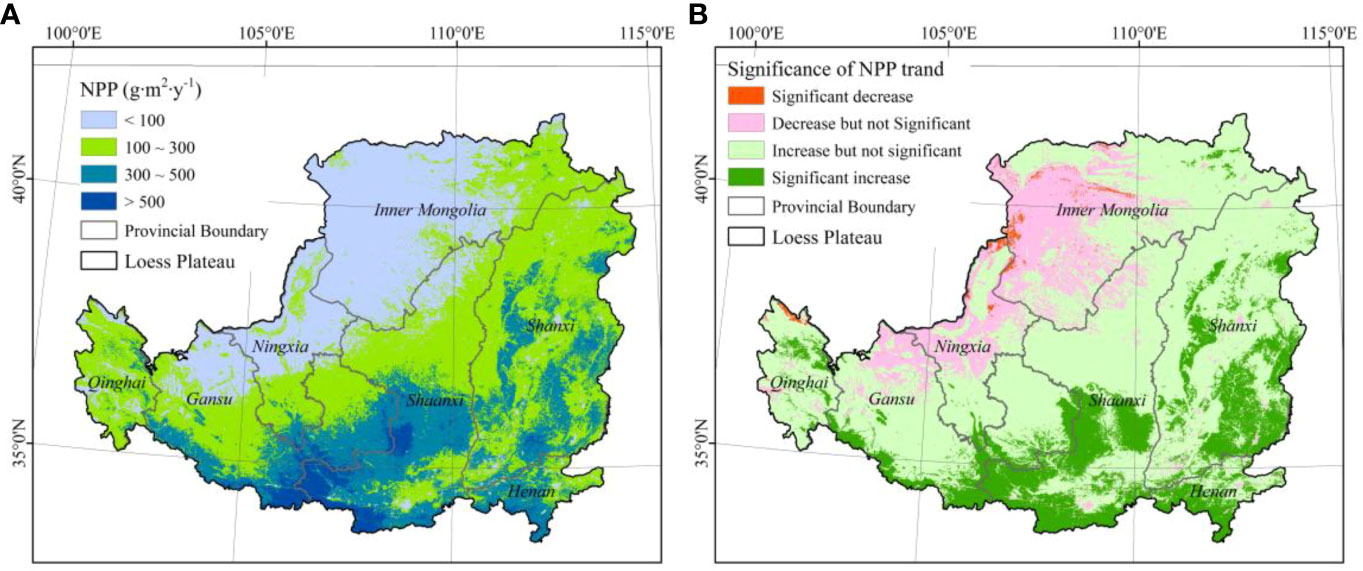
Figure 7 Spatial variation in NPP in the Loess Plateau. (A) Average NPP in each region of the Loess Plateau over 20 years and (B) the growth rate of NPP over 20 years. NPP, net primary productivity.
4.2 Relationships between driving factors and NPP
We ran the deep multiple regression models in a Windows 64-bit operating system with 16 GB running memory, a quad-core Intel CORE I5 9th Gen CPU, and a GeForce GTX 1650TI graphic card. The running environment was Python 3.7.13, and the framework was TensorFlow. The training process included two parts: unsupervised hierarchical pretraining and supervised fine-tuning. The SDAE contained many hyperparameters. We expected the selection process to have a great influence on the result. In this study, on the basis of experience and simple pre-experiments, the values of the hyperparameters, such as cycle index, block size, learning rate, and denoising factors, were pre-set. The specific parameter values are shown in Table 4. Incorporating past adjustment experiences into the parameter adjustment in this study helped to improve the convergence speed and ensure simple optimization. To obtain the values in the layer-by-layer pretraining and fine-tuning stages, we conducted 100 experiments with multiple sets of hyperparameters. Each momentum term had 10 different values [0.1:0.1:1].
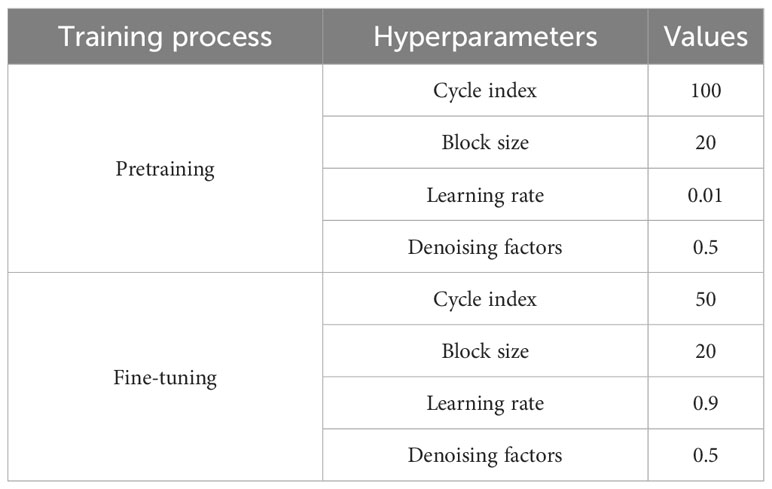
Table 4 Parts of the hyperparameters and their values.
We conducted experiments with the dataset to determine the relationships between driving factors and NPP. We also used ND and RMSE to evaluate single-correlation coefficients. ND is the deviation of the fitted NPP from the sample NPP in the framework, thus reflecting the degree of deviation of the evaluated sample from the normal sample. RMSE is the arithmetic square root of MSE; it is often used to evaluate the degree of variability of the data. The smaller the value of RMSE, the better the accuracy of the prediction model in describing the experimental data.
As shown in Table 5, the ND and RMSE of solar radiation and land use have higher values than those of climate. The poor performance of the land use evaluation methods may be attributed to their inability to detect sharing patterns of different time series. Higher values of ND and RMSE indicate poor regression results for soil moisture factors. The poor results can be attributed to the complex soil moisture conditions and lagging NPP response. The results for climatic factors are slightly better, indicating a strong relationship between climatic factors and NPP.
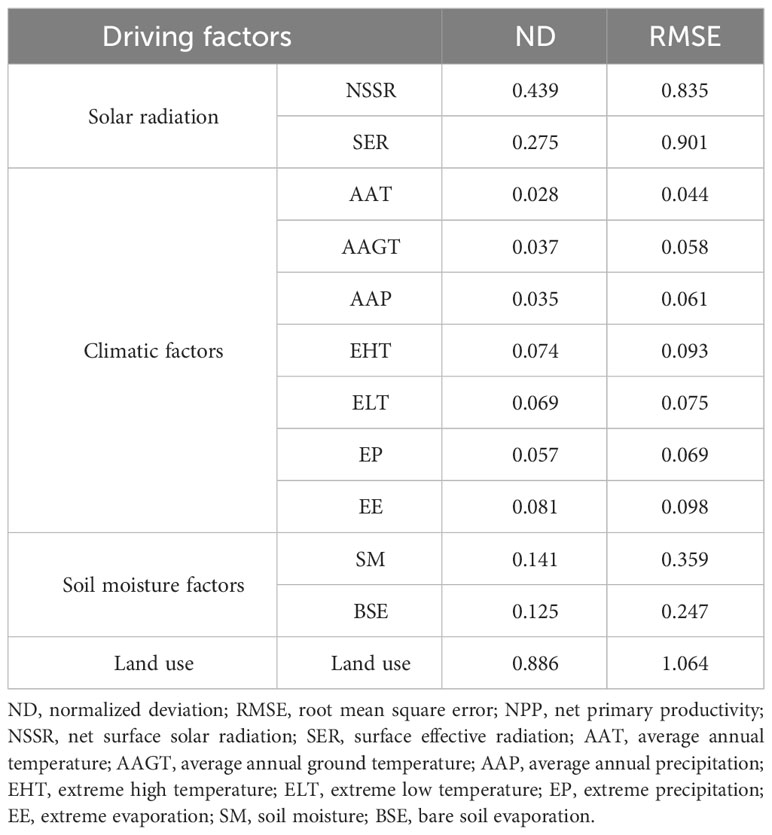
Table 5 ND and RMSE values of the dataset for determining the relationships between driving factors and NPP.
4.3 Analysis of the ecological stress on the Loess Plateau
In general, the ecosystem vulnerability in the Loess Plateau shows an obvious spatial differentiation pattern. Following the natural breakpoint method, we divided the ESI into five levels: non-stress (−0.99 to −0.30), mild stress (−0.30 to −0.10), moderate stress (−0.10 to 0.10), severe stress (0.10 to 0.30), and extreme stress (0.30 to 0.99). We partitioned the ESI to better analyze the ES in subsequent studies, after which we analyzed the overall spatial distribution and interannual variation in the ESI.
1) Spatial distribution characteristics of ES: the average ESI in 2000–2019 in the study area showed a downtrend from northwest to southeast. As shown in Figure 8A, most parts of the study area, accounting for 69.35% of the total area, have non-stress and mild ESs. These areas have low ecological sensitivity and high ecological adaptability and are primarily concentrated in the natural forest in Northern and Southern Shaanxi Province. The area of extreme ES accounts for approximately 9.17%. Although the distribution of this area is relatively scattered, it is primarily distributed in deserts and bare land in arid areas. In other words, the study area is generally in a state of weak ES.
2) Characteristics of interannual variation in ES: the effect of ES presented an uptrend in terms of interannual variation (Figure 8B). From 2000 to 2019, the ESI of the Loess Plateau presented a fluctuating decreasing trend, with a fluctuation range of 0.257 (minimum of −0.176 in 2018 and maximum of 0.091 in 2000). The average ESI (AESI) is higher than 0, with a slow change trend before 2007. After 2007, the AESI decreased significantly and fluctuated by approximately 0.176. This finding is closely related to the country’s vigorous implementation of the “Pastureland Rehabilitation” and “Restore Vegetation” policies. The years with low ESI were mainly characterized by abundant precipitation and insufficient light in the study area. The years with high ESI entailed frequent extreme climate conditions, which are not conducive to the restoration and growth of vegetation.
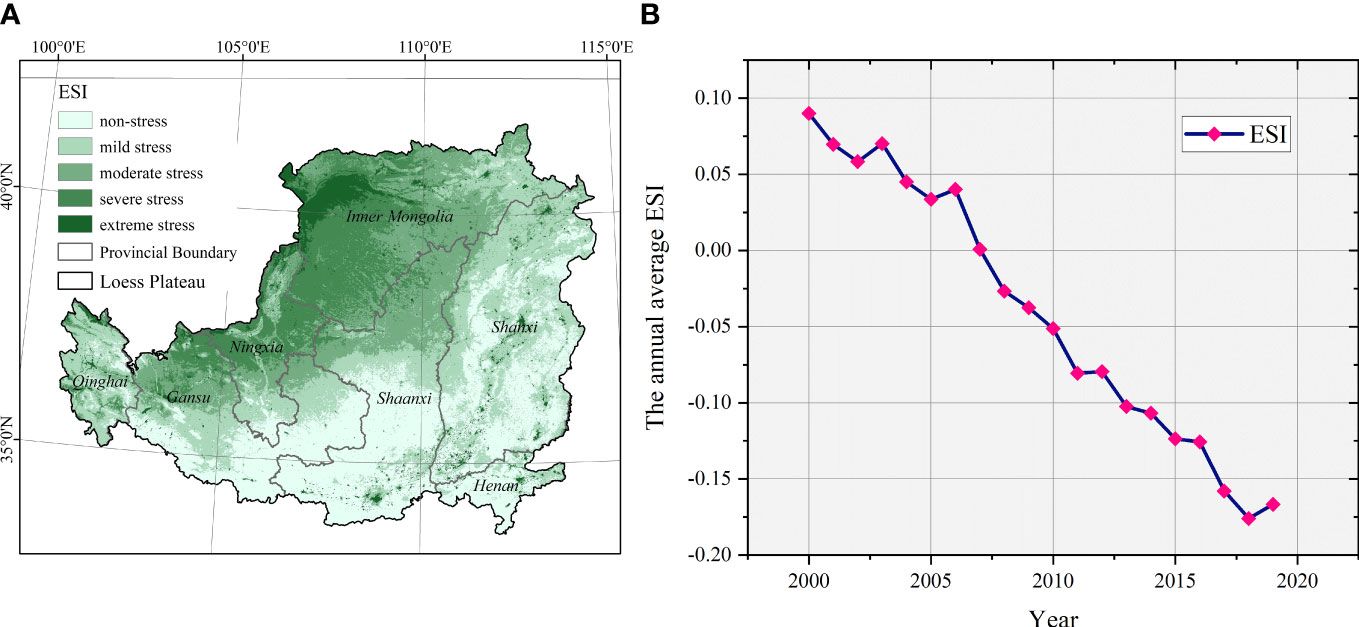
Figure 8 Ecological stress on the Loess Plateau. (A) Spatial distribution of annual average ESI on the Loess Plateau over 20 years and (B) characteristics of interannual variation in average ESI. ESI, ecological stress index.
5 Discussion
5.1 Response mechanism between the driving factors and NPP
5.1.1 RCR of the driving factors
The roles played by different driving factors vary during NPP production. Therefore, the overall contribution rate of NPP also differs from the growth patterns. Here, we first analyzed the changes in NPP in the study area to explore the RCR of each driving factor to NPP. Among the driving factors, AAP and AAT are the most widely distributed, with areas accounting for 20.49% and 15.21% of the total area, respectively. Meanwhile, EHT has the slightest control range of 2.13%. The control of other factors is relatively weak except for the following (Table 6):
1) The areas controlled by AAP and AAT are arid and semi-arid regions where vegetation types, such as grasslands, are mainly distributed. Precipitation brings oxygen, nitrogen, and other elements that promote vegetation growth. Furthermore, the humid environment increases the formation of NPP and promotes regional carbon accumulation (Cui et al., 2022; Wei et al., 2022). In arid and semi-arid regions, vegetation takes up water and nutrients at a faster rate under effective warming. Moreover, AAP and AAT can directly affect the growth process of surface vegetation.
2) The areas accounting for 11.17% controlled by the ELT and distributed in Northern Qinghai, Southern Gansu, and Central Shaanxi are significantly reduced at the lowest temperature, similar to the frequency trends. The low-temperature stress that causes chilling injuries can adversely affect plant growth (Sun et al., 2021; Yuan et al., 2021). At the same time, the photosynthetic rate is significantly reduced, and growth is inhibited.
3) The area controlled by the change in land use structure accounts for 10.82%. The increase in NPP in this region is related to the significant increase in forestlands. In particular, the conversion of cultivated land to forestland and grasslands reduced human disturbance to forests and contributed to their rapid restoration.
4) The frequency of high-temperature weather in the study area in 2000–2019 was shallow. EHT specifically impacts the agricultural planting areas distributed in the Taihang Mountains and Fen River Basin in Eastern Shanxi, Central Shaanxi, and the Ningxia Plain. However, the overall control effect is weak.
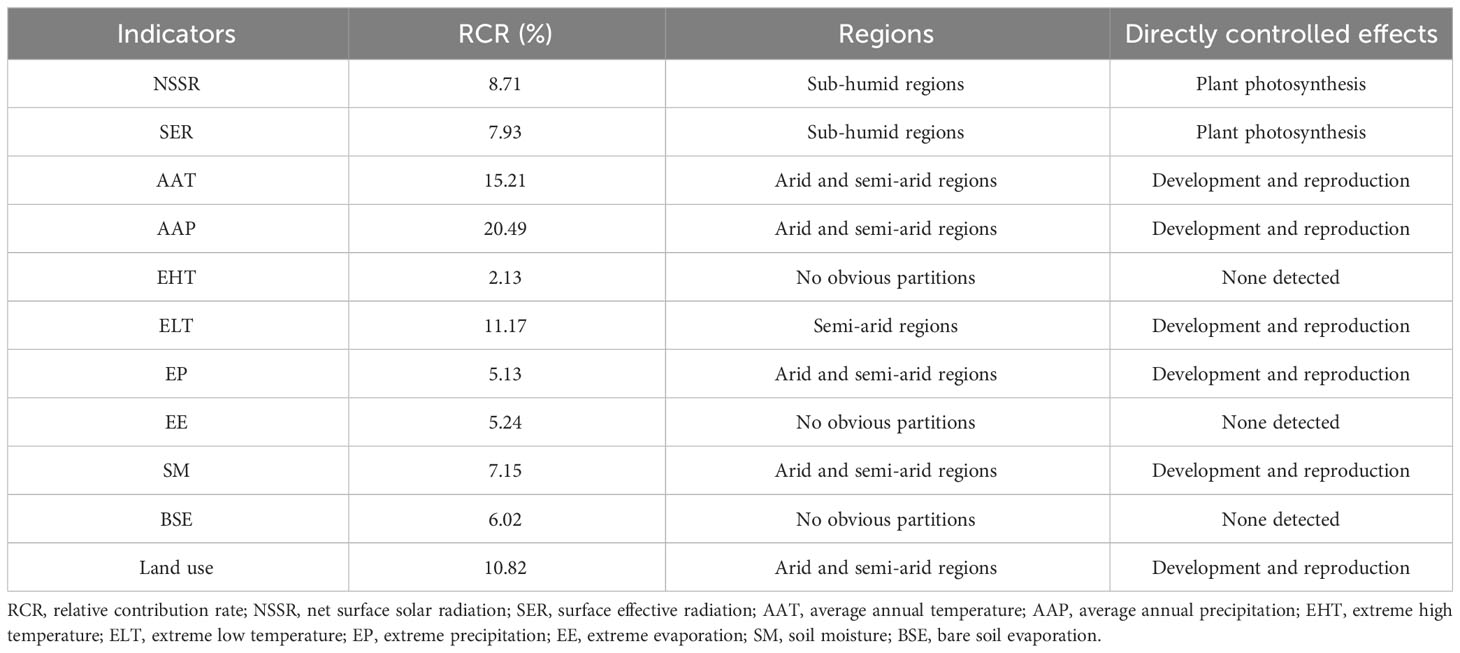
Table 6 Relative contribution rate, distribution regions, and directly controlled effects of different driving factors.
5.1.2 Effects of driving factors on spatial distribution
The effects of the driving factors on NPP changes and specific NPPs varied across different regions. On the Loess Plateau, arid and semi-arid regions are mainly controlled by precipitation, temperature, and relevant drivers, whereas sub-humid regions are mainly controlled by solar radiation and other drivers.
1) The impacts of AAT and AAP on the arid regions of the Loess Plateau are more significant than those on the sub-humid regions. As shown in Figure 9A, the positive correlations of AAT and AAP in the semi-arid regions are 76.51% and 81.34%, respectively, which are much higher than the 67.29% and 61.47% in the sub-humid regions.
2) NSSR and SER are significantly and positively correlated in the sub-humid regions and significantly negatively correlated in the semi-arid regions (Figure 9B). The main reason is that the vegetation coverage in the northwestern region is relatively low. The increase in solar radiation also increases surface evapotranspiration, but it decreases soil moisture content. This phenomenon may have affected the northwest grasslands. Furthermore, the positive incentive effect of vegetation, such as forestland in the southeast, on solar radiation factors is prominent.
3) The interannual variation in EP is less prominent in the sub-humid regions. EP has a negative correlation in the northwest and less affects the arid and semi-arid regions (Figure 9C). The main reason is that extreme rainfall directly affects soil erosion, soil landslides, and other driving factors.
4) ELT is the main factor inhibiting vegetation growth in high-altitude areas, such as the arid regions of the Loess Plateau. As shown in Figure 9D, the significant negative correlation region in the arid region is 10.51%. In sub-humid regions, the impact of low temperatures is weak.
5) The impact of land use on the northwest region is revolutionary. The land use structures of arid and semi-arid regions have undergone tremendous changes, directly increasing grasslands, forestlands, and other areas. In the sub-humid regions, the increase in forestlands, grasslands, and other areas is slightly lower than that in the northwest.
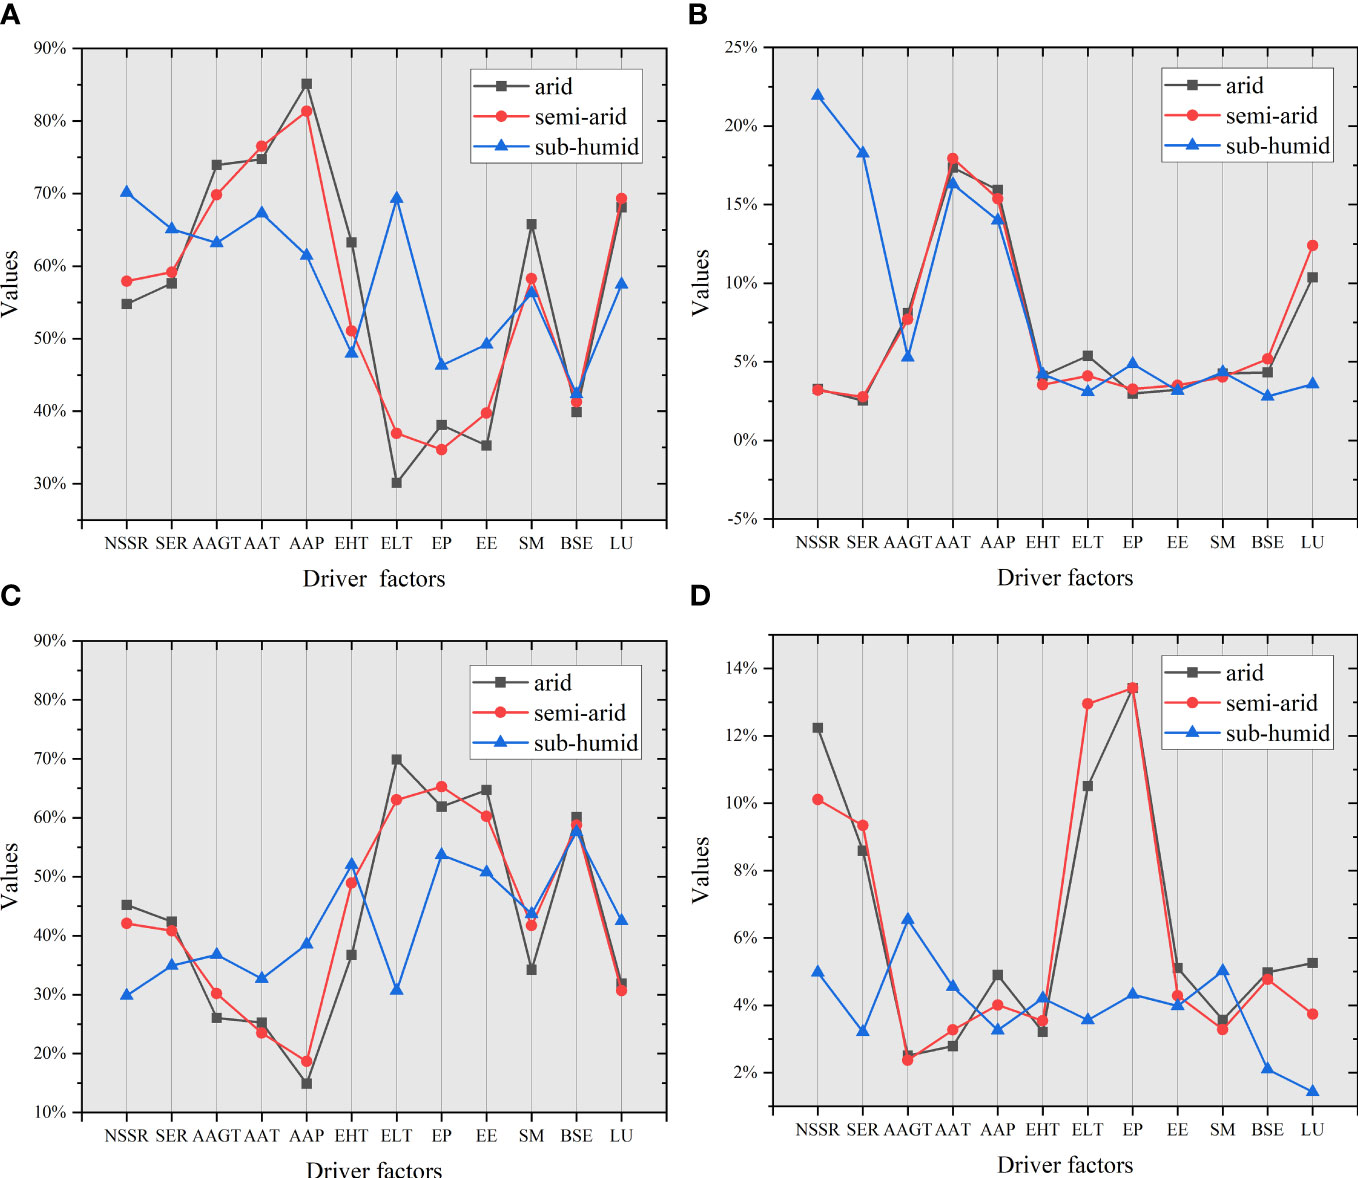
Figure 9 Correlation analysis of the spatial distributions of the driving factors for the arid, semi-arid, and sub-humid regions. (A) Positive correlation, (B) significantly positive correlation, (C) negative correlation, and (D) significantly negative correlation.
5.1.3 Characteristics of different soil types
The Loess Plateau has 12 main soil types (Figure 10), among which loessial soil, cinnamon soil, and chestnut soil are most widely distributed. The loess region is typically characterized by a thickness of 50–350 m. In this study, we classified the main soil types in the Loess Plateau into four categories: loessial soil, cinnamon soil, chestnut soil, and others. Then, we discussed the NPP of each factor using these different soil types. The NPP in the Loess Plateau is in the order of cinnamon soil > loessial soil > others > chestnut soil. However, the GRNPP was changed over 20 years, i.e., loessial soil > chestnut soil > others > cinnamon soil (Table 7).
1) The response of loessial soil to AAP is the most significant. The regions in the study area showed a positive correlation, accounting for 34.71% of the total area (Table 8). Extreme precipitation (>600 mm) can dramatically recharge the groundwater of loessial soil and thus is negatively correlated with solar radiation, such as NSSR. The findings indicate good permeability and water retention but weak antisociality. The area is also vulnerable to water and wind erosion, as it does not have any vegetation cover; thus, its soil fertility is low.
2) Cinnamon soil is mainly distributed in the mountainous and hilly areas of the study area, with deep plow layers, good water retention, and fertilizer retention. The cinnamon soil in the study area is mainly distributed in sub-humid areas, such as the southeast, with excellent hydrothermal conditions. The area has natural vegetation, with macrophanerophytes and crops planted in valley plains. Therefore, the region is significantly correlated with factors such as solar radiation but negatively correlated with AAP. Forest plantations play an important role in soil and water conservation in the gully region of the Loess Plateau.
3) One of the distinct characteristics of the chestnut soil formation process is the noticeable accumulation of organic matter and calcium carbonate. The accumulation of organic matter creates conditions that are conducive to plant growth. Chestnut soil is different from loessial soil in that although the former is greatly affected by temperature and precipitation conditions, its water retention capacity is higher than that of the latter because of its soil-forming characteristics. The areas are significantly associated with AAP and land use.
4) In other areas with sandy soil, the temperature is higher, the water content is lower, and the vegetation is generally sparse. The spatial distribution of this series of soils is relatively dispersed. In this study, we did not find significant spatial differentiations due to the areas’ smaller sample size compared with the soil types discussed above.
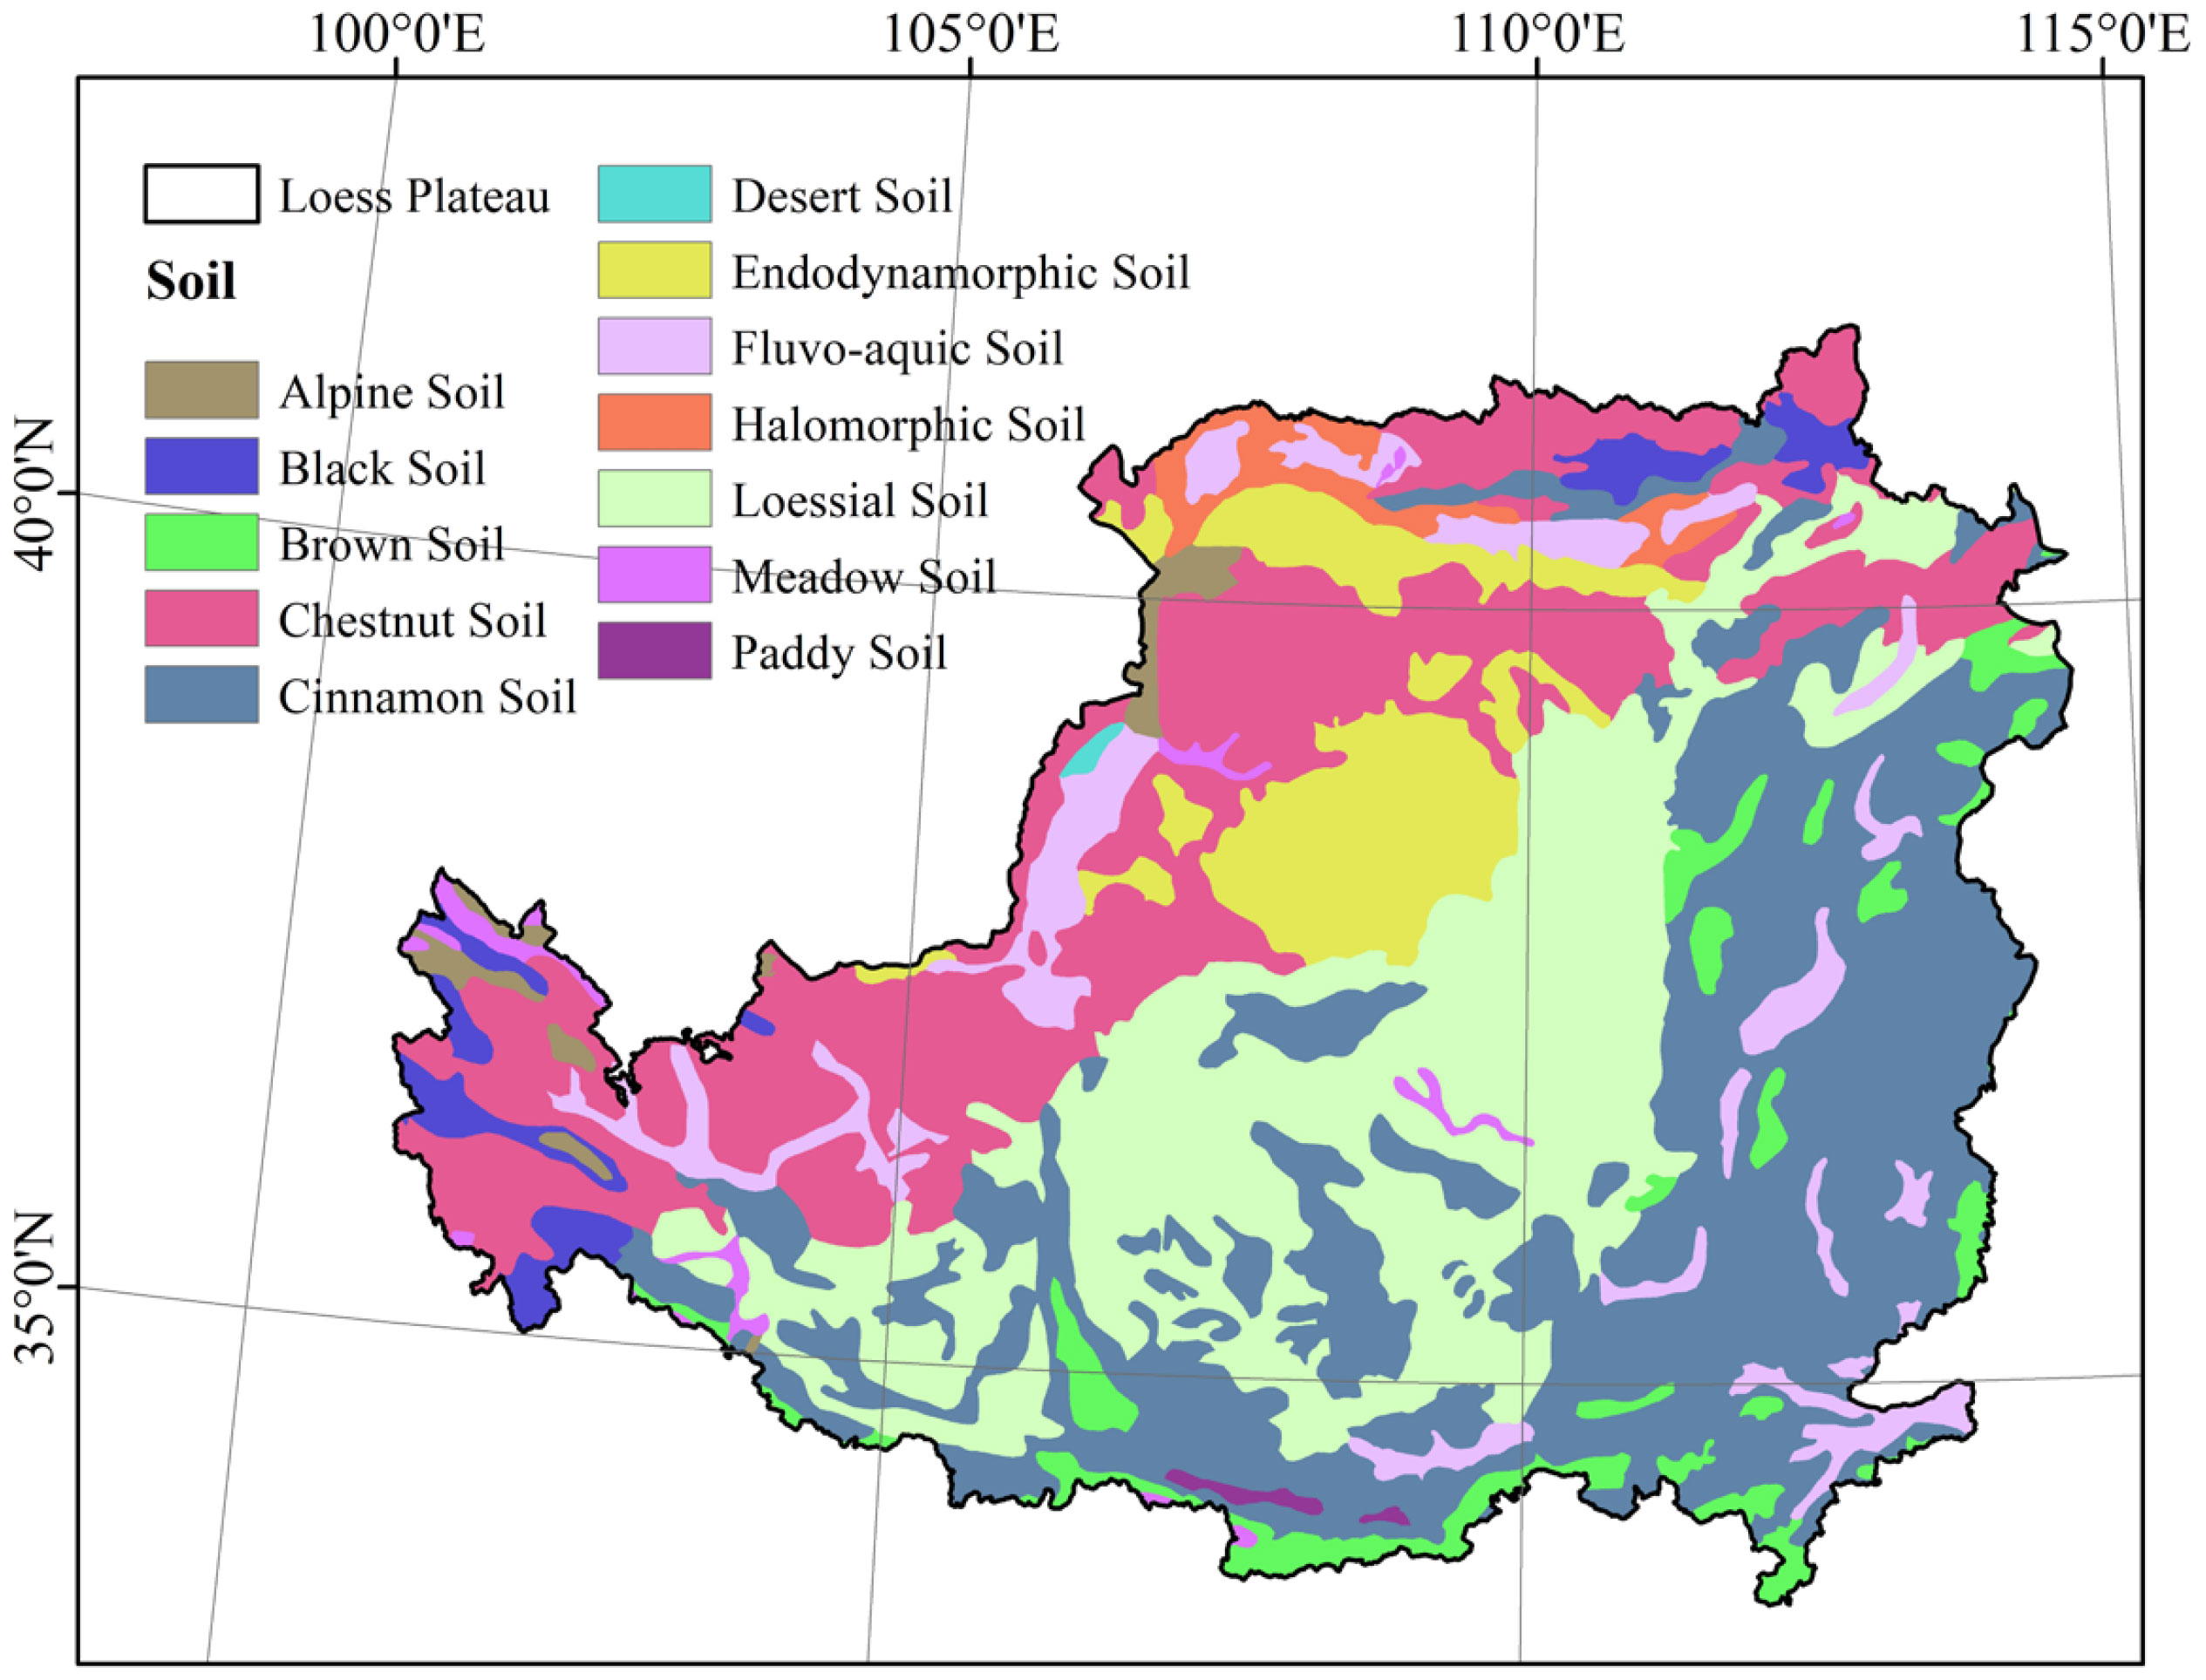
Figure 10 Major soil types in the Loess Plateau and their spatial distributions.
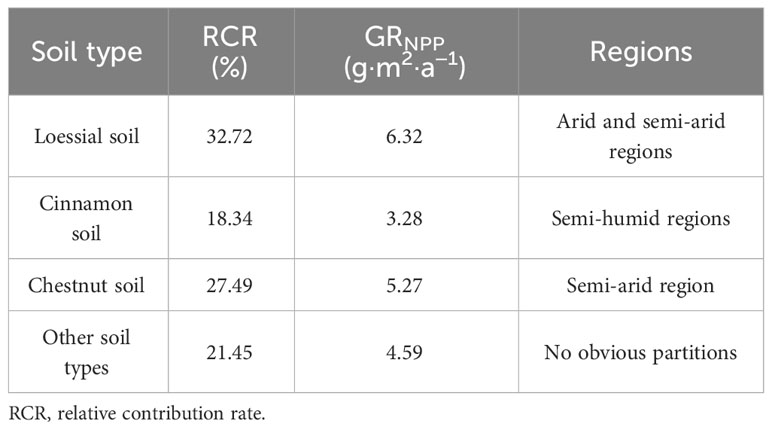
Table 7 RCR, GRNPP, and distribution regions of different soil types.
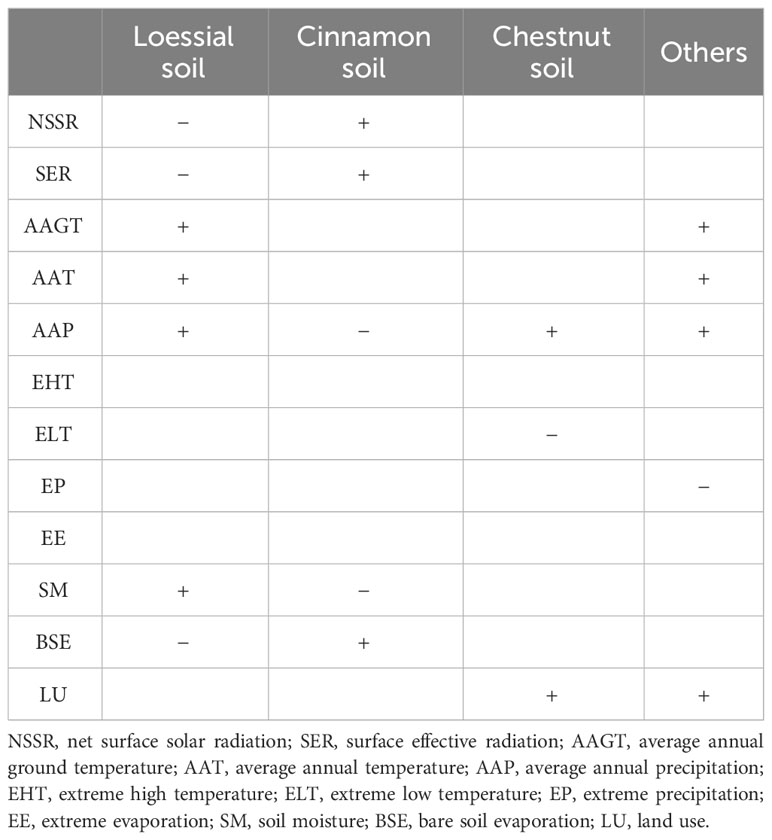
Table 8 Effects of different driving factors on various soil types.
5.2 Ecological stress in the Loess Plateau
5.2.1 Ecological stress effect on different ecological functional regions
The Loess Plateau is an independent geomorphic unit with great particularity. The ESIs of different ecological functional regions in the region vary. Moreover, the ESIs of the ecological functional regions over the 20 years differed significantly. Overall, the ESI can be presented in the following order (Figure 11A): Tibba and Desert Region (I) > Gully Region (II) > Rocky Mountain Region (III) > Irrigated Region (IV) > Valley Plain Region (V). The ESI of V is the smallest (−0.362), followed by that of IV (−0.174). The ESIs of II and I are the largest (0.083 and 0.147, respectively).
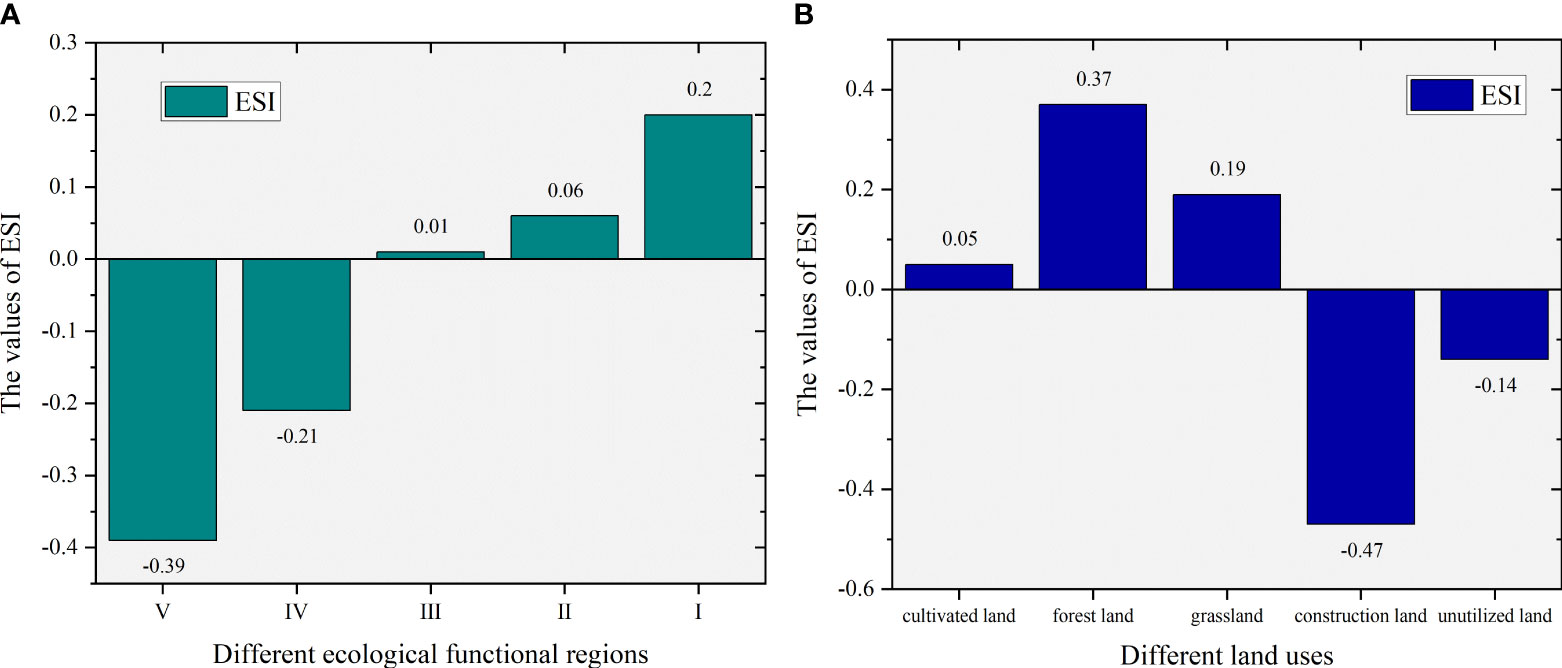
Figure 11 ESIs in different ecological functional regions and land uses. (A) Ecological functional regions and (B) land use. I, Tibba and Desert Region; II, Gully Region; III, Rocky Mountain Region; IV, Irrigated Region; V, Valley Plain Region. ESI, ecological stress index.
The vegetation coverage in V is high, and the annual precipitation is concentrated; meanwhile, IV has the best natural grasslands and farmlands. The high ESIs in II and I are mainly attributed to the desert and gully areas with less annual precipitation, much lower vegetation coverage, and much higher extreme climates than other areas. Locally, the changing trends of III and IV are non-significant. The interannual variations in other ecological functional regions are the same, showing a fluctuating and decreasing state. Topography, climate, vegetation quantity, and quality affect different ecological functional regions, while changes in climatic factors lead to significant spatial differences in climate types. Thus, the maximum and minimum values of the ESI appear at different times.
5.2.2 Ecological stress effects of different land uses
The ESIs of different land uses in the study area also vary. The overall pattern is in the order of construction lands > unutilized lands > cultivated lands > grasslands > forestlands (Figure 11B). Compared with the other land use types in the study area, the forestlands have more precipitation, better vegetation growth (e.g., spruce and cypress), and lower ESI. The valley basins generally have low ESIs and are distributed in the central grasslands with pleasant climates and abundant water resources. The soil types of cultivated lands in the Loess Plateau include chernozem soil, chestnut soil, and gray cinnamon soil, which are rich in organic matter and conducive to crop growth and low ESI. Unutilized lands are mainly mountainous and desert lands; as they are primarily distributed in areas with scarce rainfall (e.g., Northern Shaanxi and Ordos Plateau), the vegetation restoration speed is relatively slow, and the ESI is high. Meanwhile, construction lands are facing drought, water shortage, and water pollution problems and have the highest ESI in the region. Overall, the ESIs of different land uses in the Loess Plateau show a downtrend. Among them, the ESI of cultivated land decreased the most, followed by forestlands. Forestlands and grasslands have better recovery.
5.3 Applications and limitations in the study of NPP
5.3.1 Applications in sub-humid to arid transition regions
The dryland subtypes of hyper-arid, arid, semi-arid, and dry sub-humid regions account for 7%, 13%, 15%, and 6% of the total land surface, respectively. Semi-arid regions are the largest of all global dryland subtypes, accounting for more than one-third of the total dryland area (Carpenter et al., 1992). The global area of semi-arid regions has been expanding between 1948 and 2008, with their expansion accounting for half of the total dryland expansion (Huang et al., 2016). Furthermore, the expansion of semi-arid regions in the Eastern Hemisphere on all continents accounts for 75% of the total expansion of semi-arid areas, while the expansion of semi-arid regions in the American continent accounts for 25% (Figure 12). In the Eastern Hemisphere continents, the expansion of semi-arid regions replaces semi-humid/humid regions where the climate is dry and dominated by the weakening of the East Asian summer winds. By contrast, climate change in the humid semi-arid regions of North America is mainly controlled by the strengthening of the westerly wind belt, which is associated with the reduction in the sea–land temperature gradient in the context of global warming. Furthermore, the interaction between the land surface and the atmosphere is critical to the aridity trends in semi-arid regions (Feng and Zhang, 2015).
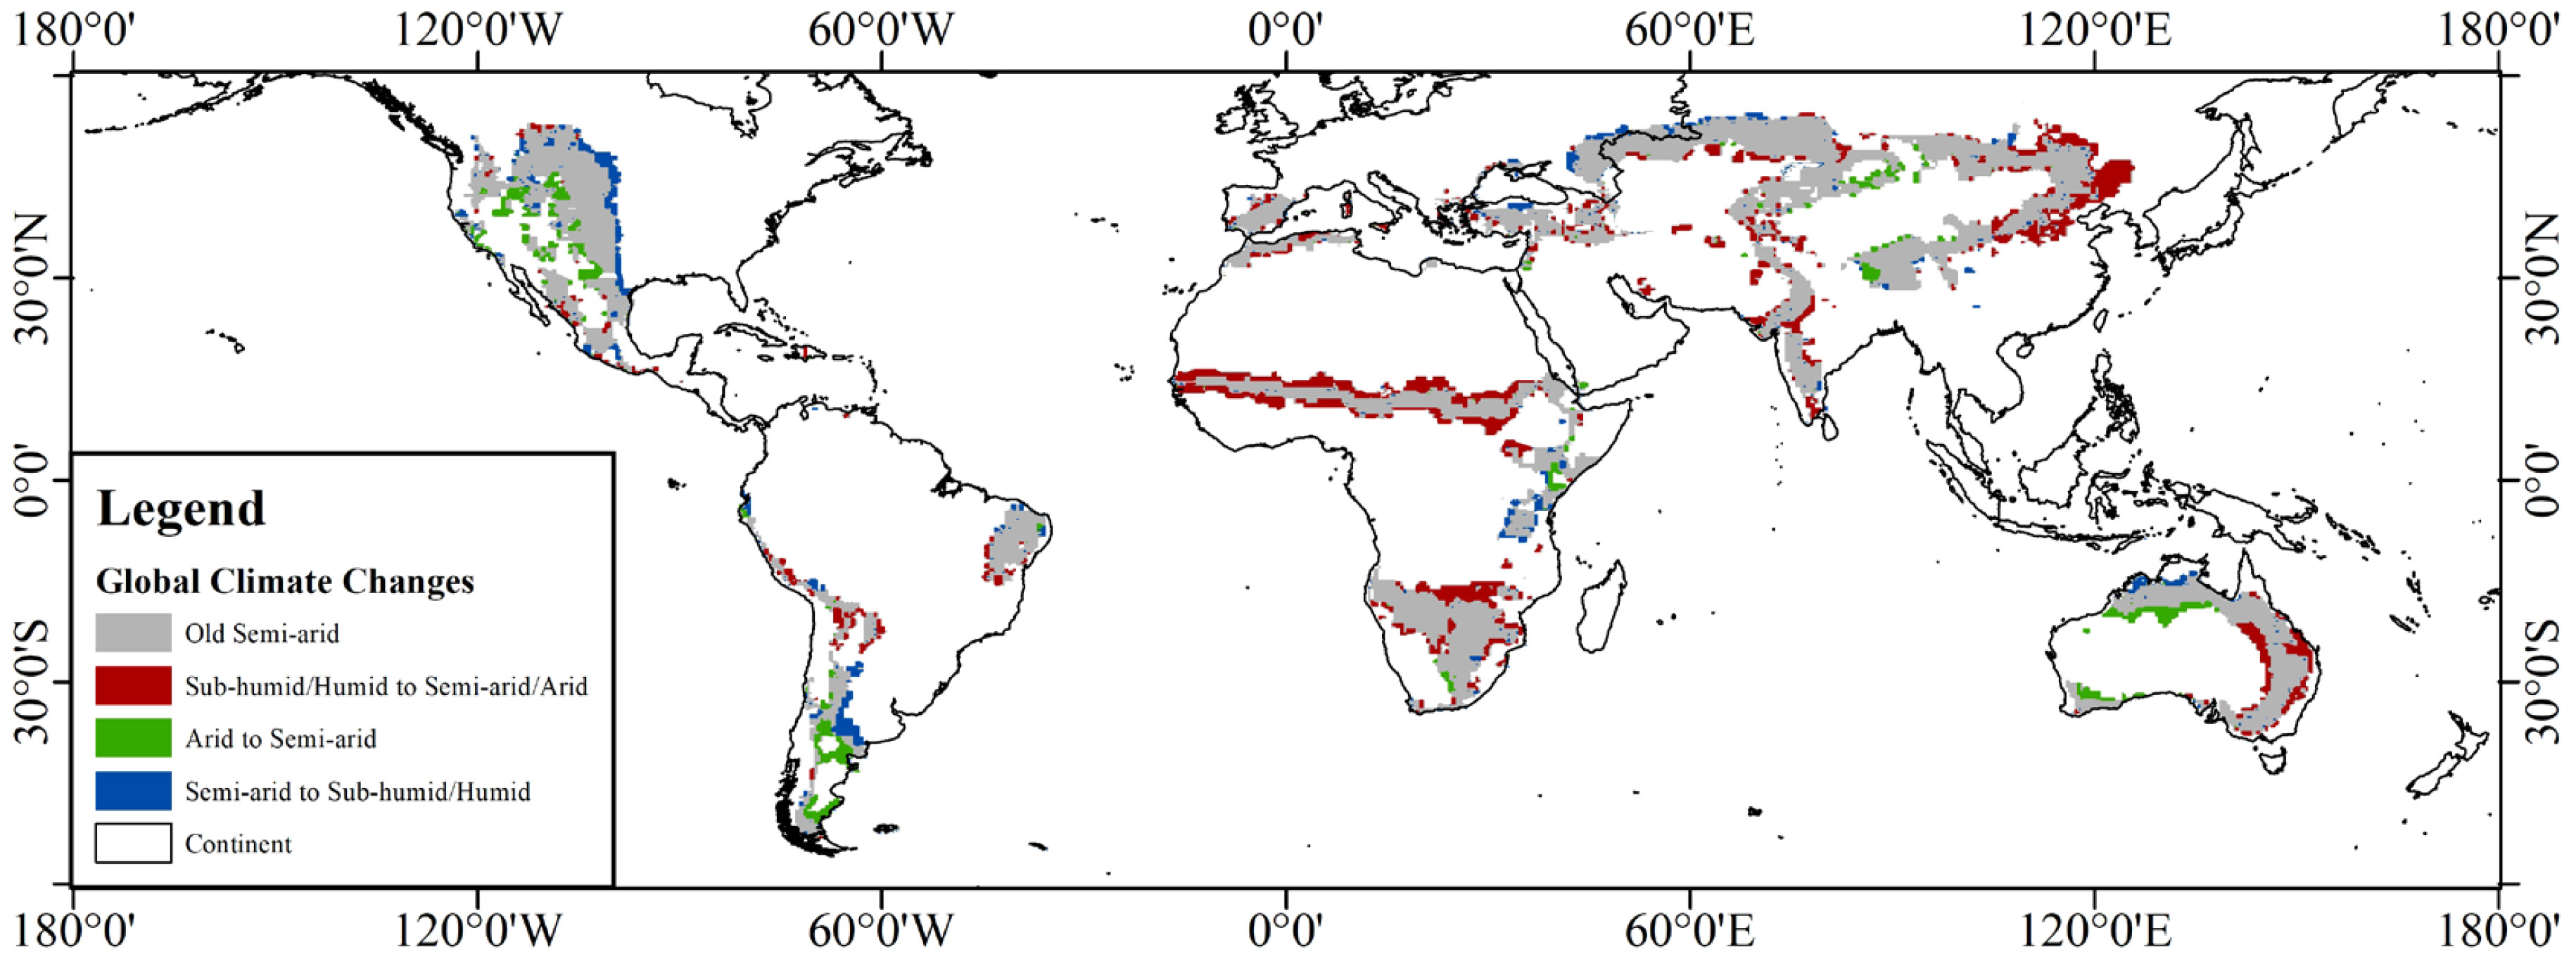
Figure 12 Global distribution of semi-arid regions and their transitions to other climate classifications (adapted from Huang et al., 2016).
With the accelerated water cycle in the context of global warming, water dissipation in arid and semi-arid regions has also accelerated. Bare soil causes evaporation and decreases wet-static energy by reducing the net radiation from the surface, leading to drier and warmer conditions. The arid and semi-arid regions, as a whole, have shown an uptrend of aridification and expansion. Furthermore, the expansion of global arid and semi-arid regions is expected to accelerate in the future. We obtained the following conclusions in this study: arid and semi-arid regions in the Loess Plateau are mainly controlled by precipitation, temperature, and other related factors, whereas sub-humid regions are mainly controlled by solar radiation and other factors. The results have great applications in the study of regional changes in the global climate.
5.3.2 Limitations and uncertainties
This study comprehensively analyzed the NPP of contrasting response mechanisms and ecological stress, but there are still some limitations. First, the data sources for different driving factors were not consistent, and the spatial resolution and the temporal resolution were not uniform, which led to some uncertainty in the construction of driving factors (Ma et al., 2022). Second, there are many factors affecting NPP, the relationship with other environmental factors and anthropogenic factors needs to be further explored, and the remote sensing data products have a certain degree of uncertainty, which leads to the results of the study receiving varying degrees of influence, further affecting the accuracy. In addition, the Loess Plateau was selected as the typical study area for sub-humid to arid transition regions. It is worth considering how the results of this research can be extended and generalized to relevant regions around the globe (Bouras et al., 2019). Finally, the results of this study were not validated by field measurement data, which should be further enhanced to reduce inaccuracies in future studies (Shen et al., 2022). In future research on ecosystem restoration and conservation, more consideration should be given to the extent to which uncertainties in the data sources of different factors contribute to the results, especially how different remote sensing products can be assimilated and fed into the model.
5.4 Future works on ecological stress
5.4.1 Ecological stress model construction based on spectral unmixing
In vegetation-abundant ecosystems, the accurate estimation of multi-objective vegetation cover, including non-photosynthetic vegetation (NPV), photosynthetic vegetation (PV), and bare soil (BS), is an important indicator of carbon stocks and climate change; it can also contribute to soil and water conservation and explain wildfire and drought. Estimating the coverage of different elements on the land surface in a timely and quantitative manner allows us to understand the current stage of vegetation growth and assess the vegetation status. Armed with such information, we can reasonably assess the structural characteristics of the vegetation on the land surface in the past and future. In this manner, we can contribute to the rational conservation and development of terrestrial ecosystems.
However, NPV and BS remain indistinguishable in satellite images of large spatial regions because their spectral reflectance is always mixed and their spectral features only subtly differ. Thus, in our next study, we intend to provide better data support for the accurate inversion of NPP by developing new vegetation indexes, allowing researchers to precisely distinguish the situation of each element component. Furthermore, we will focus on the construction of ES evaluation models based on the three elements of PV, NPV, and BS.
5.4.2 Ecological stress trend forecasting model
In our future work, we plan to use the spectral attention autoregressive model (SAAM) to predict ES in long time series. SAAM is a general framework that incorporates a spectral attention (SA) module; it can also use an embedding function’s spectral information via attention mechanisms to solve two main problems: time series governed by global trends and seasonality structures. At present, SAAM is being trained using long short-term memory (LSTM) as the embedding function, and a basic framework for the common parts is being maintained in all of our experiments. Following this model, we can fully consider the development trend based on the existing driving factors. This development can further provide a good foundation through which we can perform long-time-series ESI forecasts on a global scale.
6 Conclusions
The NPP for estimating the sustainability of the Earth’s carrying capacity in sub-humid to arid transition regions was investigated in this research. We introduced deep multiple regressive models to reveal the relationship between NPP and the identified driving factors and creatively proposed ES evaluation models from the perspective of vegetation productivity. Then, we explored the spatio-temporal pattern and evolution process of NPP and elucidated the response mechanism between NPP and relevant driving factors (land use and radiation, climate, and soil moisture factors). We also determined the ES of ecological functional regions and land use in the study area. The findings are as follows: 1) From 2000 to 2019, the changes in the driving factors presented a clear regional character, and the annual NPP maintained a fluctuating uptrend (4.57 g·m2·a−1). From the perspective of spatial distribution, the growth rate of NPP gradually increased from the arid to sub-humid regions. 2) The effects of different driving factors on NPP changes and specific NPPs varied across regions. Arid and semi-arid regions were mainly controlled by precipitation (20.49%), temperature (15.21%), and other related factors, whereas sub-humid regions were mainly controlled by solar radiation, such as NSSR (8.71%) and SER (7.93%). The main driving factors of the change in NPP varied under different soil conditions. 3) The spatio-temporal patterns of NPP approximated those of ES, but the effect of the latter significantly differed across ecological functional regions and land uses. In conclusion, this research on the Loess Plateau can serve as a valuable reference for future research on realizing ecosystem restoration and protection in sub-humid to arid transition regions.
Data availability statement
The original contributions presented in the study are included in the article/supplementary material. Further inquiries can be directed to the corresponding author.
Author contributions
Conceptualization, CW; Formal analysis, RZ; Methodology, CW and RZ; Project administration, RZ; Software, LC; Supervision, RZ; Validation, CW and LC; Writing—original draft, CW. All authors have read and agreed to the published version of the manuscript.
Funding
This research was funded by the National Natural Science Foundation of China (grant number 42301102).
Conflict of interest
The authors declare that the research was conducted in the absence of any commercial or financial relationships that could be construed as a potential conflict of interest.
Publisher’s note
All claims expressed in this article are solely those of the authors and do not necessarily represent those of their affiliated organizations, or those of the publisher, the editors and the reviewers. Any product that may be evaluated in this article, or claim that may be made by its manufacturer, is not guaranteed or endorsed by the publisher.
References
Alados I., Foyo-Moreno I., Olmo F. J., et al. (2003). Relationship between net radiation and solar radiation for semiarid shrub-lan. Agr. For. Meteorol. 116, 221–227. doi: 10.1016/S0168-1923(03)00038-8
Bouras E., Jarlan L., Khabba S., et al. (2019). Assessing the impact of global climate changes on irrigated wheat yields and water requirements in a semiarid environment of Morocco. Sci. Rep. 9 (1), 19142. doi: 10.1038/s41598-019-55251-2
Carpenter S. R., Fisher S. G., Grimm N. B., et al. (1992). Global change and freshwater ecosystems. Annu. Rev. Ecol. Syst. 23 (1), 119–139. doi: 10.1146/annurev.es.23.110192.001003
Castello L., Macedo M. N. (2016). Large-scale degradation of Amazonian freshwater ecosystems. Global Change Biol. 22 (3), 990–1007. doi: 10.1111/gcb.13173
Celiz M. D., Tso J., Aga D. S. (2009). Pharmaceutical metabolites in the environment: analytical challenges and ecological risks. Environ. Toxicol. Chem. 28, 2473–2484. doi: 10.1897/09-173.1
Chang Y., Hou K., Wu Y., et al. (2019). A conceptual framework for establishing the index system of ecological environment evaluation–A case study of the upper Hanjiang River, China. Ecol. Indic. 107, 105568. doi: 10.1016/j.ecolind.2019.105568
Chen L., Gong J., Fu B., et al. (2007). Effect of land use conversion on soil organic carbon sequestration in the loess hilly area, loess plateau of China. Ecol. Res. 22, 641–648. doi: 10.1007/s11284-006-0065-1
Chen L., Wang J., Fu B., et al. (2001). Land-use change in a small catchment of northern Loess Plateau, China. Agr. Ecosyst. Environ. 86, 163–172. doi: 10.1016/S0167-8809(00)00271-1
Cui J., Wang Y., Zhou T., et al. (2022). Temperature mediates the dynamic of MODIS NPP in alpine grassland on the Tibetan Plateau 2001–2019. Remote Sens. 14 (10), 2401. doi: 10.3390/rs14102401
Dakos V., Soler-Toscano F. (2017). Measuring complexity to infer changes in the dynamics of ecological systems under stress. Ecol. Complex. 32, 144–155. doi: 10.1016/j.ecocom.2016.08.005
Dale V. H. (1997). The relationship between land-use change and climate change. Ecol. Appl. 7, 753–769. doi: 10.1890/1051-0761(1997)007[0753:TRBLUC]2.0.CO;2
Ding D. Y., Feng H., Zhao Y., et al. (2016). Modifying winter wheat sowing date as an adaptation to climate change on the Loess Plateau. Agron. J. 108, 53–63. doi: 10.2134/agronj15.0262
Eckholm E. P. (1975). The deterioration of mountain environments: ecological stress in the highlands of Asia, Latin America, and Africa takes a mounting social toll. Science 189, 764–770. doi: 10.1126/science.189.4205.764
Fazio P., Mehic M., Voznak M. (2020). A deep stochastical and predictive analysis of users mobility based on Auto-Regressive processes and pairing functions. J. Netw. Comput. Appl. 168, 102778. doi: 10.1016/j.jnca.2020.102778
Feng H., Zhang M. (2015). Global land moisture trends: drier in dry and wetter in wet over land. Sci. Rep. 5 (1), 18018. doi: 10.1038/srep18018
Feng X., Fu B., Piao S., et al. (2016). Revegetation in China’s Loess Plateau is approaching sustainable water resource limits. Nat. Clim. Change. 6, 1019–1022. doi: 10.1038/nclimate3092
Feng Y., Hao W., Li H., et al. (2020). Machine learning models to quantify and map daily global solar radiation and photovoltaic power. Renew. Sust. Energ. Rev. 118, 109393. doi: 10.1016/j.rser.2019.109393
Gang C., Zhao W., Zhao T., et al. (2018). The impacts of land conversion and management measures on the grassland net primary productivity over the Loess Plateau, Northern China. Sci. Total. Environ. 645, 827–836. doi: 10.1016/j.scitotenv.2018.07.161
Ghimire S., Deo R. C., Downs N. J., et al. (2018). Self-adaptive differential evolutionary extreme learning machines for long-term solar radiation prediction with remotely-sensed MODIS satellite and Reanalysis atmospheric products in solar-rich cities. Remote Sens. Environ. 212, 176–198. doi: 10.1016/j.rse.2018.05.003
Guan B., Yu J., Hou A., et al. (2017). The ecological adaptability of Phragmites australis to interactive effects of water level and salt stress in the Yellow River Delta. Aquat. Ecol. 51, 107–116. doi: 10.1007/s10452-016-9602-3
Guo Q. Y., Hai B. Y., Zhi Z. T., et al. (2011). Eco-environment quality assessment of Miyun county based on RS and GIS. Proc. Environ. Sci. 10, 2601–2607. doi: 10.1016/j.proenv.2011.09.404
Hadi S. J., Shafri H. Z. M., Mahir M. D. (2014). Factors affecting the eco-environment identification through change detection analysis by using remote sensing and GIS: a case study of Tikrit, Iraq. Arabian. J. Sci. Eng. 39, 395–405. doi: 10.1007/s13369-013-0859-8
Hessel R., Messing I., Liding C., et al. (2003). Soil erosion simulations of land use scenarios for a small Loess Plateau catchment. Catena 54, 289–302. doi: 10.1016/S0341-8162(03)00070-5
Hoegh-Guldberg O., Jacob D., Taylor M., et al. (2019). The human imperative of stabilizing global climate change at 1.5 °C. Science 365, eaaw6974. doi: 10.1126/science.aaw6974
Huang J., Ji M., Xie Y., et al. (2016). Global semi-arid climate change over last 60 years. Clim. Dynam. 46, 1131–1150. doi: 10.1007/s00382-015-2636-8
Huang J., Zhang W., Zuo J., et al. (2008). An overview of the semi-arid climate and environment research observatory over the Loess Plateau. Adv. Atmos. Sci. 25, 906–921.
Huang L. (2019). Advances and perspectives on soil water research in China’s Loess Plateau. Earth-Sci. Rev. 199, 102962. doi: 10.1016/j.earscirev.2019.102962
Hussain J., Khaliq T., Ahmad A., et al. (2018). Wheat responses to climate change and its adaptations: a focus on arid and semiarid environment. Int. J. Environ. Res. 12, 117–126. doi: 10.1007/s41742-018-0074-2
Jiao Z. H., Mu X. (2022). Global validation of clear-sky models for retrieving land-surface downward longwave radiation from MODIS data. Remote Sens. Environ. 271, 112903. doi: 10.1016/j.rse.2022.112903
Jorda-Capdevila D., Gampe D., García V. H., et al. (2019). Impact and mitigation of global change on freshwater-related ecosystem services in Southern Europe. Sci. Total. Environ. 651, 895–908. doi: 10.1016/j.scitotenv.2018.09.228
Justice C. O., Townshend J. R. G., Vermote E. F., et al. (2002). An overview of MODIS Land data processing and product status. Remote Sens. Environ. 83, 3–15. doi: 10.1016/S0034-4257(02)00084-6
Karaouzas I., Smeti E., Vourka A., et al. (2018). Assessing the ecological effects of water stress and pollution in a temporary river-Implications for water management. Sci. Total. Environ. 618, 1591–1604. doi: 10.1016/j.scitotenv.2017.09.323
Kaufman Y. J., Tanré D., Remer L. A., et al. (1997). Operational remote sensing of tropospheric aerosol over land from EOS moderate resolution imaging spectroradiometer. J. Geophys. Res-Atmos. 102, 17051–17067. doi: 10.1029/96JD03988
Lam J. C., Tsang C. L., Yang L., et al. (2005). Weather data analysis and design implications for different climatic zones in China. Build. Environ. 40, 277–296. doi: 10.1016/j.buildenv.2004.07.005
Leifeld J., Menichetti L. (2018). The underappreciated potential of peatlands in global climate change mitigation strategies. Nat. Commun. 9, 1–7. doi: 10.1038/s41467-018-03406-6
Li G., Sun S., Han J., et al. (2019). Impacts of Chinese Grain for Green program and climate change on vegetation in the Loess Plateau during 1982–2015. Sci. Total. Environ. 660, 177–187. doi: 10.1016/j.scitotenv.2019.01.028
Li Z., Liu W., Zhang X., et al. (2009). Impacts of land use change and climate variability on hydrology in an agricultural catchment on the Loess Plateau of China. J. Hydrol. 377 (1-2), 35–42. doi: 10.1016/j.jhydrol.2009.08.007
Lin M., Lin T., Sun C., et al. (2020). Using the Eco-Erosion Index to assess regional ecological stress due to urbanization–A case study in the Yangtze River Delta urban agglomeration. Ecol. Indic. 111, 106028. doi: 10.1016/j.ecolind.2019.106028
Lu C., Wang Z. Y., Qin W. L., et al. (2017). Fault diagnosis of rotary machinery components using a stacked denoising autoencoder-based health state identification. Signal Process. 130, 377–388. doi: 10.1016/j.sigpro.2016.07.028
Lyu J., Mo S., Luo P., et al. (2019). A quantitative assessment of hydrological responses to climate change and human activities at spatiotemporal within a typical catchment on the Loess Plateau, China. Quatern. Int. 527, 1–11. doi: 10.1016/j.quaint.2019.03.027
Ma R., Xia C., Liu Y., et al. (2022). Spatiotemporal change of net primary productivity and its response to climate change in temperate grasslands of China. Front. Plant Sci. 13, 899800. doi: 10.3389/fpls.2022.899800
Maher B. A. (2016). Palaeoclimatic records of the loess/palaeosol sequences of the Chinese Loess Plateau. Quaternary. Sci. Rev. 154, 23–84. doi: 10.1016/j.quascirev.2016.08.004
Mamat Z., Yimit H., Eziz A., et al. (2014). Oasis land-use change and its effects on the eco-environment in Yanqi Basin, Xinjiang, China. Environ. Monit. Assess. 186, 335–348. doi: 10.1007/s10661-013-3377-y
Mumby P. J., Van Woesik R. (2014). Consequences of ecological, evolutionary and biogeochemical uncertainty for coral reef responses to climatic stress. Curr. Biol. 24, R413–R423. doi: 10.1016/j.cub.2014.04.029
Naeem S., Zhang Y., Zhang X., et al. (2021). Both climate and socioeconomic drivers contribute to vegetation greening of the Loess Plateau. Sci. Bull. 66, 1160–1163. doi: 10.1016/j.scib.2021.03.007
Ostwald M., Chen D. (2006). Land-use change: Impacts of climate variations and policies among small-scale farmers in the Loess Plateau, China. Land. Use Policy. 23, 361–371. doi: 10.1016/j.landusepol.2005.04.004
Ragab R., Prudhomme C. (2002). Sw—soil and Water: climate change and water resources management in arid and semiarid regions: prospective and challenges for the 21st century. Biosyst. Eng. 81 (1), 3–34. doi: 10.1006/bioe.2001.0013
Ramírez-Cuesta J. M., Vanella D., Consoli S., et al. (2018). A satellite stand-alone procedure for deriving net radiation by using SEVIRI and MODIS products. Int. J. Appl. Earth Obs. 73, 786–799. doi: 10.1016/j.jag.2018.08.018
Remer L. A., Kaufman Y. J., Tanré D., et al. (2005). The MODIS aerosol algorithm, products, and validation. J. Atmos. Sci. 62, 947–973. doi: 10.1175/JAS3385.1
Schmeller D. S., Loyau A., Bao K., et al. (2018). People, pollution and pathogens–Global change impacts in mountain freshwater ecosystems. Sci. Total. Environ. 622, 756–763. doi: 10.1016/j.scitotenv.2017.12.006
Scotto J., Cotton G., Urbach F., et al. (1988). Biologically effective ultraviolet radiation: surface measurements in the United States 1974 to 1985. Science 239, 762–764. doi: 10.1126/science.3340857
Seddon A. W. R., Macias-Fauria M., Long P. R., et al. (2016). Sensitivity of global terrestrial ecosystems to climate variability. Nature 531 (7593), 229–232. doi: 10.1038/nature16986
Shen X., Liu Y., Zhang J., et al. (2022). Asymmetric impacts of diurnal warming on vegetation carbon sequestration of marshes in the Qinghai Tibet Plateau. Global Biogeochem. Cycles. 36 (7), e2022GB007396. doi: 10.1029/2022GB007396
Shi Y., Li J., Xie M. (2018). Evaluation of the ecological sensitivity and security of tidal flats in Shanghai. Ecol. Indic. 85, 729–741. doi: 10.1016/j.ecolind.2017.11.033
Sievenpiper D. F. (2005). Forward and backward leaky wave radiation with large effective aperture from an electronically tunable textured surface. IEEE T Antenn. Propag. 53, 236–247. doi: 10.1109/TAP.2004.840516
Stevens T., Buylaert J. P., Thiel C., et al. (2018). Ice-volume-forced erosion of the Chinese Loess Plateau global Quaternary stratotype site. Nat. Commun. 9, 1–12. doi: 10.1038/s41467-018-03329-2
Su F., Wang F., Li Z., et al. (2020). Predominant role of soil moisture in regulating the response of ecosystem carbon fluxes to global change factors in a semiarid grassland on the Loess Plateau. Sci. Total. Environ. 738, 139746. doi: 10.1016/j.scitotenv.2020.139746
Sun J. (2002). Provenance of loess material and formation of loess deposits on the Chinese Loess Plateau. Earth Planet. Sc Lett. 203, 845–859. doi: 10.1016/S0012-821X(02)00921-4
Sun W., Shao S., Zhao R., et al. (2016). A sparse auto-encoder-based deep neural network approach for induction motor faults classification. Measurement 89, 171–178. doi: 10.1016/j.measurement.2016.04.007
Sun W., Song X., Mu X., et al. (2015). Spatiotemporal vegetation cover variations associated with climate change and ecological restoration in the Loess Plateau. Agr. For. Meteorol. 209, 87–99. doi: 10.1016/j.agrformet.2015.05.002
Sun Y., Yang Y., Zhao X., et al. (2021). Global patterns and climatic drivers of above-and belowground net primary productivity in grasslands. Sci. China.: Life Sci. 64, 739–751. doi: 10.1007/s11427-020-1837-9
Tamiminia H., Salehi B., Mahdianpari M., et al. (2020). Google Earth Engine for geo-big data applications: A meta-analysis and systematic review. ISPRS. J. Photogramm. 164, 152–170. doi: 10.1016/j.isprsjprs.2020.04.001
Tang K., Hailu A. (2020). Smallholder farms’ adaptation to the impacts of climate change: Evidence from China’s Loess Plateau. Land Use Policy 91, 104353. doi: 10.1016/j.landusepol.2019.104353
Tapley B. D., Watkins M. M., Flechtner F., et al. (2019). Contributions of GRACE to understanding climate change. Nat. Clim. Change. 9, 358–369. doi: 10.1038/s41558-019-0456-2
Walter J., Jentsch A., Beierkuhnlein C., et al. (2013). Ecological stress memory and cross stress tolerance in plants in the face of climate extremes. Environ. Exp. Bot. 94, 3–8. doi: 10.1016/j.envexpbot.2012.02.009
Wang J., Li S., An Z., et al. (2019). Batch-normalized deep neural networks for achieving fast intelligent fault diagnosis of machines. Neurocomputing 329, 53–65. doi: 10.1016/j.neucom.2018.10.049
Wang S. J., Ma H., Zhao Y. B. (2014). Exploring the relationship between urbanization and the eco-environment—A case study of Beijing–Tianjin–Hebei region. Ecol. Indic. 45, 171–183. doi: 10.1016/j.ecolind.2014.04.006
Wang Y., Shao M., Zhu Y., et al. (2011). Impacts of land use and plant characteristics on dried soil layers in different climatic regions on the Loess Plateau of China. Agr. For. Meteorol. 151, 437–448. doi: 10.1016/j.agrformet.2010.11.016
Weber S. E., Diez J. M., Andrews L. V., et al. (2019). Responses of arbuscular mycorrhizal fungi to multiple coinciding global change drivers. Fungal Ecol. 40, 62–71. doi: 10.1016/j.funeco.2018.11.008
Wei X., Yang J., Luo P., et al. (2022). Assessment of the variation and influencing factors of vegetation NPP and carbon sink capacity under different natural conditions. Ecol. Indic. 138, 108834. doi: 10.1016/j.ecolind.2022.108834
Xiao J., Wang L., Deng L., et al. (2019). Characteristics, sources, water quality and health risk assessment of trace elements in river water and well water in the Chinese Loess Plateau. Sci. Total. Environ. 650, 2004–2012. doi: 10.1016/j.scitotenv.2018.09.322
Xiong X., Barnes W. (2006). An overview of MODIS radiometric calibration and characterization. Adv. Atmos. Sci. 23, 69–79. doi: 10.1007/s00376-006-0008-3
Xiong J., Thenkabail P. S., Gumma M. K., et al. (2017). Automated cropland mapping of continental Africa using Google Earth Engine cloud computing. ISPRS. J. Photogramm. 126, 225–244. doi: 10.1016/j.isprsjprs.2017.01.019
Yao L., Li X., Li Q., et al. (2019). Temporal and spatial changes in coupling and coordinating degree of new urbanization and ecological-environmental stress in China. Sustainability 11 (4), 1171. doi: 10.3390/su11041171
Ying M., Zhang W., Yu H., et al. (2014). An overview of the China Meteorological Administration tropical cyclone database. J. Atmos. Ocean. Tech. 31, 287–301. doi: 10.1175/jtech-d-12-00119.1
Yuan Z., Wang Y., Xu J., et al. (2021). Effects of climatic factors on the net primary productivity in the source region of Yangtze River, China. Sci. Rep. 11 (1), 1376. doi: 10.1038/s41598-020-80494-9
Yurui L., Xuanchang Z., Zhi C., et al. (2021). Towards the progress of ecological restoration and economic development in China’s Loess Plateau and strategy for more sustainable development. Sci. Total. Environ. 756, 143676. doi: 10.1016/j.scitotenv.2020.143676
Zhang X., Friedl M. A., Schaaf C. B., et al. (2003). Monitoring vegetation phenology using MODIS. Remote Sens. Environ. 84, 471–475. doi: 10.1016/S0034-4257(02)00135-9
Zhang S., Liu X., Wang X., et al. (2021). Evaluation of coffee ecological adaptability using Fuzzy, AHP, and GIS in Yunnan Province, China. Arabian. J. Geosci. 14, 1–18. doi: 10.1007/s12517-021-07795-9
Zhang X., Zou Y., Li S., et al. (2019). A weighted auto regressive LSTM based approach for chemical processes modeling. Neurocomputing 367, 64–74. doi: 10.1016/j.neucom.2019.08.006
Zhao G., Mu X., Wen Z., et al. (2013). Soil erosion, conservation, and eco-environment changes in the Loess Plateau of China. Land Degrad. Dev. 24, 499–510. doi: 10.1002/ldr.2246
Zhao W., Wu H., Yin G., et al. (2019). Normalization of the temporal effect on the MODIS land surface temperature product using random forest regression. ISPRS. J. Photogramm. 152, 109–118. doi: 10.1016/j.isprsjprs.2019.04.008
Zheng F. L. (2006). Effect of vegetation changes on soil erosion on the Loess Plateau. Pedosphere 16, 420–427. doi: 10.1016/S1002-0160(06)60071-4
Zheng K., Wei J. Z., Pei J. Y., et al. (2019). Impacts of climate change and human activities on grassland vegetation variation in the Chinese Loess Plateau. Sci. Total. Environ. 660, 236–244. doi: 10.1016/j.scitotenv.2019.01.022
Keywords: Loess Plateau, global change, net primary productivity, ecological stress, response mechanism
Citation: Wang C, Zhang R, Chang L and Tian Q (2023) Contrasting response mechanisms and ecological stress of net primary productivity in sub-humid to arid transition regions: a case study from the Loess Plateau, China. Front. Ecol. Evol. 11:1157981. doi: 10.3389/fevo.2023.1157981
Received: 03 February 2023; Accepted: 31 October 2023;
Published: 21 November 2023.
Edited by:
Fang Chen, Chinese Academy of Sciences (CAS), ChinaReviewed by:
Qifei Zhang, Shanxi Normal University, ChinaXiangjin Shen, Chinese Academy of Sciences (CAS), China
Copyright © 2023 Wang, Zhang, Chang and Tian. This is an open-access article distributed under the terms of the Creative Commons Attribution License (CC BY). The use, distribution or reproduction in other forums is permitted, provided the original author(s) and the copyright owner(s) are credited and that the original publication in this journal is cited, in accordance with accepted academic practice. No use, distribution or reproduction is permitted which does not comply with these terms.
*Correspondence: Rui Zhang, emhhbmdydWlAcmFkaS5hYy5jbg==
†These authors have contributed equally to this work and share first authorship