 Bamei Tan
 Dandan Zhang
 Ying Tian
 Junxia Mao
 Xubo Wang1
 Yaqing Chang
 Zhenlin Hao
- 1Key Laboratory of Mariculture and Stock Enhancement in North China's Sea, Ministry of Agriculture, Dalian Ocean University, Dalian, Liaoning, China
- 2College of Life Science, Tarim University, Aral, China
To identify the genetic characteristics and local adaptation mechanism of the snail Neptunea cumingii in different sea areas of China, specimens from six coastal areas of the Yellow Sea and Bohai Sea were collected. Simplified genome technology was used to study the population genetic structure and genetic diversity level of N. cumingii and to infer the genetic variation pattern of environmental adaptation of this species. In total, 1992 discrete loci with high quality were obtained used for population genomics analysis. The observed heterozygosity was 0.1551–0.1612, and the expected heterozygosity was 0.1064–0.1117. Nucleotide diversity ranged from 0.1120 to 0.1241, and fixation index values ranged from −0.04683 to −0.02041. A total of 330 discrete loci were screened based on two fixation index values and a method associated with environmental factors. Functional annotation showed that the genes of discrete loci were involved in the three major functions of cell composition, biological process, and molecular function, including growth and development and cell metabolism and catalytic activity. These results suggested that different populations of N. cumingii had loci that may be related to local adaptation. The results of this study helped to clarify the level of genetic diversity and the germplasm genetic background of N. cumingii. They also provided information about the genetic mechanism of environmental adaptation of N. cumingii that can be applied to the restoration and management of N. cumingii resources.
1. Introduction
The marine snail Neptunea cumingii (Gastropoda, Probranchia, Neptunea, Mothidae) is a large cold water species that is mainly distributed in the Yellow Sea and Bohai Sea in China (Cai, 2001; Guo et al., 2015). It is a high value mariculture species due to its delicious taste and because it is rich in nutrients, including a variety of trace elements, unsaturated fatty acids, and various amino acids (Hao et al., 2016).
Previous studies of N. cumingii mainly focused on fishery resources (Guo et al., 2015), reproduction and development (Yu et al., 2019), and its breeding physiology and ecology (Ge et al., 2022; Zhang Q. H. et al., 2022; Zhang S. Y. et al., 2022), and little is known about its genetic diversity. Sui (2008) used microsatellite labeling technology to study the population structure of N. cumingii in the waters of Liaoning and Shandong in China, the results showed that the observed heterozygosity ranged from 0.173–0.865, the genetic similarity coefficient ranged from 0.858 to 0.992, the genetic distance ranged from 0.008 to 0.164, the similarity between the populations was great with the FST value 0.006–0.188. Which indicated that there was differentiation among different populations, but the differentiation was small. Wang (2018)studied the genetic diversity of the mitochondrial Cytochrome b (Cytb) gene in six populations of N. cumingii from the Yellow Sea and Bohai Sea. He found that intra-population differentiation was dominant and genetic differentiation was not obvious. Azuma et al. (2011)used microsatellite technology to study specimens from six geographic populations from Hokkaido, Japan, who suggested that the limited gene flow might be caused by the species’ poor dispersability, low genetic diversity and genetic differentiation between populations. Ma P. et al. (2022) and Ma C. L. et al. (2022) constructed microsatellite markers of snail populations in Dalian, Lushun and Weihai, and identified their genetic diversity by Illumina high-throughput sequencing and capillary electrophoresis. In recent years, few studies focused on the genetic diversity and genetic differentiation of N. cumingii population, and the existing studies mainly used microsatellite technology, which could not be used to conduct in-depth and accurate genetic analysis of N. cumingii populations.
The rapid development of high-throughput sequencing technology in recent years has resulted in unprecedented innovation in population genomics research. Simplified genome sequencing can identify a large number of mutation sites. Its relatively low cost is suitable for large-scale population studies, and it is often used for genetic mapping, genome-wide association analysis, and population genetic analysis (Emerson et al., 2010; Hohenlohe et al., 2010, 2011). Genotyping-by-sequencing (GBS) is a simplified genome analysis technique based on high-throughput second-generation sequencing. Restriction enzymes are used to segment and sequence the genome to obtain high-density single nucleotide polymorphisms (SNPs) throughout the genome, which can be used for genetic characterization analysis (Nimmakayala et al., 2014). The type II enzymes selected by GBS technology can well avoid the methylated part and determine which tags can be sequenced, especially for the species without reference genome at present, or species with highly repetitive DNA sequences and low polymorphism level in the genome have more advantages. Nowadays, using sequencing genotyping (GBS) technology to study the genetic structure of fish is becoming very mature. Létourneau et al. (2018) predicted the genetic impact of stocking in Brook Charr (Salvelinus fontinalis) by combining RAD sequencing and modeling of explanatory variables. Rougemont et al. (2019) used GBS to assess the effects on genetic structure and allelic diversity of indigenous species in a mass stocking of more than 1 million Muskellunge (Esox masquinongy) in the lower Lawrence River. Yu et al. analyzed the genetic structure and genetic diversity of two populations of Crassostrea gigas from the Bohai Sea and the Yellow Sea using GBS simplified genome sequencing technology. Which showed that although the genetic diversity of the Bohai Sea population was rich, both populations were in the state of heterozygote deletion. The population was moderately genetically differentiated. However, there were few reports on the genetic structure of shellfish using GBS technique.
In this study, GBS technology was used to study the genetic structure characteristics of six natural populations of N. cumingii in the Yellow Sea and Bohai Sea. From the perspective of the whole genome, the genetic diversity of the populations was systematically measured, the genetic structure of the population in the Bohai Sea and Yellow Sea was identified, and the genetic mechanism responsible for adaptation of different geographic populations to the local environment was evaluated. The results of this study provided an important reference for the conservation and management of N. cumingii genetic resources.
2. Materials and methods
2.1. Materials
From March to April 2021, 15 N. cumingii individuals were collected from each of six populations [Yantai (YT), Weihai (WH), Penglai (PL), Lvshun (LS), Heishijiao (HS), and Zhangzidao (ZZ)] and transported back to the Dalian Ocean University (Figure 1; Table 1). They were placed in six 500 L tanks according to their sampling location for temporary culture for 7 days, and 50% of the water volume was changed every day.
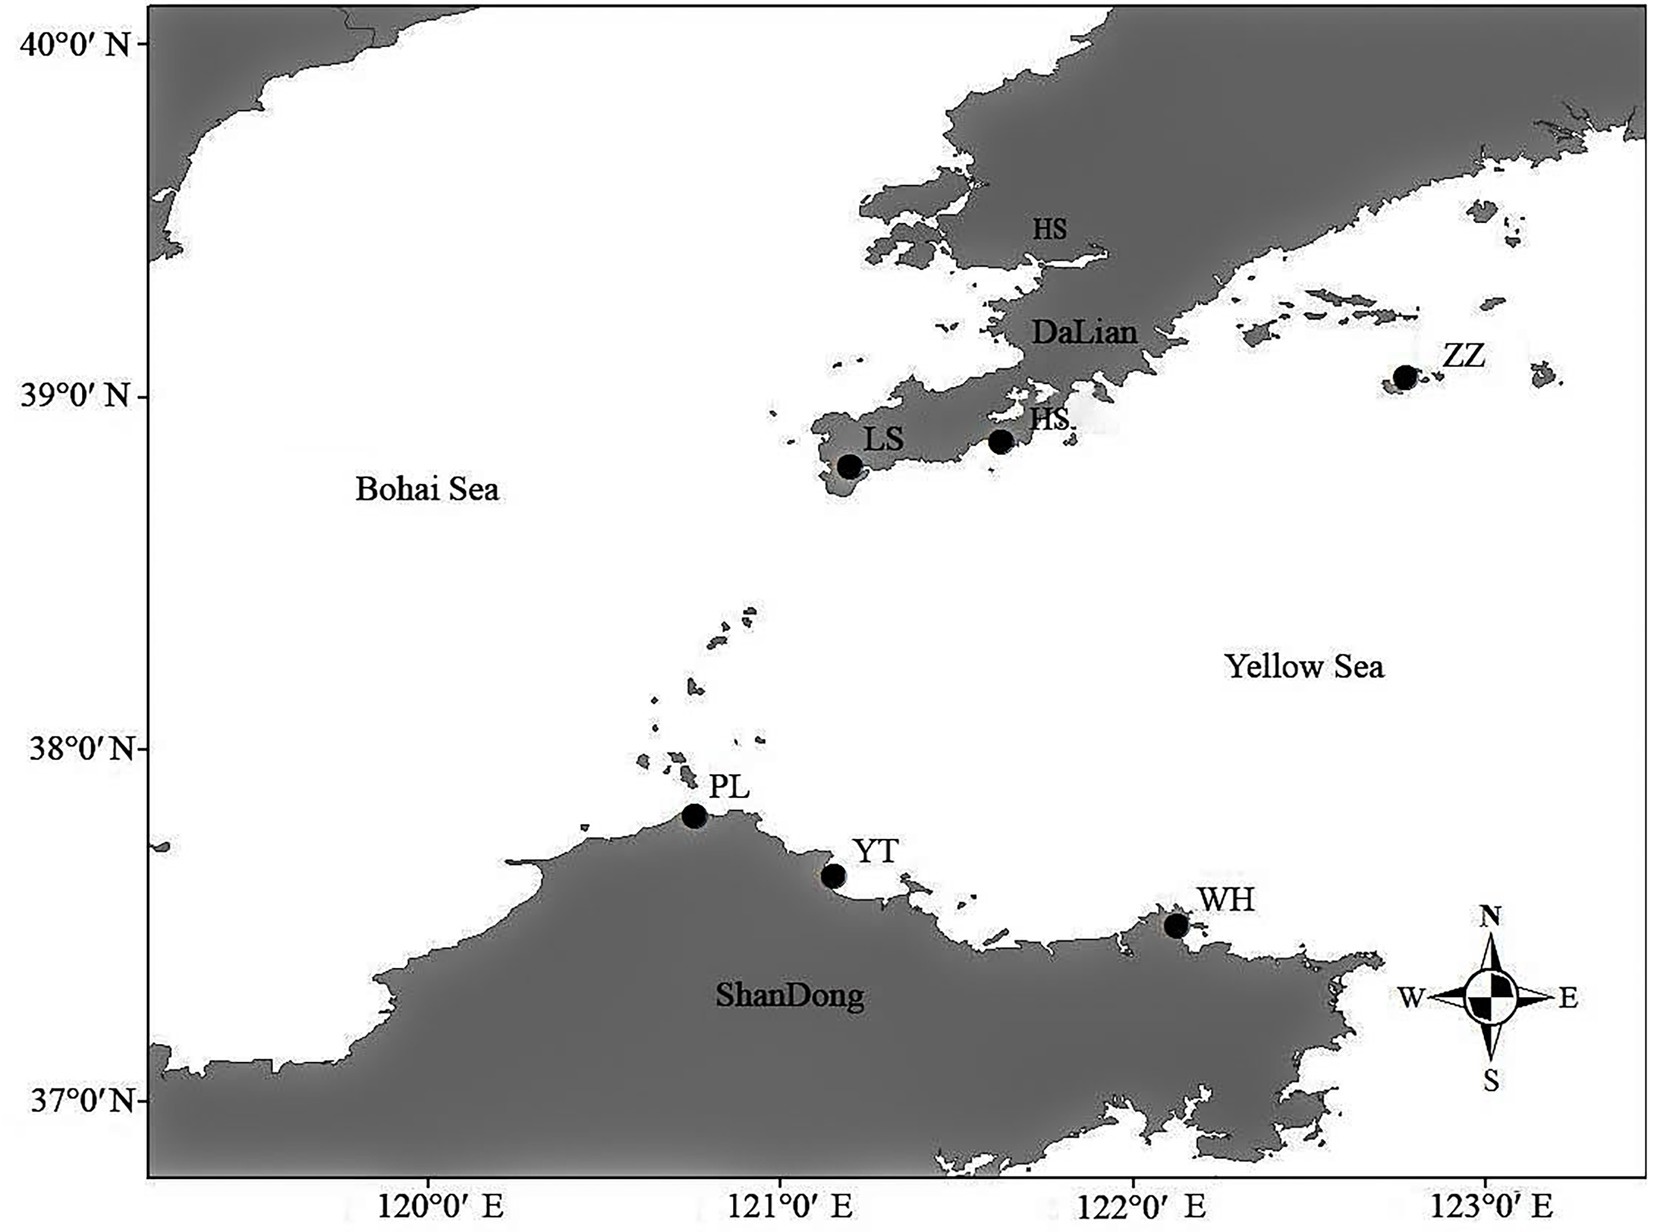
Figure 1. Collection locations of Neptunea cumingii.
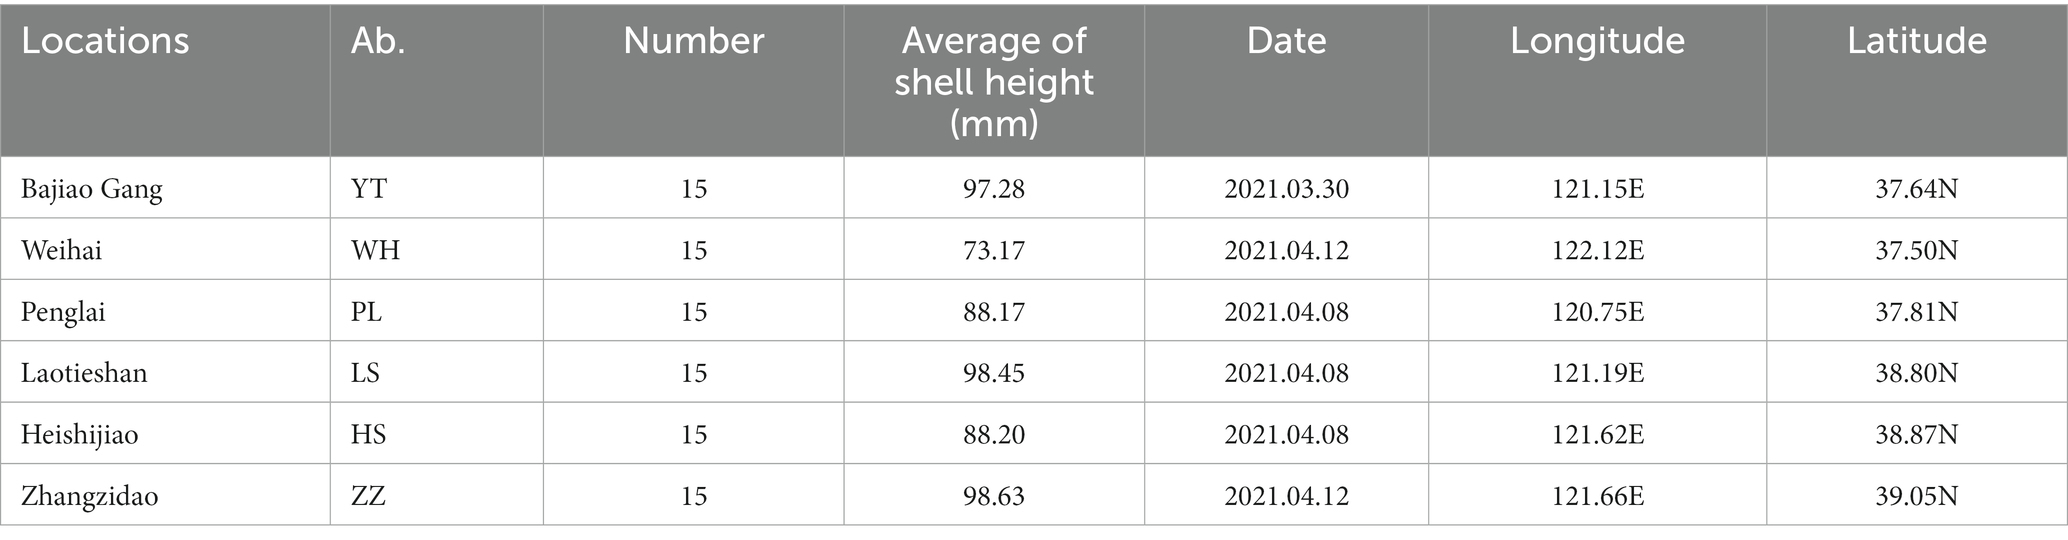
Table 1. Summary of Neptunea cumingii samples used in the study.
2.2. Genomic DNA extraction
The abdominal muscle tissue (≥100 mg) from 90 specimen was removed, frozen in liquid nitrogen, and placed in a centrifuge tube for DNA extraction. Genomic DNA was extracted using a salting out protocol (Sunnucks and Hales, 1996). For nuclear SNP marker development, we performed DNA quality assurance, including a restriction enzyme digest using EcoRI (New England Biolabs, Ipswich, MA, United States; Online Resource 1). Finally, we measured DNA concentrations spectrophotometrically (NanoDrop 1000, Thermo Scientific, Waltham, MA, United States) and verified DNA integrity electrophoretically using agarose gel electrophoresis (0.8% agarose in 1× TBE buffer).
2.3. GBS library
Sequencing libraries were prepared according to the GBS protocol following (Elshire et al., 2011), except the selective primers described below were used. Single-end sequencing was performed on a single lane of an Illumina Genome Analyzer II (at the McGill University-Génome Québec Innovation Center in Montreal, Canada) for the initial step of the method using a 48-plex GBS library, of which eight barcodes were devoted to soybean Set A. Subsequent work was performed on an Illumina HiSeq2000 system (San Diego, CA, United States).
2.4. SNP detection and screening
SAMTOOLS (Li and Durbin, 2009) software was used to detect SNP in the filtered raw data. The filtering criteria were as follows: individual depth = 4, deletion rate miss = 0.5, and minimum allele frequency min/max autocorrelation factors = 0.01. Bayesian model was used to detect polymorphic loci in populations. Finally, SNP sites were screened, and the criteria were: SNP quality value ≥30 (Q30); SNP reads support number ≥ 20; Individual coverage rate ≥ 66.7%; Minimum allele frequency (MAF) ≥5%; This SNP is retained when the allele frequency of a population is >0.2.
2.5. Genetic analysis
The evolutionary tree was constructed using the neighbor-joining method. After SNP detection, the individual SNPs obtained were used to calculate the distance between populations. Treebest-1.9.2 software was used to calculate the distance matrix. GCTA software was used for principal component analysis (min/max autocorrelation factors ≥0.05). Observed heterozygosity (HO) and expected heterozygosity (HE) per sampling location were calculated using the R package “hierfstat.” An analysis of molecular variance (AMOVA) was performed in Arlequin v.3.5 using 10,000 permutations to estimate F-statistics in order to detect population genetic partitioning between sampling locations and to estimate nucleotide diversity (Pi). Pairwise differences between localities were calculated with Nei’s estimator of fixation index (FST) in the “hierfstat” R package; 999 permutations were used to calculate the respective p-values with B-Y false discovery rate (FDR) correction. The Bayesian information criterion was used to detect the optimal number of genetic clusters. PLINK was used to analyze population structureFirstly, PLINK’s input file, Ped file, is created, and then admixture (Hu et al., 2019) software is used to construct population genetic structure and population lineage information. PLINK.1
2.6. Screening, functional annotation, and enrichment analysis of discrete sites
Lositan, BayeScan, and BayeNV were used to select the discrete sites from the filtered high-quality SNPs. Lositan and BayeScan software were used to screen the discrete sites based on FST. Lositan analyses were performed with 1,000,000 simulations and a subsample of 50 in an infinite allele model using a “neutral” mean FST (which means that the software performs a preliminary simulation to remove potentially selected loci before computing the mean neutral FST). Benjamini–Yekutieli FDR corrections were applied to the p-values of Lositan with an overall alpha level of 0.01. BayeScan search was implemented with 150,000 iterations, with a burn-in period of 100,000 and 40 pilot runs of 10,000 iterations each. Outlier loci in BayeScan were identified using a q-value of 0.01. BayeNV, which is associated with SNPs and environmental factors, allowed discrete sites associated with local adaptation to be further screened. In this process, the Markov Chain Monte Carle estimates the covariance matrix and then screens for discrete sites associated with environmental variables using a Bayesian factor, and Bayesian factor screening for discrete sites associated with environmental variables and an FST discrete SNP marker was the adaptive locus.
The sequences of the candidate loci for local adaptation. The scaffold accession number, nucleotide position, name of the gene where the sequence is located, and position were recorded for matches with E-values <1 × 10⁻⁴. Those loci then subjected to BLAST2GO functional annotation analysis using the Gene Ontology (GO) database.
In this study, four geographical environmental factors were analyzed: latitude and longitude for each sampling point and the average sea surface water temperature for each sampling point 30 days and 90 days before sample collection. The water temperature data were downloaded from the national weather service satellite information database.2
3. Results
3.1. Sequencing quality and SNP detection
Genotyping GBS sequencing results showed that 15 individuals in the HS group, 14 in the LS group, 15 in the PL group, 15 in the WH group, 14 in the YT group, and 8 in the ZZ group were sequenced successfully and produced 38602677472.00 bp of raw reads, with an average of 476576265.09 bp per individual (Table 2). After quality filtering, 36720237888.00 bp of valid data were obtained, with an average of 453336270.22 clean reads per individual. The GC content of clean reads was between 38.91% and 41.16%. The Q20 quality scores ranged from 91.41% to 96.09% and those of Q30 ranged from 81.28% to 90.81%, indicating that GBS sequencing results had high quality and could be used for subsequent analysis.
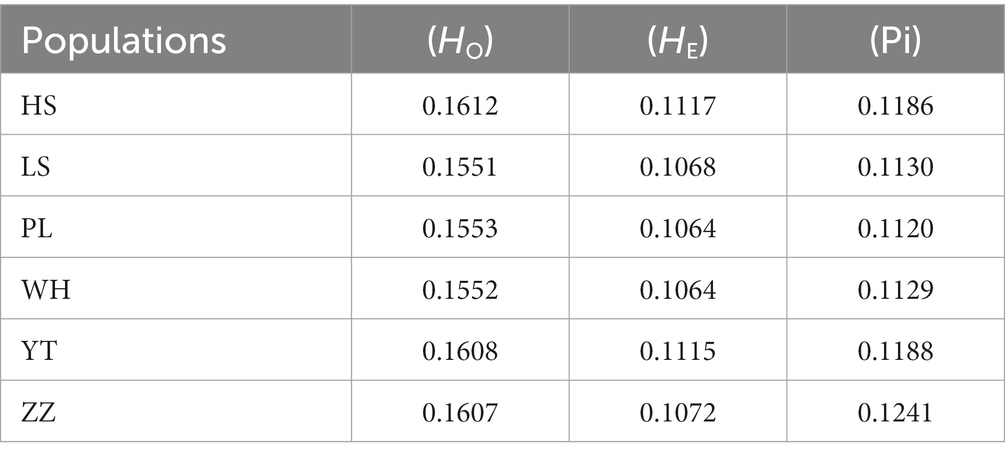
Table 2. Statistics of diversity parameters of the N. cumingii populations.
Among the clean reads, 115,615 SNPs were detected by SAMTOOLS software. The filtering criteria were as follows: individual depth = 4, deletion rate miss = 0.5, and minimum allele frequency min/max autocorrelation factors = 0.01. Ultimately, 1992 high quality SNP sites were obtained.
3.2. Population genetic diversity
To assess the genetic diversity of different populations, HO, HE, and nucleotide diversity (Pi) of the SNPs of the six populations were analyzed. The HO of the six populations ranged from 0.1551 (LS) to 0.1612 (HS), the HE ranged from 0.1064 (PL, WH) to 0.1117 (HS), and the Pi ranged from 0.1120 (PL) to 0.1241 (ZZ) (Table 2). HE was lower than HO. Among the six populations, the heterozygosity of the HS, YT, and ZZ populations was higher, and the Pi of the ZZ population was highest.
3.3. Population genetic differentiation
In the analysis of the population genetic structure of the six populations, the results of principal component analysis showed that WH and ZZ groups are relatively independent and the other four samples were clustered together (Figure 2). The results are consistent with those of phylogenetic tree analysis (Figure 3). When K = 2, the CVerror value was the smallest, thus it was the optimal K value. This indicated that the N. cumingii belonged in two clusters (Figure 4), which suggested that there was no significant genetic differentiation among different geographical populations. The FST between populations ranged from −0.04683 (YT) to −0.02041 (HS) (Table 3). The FST values were low, indicating that there was low genetic differentiation among the populations. Analysis of molecular variance (AMOVA) showed that 0.27% of genetic differences came from among populations and 100.80% from within populations (Table 4).
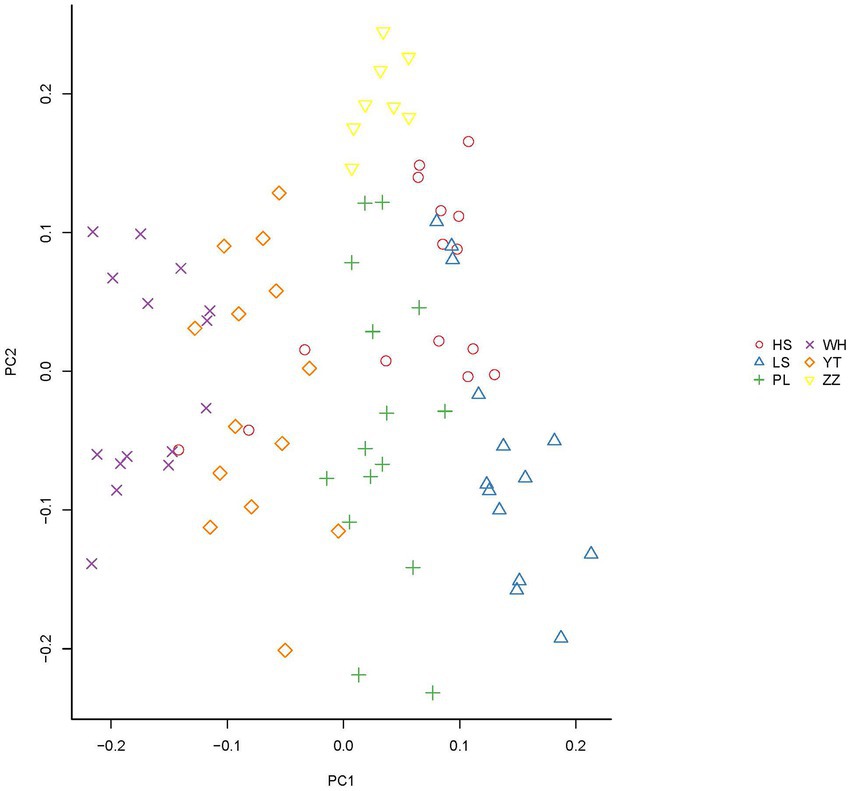
Figure 2. Principal component analysis results for the N. cumingii from the six populations.
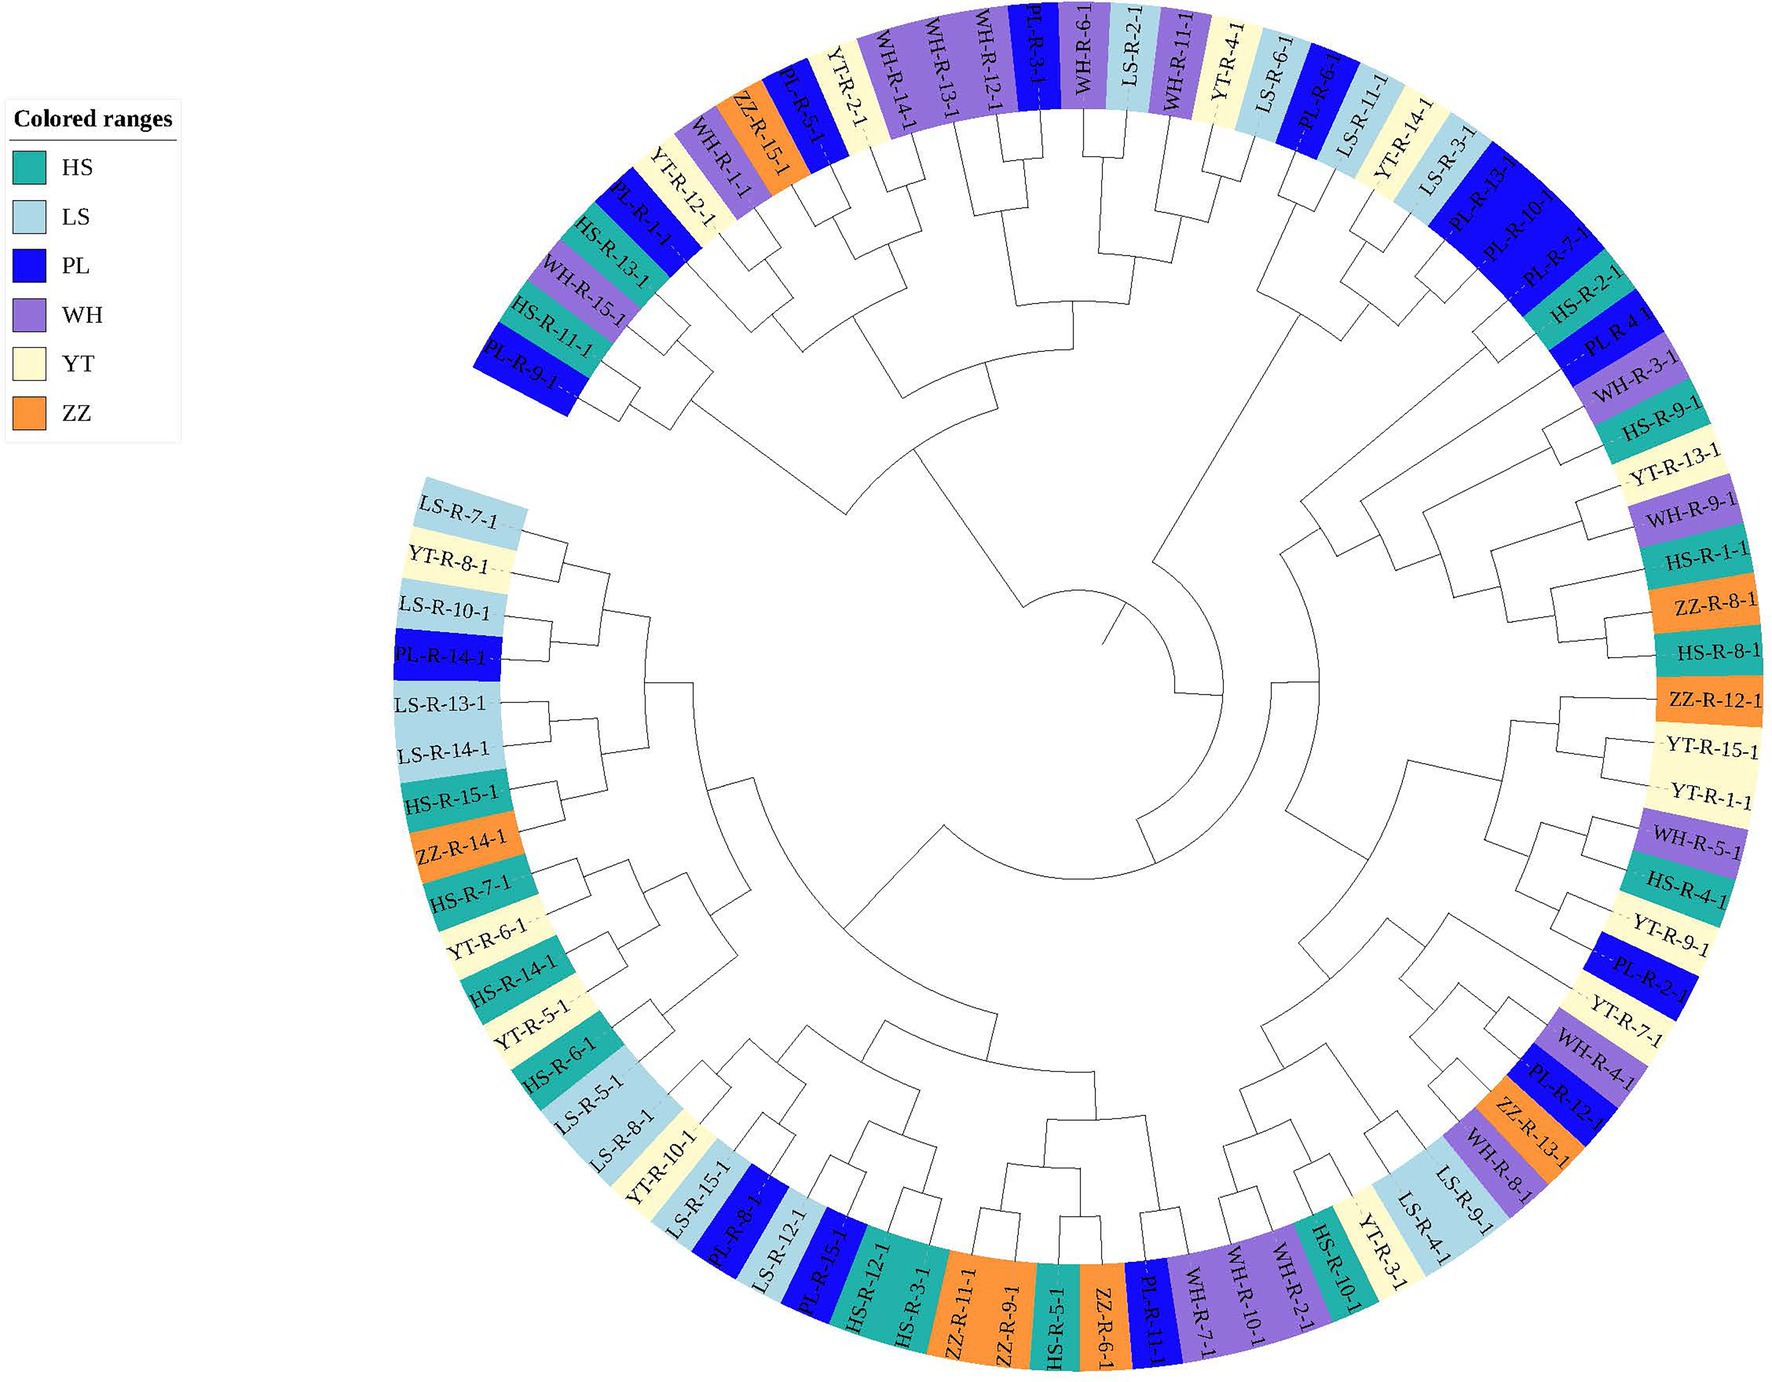
Figure 3. Phylogenetic tree of N. cumingii from the six populations.
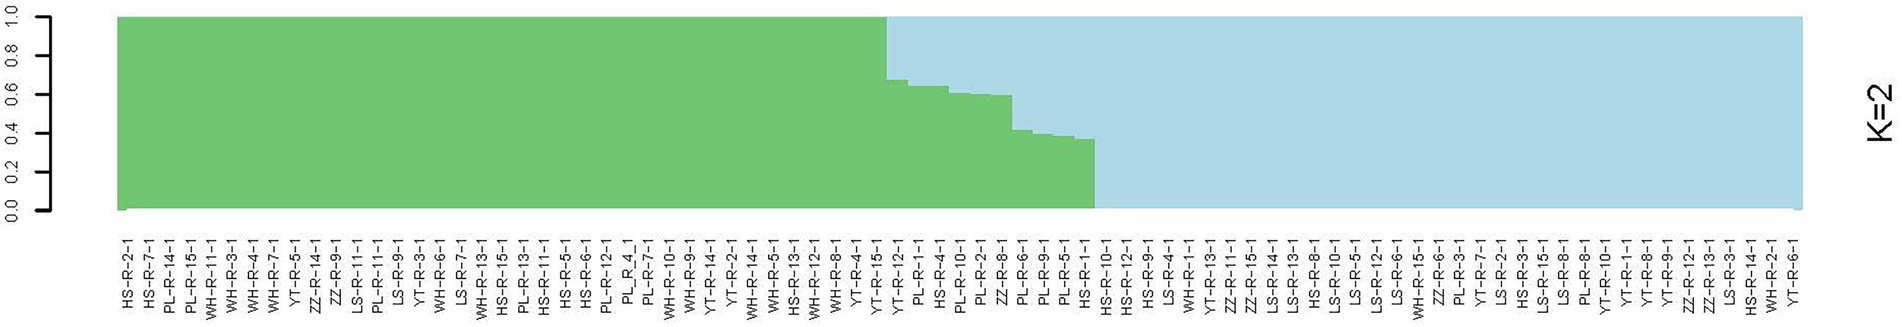
Figure 4. Genetic structure diagram of N. cumingii from the six populations.
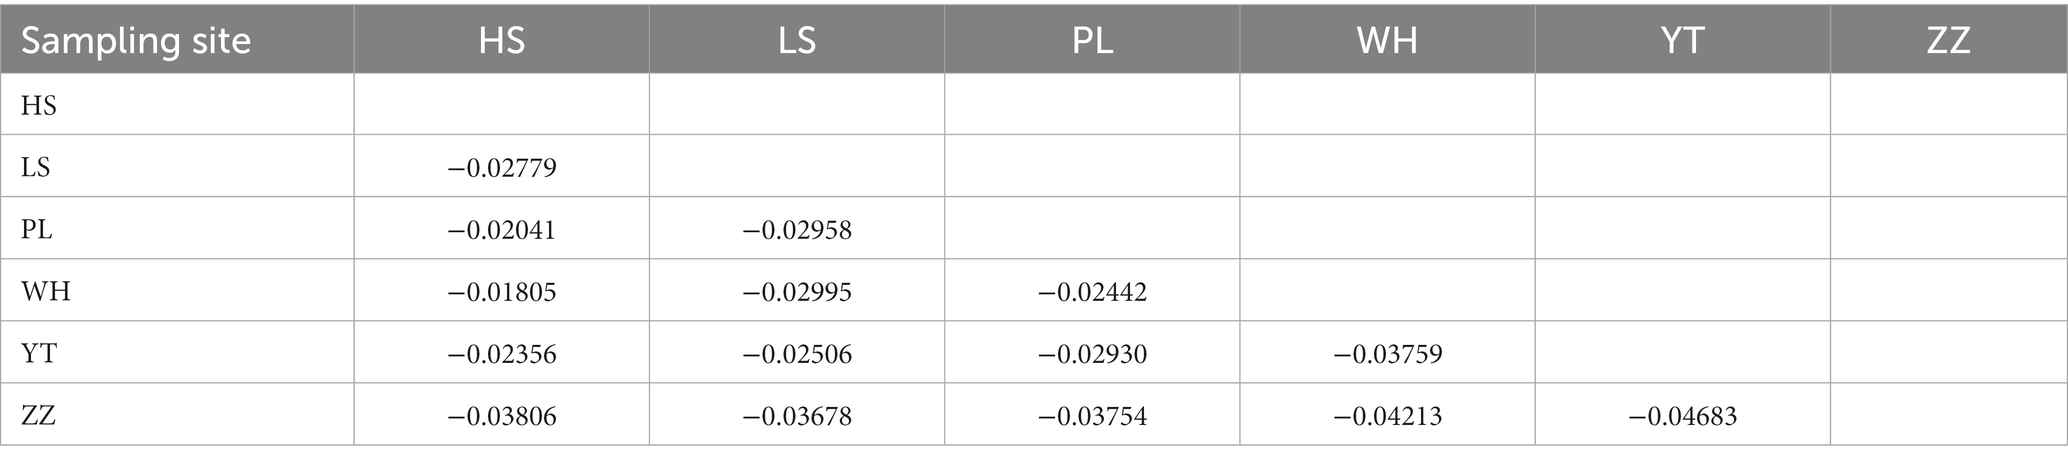
Table 3. Statistical table of FST analysis of different groups of N. cumingii.
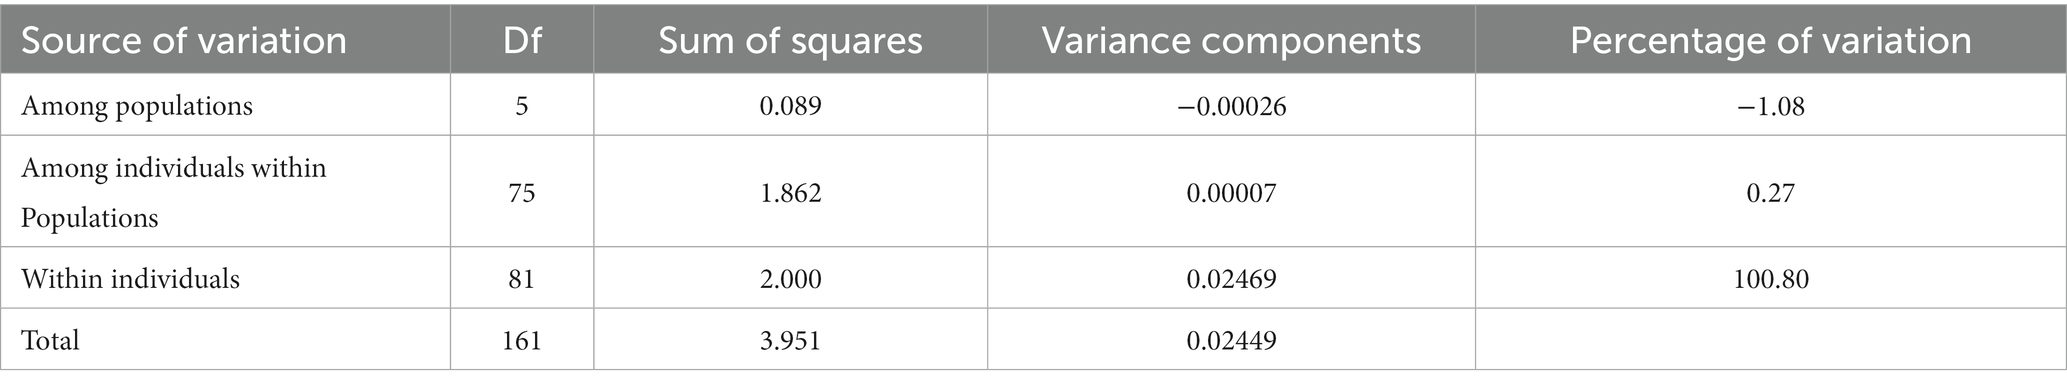
Table 4. AMOVA results for N. cumingii.
3.4. Local adaptation of populations
3.4.1. Screening of discrete sites
Fifty-nine discrete loci subjected to directional selection were selected based on the Lositan and BayeScan methods, and these loci had relatively FST values (−0.04683 to –0.02041). A total of 287 discrete loci were screened based on BayeNV association analysis of allele frequency and four environmental factors. Among these loci, 143 were associated with longitude and 83 were associated with latitude, and only 6 were jointly associated with these two factors. The results for discrete sites screened based on the two water temperatures differed significantly. The average water temperature factor 30 days before sampling was associated with 37 sites, and the average water temperature factor 90 days before sampling was associated with 116 sites. Only nine loci were jointly associated with these two factors.
3.4.2. Functional annotation and enrichment of discrete sites
Discrete loci were screened online using BlastX for gene function annotation. The results showed that 67 sequences had comparison results and 263 sequences had no comparison results. Blast2GO was used to carry out functional annotation for the 67 sequences with alignment results, and only 15 of them were mapped to the GO database. Based on the GO database analysis, these 15 sequences were involved in Biological Process (BP), Cellular Component (CC), and Molecular Function of the population, and their major functions included stress response metabolic process, biological regulation, catalytic activity, and other functional processes.
4. Discussion
4.1. Genetic diversity of Neptunea cumingii populations
Genetic diversity is the sum of genetic variation between different populations or different individuals in the same population, and it is the basis for organisms to adapt to changes in environmental conditions and maintain long-term survival and evolution (Jia et al., 2020). Richer genetic diversity results in stronger breeding and genetic improvement abilities of the species and better adaptability to different environments (Xue, 2015). Heterozygosity is an important index for evaluating the genetic diversity of a population. Populations with higher heterozygosity have richer population genetic diversity (Nei, 1978). Yu et al. (2017) used GBS technology nanalyzed the genetic diversity of the Pacific oyster (Crassostrea gigas) along the coast of Liaoning in the Yellow Sea and Bohai Sea and found that the average HO of the two populations was 0.2277 and 0.1723, respectively, and the HE was 0.2705 and 0.2375, respectively. These values indicated that the two populations were in a state of heterozygote loss. Previous studies have shown that the genetic diversity of shellfish was relatively rich, and the average heterozygosity was usually above 0.15 (Zhang et al., 2004).
In this study, the HO values of the six populations in the Yellow Sea and Bohai Sea were all higher than the He values. Sui (2008)studied the genetic diversity of the N. cumingii population and found that the heterozygosity was 0.594, and Azuma et al. (2011) used microsatellite markers found that the heterozygosity was 0.580–0.811 in the study of important resources of N. cumingii in northern Japan, but in the study, the HO of the six populations of N. cumingii in the Yellow Sea and Bohai Sea ranged from 0.1551 to 0.1612, and the He was 0.1064 to 0.1117. The low level of heterozygosity was likely due to the methodology used in this study, which was very different from methods based on traditional molecular markers. Traditional methods only select a few marker loci as representative of the diversity of the whole genome. In contrast, the method used herein screens gene loci for the whole population based on population genomics. In addition, the genetic diversity of the six natural N. cumingii populations could be influence by differences in invalid alleles or the presence of non-random mating within the population.
4.2. Genetic differentiation of Neptunea cumingii populations
Genetic differentiation is the differentiation of a population caused by gene variation, and the FST value is an important index of the degree of population genetic differentiation (Fu et al., 2013).
In the present study, the FST of the six populations ranged from −0.04683 (YT) to −0.02041 (HS). The small FST values indicated that there was low genetic differentiation among the six populations. Consistent with the results of principal component analysis, the WH and ZZ populations were separated from each other and the samples from the other geographical groups were clustered into one place without any obvious population genetic differentiation, in which the HS, LS, PL, and YT snails live is similar. Guess it might be because, the geographical distance between the WH and ZZ groups and their environment and food are quite different from those of the other four locations, which may explain their relative independence.
The genetic differentiation of the six N. cumingii populations in this study was lower than that reported in previous studies. Although a certain amount of differentiation was detected, no significant population geographic isolation was found, Wang (2013) used 16SrRNA to study the genetic diversity of the snails Thais luteostoma and Reishia clavigera and found that the genetic differentiation of both species differed greatly within the population, and no obvious genetic differentiation between the populations was detected. In this study, AMOVA indicated that only 0.27% of the genetic differences came from between populations and 100.80% came from within populations. The frequency of gene communication between populations may decrease with increasing geographical distance, so genetic differentiation At sites that are farther away from eacho ther is more likely to occur. However, several researchers found that there may be no significant correlation between genetic distance and geographical distance between populations due to the effect of different environments (Zhu et al., 2007; Liu et al., 2016). In the current study, salinity, water temperature, sediment type, feed, and other factors differed among sea areas of the Yellow Sea and Bohai Sea. Because different environments affected the degree of genetic differentiation, the degree of genetic differentiation among populations may not fully conform to the characteristics of geographical distribution.
4.3. Local adaptation of Neptunea cumingii populations
Local adaptation refers to the evolutionary process in which some groups of species are better adapted to the environment than others. The essence of local adaptation is frequent gene exchange between groups, resulting in population differentiation and trait differences, which can be inherited. In different environments, the genetic basis changes to adapt to environmental changes (Gienapp et al., 2008; Valladares et al., 2014), and differences in genetic components of different geographic populations are caused by the effects of natural selection on different populations (Thompson, 1998).
Use of the simplified genome sequencing echnique and Kyoto Encyclopedia of Genes and Genomes (KEGG) metabolic pathway analysis revealed that some metabolic pathways, such as calcium ion signaling and circadian rhythm, may be involved in local environmental adaptation of eel populations in different geographical regions (Gagnaire et al., 2012; Ulrik et al., 2014). In the current study, the annotation results of discrete sites showed that multiple discrete sites were related to energy metabolism, indicating that when the temperature was low, snails would use the stored energy in the body to adapt to environmental changes. Genes related to ion and membrane transport were also involved in the regulation of osmotic pressure, which played an important role in the adaptation to environmental changes (temperature). Previous reports showed that under heterogeneous conditions such as changing climate, water level, and disturbance in the environment, disproportionate selection led to the development of anisotropic traits in the population, thus generating local adaptation (Ravenscroft et al., 2014).
Adaptation is the result of interaction among various evolutionary forces, such as selection, genetic drift, mutation, and migration, and local adaptation of N. cumingii may be affected by many factors, including water quality, heavy metals, water temperature, salinity, parasites, predators, and physiological effects. The mechanism responsible for local adaptation may be very complex, as various factors interact to promote local adaptation. In summary, the signs of adaptive differentiation between populations based on SNP markers detected in this study were evidence of local adaptation on a micro-time scale, and the annotation results for discrete sites indicated the existence of local adaptation in different populations of N. cumingii.
4.4. Conservation of Neptunea cumingii resources
The results of genetic diversity and genetic difference level in population genetics can provide some theoretical basis for resource conservation. Therefore, in this study, the genetic characteristics of the N. cumingii population in China were preliminarily analyzed, and the results provide a theoretical basis for the formulation of relevant regulations and measures. The following methods can be adopted to protect and utilize the wild N. cumingii resources: (1) establish a key protection system for this species; (2) stipulate a strict fishing moratorium system; (3) strictly demarcate no-fishing zones; and (4) strengthen the protection of snails during breeding. In addition, appropriate artificial seedling cultivation or semi-artificial seedling collection can be conducted according to the geographical location of the snail population to implement proliferation and release, which can quickly restore the snail resources. However, more genetic information about the population genetic structure and characteristics of the N. cumingii population in China is needed.
Data availability statement
The datasets presented in this study can be found in online repositories. The names of the repository/repositories and accession number(s) can be found at: https://www.ncbi.nlm.nih.gov/, PRJNA929455.
Ethics statement
The animal study was reviewed and approved by University Animal Care and Use Committee of Dalian Ocean University.
Author contributions
ZH and YC designed the study. DZ, YT, and JM performed the study. LW, XW, and BT analyzed the data. BT wrote the manuscript. All authors contributed to the article and approved the submitted version.
Funding
This study was supported by funds from Marine Economy Development Special Project of Liaoning Province Department of Natural Resources, National Natural Science Foundation of China (42076101), General Project of Education Department of Liaoning Province (LJKZZZ0700), Project of Liaoning Provincial Natural Resources Department and Dalian key Research and Development Project (2021YF16SN015).
Acknowledgments
The authors wish to express thanks to the staffs of Key Laboratory of Mariculture and Stock Enhancement in North China’s Sea, Ministry of Agriculture, China for their help with the experiment. The authors are also grateful to the reviewers for the great elaboration of the manuscript through their critical reviewing and comments. In addition, the author would like to thank the International Science Editing Company for helping to improve the language ability of this article.
Conflict of interest
The authors declare that the research was conducted in the absence of any commercial or financial relationships that could be construed as a potential conflict of interest.
Publisher’s note
All claims expressed in this article are solely those of the authors and do not necessarily represent those of their affiliated organizations, or those of the publisher, the editors and the reviewers. Any product that may be evaluated in this article, or claim that may be made by its manufacturer, is not guaranteed or endorsed by the publisher.
Supplementary material
The supplementary material for this article can be found online at: https://www.frontiersin.org/articles/10.3389/fevo.2023.1154781/full#supplementary-material
Footnotes
1. ^http://pngu.mgh.harvard.edu/~purcell/plink/
2. ^http://iridl.ldeo.columbia.edu/SOURCES/.NOAA/.NCDC/.OISST
References
Azuma, N., Miranda, R. M., Goshima, S., and Abe, S. (2011). Genetic population structure of Neptune whelk in northern Japan inferred from microsatellite DNA variation. Plankton Benthos Res. 6, 42–50. doi: 10.3800/pbr.6.42
Cai, Q. H. (2001). Resource protection measures and processing methods of Neptunea cumingii. China Fish. 10: 73.
Elshire, R. J., Glaubitz, J. C., Sun, Q., Poland, J. A., Kawamoto, K., Buckler, E. S., et al. (2011). A robust, simple genotyping-by-sequencing (GBS) approach for high diversity species. PLoS One 6:e19379. doi: 10.1371/journal.pone.0019379
Emerson, K. J., Merz, C. R., Catchen, J. M., Hohenlohe, P. A., Cresko, W. A., Bradshaw, W. E., et al. (2010). Resolving postglacial phylogeography using high-throughput sequencing. Proc. Natl. Acad. Sci. U. S. A. 107, 16196–16200. doi: 10.1073/pnas.1006538107
Fu, J. J., Li, J. L., Shen, Y. B., Wang, R. Q., Xuan, Y. F., Xu, X. Y., et al. (2013). Genetic variation analysis of wild populations of grass carp (Ctenopharyngodon idella) using microsatellite markers. Hereditas 35, 192–201. doi: 10.3724/SP.J.1005.2013.00192
Gagnaire, P.-A., Normandeau, E., Côté, C., Møller Hansen, M., and Bernatchez, L. (2012). The genetic consequences of spatially varying selection in the Panmictic American eel (Anguilla rostrata). Genetics 190, 725–736. doi: 10.1534/genetics.111.134825
Ge, X., Zhao, J., Liang, Z., Chi, Q., Mao, J., Wang, X., et al. (2022). Comparative analysis of Neptunea cumingii growth, related digestive and immune enzyme indicators, and liver transcriptome under different feeding conditions. Front. Mar. Sci. 9:1013180. doi: 10.3389/fmars.2022.1013180
Gienapp, P., Teplitsky, C., Alho, J. S., Mills, J. A., and Merilä, J. (2008). Climate change and evolution: disentangling environmental and genetic responses. Mol. Ecol. 17, 167–178. doi: 10.1111/j.1365-294X.2007.03413.x
Guo, D., Liu, X. Z., Wang, A. Y., Wang, B., Li, Y. P., and Dong, J. (2015). Stock distribution of whelk Neptunea cumingii Crosse in Liaodong Bay. Fish. Sci. 34, 718–721. doi: 10.16378/j.cnki.1003-1111.2015.11.009
Hao, Z. L., Wang, Y., Yu, Y. Y., Zhan, Y. Y., Tian, Y., Wang, L., et al. (2016). Analysis and evaluation of nutritive composition in the muscle of Neptunea arthritica cumingii Crosse (Gastropoda: Buccinidae). J. Dalian Univ. 37, 66–70.
Hohenlohe, P. A., Amish, S. J., Catchen, J. M., Allendorf, F. W., and Luikart, G. (2011). Next-generation RAD sequencing identifies thousands of SNPs for assessing hybridization between rainbow and westslope cutthroat trout: SNP discovery: next generation sequencing. Mol. Ecol. Resour. 11, 117–122. doi: 10.1111/j.1755-0998.2010.02967.x
Hohenlohe, P. A., Bassham, S., Etter, P. D., Stiffler, N., Johnson, E. A., and Cresko, W. A. (2010). Population genomics of parallel adaptation in Threespine stickleback using sequenced RAD tags. PLoS Genet. 6:e1000862. doi: 10.1371/journal.pgen.1000862
Hu, Y., Resende, M. F. Jr., Bombarely, A., Brym, M., Bassil, E., and Chambers, A. H. (2019). Genomics-based diversity analysis of vanilla species using a Vanilla planifolia draft genome and genotyping-by-sequencing. Sci. Rep. 9:3416. doi: 10.1038/s41598-019-40144-1
Jia, L., Liu, H., Zhang, B., Chen, C. X., Dai, Y. Y., He, X. X., et al. (2020). Analysis of genetic diversity of wild and cultivated populations of Cynoglossus semilaevis based on genotyping-by-sequencing technology. Trans. Oceanol. Limnol. 1, 107–114. doi: 10.13984/j.cnki.cn37-1141.2020.01.014
Létourneau, J., Ferchaud, A. L., Le Luyer, J., Laporte, M., Garant, D., and Bernatchez, L. (2018). Predicting the genetic impact of stocking in brook Charr (Salvelinus fontinalis) by combining RAD sequencing and modeling of explanatory variables. Evol. Appl. 11, 577–592. doi: 10.1111/eva.12566
Li, H., and Durbin, R. (2009). Fast and accurate short read alignment with burrows–wheeler transform. Bioinformatics 25, 1754–1760. doi: 10.1093/bioinformatics/btp324
Liu, H. Y., Chen, X. H., and Xiong, F. (2016). Population genetic structure of Pelteobagrus fulvidraco in the lakes of the middle and lower reaches of the Yangtze River and in Fuxian Lake of Yunnan. J. Central China Normal Univ. 50, 269–275. doi: 10.19603/j.cnki.1000-1190.2016.02.018
Ma, C. L., Shan, C. F., Li, X. M., Wang, S. Y., Liu, X. X., and Wang, G. Y. (2022). Protection and sustainable utilization of marine fishery resources. Heilongjiang Huanjing Tongbao. 35, 22–23.
Ma, P., Zhang, T., Li, H., and Wang, H. (2022). Construction and characterization of microsatellite markers for the Neptune whelk, Neptunea cumingii. Mol. Biol. Rep. 49, 9065–9069. doi: 10.1007/s11033-022-07639-z
Nei, M. (1978). Estimation of average heterozygosity and genetic distance from a small number of individuals. Genetics 89, 583–590. doi: 10.1093/genetics/89.3.583
Nimmakayala, P., Levi, A., Abburi, L., Abburi, V. L., Tomason, Y. R., Saminathan, T., et al. (2014). Single nucleotide polymorphisms generated by genotyping by sequencing to characterize genome-wide diversity, linkage disequilibrium, and selective sweeps in cultivated watermelon. BMC Genomics 15:767. doi: 10.1186/1471-2164-15-767
Ravenscroft, C. H., Fridley, J. D., and Grime, J. P. (2014). Intraspecific functional differentiation suggests local adaptation to long-term climate change in a calcareous grassland. J. Ecol. 102, 65–73. doi: 10.1111/1365-2745.12168
Rougemont, Q., Carrier, A., Le Luyer, J., Ferchaud, A. L., Farrell, J. M., Hatin, D., et al. (2019). Combining population genomics and forward simulations to investigate stocking impacts: a case study of muskellunge (Esox masquinongy) from the St. Lawrence River basin. Evol. Appl. 12, 902–922. doi: 10.1101/36328
Sui, N. (2008). The analysis of the genetic diversity of different population of Neptunea cumingii Crosse using SSR marker, Liaoning Normal University.
Sunnucks, P., and Hales, D. F. (1996). Numerous transposed sequences of mitochondrial cytochrome oxidase I-II in aphids of the genus Sitobion (Hemiptera: Aphididae). Mol. Biol. Evol. 13, 510–524. doi: 10.1093/oxfordjournals.molbev.a025612
Thompson, J. N. (1998). Rapid evolution as an ecological process. Trends Ecol. Evol. 13, 329–332. doi: 10.1016/S0169-5347(98)01378-0
Ulrik, M. G., Pujolar, J. M., Ferchaud, A.-L., Jacobsen, M. W., Als, T. D., Gagnaire, P. A., et al. (2014). Do North Atlantic eels show parallel patterns of spatially varying selection? BMC Evol. Biol. 14:138. doi: 10.1186/1471-2148-14-138
Valladares, F., Matesanz, S., Guilhaumon, F., Araújo, M. B., Balaguer, L., Benito-Garzón, M., et al. (2014). The effects of phenotypic plasticity and local adaptation on forecasts of species range shifts under climate change. Ecol. Lett. 17, 1351–1364. doi: 10.1111/ele.12348
Wang, X. (2013). Research on genetic diversity of Thais luteostoma and Thais clavigera, Zhejiang Ocean University.
Xue, D. (2015). Genetic diversity of 9 populations of Protosalanx hyalocranius in China based on Cytb sequences, Jinan University.
Yu, M. S., Gao, L., Wang, W., He, C. B., Bao, X. B., and Tian, M. L. (2017). Genetic diversity of oyster in the Yellow Sea and Bohai Sea in Liaoning Province. J. Econ. Animal. 21, 215–220. doi: 10.13326/j.jea.2017.1232
Yu, Y. Y., Li, J., Wu, W., and Hao, Z. L. (2019). Research progress on the reproductive biology and artificial breeding technology of the N.arthritica cumingii. Hebei Fisheries. 4, 54–56. doi: 10.3969/j.issn.1004-6755.2019.04.014
Zhang, G. F., Liu, X., Que, H. Y., and Niu, F. (2004). The theory and application of hybridization and heterosis in marine mollusk. Mar. Sci. 28, 54–60.
Zhang, Q. H., Wang, S. J., Tian, Y., Wang, L., Mao, J. X., Wang, X. B., et al. (2022). Effects of dissolved oxygen concentration on behavior, antioxidant enzyme activities and tissue structure of whelk Neptunea cumingii Crosse. J. Dalian Ocean Univ. 37, 643–649. doi: 10.16535/j.cnki.dlhyxb.2021-309
Zhang, S. Y., Wang, S. J., Yang, J. C., Zhu, J. Y., Tian, Y., Wang, L., et al. (2022). Effects of salinity on behavior, activities of antioxidant enzymes and tissue structure of gill and kidney of whelk Neptunea cumingii Crosse. Mar. Sci. 46, 129–139. doi: 10.11759/hykx20211020004
Keywords: Neptunea cumingii, simplified genome technology, GBS, SNPs, population genetic structure, genetic diversity, genetic differentiation, local adaptability
Citation: Tan B, Zhang D, Tian Y, Mao J, Wang X, Wang L, Chang Y and Hao Z (2023) Genetic structure and local adaptation of Neptunea cumingii crosse populations in China based on GBS technology. Front. Ecol. Evol. 11:1154781. doi: 10.3389/fevo.2023.1154781
Edited by:
Hui Zhang, Institute of Oceanology (CAS), ChinaReviewed by:
Na Song, Ocean University of China, ChinaMing Liu, Morgan State University, United States
Shengyong Xu, Zhejiang Ocean University, China
Copyright © 2023 Tan, Zhang, Tian, Mao, Wang, Wang, Chang and Hao. This is an open-access article distributed under the terms of the Creative Commons Attribution License (CC BY). The use, distribution or reproduction in other forums is permitted, provided the original author(s) and the copyright owner(s) are credited and that the original publication in this journal is cited, in accordance with accepted academic practice. No use, distribution or reproduction is permitted which does not comply with these terms.
*Correspondence: Luo Wang, d2FuZ2x1b0BkbG91LmVkdS5jbg==; Yaqing Chang, eWFxaW5nY2hhbmdAaG90bWFpbC5jb20=; Zhenlin Hao, aGFvemhlbmxpbkAxMjYuY29t
†These authors have contributed equally to this work