 Tianxiao Ma
 Yu Liang1,2*
 Zhouyuan Li
 Bo Liu
95% of researchers rate our articles as excellent or good
Learn more about the work of our research integrity team to safeguard the quality of each article we publish.
Find out more
ORIGINAL RESEARCH article
Front. Ecol. Evol. , 27 July 2023
Sec. Environmental Informatics and Remote Sensing
Volume 11 - 2023 | https://doi.org/10.3389/fevo.2023.1153448
This article is part of the Research Topic Remote Sensing Advances in Biodiversity and Ecosystem Functioning Research View all 12 articles
Introduction: Northern China is considered a global hotspot of biodiversity loss due to dramatic climate and land use change characterized by rapid urban expansion. However, little is known that the impacts of these two drivers in shaping the future availability of habitat for plants in urban areas of Northern China, especially at a high spatial resolution.
Methods: Here, we modelled the habitat suitability of 2,587 plant species from the flora of Northern China and estimated how future climate and urban expansion may affect species-level plant biodiversity across three shared socioeconomic pathway (SSP) scenarios for the year 2050 in main city clusters.
Results: The results suggested that climate and urban expansion combined could cause a decline of up to 6.5% in plant biodiversity of Northern China, while urban expansion alone may cause 4.7–6.2% and climate change cause 0.0–0.3% by 2050. The contribution of urban expansion was higher in urban areas, while the contribution of climate change was higher in natural areas. Species may lose an average of 8.2–10.0% of their original environmentally suitable area. Our results verified that the process of urban expansion would necessarily result in large-scale biodiversity loss.
Discussion: The plant biodiversity loss in city clusters of Northern China was mainly determined by urban expansion rather than climatic change. The impact of climate change should not be ignored, since climate change will likely cause a higher reduction of area for some species. Based on these findings, we proposed that plant biodiversity loss in Northern China will accelerate in the future unless both urban expansion change and climate change are minimized.
Biodiversity loss has been reported as one of the most serious menaces to sustainable development, threatening the contribution and regulation of ecosystem services on which humanity relies (Steffen et al., 2015; Diaz et al., 2018; Roberts et al., 2021). A growing body of evidence indicates that the current rate of biodiversity loss is higher than that documented in historic times (Dirzo et al., 2014; Ceballos et al., 2020) and is predicted to further accelerate in future (Di Marco et al., 2019; Seebens et al., 2021). This is associated with significant natural and anthropogenic threats such as climate change (Scheffers et al., 2016) and the intensification of urban expansion (Simkin et al., 2022; Zhou et al., 2023), resulting in substantial reductions in habitat suitability and species’ range size (Velazco et al., 2019). As two major drivers of terrestrial biodiversity loss (IPCC, 2021; Li et al., 2022; Newbold, 2018), impacts of climate change and urban expansion are usually estimated separately because of the differences in time scales and patterns of biodiversity loss (Gomes et al., 2019). A realistic scenario that guides ecological conservation policies should take the combined effects of climate change and urban expansion, which may be the greatest threat to future biodiversity, especially for plants (McDonald et al., 2020; Fang et al., 2021).
Climate-driven changes with the most pervasive impact on species redistribution, such as habitat loss and elevational range shifts (Powers & Jetz, 2019; Scheffers and Pecl, 2019), will affect global biodiversity patterns and shape new hotspots. This may be more profound in the future when climate change intensifies (Visconti et al., 2016). For example, recent climate change has likely exacerbated habitat loss and fragmentation in 18.5% of ecoregions, while 43.5% of ecoregions with loss is projected under future climate change scenarios (Segan et al., 2016). However, the responses of plant species to climate change are complex and hard to predict (Corlett, 2016). Projected changes in climate differ among regions and across emissions scenarios, potentially leading to distinct ecological responses of plants across the world (Di Marco et al., 2019). Furthermore, biodiversity decline is substantially underestimated when indirect interactions between climate change and other stressors (e.g. urban expansion, pollution) are neglected (Arneth et al., 2020). Thus, it will be important to know how climate change will affect plant species and how it combines with other major threats.
Urban expansion occurs alongside threats to biodiversity driven by climate change, contributing to global biodiversity declines. Here, “urban expansion” was defined as the increase in the area of cities or towns, which is different from the term “urbanization” that usually was used to refer to the change in the proportion of a population living in an urban area (McDonald et al., 2020). The urban area tends to alter the type of habitats available (Geschke et al., 2018), support more invasive species (McKinney, 2006), and produce rapid eco-evolutionary change (Alberti et al., 2017). In addition, urban expansion can accelerate urban microclimate change, increase warming in urban and the intensity of precipitation in the local area (Krayenhoff et al., 2018). These impacts generally rise with urban area expansion and intensity in changing climate, resulting in significant changes in the abundance and composition of species when urban area replaces natural habitat (McDonald et al., 2020). Existing researches demonstrate that future global urban expansion will lead to 11–33 million hectares of natural habitat loss and a 34% reduction in species richness by 2100 (Li et al., 2022). Despite the apparent importance of urban expansion as a driver of habitat loss, three main shortcomings in present forecasts for urban impacts on biodiversity. The first concerns driving factors, which until recently have not considered climate change and urban expansion together (Li et al., 2022; Simkin et al., 2022). The second shortcoming is that most studies are conducted on a single climate change scenario and coarse spatial resolution (Seto et al., 2012; McDonald et al., 2020). The third shortcoming is that existing studies only focus on vertebrates without containing plant species (Li et al., 2022; Simkin et al., 2022), which are more sensitive to climate change and urban expansion (Burley et al., 2019). Therefore, such forecasts become less useful and an updated set of forecasts to overcome these limitations is required.
Northern China is considered a global hotspot of biodiversity loss due to dramatic climate and land use change characterized by rapid urban expansion in the past few decades and projected future (McDonald et al., 2018; McDonald et al., 2020). From 1978, the Chinese government implemented large-scale ecological restoration programs (Fu et al., 2018) to prevent further ecological problems in Northern China. Thus, the combined effects of natural and anthropogenic factors have been, still are, and will be shaping biodiversity patterns in Northern China (Mi et al., 2021). However, few studies examined the impacts of climate change and urban expansion on the biodiversity of plants simultaneously, as shortcomings existed in present studies. This inadequacy limits our understanding of the spatiotemporal heterogeneity in biodiversity and the underlying mechanisms behind the effects of climate change and urban expansion. Realistic forecasting of plant biodiversity changes in the urban area of Northern China is urgently needed to explore the underlying mechanisms of species distribution, quantify threats to endangered species and evaluate the interaction between biodiversity and socioeconomic development.
Here, we aim to quantify (i) changes in species-level biodiversity of plants due to climate change and urban expansion, (ii) the relationship between changes in species-level biodiversity and climate change/urban expansion, and (iii) the relative importance of these two drivers to the future species range and richness in five main city clusters of Northern China. Specifically, we hypothesized that: (a) combined effects of projected climate change and urban expansion will cause substantially larger losses of habitat suitability; (b) species with smaller increased temperature and greater increased precipitation are more negatively affected by climate change and urban expansion; and (c) urban expansion has the higher relative contribution than climate change for change in species-level diversity under all climate change scenarios. To test these hypotheses, we estimated the area of occupancy (AOO) for 2,587 plant species based on a species distribution model (SDM) in Northern China. We then quantified the species richness and its changes produced by historical urban expansion, three scenarios of urban expansion for 2050, three scenarios of climate change for 2050 and their interactions. Specifically, we investigated how projected changes in climate and urban area affect the AOO and species richness in five main city clusters of Northern China, which is a relatively rapid urban expansion and highly threatened region. The results would highlight important implications of our study for biodiversity conservation of plant and help form better planning for ecological restoration project in Northern China.
Northern China has a large area, which consists of 236.14 million km2 with 8 Provinces and Municipalities (Figure 1). The average annual precipitation of this area varies between 300 and 1000 mm, and the annual average temperature ranges from −3 to 10°C. To quantify the impacts of climate change and urban expansion on species-level biodiversity, five main city clusters (79% of urban area in Northern China) were focused (Table 1 and Figure S1) in analysis. The five main city clusters include Beijing-Tianjin-Hebei (BTH), Central-South Liaoning (CSR), Harbin-Changchun (HC), Hohhot-Baotou-Ordos (HBO), and Middle Shanxi (MS). Detailed information of city clusters was also given in Table 1.
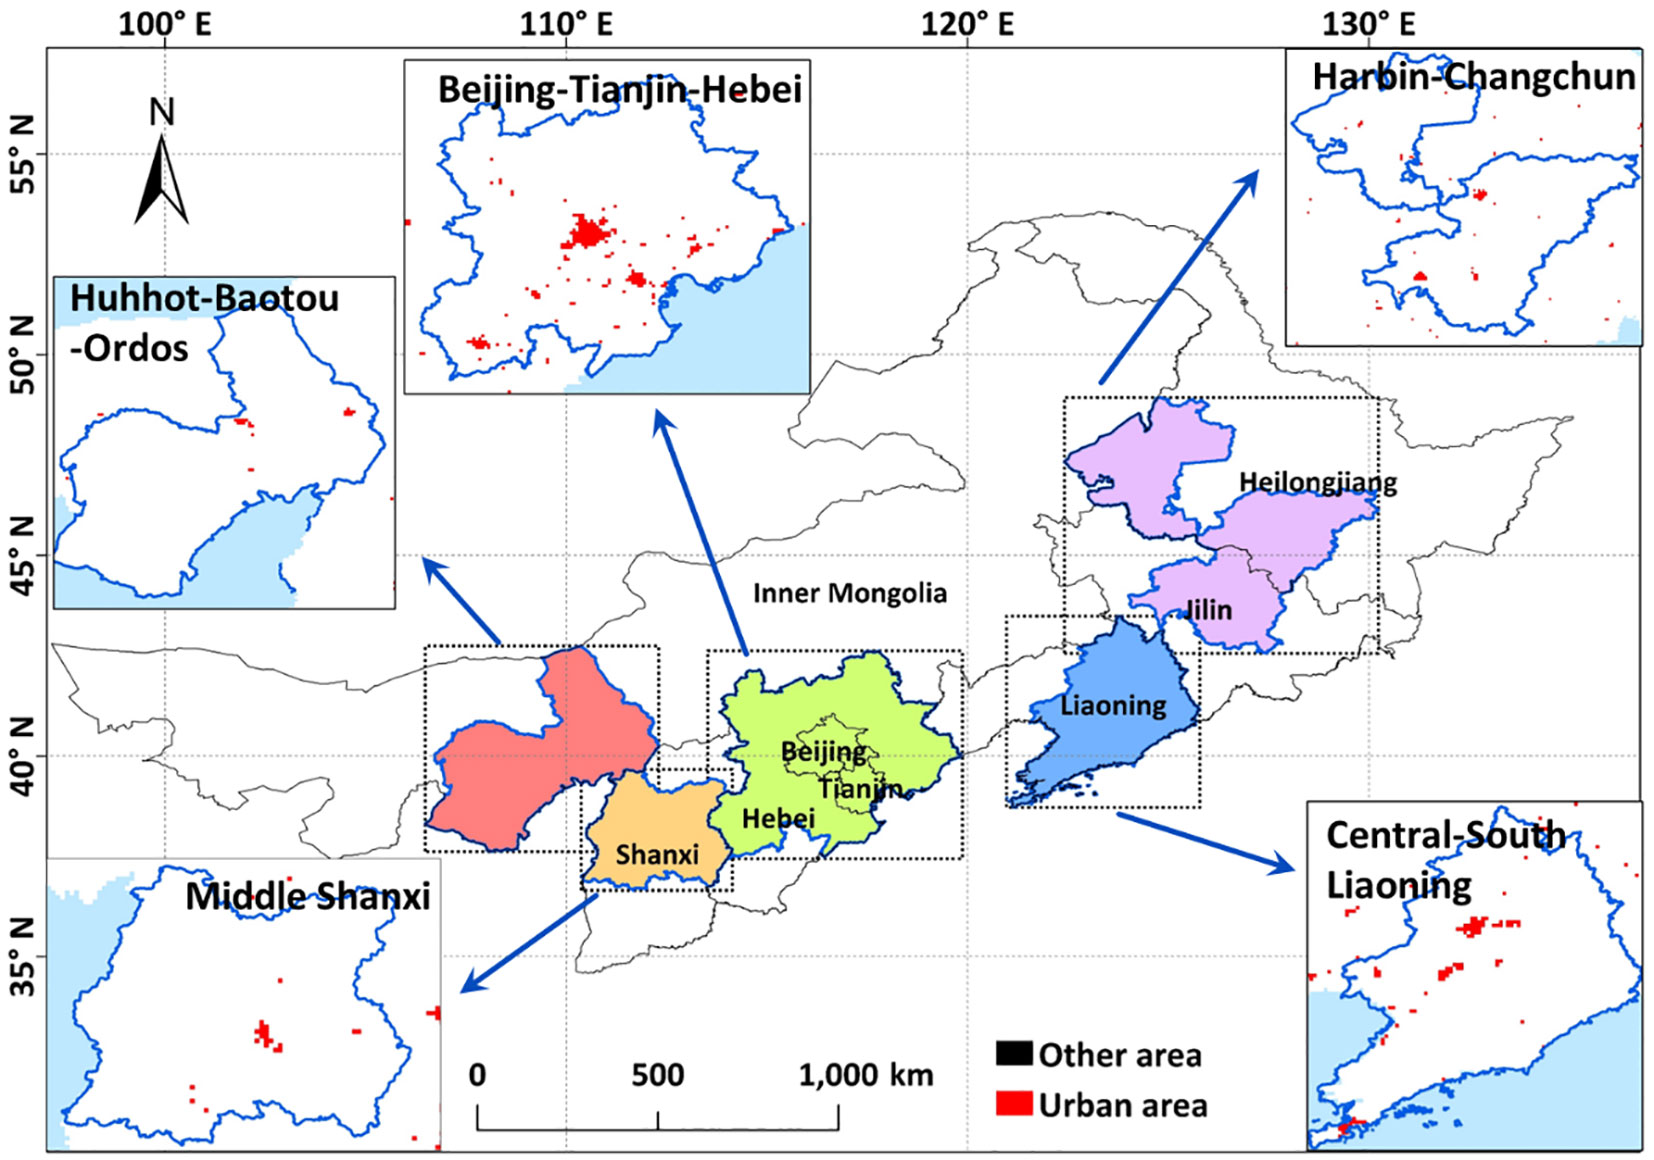
Figure 1 Spatial pattern of main city clusters in Northern China.
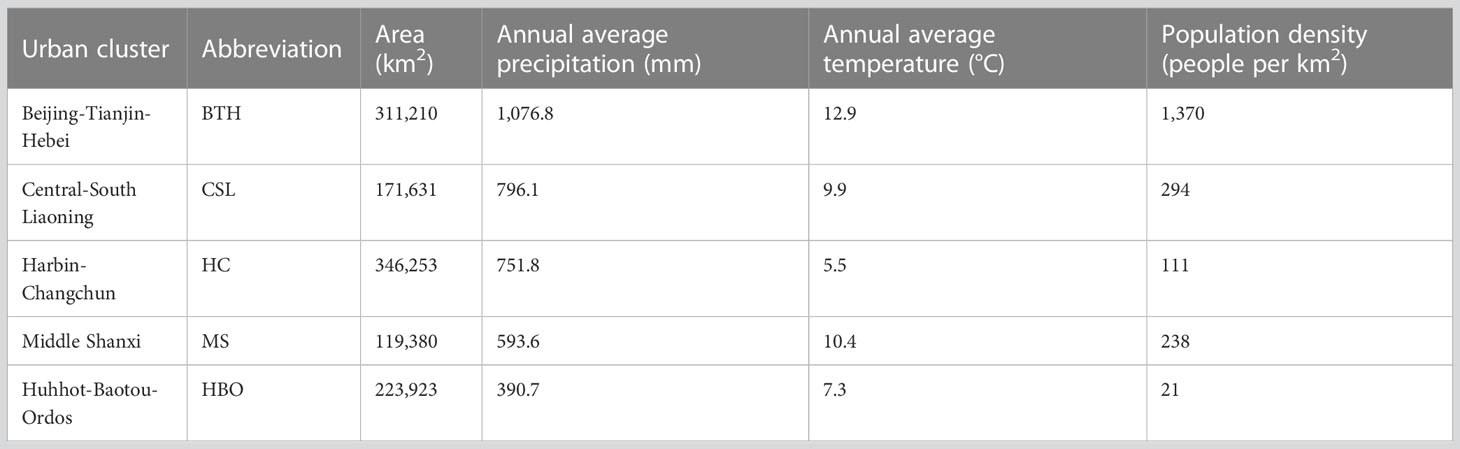
Table 1 The detailed information of five main city clusters in Northern China.
20,892,510 raw occurrences of plants were obtained from Global Biodiversity Information Facility (GBIF, www.gbif.org) and iPLANT platform (www.iplant.cn). To avoid problems in SDM related to modelling with partial geographic ranges, the occurrences in Northern China and also all occurrences in Eurasia were obtained for each species (Raes, 2012). To improve the quality of these records, we used the R package “CoordinateCleaner” (Zizka et al., 2019) to flag and remove records that satisfied any of the following criteria: 0,0 coordinates, coordinates in an ocean, coordinates within 5 km of country centroids and capitals, records within 1 km of biodiversity institutions, and records with reversed latitude and longitude values. After removing these geographical errors, we cleaned the species names by removing unusual characters and uncertain identifications, and assigned all single occurrence at the species level. Then, we checked synonyms and used accepted names, and kept only species occurring in the eight provinces of Northern China according to Flora of China (FOC) from iPLANT. Our database was composed of 325,027 unique records, representing 3,214 total species (92% of the 3,503 species of Northern China).
All species with a small number of collections were tested with all datasets to identify poorly collected species (Ter Steege et al., 2015). Only species occurring in 5 or more unique locations had their habitat suitability modelled. This procedure ensured that each species had robust range size (Rivers et al., 2011) and an environmental suitability model significantly different from a bias-corrected null models (Gomes et al., 2019), which is important to fit reliable habitat suitability models (Thibaud et al., 2014). Species with a small number of collections (<5) and not present in the final dataset based on a restricted number of locations (Gomes et al., 2019). Consequently, further modelling and analyses were conducted for 2,587 plant species (74% of the total species).
To estimate the area of occupancy (AOO) for each species based on environmental suitability, we initially obtained 19 bioclimatic variables derived from the current climate at 30 seconds spatial resolution (approximately 1 km at the equator) from WorldClim (Hijmans et al., 2005, https://www.worldclim.org/), which were produced using monthly interpolated climate data. For future climate data, we used multi-model ensemble estimates of 19 bioclimatic variables from seven global climate model (GCM) projections (including ACCESS-ESM, BCC-CSM2, FIO-ESM2, GFDL-ESM4, INM-CM5, IPSL-CM6A-LR, and MIROC6) for the IPCC Sixth Assessment Report (AR6). These selected future climate datasets were also downloaded from the WorldClim Database. The derived bioclimatic variables were used to assess the effects of climate change in the year 2050 (average for 2041–2060) under the three shared socioeconomic pathways (SSP126, SSP245, and SSP585), which represent taking the sustainability, middle of the road, and the fossil-fueled development, respectively (You et al., 2021; Li et al., 2022). SSP126, SSP245, and SSP585 typically lead to 421 ppm, 538 ppm, and 936 ppm of CO2 concentrations by the year 2100, which represent low, moderate, and high emission scenario separately (Tian and Zhang, 2020).
Due to spatially correlated bioclimatic variables, we selected the less correlated predictor variables based on their biological relevance and on their scores using Spearman’s rank correlation coefficient threshold |ρ| > 0.7 (Dormann et al., 2013). Those variables that presented correlation values over 0.7 were removed from the analysis (Supplementary materials Figure S1). For the final modelling stage, we selected six less correlated predictor variables: mean diurnal range (BIO2), Isothermality (BIO3), temperature annual range (BIO7), mean temperature of warmest quarter (BIO10), annual precipitation (BIO12), precipitation seasonality (BIO15). These climatic parameters were preprocessed to a general spatial resolution of 5 km as it represents a fine scale to avoid undesired distortions and recognize spatial patterns (Leao et al., 2020).
Current (2015) and projected future (2050) patterns of urban expansion with three selected SSP scenarios in Northern China were obtained from the global projection of urban expansion dataset (Chen et al., 2020; https://doi.org/10.1594/PANGAEA.905890), which describes the grid cells of 1km resolution occupied by current and future urban land demand (Supplementary materials Figure S2). This dataset used panel data regression to estimate future urban land areas based on the factors of population, urbanization rate (percentage of urban population to total population) and gross domestic product (GDP). In this study, we selected three climate change scenarios (SSP126, SSP245, and SSP585) which represent sustainability, middle of the road, and fossil-fueled development routes, respectively (Jiang and O’Neill, 2017). Specifically, SSP126 (“sustainability” scenario) envisions a development path of rapid urban expansion with high income growth for all country groups. SSP245 (“middle of the road” scenario) envisions a development path of moderate urban expansion and moderate income growth for all country groups. SSP585 (“fossil-fueled development” scenario) envisions that all country groups will experience rapid urban expansion. Under SSP126, SSP245, and SSP585, urban area corresponds to predictions of 65%, 55% and 70% expansion for 2050 in five main city clusters of Northern China, respectively.
To further estimate the spatial distribution of biodiversity change due to urban expansion under three SSP scenarios in each 5 km grid cell, we calculated the fraction of area that will be occupied by urban expansion between 2015 and 2050. We then multiplied this value by the number of species in each grid cell to estimate the potential number of species change due to urban expansion (Li et al., 2022). Generally, the species with lower habitat suitability are more vulnerable to urban expansion. To determine which species are affected by urban expansion, we estimated the habitat suitability using Maxent models for each species and all species were sorted by their habitat suitability in each grid cell. Species with lower habitat suitability for the potential number of species loss were regarded as the species affected by urban expansion. Corresponding grid cells were eliminated from the AOO of affected species.
In this study, we used the maximum entropy model (Phillips et al., 2006; Maxent version 3.4.1) to estimate the area of occupancy (AOO) in Northern China. For each species, 75% of the occurrence data were used as a training model and the remaining 25% for validating the Maxent model. Climate values from 10,000 randomly sampled points records as background data to account for sampling intensity and reduce spatial sampling bias (Thornhill et al., 2017). The algorithm runs either 1000 iterations of these processes or continues until convergence (threshold 0.00001). The modelling extent was restricted to the complete area of Eurasia, which was used for all species models. MaxEnt models were generated using 10 cross-validated replicate runs with the aforementioned parameters. Outputs were transformed into binary maps with a 10% training presence threshold and restricted to Northern China by clipping.
To calibrate and validate the performance of the Maxent model, threshold-independent receiver-operating characteristic (ROC) analyses were used (Phillips et al., 2006). An area under the ROC curve (AUC) was examined for additional precision analyses. The AUC values between 0 and 0.5 indicate predictions are no better than random and the highest value of 1 gives the best prediction (Elith et al., 2011). The average AUC training value was 0.949, indicating both models performed well and generated excellent evaluations. We also used a Jackknife test and the percent variable contribution to identify the relative importance of each variable. In MaxEnt, the jack-knife test systematically drops one variable each time and compares the predictions using the model with all variables except the dropped one and a model based on that variable only (Phillips et al., 2006).
To estimate the impacts of urban expansion and climate change on plants in Northern China, we produced eleven different scenarios (Table 2). First, we modelled the species’ current AOO with and without considering urban area. Then, we estimated the impacts of climate change by modelling the species’ AOO of 2050 (SSP126, SSP245, and SSP585) without considering urban area. Furthermore, we calculated the impacts of six combined scenarios of urban expansion and climate change: 1) no urban expansion: SSP126, SSP245, and SSP585 with 2015 urban area; 2) urban expansion: SSP126, SSP245 and SSP585 with their corresponding 2050 urban area. Considering these eleven scenarios, we produced species distribution model (SDM) maps for all species, and species richness maps (defined as the number of species per grid cell) by adding the predicted species in each grid cell for each scenario to assess species richness.
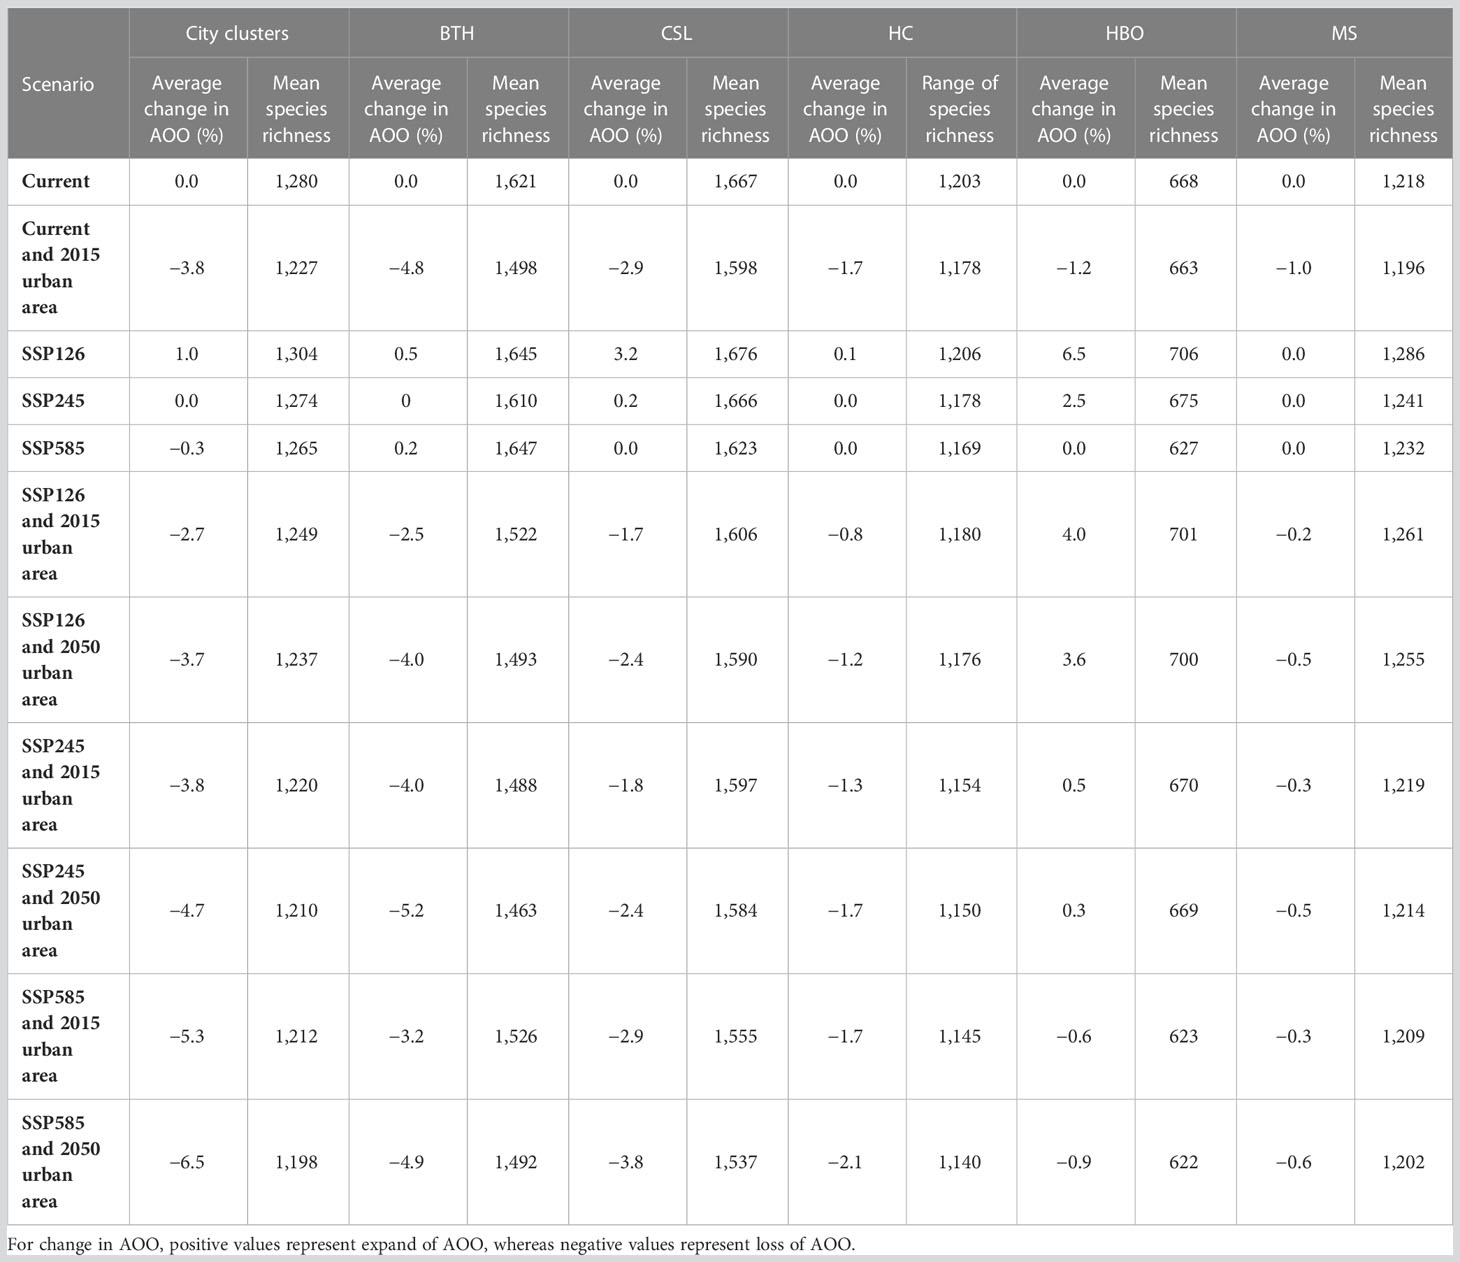
Table 2 Results for all scenarios showing estimation of change in AOO and mean species richness.
To reflect the potential impact of urban expansion and climate change, the range of analyses presented here was restricted to five main city clusters based on projected results of Northern China under eleven scenarios. We first calculated the change in species richness and AOO of each scenario to evaluate future changes in species distribution. The change in species richness and AOO was calculated as the difference between the projected results under scenarios for the years 2050 and scenarios without considering urban area in 2015. For analyzing the individual and combined effects of urban expansion and climate, we separated the change of urban area and climate when designing the scenarios (see the names of these scenarios in Table 2). For example, we could estimate the individual effect of climate change under SSP585 by comparing the “current” and “SSP585” scenario; we could estimate the individual of urban expansion by comparing the “SSP585 and 2015 urban area” and “SSP585 and 2050 urban area” scenario. For combined effects, we could compare scenarios which has different conditions of climate and urban area. In addition, we fitted simple ordinary least-squares regression models to understand how changes in species richness and AOO change relate to increased temperature, precipitation, and urban expansion to examine the roles of urban expansion and climate influences on vegetation dynamics. Finally, we used the metrics proposed by Lindeman, Merenda, and Gold (LMG) (Grömping, 2006) to quantify the relative contributions of climate change and urban expansion to the variation of the species richness dynamics in each 25 km2 grid cell of five main city clusters under three climate change scenarios.
Urban expansion is the major cause of species that may lose sufficient AOO to become threatened, while the losses of species richness produced by combined effects of climate change and urban expansion are expected to be higher (Table 2). The mean current species richness in the urban area of Northern China was 1,280. The 2015 urban area was responsible for a mean decline of 3.8% in the estimated AOO of plant species. Current species richness was higher in CSL and BTH, while loss by urban area mainly occurred in the same region. The average change in AOO by 2050 was 1.0%, 0.0%, and −0.3% in the SSP126, SSP245, and SSP585 scenario without considering urban expansion, whereas mean species richness is expected to slightly decrease under SSP245. Compared to the current scenario, climate change scenarios have a lower average change in AOO. Under the SSP126 scenario, the species richness will increase in most city clusters. Under the SSP245 climate scenario, the AOO stayed the same as current scenario. Under the SSP585 climate scenario, the species richness will have a great loss, and the change in AOO will shift from gain to loss.
The combined effect of urban expansion and climate change is a greater threat to plant biodiversity in Northern China under SSP585. The projected urban expansion for 2050 (with urban growth of 65% in SSP126, 55% in SSP245, and 70% in SSP585) is expected to produce an average loss of AOO of 3.7%, 4.7%, and 6.5% for SSP126, SSP245, and SSP585, respectively. The patterns of change in losses of species richness by urban expansion are consistent with the projections of urban area. As the projected urban expansion is high in BTH, species richness was predicted to suffer higher impacts of urban expansion in BTH.
Species richness is more negatively affected by the combined effects of climate change and urban expansion, and by the independent effects of urban expansion (Figure 2). When simulating the effects of climate change alone and keeping urban area constant, the mean species richness of each grid cell increased by 0.5% under SSP126 (min. = −6.6%, max. = 8.3%), decreased by 0.5% under SSP245 (min. = −6.8%, max. = 5.9%) and by 1.4% under SSP585 (min. = −11.2%, max. = 7.1%). Simulating the effects of urban expansion alone, keeping the climate constant, reduced the mean species richness of each grid cell by around 8% for all three climate change scenarios (min. = −40.0%, max. = −3.2%). The combined effect of climate change and urban expansion reduced the mean species richness of each grid cell by 8.7% under SSP126 (min. = −36.3%, max. = 11.3%) by 10.1% under SSP245 (min. = −35.3%, max. = 8.2%) and by 12.7% under SSP585 (min. = −42.5%, max. = 10.9%). In addition, our prediction showed that the negative effects of urban expansion to the urban area in the high latitude (e.g. HC) would become more significant.
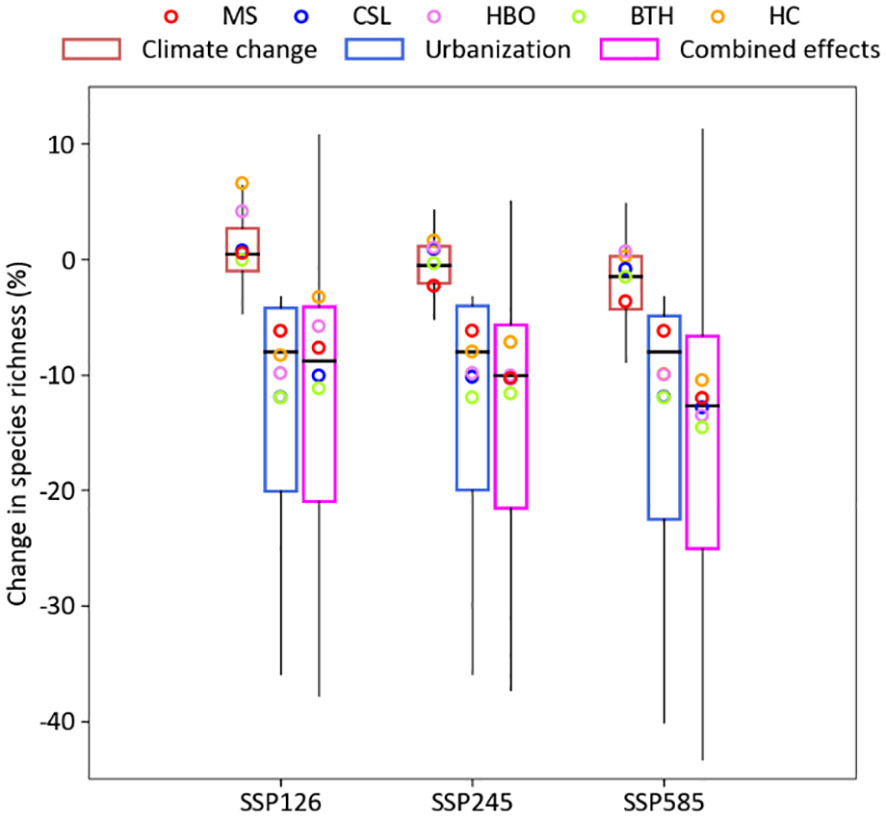
Figure 2 Box plot of the predicted effects of climate change and urban expansion for change in species richness given the three scenarios in the year 2050 at the urban area.
Few species gained AOO due to projected combined change in climate and urban area, while the majority of the species lost substantial amounts of AOO (Figure 3). The mean change in AOO by climate change was 1.4% in the SSP 126 scenario, 0.3% in the SSP245 and −0.7% in the SSP585 (Figure 3A). Mean AOO is expected to decrease by urban expansion between 5.1% in SSP245 and 5.4% in SSP585. The best-case combined scenario for 2050 resulted in a mean loss of estimated AOO of 3.9% (SSP126), followed by SSP245 with 4.9%, and the worst-case combined scenario (SSP585) with 6.7%. Another striking aspect of the predicted combined impacts is the right-skewed distribution of changes in AOO (Figures 3B–D). Future AOO was at least 10% smaller for 31% of the species under SSP126, 36% of the species under SSP245, and 38% of the species under SSP585. In contrast, future habitat suitability was at least 10% larger for only 10% of the species under SSP126, and 7% of the species under SSP245 and SSP585.
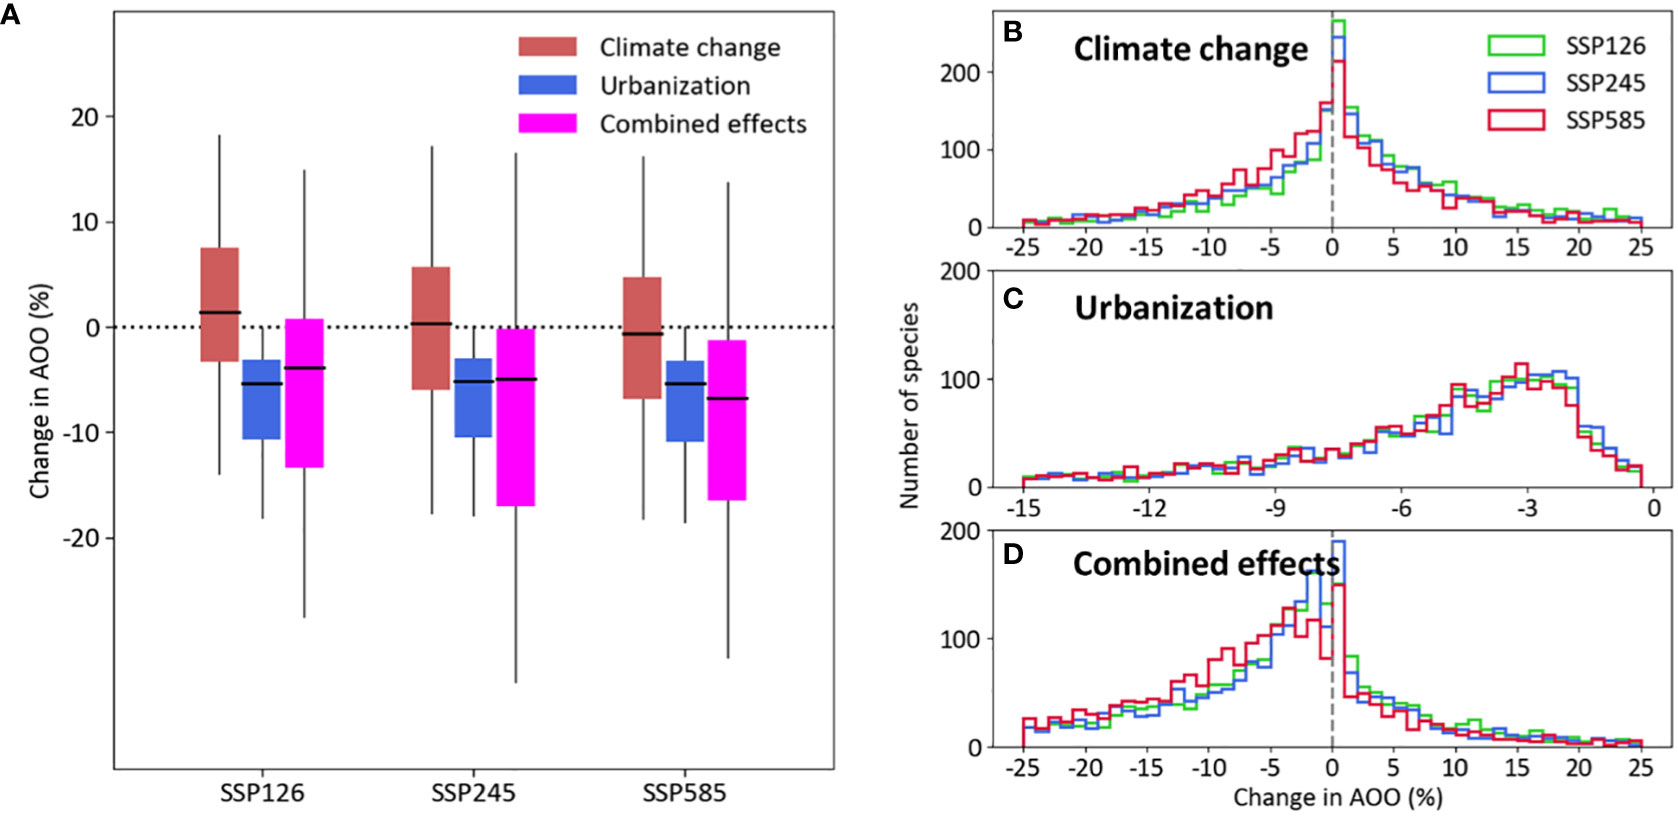
Figure 3 (A) Box plot of the predicted effects and (B–D) frequency distribution of climate change and urban expansion in AOO change given the three scenarios for climate change and urban expansion in the year 2050. In (A), lines inside the boxes show median effects, the lower and upper limits of the boxes show first and third quantiles respectively, and whiskers show range from minimum to maximum values excluding outliers (not shown).
Under effects of climate changes and urban expansion, the correlation between change in species richness and climatic driving factors were converse (Figure 4). Due to the effect of climate change, grid cells with larger increased precipitation and smaller increased temperature lost larger species richness, especially for city clusters with lower urban expansion (e.g. HBO and HC). In contrast, grid cells lost larger species richness with smaller increased precipitation and larger increased temperature due to urban expansion and combined effects. Across SSP scenarios, this pattern of correlation is more obvious under scenario SSP585 than under other scenarios. It is consistent for all scenarios that projected urban expansion is expected to reduce species richness.
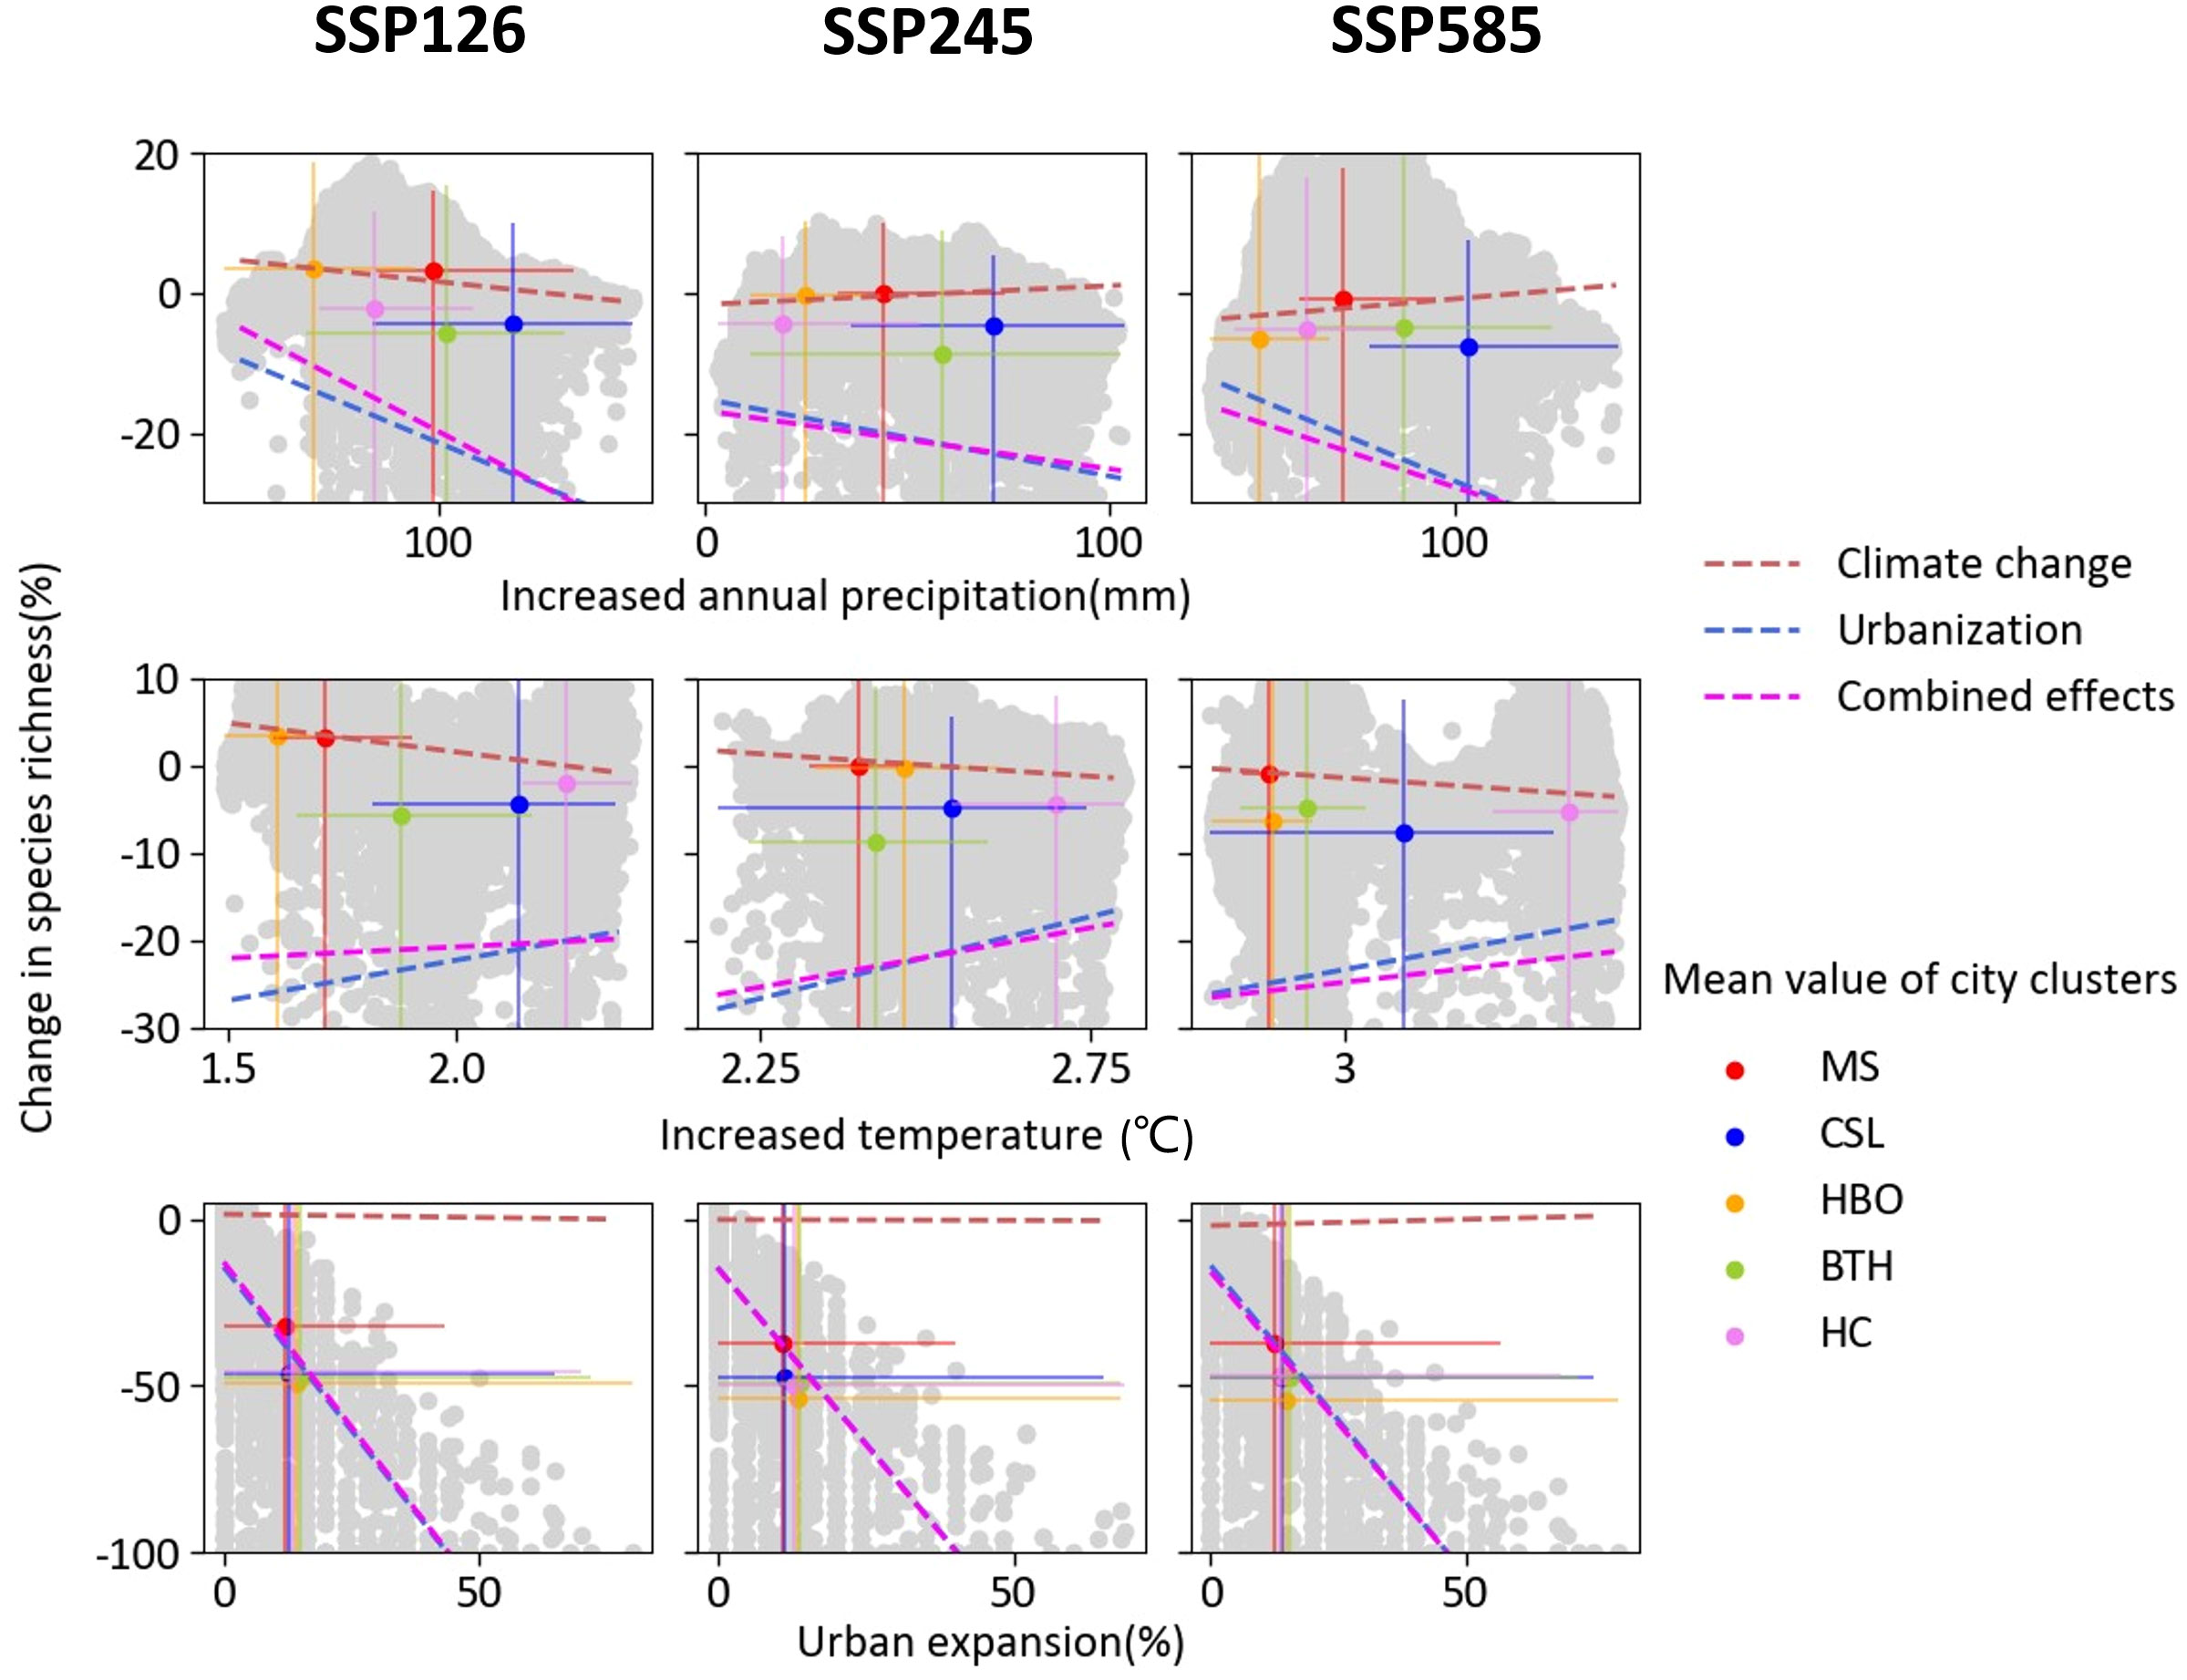
Figure 4 Relationship between the magnitude of species richness of change and driving factors (increased annual precipitation, increased temperature and urban expansion) in each climate change scenarios. Grey points represent change in species richness and corresponding driving factors in each grid. Colorful points indicate mean values of city clusters. Error bars shows the range of x- and y-axis values of corresponding city clusters. Lines are the fitted lines based on the generalized least squares model in natural and urban area. Significance levels p < 0.01 for all fitting.
Changes in AOO were negatively associated with increased annual precipitation, temperature, and urban expansion, especially for SSP585 due to urban expansion and combined effects (Figure 5). Linear regressions between the factors and changes in AOO were significant at a 99% confidence level. The slopes of linear regression indicate that there is more loss in estimated AOO with much larger increased annual precipitation, temperature, and urban expansion, particularly true in temperate regions with high urban expansion (e.g. BTH and CSL).

Figure 5 Relationships between projected change in species’ AOO and increased annual precipitation, increased temperature and urban expansion in different city clusters under SSP126, SSP245 and SSP585 due to climate change, urban expansion and their combined effects. The linear fits are also shown each subplot.
The contribution of urban expansion and climate change suggested that urban expansion (> 50%) is the key driving factor for the change in species richness under all climate change scenarios in the urban area (Figure 6). Around 89%, 92%, and 82% area of change in species richness could be mainly explained by urban expansion for SSP126, SSP245, and SSP585, respectively (Figure 6A). The contribution ratio of urban expansion exceeded 60% in all city clusters (Figure 6B). The responses of species richness to climate change and urban expansion exhibited strong discrepancies among city clusters. More developed city clusters with more precipitation (i.e. BTH and CSL) would be more sensible to the effect of urban expansion (Figure 6B). It showed that species richness of southern BTH was more sensitive to the effect of climate change across scenarios. The species richness of CSL displayed higher sensitivity to the effect of urban expansion. The species richness of MS was sensitive to climate change under SSP126, whereas the species richness of MS was mainly affected by urban expansion under the other two scenarios. In addition, the contribution ratio of MS had a greater variation than other city clusters among climate change scenarios. The species richness of HC demonstrated strong sensitivity to climate change under SSP585.
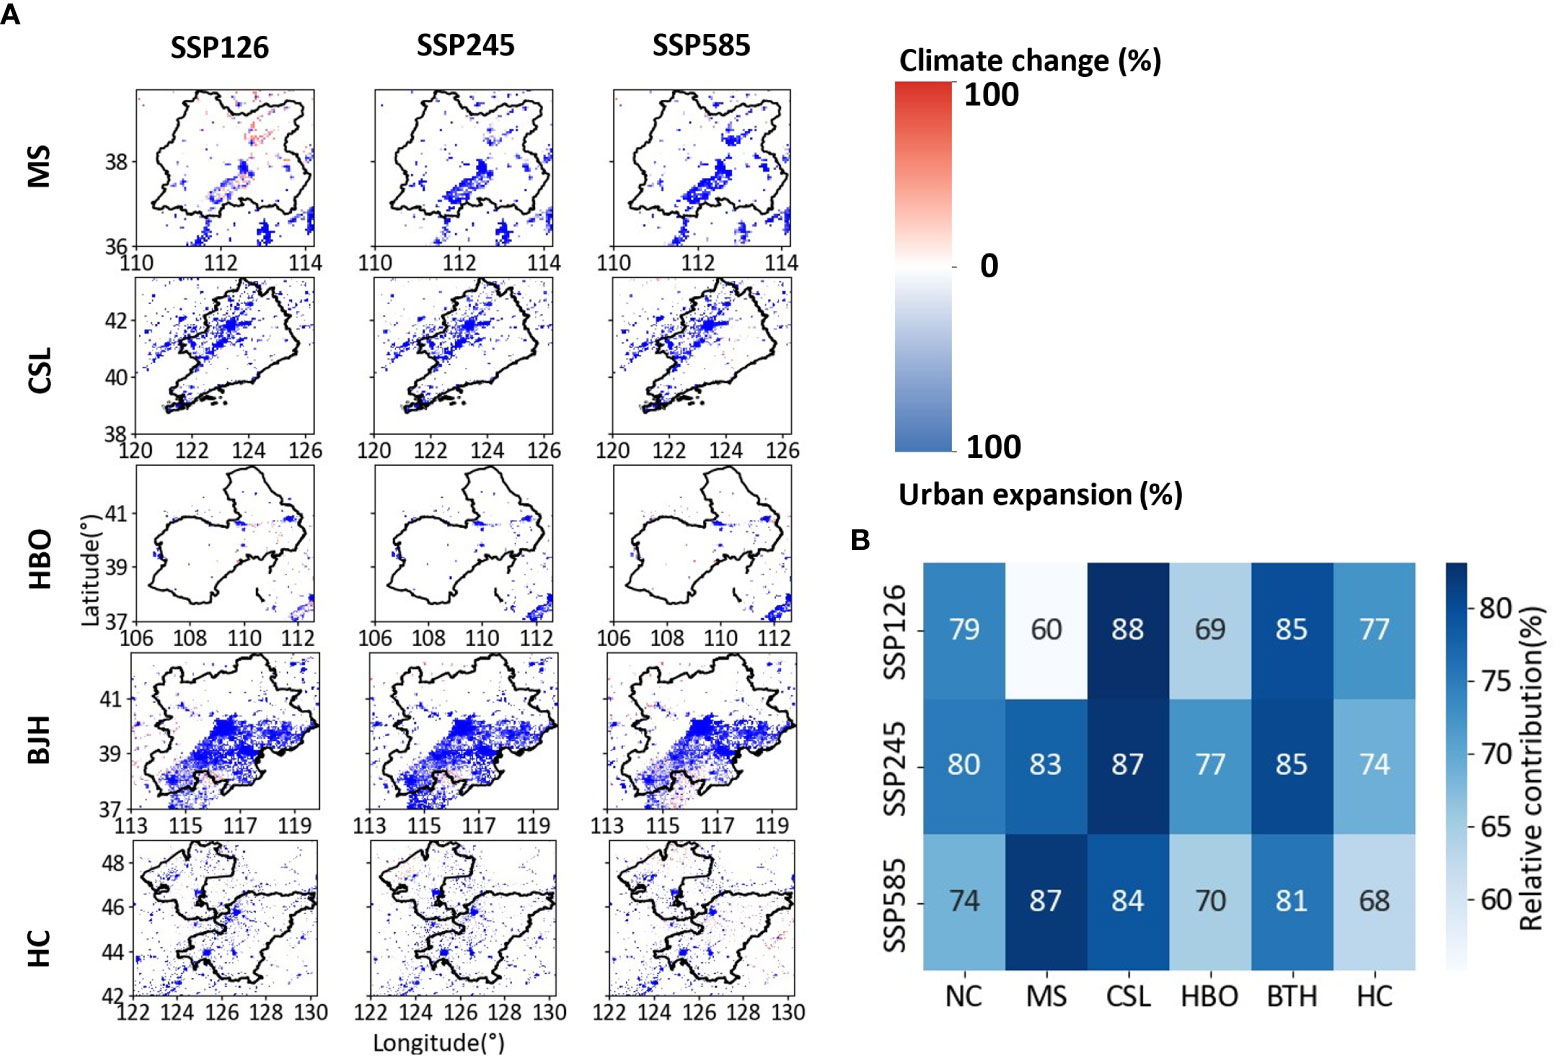
Figure 6 (A) Spatial distributions and (B) mean value of the relative importance of climate change and urban expansion for the projected change in species richness in different city clusters of Northern China under SSP126, SSP245 and SSP585.
At different city clusters, the relative contributions of climate change and urban expansion to changes in AOO strongly vary depending on the climatic characteristic and level of urban expansion for different future scenarios (Figure 7). The changes in AOO were mainly explained by urban expansion, while the contribution of climate change was less than 20%. In contrast, the relative contribution of urban expansion exceeded 80% in all city clusters. Generally, the higher relative contribution of urban expansion were found in CSL, BTH, and HC, and the lowest one was in HBO (less than 88%). Compared to other city clusters, the variation of relative contribution was higher in arid region, such as MS and HBO with 9–11% and 13–15% for relative contribution of climate, respectively.
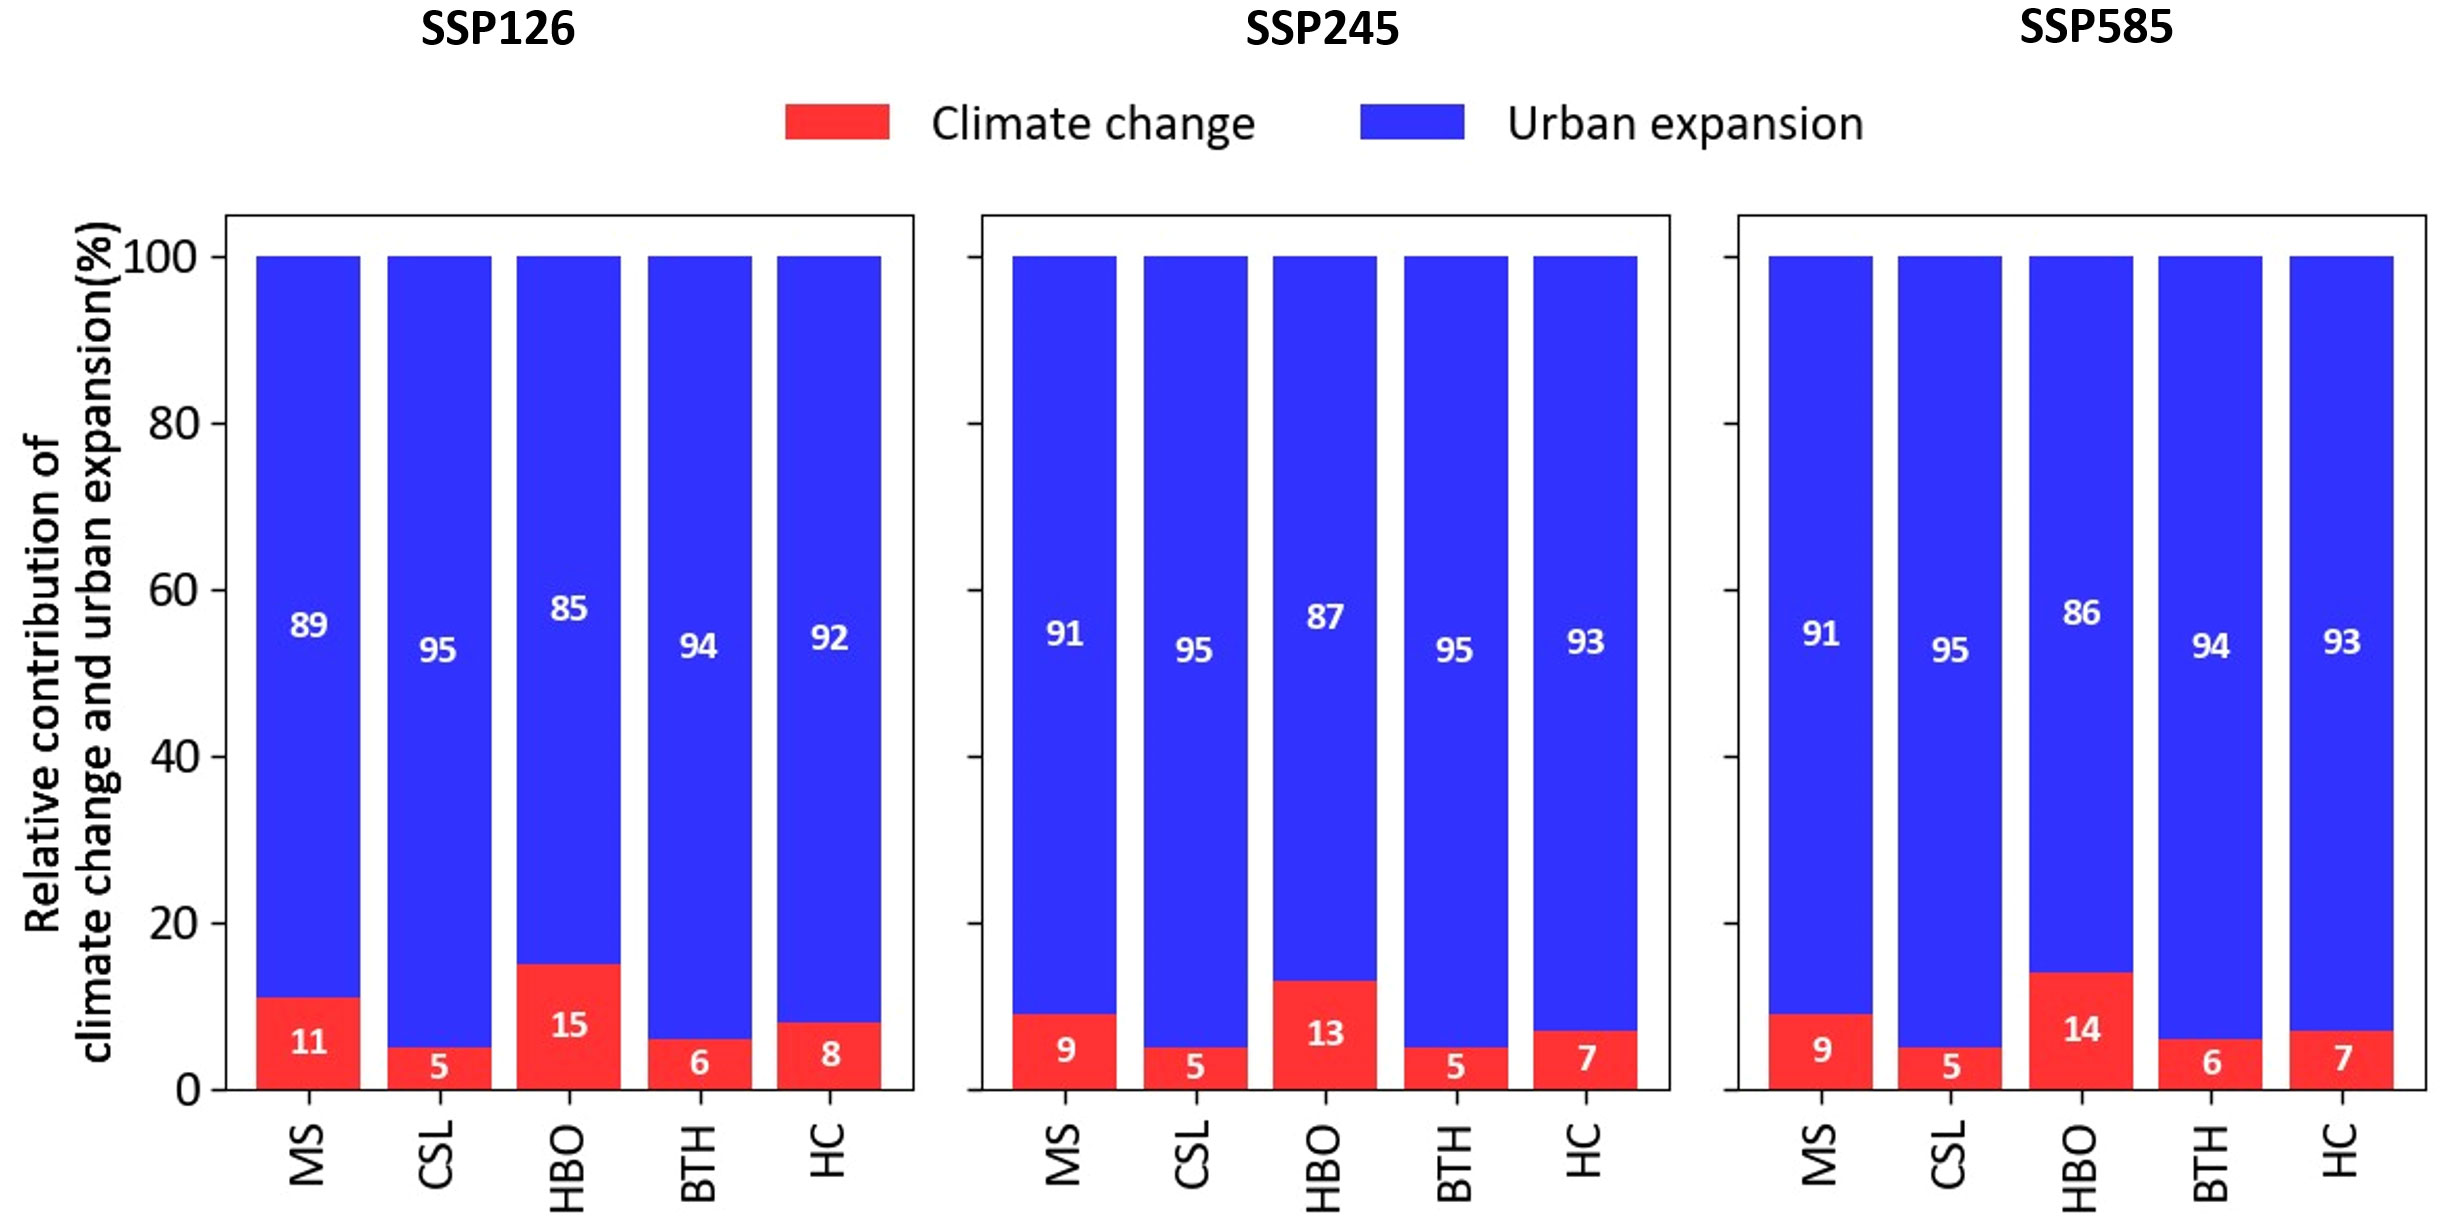
Figure 7 Relative importance of climate change and urban expansion for the projected change in AOO for species of different city clusters under three scenarios in Northern China.
Our results demonstrated that biodiversity loss will accelerate in the future unless both urban expansion and climate change are minimized. In particular, if the sustainable pathway (i.e., scenario SSP126) is properly implemented, humans will be able to maintain a relatively low natural habitat loss and a high level of species conservation. On the other hand, SSP585 and 2050 urban area was the most extensive biodiversity loss among the three climate scenarios. This finding is in accordance with the results of Li et al. (2021), which claimed that greater declines in habitat quality would be observed under SSP585. However, it is different that urban expansion per se was the predominant driver of biodiversity loss rather than climate change due to the different methods used to assess their impacts. In addition, we noticed that species’ sensitivity to climate change and urban expansion varies among scenarios and regions (Table 2). The existence of such geographical and climatic variation implies that attempts to extrapolate the impact of climate change and urban expansion may be misleading (Newbold et al., 2020). This suggests that further work on the impacts of climate change and urban expansion (based on multi-source datasets) at different regions and scenarios is needed to achieve precise conservation of plant biodiversity. Avoiding the SSP585 scenario should be largely beneficial to the conservation of plant species in Northern China.
Our results suggested that losses of habitat area will be much larger from the impacts of urban expansion than climate change (Table 2; Figures 2, 3), which is consistent with the findings from other studies at the national scale (Li et al., 2020). Our results showed the urban expansion may cause 4.7–6.2% of loss in plant biodiversity. This is consistent with other literature, which showed the loss caused by urban expansion ranged from 3.3% to 10.4% (He et al., 2014; Tang et al., 2021). Although the influences of temperature and precipitation among different climate change scenarios were very similar, the response of species richness and mean geographic range (AOO) to temperature and precipitation exhibited strong differences (Figures 4, 5). Our results are in agreement with previous studies that temperature tended to negatively affect species’ geographic range in Northern China, whereas the temperature positively affects the species richness (Li et al., 2020; Figures 4, 5). The spatial shift of species’ geographic range (i.e. AOO changes) reflects the ability of tracking suitable climatic conditions at the regional scale, while species richness reflects the ability of adapting to the new climatic conditions in the local range (Bellard et al., 2012). The opposite response of AOO and species richness to climate change with the positive effect of temperature on AOO changes indicate that plant species of Northern China tend to adapt to the new conditions rather than shift to a different habitat.
Urban expansion explained above 85% of the variations in plant species richness of urban areas under all scenarios (Figure 6), which indicated that the effects generated by urban expansion should not be ignored. Specifically, the future urban expansion will disproportionately affect the natural habitat around the urban area. The biodiversity loss becomes higher in as urban areas get closer to the patch edges of natural habitat. In addition, the key biodiversity hotspots and ecologically vulnerable ecoregions that have higher plant species richness will suffer the highest percentage of urban expansion such as BTH, CSL, and MS (Figure 6). These city clusters usually have a population density higher than 200 people/km2 (Zhou et al., 2021), indicating explicit shifts and depletion of plants occurs when exceeding 200 people/km2. For these city clusters with high population density and located in biodiversity-vulnerable regions, choosing an appropriate urban development pathway may be the most considered requirement for balancing urban expansion and biodiversity conservation of plant (Peng et al., 2016).
The combined effects of urban expansion and climate change are the greatest threat to plant biodiversity in Northern China. In regions with lower increased temperature, high urban expansion, and higher increased precipitation, species richness was more sensitive to the combined impacts of urban expansion and climate change (Figures 4, 5). Leersia spp. and Amaranthus spp. suffered more than other species. This pattern may be related to species in numerous human-dominated land uses (e.g. Northern China), which have been found to have higher proportions of individuals affiliated with higher temperatures and lower precipitation levels than that within natural habitats (Williams and Newbold, 2020). When the increased temperature is lower and increased precipitation is higher, species in Northern China with higher temperatures and lower precipitation levels are more susceptible and often suffer from projected changes in climate. More attention should be given to such relatively susceptible regions and species, which is important for biodiversity conservation under future climate change.
In our study, we quantified biodiversity loss by using species richness and AOO, which represent two aspects of species-level biodiversity dynamics. Change in AOO, which can include changes in range size or location of species, can be driven by changes in local habitat suitability (Molinos et al., 2015). Changes in species richness are driven by individual species shifting their ranges (i.e. AOO) into or out of a region (Batt et al., 2017). Therefore, the selection of indicators substantially determines whether the climate change or urban expansion are important for biodiversity loss. Our results indicated that plant species richness is more sensitive to the combined changes in climate and urban area (Figures 2, 3). However, changes in plant species richness are more commonly driven by the loss due to the impact of urban expansion for multiple species to shift their geographic ranges (Figures 2, 3) and become more common as urban expands for future developed scenarios (Li et al., 2022). Currently, less clear is how species-level range size affects plant species richness at regional scales. Future work should consider whether climate change or urban expansion played a role in affecting range sizes and richness of plant species, and how the timing of changes in these two drivers affect.
Applying broad-scale models to analyze the response of biodiversity to both urban expansion and climate change has several important known limitations. First, we only examined how future urban expansion will directly affect plant biodiversity without considering its indirect effects. Indirect impacts include the impacts of resources (e.g. Energy and food) and wastes (including solid, liquid and gaseous wastes) from urban areas (McDonald et al., 2020). Although it is currently difficult to accurately quantify such indirect effects which are not simply additive, high-resolution data may facilitate us to analyze the embodied biodiversity loss from such indirect effects. Second, due to a lack of available future land cover and dynamic biodiversity data, we could not accurately estimate the dynamic changes in habitat fragmentation and biodiversity losses due to climate change and urban expansion. Third, we used SDM based on presence‐only data for estimating species habitat suitability to reflect biodiversity patterns. However, the time lag between the reduction in habitat suitability and the loss of biodiversity may be large enough to hinder our perception of climate change and urban expansion, particularly for plants (Leao et al., 2021). In addition, rare species and species with few records are also probably over-predicted (Gomes et al., 2019). Finally, though our results suggest that plants in urban areas of Northern China may lose lower proportions of their habitat from climate change, this should not be taken as evidence that climate change is not a major threat in urban areas. Current CMIP6 climate data forecast more extreme changes in climate, and therefore greater losses in biodiversity, which should be particularly concerning in future research because previous estimates were based on climate data that typically project smaller climate changes.
In this study, we quantified the effects of climate change and urban expansion on plant biodiversity by mapping the variations of species’ habitat range and richness of Northern China for the current and the year 2050. Firstly, urban expansion rather than climate change will likely cause more losses to the species richness of plants during the next several decades in city clusters of Northern China. The contribution of urban expansion was higher in urban areas which have higher plant species richness and population density. Secondly, the combined effects of projected urban expansion and climate change are the greatest threat to plants in Northern China, especially under the SSP585 scenario. It should be noted that the SSP585 scenario should be avoided to benefit the conservation of plant species. Thirdly, the results indicate that species with smaller increased temperature and greater increased precipitation are more negatively affected by climate change and urban expansion. These findings will be beneficial in future urban built-up strategies and policy decisions to enable both the satisfaction of human needs and biodiversity maintenance. For future research, other impacts of urban expansion (e.g. road expansion, afforestation, or agricultural activities) and climate (e.g. fire, solar radiation, nitrogen deposition, or rising CO2) need to be further investigated to improve our understanding the dynamics of plant biodiversity. Also, policy-related issues of urban expansion in regard to the intensity of settlement (high density high-rise apartment buildings, or larger single-family properties with gardens, etc.) and transportation system (public transit, personal vehicles etc.) could be useful areas to explore in future.
The original contributions presented in the study are included in the article/Supplementary Material. Further inquiries can be directed to the corresponding authors.
TM: Methodology, Software, Writing – Original Draft, Visualization. YL: Supervision, Funding acquisition. ML: Writing – Review and Editing, Project administration. BL: Writing – Review and Editing, Investigation. MW: Validation, Formal analysis. YF: Writing – Review and Editing, Conceptualization, Supervision. All authors contributed to the article and submitted and approved the submitted section.
This research was supported by the National Natural Science Foundation of China (Grant No. 31961133027, 31971486, 42050410324, 32171562, 32101324), Major Program of Institute of Applied Ecology, Chinese Academy of Sciences (Grant No. IAEMP202201), the Natural Science Foundation of Liaoning Province (Grant No. 2021-BS-013) and the Fundamental Research Funds for the Central Universities (Grant No. WK2080000161, 2021ZY85) and the Open Research Fund of State Key Laboratory of Simulation and Regulation of Water Cycle in River Basin, China Institute of Water Resources and Hydropower Research (Grant NO. IWHR-SKL-KF202303).
The authors declare that the research was conducted in the absence of any commercial or financial relationships that could be construed as a potential conflict of interest.
All claims expressed in this article are solely those of the authors and do not necessarily represent those of their affiliated organizations, or those of the publisher, the editors and the reviewers. Any product that may be evaluated in this article, or claim that may be made by its manufacturer, is not guaranteed or endorsed by the publisher.
The Supplementary Material for this article can be found online at: https://www.frontiersin.org/articles/10.3389/fevo.2023.1153448/full#supplementary-material
Alberti M., Correa C., Marzluff J. M., Hendry A. P., Palkovacs E. P., Gotanda K. M., et al. (2017). Global urban signatures of phenotypic change in animal and plant populations. Proceedings of the National Academy of Sciences 114 (34), 8951–8956.
Arneth A., Shin Y. J., Leadley P., Rondinini C., Bukvareva E., Kolb M., et al. (2020). Post-2020 biodiversity targets need to embrace climate change. Proc. Natl. Acad. Sci. U. S. A. 117 (49), 30882–30891. doi: 10.1073/pnas.2009584117
Batt R. D., Morley J. W., Selden R. L., Tingley M. W., Pinsky M. L. (2017). Gradual changes in range size accompany long-term trends in species richness. Ecol. Lett. 20 (9), 1148–1157. doi: 10.1111/ele.12812
Bellard C., Bertelsmeier C., Leadley P., Thuiller W., Courchamp F. (2012). Impacts of climate change on the future of biodiversity. Ecol. Lett. 15 (4), 365–377. doi: 10.1111/j.1461-0248.2011.01736.x
Burley H., Beaumont L. J., Ossola A., Baumgartner J. B., Gallagher R., Laffan S., et al. (2019). Substantial declines in urban tree habitat predicted under climate change. Sci. Total. Environ. 685, 451–462. doi: 10.1016/j.scitotenv.2019.05.287
Ceballos G., Ehrlich P. R., Raven P. H. (2020). Vertebrates on the brink as indicators of biological annihilation and the sixth mass extinction. Proc. Natl. Acad. Sci. U. S. A. 117 (24), 13596–13602. doi: 10.1073/pnas.1922686117
Chen G., Li X., Liu X., Chen Y., Liang X., Leng J., et al. (2020). Global projections of future urban land expansion under shared socioeconomic pathways. Nat. Commun. 11, 537. doi: 10.1038/s41467-020-14386-x
Corlett R. T. (2016). Plant diversity in a changing world: Status, trends, and conservation needs. Plant Divers. 38, 10–16. doi: 10.1016/j.pld.2016.01.001
Diaz S., Pascual U., Stenseke M., Martin-Lopez B., Watson R. T., Molnar Z., et al. (2018). Assessing nature’s contributions to people. Science 359 (6373), 270–272. doi: 10.1126/science.aap8826
Di Marco M., Harwood T. D., Hoskins A. J., Ware C., Hill S. L., Ferrier S. (2019). Projecting impacts of global climate and land-use scenarios on plant biodiversity using compositional-turnover modelling. Global Change Biol. 25 (8), 2763–2778. doi: 10.1111/gcb.14663
Dirzo R., Young H. S., Galetti M., Ceballos G., Isaac N. J., et al. (2014). Defaunation in the anthropocene. Science 345 (6195), 401–406. doi: 10.1126/science.1251817
Dormann C. F., Elith J., Bacher S., Buchmann C., Carl G., Carre G., et al. (2013). Collinearity: a review of methods to deal with it and a simulation study evaluating their performance. ECOGRAPHY 36, 27–46. doi: 10.1038/s41558-019-0500-2
Elith J., Phillips S. J., Hastie T., Dudik M., Chee Y. E., Yates C. J. (2011). A statistical explanation of MaxEnt for ecologists. Divers. Distrib. 17, 43–57. doi: 10.1111/j.1472-4642.2010.00725.x
Fang C., Liu H., Wang S. (2021). The coupling curve between urbanization and the eco-environment: China’s urban agglomeration as a case study. Ecol. Indic. 130, 108107. doi: 10.1016/j.ecolind.2021.108107
Fu W., Lv Y., Harris P., Comber A., Wu L. (2018). Peri-urbanization may vary with vegetation restoration: a large scale regional analysis. Urban. For. Urban. Greening. 29, 77–87. doi: 10.1016/j.ufug.2017.11.006
Geschke A., James S., Bennett A. F., Nimmo D. G. (2018). Compact cities or sprawling suburbs? Optimising the distribution of people in cities to maximise species diversity. J. Appl. Ecol. 55 (5), 2320–2331. doi: 10.1111/1365-2664.13183
Gomes V. H., Vieira I. C., Salomao R. P., Ter Steege H. (2019). Amazonian tree species threatened by deforestation and climate change. Nat. Clim. Change 9 (7), 547–553. doi: 10.1038/s41558-019-0500-2
Grömping U. (2006). Relative importance for linear regression in R: the package relaimpo. J. Stat. Softw. 17 (1), 1–27. doi: 10.1080/10629360600569147
He C., Liu Z., Tian J., Ma Q. (2014). Urban expansion dynamics and natural habitat loss in China: A multiscale landscape perspective. Global Change Biol. 20 (9), 2886–2902. doi: 10.1111/gcb.12553
Hijmans R. J., Cameron S. E., Parra J. L., Jones P. G., Jarvis A. (2005). Very high resolution interpolated climate surfaces for global land areas. Int. J. Climatol. 25, 1965–1978. doi: 10.1002/joc.1276
IPCC. (2021). Climate change 2021: The physical science basis. Contribution of working group I to the sixth assessment report of the Intergovernmental Panel on Climate Change. (Cambridge: Cambridge University Press).
Jiang L., O’Neill B. C. (2017). Global urbanization projections for the Shared Socioeconomic Pathways. Glob. Environ. Change 42, 193–199. doi: 10.1016/j.gloenvcha.2015.03.008
Krayenhoff E. S., Moustaoui M., Broadbent A. M., Gupta V., Georgescu M. (2018). Diurnal interaction between urban expansion, climate change and adaptation in US cities. Nat. Clim. Change 8 (12), 1097–1103. doi: 10.1038/s41558-018-0320-9
Leao T. C., Lughadha E. N., Reich P. B. (2020). Evolutionary patterns in the geographic range size of Atlantic Forest plants. Ecography 43, 1510–1520. doi: 10.1111/ecog.05160
Leao T. C., Reinhardt J. R., Nic Lughadha E., Reich P. (2021). Projected impacts of climate and land use changes on the habitat of Atlantic forest plants in Brazil. B. Glob. Ecol. Biogeogr. 30 (10), 2016–2028. doi: 10.1111/geb.13365
Li J., Chen X., Kurban A., Van de Voorde T., De Maeyer P., Zhang C. (2021). Coupled SSPs-RCPs scenarios to project the future dynamic variations of water-soil-carbon-biodiversity services in Central Asia. Ecol. Indic. 129, 107936. doi: 10.1016/j.ecolind.2021.107936
Li G., Fang C., Li Y., Wang Z., Sun S., He S., et al. (2022). Global impacts of future urban expansion on terrestrial vertebrate diversity. Nat. Commun. 13 (1), 1–12. doi: 10.1038/s41467-022-29324-2
Li D., Wu S., Liang Z., Li S. (2020). The impacts of urbanization and climate change on urban vegetation dynamics in China. Urban. For. Urban. Greening. 54, 126764. doi: 10.1016/j.ufug.2020.126764
MacDonald D. W., Bothwell H. M., Hearn A. J., Cheyne S. M., Haidir I., Hunter L. T., et al. (2018). Multi-scale habitat selection modeling identifies threats and conservation opportunities for the sunda clouded leopard (Neofelis diardi). Biol. Conserv. 227, 92–103. doi: 10.1016/j.biocon.2018.08.027
McDonald R. I., Mansur A. V., Ascensao F., Crossman K., Elmqvist T., Gonzalez A., et al. (2020). Research gaps in knowledge of the impact of urban growth on biodiversity. Nat. Sustainabil. 3 (1), 16–24. doi: 10.1073/pnas.2117297119
McKinney M. L. (2006). Urbanization as a major cause of biotic homogenization. Biol. Conserv. 127 (3), 247–260. doi: 10.1016/j.biocon.2005.09.005
Mi X., Feng G., Hu Y., Zhang J., Chen L., Corlett R. T., et al. (2021). The global significance of biodiversity science in China: an overview. Natl. Sci. Rev. 8 (7), nwab032. doi: 10.1093/nsr/nwab032
Molinos J. G., Halpern B. S., Schoeman D. S., Brown C. J., Kiessling W., Moore P. J., et al. (2015). Climate velocity and the future global redistribution of marine biodiversity. Nat. Clim. Change 6, 83–88. doi: 10.1038/nclimate2769
Newbold T. (2018). Future effects of climate and land-use change on terrestrial vertebrate community diversity under different scenarios. Proc. R. Soc B. 285 (1881), 20180792. doi: 10.1098/rspb.2018.0792
Newbold T., Oppenheimer P., Etard A., Williams J. J. (2020). Tropical and Mediterranean biodiversity is disproportionately sensitive to land-use and climate change. Nat. Ecol. Evol. 4 (12), 1630–1638. doi: 10.1038/s41559-020-01303-0
Peng J., Du Y., Liu Y., Hu X. (2016). How to assess urban development potential in mountain areas? An approach of ecological carrying capacity in the view of coupled human and natural systems. Ecol. Indic. 60, 1017–1030. doi: 10.1016/j.ecolind.2015.09.008
Phillips S. J., Anderson R. P., Schapire R. E. (2006). Maximum entropy modeling of species geographic distributions. Ecol. Model. 190, 231–259. doi: 10.1016/j.ecolmodel.2005.03.026
Powers R. P., Jetz W. (2019). Global habitat loss and extinction risk of terrestrial vertebrates under future land-use-change scenarios. Nat. Clim. Change 9 (4), 323–329. doi: 10.1038/s41558-019-0406-z
Raes N. (2012). Partial versus full species distribution models. Nat. Conserv. 10, 127–138. doi: 10.4322/natcon.2012.020
Rivers M. C., Taylor L., Brummitt N. A., Meagher T. R., Roberts D. L., Lughadha E. N. (2011). How many herbarium specimens are needed to detect threatened species? Biol. Conserv. 144 (10), 2541–2547. doi: 10.1016/j.biocon.2011.07.014
Roberts L., Hassan A., Elamer A., Nandy M. (2021). Biodiversity and extinction accounting for sustainable development: A systematic literature review and future research directions. Bus. Strateg. Environ. 30 (1), 705–720. doi: 10.1002/bse.2649
Scheffers B. R., De Meester L., Bridge T. C. L., Hoffmann A. A., Pandolfi J. M., Corlett R. T., et al. (2016). The broad footprint of climate change from genes to biomes to people. Science 354 (6313), aaf7671. doi: 10.1126/science.aaf7671
Scheffers B. R., Pecl G. (2019). Persecuting, protecting or ignoring biodiversity under climate change. Nat. Clim. Change 9, 581–586. doi: 10.1038/s41558-019-0526-5
Seebens H., Bacher S., Blackburn T. M., Capinha C., Dawson W., Dullinger S., et al. (2021). Projecting the continental accumulation of alien species through to 2050. Global Change Biol. 27 (5), 970–982. doi: 10.1111/gcb.15333
Segan D. B., Murray K. A., Watson J. E. (2016). A global assessment of current and future biodiversity vulnerability to habitat loss–climate change interactions. Global Ecol. Conserv. 5, 12–21. doi: 10.1016/j.gecco.2015.11.002
Seto K. C., Güneralp B., Hutyra L. R. (2012). Global forecasts of urban expansion to 2030 and direct impacts on biodiversity and carbon pools. Proc. Natl. Acad. Sci. 109 (40), 16083–16088. doi: 10.1073/pnas.1211658109
Simkin R. D., Seto K. C., McDonald R. I., Jetz W. (2022). Biodiversity impacts and conservation implications of urban land expansion projected to 2050. Proc. Natl. Acad. Sci. U. S. A. 119 (12), e2117297119. doi: 10.1073/pnas.2117297119
Steffen W., Richardson K., Rockstrom J., Cornell S. E., Fetzer I., Bennett E. M., et al. (2015). Planetary boundaries: Guiding human development on a changing planet. Science 347 (6223), 1259855. doi: 10.1126/science.1259855
Tang L., Ke X., Chen Y., Wang L., Zhou Q., Zheng W., et al. (2021). Which impacts more seriously on natural habitat loss and degradation? Cropland expansion or urban expansion? Land. Degradation. Dev. 32 (2), 946–964. doi: 10.1002/ldr.3768
Ter Steege H., Pitman N. C., Killeen T. J., Laurance W. F., Peres C. A., Guevara J. E., et al. (2015). Estimating the global conservation status of over 15,000 Amazonian tree species. Sci. Adv. 1 (10), e1500936. doi: 10.1126/sciadv.1500936
Thibaud E., Petitpierre B., Broennimann O., Davison A. C., Guisan A. (2014). Measuring the relative effect of factors affecting species distribution model predictions. Methods Ecol. Evol. 5, 947–955. doi: 10.1111/2041-210X.12203
Thornhill A. H., Baldwin B. G., Freyman W. A., Nosratinia S., Kling M. M., Morueta-Holme N., et al. (2017). Spatial phylogenetics of the native California flora. BMC Biol. 15 (1), 96. doi: 10.1186/s12915-017-0435-x
Tian J., Zhang Y. (2020). Detecting changes in irrigation water requirement in Central Asia under CO2 fertilization and land use changes. J. Hydrol. 583, 124315. doi: 10.1016/j.jhydrol.2019.124315
Velazco S. J. E., Villalobos F., Galvao F., De Marco Júnior P. (2019). A dark scenario for Cerrado plant species: Effects of future climate, land use and protected areas ineffectiveness. Divers. Distrib. 25 (4), 660–673. doi: 10.1111/ddi.12886
Visconti P., Bakkenes M., Baisero D., Brooks T., Butchart S. H., Joppa L., et al. (2016). Projecting global biodiversity indicators under future development scenarios. Conserv. Lett. 9 (1), 5–13. doi: 10.1111/conl.12159
Williams J. J., Newbold T. (2020). Local climatic changes affect biodiversity responses to land use: A review. Divers. Distrib. 26 (1), 76–92. doi: 10.1111/ddi.12999
You Q., Cai Z., Wu F., Jiang Z., Pepin N., Shen S. S. (2021). Temperature dataset of CMIP6 models over China: evaluation, trend and uncertainty. Clim. Dyn. 57 (1), 17–35. doi: 10.1007/s00382-021-05691-2
Zhou C., Li M., Zhang G., Chen J., Zhang R., Cao Y. (2021). Spatiotemporal characteristics and determinants of internal migrant population distribution in China from the perspective of urban agglomerations. PloS One 16 (2), e0246960. doi: 10.1371/journal.pone.0246960
Zhou T., Liu H., Gou P., Xu N. (2023). Conflict or Coordination? measuring the relationships between urbanization and vegetation cover in China. Ecol. Indic. 147, 109993. doi: 10.1016/j.ecolind.2023.109993
Keywords: climate change, urban expansion, plant biodiversity, species distribution modelling, Northern China
Citation: Ma T, Liang Y, Li Z, Liu B, Wu MM, Lau MK and Feng Y (2023) Projected effects of climate change and urban expansion on species-level biodiversity of plants in main city clusters of Northern China. Front. Ecol. Evol. 11:1153448. doi: 10.3389/fevo.2023.1153448
Received: 29 January 2023; Accepted: 06 July 2023;
Published: 27 July 2023.
Edited by:
Juergen Pilz, University of Klagenfurt, AustriaReviewed by:
Lesley Lovett-Doust, Nipissing University, CanadaCopyright © 2023 Ma, Liang, Li, Liu, Wu, Lau and Feng. This is an open-access article distributed under the terms of the Creative Commons Attribution License (CC BY). The use, distribution or reproduction in other forums is permitted, provided the original author(s) and the copyright owner(s) are credited and that the original publication in this journal is cited, in accordance with accepted academic practice. No use, distribution or reproduction is permitted which does not comply with these terms.
*Correspondence: Yu Liang, bGlhbmd5dUBpYWUuYWMuY24=; Zhouyuan Li, bGl6aG91eXVhbkBiamZ1LmVkdS5jbg==; Yue Feng, bHVuYW1vb243N0AxNjMuY29t
Disclaimer: All claims expressed in this article are solely those of the authors and do not necessarily represent those of their affiliated organizations, or those of the publisher, the editors and the reviewers. Any product that may be evaluated in this article or claim that may be made by its manufacturer is not guaranteed or endorsed by the publisher.
Research integrity at Frontiers
Learn more about the work of our research integrity team to safeguard the quality of each article we publish.