 Jing Wang1,2
 Jia Wang
94% of researchers rate our articles as excellent or good
Learn more about the work of our research integrity team to safeguard the quality of each article we publish.
Find out more
METHODS article
Front. Ecol. Evol. , 03 May 2023
Sec. Environmental Informatics and Remote Sensing
Volume 11 - 2023 | https://doi.org/10.3389/fevo.2023.1153342
This article is part of the Research Topic Remote Sensing Advances in Biodiversity and Ecosystem Functioning Research View all 12 articles
A significant portion of Zhanjiang City’s ecological land areas have been reduced as a result of the city’s growing urbanization, which has caused the city’s ecological environment quality to decline. In order to monitor the quality of the ecological environment, the remote sensing ecological index (RSEI) is frequently utilized. In this study, the Landsat series satellite images from 2000, 2005, 2009, 2015, and 2020 were used. The Normalized Differential Vegetation Index (NDVI), Wetness (WET), Normalized Differential Build-up and bare Soil Index (NDBSI), and Land Surface Temperature (LST) were the four indicators utilized in the RSEI to quantitatively evaluate the changes in ecological environment quality in Zhanjiang City. The results are as follows. (1) The mean RSEI values for the years 2000, 2005, 2009, 2015, and 2020 are, respectively, 0.579, 0.597, 0.597, 0.607, and 0.601. In addition, the overall ecological environment of Zhanjiang is very good. In terms of spatial differences, the ecological environment quality in the central and southeastern parts of Zhanjiang is significantly higher than that in other areas, while the ecological environment quality in its coastal town areas is much worse. The lower RSEI index of developed land in coastal areas proves that the RSEI index can reflect the deterioration of the urban environment in coastal areas from 2000 to 2020. Therefore, the RSEI can be used to evaluate the ecological environment quality of Zhanjiang City. (2) The ecological environment changes in the study area are “substantially better,” “better,” “no change,” “worse,” and “much worse,” respectively, according to the difference in RSEI processed between 2000 and 2020. These changes were 38.38, 6,047, 13.93, 6.65, and 34.58%. The percentage of ecological environmental quality in Zhanjiang City that has become better is higher than that has become worse. This indicates that the quality of ecological environment in Zhanjiang City has improved between 2000 and 2020. (3) The regression produced the following equation for the association, which was significant at the 0.053 level: 100*Rsei = 154.69–1.18*IS(R = 0.66). The remote sensing ecological index for Zhanjiang in 2035 is 0.488 when the city’s planned population and area are added together.
Ecosystem quality is closely related to human beings and is the material basis for human survival and social development, so it is of great practical significance to monitor and evaluate ecosystem quality. In recent years, remote sensing technology has been widely used for ecological environment monitoring with its advantages of multi-directional, large range, long time series and low cost (Rai, 2013; Matco-Caria et al., 2018), but most of the traditional remote sensing ecological evaluation methods are based on a single indicator for monitoring, which does not reveal the ecosystem changes comprehensively (Qin et al., 2023).
Therefore, Ministry of Environmental Protection (2005) proposed the Ecological Environment Index (EI) based on remote sensing technology in 2005. It was proposed to quantitatively analyze the quality of the ecological environment from six aspects, such as biology, vegetation, land and human activities. This method is difficult to obtain statistical data, and the assignment of ecological index weights is more subjective (2015). On this basis, Xu et al. (2013) proposed the Remote Sensing Environment Index (RSEI) to evaluate the ecological quality of Fuzhou City in 2013, using the Normalized Differential Vegetation Index (NDVI) to represent the greenness component, the tasseled cap transformation (TCT) to represent the Wetness (WET), Land Surface Temperature (LST) and Normalized Differential Build-up and bare Soil Index (NDBSI). And combined with Principal Component Analysis (PCA) to establish a remote sensing ecological index model for rapid quantitative analysis of the regional ecological environment. This algorithm is simpler to calculate, easier to obtain data sources, and can objectively reflect the quality of the regional ecological environment. Therefore, this method has been widely used in a variety of scenarios (Gao et al., 2020; Nong and Wang, 2020; Miao and Liang, 2021; Wu et al., 2021; Ji et al., 2022). In the subsequent research on remote sensing ecological index, scholars proposed MSRE, IRSEI and ERSEI, which are improved versions of remote sensing ecological index models adapted to different geographic environments, according to the changes of geographic environments in the study area, such as: cities, villages, forests, wetlands, islands, deserts, loess lands, mining areas, etc. (Jiang et al., 2019; Song et al., 2019; Wang et al., 2020; Cheng et al., 2021).
Zhanjiang is subject to the interaction of fresh and brackish water as well as land and sea, therefore, Zhanjiang is characterized by rich biodiversity as well as complex and diverse wetland types, such as mangrove wetlands, mudflat wetlands, etc. (Xu et al., 2006; Chen et al., 2018). However, along with the development of socio-economic and urbanization processes, the increasingly frequent reclamation projects have caused some damage to the ecological environment of coastal areas, resulting in some coastal areas becoming typical ecologically fragile and sensitive areas, causing habitat destruction, resource reduction and landscape degradation. At present, there is a lack of research on the long time series monitoring of the ecological environment in Zhanjiang City, and it is necessary to study the spatial and temporal changes in ecological environment quality in Zhanjiang City.
In this paper, the Google Earth Engine (GEE) cloud platform was used to acquire Landsat remote sensing images for the years 2000, 2005, 2009, 2015, and 2020. The ENVI 5.3 and ArcGIS 10.8 platforms were used to construct the Remote Sensing Ecological Index (RSEI) for the ecological pattern evaluation of Zhanjiang City, and the Spss platform was used to predict the ecological environment quality of Zhanjiang City, using the relationship between the change of impervious area and ecological environment quality, combined with the planned population and total planned area of Zhanjiang City in 2035. Ecological environment quality is predicted. It provides a scientific basis for the subsequent ecological development of Zhanjiang City, fills the gap of ecological environment quality evaluation in the coastal zone, and provides a scientific basis and sustainable development strategy to ensure the effective use of resources and avoid ecological risks.
The region for the research is the city of Zhanjiang, which is situated between latitudes 20°13′N and 21°57′N and longitudes 109°40′E and 110°58′E. The majority of the territory is made up of peninsulas and islands, with Donghai Island being the sixth largest island in China. The region is long and width. The urban area is around 13,225 square kilometers in size, while the coastline is 1,556 kilometers long. It is surrounded by the South China Sea to the south, Maoming City to the east, and Beibu Gulf to the west. It is situated where the provinces of Guangxi, Guangdong, and Hainan converge. Its authority spans two counties, three county-level cities, and five districts. Its authority spans two counties, three county-level cities, and five districts (Figure 1). The area has a tropical northern monsoon climate that is mostly influenced by the ocean, with an average yearly temperature ranging from 22.7°C to 23.5°C. The wet season lasts from April to September, and the dry season lasts from October to March. Zhanjiang’s geography is primarily flat, with terraced land only making up a small fraction of the coastline region. The landscape has a relatively low slope of 1–4° and is typically high from north to south and low from east to west.
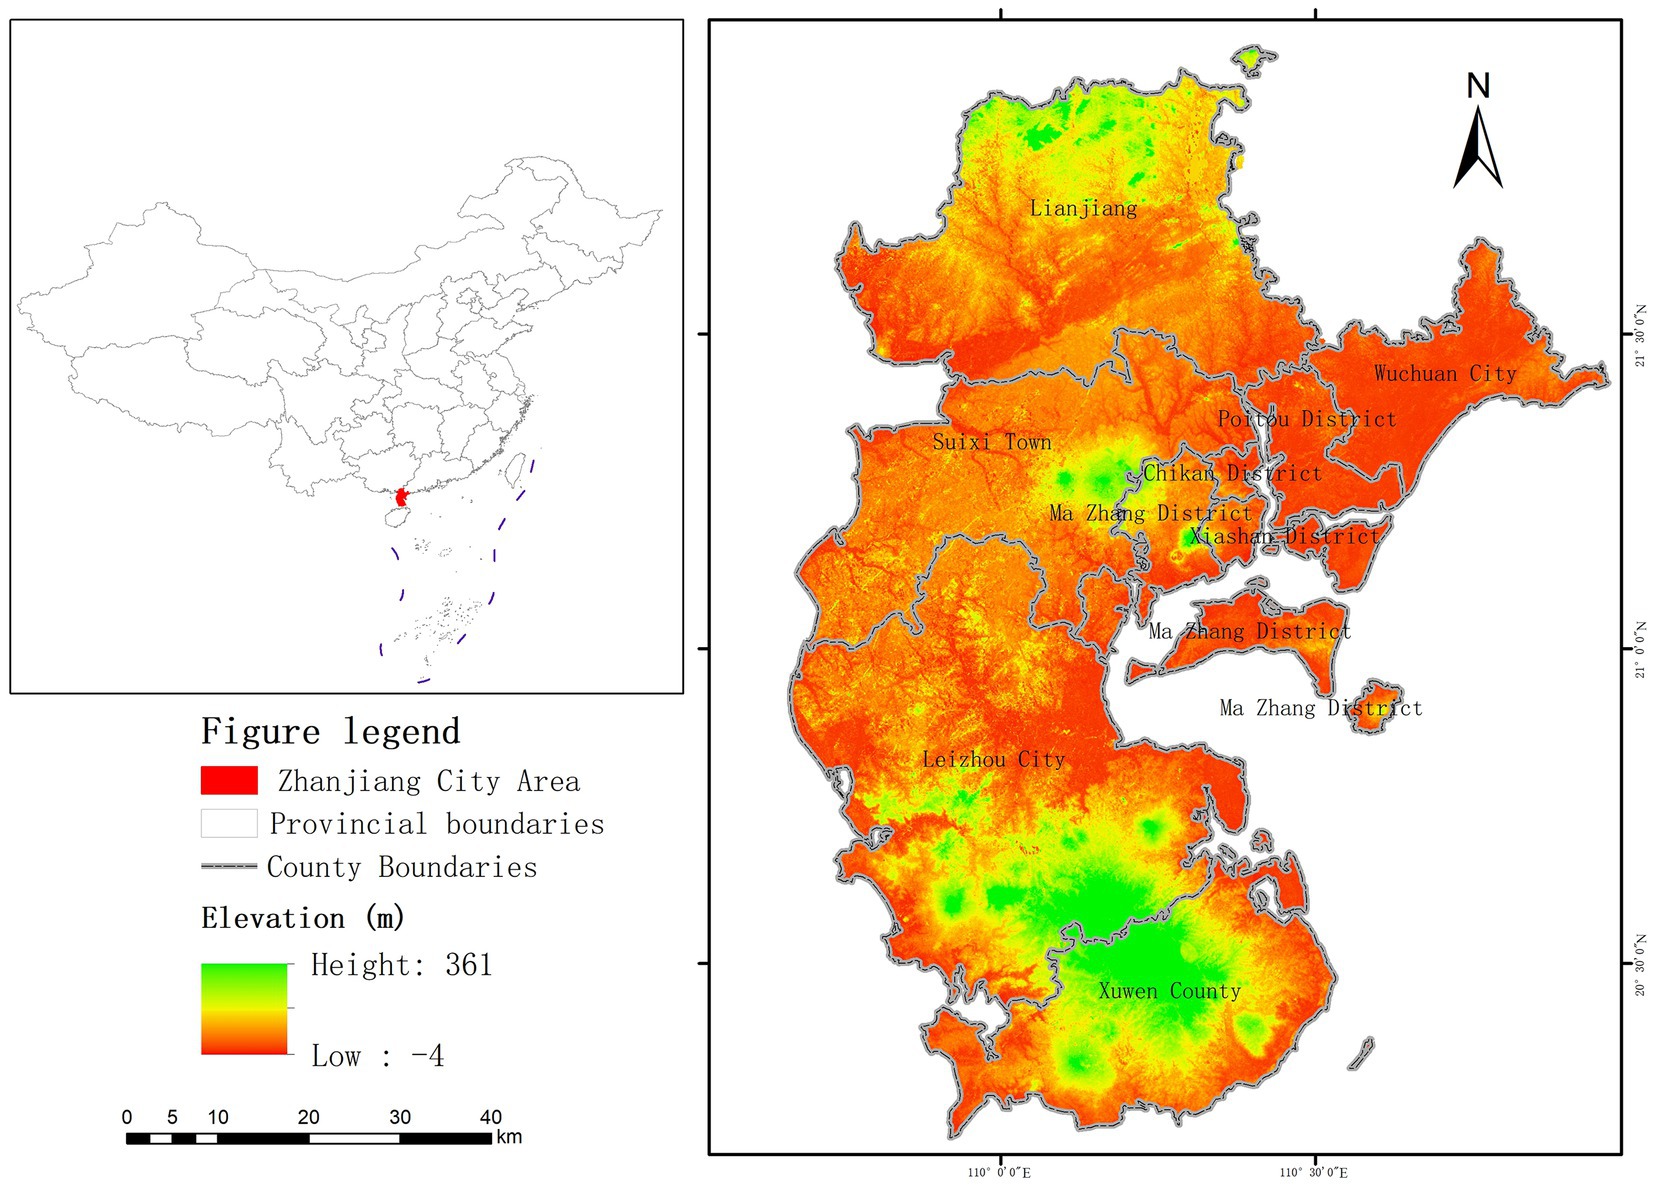
Figure 1. Location of Zhanjiang City.
Mudflat wetlands abound in Zhanjiang, which also has China’s most concentrated, diverse, and sizable mangrove wetland natural reserve with a total size of roughly 20, 278.8 acres (Wang, 2008).
The remote sensing images of Zhanjiang City are of poor quality due to the influence of clouds, so it is necessary to de-cloud/cloud shadow the multiview images before stitching them to obtain cloud-free images with complete coverage of the study area. Therefore, this paper acquires Landsat-5 surface reflectance dataset from May 2000 to September 2009 and the Landsat-8 surface reflectance dataset from May 2015 to September 2020 for the Zhanjiang city area based on GEE platform. And the minimum cloud image synthesis is performed to remove the cloudy image elements and synthesize the target year image with cloud-free image elements.
The land use data with a spatial resolution of 30 m in the fifth period were obtained from the product data (Earth System Science Data) of the study by Huang Xin’s team at Wuhan University (Yang and Huang, 2021). The administrative boundary vector data of Zhanjiang city districts and counties were obtained from the geographic state monitoring platform (Table 1).1

Table 1. Data sources.
Vegetation Greenness, humidity, heat, and dryness all play significant roles in how humans perceive ecological conditions visually, and as a result, they are frequently used to evaluate ecosystems (Moran et al., 2004; Yuan and Bauer, 2007; Gupta et al., 2012; Wei et al., 2022). Based on this, Xu Hanqiu proposed RSEI, combining four crucial ecological factors—vegetation greenness, humidity, dryness, and heat, which can accurately describe the quality of the ecological environment (Xu et al., 2013). Thus, this essay makes reference to his work in developing RSEI to evaluate the ecological environment quality of the city of Zhanjiang. The following are the calculation formulas for each ecological index.
Vegetation greenness is used to quantitatively reflect the information of vegetation growth status, vegetation cover and biomass (Li et al., 2020). The normalized differential vegetation index (NDVI) is used to represent vegetation greenness. The calculation formula of NDVI is as follows.
The wet indicator (WET) is intently connected to the ecologic environment, which indicates the humidity of water, soil, and vegetation (Nong et al., 2021). It acquired from the Tasseled Cap transformation (TCT). The calculation formula of WET is as follows and it is expressed differently by different satellite sensors (Wang et al., 2019).
Heat reflects the surface temperature of an area and is closely related to the ecologic environment (Nichol, 2005). The land surface temperature (LST) is used to represent heat index.
The standard method for retrieving LST from raw Landsat datasets requires the conversion of the DN values of the thermal bands into at-satellite spectral radiance values (L6). And then into the at-satellite brightness temperature (T; Chander et al., 2009). The calculation formula of LST, T, and L6 is as follows:
The index-based built-up indicator (IBI) just reflects the situation of building land. Therefore, the dryness index can be declared by the average value of SI and IBI, called “NDBSI” (Rikimaru et al., 2002). The calculation formula of NDBSI, IBI, and SI are as follows:
In this study, principal components analysis (PCA) was used to construct a remote sensing ecological index (RSEI). It couples four single indicators into one comprehensive index, concentrating the main information on the first principal component (PC1), which enables the RSEI to synthesize the information of the four indicators. The advantage of using the principal component analysis method is that the index weights are more objective and avoid the bias of results caused by weight settings that vary from person to person and from method to method.
Before creating the RSEI index, each index must be normalized such that its value is between 0 and 1, as the dimensions of the NDVI, WET, NDBSI, and LST are not uniform. The formula is defined as follows:
T represents the original index, Tmax and Tmin represent the maximal and minimal values, and TN represents normalized value.
Due to the existence of a large range of water bodies and wetlands in the study area, the modified Normalized difference Water index (MNDWI) was used to mask the water bodies in Zhanjiang City before the principal component analysis of the indicators to avoid the influence of the water bodies on the weight of the WET components, which in turn affects the load value distribution of PCA.
The principal component analysis (PCA) was performed on the ecologic indicators of greenness, wetness, dryness, and heat obtained after normalization and water body masking, and ENVI software calculated the RSEI. The formula is showed as.
To facilitate comparison and metrics among indicators, RSEI can be normalized similarly.
The higher the value of RSEI is, the better the quality of ecological environment, and vice versa, the worse the quality of ecological environment.
Regional planning often takes into account population issues. Population growth will require more impervious developed space for work, living, and various social activities, which will result in the loss of natural landscapes such as vegetation and water, and affect the impact of regional planning on ecosystems and the environment. Xu (2013) related population density to potential IS growth area in order to predict the impact of the amount of population growth on the ecological environment. Therefore, this study combines population growth with potential IS area growth to predict the impact of future population growth on the ecological environment of Zhanjiang City.
Based on the predicted population expansion through 2035, the impervious equilibrium area is computed. After the expansion of IS, the area’s general ecological quality will not be impacted. This amount is referred to as the imperviousness level metric. Current population, current IS area, current population density, planned future population, and planned future population density are among the factors used in the determination of the imperviousness level metric. The model is developed as follows:
where A is the estimated balance amount of total impervious surface area, where Ac is the current impervious surface area, Pc is the current population, Dc is the current population density, and Dp is the planned future population density.
Analyzing the functional relationship between the RSEI and impervious areas is an important prerequisite for predicting the ecological impact of urban development planning in Zhanjiang. In this paper, based on land use data and RSEI value in 2000, 2005, 2009, 2015, and 2020, we used a one-dimensional linear regression method to quantify the functional relationship between the percentage of impervious area and the RSEI through spss software to predict the possible impact of future construction activities on the environmental quality of the study area (Hanqiu et al., 2019).
According to Table 2, which shows the eigenvalue contribution rate for each year as well as the loadings of the four ecological indicators in various main components in 2000, 2005, 2009, 2015, and 2020, the Eigenvalue of the four indices is concentrated in PC1. 67.9, 71.1, 59.1, 75.6, and 75.2%, respectively, of the contributions to the PC1 eigenvalue in the years 2000, 2005, 2009, 2015, and 2020. The four indices’ loadings are clearly symmetrical in PC1, with WET and NDVI having positive loadings and LST and NDBSI having negative loadings. This shows that ecosystem quality is positively impacted by humidity and greenness and negatively impacted by dryness and high heat indices. The outcome is essentially in accordance with the actual situation. As a result, the first principle component served as the foundation for this study’s RSEI.
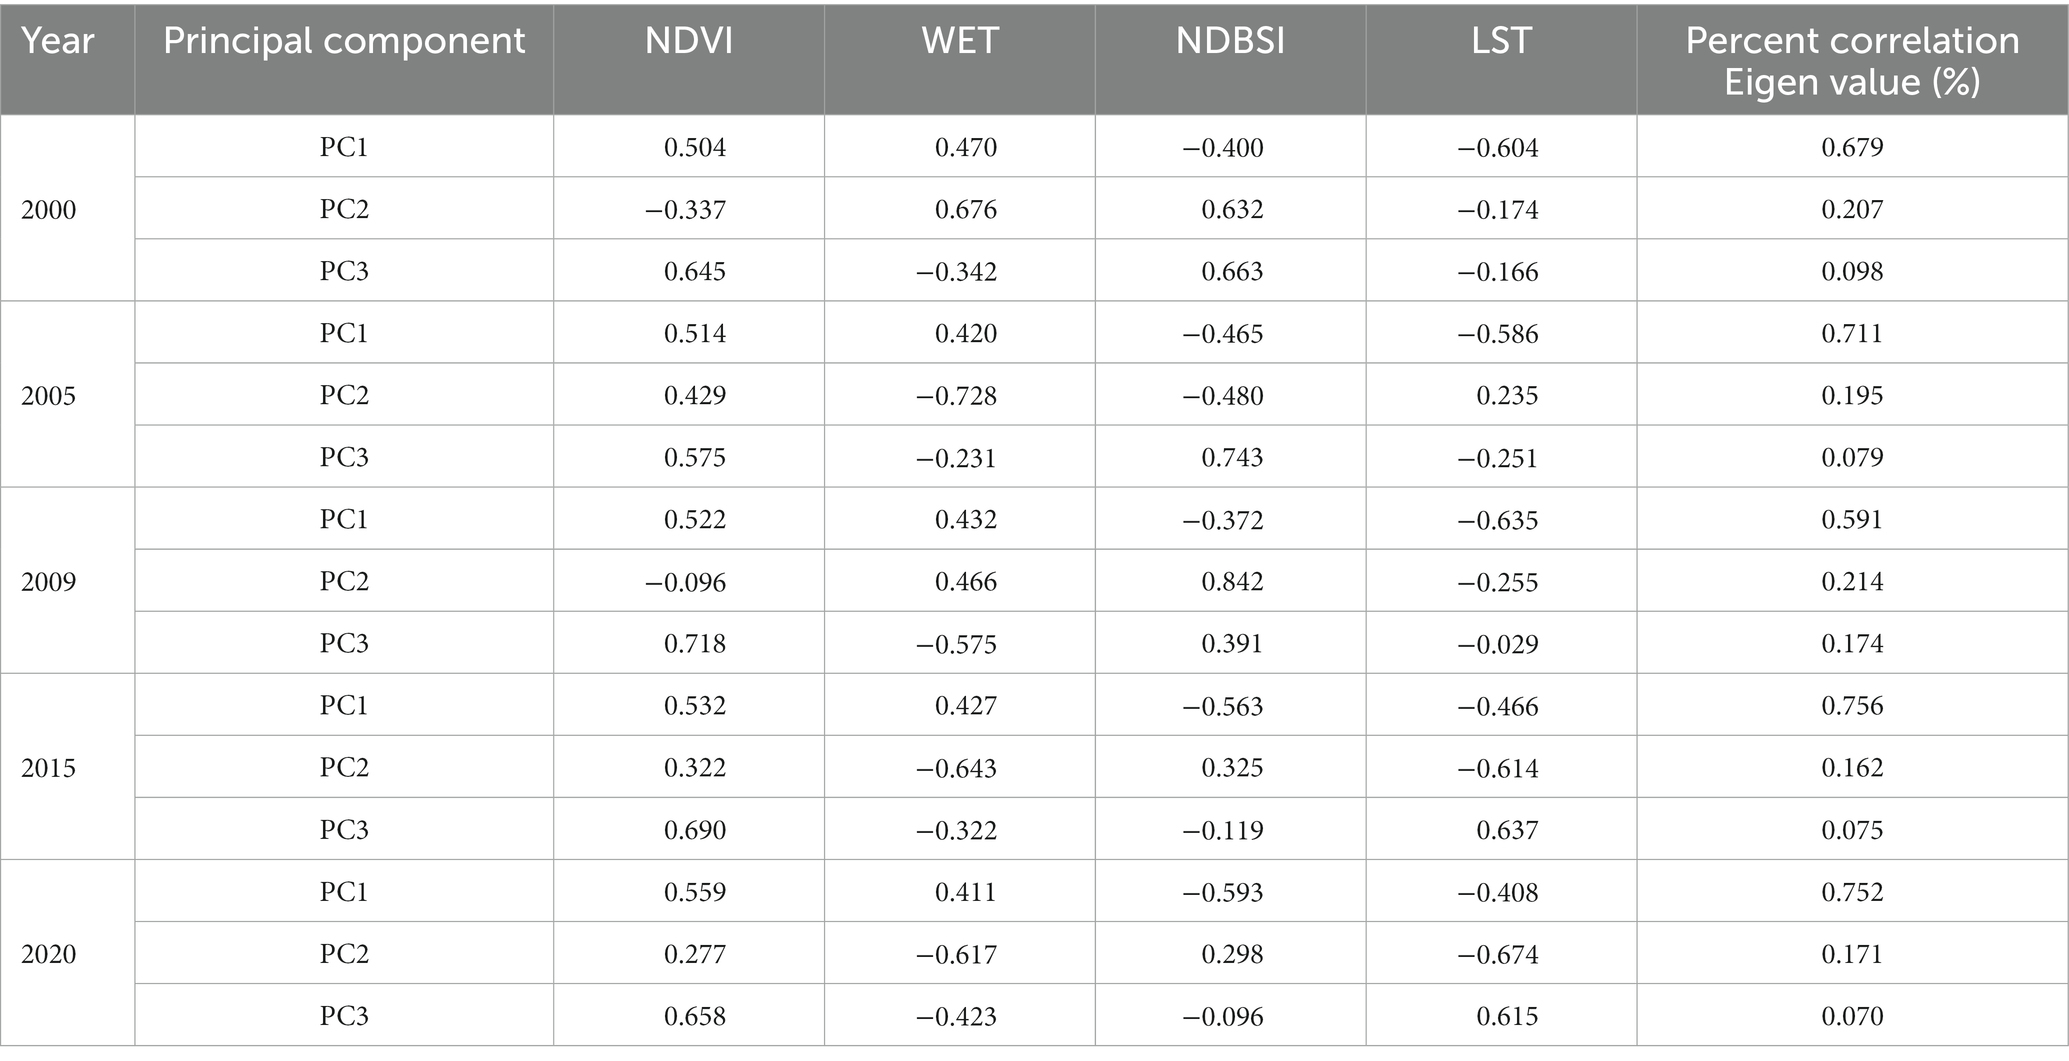
Table 2. Results of the principal component analysis of each index in each year.
Table 3 shows that from 2000 to 2020, the RSEI went from 0.579 to 0.601, an increase of about 2.2%. One of them, the RSEI index, showed no change from 2005 to 2009, a 3.1% increase from 2000 to 2005, a 1.7% increase from 2009 to 2015, and a 0.1% decrease from 2015 to 2020. With a maximum value of 0.684 in 2015, the average correlation between NDVI and RSEI—which compares the four ecological indicators—is the greatest at 0.642. The average correlation between the four ecological indicators LST and RSEI is lower, at 0.435, with the minimum values occurring in 2015 at 0.395. The average correlation scores for the last two indicators are 0.575 and 0.596.
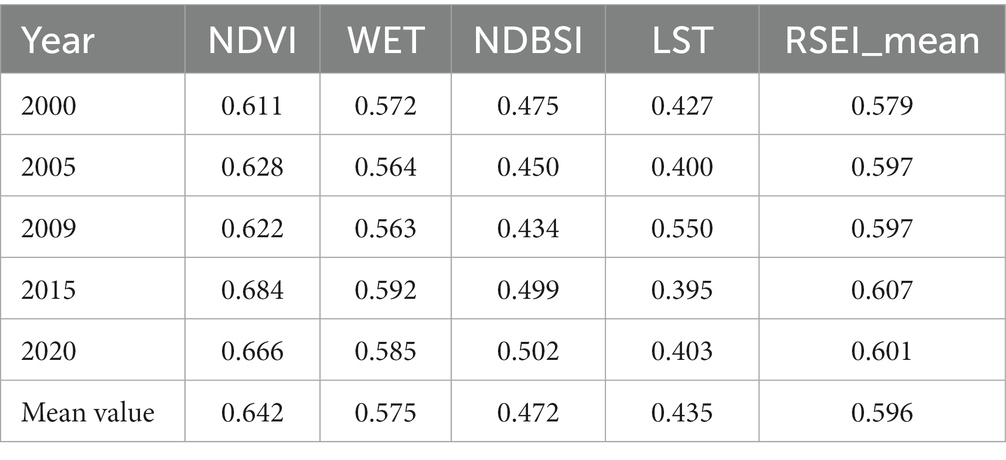
Table 3. The mean value of RSEI and mean correlation between RSEI and each index in different years.
The spatial distribution of RSEI values in Zhanjiang city in 2000, 2005, 2009, 2015, and 2020 is shown in Figure 2. As can be seen, between 2000 and 2009, places with poor ecological conditions were primarily distributed in coastal urban areas and the north, while areas with better ecological conditions were primarily spread in the center and southern areas. The northern region’s ecological environment quality has increased between 2000 and 2005. Nonetheless, the ecological condition of the northern region declined between 2005 and 2009. The RSEI values’ spatial distribution is similar between 2015 and 2020. Urbanized coastal areas tend to have places with a worse natural environment. In general, Zhanjiang City’s center and southeast regions have superior ecological conditions than its coastal metropolitan districts.
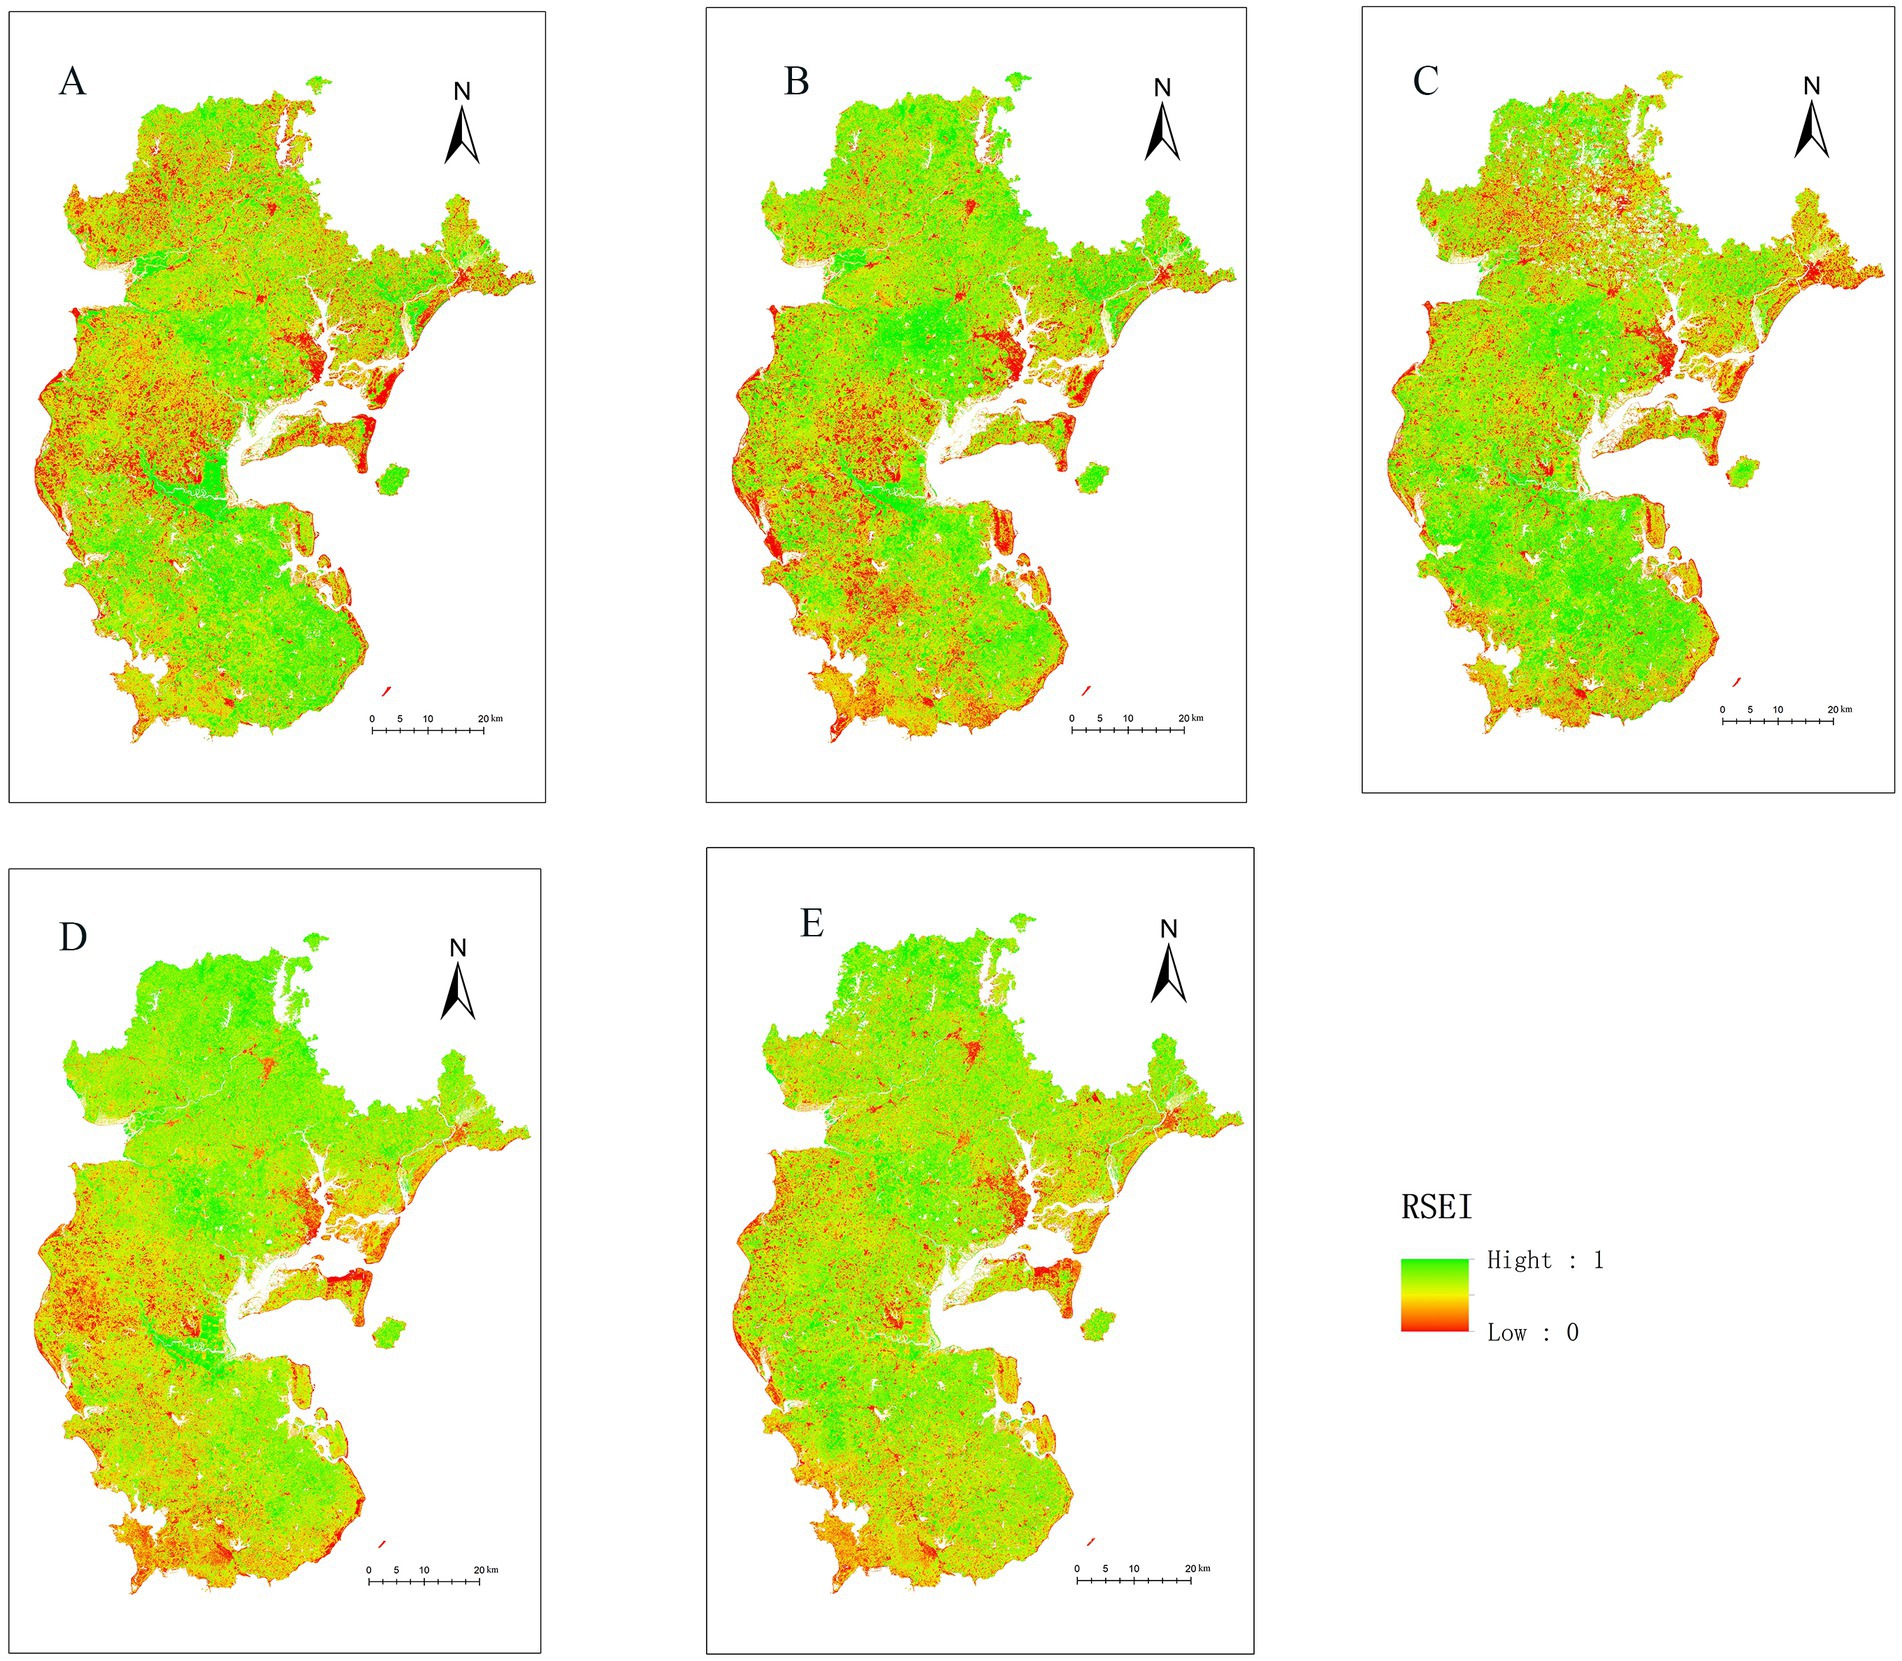
Figure 2. Remote sensing Ecological Index from 2000 to 2020; (A) Remote sensing Ecological Index in 2000, (B) Remote sensing Ecological Index in 2005, (C) Remote sensing Ecological Index in 2009, (D) Remote sensing Ecological Index in 2015, (E) Remote sensing Ecological Index in 2020.
Table 4 displays the ecological environment quality in Zhanjiang City for the years 2000, 2005, 2009, 2015, and 2020. In general, the ecological conditions are good or exceptional in more than 60% of Zhanjiang City’s areas. In terms of proportion, the distribution of grades in 2000, 2005, and 2009 is similar. Also, the percentages of each grade’s natural environment are similar between 2015 and 2020. In Zhanjiang, the percentage of bad ecological quality declined by 5% from 2009 to 2015, while the percentage of good ecological quality rose by 5%. As a result, Zhanjiang City’s total ecological environment quality has improved since 2009, with the places with poor ecological quality seeing the most improvement.
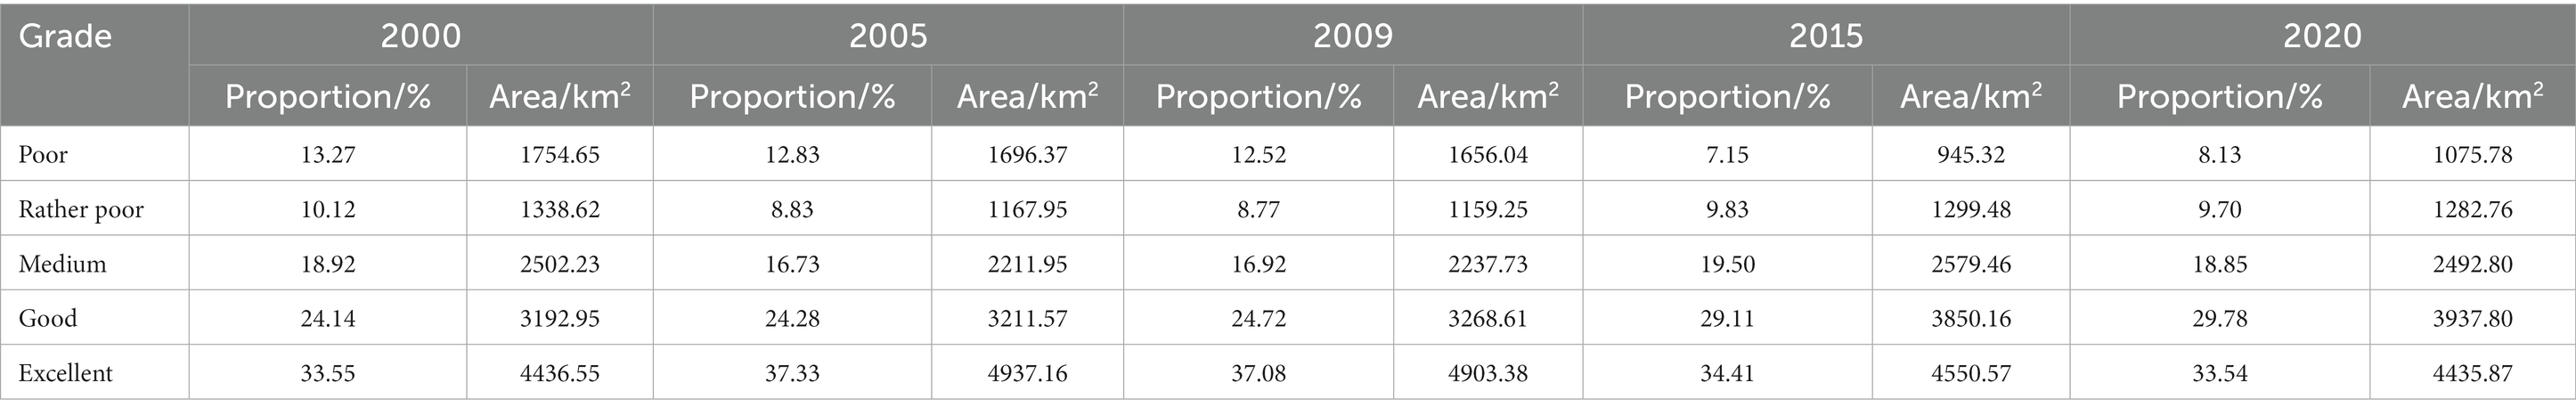
Table 4. Area and proportion of RSEI of each grade in each year.
According to the RSEI values and using equal intervals, the study region was categorized into five categories in Figure 3: excellent, good, medium, fairly poor, and poor. The majority of the regions with a pretty low grade are found in coastal towns, demonstrating that human activities have a negative impact on the ecological quality. The southeast and center regions of the country tend to have the best ecological conditions. Since this area contains forest land, it is clear that vegetation positively affects the ecological quality.
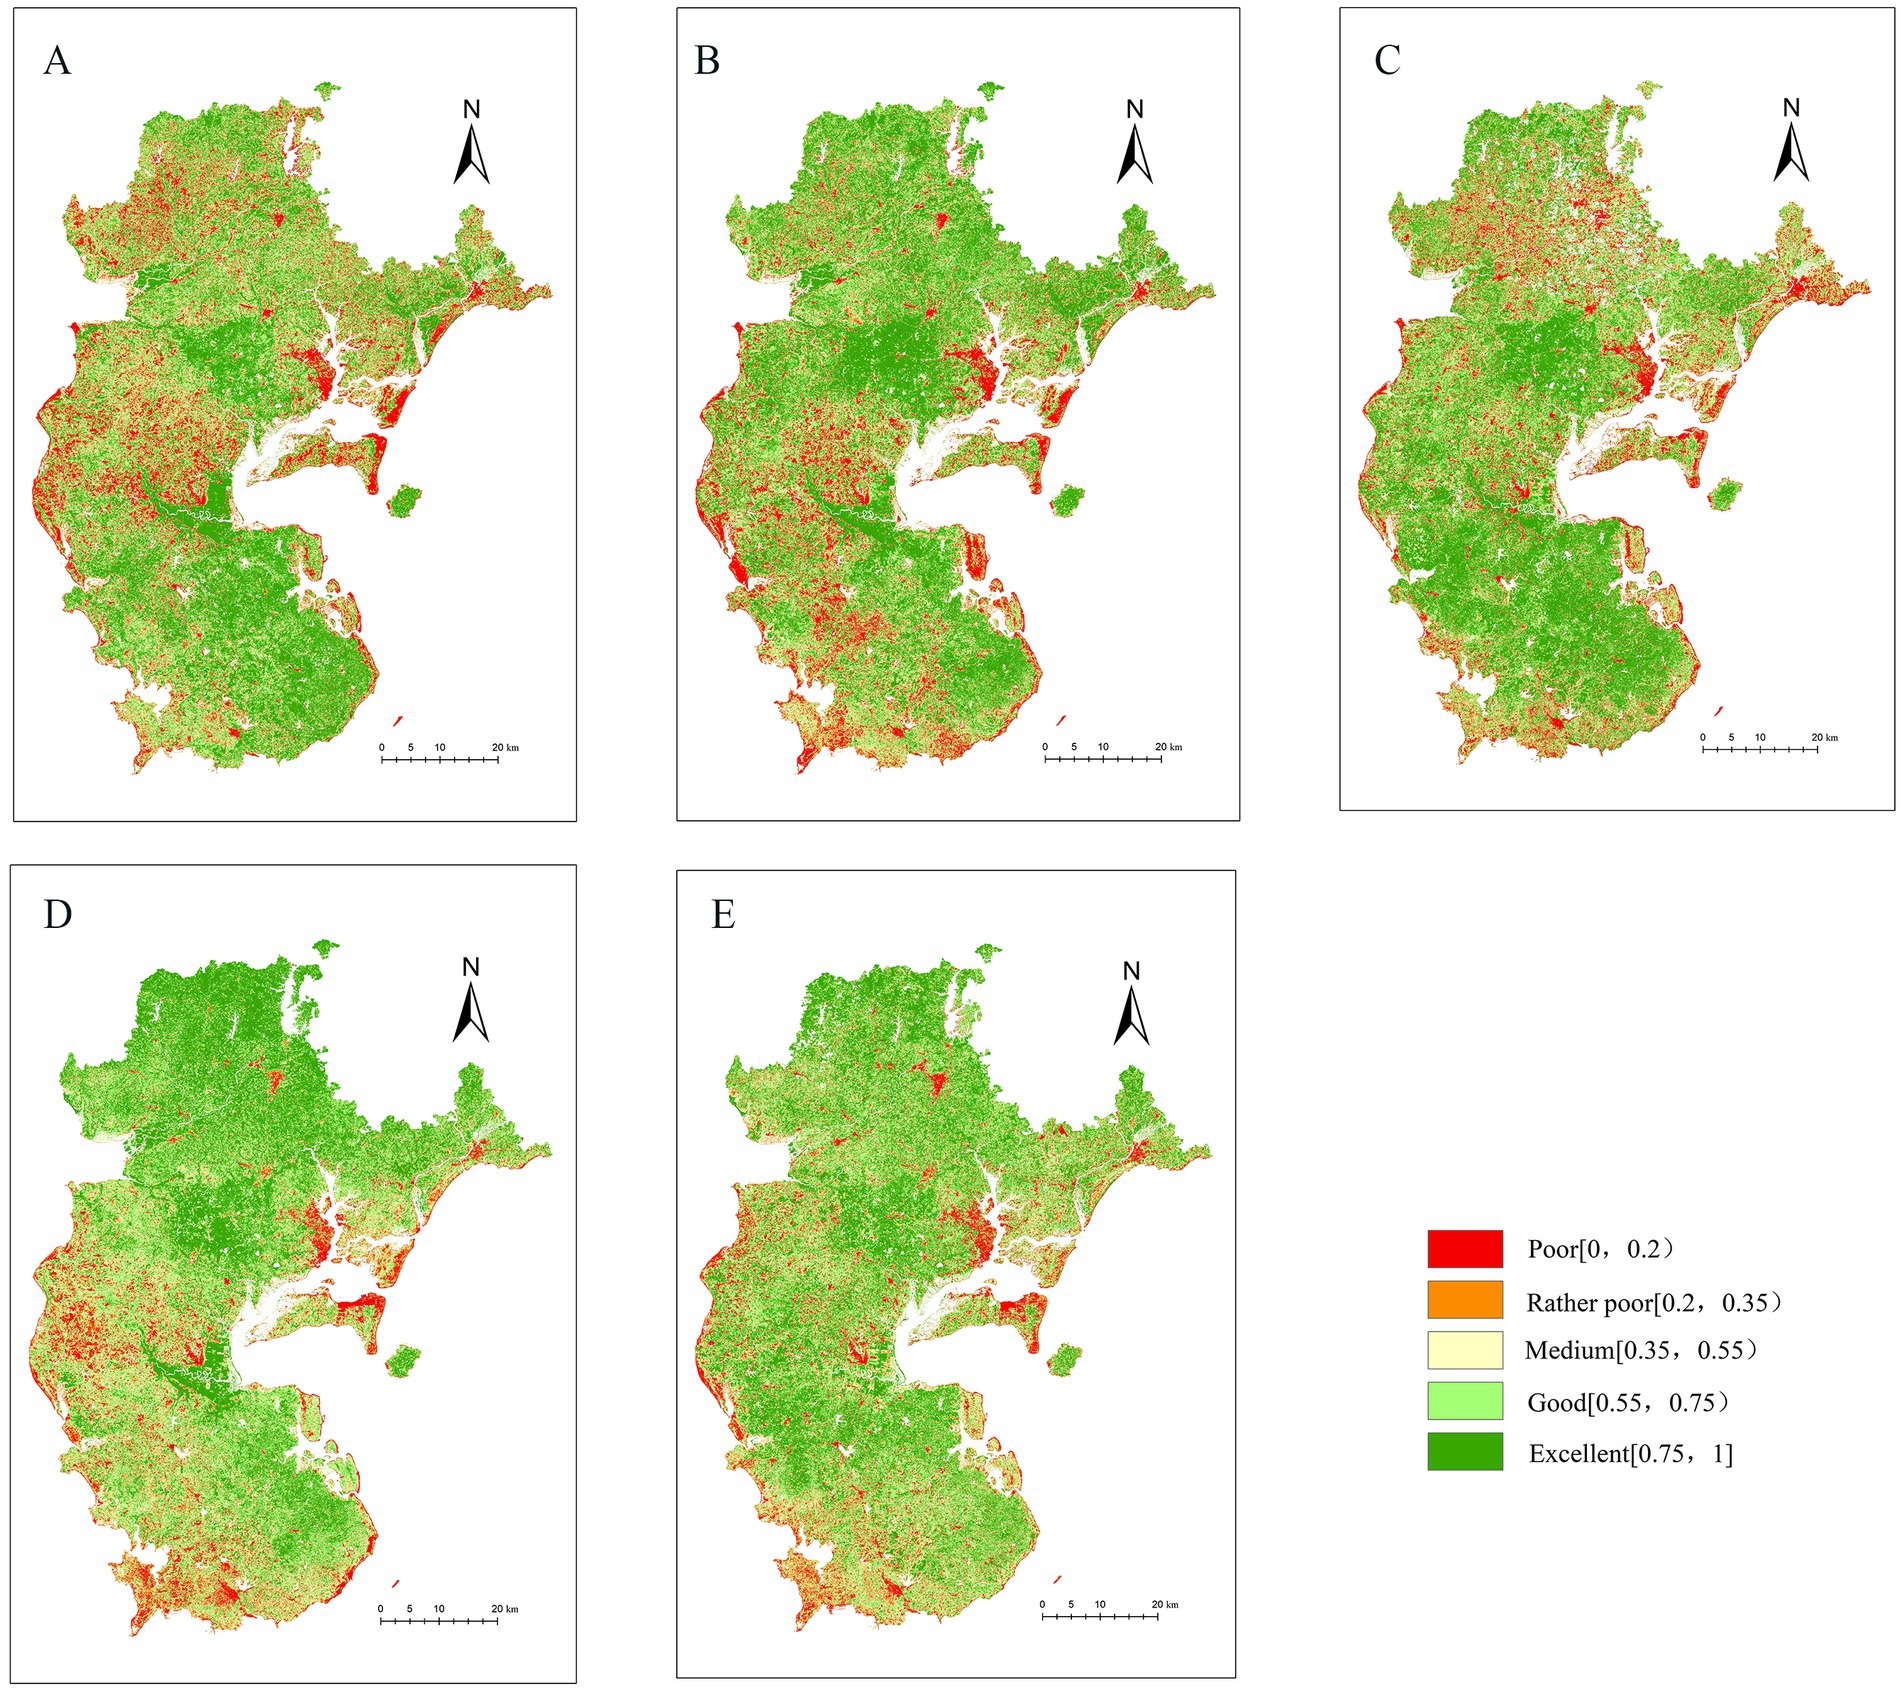
Figure 3. Remote sensing Ecological Index Grading from 2000 to 2020; (A) Remote sensing Ecological Index Grading in 2000, (B) Remote sensing Ecological Index Grading in 2005, (C) Remote sensing Ecological Index Grading in 2009, (D) Remote sensing Ecological Index Grading in 2015, (E) Remote sensing Ecological Index Grading in 2020.
The RSEI values of Zhanjiang City were differed for 5 periods in order to further study the temporal and spatial variations in ecological environmental quality in Zhanjiang City from 2000 to 2020. The differential results were graded. Table 5 shows the changes in Zhanjiang City’s ecological environment quality and its percentage during a 20-year period. The percentage of Zhanjiang City’s ecological environment that was significantly better and significantly worse over the course of the five periods is quite close to 30%. Around 7% of changes are for the better, whereas 7% are for the worse. Overall, the percentage of Zhanjiang City’s ecological environment that is better than significantly worse is significantly higher, whereas this is not the case for the time periods 2005 to 2009 and 2015 to 2020, where the percentage of ecological environment that is better than significantly worse is lower. In Zhanjiang, the percentages of a better and substantially better ecological environment quality during the last 20 years are 6.47 and 38.38%, respectively. These percentages are somewhat higher than those of a poorer and significantly worse ecological environment quality. This suggests that in 2020, Zhanjiang City’s ecological environment quality has increased compared to 2000.
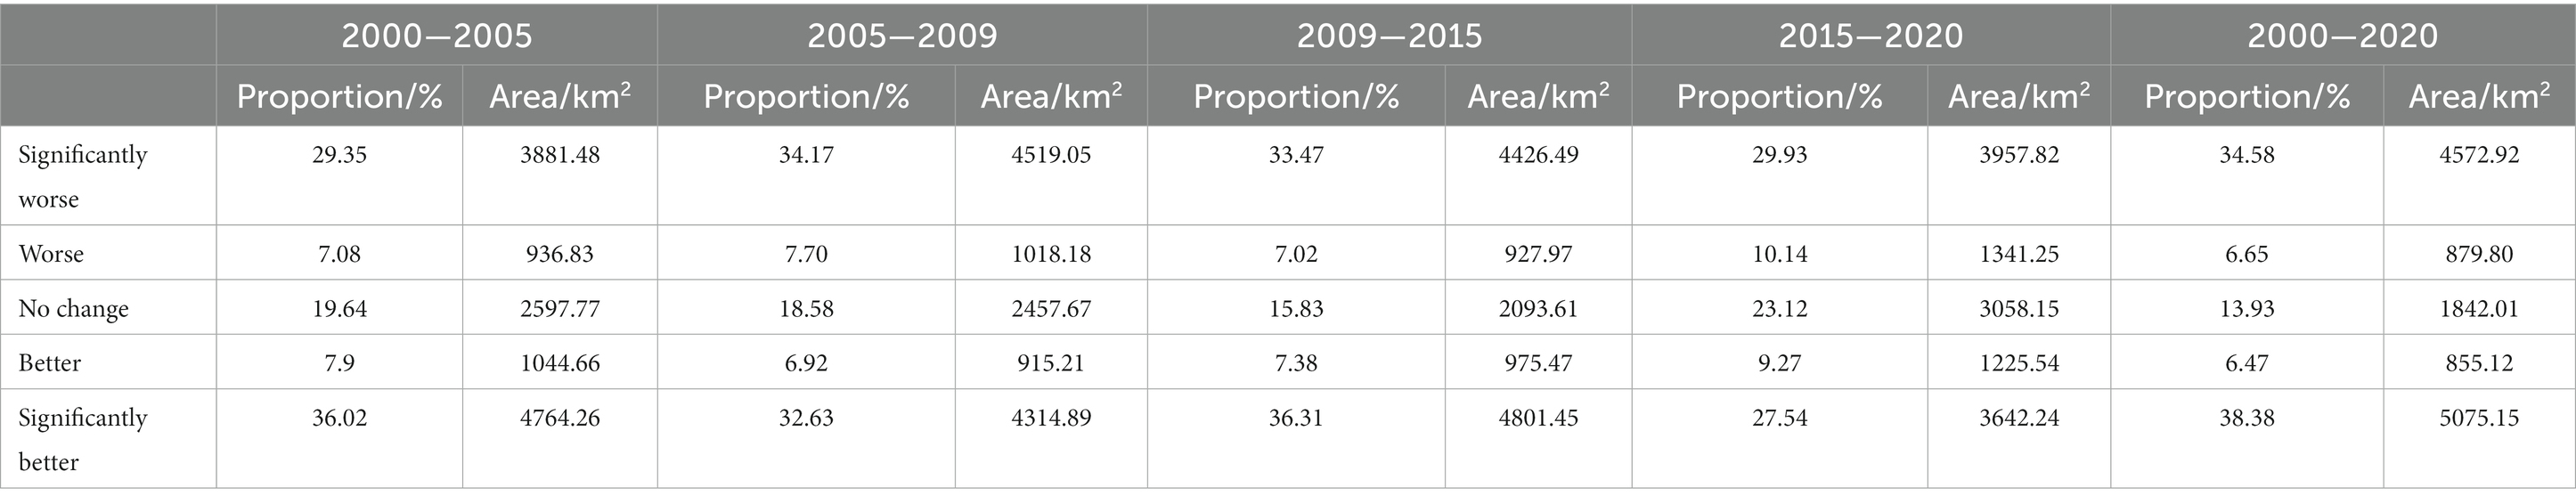
Table 5. Changes of ecological environment quality to different degrees.
According to Figure 4, there were similar regional variations in ecological quality between 2000 and 2005 and 2009 and 2015, with the northern portion of Zhanjiang experiencing significantly better ecological quality and the southern region experiencing significantly worse ecological quality. The areas with significantly worse ecological quality occur in the northern part of Zhanjiang, while the areas with significantly better ecological quality primarily occur in the southern part of the city, which is a similar pattern to the spatial changes in ecological quality from 2005 to 2009 and from 2015 to 2020. In the southern region and coastal urban area, the ecological environment’s quality has declined.
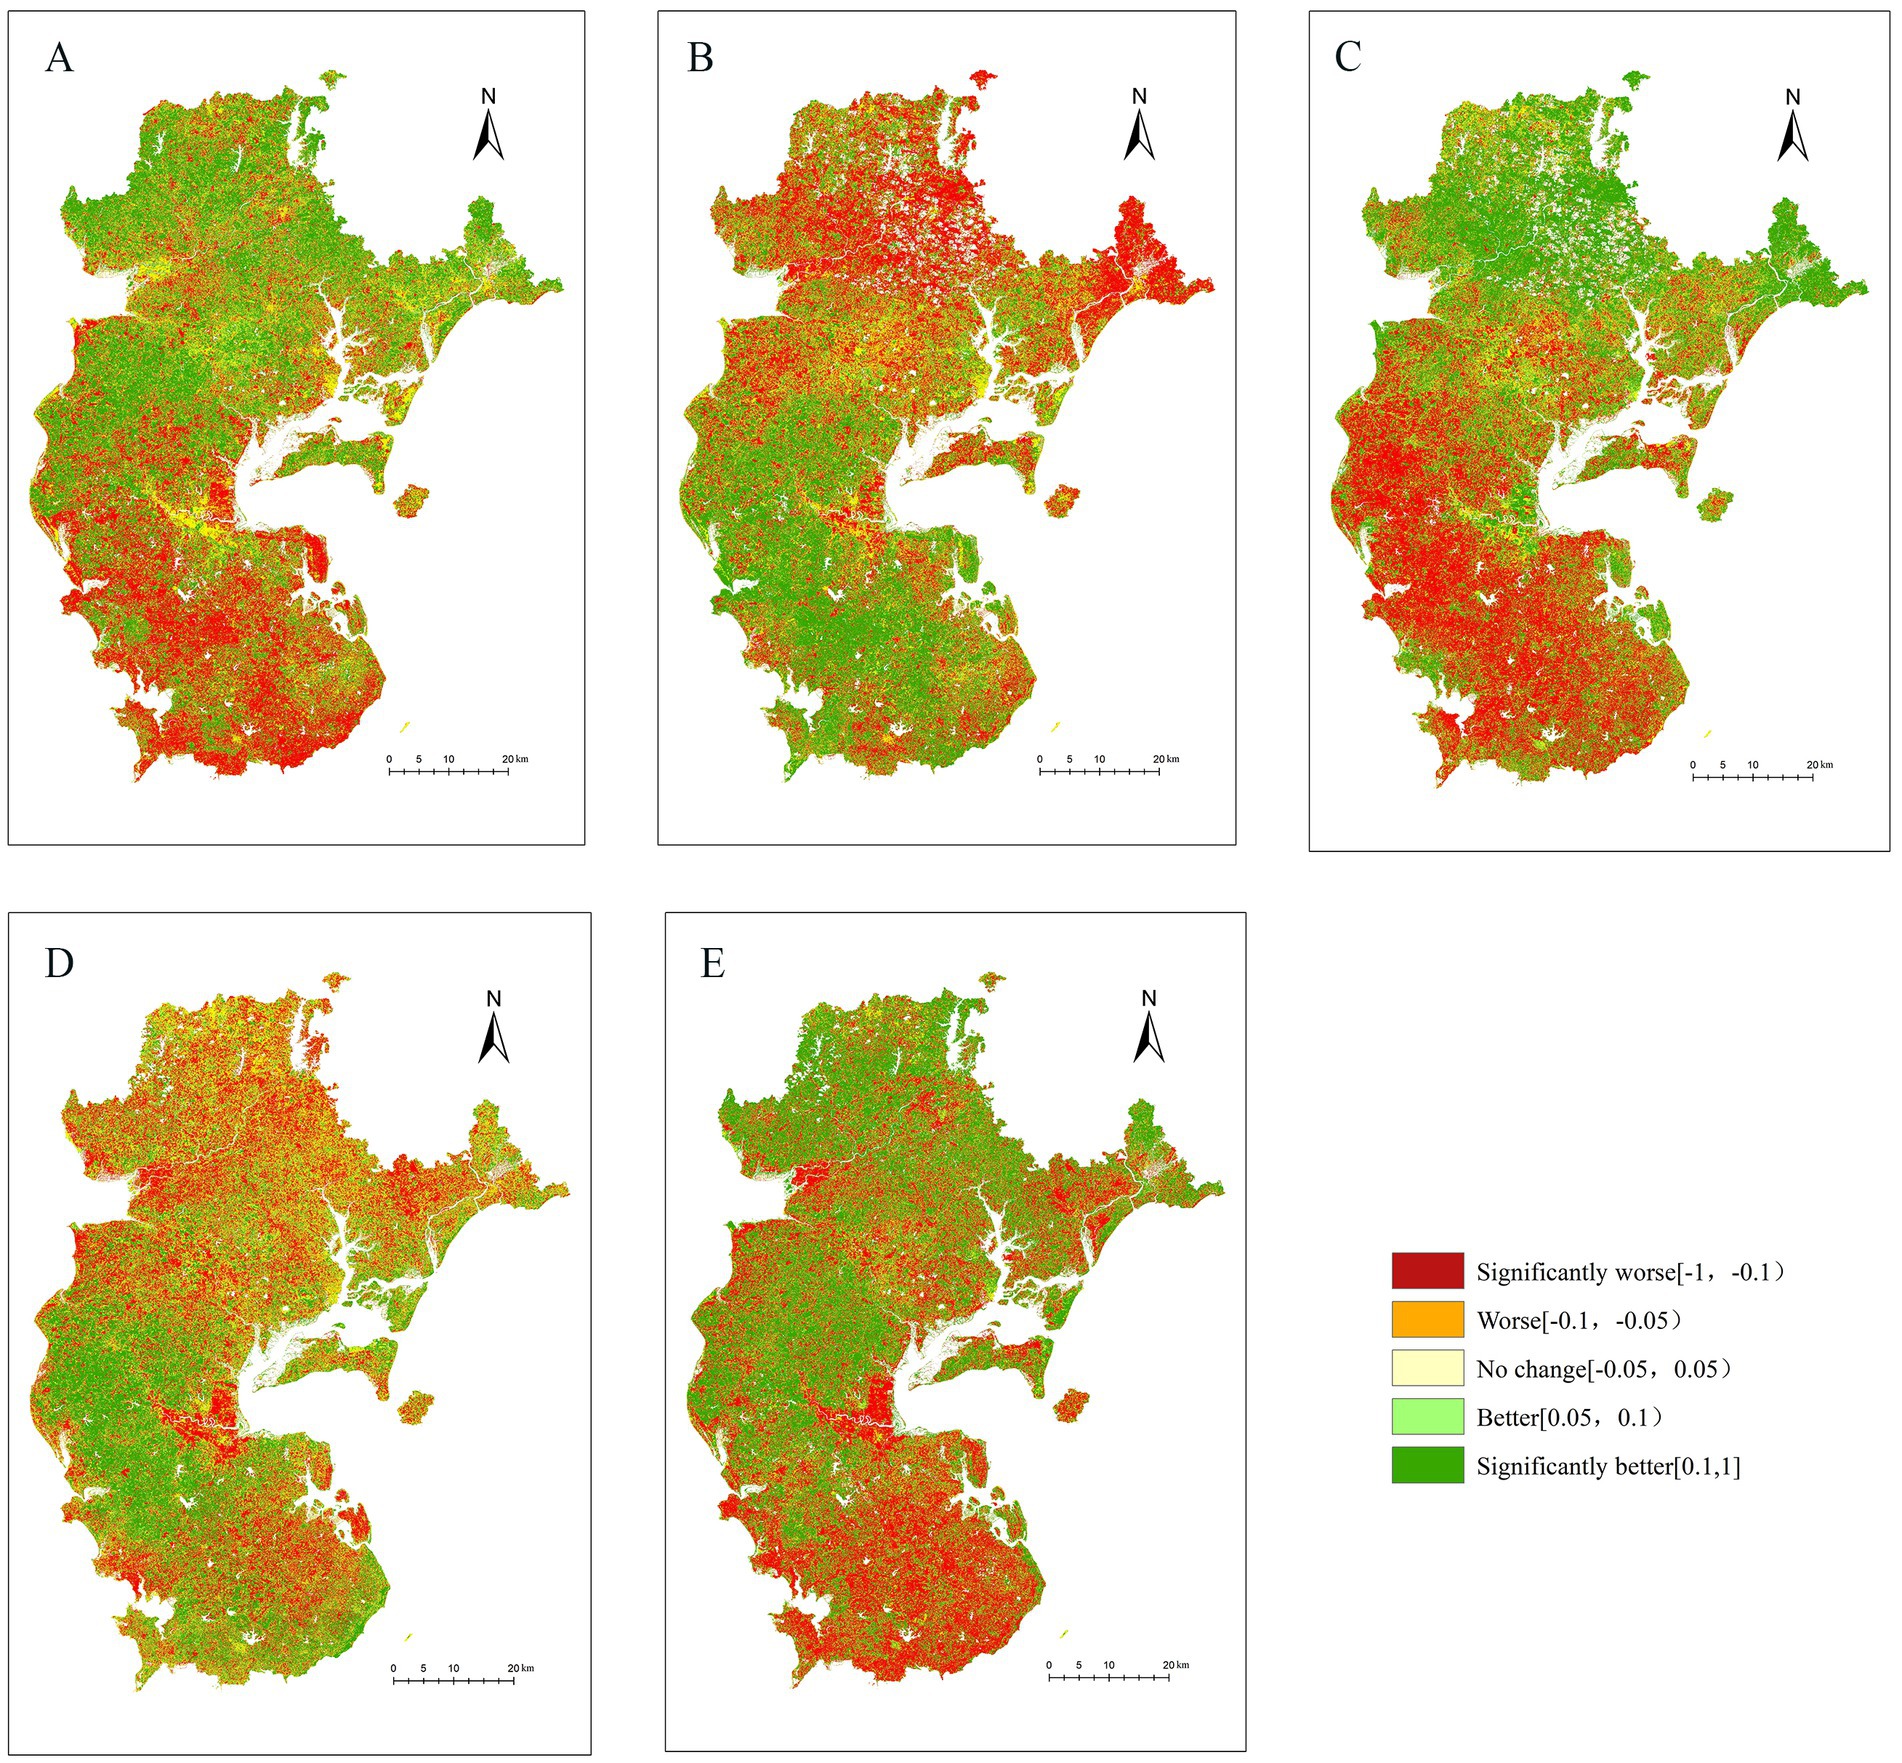
Figure 4. Space change of ecological environment in Zhanjiang city from 2000 to 2020, (A) Space change of ecological environment in Zhanjiang city in 2000, (B) Space change of ecological environment in Zhanjiang city in 2005, (C) Space change of ecological environment in Zhanjiang city in 2009, (D) Space change of ecological environment in Zhanjiang city in 2015, (E) Space change of ecological environment in Zhanjiang city in 2020.
Using the RSEI index as the dependent variable and the percentage of impervious surface area in the study area as the independent variable, a multiple linear regression analysis was performed to obtain the following relationship equation.
Equation (12) shows that R is greater than 0.6, indicating that the whole equation has a high agreement with the original data. The negative sign of the coefficient of IS indicates that impervious surfaces have a bad impact on environmental quality. The p < 0.1 significance test was passed in the regression equation, indicating that it is an important influence on regional environmental quality, influencing factors. According to model 16, as long as the percentage of impervious surfaces in the study area increases by 10% (e.g., from 20 to 30%), the RSEI value will decrease by 0.118.
According to the Zhanjiang City 2035 planning, the population growth and area expansion planned for 2035 are available at this stage. Therefore, this paper predicts the impact of population growth on ecological quality by linking population growth to IS increase based on the previous relationship between the two variables.
Zhanjiang City has a planned maximum population of 10 million in 2035 and a population density of 679 persons/km2. According to the census data, the area has a population of 7.03 million in 2020 and a density of 576 persons/km2. This study shows that the IS area and the average RSEI of the area in 2020 are 470.53 km2 and 0.758 km2. These data are the inputs to the estimation model.
The expected value of the total IS area was first estimated using Eq. (13), and the results were subsequently used as input to Eq. (16) as a way to predict the RSEI in 2035.
The results show that the projected value of Eq. (16) for the total IS area of Zhanjiang City is 511 km2. The mean value of RSEI in 2035 projected using this quantity is 0.488.
Some academics analyze the relationship between population and ecological environment because they predict that increasing populations would result in resource shortages, exacerbate environmental contamination, and put more strain on ecosystems (Chen et al., 2009). According to some scholars, large-scale urban development not only modifies the original natural environment, causing significant ecological changes that make it easier to trigger geological disasters like landslides, debris flows, and soil erosion, but also causes cities to produce heat islands that have varying degrees of an impact on the natural environment around them (He et al., 2017; Zhao et al., 2017). The interaction of many components in the ecological environment is currently being given more attention in academic circles (Ping and Fang, 2014; Zhong et al., 2015; Yuan et al., 2016). Analysis reveals that the contribution level of a single factor is greatly outweighed by the interaction effect of numerous factors. Our research offers a comparatively thorough identification approach for carefully taking into account numerous governance-related criteria. The RSEI integrates four factors, greenness, humidity, dryness and heat, which can more accurately represent the ecological environment quality of Zhanjiang City.
The findings of this study (Figure 2) are similar with those the study of Wang et al.’s (2022), arable land and impermeable surfaces tend to have a lower RSEI, wetlands and forests tend to correspond to higher RSEI values, and grasslands have RSEI values in the middle. In general, RSEI can more correctly describe the ecological environment quality of Zhanjiang. These show that the trend of ecological environmental quality is related to land-use types.
Table 3 shows the mean values of NDVI, WET, NDBSI and LST in 2000, 2005, 2009, 2015, and 2020. From the Table 3, it can be seen that the trend of NDVI change is similar to the trend of RSEI values in Zhanjiang City, which shows an increase in 2000–2015 and a decrease from 2015 to 2020. This indicates that, among these four indicators, the RSEI values are mainly influenced by NDVI. The other three indicators have less influence.
In this study, spass software was used to perform univariate linear regression between the impervious area and the RSEI value in the fifth period, and the Eq. (16), in which the impervious area showed a negative correlation with RSEI, and the RSEI value decreased with the increase of the impervious area. This is consistent with the results of Xu’s (2013) study.
Although this study can relatively objectively analyze the changes in ecological environment quality in Zhanjiang City through RSEI, and objectively predict the RSEI values in 2035 based on the regression model of impervious planning area and RSEI values. However, there are shortcomings in the study.
The atmosphere, vegetation, water system, temperature, and population diversity are also causes of changes in ecological environment quality, and the driving mechanism of the above factors on ecological environment quality changes still needs to be studied. If future studies can consider other ecological indicators comprehensively, the ecological environment quality of Zhanjiang City can be evaluated more comprehensively.
Due to the cloud cover in some areas of the study area and the presence of a small amount of water bodies, the data were de-clouded and masked with water bodies. As a result, there are a few blank image elements in Figures 2–4.
There are large areas of mudflat wetlands in the study area, and there are certain differences in the area and extent of water bodies in different seasons, which have certain effects on the moisture factor and water body mask extraction. The time range of the image data selected in this study is summer, therefore, the RSEI of the study area has some seasonal differences. In the future development, the seasonality of ecological regions can be considered so that the RSEI can monitor the quality of ecological environment more comprehensively.
This study takes Zhanjiang City as the study area and constructs the Zhanjiang City Ecological Environment Evaluation System-RSEI model. The findings of the study are as follows.
(1) The contribution rates of the first principal components of the RSEI constructed in this paper are all over 59%, and in PC1, the eigenvalue signs of the greenness index and the humidity index are positive and play a positive role in ecological environment quality assessment, while the eigenvalue signs of the dryness index and the heat index are negative and play a negative role in ecological environment quality assessment. Spatially speaking, the areas with high RSEI values were distributed in the central and southeastern regions of Zhanjiang City, and the land use types in these areas were mainly forests. In contrast, the RSEI index is low in the eastern coastal area, which is the central urban area of Zhanjiang and is a type of building land. In summary, the effect of the four ecological indicators on the quality of the ecological environment is in line with the actual basic situation. The RSEI index can accurately and comprehensively assess the ecological environment quality of Zhanjiang city.
(2) From 2000 to 2020, the RSEI values were 0.579, 0.597, 0.597, 0.607, and 0.601, respectively, showing a trend of “rising-falling.” According to the analysis of the difference between the remote sensing ecological index in 2000 and 2020, the ecological environment quality of Zhanjiang City has improved in the last 20 years.
(3) According to the regression model of impervious area and RSEI obtained from the study area’s population planning and total area planning in 2035, if the impervious planning area is 4.196% of the total planning area, obtain the 2035 Zhanjiang City RSEI forecast value of 0.488.
The original contributions presented in the study are included in the article/supplementary material, further inquiries can be directed to the corresponding author.
JinW: methodology, writing—original draft, visualization, and supervision. JiaW: writing—review and editing, and funding acquisition. XJ: resources. All authors contributed to the article and approved the submitted version.
This work was supported by the Natural Science Foundation of China (grant numbers 42171329, 42071342) and the Fundamental Research Funds for the Beijing Natural Science Foundation Program (grant numbers 8222069, 222052).
We are grateful to the undergraduate students and staff of the Laboratory of Forest Management and “3S” technology, Beijing Forestry University.
The authors declare that the research was conducted in the absence of any commercial or financial relationships that could be construed as a potential conflict of interest.
All claims expressed in this article are solely those of the authors and do not necessarily represent those of their affiliated organizations, or those of the publisher, the editors and the reviewers. Any product that may be evaluated in this article, or claim that may be made by its manufacturer, is not guaranteed or endorsed by the publisher.
Chander, G., Markham, B. L., and Helder, D. L. (2009). Summary of current radiometric calibration coefficients for Landsat MSS, TM, ETM+, and EO-1 ALI sensors. Remote Sens. Environ. 113, 893–903. doi: 10.1016/j.rse.2009.01.007
Chen, Y. Q., Li, Y. F., Qi, X. H., Chen, W. H., and Lin, J. H. (2018). Assessing ecosystem risk in coastal wetland of the South Fujian Golden Delta using a habitat risk assessment model based on the land-use effect on tidal flat wetland. Acta Ecol. Sin. 38, 4214–4225. doi: 10.5846/stxb201802120366
Chen, Q.-Q., Sun, X.-H., Wang, S.-L., and Yang, S. X. (2009). Impacts of social and economic factors on environment in Gannan Province. Northwest Popul. J. 30, 58–61. doi: 10.3969/j.issn.1007-0672.2009.06.024
Cheng, L. L., Wang, Z. W., Tian, S. F., Niu, Y. T., Sun, M. Y., and Yang, Y. M. (2021). Evaluation of eco-environmental quality in Mentougou District of Beijing based on improved remote sensing ecological index. Chin. J. Ecol. 40, 1177–1185. doi: 10.13292/j.1000-4890.202104.021
Gao, P., Kasimu, A., Zhao, Y., Chai, J., Rui, T., and Zhao, H. (2020). Evaluation of the temporal and spatial changes of ecological quality in the Hami oasis based on RSEI. Sustainability 12:7716. doi: 10.3390/su12187716
Gupta, K., Kumar, P., Pathan, S. K., and Sharma, K. P. (2012). Urban neighborhood green index – a measure of green spaces in urban areas. Landsc. Urban Plan. 105, 325–335. doi: 10.1016/j.landurbplan.2012.01.003
Hanqiu, X., Wang, M., Shi, T., Guan, H., Fang, C., and Lin, Z. (2019). Prediction of ecological effects of potential population and impervious surface increases using a remote sensing based ecological index (RSEI). Ecol. Indic. 93, 730–740. doi: 10.1016/j.ecolind.2018.05.055
He, J., Wang, S., Liu, Y., Ma, H., and Liu, Q. (2017). Examining the relationship between urbanization and the eco-environment using a coupling analysis: case study of Shanghai, China. Ecol. Indic. 77, 185–193. doi: 10.1016/j.ecolind.2017.01.017
Ji, J., Wang, S., Zhou, Y., and Wang, L. (2022). Spatiotemporal change and landscape pattern variation of eco-environmental quality in Jing-Jin-Ji urban agglomeration from 2001 to 2015. IEEE Access 8, 125534–125548. doi: 10.1109/ACCESS.2020.3007786
Jiang, C. L., Wu, L., Liu, D., and Xu, X. J. (2019). Dynamic monitoring of eco-environmental quality in arid desert area by remote sensing: taking the Gurbantunggut Desert China as an example. Chin. J. Appl. Ecol. 30, 877–883. doi: 10.13287/j.1001-9332.201903.008
Li, F. Y., Zhang, Y. Z., Zhao, Z. M., Cheng, M. Q., Cheng, M. Y., and Wang, Z. F. (2020). Evaluation of ecological pattern change of Nanhui Dongtan wetland in Shanghai based on remote sensing ecological index. J. Shanghai Ocean Univ. 29, 746–756. doi: 10.12024/jsou.20191002841
Matco-Caria, G., Comez-Chova, L., Amoros-Lopez, J., Muñoz-Marí, J., and Camps-Valls, G. (2018). Multitemporal eloud masking in the Google earth engine. Remote Sens. 10:1079. doi: 10.3390/rs10071079
Miao, X. H., and Liang, Q. O. (2021). Analysis of ecological environment changes in Yongjiang River basin based on remote sensing ecological index. Resour. Environ. Yangtze River Basin 30, 427–438. doi: 10.11870/cjlyzyyhj202102017
Ministry of Environmental Protection (2005). Technical specifications for ecological environment assessment:HJ192—2015. Beijing: China Environmental Science Press.
Moran, M. S., Peters-Lidard, C. D., Watts, J. M., and McElroy, S. (2004). Estimating soil moisture at the watershed scale with satellite-based radar and land surface models. Can. J. Remote. Sens. 30, 805–826. doi: 10.5589/m04-043
Nichol, J. (2005). Remote sensing of urban heat islands by day and night. Photogramm. Eng. Remote Sens. 71, 613–621. doi: 10.14358/PERS.71.5.613
Nong, L. P., and Wang, J. L. (2020). Dynamic monitoring of ecological environment quality in Kunming based on RSEI model. Chin. J. Ecol. 39, 2042–2050. doi: 10.13292/j.1000-4890.202006.025
Nong, L. P., Wang, J. L., and Yu, Y. H. (2021). Research on ecological environment quality in Central Yunnan based on MRSEI model. J. Ecol. Rural Environ. 37, 972–982. doi: 10.19741/j.issn.1673-4831.2020.0821
Ping, Y. I., and Fang, S. (2014). Coupling coordination between the socio-economic benefits and eco-environmental benefits of the songshan global geopark. Resour. Sci. 36:11. doi: 10.3969/jissn.1671-9646(X).2014.07.051
Qin, L., Chen, B. Q., Yu, Y., Yang, J. L., and Yang, Y. (2023). Study on Spatio-temporal variation of ecological environment before and after mine closure based on RSEI. Metal Mine 58, 1–12. doi: 10.19614/j.cnki.jsks.202303033
Rai, P. K. (2013). Forest and land use mapring using remote sensing and ceographical information system: a case study on model system. Environ. Skep. Crit. 2, 97–107.
Rikimaru, A., Roy, P. S., and Miyatake, S. (2002). Tropical forest cover density mapping. Trop. Ecol. 43, 39–47. doi: 10.20659/jfp.15.2_63
Song, M. J., Luo, Y. Y., and Duan, L. M. (2019). Evaluation of ecological environment in the Xilin Gol steppe based on modified remote sensing ecological index modell. Arid Zone Res. 36, 1521–1527. doi: 10.13866/j.azr.2019.06.22
Wang, Y. (2008). Guangdong Zhanjiang mangrove National Nature Reserve Management Status and conservation measures. Wetl. Sci. Manag. 4:2. doi: 10.3969/j.issn.1673-3290.2008.02.013
Wang, L. C., Jiao, L., Lai, F. B., and Zhang, N. M. (2019). Evaluation of ecological changes based on a remote sensing ecological index in a Manas Lake wetland, Xinjiang. Acta Ecol. Sin. 39, 2963–2972. doi: 10.5846/stxb201804030758
Wang, J., Ma, J. L., and Xie, F. F. (2020). Improvement of remote sensing ecological index in arid regions: taking Ulan Buh Desert as an example. Chin. J. Appl. Ecol. 31, 3795–3804. doi: 10.13287/j.1001-9332.202011.011
Wang, S., Zhang, M., and Xi, X. (2022). Ecological environment evaluation based on remote sensing ecological index: a case study in East China over the past 20 years. Sustainability 14:15771. doi: 10.3390/su142315771
Wei, X., Yang, J., Luo, P., Lin, L., Lin, K., and Guan, J. (2022). Assessment of the variation and influencing factors of vegetation NPP and carbon sink capacity under different natural conditions. Ecol. Indic. 138:108834. doi: 10.1016/j.ecolind.2022.108834
Wu, K. R., Gao, Q., Wang, R. H., Yang, P., Peng, Q., and Liu, C. W. (2021). Evaluation of ecological environment quality in Shijiazhuang based on RSEI model. Prog. Geophys. 36, 968–976. doi: 10.6038/pg2021EE0361
Xu, H. Q. (2013). A remote sensing urban ecological index and its application. Acta Ecol. Sin. 33, 7853–7862. doi: 10.5846/stxb201208301223
Xu, X. G., Peng, H. F., and Xu, Q. Z. (2006). Land resource conflicts and coordination in fast urbanized coastal zone: a case study of the Shandong peninsula. J. Peking Univ. Nat. Sci. Ed. 42, 527–5333. doi: 10.13209/j.0479-8023.2006.097
Xu, H. Q., Shi, T. T., Wang, M. Y., and Lin, Z. (2013). L.Land cover changes in the Xiong' an new area and a prediction of ecological response to forthcoming regional planning. Acta Ecol. Sin. 37, 6289–6301. doi: 10.5846/stxb201705210941
Yang, J., and Huang, X. (2021). The 30 m annual land cover dataset and its dynamics in China from 1990 to 2019. Earth Syst. Sci. Data 13, 3907–3925. doi: 10.5194/essd-13-3907-2021
Yuan, F., and Bauer, M. E. (2007). Comparison of impervious surface area and normalized difference vegetation index as indicators of surface urban heat island effects in Landsat imagery. Remote Sens. Environ. 106, 375–386. doi: 10.1016/j.rse.2006.09.003
Yuan, Y. Y., Wahap, H., Guan, J. Y., Lu, L. H., and Zhang, Q. (2016). Spatial differentiation and impact factors of Yutian Oasis’s soil surface salt based on GWR model. Chin. J. Appl. Ecol. 27, 3273–3282. doi: 10.13287/j.1001-9332.201610.022
Zhao, Y., Wang, S., Ge, Y., Liu, Q., and Liu, X. (2017). The spatial differentiation of the coupling relationship between urbanization and the eco-environment in countries globally: a comprehensive assessment. Ecol. Model. 360, 313–327. doi: 10.1016/j.ecolmodel.2017.07.009
Keywords: ecological environment quality, remote sensing ecological index, Zhanjiang City, forecast, impervious area balance
Citation: Wang J, Wang J and Xu J (2023) Spatio-temporal variation and prediction of ecological quality based on remote sensing ecological index – a case study of Zhanjiang City, China. Front. Ecol. Evol. 11:1153342. doi: 10.3389/fevo.2023.1153342
Edited by:
Weiwei Sun, Ningbo University, ChinaReviewed by:
Chao Chen, Zhejiang Ocean University, ChinaCopyright © 2023 Wang, Wang and Xu. This is an open-access article distributed under the terms of the Creative Commons Attribution License (CC BY). The use, distribution or reproduction in other forums is permitted, provided the original author(s) and the copyright owner(s) are credited and that the original publication in this journal is cited, in accordance with accepted academic practice. No use, distribution or reproduction is permitted which does not comply with these terms.
*Correspondence: Jia Wang, d2FuZ2ppYTIwMDlAYmpmdS5lZHUuY24=
Disclaimer: All claims expressed in this article are solely those of the authors and do not necessarily represent those of their affiliated organizations, or those of the publisher, the editors and the reviewers. Any product that may be evaluated in this article or claim that may be made by its manufacturer is not guaranteed or endorsed by the publisher.
Research integrity at Frontiers
Learn more about the work of our research integrity team to safeguard the quality of each article we publish.