 Y.Y. Lv
 H.Y. Yu3
 M. Li
M. Li S.H. Yi
 B.P. Meng
- 1Institute of Fragile Eco-Environment, Nantong University, Nantong, Jiangsu, China
- 2School of Geographic Science, Nantong University, Nantong, Jiangsu, China
- 3Qinghai Service and Guarantee Center of Qilian Mountain National Park, Xining, Qinghai, China
Alpine grassland is one of the most critical grassland types in the world, and it is vulnerable and sensitive to external disturbances. The development and outbreak of locust might result in the irreversible degradation. However, most locust studies have been on the tropical, temperate, and desert areas. Our knowledge of inhabitable areas in alpine grassland still needs to be explored. This study was carried out in the alpine grassland in the Qilian Mountain National Park. Environmental factors (remote sensing vegetation index, meteorology, soil, topography, and grassland types) and their impact on locust density were investigated. Finally, the inhabitable areas of locust in the study area were mapped. The results showed that: (1) six out of 26 factors [including precipitation, solar radiation (average and maximum value), normalized vegetation index (NDVI), soil, and temperature] had great influence on locust density, with a relative contribution (RC) more than 10%. (2) Among all locust density estimation models, those based on average and maximum solar radiation, maximum precipitation, maximum NDVI, average temperature, and clay content in deep soil performed better than others, with R ranging from 0.58 to 0.73 and root mean square error ranging from 21.70 to 25.82 head/m2. (3) The areas most suited for locust growth, development, and frequent outbreak were found in the south of Tianjun County, middle and northwest of Qilian County (account for 27% of the study area), while the inhabitability was weak in south of Gangcha County, northwest of Tianjun County, and most of Delingha City. Thus our study clarified the distribution region and occurrence variation of the locust and provided a scientific basis for locust prevention and control in alpine grassland in the Qilian Mountain National Park.
1. Introduction
Since the beginning of farming and pastoralism, locust outbreaks and plagues have wreak havoc on humans, causing devastation, hunger and even death (Zhang et al., 2019; Peng et al., 2020). Except for Antarctica, all continents have been infected by various locust species, which affected the livelihood of approximately 10% of the world’s population (Klein et al., 2022). More than 10,000 locust species were found in tropical, temperate grassland, and desert locations across the world (Veran et al., 2015). In China, about 200 species were distributed in grassland and 20 of which could cause pasture damage (Hong et al., 2014). Locust harmed the pasture by eating grassland green vegetation. During the solitary phase, locust played an important role in the food chain and grassland nutrient cycling. However, during the gregarious phase, locust cause extensive damage to pasture and constitute a great threat to livestock and other fauna species (Kambulin, 2018). The unusual weather conditions (high temperature, drought) and scarcity of plant food forced locust multiplying and aggregating rapidly (Meynard et al., 2020). Then the locust outbreak was formed, and the devastation is spread by the extremely mobile flying swarms (Kimathi et al., 2020).
Currently, most locust studies are focused on tropical, temperate and desert areas (Li et al., 2022). The alpine grassland, as one of the most important grassland types, was also affected by the locust. However, our knowledge still needed to be improved. The Qinghai-Tibetan Plateau (QTP) encompassed 83% of the earth’s terrain above 4,000 m, and grassland was widely distributed (Miehe et al., 2019). The health of the alpine grassland ecosystem is critical not only for local animal husbandry and water conservation, but also for global climate control, carbon fixation, and biodiversity preservation (Zhang et al., 2020). Nevertheless, alpine grassland was vulnerable and sensitive to external disturbances (Yao et al., 2016). The outbreak of rodents, insects, as well as the snow and drought, were the major natural disasters on the QTP (Wang, 2000). The locust is the major disaster insect in alpine grassland. For example, about 16 × 104 hm2 of grassland suffered from locust plague in Tibetan per year (Hong et al., 2014), and 5,000 km2 in Qinghai province per year (Ni, 2002). The average density of locust reached 150–200 head/m2 in an outbreak year, the highest density even exceeded 1,000 head/m2.
The Qilian Mountain National Park was located in the center of Eurasia at the intersection of the QTP, the Mongolia Plateau and the Loess Plateau, and it was an important ecological shelter zone in western China (Li et al., 2019; Liu et al., 2022). Alpine grassland was the main land use type (90%). Unfortunately, more than 90% of grassland is degraded due to climate changes, human activities and natural disasters. There were ten species of locusts in the Qilian Mountain National Park, the stability of the grassland ecosystem and sustainable economic development of Qilian Mountain was greatly affected and restricted by the locust (Yang et al., 2020).
Early in the 1960s, substantial efforts, time and cost were devoted to locust plague prevention, notably in the development of chemical and biological insecticides (Story and Cox, 2001; Mansour et al., 2015). However, it failed to minimize the harm fundamentally and effectively. Furthermore, the majority of the locust inhabitable area was distributed in coastal areas, along the rivers and lakes. The usage of chemical pesticides in these places might result in major environmental issues such as water pollution, soil pollution, biodiversity reduction, and ecological damage (Chiaia-Hernandez et al., 2017; Maute et al., 2017; Oves et al., 2018). The division of the inhabitable areas might anticipate the species’ presence and outbreak, as well as give data support and a decision foundation for its control (Zhao et al., 2020), but the inhabitable areas of the locust in the Qilian Mountain National Park were still unknown. Therefore, this study aimed to investigate inhabitable areas of the locust and its influencing factors in the Qilian Mountain National Park. We propose a method to improve forecasting, warning, and prevention of locust and provide a scientific basis for damaged grassland management and restoration.
2. Data and methods
2.1. Study area
The study area is located in the Qilian Mountain National Park in Qinghai Province (36.8926°–39.2110°N; 96.1380°–102.6405°E). There are four counties’ (Tianjun, Qilian, Gangcha and Menyuan) and one city (Delingha). Most of the study area (90%) is grassland, which is the most important land use type. Eight types of grassland, including alpine meadow, mountain meadow, lowland meadow, temperate steppe, alpine steppe, alpine desert steppe, temperate desert, and alpine desert are also found in study area (Figure 1). The average annual precipitation is 232.4 mm, increasing from northwest to southeast, and the higher precipitation is distributed in the central and eastern of the study area. The mean annual temperature is 4°C, it is relatively stable with a little inter-annual variation. The temperature contour is consistent with the terrain profile. The average elevation is 4,000 m (Figure 1).
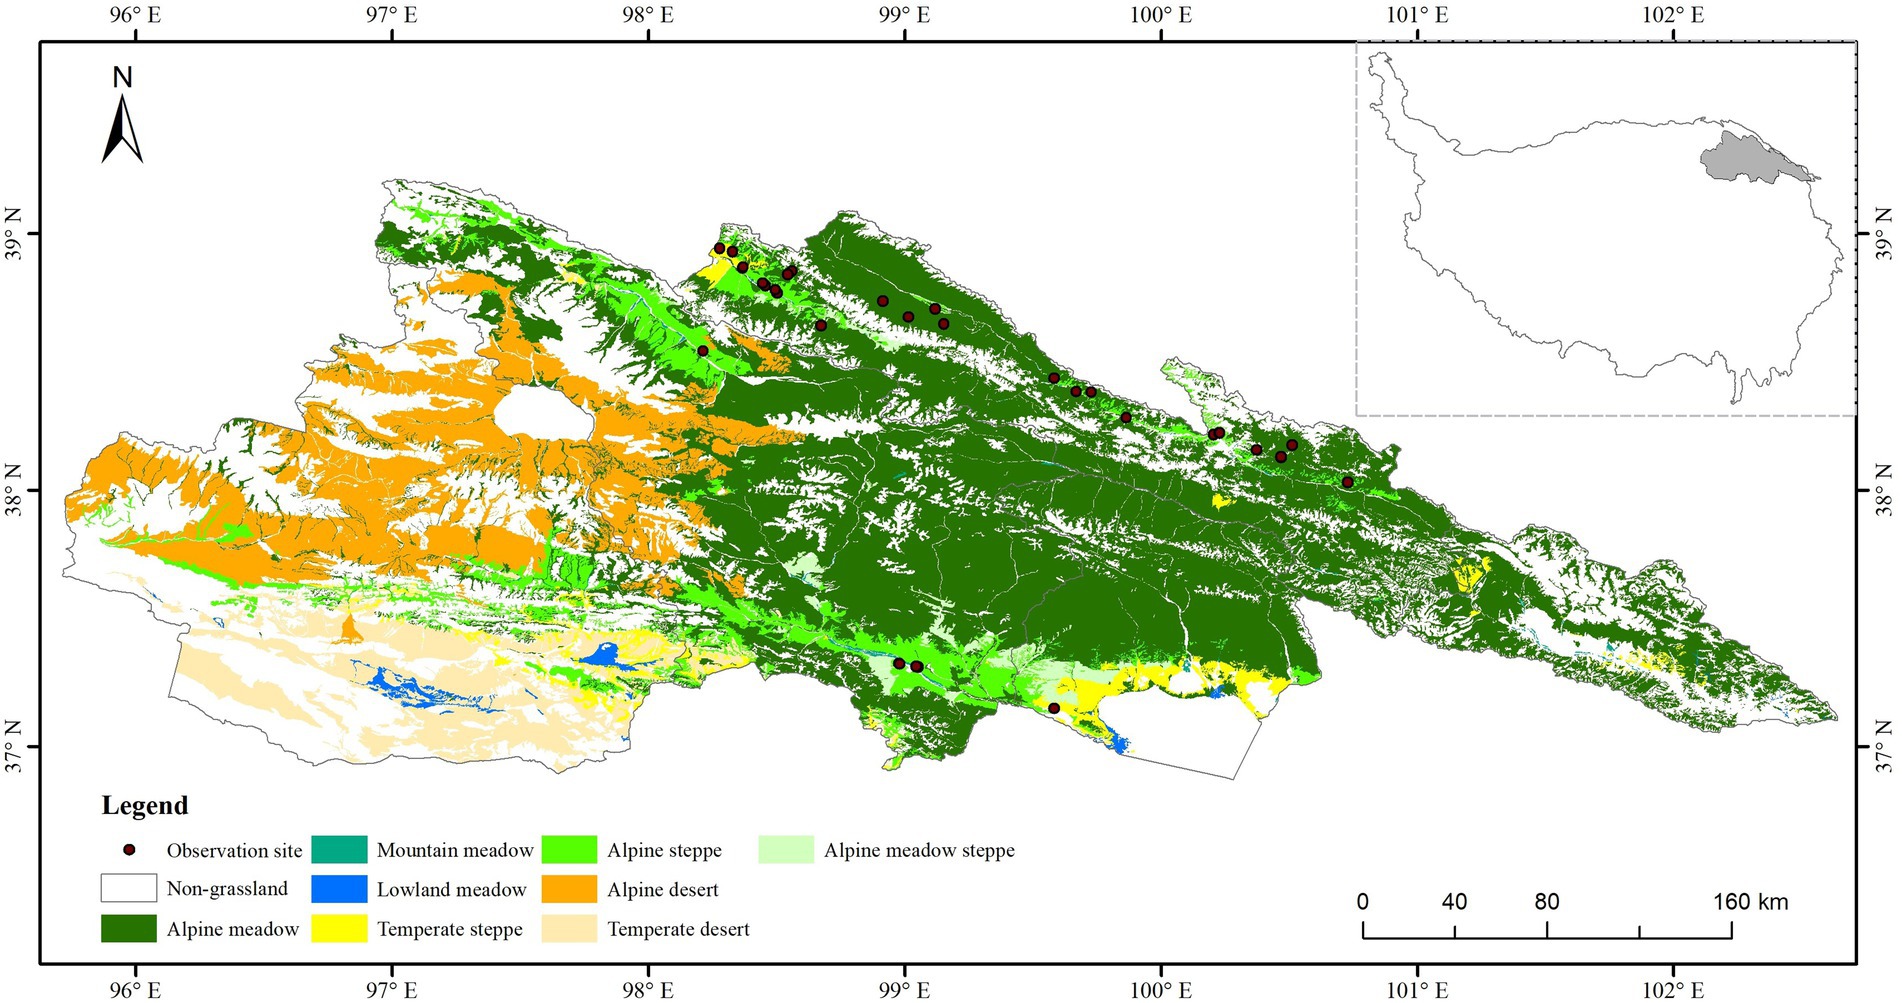
Figure 1. Location and grassland types of study area.
2.2. Field observation
During the grassland growth season (from 2000 to 2021, May to September), 68 sites were conducted to collect the data according to the terrain condition and locust distribution (Figure 1). Field survey sites were selected to ensure a 5 km horizontal distance between every two sites and homogeneity of vegetation and land use. The geographical location of the sites was selected to ensure similar grassland types and geomorphology within a 250 m range around the sites (given that MODIS pixels are 250 × 250 m in size). For ground observation, three to five plots (30 × 30 m) were randomly established in each site. The butterfly net was used to collect the locust in each plot, then the latitude, longitude, elevation, grassland type, species and density of locust were recorded.
2.3. Data preprocess
This study analyzed the environmental factors of remote sensing vegetation index, topography, soil, grassland type and meteorological. The remote sensing vegetation index was derived from MODIS 16d maximum value synthesis vegetation index product MOD13Q1 NDVI, which was downloaded from the United States Geological Survey (USGS; https://e4ftl01.cr.usgs.gov/). The image was selected from May to September during 2000–2021, with a spatial resolution of 250 m (h25v05 and h26v05). The formation and the projection were then transferred and reprocessed using the ArcGIS Raster Calculator tool. The maximum (NDVImax), minimum (NDVImin), medium (NDVImedi), mean (NDVImean), range (NDVIrange), standard deviation (NDVIstd), sum (NDVIsum), and other characteristic variables of MODIS NDVI vegetation index were calculated during the annual growing season (May–September) from 2010 to 2021.
Digital elevation model (DEM), slope, aspect, and topographic position index (TPI) are the main topography variables. DEM data were obtained by shuttle radar topography mission images (version V004), with 90 m resolution and Geo_TIFF format. The slope, aspect and TPI were calculated based on DEM in ArcMap 10.2 software. The soil data mainly include soil type, sand and clay content in surface and depth soil (Sand1, Sand2; Clay1, Clay2). The soil type data were downloaded from the vectorized data set 1:1,000,000 Soil Map of the People’s Republic of China compiled and published by the National Soil Census Office in 1995 (https://www.resdc.cn/ data.aspx?DATAID = 145). Soil clay and sand content data downloaded from the north-west ecological environment resources, Chinese Academy of Sciences institute of cold and arid regions of the science data center.1 The meteorological data were obtained from the national meteorological information center, the data mainly included the temperature, precipitation and solar radiation from 2010 to 2021 with a spatial resolution of 5 km. Maximum, minimum, mean and sum values of temperature (TEMmax, TEMmin, TEMmean, TEMsum), precipitation (PREmax, PREmin, PREmean, and PREsum) and solar radiation (SRAmax, SRAmin, SRAmean, and SRAsum) in the growing season (May–September) from 2011 to 2021 were calculated using ArcGIS Raster Calculator. The grassland types were obtained from the 1:1 Million Atlas of Grassland Resources in China (1 Million China Grassland Resource Map Compilation Committee, 1993).
The above data were uniformly transformed into Albers in ArcGIS software, and resampled into raster images with a resolution of 250 m (each raster data has the same number of rows and columns) so as to be used as input in the later construction and prediction of locust density.
2.4. Environmental factors selection
Because the boosted regression tree (BRT) analysis cannot eliminate the autocorrelation between the environmental factors, the combination of Pearson coefficient and BRT analysis were used to reduce the influence of the autocorrelation and information redundancy among the environmental factors. The Pearson coefficients, calculated using R package “rcorr,” were used to screen factors first, and only one factor is retained if |r| > 0.7 between two factors. Then the boosted regression tree analysis (Mansiaux and Carrat, 2014; Hou et al., 2020), created using R packages “gbm” (Hijmans et al., 2017) and “dismo” (Elith et al., 2008) were used to examine the relationship between potential predictors and environmental factors. And the relative contribution (RC) percentage was used to assess the relevance of each factor in BRT models. This metric measured how often the predictor was selected for partitioning, weighted by the squared model improvement resulting from successive partitions (Norazrin and Hazrul, 2023). Finally, the factors cumulative RC greater than 85% were retained for further analysis.
2.5. Locust density estimation models
The polynomial model was used to build the locust density estimation models in this study. The locust density in each sample plot and corresponding environmental factors (selected by autocorrelation and BRT analysis) acted as the dependent and independent variables. The polynomial models were employed for calculating their correlations with locust density in this study. The leave-one-out cross validation (LOOCV) method, root mean square error (RMSE) and R were used to evaluate the accuracy of each estimation model. RMSE and R were calculated as follows:
where, represent the i-th observation locust density, represent the i-th locust density estimated by model, and represent the average value of observation and prediction locust density, represent number of plot, n was the number of modeling and validation repetition.
2.6. Inhabitable index for each factor
The threshold of inhabitable index for each environmental factor was calculated by density estimation models and the standard of locust prevention and treatment measures of Qinghai province (Table 1). In this study, each environmental factor was divided into five classes. The classes from 1 to 5 represented the degree of inhabitation, e.g., when the inhabitable index was one, it meant that the areas had the main conditions for locust growth and development and was a potential locust plague area. While inhabitable index five represented it was very inhabitable for locust growth and development, and locust plague often occurred in this region.
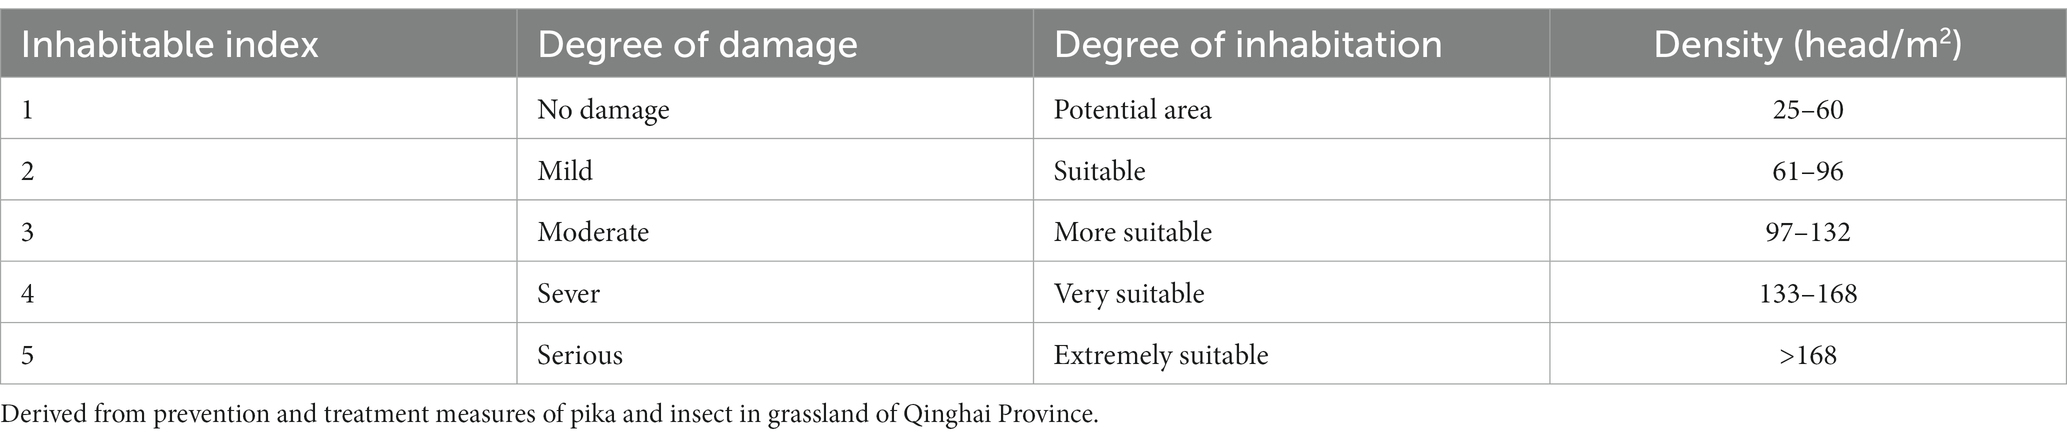
Table 1. Inhabitable index of locust.
According to the inhabitable index of each environmental factor, the inhabitable area was calculated with function three.
Where, IH(x, y) represents the pixel inhabitable index with coordinate (x, y); n represents the number of environmental factors; Ei (x, y) represent the pixel value of i-th factor in coordinate (x, y); Wi represents the weight of i-th factor, which calculated by BRT algorithm in Section 2.4.1. Here i = 1, 2, 3, …n.
Finally, the inhabitable areas were represented by the reclassification result of IH, the classification standard was shown in Table 2.
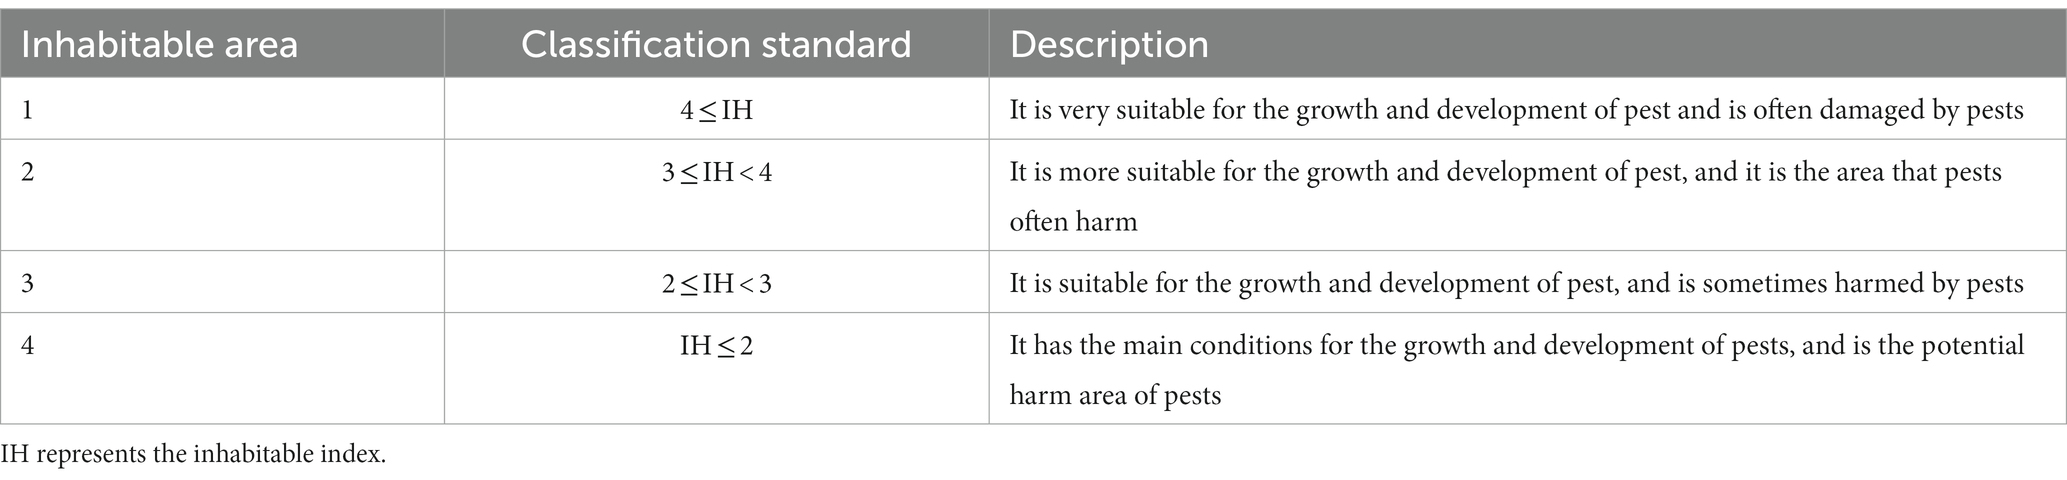
Table 2. Inhabitable areas of locust.
3. Results
3.1. The main environmental factors that influence locust
The auto-correlation between each environmental factor showed that 11 out of 26 environmental factors showed a Pearson relationship between any two factors that was less than 0.7. The NDVImax, NDVImin, PREmax, SRAave, SRAmax, Grassland type, Clay1, Clay2, Sand1, and soil type were among the main criteria (Figure 2). Those factors were selected for further analysis. The factors with Pearson coefficient higher than 0.7 were shown in (Supplementary Figures S1–S3), and those factors were abandoned.
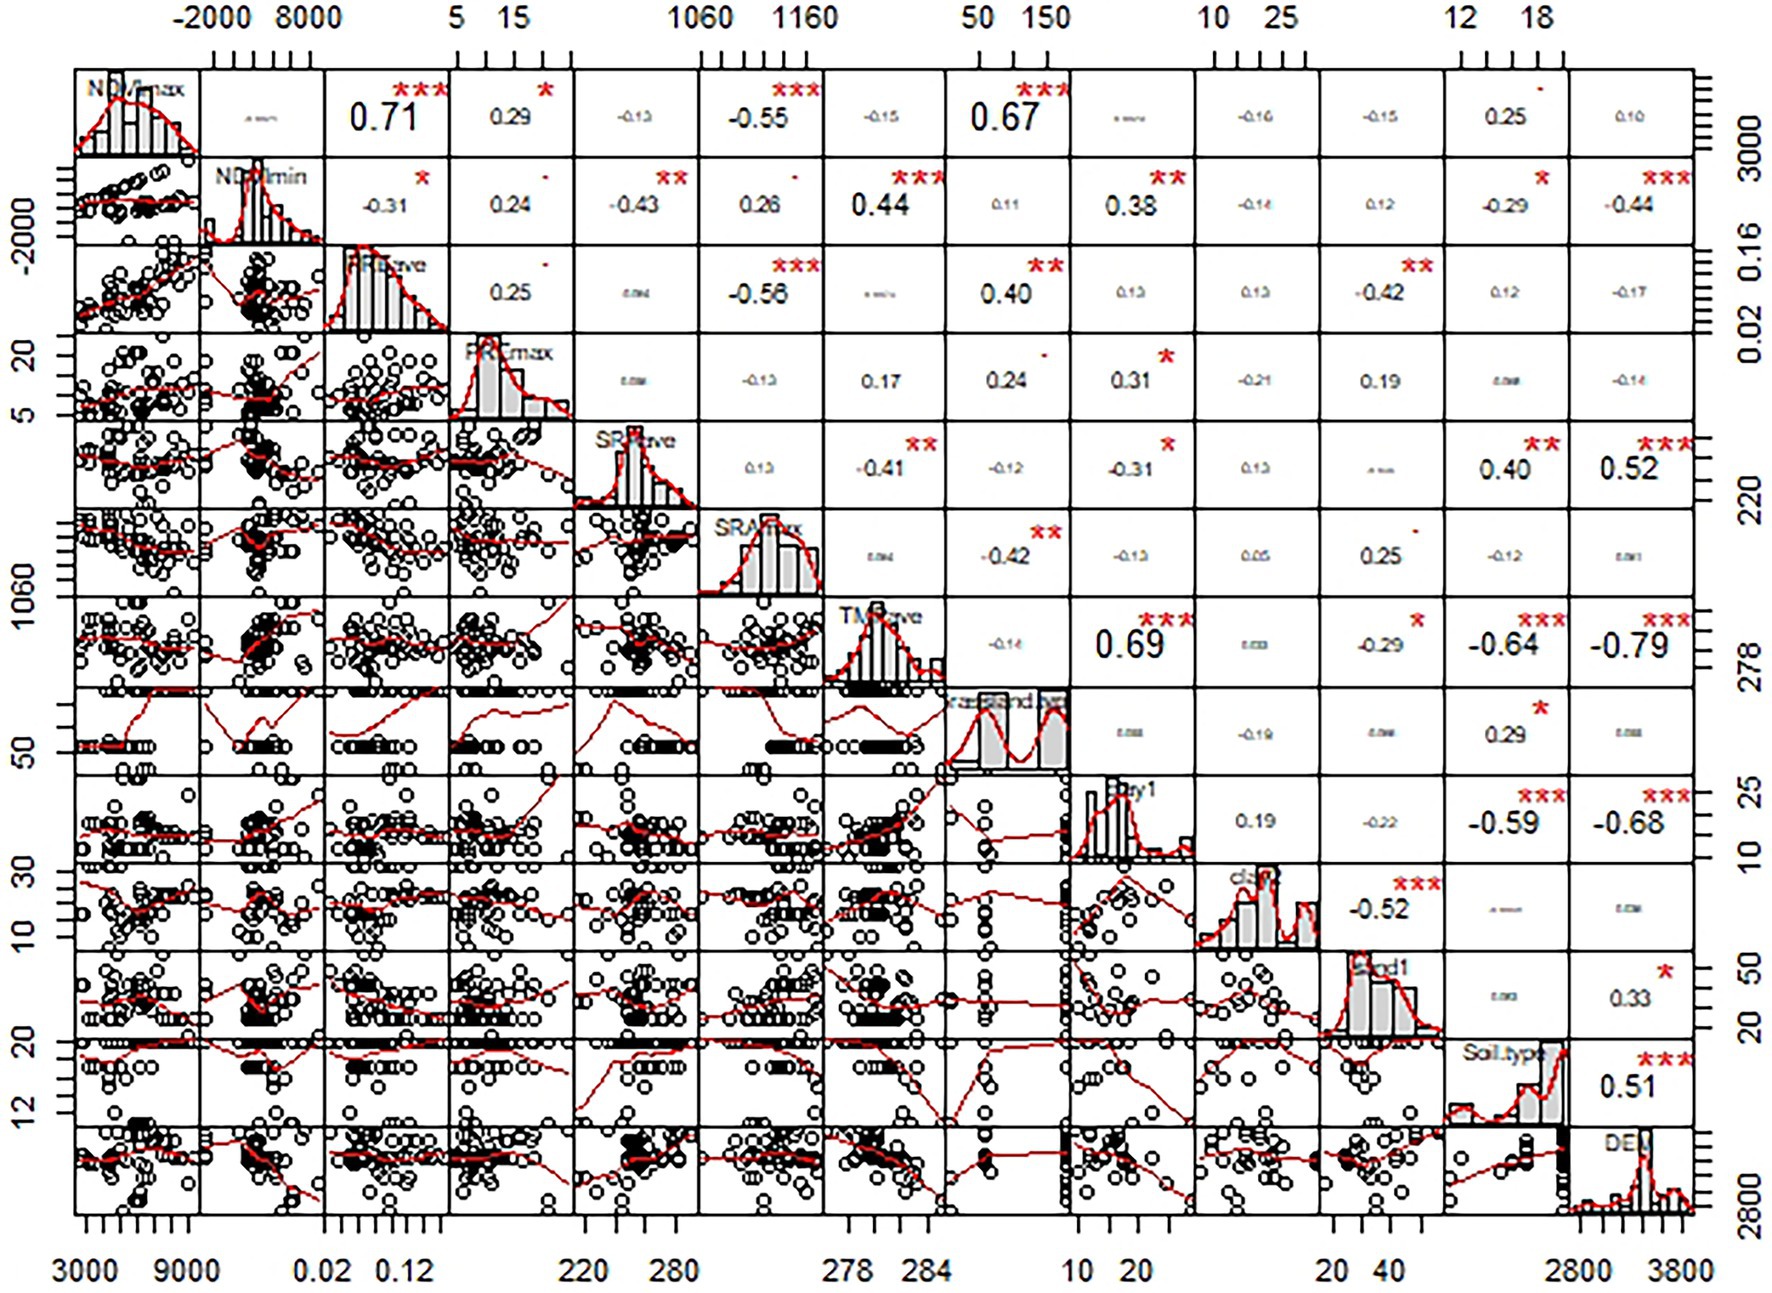
Figure 2. The correlation of Pearson coefficient among factors. NDVImax, NDVImin, PREave, PREmax, SARave, SRAmax, TMPave, Clay1, Clay2, Sand1, and DEM refers to the maximum normalized difference vegetation index, the minimum normalized difference vegetation index, the average precipitation, the maximum precipitation, the average solar radiation, the maximum solar radiation, the average temperature, the clay concentration of surface soil, the clay concentration of bottom soil, the sand concentration of surface soil, and digital elevation model, respectively. *denotes p < 0.05, **denotes p < 0.01; ***denotes p < 0.001.
The relative contributions of 11 environmental factors calculated using the BRT method was shown in Figure 3. With a comparative contribution of 22.60%, the PREmax had the greatest impact on locust growth and outbreak. The relative contribution values for SRAave, NDVImax, Clay2, SRAmax, and TMPave varied from 11.10 to 15.90%. With a proportional contribution of less than 10%, the NDVImin, Sand1, Soil, Clay1, and Grassland had a smaller effect on locust density. The grassland type had the least impact, with a relative contribution of 0.2%. The accumulative relative impact of the first six components surpassed 85% (88.80%) of all studied factors. As a result, those characteristics were chosen for further locust density model estimation.
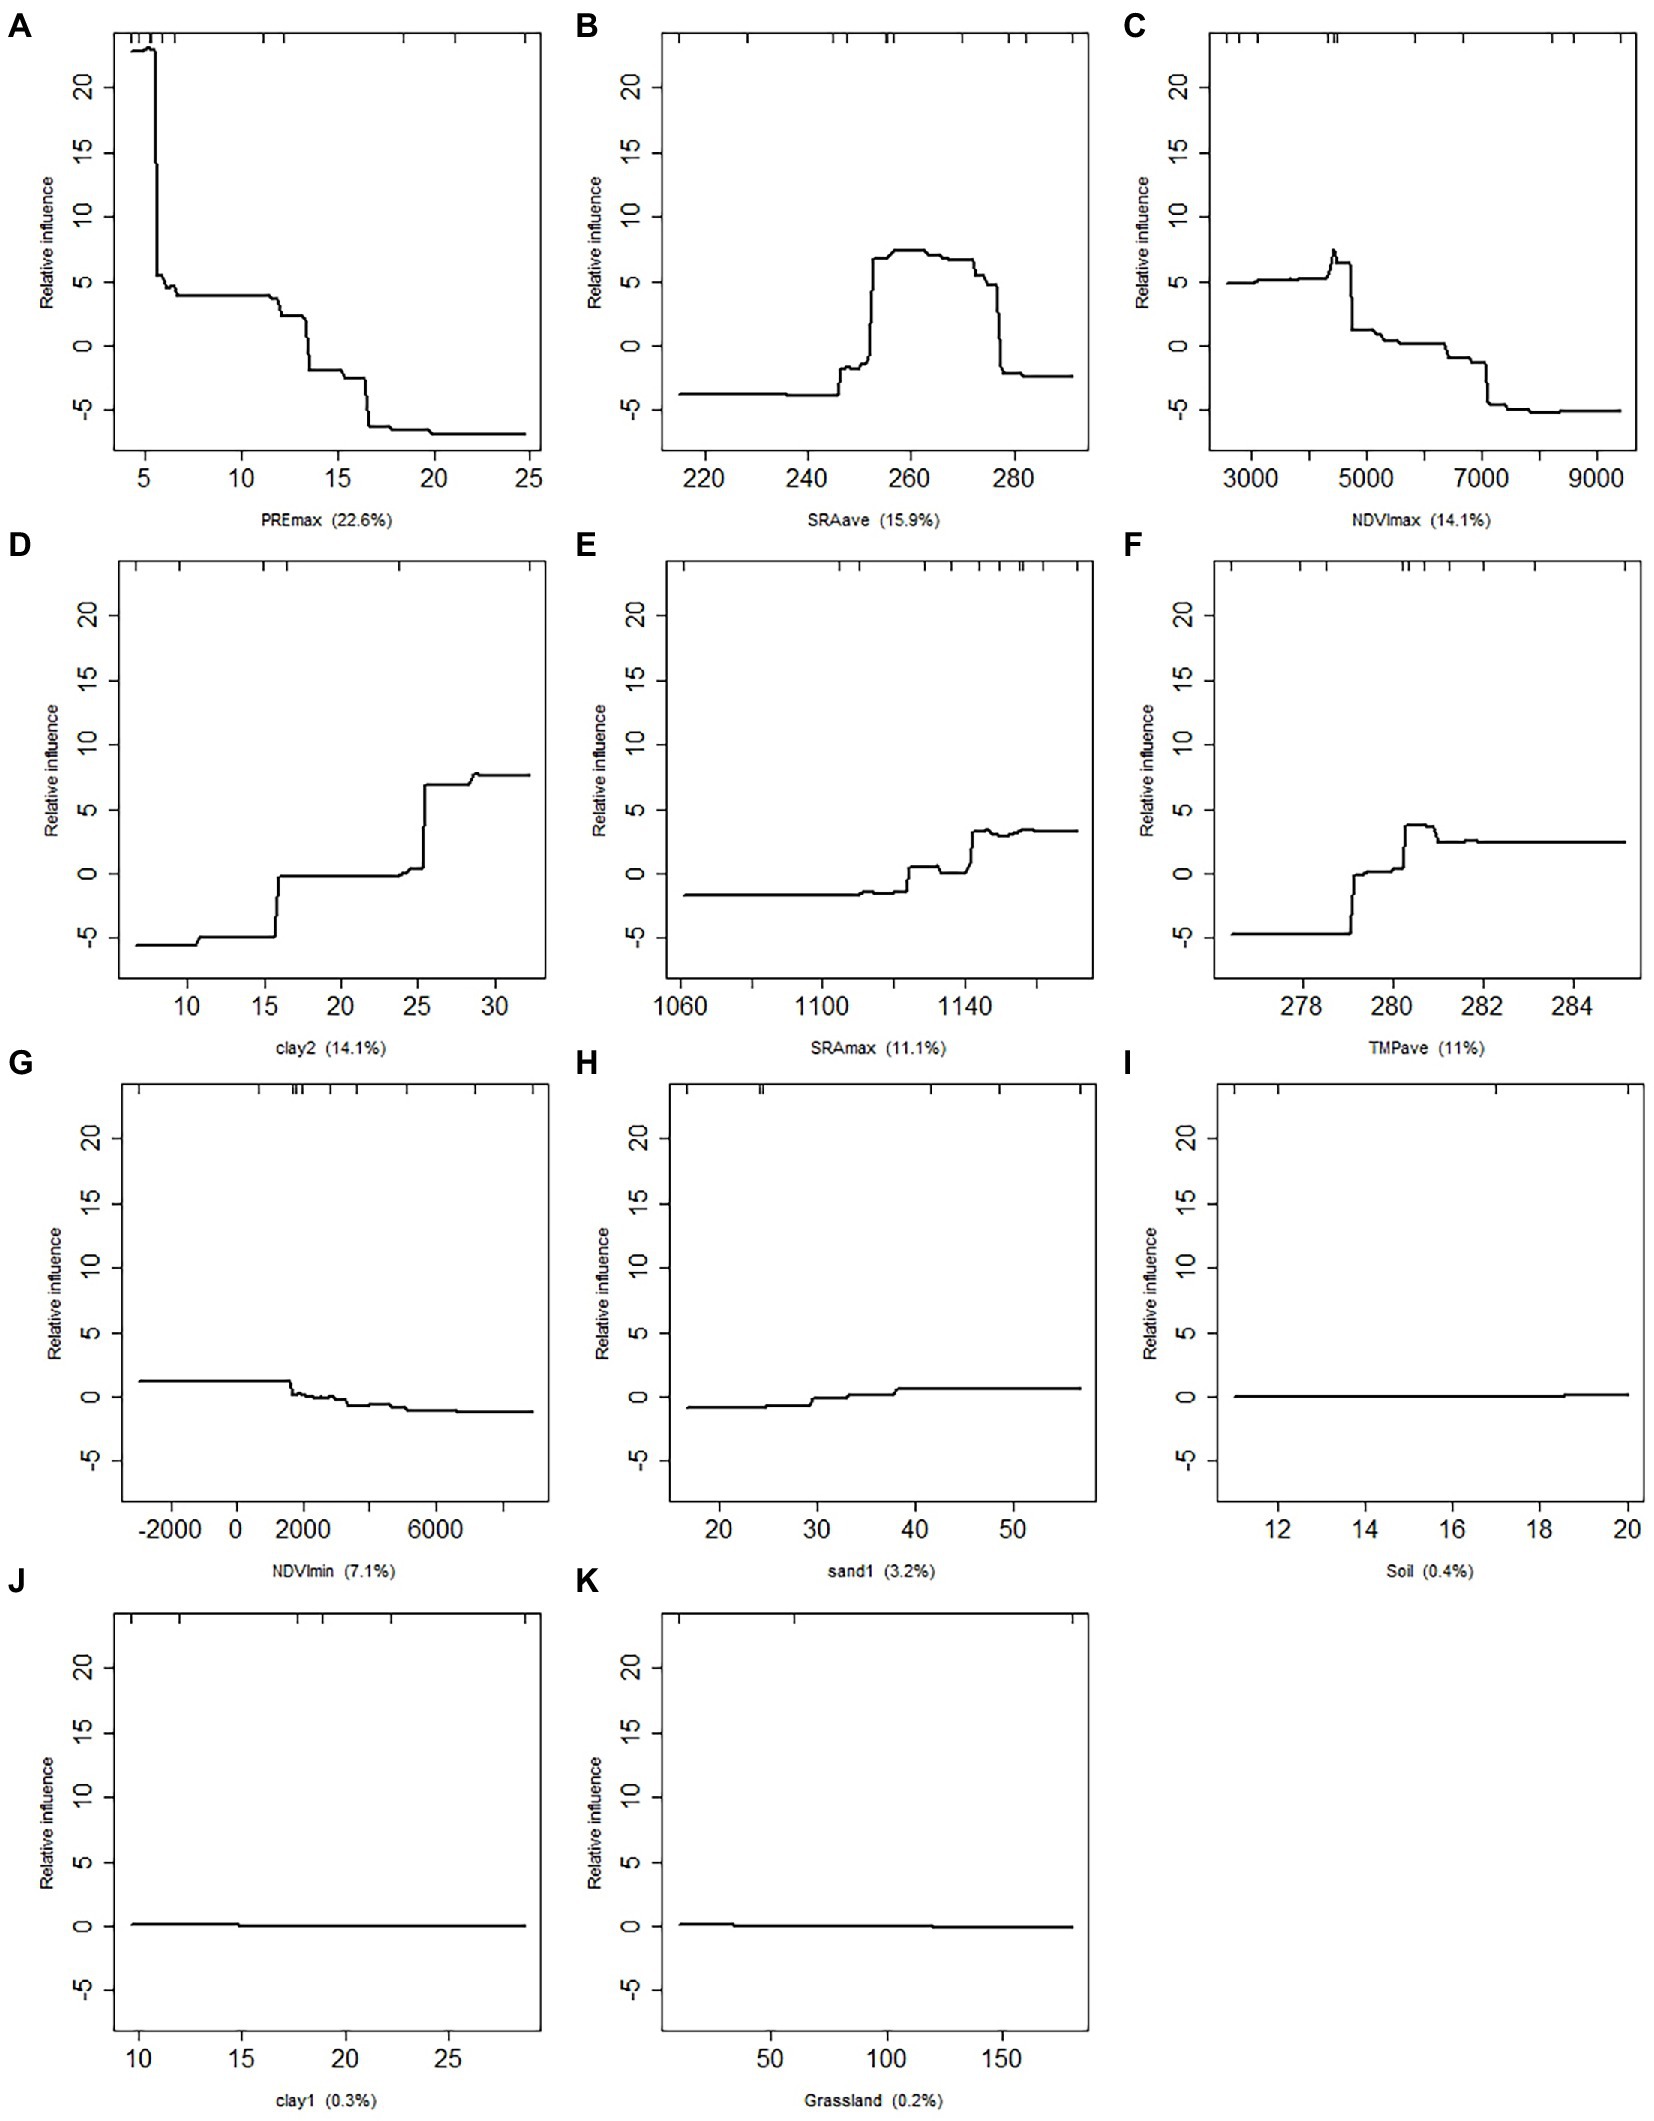
Figure 3. The relative contribution of the environment variables. (A-K) refers to the maximum precipitation (PREmax), average solar radiation (SRAave), maximum NDVI (NDVImax), clay concentration of bottom soil (Clay2), maximum solar radiation (SRAmax), average temperature (TEMave), minimum NDVI (NDVImin), sand con-centration of surface soil (Sand1), soil type (Soil), clay concentration of bottom soil (Clay1), and grassland type (Grassland), respectively. X is the value of each environmental variables.
3.2. Locust density estimation models
The evaluation of locust density estimation models based on LOOCV method and polynomial models were shown in Figure 4. Among all environmental factors, the model based on SRAave had the best accuracy, with R reaching 0.73 and RMSE reaching 21.70 head/m2. Following that are models based on PREmax, TMPave, Clay2, SRAmax, and NDVImax, with R ranged from 0.58 to 0.71 and RMSE ranged from 22.23 to 25.82 head/m2. However, the models based on NDVImin, Sand1, soil type, Clay1, and grassland type had low accuracy, with R ranged from −0.10 to 0.25, and RMSE ranged from 31.52 to 34.95 head/m2.
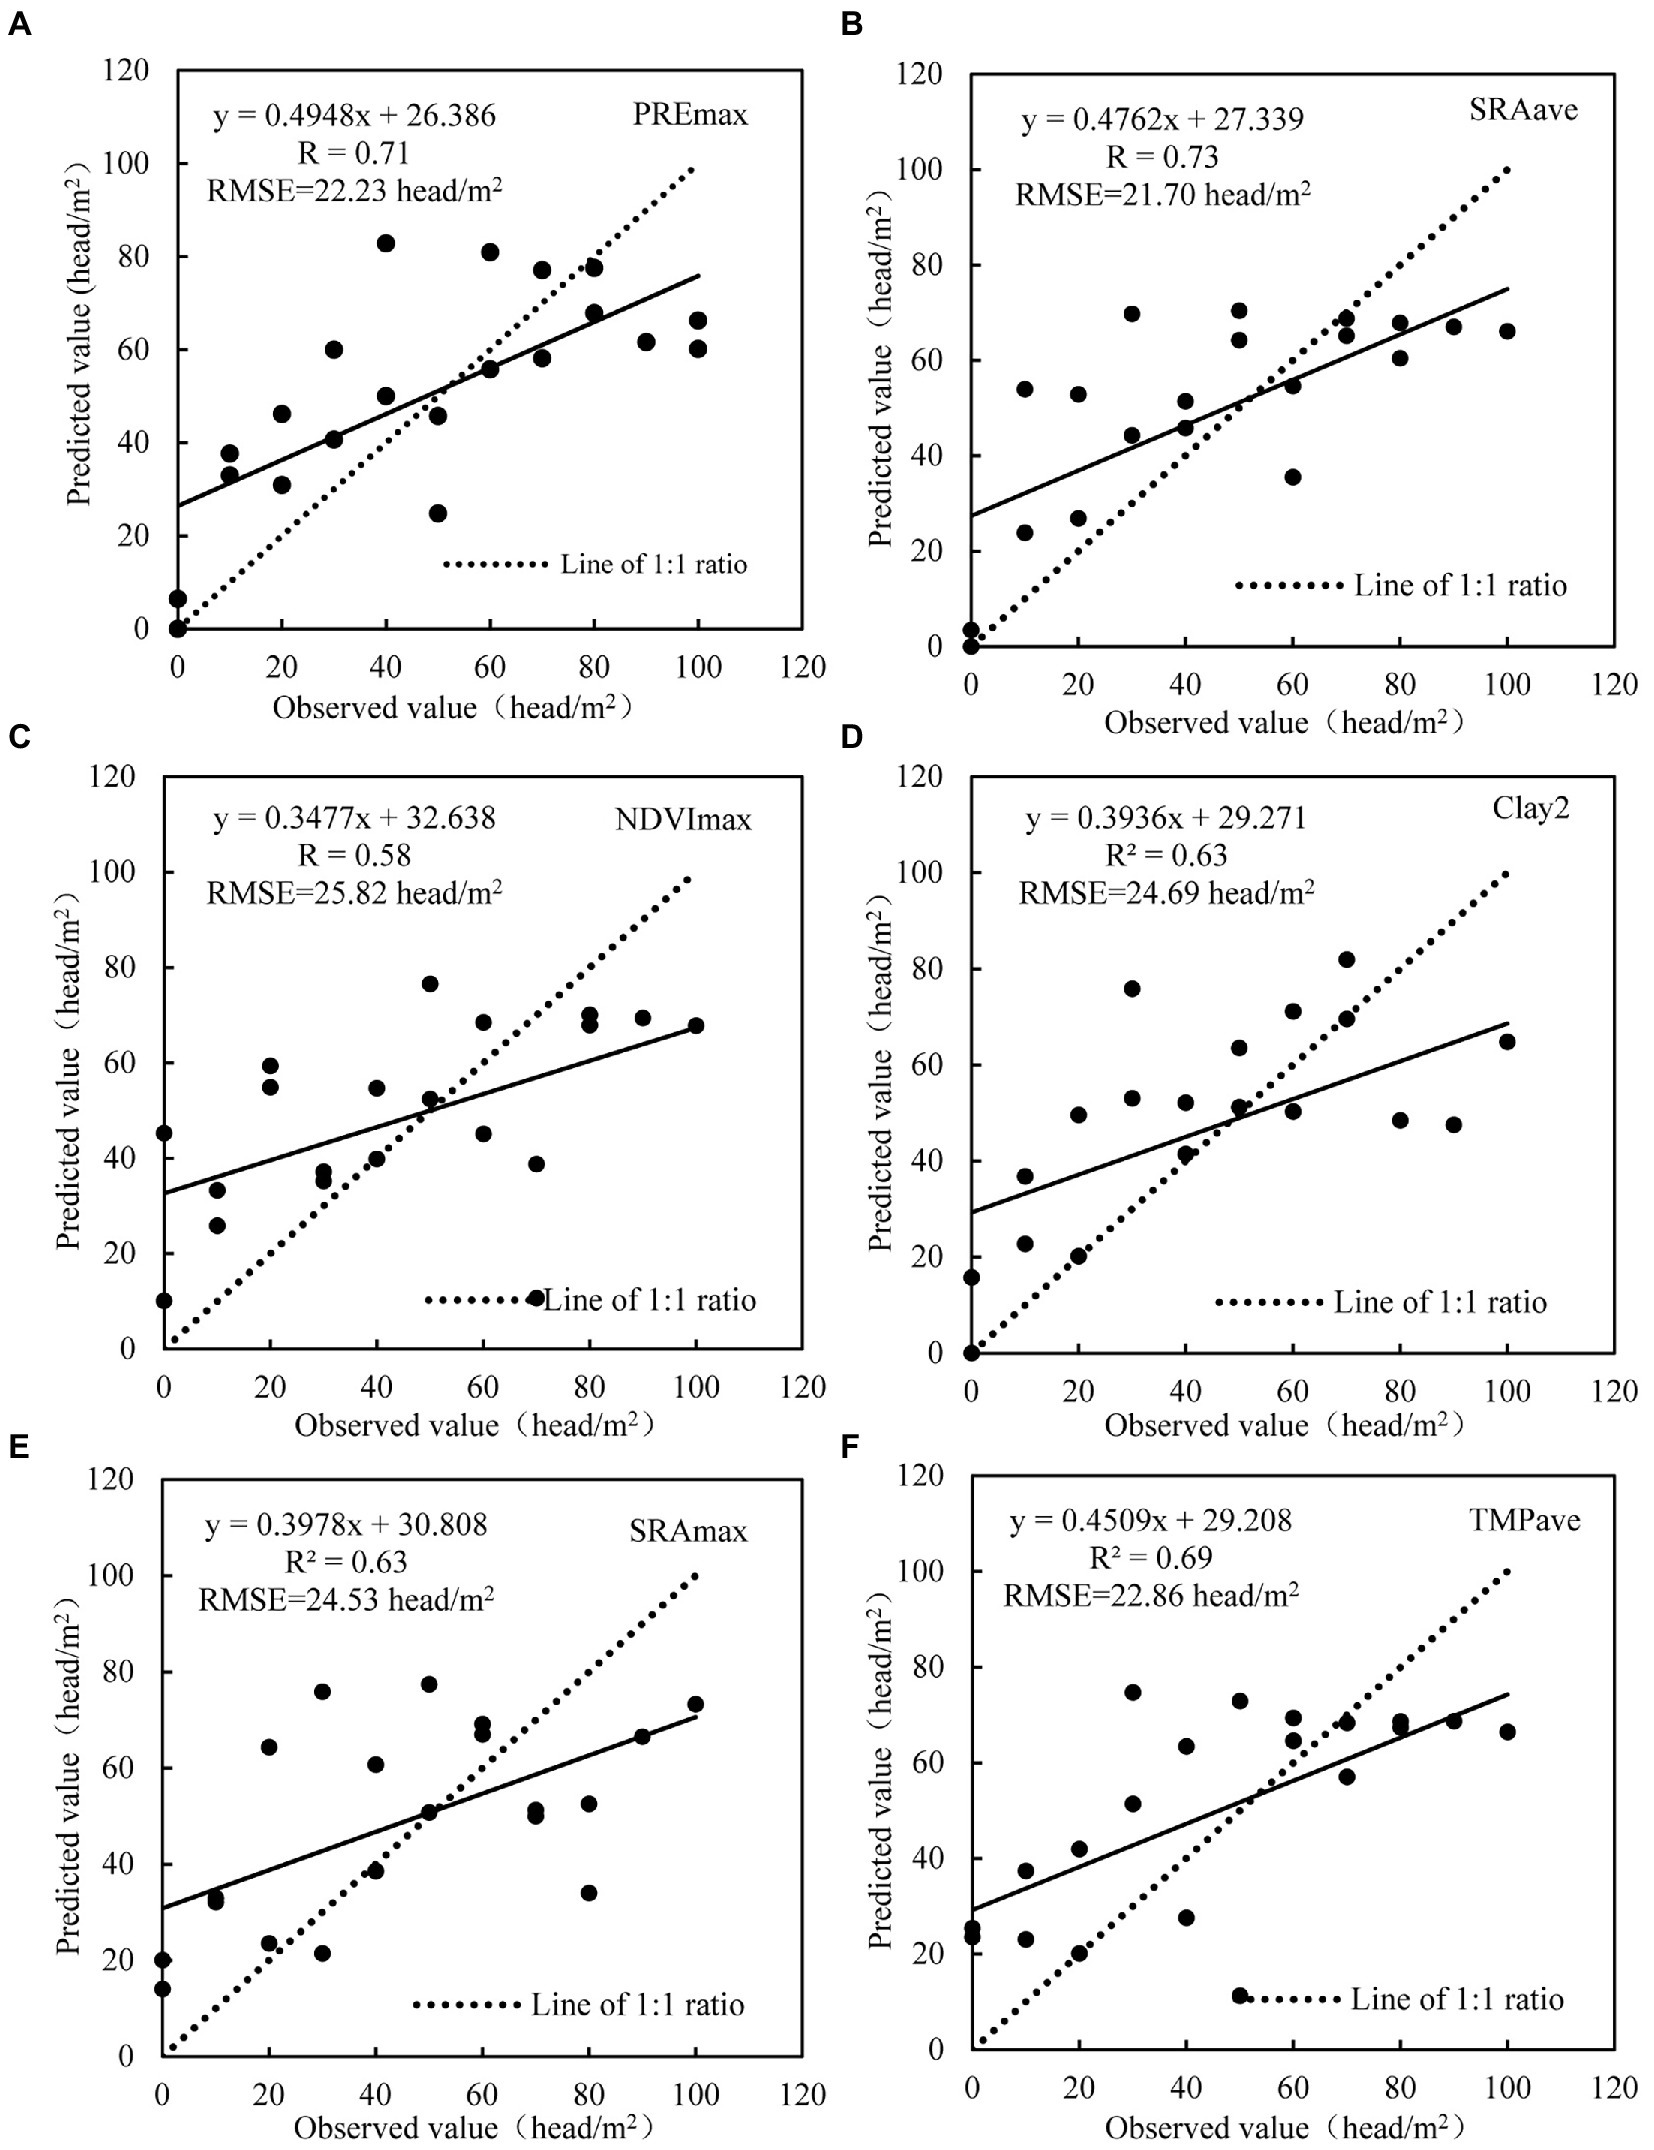
Figure 4. The relationship between the observation value and predicted value. (A-F) refers to the maximum precipitation (PREmax), average solar radiation (SRAave), maximum NDVI (NDVImax), clay concentration of bottom soil (Clay2), maximum solar radiation (SRAmax), and average temperature (TEMave), respectively.
The parameters of the optimum estimation model for the six factors listed above were shown in Table 3. At a significance level of 0.05, all six models passed the T-test and F-test. The models based on PREmax and TMPave performed the best, with R2 of 0.568 (highest). Followed by the SRAave, SRAmax, Clay2, and NDVImax, the R2 of those models were ranged from 0.367 to 0.479. The formulas of six models were shown in Table 4.
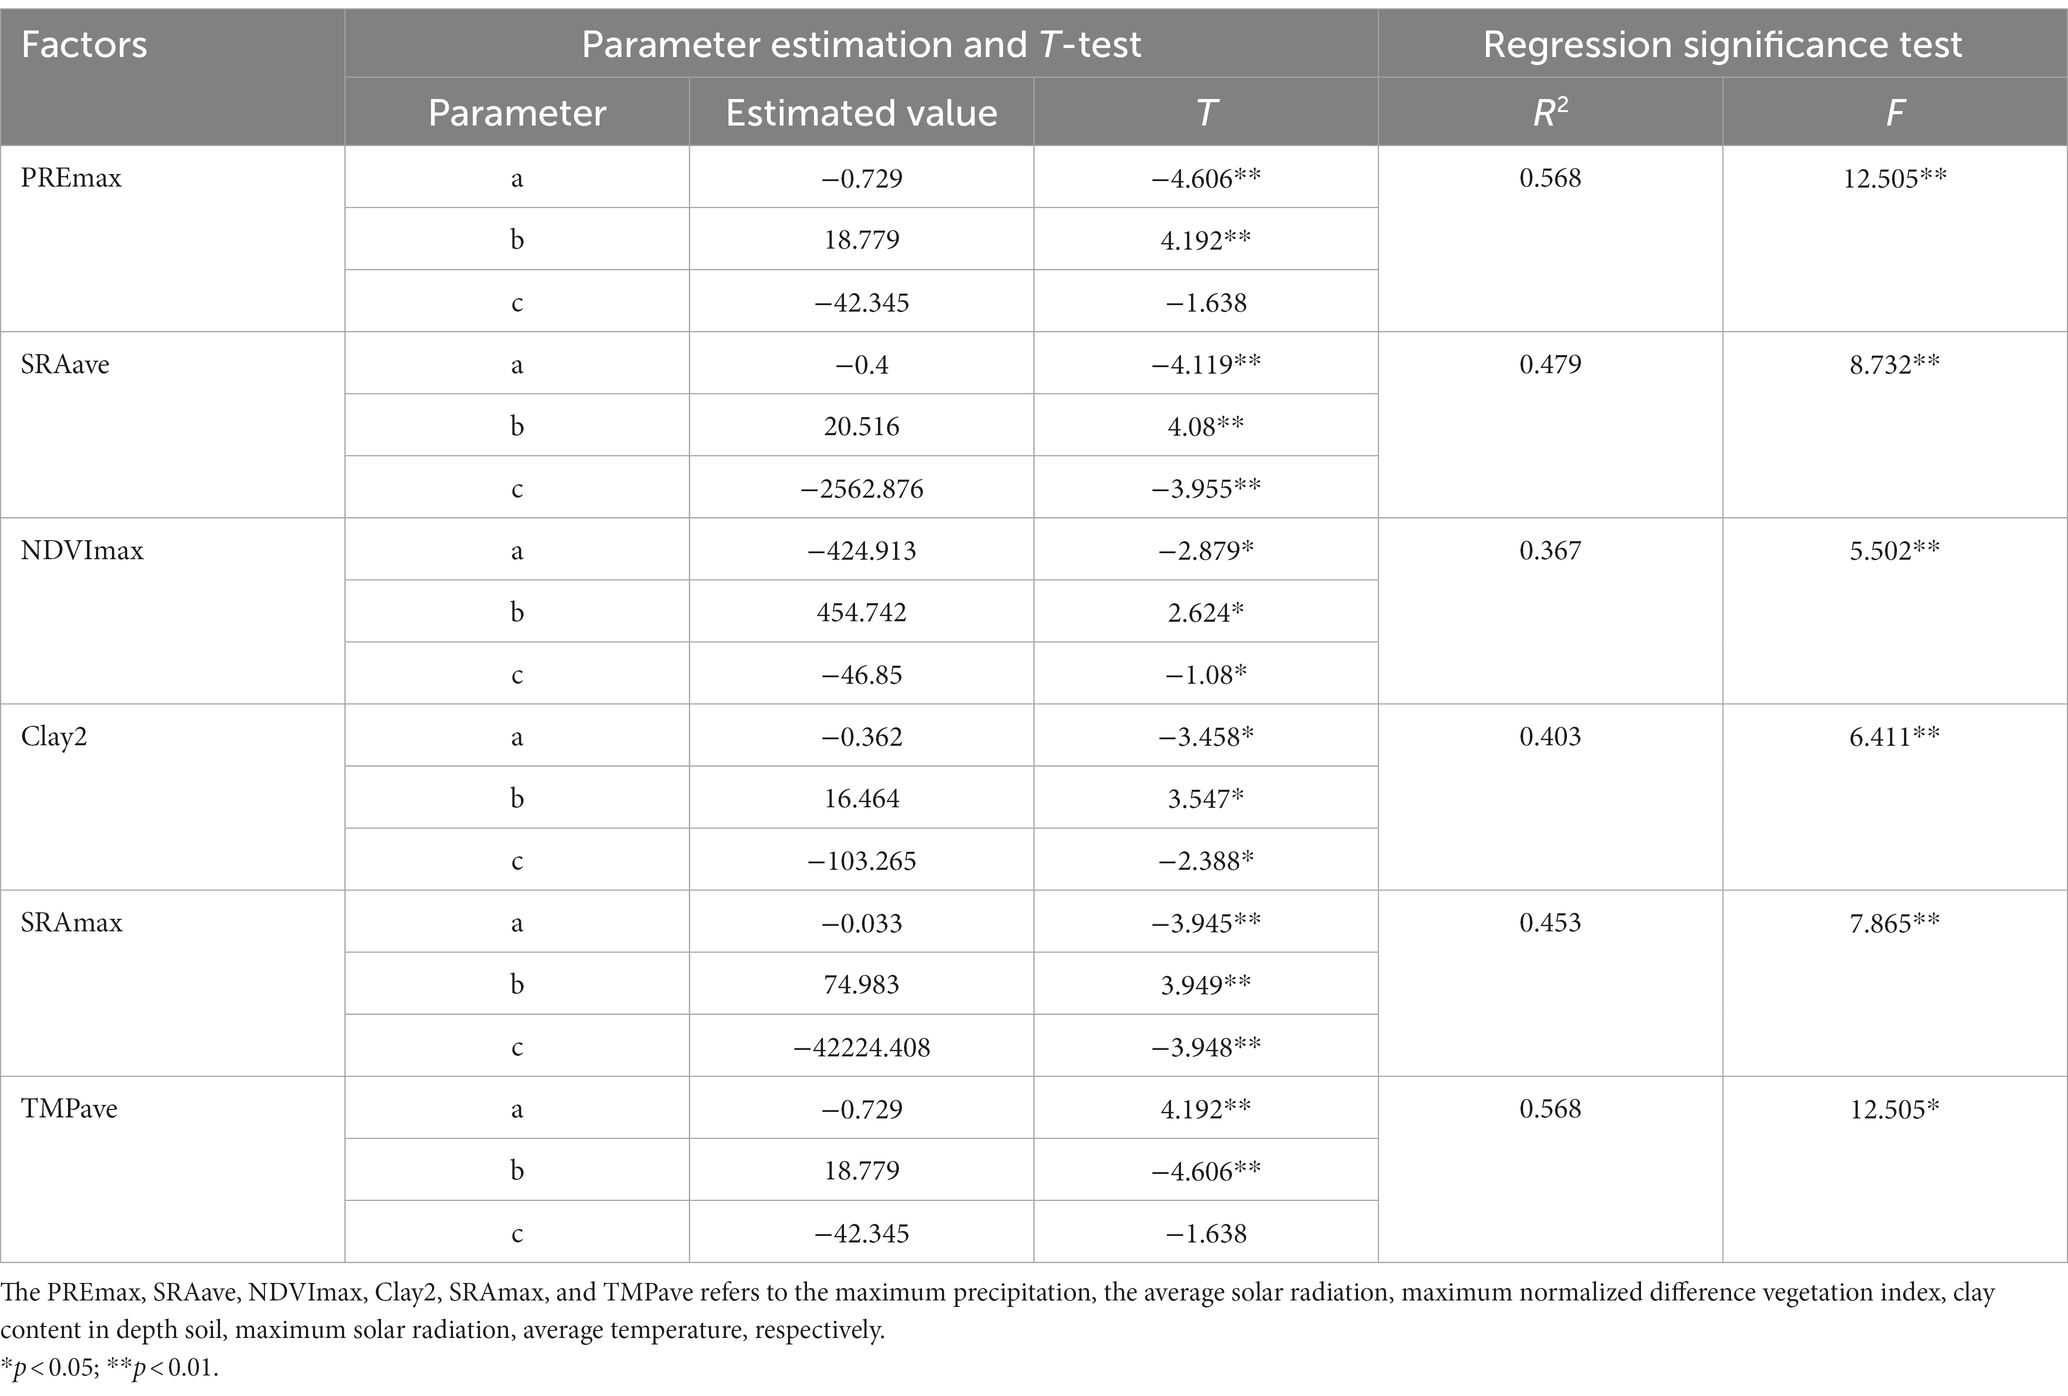
Table 3. Results of models fitting with the optimum estimation models.

Table 4. Fitted models constructed based on PREmax, SRAave, NDVImax, Clay2, SRAmax, and TMPave.
3.3. Distribution of the inhabitable indices
The distribution of IH for each variable was mapped using estimation models based on chosen factors (Figure 4) and the IH division rule (Table 1). The IH of the PREmax, SRAave, and Clay2 revealed a similar tendency, with the IH value of three distributed in central and northwest of the study area (with the proportion of 96, 40, and 67%, respectively). The NDVImax has an IH values of 2 and 3, with the IH value 2 distributed in the northeast (32%), and the IH value of 3 distributed in the northwest of the study area (65%). The TMPave has IH value of 1, 2, and 3, and were mostly distributed in the central and northeast of the study area. There was no IH value of 4 found in the above environment factors. The SRAmax had the most of the area distributed with the IH 4 (73%), which were mainly located in the northeast and southeast of the study area. The IH 3 were primarily distributed in the northwest of the study and accounted for 26% (Figure 5).
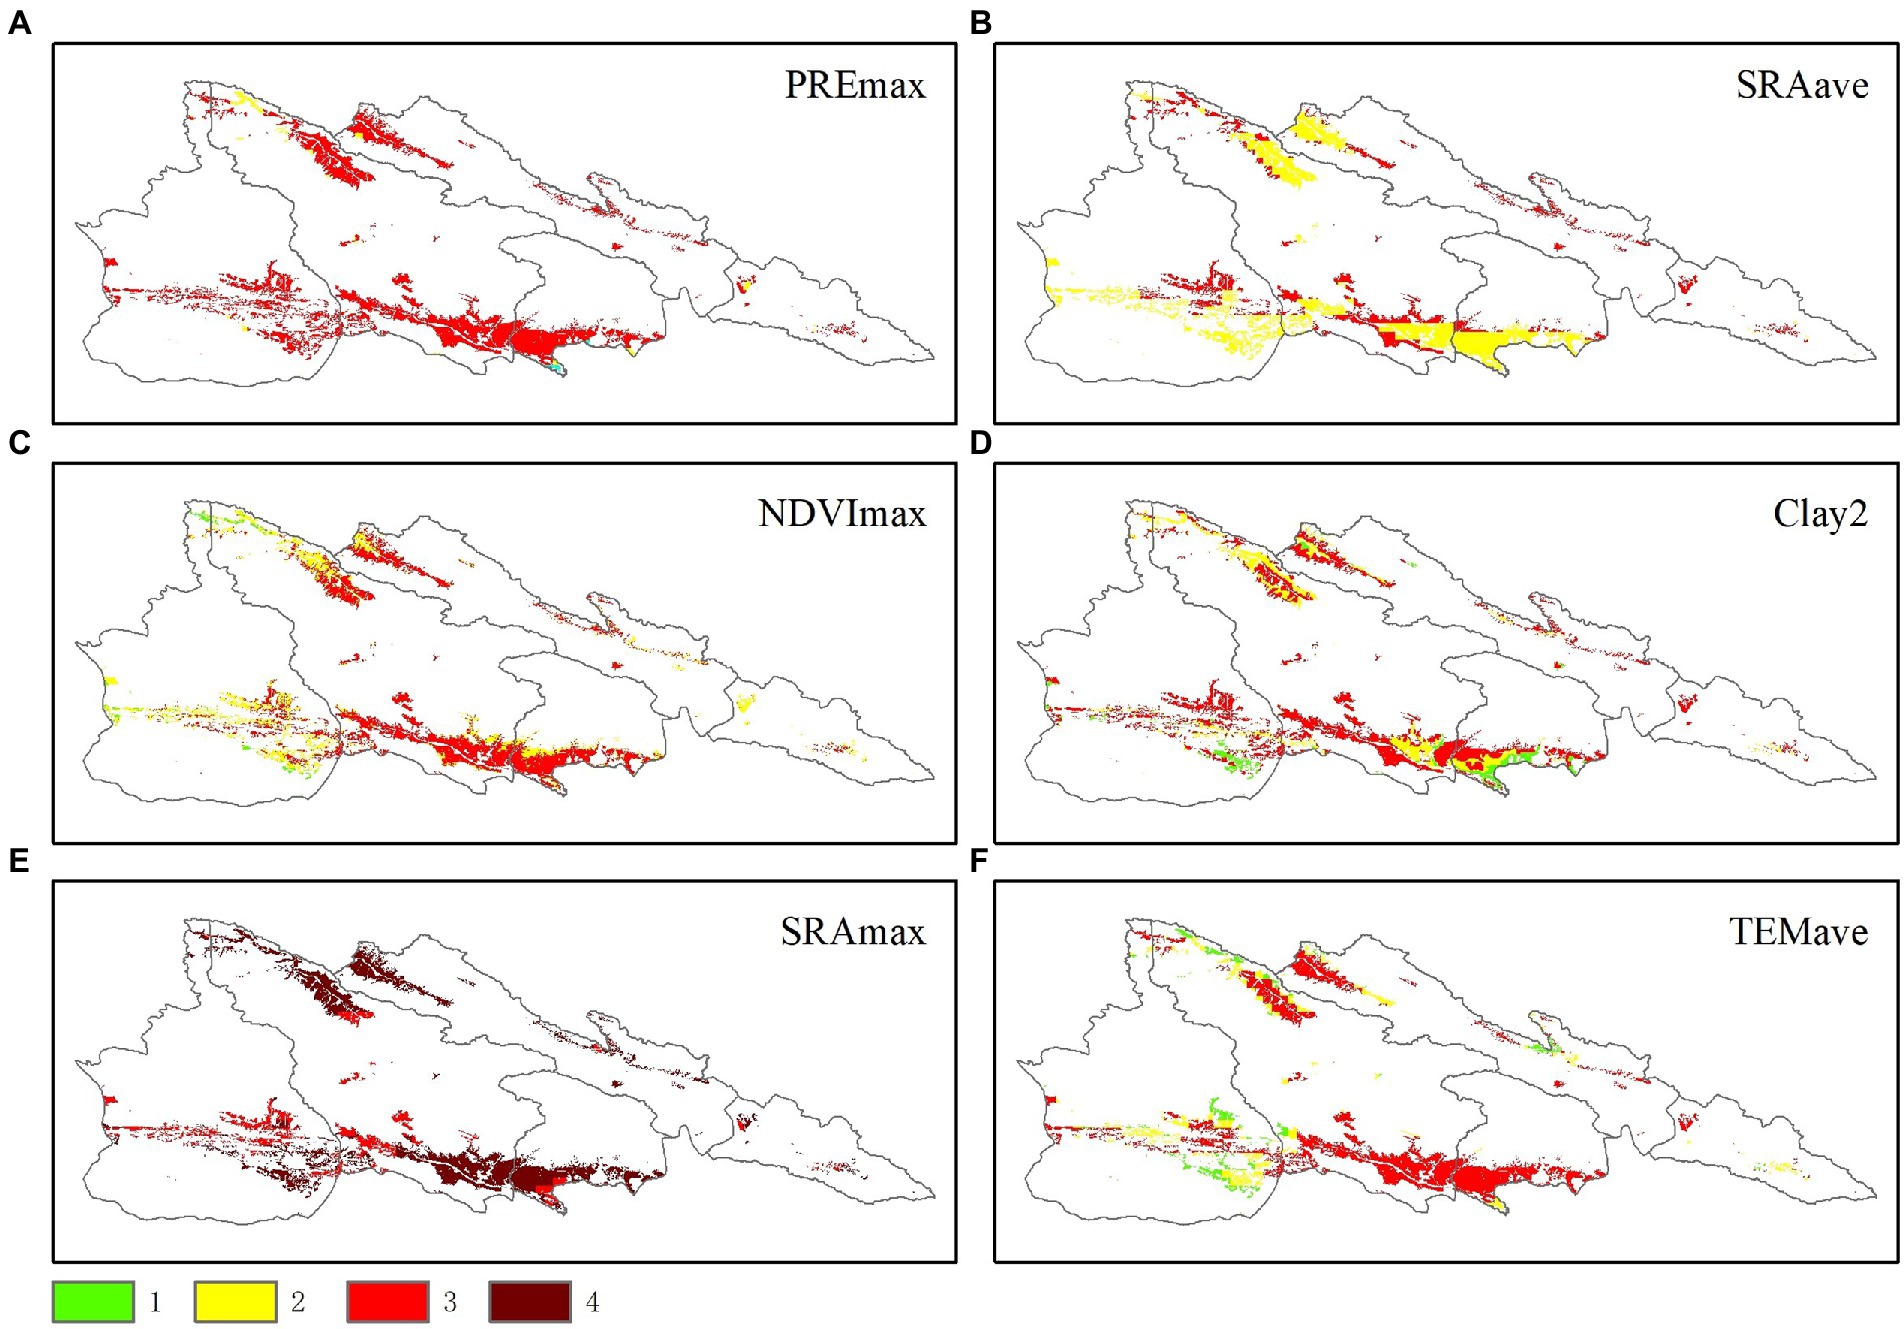
Figure 5. Ranking and distribution of the inhabitable indices. The IH of 1, 2, 3, and 4 represent the degree of damage ranged from no damage, mild, moderate, severe, respectively, and the degree of inhabitation are potential area, suitable, more suitable, and very suitable respectively; the density are 25–60 head/m2, 61–96 head/m2, 97–132 head/m2, 133–168 head/m2, respectively, (A-F) refers to the maximum precipitation (PREmax), average solar radiation (SRAave), maximum NDVI (NDVImax), clay concentration of bottom soil (Clay2), maximum solar radiation (SRAmax), and average temperature (TEMave), respectively.
3.4. Distribution of inhabitable area
The inhabitable area distribution was shown in Figure 6. The inhabitable areas two were mostly distributed in the south of Tianjun County, middle and northwest of Qilian County, accounting for 27% of the study area. The inhabitable areas four were mostly found to south of Gangcha County, northwest of Tianjun County, and most of Delingha City, account for 20% of the study area. The inhabitable areas three were scattered between inhabitable areas two and inhabitable areas four, with the area of 53% of the study area.

Figure 6. The distribution of the inhabitable area. The inhabitable are two means it is more suitable for the growth and development of pest, and it is the area that pests often harm; The inhabitable are three means it is suitable for the growth and development of pest, and is sometimes harmed by pests; The inhabitable are four means it has the main conditions for the growth and development of pests, and is the potential harm area of pests.
4. Discussion
4.1. Distribution and main influence factors of locust
Ground-based surveillance demanded great manpower of trained researchers to examine vast recession areas (Huis et al., 2007). Millions of hectares had to be investigated within a narrow time window of only a few weeks. Therefore, up-to-date habitat suitability maps with high spatial resolution and detail could improve efficiency and focused on inhabitable breeding areas (Sivanpillai et al., 2006; Cressman, 2013). The inhabitable area was identified in this study, as shown in Figure 6. The inhabitable area 2, which was the area suitable for locust growth and development, was mainly distributed in the northeast of the study area, and accounted for 27% of the study area. These areas should invest more manpower and material resources in prevention and control. Our study showed that the majority of the Qilian Mountain National Park belonged to the inhabitable area 3 (53%), those areas were usually ignored but they had potential to form disaster. Therefore, those areas should be dynamically monitored and given additional attention.
Six environmental parameters were shown to have a significant impact on locust density in this study. The PREmax has a 22.60% relative contribution for the locust density (Figure 3). Veran et al. (2015) found that rainfall best explained the spatial variability in outbreak probability across eastern Australia. Outbreaks were more likely to occur in temperate than tropical regions, with a faster and more continuous response to rainfall in desert than in agricultural areas. Previous studies demonstrated that desert locust grew quickly in a semi-arid environment and preferred to lay eggs in moist, fresh sandy soil. Therefore, rainfall created favorable conditions for locust breeding. Uvarov (1977) indicated that the outbreak occurred in areas with more than 200 mm annual rainfall. For example, from July 2003 to April 2004, the rainfall in the Sahel region and Northwest Africa exceeded the average level, creating excellent circumstances for desert locust aggregation and the formation of locust plague (Ceccato et al., 2007). The distribution of the locust are closely related to their lifestyle and feeding habits, in our study area, the locust is preferred to Koeloriacristata, Alfafa, and Splendens (Su et al., 2007). Li et al. (2011) also showed that spawning quantity of Tibetan migratory locust varies under different vegetation conditions, with precipitation being the key limiting factor (Li et al., 2011).
SRAave was another important factor that controlled the distribution of locust inhabitable area, with relative influence accounting for 15.90% (Figure 3). There were different opinions on the influence of SRA on the growth, development, and reproduction. Schistocerca preferred to lay eggs with strong light condition, while Nomadacris liked in dark sand (Li et al., 2022). In our study, about 10 species, including Angaracris barabensis, Angaracris rhodopa, Myrmeleotettix palpalis, Chorthippus dubius, Chorthippus fallax, Gampsoccleis abbreviatus, Chorthippus albonemus, Chorthippus qingzanggensis, Bryodema luctousum, Bryodema miramae, were distributed (Yang et al., 2020). Most of them disliked too much solar radiation and usually lived on semi-sunny slopes (Su et al., 2007; Li et al., 2011). The ideal photoperiod for male and female adult locust development in Tibet was 16 Light: 8 Dark and 12 Light: 12 Dark, respectively. At the same time, 8–16 h of light was required for good dimension. Furthermore, the food consumption in the body was associated with energy conversion and stress during photoperiod (Wu, 2010). Locust had a certain preference for the temperature, and low temperature was bad for their growth and development. In the temperature ranged from 18 to 30°C, the developmental period of each insect state was shortened with the increase of temperature (Li et al., 2007). Ran et al. (2020)investigated the adaptation mechanism to plateau environment of the locust, and found that the genes related to glucose metabolic pathway boost the immunity.
The maximum NDVI had a relative influence of 14.10% for the distribution of locust (Figure 3). Previous studies have found that locust distributed in the areas with medium vegetation coverage, probably because of the medium vegetation coverage could provide opportunities for survival and risk escape, resulting in a balance between the food, microhabitat preference and risk, and thus population generation. Borges and Brown (2010) have indicated that non-gramineous plant coverage impacted on the distribution of insects. For locust, different functional groups of grasses, sedges, legumes and weeds in grassland may have different impacts on the distribution.
4.2. Limitations in locust monitoring
Monitoring locusts in Qinghai Province has a long history. The lack of a recent systematic survey of the region impedes the forecasting and avoidance of locust outbreaks. Up to date, several methods have been applied, but the limitations are obvious: Traditional empirical approaches, based on artificial spot investigations, have been used for locust monitoring. These are inefficient, inaccurate, and likely to overlook practical prevention measures. Due to the extensive locust distribution, these spot investigations are unlikely to provide efficient and targeted management of the locust (Ji et al., 2004). Satellite-based remote sensing technology can be useful for monitoring the large areas of locust habitat (Sivanpillai et al., 2006; Cressman, 2013; Mohammed et al., 2015; Renier et al., 2015). However, there are few studies on locust area delineation. A large-scale and high-precision method for locust area identification is still needed for more accurate and efficient locust control.
This study investigated the inhabitable area of locust and offered a framework for their management; nevertheless, there exist some limitations and uncertainties: (1) with the exception of MODIS remote sensing and topography data, the other data set was primarily interpolated by limited observations and coarse spatial resolution. The classification of locust inhabitable area still has some errors and uncertainties. (2) The density of locust was the foundation for classifying the inhabitable area. In our study, the data was mostly gathered through field observation using traditional methods, which were time-consuming, labor-intensive, and expensive.
Locust outbreaks usually began in remote unpopulated areas following higher than average rainfall. The need to survey such areas had suggested that unmanned aerial vehicles (UAVs), often referred to as drones, might be an effective method of surveying areas and detecting important locust concentrations (Matthews, 2021). Zheng et al. (2010) identified and counted the locust in the images taken from the UAV, the results indicated that the accuracy reached 89%, which could meet the requirements of locust disaster monitoring. However, due to the wide variety of species in grassland, it was difficult to achieve accurate population measurement reporting. With the abundance of remote sensing data resources, the corresponding locust remote sensing monitoring models are diversified, and the selection of model parameters is more complex. How to manage these models scientifically for better reuse still needs to be addressed.
5. Conclusion
Based on the field observation and multi-source environmental factors, this study investigated the relationship between locust density and main influencing factors, and identified the locust inhabitable areas in the Qilian Mountain National Park. Our results showed that average and maximum solar radiation, maximum precipitation, NDVI and precipitation, average temperature were the main influencing factor of locust inhabitability. And the locust density models based on above factors can accurately estimate the density of locust, with R ranging from 0.58 to 0.73 and RMSE ranging from 21.70 to 25.82 head/m2. The inhabitable area most suited for locust growth, development, and frequent outbreak lied in the south of Tianjun County, middle and northwest of Qilian County (27% of study area), and inhabitability weakened in south of Gangcha County, northwest of Tianjun County, and most of Delingha City. In future work, UAV technology realized long-term, repeated, large-scale monitoring, and automatic video recognition should be developed in locust monitoring.
Data availability statement
The original contributions presented in the study are included in the article/Supplementary material, further inquiries can be directed to the corresponding author.
Author contributions
All authors contributed significantly to this manuscript. YL and BM designed this study and responsible for writing of the paper; YL, WC, ML, BM, and HY were responsible for the field observation, data processing and analysis; SY made valuable revisions and editing of the paper. All authors contributed to the article and approved the submitted version.
Funding
This study was supported by the investigation and monitoring of grassland pests in the Qilian Mountain National Park ([2021]485) and the national standardized demonstration area of green prevention and control of insect pest in grassland (SFQ11-90).
Acknowledgments
We thanks the Qilian Mountain National Park for providing the field observation.
Conflict of interest
The authors declare that the research was conducted in the absence of any commercial or financial relationships that could be construed as a potential conflict of interest.
Publisher’s note
All claims expressed in this article are solely those of the authors and do not necessarily represent those of their affiliated organizations, or those of the publisher, the editors and the reviewers. Any product that may be evaluated in this article, or claim that may be made by its manufacturer, is not guaranteed or endorsed by the publisher.
Supplementary material
The Supplementary material for this article can be found online at: https://www.frontiersin.org/articles/10.3389/fevo.2023.1149952/full#supplementary-material
Footnotes
References
1 Million China Grassland Resource Map Compilation Committee. (1993). 1:1 Million China Grassland Resource Atlas. (Beijing: China Cartographic Publishing House).
Borges, P. A. V., and Brown, V. K. (2010). Phytophagous insects and webr building spiders in relation to pasture vegetation complexity. Ecography 24, 68–82. doi: 10.1034/J.1600-0587.2001.240109.X
Ceccato, P., Cressman, K., Giannini, A., and Trzaska, S. (2007). The desert locust upsurge in West Africa (2003–2005): information on the desert locust early warning system and the prospects for seasonal climate forecasting. Int J of Pest Manage. 53, 7–13. doi: 10.1080/09670870600968826
Chiaia-Hernandez, A. C., Keller, A., Wächter, D., Steinlin, C., Camenzuli, L., Hollender, J., et al. (2017). Long-term persistence of pesticides and TPs in archived agricultural soil samples and comparison with pesticide application. Environ. Sci. Technol. 51, 10642–10651. doi: 10.1021/acs.est.7b02529
Cressman, K. (2013). Role of remote sensing in desert locust early warning. J. Appl. Remote. Sens. 7:075098. doi: 10.1117/1.JRS.7.075098
Elith, J., Leathwick, J. R., and Hastie, T. (2008). A working guide to boosted regression trees. J. Anim. Ecol. 77, 802–813.
Hijmans, R. J., Phillips, S., Leathwick, J. R., and Elith, J. (2017). Dismo package for R, version 1.1-4. Available at: https://cran.r-project.org/web/packages/dismo/dismo.pdf.
Hong, J., Du, G., and Wang, G. J. (2014). The occurring and control situation of grasshopper in the grassland of China (review). Acta Agrestia Sin. 22, 929–934.
Hou, M. J., Ge, J., Gao, J. L., Meng, B. P., Li, Y. C., Yin, J. P., et al. (2020). Ecological risk assessment and impact factor analysis of alpine wetland ecosystem based on LUCC and boosted regression tree on the Zoige plateau. Chin. Remote Sens. 12:368. doi: 10.3390/rs12030368
Huis, A. V., Cressman, K., and Magor, J. I. (2007). Preventing desert locust plagues: optimizing management interventions. Entomol. Exp. Appl. 122, 191–214. doi: 10.1111/j.1570-7458.2006.00517.x
Ji, R., Xie, B. Y., Li, D. M., Li, Z., and Zhang, X. (2004). Use of MODIS data to monitor the oriental migratory locust plague. Agric. Ecosyst. Environ. 104, 615–620. doi: 10.1016/j.agee.2004.01.041
Kambulin, V.E. (2018). Locust Methods of Assessing Harm, Forecasting the Number and Technologies for Identifying Populated Areas. (PHD thesis). Almaty.
Kimathi, E., Tonnang, H. E. Z., Subramanian, S., Cressman, K., Abdel-Rahman, E. M., Tesfayohannes, M., et al. (2020). Prediction of breeding regions for the desert locust Schistocerca gregaria in East Africa. Sci. Rep. 10:11937. doi: 10.1038/s41598-020-68895-2
Klein, I., Woude, S. V. D., Schwarzenbacher, F., Muratova, N., Slagter, B., Malakhov, D., et al. (2022). Predicting suitable breeding areas for different locust species – a multi-scale approach accounting for environmental conditions and current land cover situation. Int. J. Appl. Earth Obs. 107:102672. doi: 10.1016/j.jag.2021.102672
Li, S., Feng, S. Q., Hidayat, U., Tu, X. B., and Zhang, Z. H. (2022). IPM—biological and integrated management of desert locust. J. Integr. Agric. 21, 3467–3487. doi: 10.1016/j.jia.2022.09.017
Li, Q., Feng, C. H., Zhang, M., Jiang, F., Yang, G., and Luo, L. M. (2007). The biological characteristics of Locusta migratoria tibetensis. Acta Entomol. Sin. 44, 210–213. (in Chinese)
Li, Y. L., Li, Q., Kuang, J. K., Yang, G., Feng, C. H., and Luo, H. H. (2011). Observation of antennal sensilla of Locusta migratoria tibetensis with scanning electron microscope. Chin. J. Appl. Entomol. 48, 872–876. (in Chinese)
Li, Z., Yuan, R., Feng, Q., Zhang, B., Lv, Y., Li, Y., et al. (2019). Climate background, relative rate, and runoff effect of multiphase water transformation in Qilian Mountains, the third pole region. Sci. Total Environ. 63, 315–328.
Liu, Y. Y., Liu, X. Y., Zhao, C. Y., Wang, H., and Zang, F. (2022). The trade-offs and synergies of the ecological-production-living functions of grassland in the Qilian mountains by ecological priority. J. Environ. Manage. 327:116883. doi: 10.1016/j.jenvman.2022.116883
Mansiaux, Y., and Carrat, F. (2014). Detection of independent associations in a large epidemiologic dataset: a comparison of random forests, boosted regression trees, conventional and penalized logistic regression for identifying independent factors associated with H1N1pdm influenza infection. BMC Med. Res. Methodol. 14:99. doi: 10.1186/1471-2288-14-99
Mansour, S. A., El-Sharkawy, A. Z., and Abdel-Hamid, N. A. (2015). Toxicity of essential plant oils, in comparison with conventional insecticides, against the desert locust, Schistocerca gregaria (Forskål). Ind. Crop. Prod. 63, 92–99. doi: 10.1016/j.indcrop.2014.10.038
Matthews, G. A. (2021). New technology for desert locust control. Agronomy 11:1052. doi: 10.3390/agronomy11061052
Maute, K., French, K., Story, P., Bull, C. M., and Hose, G. (2017). Short and long-term impacts of ultra-low-volume pesticide and biopesticide applications for locust control on nontarget arid zone arthropods. Agric. Ecosyst. Environ. 240, 233–243. doi: 10.1016/j.agee.2017.02.024
Meynard, C. N., Lecoq, M., Chapuis, M. P., and Piou, C. (2020). On the relative role of climate change and management in the current desert locust outbreak in East Africa. Glob. Chang. Biol. 26, 3753–3755. doi: 10.1111/gcb.15137
Miehe, G., Schleuss, P., Seeber, E., Babel, W., Biermann, T., and Braendle, M. (2019). The Kobresia pygmaea ecosystem of the Tibetan highlands – origin, functioning and degradation of the world's largest pastoral alpine ecosystem. Sci. Total Environ. 648, 754–771. doi: 10.1016/j.scitotenv.2018.08.164
Mohammed, L., Diongue, A., Yang, J. T., Bahia, D. M., and Michel, L. (2015). Location and characterization of breeding sites of solitary desert locust using satellite images Landsat 7 ETM and terra MODIS. Adv. Entomol. 3, 6–15. doi: 10.4236/ae.2015.31002
Ni, S.X. (2002). Remote Sensing Monitoring and Prediction of Grasshopper in Qinghai Lake. (Shanghai Science and Technology Press: Shanghai)
Norazrin, R., and Hazrul, A. S. (2023). Boosted regression tree (BRT) model for PM 10 concentrations prediction in Malaysia. IOP Conf. Ser.: Earth Environ. Sci. 1135:012041. doi: 10.1088/1755-1315/1135/1/012041
Oves, M., Khan, M.Z., and Iqbal, M. (2018). “Modern age environmental problems and their remediation,” in pesticide contamination and human health risk factor. (Chapter 3), 49–68.
Peng, W. X., Ma, N. L., Zhang, D. Q., Zhou, Q., Yue, X. C., Khoo, S. C., et al. (2020). A review of historical and recent locust outbreaks: links to global warming, food security and mitigation strategies. Environ. Res. 191:110046. doi: 10.1016/j.envres.2020.110046
Ran, L. Y., Jiang, C. X., Yang, Q. F., Wang, H. J., Baima, T. Z., Chen, L., et al. (2020). Comparative transcriptome analysis of Locusta migratoria tibetensis Chen (Orthoptera: Oedipodidae) under high- and low-temperature stress. J. Appl. Entomol. 144, 181–190. doi: 10.1111/jen.12728
Renier, C., Waldner, F., Jacques, D., Ebbe, M. A. B., Cressman, K., and Defourny, P. (2015). A dynamic vegetation senescence indicator for near-real-time desert locust habitat monitoring with MODIS. Remote Sens. 7, 7545–7570. doi: 10.3390/rs70607545
Sivanpillai, R., Latchininsky, A. V., Driese, K. L., and Kambulin, V. E. (2006). Mapping locust habitats in river Ili Delta, Kazakhstan, using Landsat imagery. Agric. Ecosyst. Environ. 117, 128–134. doi: 10.1016/j.agee.2006.03.028
Story, P., and Cox, M. (2001). Review of the effects of organophosphorus and carbamate insecticides on vertebrates. Are there implications for locust management in Australia? Wildl. Res. 28, 179–193. doi: 10.1071/WR99060
Su, H. T., Bai, S., and Yao, Y. (2007). The occurrence and distribution of Tibetan migratory locust in the last few years. Pratac. Sci. 24, 78–80. (in Chinese)
Uvarov, B. (1977). “Grasshoppers and locusts,” in A Handbook of General Acridology, Behaviour, Ecology, Biogeography, Population Dynamics, vol. 2 (London, UK: Centre for Overseas Pest Research), 1–613.
Veran, S., Simpson, S. J., Sword, G. A., Deveson, E., Piry, S., Hines, J. E., et al. (2015). Modeling spatiotemporal dynamics of outbreaking species: influence of environment and migration in a locust. Ecology 96, 737–748. doi: 10.1890/14-0183.1
Wang, X. G. (2000). The current situation of rodents pests and its control methods in resource area of Huanghe River. Qinghai Pratac. 3, 19–24.
Wu, L. (2010). The influences of environmental stress on adult Locusta migratoria tibetensis’s food consumption, growth and antioxidant enzymes. Master thesis. Ya’an: Sichuan Agricultural University (in Chinese)
Yang, L. S., Feng, Q., Adamowski, J. F., Alizadeh, M. R., Yin, Z. L., Wen, X. H., et al. (2020). The role of climate change and vegetation greening on the variation of terrestrial evapotranspiration in Northwest China’s Qilian Mountains. Sci. Total Environ. 759:143532. doi: 10.1016/j.scitotenv.2020.143532
Yao, Z. Y., Zhao, C. Y., Yang, K. S., Liu, W. C., Li, Y., You, J. D., et al. (2016). Alpine grassland degradation in the qilian mountains, China—a case study in damaying grassland. Catena 137, 494–500. doi: 10.1016/j.catena.2015.09.021
Zhang, L., Lecoq, M., Latchininsky, A., and Hunter, D. (2019). Locust and grasshopper management. Annu. Rev. Entomol. 64, 15–34. doi: 10.1146/annurev-ento-011118-112500
Zhang, W., Yi, S. H., Qin, Y., Sun, Y., Shangguan, D. H., Meng, B. P., et al. (2020). Effects of patchiness on surface soil moisture of alpine meadow on the northeastern Qinghai-Tibetan plateau: implications for grassland restoration. Remote Sens. 12:4121. doi: 10.3390/rs12244121
Zhao, L. L., Huang, W. J., Chen, J. S., Dong, Y. Y., Ren, B. Y., and Geng, Y. (2020). Land use/cover changes in the oriental migratory locust area of China: implications for ecological control and monitoring of locust area—ScienceDirect. Agric. Ecosyst. Environ. 303:107110. doi: 10.1016/j.agee.2020.107110
Keywords: alpine grassland, locust, environmental factors, inhabitable areas, distribution
Citation: Lv YY, Yu HY, Chen W, Li M, Yi SH and Meng BP (2023) Predicting inhabitable areas for locust based on field observation and multi-environmental factors in alpine grassland—A case study in the Qilian Mountain National Park, China. Front. Ecol. Evol. 11:1149952. doi: 10.3389/fevo.2023.1149952
Edited by:
Fujiang Hou, Lanzhou University, ChinaReviewed by:
Mou Xiaoming, Chinese Academy of Sciences (CAS), ChinaHengfu Huan, Chinese Academy of Tropical Agricultural Sciences, China
Copyright © 2023 Lv, Yu, Chen, Li, Yi and Meng. This is an open-access article distributed under the terms of the Creative Commons Attribution License (CC BY). The use, distribution or reproduction in other forums is permitted, provided the original author(s) and the copyright owner(s) are credited and that the original publication in this journal is cited, in accordance with accepted academic practice. No use, distribution or reproduction is permitted which does not comply with these terms.
*Correspondence: B.P. Meng, bWVuZ2JwMThAbnR1LmVkdS5jbg==