 Lindong Ma1,2
 Yuanxiao Hong1*
 Shouchao He3*
 Haibei Luo4Guangming Liu5Jinhui Zheng6Yuntian Xia7Deheng Xiao8
- 1Xingzhi College, Zhejiang Normal University, Jinhua, China
- 2School of Management, Zhejiang University of Technology, Hangzhou, China
- 3School of Economics and Management, Wenzhou University of Technology, Wenzhou, China
- 4College of Modern Science and Technology, China Jiliang University, Hangzhou, China
- 5School of Economics and Management, Huangshan University, Huangshan, China
- 6 School of Economics, Zhejiang University of Technology, Hangzhou, China
- 7School of Economics and Management, Hefei Normal University, Hefei, China
- 8School of Government, University of International Business and Economics, Beijing, China
The iterative upgrading of digital technology and the implementation of “carbon-peaking and carbon neutrality” national strategy provide an opportunity for the synergistic integration of digital economy and green economy in China, thus, whether the development of digital economy can curb urban carbon emission intensity (CEI) remains to be answered. Based on the panel data of 110 cities in the Yangtze River Economic Belt (YREB) region from 2011 to 2020, this paper investigated the impact of digital economy on CEI by using the dual fixed-effect model, the mediating mechanism model and the spatial Durbin model. The main results are as follows: (1) The development of digital economy in the YREB region can lower down CEI, promote the rationalization and upgrading of industrial structure, and improve cities’ green innovation capacity; (2) CEI was reduced through the intermediary effect of industrial structure optimization and upgrading and green technology innovation; (3) Digital economy shows a significant positive spatial correlation, and exerts a spatial spillover effect of reducing CEI in surrounding cities with obvious spatial heterogeneity; (4) Digital economy has a stronger inhibitory impact on CEI in the downstream cities and cities within the urban agglomerations; (5) In addition to digital infrastructure, the remaining components of digital economy, directly and indirectly, diminish CEI. At last, according to the research findings, suggestions for digital economy development in the YREB region are put forward.
1. Introduction
Global warming is a great challenge facing humanity. The continued increase in greenhouse gas emissions will adversely affect agricultural production, socioeconomic activities, and human livelihoods, and ultimately hinder progress toward global sustainable development. In China, carbon emissions increased from 8.83 billion tons (2011) to 9.90 billion tons (2020),1 accounting for a large proportion of the world’s total carbon emissions, and the carbon emission reduction is grim. In September 2020, President Xi Jinping pledged at the United Nations (UN) General Assembly to peak carbon emissions by 2030 and achieve carbon neutrality before 2060. China’s carbon peaking and carbon neutrality goals not only show China’s determination to reduce greenhouse gases, but also the essential requirement for China’s high-quality development (Panpan et al., 2020). China’s carbon emission reduction significantly impacts the global economy and environment (Wang C. et al., 2019). The Yangtze River Economic Belt (YREB) region accounts for more than 40% of China’s total economic output. It is an vital growth momentum of the national economy and the most promising region to achieve the “double carbon” target. Along with economic development, a large amount of CO2 emitted by fossil energy consumption has caused severe ecological problems. The conflict between economic development, resource use, and environmental protection needs to be solved urgently (Wang R. et al., 2019; Siqin et al., 2022). This paper studies the CEI of Yangtze River Economic Belt, which is important for enhancing low-carbon economic development and reducing regional carbon emissions. With the advancement of Chinese-style modernization, China’s economy is facing the transformation of industrial structure led by the digital economy. The White Paper on China’s Digital Economy Development mentioned that the volume of China’s digital economy has increased from 9.5 trillion yuan in 2011 to 39.2 trillion yuan in 2020. As digital technology upgrades quickly, China’s digital economy and the real economy have reached deep integration. It promotes digital industrialization and industrial digitization, realizes the rational allocation of production factors, and optimizes energy structure. In the background of China’s “double carbon” target and economic transformation development, the synergy between economic development and ecological protection ask for higher standards in carbon emission management to solve the dilemma between the ecological environment and economic development. Then, a pivotal question to be answered is whether the development of digital economy can reduce a city’s CEI. If it is valid, what is the mechanism of their interaction? Moreover, is there a difference in the spatial distribution and characteristics of the CEI effect caused by the digital economy over cities? Is there a spatial effect? Working out the above issues will help clarify the link between the digital economy and CEI. The conclusions of this study also can provide an empirical basis and decision reference for cities’ low-carbon development.
With continuous innovation of network information technology, the digital economy is affecting all aspects of the economy, society, and environment with high penetration, scale effect, and network effect. Since the “Double Carbon” target and the Digital China Strategy were put forward, the government and academia have been focusing on taking full advantage of the digital economy to promote low-carbon development. The existing literature can be divided into three themes. Firstly, based on the relationship between the digital economy and total carbon emissions. Three views exist in this perspective: (1) Positive view that the development of digital economy has contributed to carbon emissions reduction. There are a number of articles demonstrating its positive effects from different perspectives by using different methods. For example, digital finance is part of the digital economy and can effectively reduce carbon emissions (Zhang and Liu, 2022). Digitalization development has beneficially promoted the technological transformation and upgrading, and strengthened green technological innovation (Ma Q. et al., 2022), thus changing the structure of energy consumption, which in turn promotes energy conservation and carbon emission reduction (Yi et al., 2022). It has also been found in industrial division and scale studies that the development of digital economy in recent years has beneficially expanded the economic scale and proportion of tertiary industries (Wang J. et al., 2022), thus reducing the share of polluting industries, which leads to carbon emission reduction. In addition to decreasing local carbon emission, some scholars also found that the development of digital economy exerts huge spatial spillover effect, thus contributing to carbon emission reduction in the surrounding areas (Yi et al., 2022). (1) Negative view that digital economy development is detrimental to carbon emission reduction. Dong et al. (2022) argued that digital economy can indirectly increase carbon emissions per capita by promoting economic growth, industrial structure upgrading and financial development. Zhang L. et al. (2022) pointed out that digital economy is detrimental to improving energy efficiency, which indirectly increases total carbon emissions. Yu and Zhu (2023) stated that digital economy strengthens carbon emissions by increasing energy intensity and promoting economic expansion. (2) Other views with complex results. Some scholars have found an inverted U-shape relationship between digital economy and total carbon emissions with a threshold effect (Chen X. et al., 2022; Li and Wang, 2022; Zhao S. et al., 2022). Secondly, based on the relationship between digital economy and carbon emission efficiency. Zhang et al. (2022b) theoretically elaborated the influence mechanism of digital economy on carbon emission efficiency, and on the basis of measuring carbon emission efficiency with EBM, demonstrated empirically that digital economy can improve carbon emission efficiency through intermediary variables such as energy intensity, but the spatial spillover effect on neighboring cities is not obvious. Based on the NDDF model calculating carbon emission efficiency in 285 cities in China, Zhang and Liu (2022) demonstrated that digital finance can beneficially contribute to the improvement of urban carbon emission efficiency and there are beneficial spatial spillover effects. Thirdly, based on the relationship between digital economy and carbon emission intensity. Gu et al. (2023) explored the relationship between digital economy and carbon emission intensity based on 13 cities in the Beijing-Tianjin-Hebei urban agglomeration and concluded that the digital economy can effectively reduce CEI, and analyzed its spatial spillover effect based on the space adjacency matrix. China is vigorously promoting the construction of urban agglomerations, therefore, Yan et al. (2022) and Xiaohan et al. (2022) explored the contribution of digital economy development to lowering carbon emission intensity in six urban agglomerations in China and found that the construction of urban agglomerations beneficially contributed to the reduction of carbon emission intensity by comparison. Sun et al. (2023), based on the panel data of 30 provinces in China with mediating variables (technological innovation and energy structure), concluded that digital finance had a strong and sustained effect on the reduction of carbon emission intensity. The above research provides a theoretical basis and empirical reference for exploring the impact of digital economy on carbon emissions, some scholars have identified the digital economy in reducing urban or provincial carbon emissions intensity, and urban agglomeration perspective has also received academic attention (Xiaohan et al., 2022). Due to the large development gap between the east and west of China, the existing literature applied different measurement methods and selects different indicator variables. So whether there exists a unified indicator system and method based on the national level regions in China, which can also achieve micro and macro comparison, to explore the impact of digital economy on CEI and its internal mechanisms more comprehensively and objectively? We can see from the existing literature, based on the cities within urban agglomerations, there is a spatial spillover effect of the digital economy on CEI, does it exist among cities in non-urban agglomerations? Whether there are differences in spillover effects between regions? The digital economy is a comprehensive indicator, are there differences in the impact of its various component parts on CEI? Are there spatial spillover from each component as well? The above fields are still a blank to be explored. We try to answer the above questions by empirical analysis, using the panel data of 110 cities from 2011 to 2020 in Yangtze River Economic Belt in China.
As mentioned above, this study conducts analysis into the influencing mechanism and spatial effects of the digital economy on CEI based on the panel data in 110 cities in the YREB region from 2011 to 2020. The research is conducted as follows: (1) This study objectively calculates the digital economy development level in YREB region by constructing a scientific digital economy development indicator system. (2) This study uses the two-way fixed effects model to evaluate the impact of digital economy development on CEI. (3) This paper studies the mediating mechanisms of industrial structure rationalization and upgrading and green technology innovation in the situation of digital economy influencing CEI. (4) This study analyzes the spatial distribution characteristics of digital economy and CEI in the YREB region, and then applies the spatial Durbin model to assess the spatial spillover effect of digital economy on CEI. (5) The regressions were categorized according to geography and whether they were within urban agglomerations. (6) The regression of the CEI is classified according to each component of the digital economy. (7) Robustness tests.
The potential contributions are as follows: First, in term of research area, the impact of digital economy on CEI is evaluated from multiple dimensions based on uniform indicators and calculation methods: urban agglomeration versus non-urban agglomeration, a comparison among East China, Central China and West China, obtaining beneficial direct effect and spatial spillover effect. Second, in term of research content, this paper explores whether the digital economy has an mediating effect on CEI. According to the significant improvement of green innovation and the acceleration of industrial structure upgrading brought by digital economy, green innovation and industrial structure are selected to verify the intermediary effect. Third, this study uses the concept of spatial location to thoroughly explore the spatial correlation of the digital economy on CEI in the YREB region, as well as spillover effects. Fourth, with spatial heterogeneity, the spatial differences in the impact of the digital economy on CEI are discussed. Further, the influencing factors of the digital economy on CEI is explored for a more detailed and comprehensive understanding of its role.
2. Theoretical basis and research hypothesis
2.1. Direct effect of digital economy development on CEI
Established research and real-life practice show that the digital economy can create carbon emission reduction effects from multiple aspects and dimensions. A brief description follows. First, combining digital technology with the traditional production process, in the common development of the digital economy and the real economy, promotes the flow speed, scientific integration, and utilization of all links, realizes the transformation from inefficient industries to efficient ones, effectively optimizes the allocation of resources, and promotes productivity development. The Index Climate Action Roadmap proposes that digital technology solutions can reduce 15% of global CO2 in manufacturing, energy, transportation, buildings, agriculture and other areas. It is a critical technological factor in achieving carbon reduction. Specifically, the digital economy can provide a networked environment. Online shopping and a paperless office lifestyle eliminate geospatial constraints and reduce the use of transportation and office consumables (Li et al., 2021). As a result, they significantly reduce transportation and production energy consumption, thereby reducing city carbon intensity. Second, in terms of environmental governance. Digital technologies can accelerate the spread of information and improve the effectiveness of environmental education, raising public awareness of environmental protection. It enhances citizens’ monitoring role of government regulation and corporate carbon emission reduction through open access to government data and other means (Yang et al., 2020). Hampton et al. (2013) suggest the use of digital technology (e.g., big data, cloud computing, etc.) can help governments develop scientific carbon policies, help regulators implement policies and predict future development trends scientifically and effectively, and reduce environmental pollution as much as possible. Third, in terms of stimulating enterprises. The use of digital technology is forcing companies to pay attention to environmental benefits and external effects. It will prompt enterprises to use digital technology to transform and upgrade traditional industries, and promote the intellectual development of industries, thus improving enterprises’ resource allocation rate and productivity. Resource allocation is one of the main factors affecting carbon emissions. Therefore, developing the digital economy can enhance enterprises’ green transformation and reduce carbon emissions. So, we have the hypothesis H1.
H1: The digital economy development can reduce CEI in the YREB region.
2.2. Mediating mechanism of digital economy on CEI
The digital economy promotes industrial structure optimization through efficiency improvement, economy of scale, precise allocation, cost savings and innovation empowerment. This paper evaluates the industrial structure optimization from two aspects: industrial structure rationalization and industrial structure upgrade, then discusses how the digital economy development influences those two aspects, eventually affects CEI as a result. First, enterprises can achieve efficient access to information and efficiency by using digital technology, thus reducing the negative impact of information asymmetry or incompleteness, thus reducing ineffective production processes, and improving the efficiency of limited resource utilization (Ren et al., 2021). Digital trading platforms and industrial internet platforms can improve the coordination of resources between industries, and promote the rational allocation of resources. They can reduce enterprises’ energy consumption and then reduce CEI (Chen et al., 2019). Secondly, along with the deepening of industrial digitization and digital industrialization, the rapid development of tertiary industries such as digital services, the rise of the Internet of things and the rapid growth of e-commerce, the industrial structure has been optimized. In addition, the application of digital technology has promoted the transformation of industries into technology-intensive industries, which in turn has improved the level of industrial structure. In terms of the impact of industrial structure optimization on carbon emissions, Zhu and Shan (2020) stated that most of the industries undergoing digital transformation are clean industries with high efficiency and low energy consumption, which leads to low CEI. It is confirmed that the rationalization and upgrading of the industrial structure have a positive effect on reducing regional carbon emissions in the YREB region. So we bring the hypotheses H2a and H2b.
H2a: Digital economy development reduces CEI by the upgrading of industrial structure in the YREB region.
H2b: Digital economy development reduces CEI by enhancing the rationalization of industrial structure in the YREB region.
The digital economy is a critical factor in promoting technological innovation. Green innovation refers explicitly to technological innovation that results in environmental sustainability goals, which play an important role in the low-carbon transformation of industries (Xu et al., 2021; Dou and Gao, 2022). Specifically, first, the digital economy breaks through the original geographic spatial restrictions through cyberspace, enabling the entire flow of production factors. It can attract upstream and downstream industries to form virtual clusters, promote knowledge and technology spillover, and enhance cities’ overall green innovation level (Halbert, 2011; Tang et al., 2021). Second, driven by digital technology, new financial services can improve the financial environment and structure and reshape the financial industry (Zhang et al., 2022b). With the help of digital technologies such as big data, banks can conduct comprehensive research and reasonable deployment to help enterprises improve their credit rationing structure and alleviate their debt financing risks and constraints. Therefore, with the gradual expansion of new businesses such as green credit, financial support can be provided for enterprises’ green innovation, helping them to sustain their green innovation and long-term development (Zhang A. et al., 2022). Third, enterprises use digital technology to collect information on consumers’ green consumption preferences and provide intelligence to support the production of green and innovative products. Digital technology can also force enterprises to improve the efficiency of green innovation and avoid wasting resources (Kafouros, 2006; Paunov and Rollo, 2016). In summary, the digital economy significantly impacts green innovation through the penetration of digital technology applications. In the study of green innovation to reduce carbon emissions, Gu et al. (2023) proposed that improving green innovation can alleviate technical problems such as insufficient new energy storage and power consumption, and then reduce carbon emissions by optimizing the energy structure. In addition, the promotion of green innovation will help to eliminate high energy-consuming and polluting enterprises, thus reducing carbon emissions. So, we get the hypothesis H3.
H3: The digital economy development reduces CEI through green technology innovation in the YREB region.
2.3. Spatial spillover effect of digital economy on CEI
According to the relevant theories of economic geography, spatial proximity or economic distance can accelerate or slow down the spread of knowledge innovation. Technology spillover can accelerate the flow of production factors, which have positive or negative effects on the surrounding areas. Digital economy development provides new ways and opportunities to reshape the spatial pattern of economic production. The “spillover” of digital economy is determined by the inherent qualities of digital technology. Due to the high mobility and replicability of digital technology, and less influenced by geographical constraints, the digital economy can realize the industrial and economic activities to move across regions with strong spatial spillover effects (Li and Wang, 2022; Zhang et al., 2022b). First, with the innovation of digital technology, digital economy is developing rapidly. Enterprises, universities and academic institutions across the regions have more opportunities to exchange and cooperate with each other in technology research and development. Talents and data can flow freely across the regions, achieving intellectual spillover and information spillover. Second, the development of digital economy has accelerated the process of digital transformation of the real economy. All industries and fields are undergoing digital transformation, which has greatly improved the production efficiency and commodity circulation efficiency, which in turn improves the utilization rate of urban resources and generates resource spillover effects. As a result, carbon emissions can be reduced. Third, digital technology is used to achieve collaborative detection and governance. It helps to exert the effect of collaborative governance to maximize and rationalize production factors, thus achieving the purpose of reducing CEI as well as promoting the low-carbon coordinated development of the YREB region (Li and Wang, 2022). In an empirical study based on the spatial spillover of CO2, Yue et al. (2021) and Liu and Liu (2019) stated that carbon emissions can influence the local ecological environment, and cause the chain reaction in the surrounding cities as well. Therefore, it is spatially significantly correlated. In summary, we propose hypothesis H4.
H4: There are spatial spillover effects on the impact of the digital economy on CEI.
3. Variable definition and model construction
3.1. Variable definition
3.1.1. Dependent variables
Carbon emission intensity (CEI). Because of the significant differences in economic development among cities in the YREB, this paper applies the CEI to evaluate the level of carbon emissions in cities (Cary, 2020). CEI is the amount of CO2 produced per unit of real GDP. Referring to previous research (Chen et al., 2020; Banruo and Zijie, 2021), this study uses the consumption of petroleum gas, natural gas, and electricity consumption of the whole society to estimate energy consumption. Among them, China’s urban power generation is still dominated by coal, so coal-fired power generation is used to measure CO2 emissions (Wang Y. et al., 2022). The formula is as follows:
In equation (1), CO2 is the total energy-related carbon emission of the city; Cn, Cp, and Ce, respectively, represent the CO2 emissions generated by natural gas, liquefied petroleum gas, and electricity consumption of the whole society; En is the consumption of natural gas, Ep is the consumption of liquefied petroleum gas, Ee is the electricity consumption of the whole society; k is the emission coefficient of natural gas, v is the emission coefficient of liquefied petroleum gas, η is the ratio of coal power to the total power generation, and φ is the coefficient of the coal power emission. Among them, the CO2 emission coefficient refers to the previous research (Panpan et al., 2020) and the “Provincial Greenhouse Gas Inventory Compilation Guide,” and this study sets the CO2 emission factors of natural gas, liquefied petroleum gas, and coal power fuel chain as 2.162 2 kg/m3, 3.101 3 kg/kg and 1.302 3 kg/kW·h, respectively. In equation (2), CEI is the urban carbon emission intensity, and GDP is the gross domestic product.
3.1.2. Independent variables
Digital economy development index. This study refers to Wang and Guo (2022) and Li et al.’s (2021) digital economy development index measurement method. As shown in Table 1, we use six indicators to construct the digital economy index system. Then we use the entropy weight method to calculate cities’ digital economy comprehensive index.
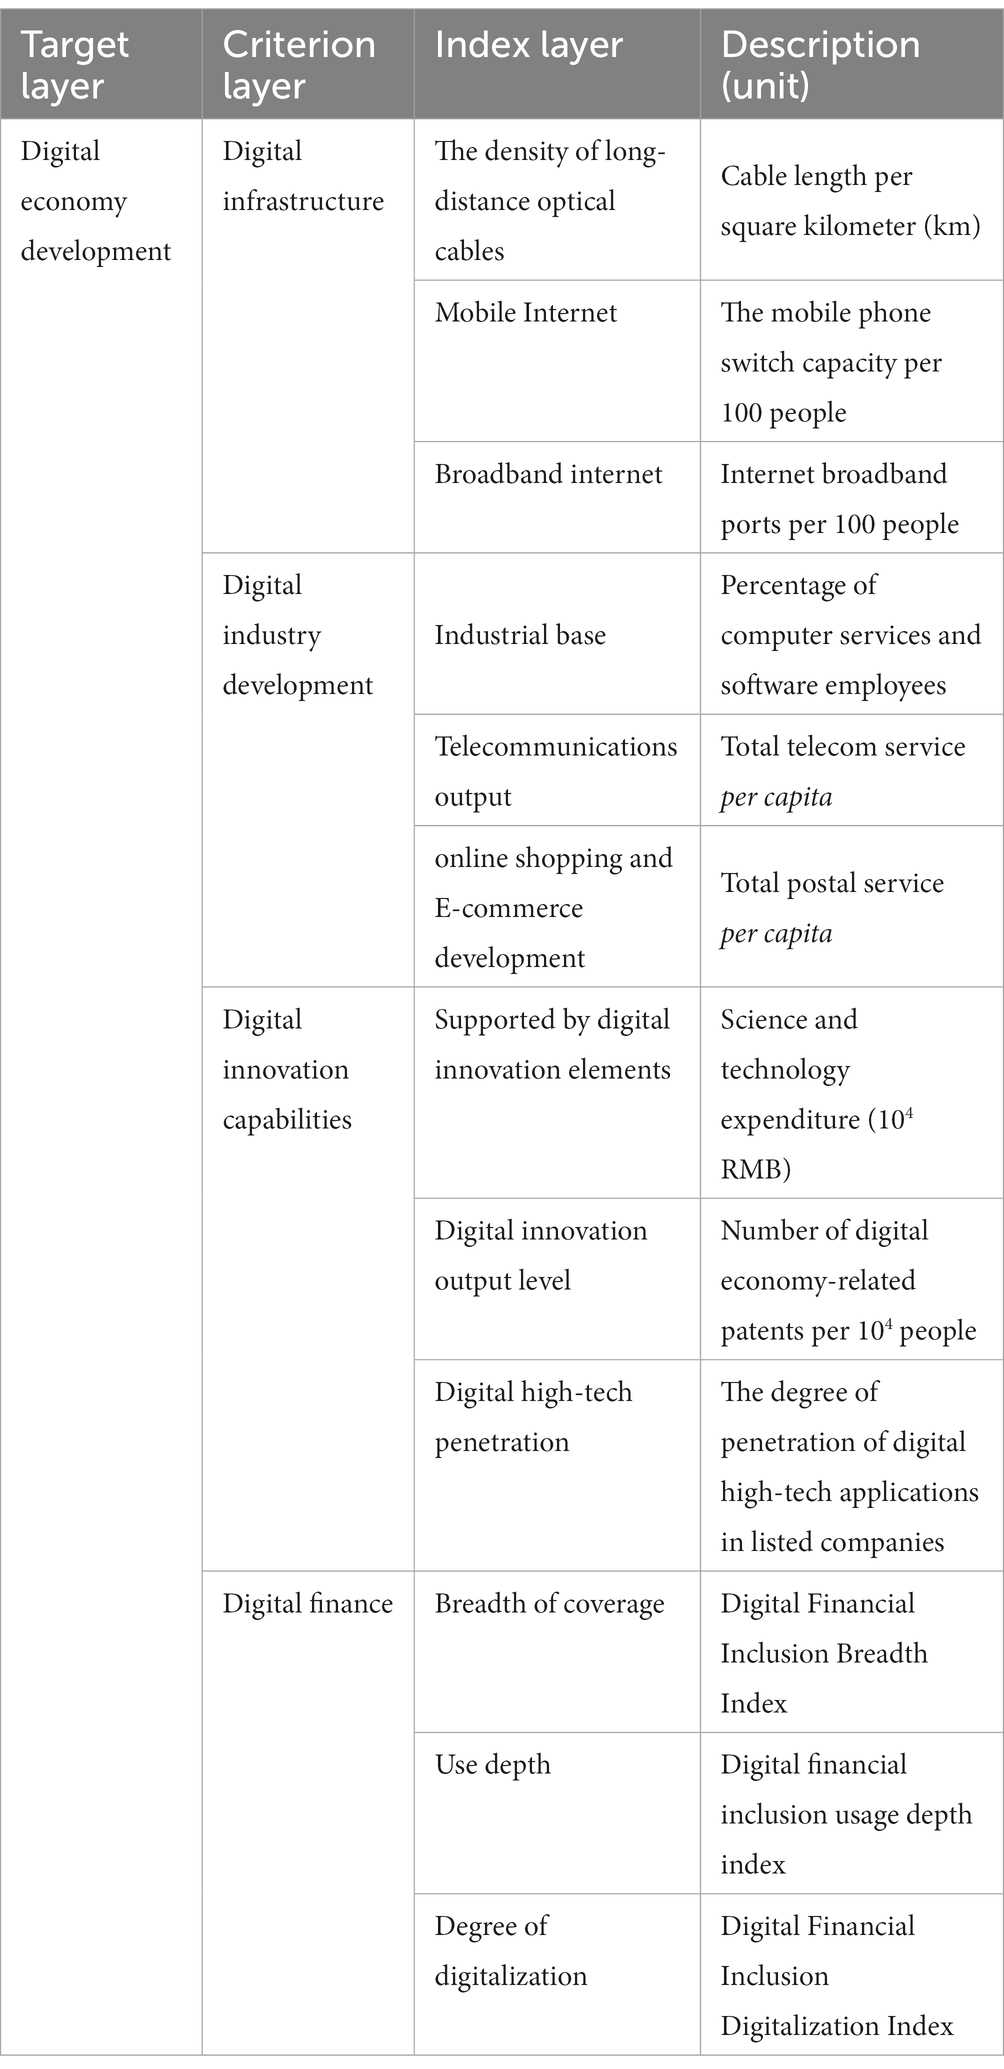
Table 1. Digital economy development comprehensive index system.
3.1.3. Intervening variables
1. Industrial structure optimization, containing two submitting parties of industrial structure rationalization (Isr) and industrial structure upgrade (Isu). Based on Yigen and Zhen (2021) research, this study measures the level of industrial structure upgrading by the weighted average of the proportion of the GDP of the secondary and tertiary industries, that are 0.4 and 0.6, respectively. And the industrial structure rationalization index is measured with the Theil index. The formula is as follows.
From equation (3), n is the number of industrial parties; i is the industrial sector; G is the city GDP; L is the number of employees; Gi/G is the output structure; Gi/Li is the productivity of the industrial sector i; G/L is the yield of the industry.
(2) Green technology innovation (Gti). This study measures it as the sum of the number of green technology invention patents (Zeng et al., 2022). Referring to the Technology Fields and IPC Classification Number Comparison Table released by OECD (Organization for Economic Cooperation and Development), the coverage of green technology is settled by establishing the corresponding relationship between green technology and IPC classification, mainly involving water pollution control, soil pollution control and air pollution control and other technologies (Zhang et al., 2022a). The patent data is regarded as the output index of enterprise innovation, which can measure the level of regional independent innovation and reflect the innovation situation of enterprises. Thereby, this study adopts the number of green patents as an indicator of green innovation in referring to Tang et al. (2021).
3.1.4. Control variables
Referring to Zhang et al. (2022a), Zhao X. et al. (2022), Xu et al. (2021), and Wang and Guo (2022b). The control variables are selected as follows: (1) Environmental regulation intensity (Eri). It is issued by governments as a command-control tool to manage the ecological environment (Zhang et al., 2022a) and is calculated by discharging three wastes (SO2, wastewater, and soot). (2) Science and technology support (Sts). Local financial expenditures on science and technology as a percentage of GDP for the year indicate science and technology support. (3) The population density index (Pdi). Demographic factors have an important relationship with carbon emissions, especially regional populations (Xu et al., 2021). The increase in carbon dioxide emissions is mainly caused by population growth and increased human activities. However, population growth may also improve energy efficiency and alleviate environmental pressure due to “Agglomeration Effect” and “Shared Benefits” (Xie et al., 2019). (4) Economic development level (Edl). China’s economic growth relies on energy, whose excessive consumption will inevitably produce large amounts of carbon dioxide (Wang and Guo, 2022). The level of economic development is measured by the real GDP per capita of the region. (5) Urbanization development level (Udl). It is expressed by the urbanization rate, that is the proportion of the urban household registration population in the total household registration population. The specific description of each variable are shown in Table 2.
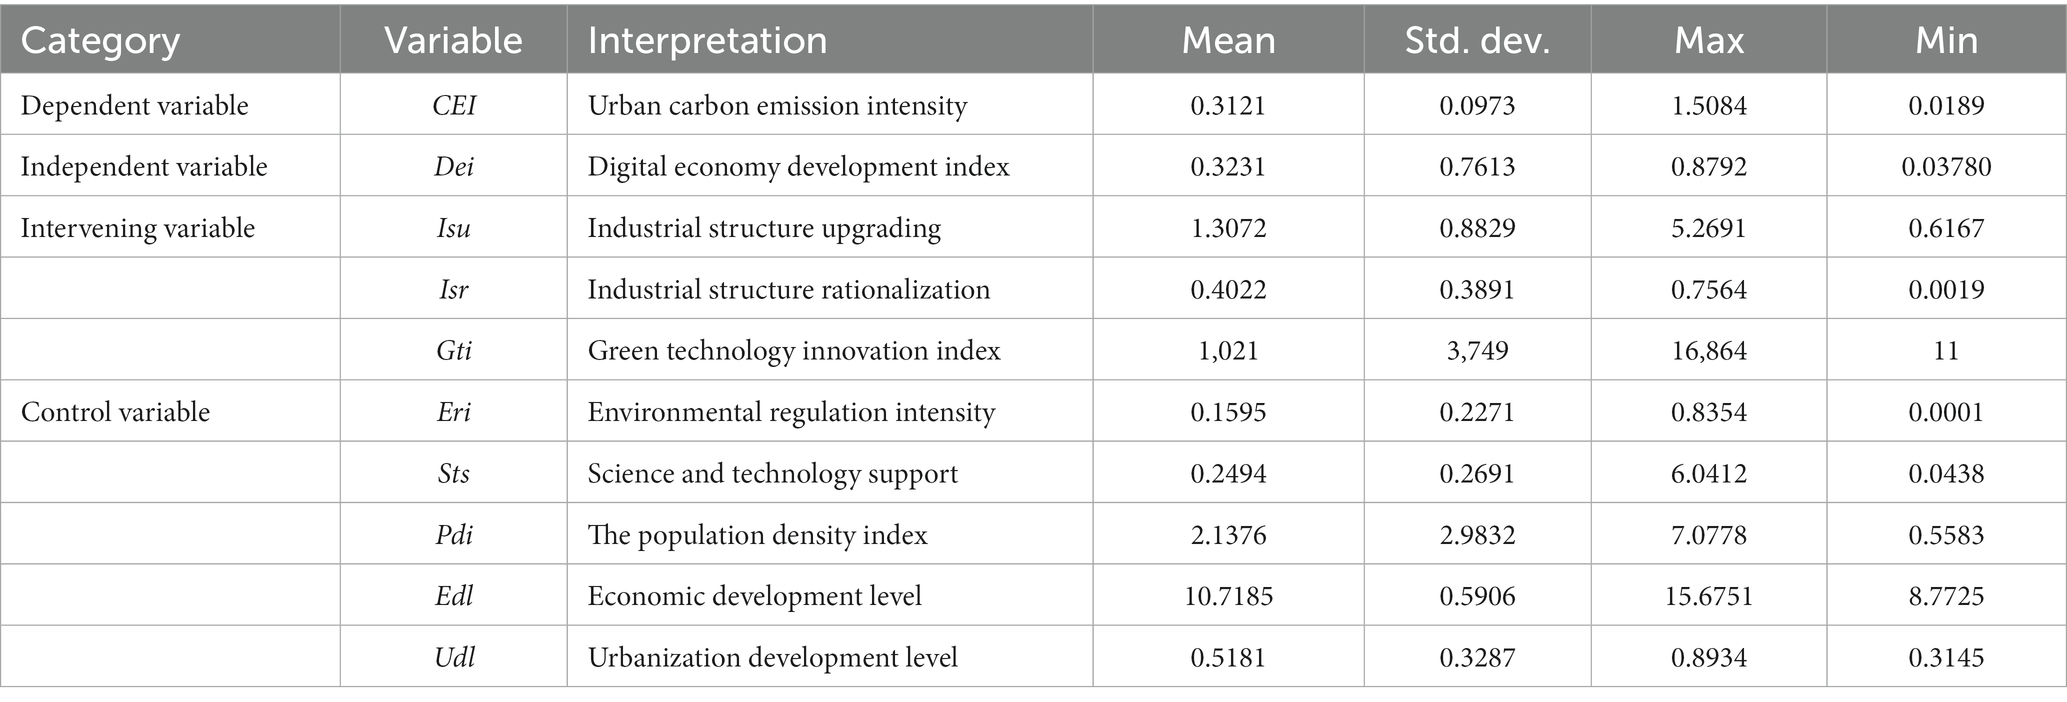
Table 2. Variables’ explanatory and descriptive statistics.
3.2. Model construction
3.2.1. Fixed effects model
This study uses a fixed effects model to analyze the impact of urban digitalization on urban carbon emission intensity. The model is as follows Li et al. (2019) and Zhang et al. (2022b).
In this model, i is the city; t is the year; CEI is the carbon emission intensity; Dei is the digital economy index; Xit is the Control variables; μi is an individual fixed effect, δt is the time fixed effect, and εit is random error.
3.2.2. Mediating model
As mentioned in the above assumptions, industrial structure optimization (industrial structure rationalization, industrial structure upgrading) and green technology innovation are two mediating factors for the digital economy to reduce carbon emissions. Based on this, the mediation model is constructed as follows.
In model (5), Y is an intervening variable, which refers to industrial structure upgrading, industrial structure rationalization, and green technology innovation index. In model (6), β1is the mediating effect, showing that digital economy development affects CEI through green technology innovation or industrial structure optimization. The other variables are the same as model (4).
3.2.3. Spatial Durbin model
The spatial spillover effects of the digital economy are evident (Gu et al., 2023; Yu and Zhu, 2023), and urban carbon emissions will generate negative externalities on the surrounding urban environment, and it has an obvious spatial correlation (Wang and Guo, 2022). Therefore, this study constructs the spatial Durbin model to verify the spatial effect of the digital economy on CEI (Lv et al., 2022). The model is as shown below.
In model (7), is the autocorrelation coefficient; Xit is the control variable; W is the spatial weight matrix; 1 is the coefficient of independent variables; 2 is the coefficient of control variables’ spatial interaction term.
There are four types of spatial weight matrices commonly used in academic research: first-order adjacency spatial weight matrix (W1), geographic distance spatial weight matrix (W2), economic distance spatial weight matrix (W3), and geographic economic nested spatial weight matrix (W4). The geographic distance spatial weight matrix and the economic distance spatial weight matrix examined the effects of geographic and economic factors on the spatial distribution characteristics of the variables, respectively. The geographic-economy nested spatial weight matrix includes geographical factors and economic development factors, all spatial weight matrices are as follows:
Where element dij of W2 and W4 represents the nearest highway mileage of city i and j. GDPi and GDPj of W3 and W4, respectively, represent the annual per capita GDP of cities i and j. represents the weight of the geographic-economy nested spatial weight matrix. Referring to Wang and Guo (2022), it is taken as 0.5. Besides, this paper has standardized the spatial weight matrix in the empirical analysis.
3.3. Data sources
This study adopts the panel data of 110 cities in the YREB region from 2011 to 2020. All city data are derived from the “China Urban Statistical Yearbook,” “China Energy Statistical Yearbook,” “China statistical yearbook on the environment,” annual statistical reports, and statistical bulletins for each city or province. The digital financial inclusion index is derived from the “Digital Financial Inclusion Index System and Index Compilation” (Guo et al., 2020). The missing data were filled using linear interpolation and the mean method. To try to mitigate the effect of heteroskedasticity, this study took logarithms for all variables when conducting regression analysis.
4. Direct effects and mediating mechanism
4.1. Direct effects
To verify the impact of the digital economy on CEI in the YREB region, a double fixed-benchmark regression with time effect and the individual effect was conducted on the model (4). The regression results are shown in Table 3, and the difference between the two regression results lies in whether control variables are included or not. It can be found that the coefficients of lnDei in columns (1) and (2) are significantly negative at the significance levels of 1%, which indicates that the digital economy development in the YREB region has a significant impact on decreasing CEI. To be more detail, when lnDei increases by 1%, lnCEI decreases by 0.199% accordingly, which confirms hypothesis H1. The reason may be that the development of the digital economy in the Yangtze River Economic Belt has obvious advantages compared with other regions, such as the development of the digital industry in Zhejiang and the digital transformation of the manufacturing industries in Jiangsu, Shanghai, Wuhan and Chongqing, which realize the deep integration and coordinated development of digital technology and high-carbon emission fields such as industry, electricity, transportation. In addition, by building smart cities, we can improve the efficiency of urban operations, environmental management, and digital government services to promote low-carbon transformation cities and reduce CEI.
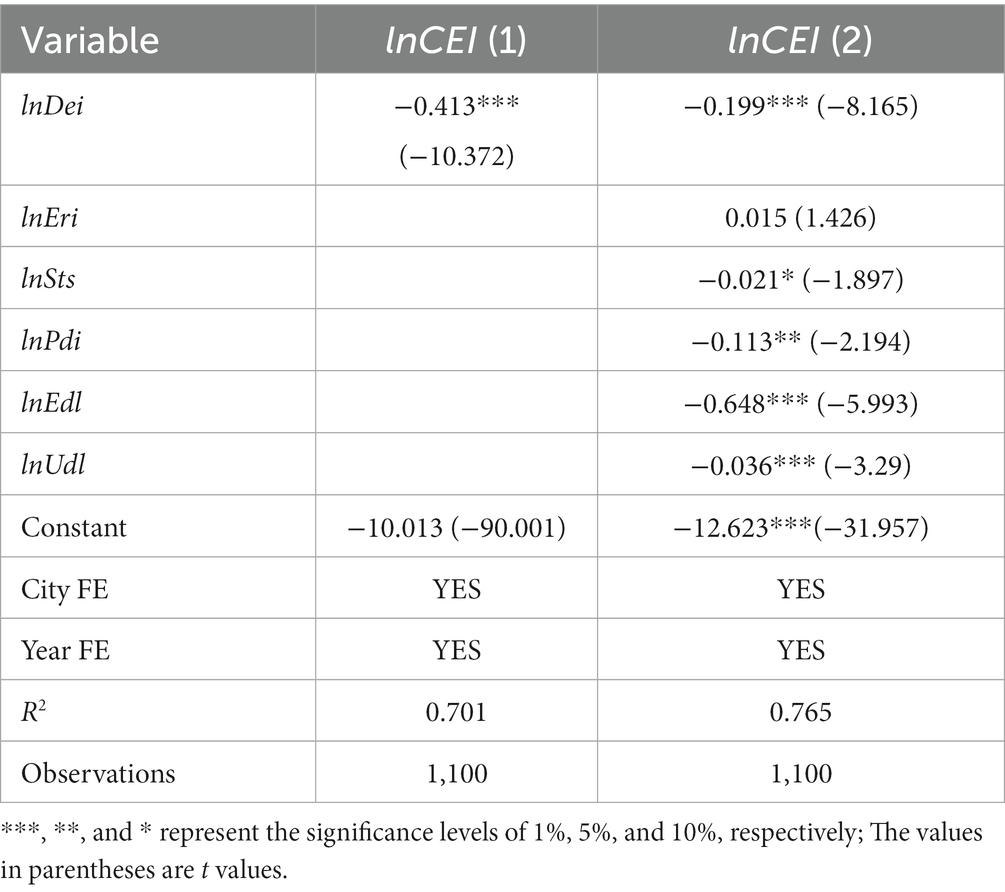
Table 3. Benchmark regression results.
The control variables are as follows. Economic development and urbanization development both affect CEI at a significance level of 1%. The possible explanation is that economic development and urbanization advancement make citizens more aware of environmental protection and strengthen government regulatory actions, leading to an increase in sewage costs, which reverses the effects on carbon emissions. Urban economic growth causes technological innovation, institutional change, and economic restructuring, which help reduce the intensity of urban carbon emissions. The population density and science and technology support negatively affect CEI at the significance levels of 5% and 10%, respectively. On the one hand, the increased population density will increase the total amount of carbon emissions due to the resources increase as the population increase, but the economic growth benefits and the more efficient and rational use of resources, especially economies of scale, will lead to a decrease in CEI. Increasing government investment in science and technology can encourage companies and research institutions to accelerate research in green and digital technologies and to promote the application of advanced green technologies in production. In addition, by using digital technologies such as machine learning and big data, companies can achieve emission reductions more accurately. The positive effects of Eri on CEI did not pass the t-test. The reason behind it is that the Eri increases when the government steps up efforts to regulate activities that pollute the environment, thereby reducing carbon emissions. At the same time, it will also cause many enterprises to move out due to excessive pollution costs or non-compliance with environmental protection requirements, which may eventually lead to economic stagnation or even retrogression. Therefore, the effects of Eri on CEI do not pass the significance test.
4.2. Mediating mechanism
This part uses the stepwise inspection method to analyze the regression results of models (5) and (6), and judge the mediating effect of Dei on CEI in the YREB region. From Table 4, we can find that the coefficient of lnDei on lnIsu is significantly positive at the 1% significance level, presenting that the digital economy development in the YREB region has substantially improved the upgrading of industrial structure, which confirms hypothesis H2a. Moreover, in columns (2) and (3), we can see that the coefficients of lnDei on lnIsr and lnGti are significantly positive at the significance level of 1%, indicating that the development of digital economy has vigorously promoted the industrial structure rationalization and green technology innovation in the YREB region, which firms hypotheses H2b and H3.
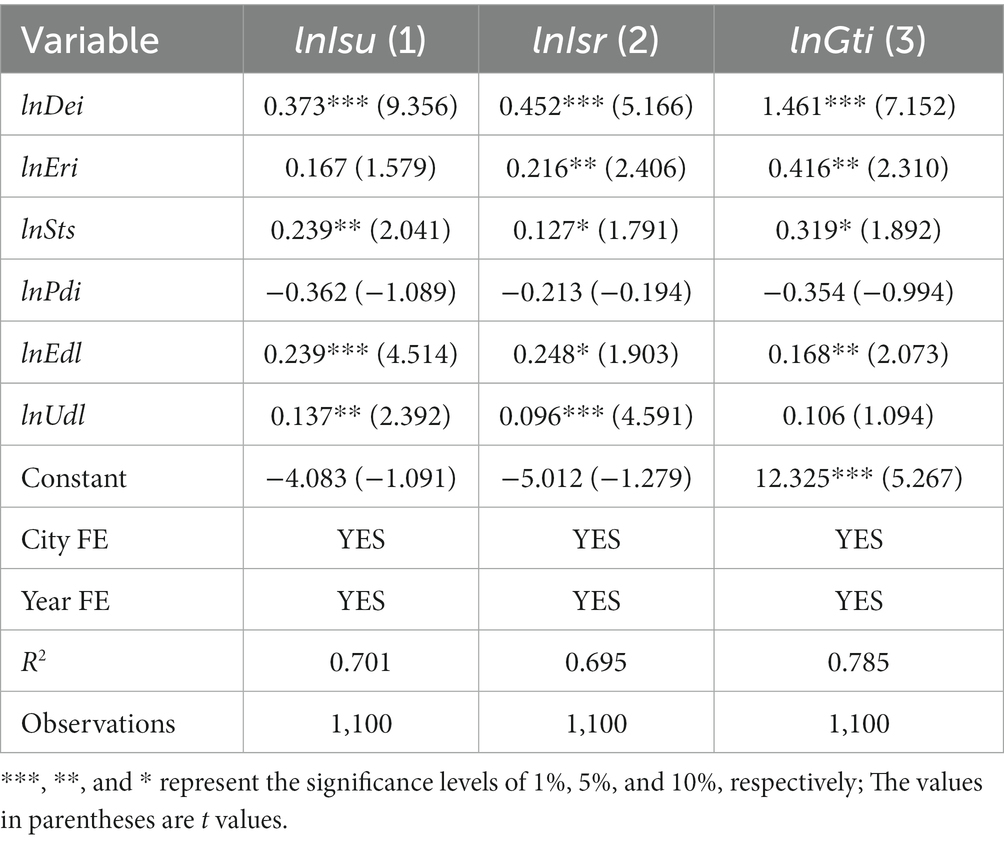
Table 4. Digital economy and mediating variables.
As shown in Table 5, the effects of Dei on CEI are all significant after adding three mediating variables separately. The specific analysis is as follows. In column (1), the coefficient of lnIsu on lnCEI is significantly positive at the significance level of 10%. The above definition of intermediary variables indicates that the digital economic development in the YREB region reduces CEI through industrial structure upgrading, which confirms hypothesis H2a. In columns (2) and (3), the coefficients of lnIsr and lnGti are significant at the 1% and 5% significance levels, respectively. It indicates that improving industrial structure rationalization and increasing green technology innovation can significantly reduce CEI. According to the above analysis, it can conclude that similar results, confirm H2b and H3.
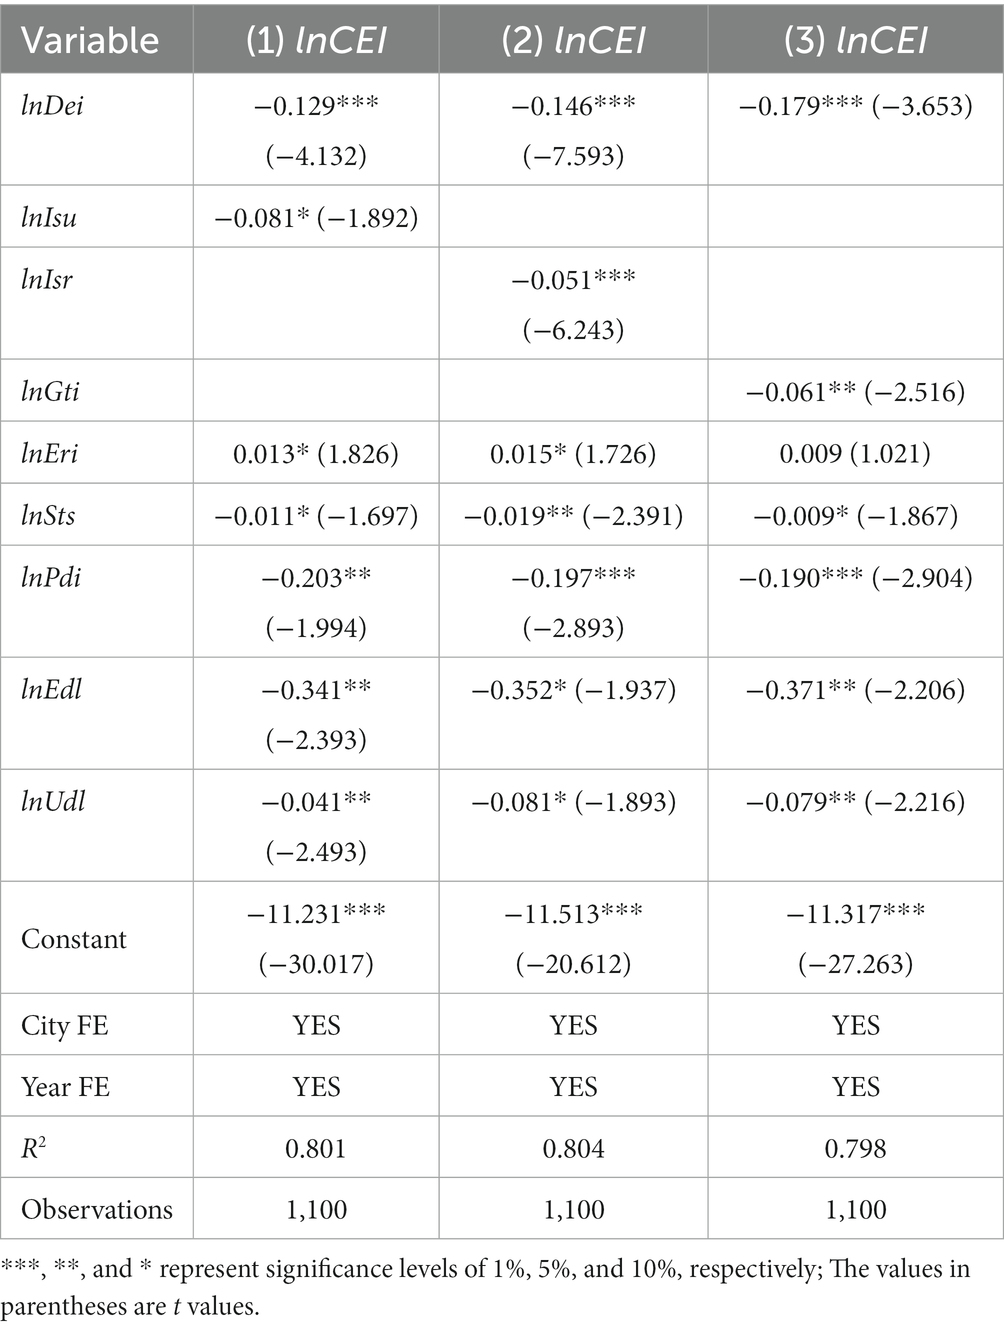
Table 5. Mediating variables and CEI.
The above research confirms that Dei can significantly reduce CEI in the YREB region after adding Isu and that Isu significantly reduces CEI. To strengthen the verification of hypotheses H2a, H2b, and H3, we adopt Bootstrap method to further test the mediating effect. The Bootstrap sampling method is about whether the product term of regression coefficient a and regression coefficient b contains the number 0 within the 95% confidence interval. If the number 0 is not included, it means it has a mediating effect. The results of Bootstrap test with 1,000 samples are presented in Table 6. The multiplication items of the regression coefficients of the three mediating variables do not contain the number 0 within the 95% confidence interval, and they are all significant at the significance level of 1%, which confirms the existence of mediating effects.
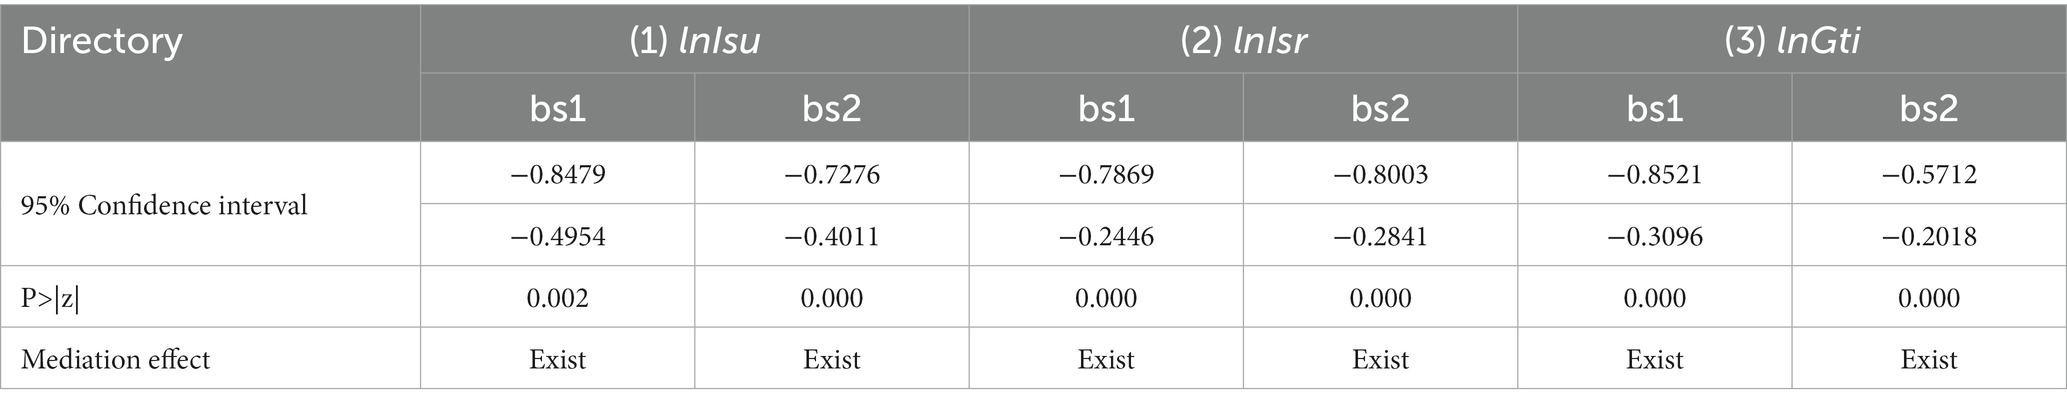
Table 6. Bootstrap test.
5. Spatial analysis of the digital economy and the CEI
5.1. Spatial distribution of the digital economy and the CEI
1. Spatial distribution of the digital economy. ArcGIS 10.8 is applied to visualize the spatial distribution of the digital economy in the YREB region, as presented in Figure 1. On the whole, the urban digital economy has been developing over the past 11 years. During this period, the digital economy index proliferated from 2011 to 2021, and the growth rate of many cities exceeded 100%, indicating that the digital economy was in a rapid development stage. Especially from 2015 to 2021, the digital economy development of downstream in the YREB region has changed from the original core “multi-point” sporadic distribution to the “group” aggregation form. This may be integrated with the Yangtze River Delta city cluster, which is beneficial to promote coordinated regional development and information sharing, and then enhances the formation of economies of scale and integration benefits.
2. The spatial distribution of CEI. It can be found from Figure 2. that the CEI of most cities has decreased significantly on the whole over the past 11 years, and it is more obvious in the eastern cities but sees less improvement in cities in the Midwest. Among these cities, Shanghai’s CEI has been getting lower every year. It indicates that Shanghai has paid attention to lower down carbon emissions while developing its economy, and has enhanced the development of low-carbon economy. However, Pu′er City has been at the high point of CEI and the decrease is not obvious, which may not only be related to its carbon reduction realization but also related to its special development stage of economic development and the general lack of improvement in surrounding cities, as well as the development level of the natural environment and digital economy.
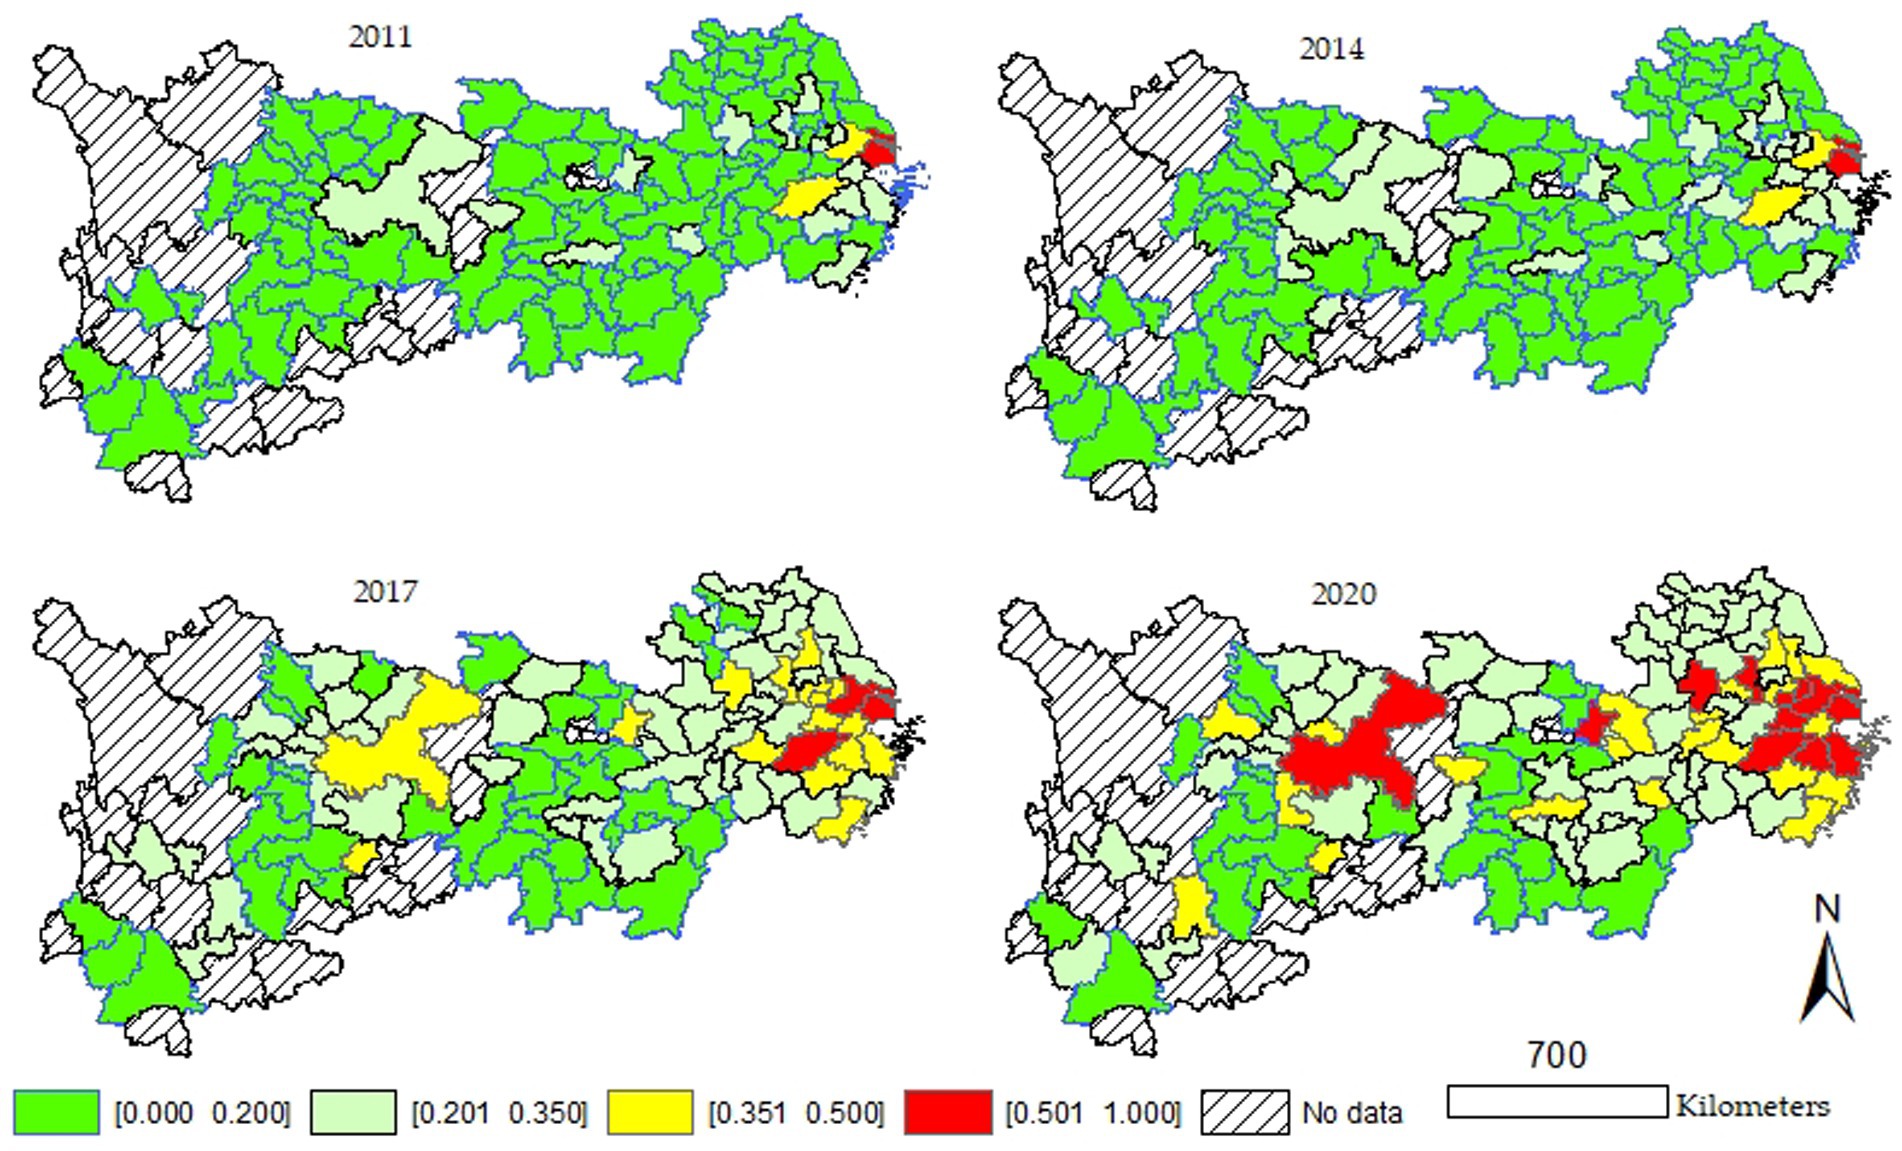
Figure 1. Spatial distribution of the digital economy.
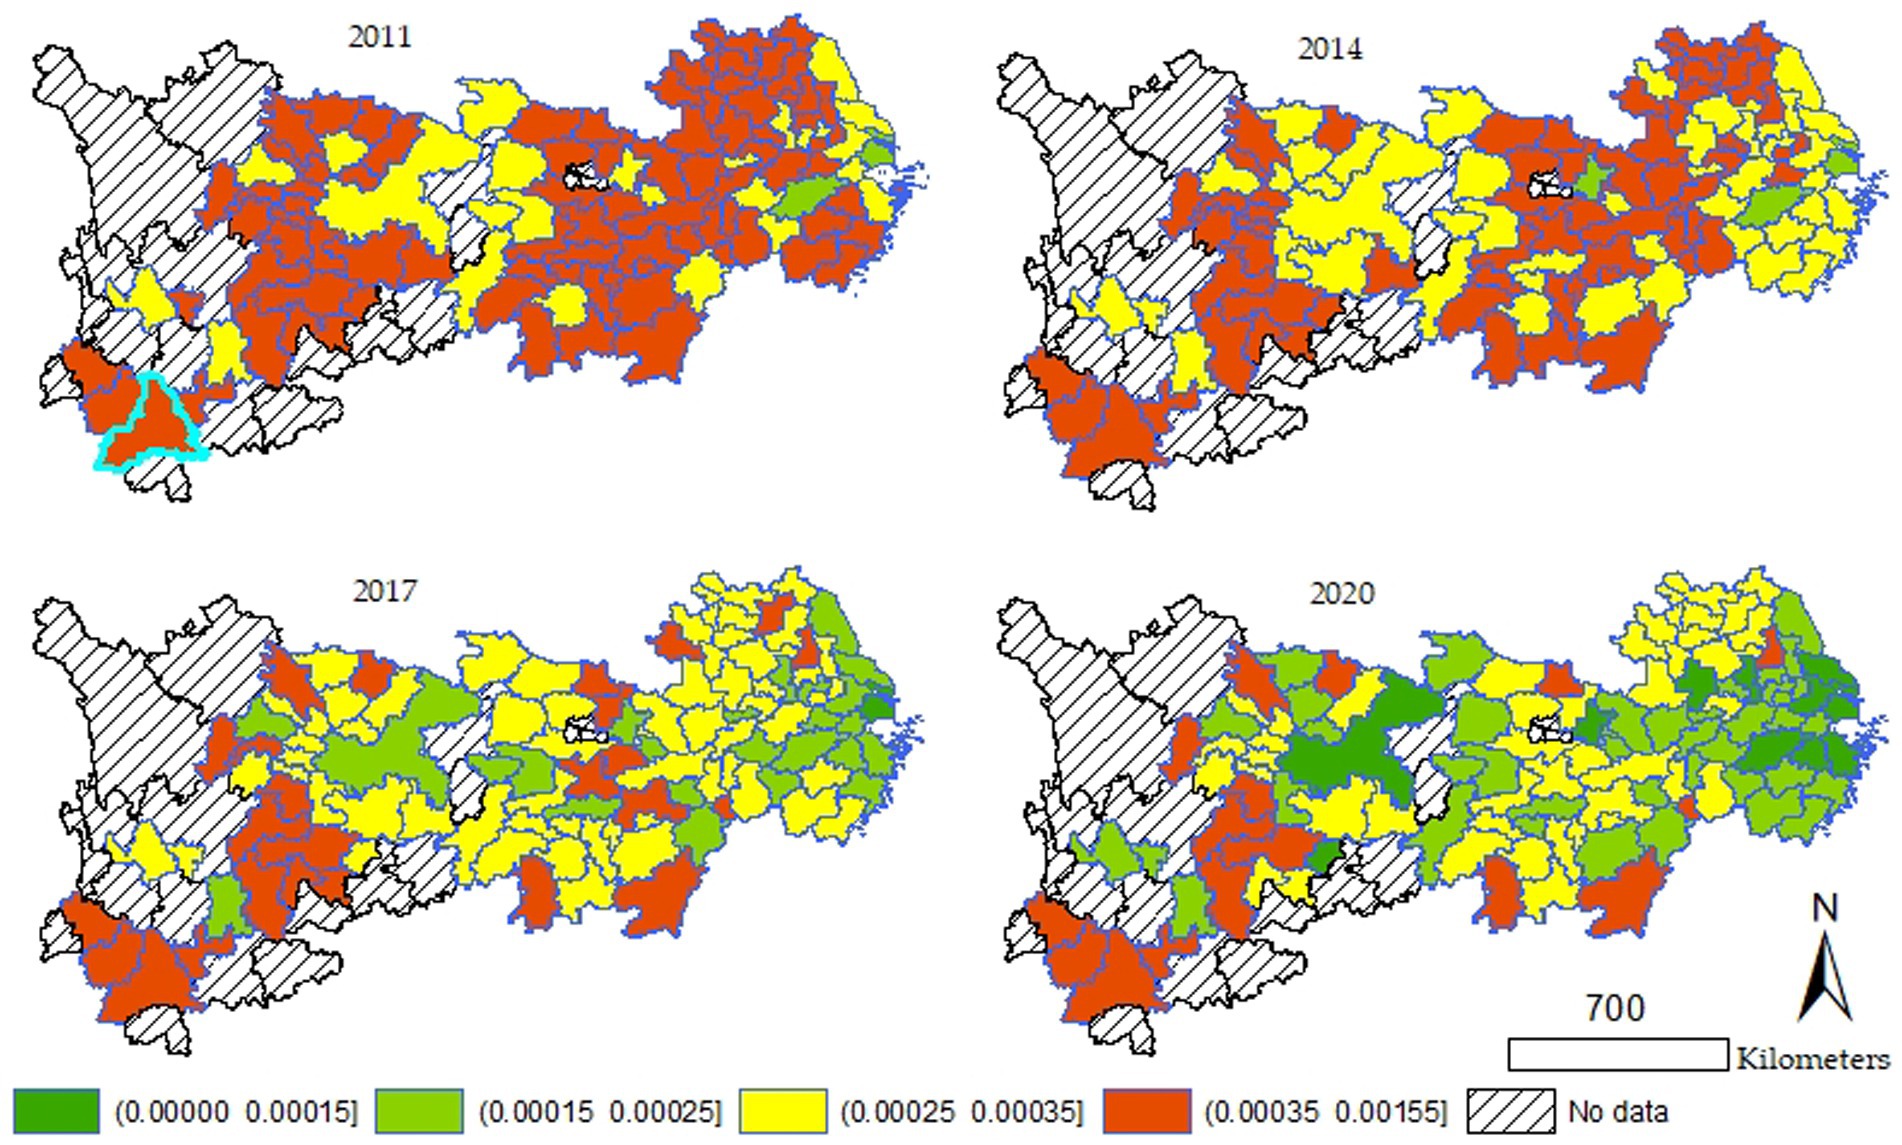
Figure 2. Spatial distribution of the CEI.
5.2. Spatial correlation analysis
The global Moran index is adopted to evaluate the spatial correlation of digital economy (Zeng et al., 2022; Zhao and Sun, 2022). Before performing a spatial correlation analysis, it needs to create and apply the spatial weight matrices. To analyze the spatial effect more scientifically and comprehensively, the study refers to the existing literature (Li et al., 2022; Zhao and Wang, 2022) and constructs four types of spatial weight matrices, and the results are shown in Table 7.
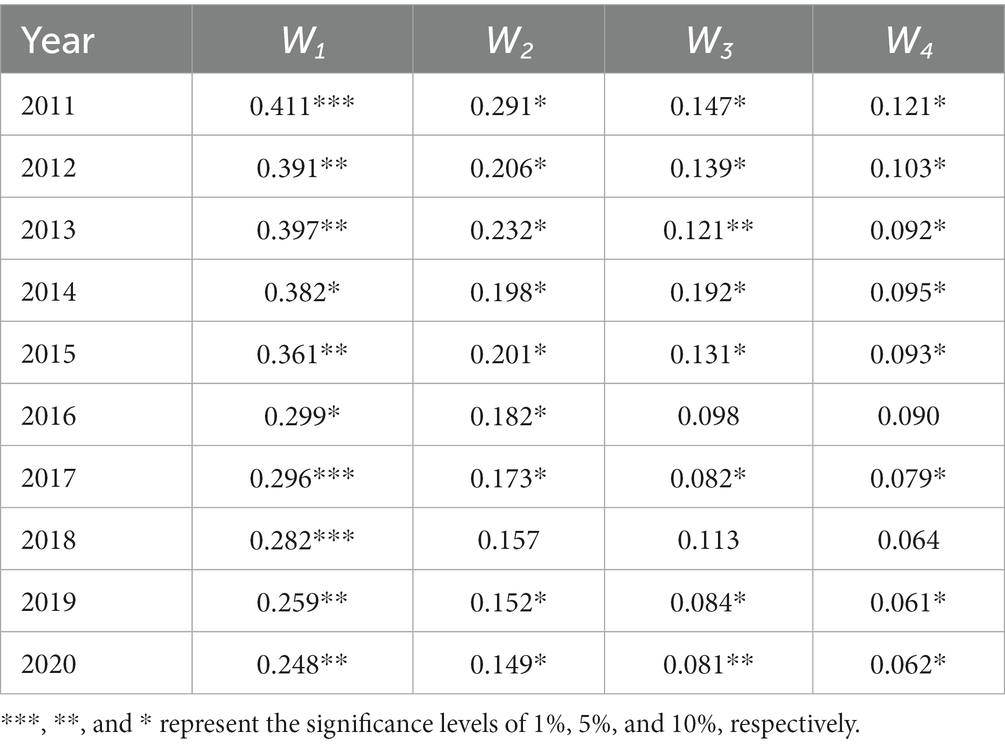
Table 7. Moran’s I statistic of the urban digital economy.
When Moran’s I>0, spatial correlation among regions is positive; Moran’s I<0 means that spatial correlation among regions is negative; Moran’s I = 0 indicates no correlation.
The results show that the global Moran value of the digital economy is between 0.248 and 0.411 and passes the 10% significance test, which indicates that the digital economy development shows a positive spatial correlation under W1. As can be seen from Table 6, by the same token, it can be found that Moran’s I >0 in terms of W2, W3, and W4, and can pass the 10% significance test in most years. In summary, the digital economy has apparent positive spillover effects.
5.3. Spatial effect analysis
To make it suitable for this study, firstly, the Wald test and LR test were operated, and the results showed that both of them passed the 1% significance test, thus rejecting the original hypothesis of using the SLM model or SEM model, proving that the spatial error term and spatial lag term existed at the same time, therefore, this study used the Spatial Durbin model (SDM) to start the analysis, and the calculated Hausman test results passed the 1% significance test, then the fixed effect model was chosen. Due to the existence of spatial correlation, it is difficult to carry out accurate estimation using the OLS method, so the Quasi-maximum likelihood estimate (QMLE) is used for estimation (Feng et al., 2022; Weixiang et al., 2022; Xie et al., 2022). The results are presented in Table 8. The coefficient of lnDei in column W1 is significant at the 1% significance level. It shows that the development of digital economy can greatly curbs the CEI in the YREB region, which is consistent with the previous outcome. The spatial coefficient of lnDei is significant at the 5% significant level, which tells us that the development of digital economy in a given city has a spillover effect on the CEI of the surrounding cities. The coefficients of lnDei in columns W2, W3, and W4 are all significant at the significance level of 1% and the interactive effect on the CEI of the surrounding cities are all significant at the 10% level. This suggests that the indirect impact of the digital economy on CEI is significant and cannot be ignored. That is, the development of digital economy has an inhibitory effect on CEI not only in local cities, but also in neighboring cities, and they are of same importance. The above findings confirm that the digital economy offers a positive spatial spillover effect.
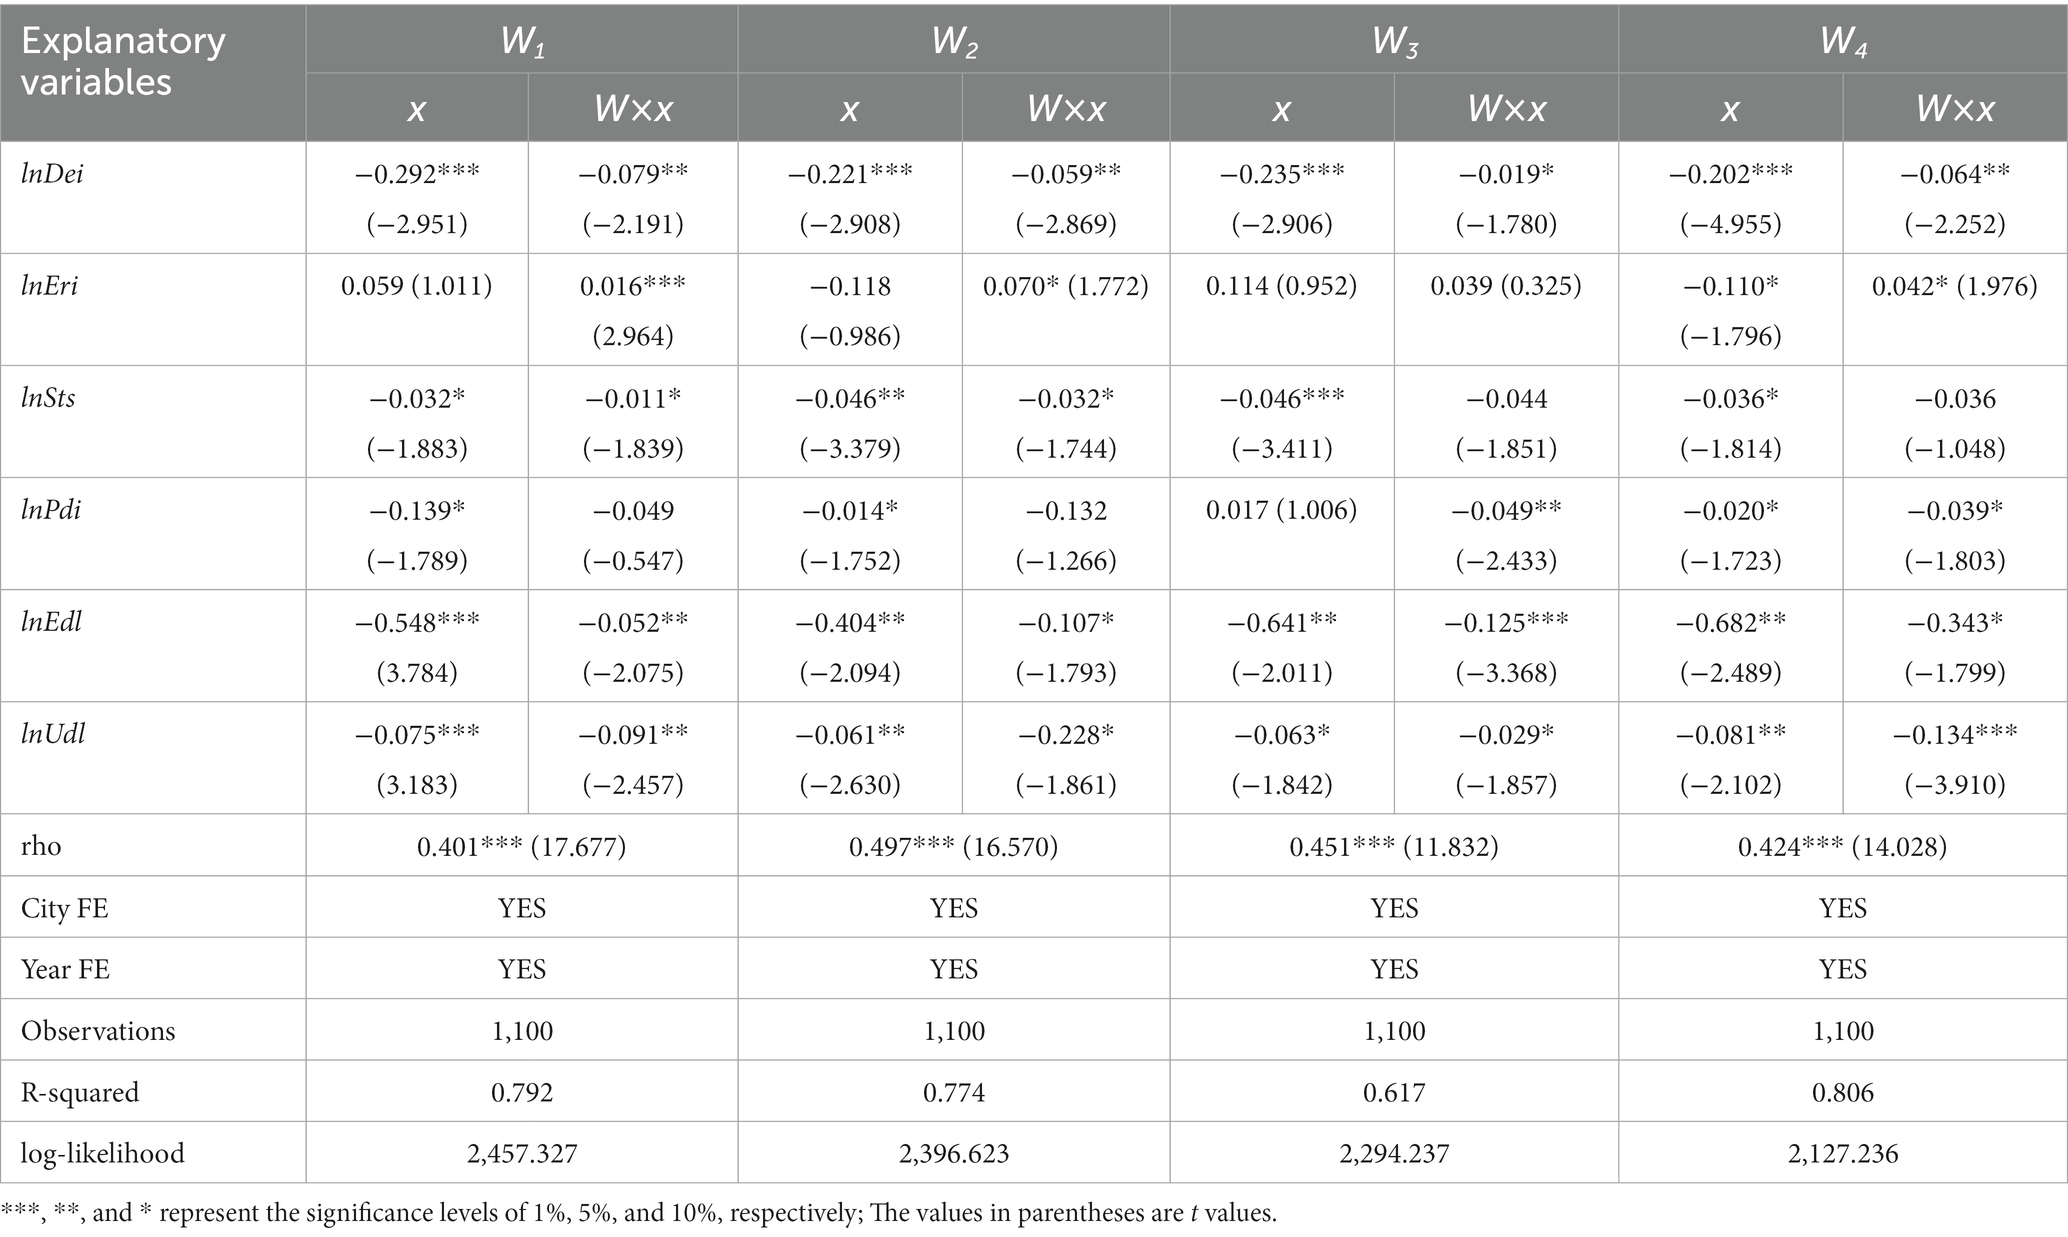
Table 8. Regression of results.
The coefficients of control variables in column W4 are significant, displaying that the environmental regulation, science and technology support, population density, and economic and urbanization development of the sample cities greatly influence the urban CEI. In the sixth line, the coefficient of lnEdl is significantly positive for reducing CEI in all spatial weight matrices. It indicates that economic development has beneficially promoted the reduction of CEI and has a spatial spillover effect on surrounding cities, showing that the carbon emissions per unit economy are significantly reduced, and the extensive economic development mode of the Yangtze River Economic Belt has been changing to intensive development and has entered the development stage on the right side of the Kunze curve. This may have something to do with the intensive green development guided by the government and the practice of the “Two Mountains Theory” (Ma et al., 2022a). The development of urbanization (the seventh line lnUdl) has beneficially promoted the reduction of CEI in the process of converting the rural population to the urban population, along with the further expansion of the urban scale and the further rationalization of the layout. The scale of industry, especially the tertiary industry, has realized the scale effect of population agglomeration, reduced energy consumption, improved the green intensive effect, and ultimately promoted the reduction of CEI. With the advancement of urbanization, people’s awareness of carbon reduction has been strengthened, which in turn has promoted the reduction of CEI, especially in the comparative effect and role model power of surrounding cities, which may explain why the spatial effects are so significant.
5.4. Spatial heterogeneity analysis
To further consider whether spatial heterogeneity exists in regions regarding the impact of the digital economy development on CEI, this study is carried out from the perspectives of sub-region and urban agglomeration. The division of regions (the upper, middle, and lower reaches of the Yangtze River Economic Belt) and urban agglomerations (Ma et al., 2022b) (the Yangtze River Delta urban agglomeration, the middle reaches of the Yangtze River and the Chengdu-Chongqing urban agglomeration) are covered in this study. Because the impact of spatial heterogeneity is mainly taken into consideration, subsequent studies based on the W1 are used to carry out the estimation. Based on the three regions in the upper, middle, and lower reaches of the Yangtze River Economic Belt and whether they belong to urban agglomerations, regional heterogeneity regarding the digital economy influencing CEI is tested, and the regression results are shown in Table 9.
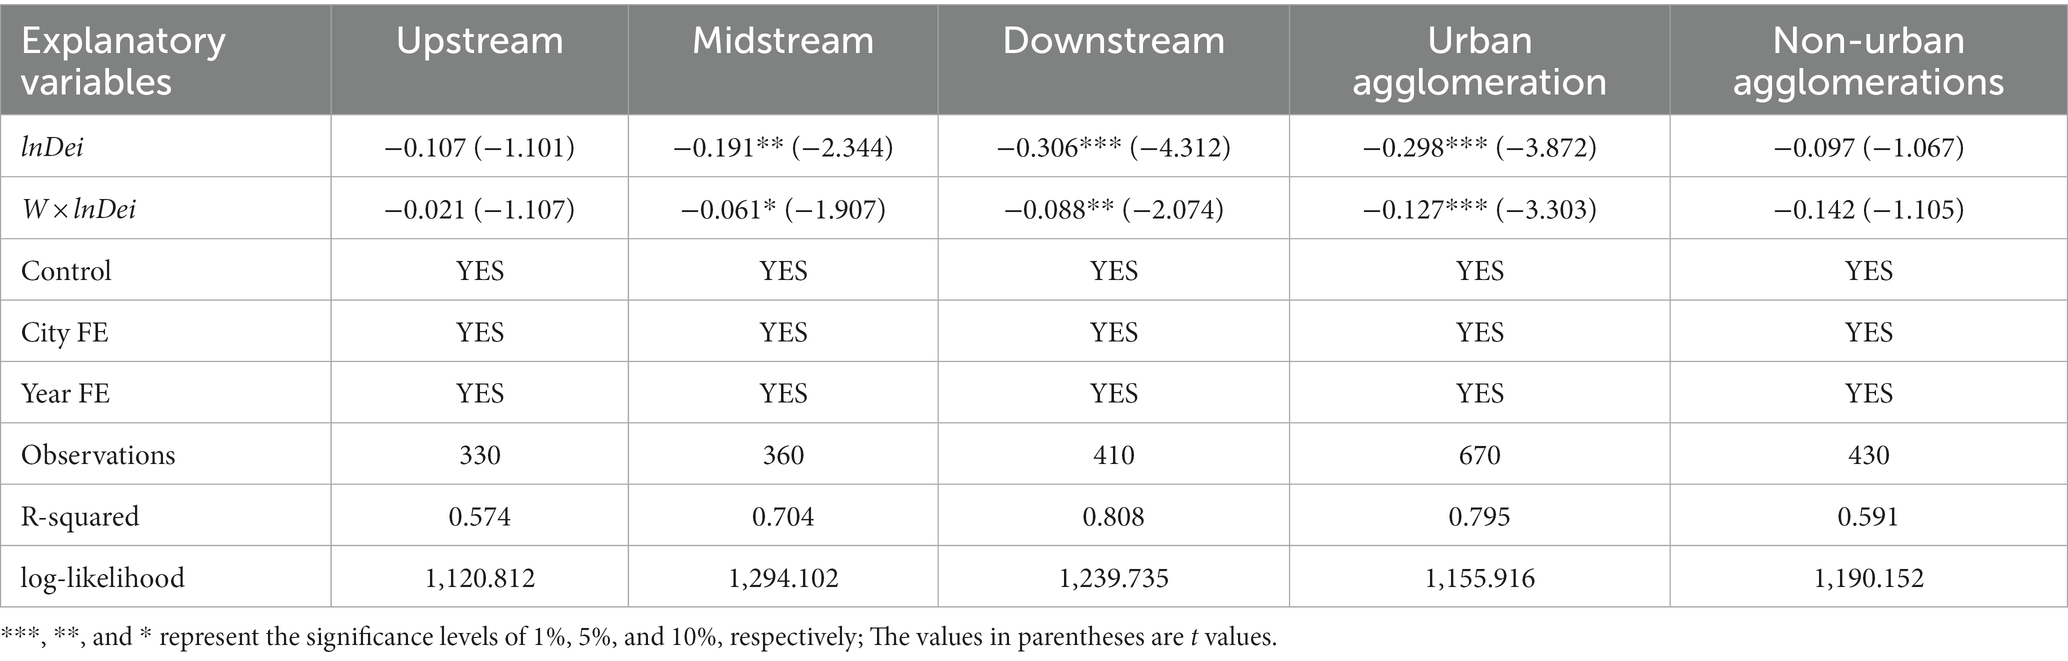
Table 9. Regression results of the spatial heterogeneity test.
In the downstream region, the digital economy has a significant inhibitory effect on CEI in the region, and will also significantly promote the decline of CEI in neighboring cities. The reason may be that the downstream region has more obvious advantages in the development of digital infrastructure and digital industry, and because the downstream region has gathered a large number of digital innovation talents and digital industry, it can better play the role of digital empowerment with various advantages, so the reduction of CEI is more obvious. In the midstream region, the development of the digital economy can reduce the CEI of cities in the region, and the effect on neighboring areas is also obvious. This may be because the cities in the central region are still in the stage of rapid digital development, the industrial layout and regional functionalization brought by the construction of digital infrastructure are reasonable and beneficial to the improvement of energy utilization, and the core cities in the midstream region have obvious advantages. In the upstream region, the digital economy development variables have not passed the significance test, which may be because the development of the digital economy in the upstream region is still in its infancy, and the level of digital development is generally disclosed (see Figure 1), which cannot form the diffusion effect with scale and agglomeration, and the effect of digital empowerment is minimal, which leads to the insignificant effect of the digital economy on the reduction of urban CEI.
From the perspective of urban agglomeration heterogeneity, the development of the digital economy can effectively reduce CEI within urban agglomerations and can affect neighboring areas through spillover effects and reduce the CEI of surrounding cities. In non-urban agglomeration areas, the development of the digital economy has no significant impact on the mitigation effect of urban CEI. This is mainly due to the relatively high level of digital economy development in cities in urban agglomerations (see Figure 1), the initial formation of scale and agglomeration effect, and the existence of preferential measures such as policy coordination and resource sharing within urban agglomerations, coupled with its own relatively high level of digital industrialization, so its role in reducing CEI is obvious. Non-urban agglomeration cities have limited geographical location advantages and resources, and in most areas the digital economy is in its infancy, resulting in a lack of obvious mitigation effects on urban CEI. Intuitively, the spatial evolution of CEI is from Figure 2. Can also be well-verified.
Therefore, considering the heterogeneity of spatial regions, the digital economy dividends in downstream areas and cities belonging to urban agglomerations are more fully released, and their impact on CEI is more significant, while the effect of the digital economy in upstream and non-urban agglomeration cities is not obvious.
5.5. Decomposition of the role of digital economy on CEI
To further investigate the specific factors that affect urban CEI in the development of digital economy, Digital industry development, Digital infrastructure, Digital innovation capabilities and Digital finance in the digital economy indicator system are used as independent variables to conduct empirical tests, whose results are shown in Table 10. From the results in column (1) of Table 10, it is clear that digital infrastructure construction does not have a significant effect on the CEI of the city. This indicates that the increase in digital infrastructure coverage produces a double-from effect. On the one hand, it promotes the formation of informal environmental regulations as well as digital empowerment to achieve energy saving, emission reduction, and economic development (Wen et al., 2022; Hanjin et al., 2023). On the other hand, the production and construction of digital economy facilities will generate large amounts of resources and energy consumption, and even pollute the environment, which in turn generates large amounts of carbon emissions. These two effects offset each other so that the effect of digital infrastructure on CEI in the region is not significant. However, digital infrastructure reduces the CEI of neighboring cities, which indicates that the environmental improvement effect generated by the coverage of digital economy facilities has some spillover effect (e.g., the spillover effect of information technology), affecting neighboring regions. From column (2) of Table 10, the development of the digital industry has a significant negative effect on the CEI of both the region and the neighboring regions, which indicates that the development of the digital economy industry has a double-slave effect, not only promoting economic development, but also having an emission reduction effect on urban carbon emissions. This may be that the development of digital industry promotes the transformation and upgrading of industrial structure leading to more reasonable layout. Meanwhile, it also promotes the development of traditional industrial production factor resources, turning them from low marginal returns into high marginal returns (Cheng et al., 2021). It not only promotes the optimization of factors and energy allocation, but also promotes the upgrading of energy structure and reduces urban carbon emissions (Zhao S. et al., 2022). From the results of column (3) in Table 10, digital innovation capacities have a significant pro-decrease effect on the CEI of cities. This indicates that the improvement of digital innovation capabilities is one of the paths through which the digital economy affects the CEI of cities, and hurts neighboring regions. Probably, because digital innovation has a significant spillover effect, and innovation factors spill over to promote the development of digital innovation in neighboring regions, which can better achieve resource optimization, and thus reduce the level of CEI in cities while promoting economic development. The results of column (4) are in Table 10 shows that the coefficients of digital inclusive finance are all significantly negative, which indicates that digital inclusive finance has a significant negative effect on urban CEI. This is because digital inclusive finance can improve the efficiency of urban life and financial services, and optimize resource allocation, for example, digital payment systems, digital currency and payment apps can reduce the carbon emission of residents’ offline behavior by realizing online life payment, online registration, ticket purchase, and online traffic ticket payment, etc. On the other hand, digital inclusive finance can also reduce carbon emissions in corporate financing behaviors by improving the financial accessibility of enterprises (He and Yang, 2021), which can facilitate and promote efficient economic and social development at the same time.

Table 10. Decomposition of the role of the digital economy on CEI.
5.6. Robustness test
We further analyze the influence of digital economy development on CEI in the YREB region. The Robustness test mainly involves substituting the dependent variables, excluding low-carbon pilot cities and municipalities directly under the central government, and using explanatory variables with a one-period lag as instrumental variables.
5.6.1. Substitution of the dependent variable
The level of economic development are important factors affecting carbon emission intensity. According to the available literature (Zhang and Liu, 2022), carbon emission efficiency is calculated by combining the input of production factors such as energy, and the output of economic development, including the undesirable output of carbon emission. Therefore, carbon emission efficiency is used to replace CEI for verification. The selection and calculation method of carbon emission efficiency indicators mainly refer to the previous related literature (Gao et al., 2021; Chen J. et al., 2022; Lyu et al., 2023), and the input indicators are selected from the factors of the production labor force, capital, and energy consumption, the desirable output is the GDP, and the undesirable output is the carbon emission at the end of the year. The super-SBM model (Lyu et al., 2023) is used to calculate the carbon emission efficiency. Carbon emission intensity was replaced by carbon emission efficiency, and the results were obtained as shown in Table 11.
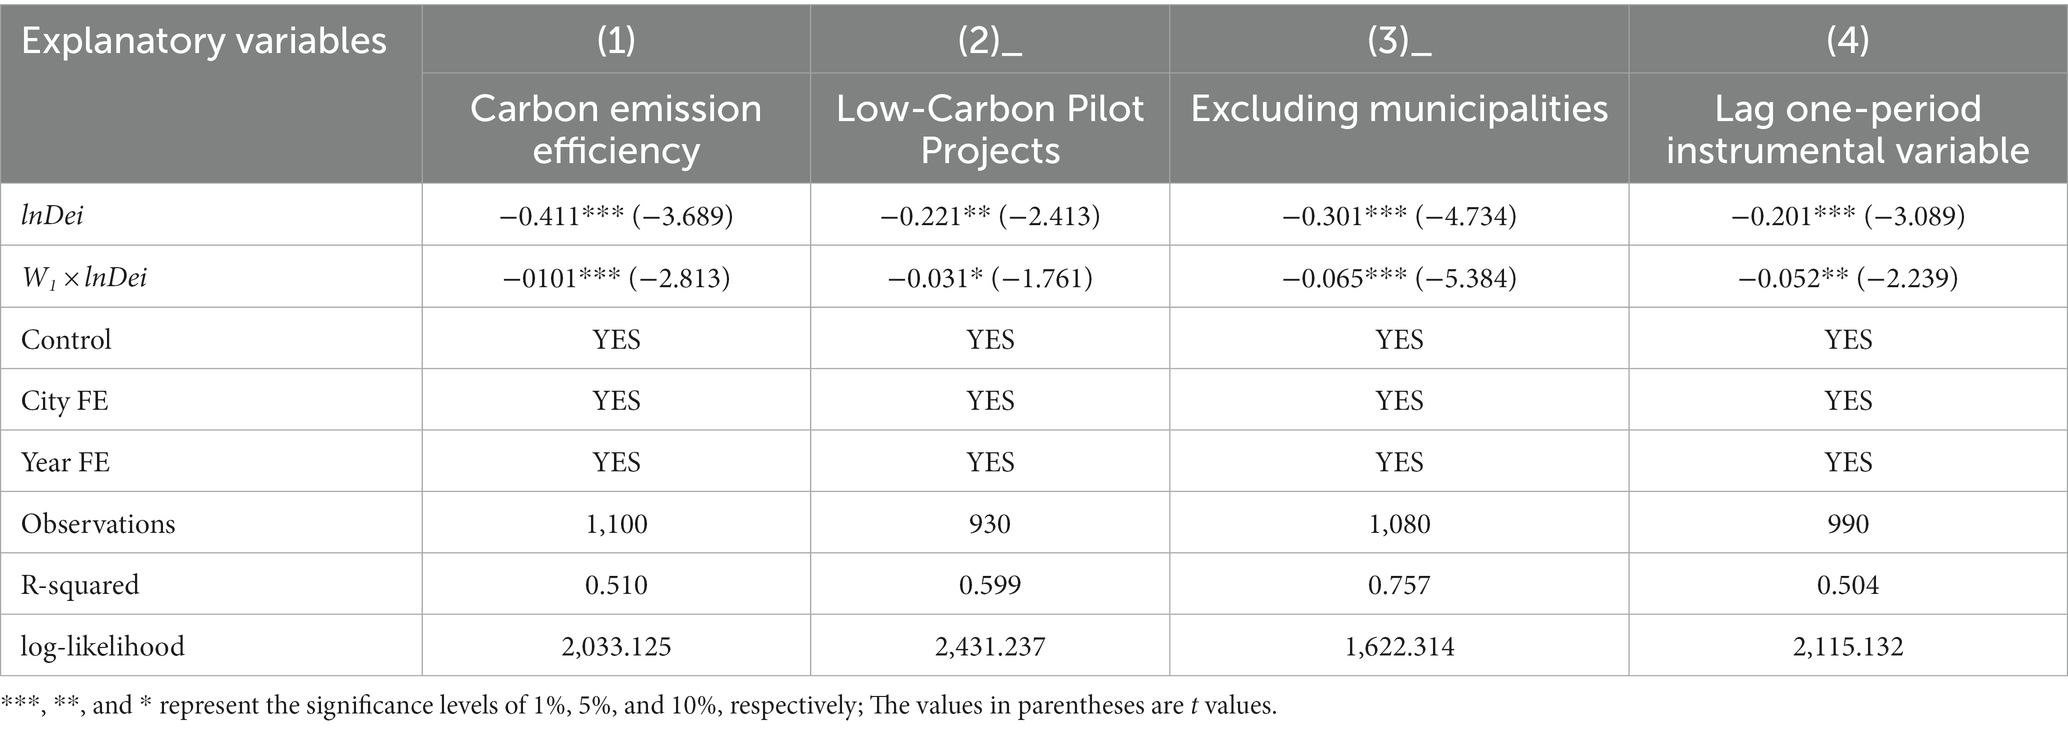
Table 11. The regression results of the robustness test.
5.6.2. Excluding the low-carbon pilot cities in China
China has been exploring the construction of low-carbon cities since 2008, and launched the first batch of low-carbon pilot areas in 2010, which has had a significant impact on local low-carbon development (Zhang, 2020). Therefore, low-carbon pilot cities are excluded from the YREB region for regression. The results are presented in column (2) of Table 11, which are consistent with the results in Table 7, proving that the SDM regression results are robust.
5.6.3. Excluding municipalities directly under the central government
Under China’s special regime, municipalities, which are directly under the central government, have distinct economic, political and aggregate economic advantages that some conventional cities do not have. Therefore, we exclude these cities for regression. Column (3) of Table 11 shows the regression results, which are significantly negative as well.
5.6.4. Endogenous test
The previous findings have shown that the digital economy development can reduce the CEI in cities. However, there may be endogeneity that makes the results potentially biased. Based on the topic of this paper and the reference to the relevant literature, endogeneity may come mainly from two sources. One is omitted variables (Zhao and Wang, 2022). Although this study has adopted control variables and fixed effects model, there are still some other elements that may affect the digital economy and CEI, such as local policies and emergencies, that are not included in the model. The other source is two-way causality. The other source is the two-way cause and effect of the digital economy and CEI. The digital economy development can reduce the urban CEI. However, in recent years, with the development of low-carbon cities and the implementation of various government environmental strategies, more high-tech enterprises attracted while the industrial structure transformation and upgrading was accelerated, which may strengthen the urban digital economy development.
In empirical studies, lagged endogenous variables are often used as instrumental variables to mitigate endogeneity (Zhao and Wang, 2022). Therefore, the lagged digital economy is an instrumental variable to investigate the relationship between the digital economy and CEI. The lagged variable is strongly correlated with the present value of the digital economy, which can affect the regional CEI through the present value. And conversely, the lagged digital economy will not be affected by the current CEI. Therefore, it is feasible to use the lagged digital economy as an instrumental variable of the digital economy. The regression results are shown in column (4) of Table 11. The coefficients of lnDei are close to that with SDM in Table 7. Therefore, it indicates that the regression results in Table 7 are robust.
6. Conclusions and policy implications
The digital economy development is an inevitable choice for cities to achieve low-carbon development. This paper studies the influencing mechanism and spatial spillover effects of digital economy development on CEI by applying two-way fixed effects model, mediating effect model and spatial Durbin model, based on the panel data of 110 cities in the YREB region from 2011 to 2020.
To cope with the drastic global climate change and achieve the “double carbon” target, strengthening digital transformation, improving the level of innovation, and continuously optimizing and upgrading the industrial structure are the key to China’s economic development. The digital economy development is a suitable choice for cities to carry out low-carbon development. Based on the data of 110 cities in the YREB from 2011 to 2020, this paper explores the influencing mechanism, spatial effect, regional heterogeneity, and single decomposition force of digital economy on CEI by using the double fixed effect model, mediated effect model and spatial Durbin model. The following findings were drawn: (1) The digital economy development can significantly reduces CEI in the YREB region. Environmental regulation, science and technology support, population density, economic and urbanization development can all affect CEI. (2) The results of mediating effect test show that the digital economy development can promote the rationalization and upgrading of industrial structure, and enhance cities’ green technology innovation as well, which eventually result in decreasing the CEI in the YREB region through the intermediary effect. (3) The digital economy shows an obvious positive spatial correlation with a spatial spillover effect on CEI. (4) There is an obvious spatial heterogeneity in digital economy’s effect on CEI. The inhibitory impact of digital economy development on carbon emissions in the eastern regions is strong. Meanwhile, cities located in the urban agglomerations are more affected by the digital economy. (5) Except for digital infrastructure, all components of the digital economy are effective in directly reducing CEI in local cities, and present obvious spatial spillover effects of reducing CEI in neighboring cities.
Based on the findings in this study, the following policy recommendations are made.
1. The government of the YREB region needs to further support the development of digital economy comprehensively in order to take full advantage of digital economy in reducing CEI. First, the government should formulate and improve the policies and regulations related to the digital economy development, form a good institutional guarantee and market atmosphere for the digital economy development, especially in the construction of digital infrastructure. Secondly, the government should improve the establishment of cloud service platforms bearing digital technologies, and promote the clustering and synergistic effect of virtual industrial space. The government should play the unified coordination mechanism of urban clusters, improve the efficiency of resource utilization, and thus better play a synergistic role of the whole industrial chain. Third, it should strengthen the practical use of digital technology in enterprise production process, residents’ life and urban governance, enhance the construction of digital infrastructure, improve the efficiency of data circulation, and provide technical support for urban carbon emission reduction.
2. The government of the YREB region should strengthen the regional digital synergy to promote industrial structure optimization and green technology innovation. Firstly, each government in the region should guide local enterprises to optimize and transform and upgrade their industries and encourage them to carry out green technology innovation according to the overall layout of the national region and combined with the actual situation of the region. Secondly, the government should formulate special policies, such as purchasing services, special loans and other support policies, to promote local enterprises to realize digital transformation. The government should provide support for small-scale service and manufacturing enterprises who have difficulties in realizing digitalization quickly, so as to improve the digitalization level of industries in the region as a whole, thereby achieving energy saving, lowering CEI, and achieving better development. Third, the government should strengthen the protection and support of green intellectual property rights, and at the same time, eliminate or upgrade the backward production capacity. The government should promote the buyout of some general and effective green technology patents to provide motivation for the green technology innovation in enterprises, and the effectiveness of green patents. It should achieve targeted production reduction or even shutdown some enterprises that cannot achieve transformation and upgrading or green transformation.
3. The Spatio-temporal evolutionary characteristics of the digital economy development show obvious gaps among cities in the YREB region. Based on the differences in the digital resources and digital development of various cities, first, the government should formulate digital development strategies according to local conditions, make good use of the radiation-driven effect of Shanghai and Zhejiang’s digitalization and carbon emission reduction, and create digital industries with regional characteristics. Second, the government should develop competitive tax incentives and fiscal science and technology spending policies to support relatively backward cities in digital economy development. In addition, the government should use measures such as improving service networking, nurturing digital professionals, and accelerating digital infrastructure construction to reduce the digital economy development gap between cities.
The shortcomings of this study deserve further exploration. First, the limitations of the data, because county-level data is incomplete, limit the further use of county data for dual validation of indicator variables and the selection of research samples, and future county-based research is also worth looking into. Second, although the current study findings pass the robustness test, the magnitude of the external shock effect and the timing of the effect deserves further in-depth excavation. Finally, although we have systematically studied the differences between regions in the east, central, and west using the YREB as an example, and also studied the different magnitudes of forces between urban and non-urban agglomerations, etc., it is also worthwhile to research, such as the coastal urban belt between the north and the south or the Hu Huanyong line based on the geographical perspective.
Data availability statement
The original contributions presented in the study are included in the article/Supplementary material, further inquiries can be directed to the corresponding authors.
Author contributions
LM and YH: conceptualization, formal analysis, and writing–original draft. GL and SH: funding acquisition, resources, and supervision. HL and JZ: investigation, data curation. LM and SH: methodology. YX, DX and HL: project administration, software, and visualization. YH: validation and writing–review and editing. All authors contributed to the article and approved the submitted version.
Funding
This work was funded by the Anhui Educational Committee (Grant number: SKHS2020B02).
Conflict of interest
The authors declare that the research was conducted in the absence of any commercial or financial relationships that could be construed as a potential conflict of interest.
Publisher’s note
All claims expressed in this article are solely those of the authors and do not necessarily represent those of their affiliated organizations, or those of the publisher, the editors and the reviewers. Any product that may be evaluated in this article, or claim that may be made by its manufacturer, is not guaranteed or endorsed by the publisher.
Footnotes
1. ^https://www.bp.com.cn/content/dam/bp/country-sites/zh_cn/china/home/reports/statistical-review-of-world-energy/2021/BP_Stats_2021.pdf (2022-10-01).
References
Banruo, Z., and Zijie, L. (2021). Can high-speed rail promote low-carbon economy? J. Huazhong Univ. Sci. Technol. 35, 131–140. doi: 10.19648/j.cnki.jhustss1980.2021.01.15
Cary, M. (2020). Molecules of inefficiency: how tariffs impact carbon intensities, carbon dioxide emissions, and the environment. Sci. Total Environ. 713:136531. doi: 10.1016/j.scitotenv.2020.136531
Chen, J., Gao, M., Hou, W., Song, M., Liu, X., Yu, L., et al. (2020). County-level CO2 emissions and sequestration in China during 1997–2017. Sci. Data 7:391. doi: 10.1038/s41597-020-00736-3
Chen, J., Gui, W., and Huang, Y. (2022). The impact of the establishment of carbon emission trade exchange on carbon emission efficiency. Environ. Sci. Pollut. Res. Int. 30, 19845–19859. doi: 10.1007/s11356-022-23538-z
Chen, X., Mao, S., Lv, S., and Fang, Z. (2022). A study on the non-linear impact of digital technology innovation on carbon emissions in the transportation industry. Int. J. Environ. Res. Public Health 19:12432. doi: 10.3390/ijerph191912432
Chen, J., Yuan, H., Tian, X., Zhang, Y., and Shi, F. (2019). What determines the diversity of CO2 emission patterns in the Beijing-Tianjin-Hebei region of China? An analysis focusing on industrial structure change. J. Clean. Prod. 228, 1088–1098. doi: 10.1016/j.jclepro.2019.04.267
Cheng, S., Chen, Y., Meng, F., Chen, J., Liu, G., and Song, M. (2021). Impacts of local public expenditure on CO2 emissions in Chinese cities: A spatial cluster decomposition analysis. Resour. Conserv. Recycl. 164:105217. doi: 10.1016/j.resconrec.2020.105217
Dong, F., Hu, M., Gao, Y., Liu, Y., Zhu, J., and Pan, Y. (2022). How does digital economy affect carbon emissions? Evidence from global 60 countries. Sci. Total Environ. 852:158401. doi: 10.1016/j.scitotenv.2022.158401
Dou, Q., and Gao, X. (2022). The double-edged role of the digital economy in firm green innovation: micro-evidence from Chinese manufacturing industry. Environ. Sci. Pollut. Res. Int. 29, 67856–67874. doi: 10.1007/s11356-022-20435-3
Feng, Y., Zou, L., Yuan, H., and Dai, L. (2022). The spatial spillover effects and impact paths of financial agglomeration on green development: evidence from 285 prefecture-level cities in China. J. Clean. Prod. 340:130816. doi: 10.1016/j.jclepro.2022.130816
Gao, P., Yue, S., and Chen, H. (2021). Carbon emission efficiency of China’s industry sectors: from the perspective of embodied carbon emissions. J. Clean. Prod. 283:124655. doi: 10.1016/j.jclepro.2020.124655
Gu, R., Li, C., Yang, Y., Zhang, J., and Liu, K. (2023). Online ahead of print). Impact of digital economy development on carbon emission intensity in the Beijing-Tianjin-Hebei region: a mechanism analysis based on industrial structure optimization and green innovation. Environ. Sci. Pollut. Res. doi: 10.1007/s11356-023-25140-3
Guo, F., Wang, J., Wang, F., Cheng, Z., Kong, T., and Zhang, X. (2020). Measuring China's digital financial inclusion: index compilation and spatial characteristics. China Econ. Q. 19, 1401–1418. doi: 10.13821/j.cnki.ceq.2020.03.12
Halbert, L. (2011). Collaborative and collective: reflexive co-ordination and the dynamics of open innovation in the digital industry clusters of the Paris region. Urban Stud. 49, 2357–2376. doi: 10.1177/0042098011427186
Hampton, S. E., Strasser, C. A., Tewksbury, J. J., Gram, W. K., Budden, A. E., Batcheller, A. L., et al. (2013). Big data and the future of ecology. Front. Ecol. Environ. 11, 156–162. doi: 10.1890/120103
Hanjin, X., Xi, T., Jun, L., Shuang, Q., and Chunmei, Y. (2023). Does information infrastructure promote low-carbon development? Evidence from the "broadband China" pilot policy. Int. J. Environ. Res. Public Health 20:962. doi: 10.3390/ijerph20020962
He, M., and Yang, X. (2021). Digital inclusive finance, carbon emissions and total factor productivity. Finance Forum 26, 18–25. doi: 10.16529/j.cnki.11-4613/f.2021.02.004
Kafouros, M. I. (2006). The impact of the internet on R&D efficiency: theory and evidence. Technovation 26, 827–835. doi: 10.1016/j.technovation.2005.02.002
Li, J. L., Chen, L. T., Chen, Y., and He, J. W. (2022). Digital economy, technological innovation, and green economic efficiency-empirical evidence from 277 cities in China. Manag. Decis. Econ. 43, 616–629. doi: 10.1002/mde.3406
Li, Z., and Wang, J. (2022). The dynamic impact of digital economy on carbon emission reduction: evidence City-level empirical data in China. J. Clean. Prod. 351:131570. doi: 10.1016/j.jclepro.2022.131570
Li, Y., Yang, X., Ran, Q., Wu, H., Irfan, M., and Ahmad, M. (2021). Energy structure, digital economy, and carbon emissions: evidence from China. Environ. Sci. Pollut. Res. Int. 28, 64606–64629. doi: 10.1007/s11356-021-15304-4
Li, S., Zhou, C., and Wang, S. (2019). Does modernization affect carbon dioxide emissions? A panel data analysis. Sci. Total Environ. 663, 426–435. doi: 10.1016/j.scitotenv.2019.01.373
Liu, F., and Liu, C. (2019). Regional disparity, spatial spillover effects of urbanisation and carbon emissions in China. J. Clean. Prod. 241:118226. doi: 10.1016/j.jclepro.2019.118226
Lv, T., Hu, H., Zhang, X., Xie, H., Wang, L., and Fu, S. (2022). Spatial spillover effects of urbanization on carbon emissions in the Yangtze River Delta urban agglomeration, China. Environ. Sci. Pollut. Res. 29, 33920–33934. doi: 10.1007/s11356-021-17872-x
Lyu, K., Yang, S., Zheng, K., and Zhang, Y. (2023). How does the digital economy affect carbon emission efficiency? Evidence from Energy Consumption and Industrial Value Chain. Energies 16:761. doi: 10.3390/en16020761
Ma, L., Hong, Y., and Chen, X. (2022a). Can green economy and ecological welfare achieve synergistic development? The perspective of the "two mountains" theory. Int. J. Environ. Res. Public Health 19:6460. doi: 10.3390/ijerph19116460
Ma, L., Hong, Y., Chen, X., and Quan, X. (2022b). Can green innovation and new urbanization be synergistic development? Empirical evidence from Yangtze River Delta City Group in China. Sustainability 14:5765. doi: 10.3390/su14105765
Ma, Q., Tariq, M., Mahmood, H., and Khan, Z. (2022). The nexus between digital economy and carbon dioxide emissions in China: the moderating role of investments in research and development. Technol. Soc. 68:101910. doi: 10.1016/j.techsoc.2022.101910
Panpan, C., Yuan, Z., Lisha, H., Siyou, X., Xin, X., and Wenmin, T. (2020). Evaluation on the effectiveness of provincial emission reductionin the process of carbon emission intensity decline in China'senergy industry. Geogr. Res. 39, 1864–1878. doi: 10.11821/dlyj020190688
Paunov, C., and Rollo, V. (2016). Has the internet fostered inclusive innovation in the developing world? World Dev. 78, 587–609. doi: 10.1016/j.worlddev.2015.10.029
Ren, S., Hao, Y., Xu, L., Wu, H., and Ba, N. (2021). Digitalization and energy: how does internet development affect China's energy consumption? Energy Econ. 98:105220. doi: 10.1016/j.eneco.2021.105220
Siqin, Z., Niu, D., Li, M., Zhen, H., and Yang, X. (2022). Carbon dioxide emissions, urbanization level, and industrial structure: empirical evidence from North China. Environ. Sci. Pollut. Res. 29, 34528–34545. doi: 10.1007/s11356-021-17373-x
Sun, B., Li, J., Zhong, S., and Liang, T. (2023). Impact of digital finance on energy-based carbon intensity: evidence from mediating effects perspective. J. Environ. Manag. 327:116832. doi: 10.1016/j.jenvman.2022.116832
Tang, C., Xu, Y., Hao, Y., Wu, H., and Xue, Y. (2021). What is the role of telecommunications infrastructure construction in green technology innovation? A firm-level analysis for China. Energy Econ. 103:105576. doi: 10.1016/j.eneco.2021.105576
Wang, J., Dong, K., Dong, X., and Taghizadeh-Hesary, F. (2022). Assessing the digital economy and its carbon-mitigation effects: the case of China. Energy Econ. 113:106198. doi: 10.1016/j.eneco.2022.106198
Wang, H., and Guo, J. (2022). Impacts of digital inclusive finance on CO2 emissions from a spatial perspective: evidence from 272 cities in China. J. Clean. Prod. 355:131618. doi: 10.1016/j.jclepro.2022.131618
Wang, Y., Hou, L., and Zhu, J. (2022). Whether urban innovation can contribute to the development of low-carbon economy: the impact assessment and mechanism analysis of pilot policies of innovation-oriented cities on carbon intensity. Sci. Technol. Progress Countermeas. 39, 39–49.
Wang, R., Zameer, H., Feng, Y., Jiao, Z., Xu, L., and Gedikli, A. (2019). Revisiting Chinese resource curse hypothesis based on spatial spillover effect: a fresh evidence. Res. Policy 64:101521. doi: 10.1016/j.resourpol.2019.101521
Wang, C., Zhan, J., Bai, Y., Chu, X., and Zhang, F. (2019). Measuring carbon emission performance of industrial sectors in the Beijing-Tianjin-Hebei region, China: a stochastic frontier approach. Sci. Total Environ. 685, 786–794. doi: 10.1016/j.scitotenv.2019.06.064
Weixiang, X., Jianping, Z., and Chengjun, L. (2022). The impact of digital economy on urban carbon emissions: based on the analysis of spatial effects. Geogr. Res. 41, 111–129. doi: 10.11821/dlyj020210459
Wen, H., Liang, W., and Lee, C.-C. (2022). Urban broadband infrastructure and green total-factor energy efficiency in China. Util. Policy 79:101414. doi: 10.1016/j.jup.2022.101414
Xiaohan, Y., Yuanjie, D., Lina, P., and Zhide, J. (2022). Study on the impact of digital economy development on carbon emission intensity of urban agglomerations and its mechanism. Environ. Sci. Pollut. Res. Int. 30, 33142–33159. doi: 10.1007/s11356-022-24557-6
Xie, F., Liu, Y., and Yang, M. (2022). Spatial spillover effect of environmental regulation on regional economic growth. Environ. Dev. Sustain. doi: 10.1007/s10668-022-02366-8
Xie, R., Wei, D., Han, F., Lu, Y., Fang, J., Liu, Y., et al. (2019). The effect of traffic density on smog pollution: evidence from Chinese cities. Technol. Forecast. Soc. Chang. 144, 421–427. doi: 10.1016/j.techfore.2018.04.023
Xu, L., Fan, M., Yang, L., and Shao, S. (2021). Heterogeneous green innovations and carbon emission performance: evidence at China's city level. Energy Econ. 99:105269. doi: 10.1016/j.eneco.2021.105269
Yan, X., Deng, Y., Peng, L., and Jiang, Z. (2022). Study on the impact of digital economy development on carbon emission intensity of urban agglomerations and its mechanism. Environ. Sci. Pollut. Res. Int. 30, 1–18. doi: 10.1007/s11356-022-24557-6
Yang, J., Li, X., and Huang, S. (2020). Impacts on environmental quality and required environmental regulation adjustments: a perspective of directed technical change driven by big data. J. Clean. Prod. 275:124126. doi: 10.1016/j.jclepro.2020.124126
Yi, M., Liu, Y., Sheng, M. S., and Wen, L. (2022). Effects of digital economy on carbon emission reduction: new evidence from China. Energy Policy 171:113271. doi: 10.1016/j.enpol.2022.113271
Yigen, W., and Zhen, F. K. Z. (2021). Spatial convergence of inter-provincial eco-efficiency in China. J. China Agricult. Univ. 35, 131–140. doi: 10.11841/j.issn1007-4333.2019.02.22
Yu, H., and Zhu, Q. (2023). Impact and mechanism of digital economy on China's carbon emissions: from the perspective of spatial heterogeneity. Environ. Sci. Pollut. Res. Int. 30, 9642–9657. doi: 10.1007/s11356-022-22552-5
Yue, J., Zhu, H., and Yao, F. (2021). Does industrial transfer change the spatial structure of CO2 emissions?-evidence from Beijing-Tianjin-Hebei region in China. Int. J. Environ. Res. Public Health 19:322. doi: 10.3390/ijerph19010322
Zeng, S., Li, G., Wu, S., and Dong, Z. (2022). The impact of green technology innovation on carbon emissions in the context of carbon neutrality in China: evidence from spatial spillover and nonlinear effect analysis. Int. J. Environ. Res. Public Health 19:730. doi: 10.3390/ijerph19020730
Zhang, H. (2020). Can low carbon city pilot policies reduce carbon emissions? Evidence from a quasi-natural experiment. Bus. Manag. J. 6, 25–41. doi: 10.19616/j.cnki.bmj.2020.06.002
Zhang, A., Deng, R., and Wu, Y. (2022). Does the green credit policy reduce the carbon emission intensity of heavily polluting industries? -evidence from China's industrial sectors. J. Environ. Manag. 311:114815. doi: 10.1016/j.jenvman.2022.114815
Zhang, W., Li, G., and Guo, F. (2022a). Does carbon emissions trading promote green technology innovation in China? Appl. Energy 315:119012. doi: 10.1016/j.apenergy.2022.119012
Zhang, M., and Liu, Y. (2022). Influence of digital finance and green technology innovation on China's carbon emission efficiency: empirical analysis based on spatial metrology. Sci. Total Environ. 838:156463. doi: 10.1016/j.scitotenv.2022.156463
Zhang, W., Liu, X., Wang, D., and Zhou, J. (2022b). Digital economy and carbon emission performance: evidence at China's city level. Energy Policy 165:112927. doi: 10.1016/j.enpol.2022.112927
Zhang, L., Mu, R., Zhan, Y., Yu, J., Liu, L., Yu, Y., et al. (2022). Digital economy, energy efficiency, and carbon emissions: evidence from provincial panel data in China. Sci. Total Environ. 852:158403. doi: 10.1016/j.scitotenv.2022.158403
Zhao, X., Dong, Y., and Gong, X. (2022). The digital economy and carbon productivity: evidence at China's City level. Sustainability 14:10642. doi: 10.3390/su141710642
Zhao, S., Peng, D., Wen, H., and Wu, Y. (2022). Nonlinear and spatial spillover effects of the digital economy on green total factor energy efficiency: evidence from 281 cities in China. Environ. Sci. Pollut. Res. Int. 27, 1–21. doi: 10.1007/s11356-022-22694-6
Zhao, M., and Sun, T. (2022). Dynamic spatial spillover effect of new energy vehicle industry policies on carbon emission of transportation sector in China. Energy Policy 165:112991. doi: 10.1016/j.enpol.2022.112991
Zhao, C., and Wang, B. (2022). How does new-type urbanization affect air pollution? Empirical evidence based on spatial spillover effect and spatial Durbin model. Environ. Int. 165:107304. doi: 10.1016/j.envint.2022.107304
Keywords: digital economy, carbon emission intensity, mediating mechanism, spatial effect, Yangtze River Economic Belt, China
Citation: Ma L, Hong Y, He S, Luo H, Liu G, Zheng J, Xia Y and Xiao D (2023) The influence of digital economy development on urban carbon emission intensity in the Yangtze River Economic Belt: Mediating mechanism and spatial effect. Front. Ecol. Evol. 11:1148505. doi: 10.3389/fevo.2023.1148505
Edited by:
Andrzej Klimczuk, Warsaw School of Economics, PolandReviewed by:
Huwei Wen, Nanchang University, ChinaXin Zhao, Anhui University of Finance and Economics, China
Kaiyang Zhong, Zhejiang University, China
Shulei Cheng, Southwestern University of Finance and Economics, China
Copyright © 2023 Ma, Hong, He, Zheng, Liu and Luo. This is an open-access article distributed under the terms of the Creative Commons Attribution License (CC BY). The use, distribution or reproduction in other forums is permitted, provided the original author(s) and the copyright owner(s) are credited and that the original publication in this journal is cited, in accordance with accepted academic practice. No use, distribution or reproduction is permitted which does not comply with these terms.
*Correspondence: Yuanxiao Hong, aHl4MDIxQHpqbnUuZWR1LmNu; Shouchao He, aHNjQHd6dXQuZWR1LmNu