 Feng Peng
 Xichun Zhang
- 1School of Economics and Management, China Three Gorges University, Yichang, China
- 2School of Business Administration, Zhongnan University of Economics and Law, Wuhan, China
As one of the important strategic measures to increase the international competitiveness of high-tech manufacturing (HTM), industry-university-research cooperation (IURC) has received increasing attention in China. However, there is little literature to explore the links between IURC and the environmental efficiency (EE) of HTM. To incorporate a variety of environmental pollution indicators into the efficiency analysis framework and reduce the adverse effects of random errors on the estimation results, this article combined the projection pursuit model with the stochastic frontier analysis (SFA) method and proposed a translog stochastic frontier model considering undesirable outputs to analyze the multiple impacts of IURC on the EE of HTM. The results show that IURC has both a significant negative direct effect and a significant positive indirect effect on HTM’s EE. Although IURC cannot directly promote EE, it has a positive impact on EE of HTM through its complementary effect with research and development (R&D) investment. The results also confirm that the average EE of the whole country is only 0.346, while that of the eastern area is 0.595, and that of the central and western areas are 0.199 and 0.171, respectively. Therefore, it is particularly urgent to improve the EE of China’s HTM industry through a variety of measures, such as promoting IURC and increasing R&D investment in environmental technology. This study not only provides an improved SFA method for measuring EE, but also deepens research on the mechanism of the impact of IURC on HTM’s EE.
1. Introduction
Since the 1990s, China’s high-tech manufacturing (HTM) has experienced rapid development. It is not only among the top 10 in the world in terms of industrial output but also has global competitiveness in such high-tech fields as aerospace, high-speed rail, and communications equipment manufacturing. However, due to the neglect of environmental efficiency (EE), China’s HTM does not present the characteristics of high added value and low pollution, and environmental pollution incidents are frequently reported in the press (Wu Q. et al., 2022). Furthermore, in the increasingly ecologically fragile eastern region, environmental regulation has caused many HTM enterprises to transfer their highly polluting processing and manufacturing links to the central and western regions, intensifying people’s concern that these regions will become “pollution refuges” (Peng et al., 2018). Therefore, how to improve EE has become an important practical problem for the sustainable development of Chinese HTM.
Developing technologies to reduce environmental pollution is an expensive, complex, and highly uncertain task (Oke, 2013; Rabal-Conesa et al., 2022). Usually, it is difficult for enterprises to deal with the pressure of controlling environmental pollution only through internal research and development (R&D) (Chang et al., 2022). Enterprises can and should use external knowledge to improve their technical capabilities and solve environmental pollution problems (Hu et al., 2017). The ability to acquire knowledge from the outside has been proved to be a key factor to enhance the competitiveness of enterprises (Leiponen and Helfat, 2010). Compared with traditional innovation, environmental innovation needs more external knowledge (Aldieri et al., 2020). Enterprises compensate for the lack of the necessary technical capacity, especially knowledge related to the environment, through cooperation with external organizations to implement environmental innovation activities (Diez-Martinez et al., 2022). In the process of realizing the green development of the manufacturing industry, developing countries usually actively acquire external technology to improve their level of environmental technology (Hou et al., 2017). The main ways to acquire external knowledge usually include the introduction of foreign technologies and industry-university-research cooperation (IURC) (Xu et al., 2022).
With the strengthening of technology export control from developed countries to China in the high-tech field, it has become increasingly difficult for China to obtain foreign technology transfer (Kwan, 2020). In this context, China has not only continued to increase investments in green technology R&D. At the same time, it actively accelerates IURC to promote the sustainable development of its manufacturing industry. The Chinese government has not only formulated a series of laws and regulations to promote IURC, but also strengthened its support for IURC in terms of resources and technology (Yao et al., 2021). However, there is still a lack of research on whether these efforts have contributed to the EE of China’s HTM. We attempt to reveal the relevance of IURC and EE in China’s HTM. Research on this issue will help clarify the current situation of EE in China’s HTM and offer a foundation for accelerating its green development.
This study contributes to existing research in three aspects. First, the research on EE of China’s industrial sector usually focuses on pollution-intensive industries, with a relatively lack of research on HTM. Moreover, DEA is more common in the method. This article uses the stochastic frontier analysis (SFA) method to measure the EE of China’s HTM. Second, little research examines the links between IURC and the EE of Chinese HTM. This article not only examines the direct action of IURC on the EE of HTM, but also analyzes the reciprocal action of IURC and R&D investment and their indirect effect on EE. Thus, it deepens the research on the mechanism of the effect of IURC on EE. Finally, this study combines the projection pursuit (PP) model with SFA and incorporates both desirable and undesirable outputs into the analysis framework for EE, providing an improved SFA method to measure EE. Compared to the commonly used DEA model, this method avoids the error of estimation results because it considers the influence of random factors when EE is analyzed.
The next section is the literature review. Section 3 is the Materials and methods. We combine the PP model and the SFA model to propose an SFA method considering environmental pollution. Section 4 is the Results and discussion. We present the results of the SFA method and discuss the links and differences between this study and previous studies. The last section is the Conclusion and policy implications.
2. Literature review
The related research can be divided into two parts: the estimation of EE and the impact of IURC on EE.
2.1. The estimation of EE
With the rapid growth in economic output, the environmental pollution problem of China’s industries is becoming more apparent. This makes its EE has been widely concerned. Much research has examined the EE of China’s industries. Chen and Jia (2017) applied the SBM to calculate the EE of Chinese industry. Shao and Wang (2016) used the Malmquist-Luenberger productivity index to evaluate the EE of China’s non-ferrous metal manufacturing industry. Wu et al. (2014) utilized DEA to evaluate the EE of Chinese interprovincial industries from 2007 to 2011. Wang et al. (2019) used the SFA method to estimate the EE of China’s coal industry. Some scholars revealed regional differences in the EE of China’s industries (Fei et al., 2020). An et al. (2020) found that industrial EE in East China was more efficient.
More research has analyzed the differences in EE in different types of Chinese industries. Xiao et al. (2018) examined the EE of 31 industries and found that the EE of most industries showed an upward trend. Among these literatures, studies on China’s manufacturing industry are the most abundant. Xie et al. (2016) evaluated the EE of Chinese manufacturing industries and confirmed that EE in most manufacturing industries was low. Qu et al. (2017) found that the EE of the manufacturing industry steadily increased between 2003 and 2011. There are also some studies that compare and analyze differences in EE between subsectors of the manufacturing industry (Yuan et al., 2017; Kang et al., 2018). Xie et al. (2017) found that the EE of HTM was higher than that of the traditional manufacturing industry. Zhang et al. (2022) confirmed that the EE of China’s HTM grew faster than that of other manufacturing industries between 2004 and 2017.
DEA and SFA are two common methods to calculate the EE of industrial sector (Khan et al., 2021; Rasheed et al., 2022). The former is often used to evaluate the relative efficiency of similar decision-making units with multi-input and multi-output, and it does not need to assume the form of production function. However, this method is difficult to deal with the measurement error of the data (Li and Tao, 2017). The latter not only allows for the selection of the best form of function (Khan et al., 2022), but also considers the interference of random error and statistical noise (Bibi et al., 2020). In addition, compared with the former, the latter can analyze the influencing factors of EE at the same time when estimating EE (Sun et al., 2019). However, the existing literature usually uses DEA method to evaluate the EE of China’s industrial sector, while the literature using SFA method is relatively few. In addition, there is little literature to evaluate the EE of China’s HTM, especially the use of the SFA method.
2.2. The impact of IURC on EE
Industry-university-research cooperation refers to collaborative technological innovation and commercialization of enterprises, universities, and scientific research institutions (Bai et al., 2020; Song et al., 2020). External knowledge from universities and scientific research institutions is considered to have a positive influence on environmental innovation (De Marchi and Grandinetti, 2013). On the one hand, enterprises can obtain the external knowledge needed to protect the environment from universities and research institutions. Through contact and interaction with academic departments, enterprises can acquire the technical knowledge needed for their product or process innovation to supplement or replace expensive R&D work (Caloghirou et al., 2004). Enterprises enhance their environmental technology capabilities through cooperation with universities and research institutions (Wang et al., 2012). On the other hand, IURC can achieve the coordination of technology, finance, and human capital, thus stimulating the vitality of environmental technological innovation (Yang et al., 2021).
In emerging economies, however, the opportunities for companies to acquire knowledge from domestic universities and research institutions may be short-lived. Because competitors can easily identify, acquire, or copy this knowledge (Kafouros and Forsans, 2012). In addition, enterprises that focus on IURC may not be able to acquire cutting-edge environmental knowledge, which is usually developed by enterprises in developed economies (Hou et al., 2017).
Furthermore, successful environmental innovation requires enterprises to have the corresponding absorptive capacity to transform external knowledge into their own skills (Ben Arfi et al., 2018). Internal R&D promotes the replication of knowledge and helps enterprises benefit from external knowledge (Kafouros and Buckley, 2008). When enterprises invest in R&D, they not only create new knowledge, but also improve their absorptive capacity (Cohen and Levinthal, 1990). The improvement of absorptive capacity helps enterprises to acquire external knowledge and carry out environmental innovation (Rabal-Conesa et al., 2022). The combination of external knowledge acquisition and internal R&D can enable enterprises to effectively carry out internal R&D activities and benefit from knowledge complementarity (Lokshin et al., 2008).
Although the research literature on the EE of the manufacturing industry is becoming more and more abundant, the research on evaluating the EE of China’s HTM is still relatively lacking. In addition, with the intensification of global competition in HTM, China regards IURC as an important way to enhance the international competitiveness of its HTM. However, there is also a lack of in-depth research on whether IURC can promote the EE of China’s HTM. Second, the existing literature usually uses a two-stage method (such as DEA-Tobit) to study China’s industrial EE (Wang et al., 2017; Peng et al., 2022). This method does not separate random factors when analyzing the factors influencing EE, which may lead to errors in the estimates. Therefore, this article combines the PP model with the SFA method, puts forward a translog stochastic frontier model considering undesirable outputs, and analyses the direct and indirect effects of IURC on EE, to clarify the mechanism of IURC on the EE of HTM.
3. Materials and methods
3.1. Analysis framework
The production system creates value by converting inputs into outputs. Inputs are usually factors of production such as capital and labor. Outputs include not only desirable outputs such as output value, but also undesirable outputs such as wastewater and waste gas, etc. EE can be understood as the ratio of outputs to inputs in the production system (Song et al., 2012). For the given inputs, the more desirable (or less undesirable) outputs provided by the production system, the higher its EE.
The impact of IURC on industrial EE is multiple (see Figure 1). First, IURC has a direct effect on industrial EE. This effect can be positive or negative. Second, IURC has an indirect effect on industrial EE, and it has an indirect impact on industrial EE through its complementary effect with R&D investment.
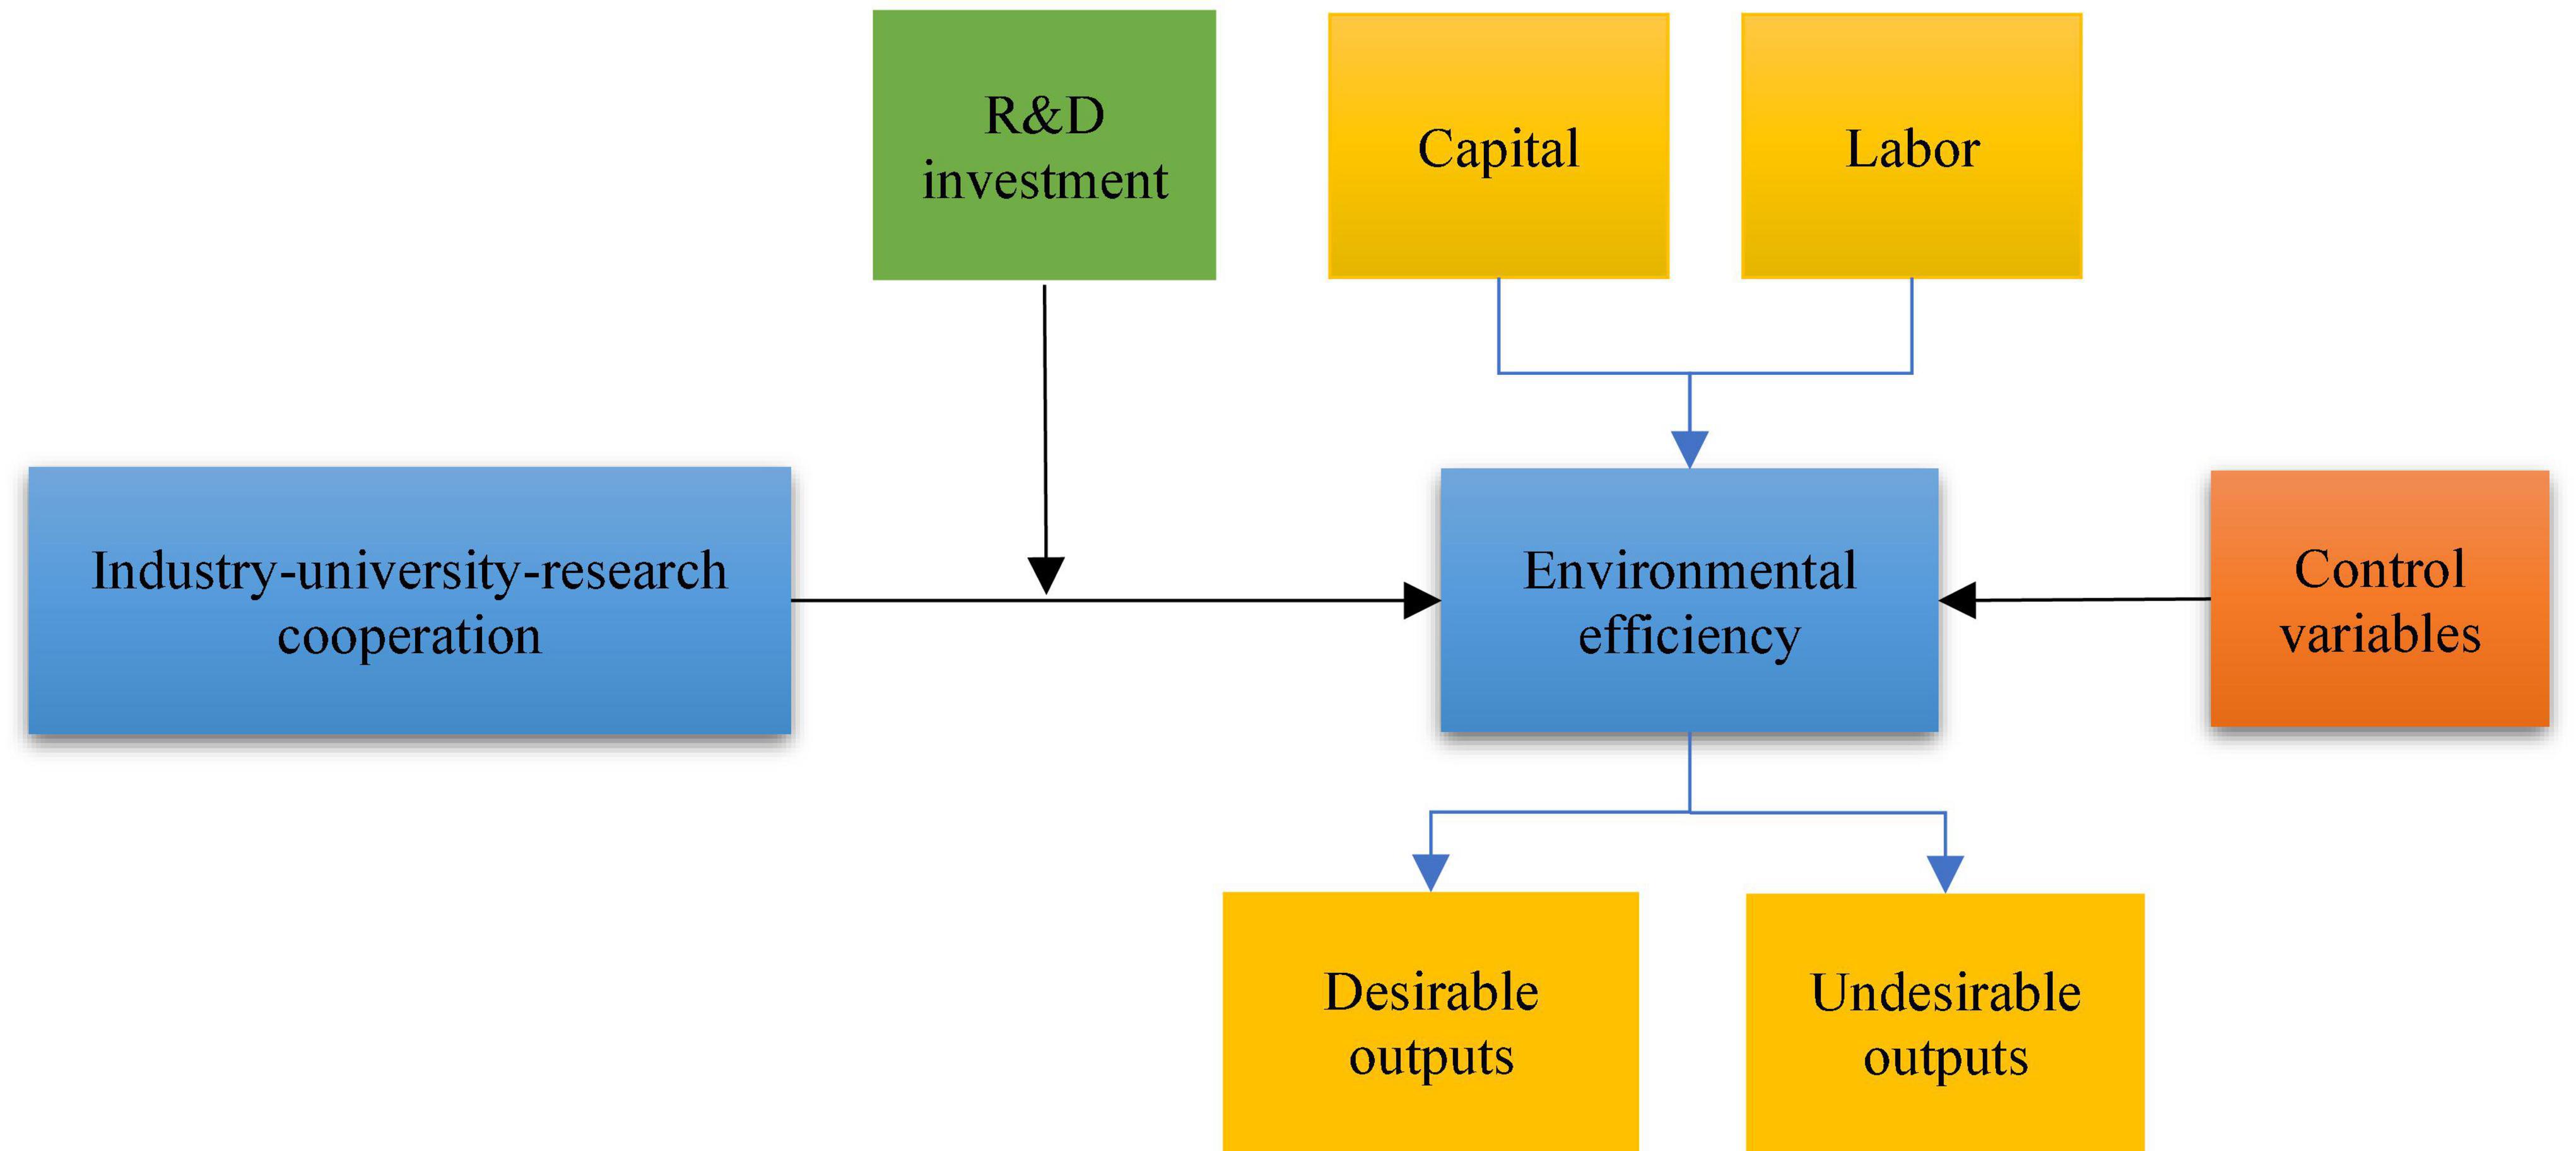
Figure 1. Research framework.
3.2. Model
Due to the ability to incorporate both desirable and undesirable outputs into the efficiency analysis framework, DEA has become one of the common methods for evaluating industrial EE (Li et al., 2013; Song et al., 2018). However, the purpose of this article is not only to measure the EE of HTM, but also to analyze the effect of IURC on EE. To reduce the error in the estimation results caused by random factors, the SFA method was chosen in this study.
The analysis of industrial EE should consider not only desirable outputs but also undesirable outputs. The traditional SFA method is usually difficult to deal with this kind of efficiency analysis of multiple outputs. Therefore, using the PP model (Yu and Lu, 2018), we transform multiple output indexes (multidimensional data) into a compositive output index, that is, multidimensional data into one-dimensional data. Then, on this basis, the stochastic frontier model was established (Sun and Huang, 2020; Zhang and Chen, 2021).
3.2.1. PP model
Projection pursuit is a statistical method to analyze high-dimensional and non-normal data. At the same time, this method has the characteristics of robustness, anti-interference, and high precision (Ouyang et al., 2021).
The steps to establish the PP model are as follows (Wu S. et al., 2022):
➀ Data normalization.
Let the set of HTM output indexes be {x*(i,j)|i = 1,2,⋯,m;;j = 1,2,⋯,n}, where x*(i,j) is the j-th output index of the i-th province. To unify the range of index values, the output indicators are normalized as follows:
For the positive index,
For the negative index,
here x(i,j) is the normalized value of the output index set, xmax(j) and xmin(j) are the maximum and minimum values of the j-th index in the index set, respectively.
➁ Construct the projection objective function.
After determining the projection direction p = {p1,,p2,⋯,pn}, the n-dimensional data {x(i,j)|j = 1,2,⋯,n} is converted into a one-dimensional projection value z(i):
where p(j) is a unit vector.
Next, the projection objective function is constructed:
where Sz and Dz are the standard deviation and local density of z(i), respectively.
here E(z) is the mean value of z(i) and R is the window radius; r(i,j) = |z(i)−z(j)|; and u(a) is a unit step function, u(a) = 1 when a≥0, u(a) = 0 when a < 0.
➂ Optimize the projection objective function.
The value of Q(a) depends on the projection direction. Solve the following objective function to obtain the best projection direction.
For this non-linear optimization problem, the accelerated genetic algorithm can be used to solve the maximum problem.
➃ Calculate the comprehensive index of the outputs.
After determining the optimal projection direction p*, p*, and x(i,j) are brought into the Equation 4 to obtain the projection value z*(i).
3.2.2. SFA model
Commonly used stochastic frontier models include the Cobb–Douglas production frontier and the translog production frontier. The Cobb–Douglas production frontier model can be set as follows (Battese and Coelli, 1995):
here Yit is the output of the i-th observed value in period t. Kit and Lit are the capital input and labor input of the i-th observation in period t, respectively. β1, β2, and β3 are parameters to be estimated. Vit is a random variable with normal distribution . Uit is a non-negative random variable used to explain production inefficiency, which follows the normal distribution censored at 0, independent of Vit. Where mit = zitδ, zit is a vector that may affect EE, and δ is the parameter vector to be estimated.
Compared with the Cobb–Douglas production function, the translog production function considers substitution effects and interactions between input factors and is more flexible in form (Sun and Huang, 2020; Zhang and Chen, 2021). Therefore, the stochastic frontier model of the translog production function was used to explore the impact of IURC on the EE of the HTM. The translog production frontier model can be set as (Bibi et al., 2020):
The inefficiency model may be expressed as:
where IURCit represents IURC, RDit represents R&D investment. Φ is the vector of control variables, and ω is the vector of parameters.
Equation 10 does not consider the links between IURC and R&D investment and its impact on EE. In fact, R&D can not only produce more environmentally friendly technologies (Song et al., 2019), but also enhance the absorptive capacity of enterprises to external technologies (Aldieri et al., 2018). The interaction between R&D investment and external technology can be expressed by their product (Danquah, 2018; Barasa et al., 2019). Therefore, to explore the effect of IURC on EE more accurately, this study added an interaction term between IURC and R&D investment and further set the inefficiency model as follows:
here δ3 represents the interaction effect between IURC and R&D investment. If δ3 is significantly positive, it indicates that there is a substitution effect between IURC and R&D investment, which leads to inefficiency of environmental technology. If δ3 is significantly negative, it indicates that there is a complementary effect between IURC and R&D investment, thus reducing the inefficiency of environmental technology (and improving EE).
To determine whether the stochastic frontier production model is applicable, a common method is to test the hypothesis of the variation coefficient γ (Battese and Coelli, 1995).
If γ is significantly different from 0, it indicates that the stochastic frontier production function is more suitable. The closer γ is to 1, the deviation comes mainly from the inefficiency effect, and it is more appropriate to adopt the stochastic frontier model.
3.3. Variables and data
3.3.1. Input-output index
Production inputs include labor and capital. Labor was reckoned by employment in HTM (Peng et al., 2018). Capital was calculated using the perpetual inventory method (PIM) (Chen et al., 2018). Take the total output value and the output value of new products as desirable output indicators (Peng et al., 2022). Due to the availability of HTM environmental pollution data, sulfur dioxide emissions and industrial wastewater emissions were selected as undesirable output indicators in this study (Chen et al., 2021). The PP model was used to transform the four outputs into a compositive output index (CY).
3.3.2. Explanatory variables
Explanatory variables include IURC and R&D investment (RD).
The funds obtained from enterprises, universities, and scientific research institutions can measure the degree of IURC (Zhang and Sun, 2022). Therefore, we measure IURC by the expenditure of enterprises to purchase domestic technology.
According to the technology purchase expenditure and the RD expenditure, the PIM was used to estimate the knowledge stock of IURC and R&D investment (Coe et al., 2009; Shahabadi et al., 2018). To attenuate heteroscedasticity in the regression model, we used the logarithm of the technological knowledge stock to represent IURC, and the logarithm of the R&D knowledge stock to represent RD.
3.3.3. Control variables
Existing studies have identified the factors that influence industrial EE (Chen et al., 2020; Ma et al., 2022). These factors include foreign direct investment (FDI), R&D investment, and human capital (Tao et al., 2012; Lu and Pang, 2017; Chen et al., 2022). Chen et al. (2020) verified that R&D and human capital have a positive influence on China’s industrial EE. Ma et al. (2022) found that human capital and FDI are positively correlated with China’s industrial EE. Some studies point out that since China’s manufacturing industry has undergone drastic structural changes during market-oriented reform, the degree of marketization plays an important role in explaining the efficiency change and technology gap of China’s manufacturing industry (Walheer and He, 2020). In addition, enterprise scale may also be an important factor affecting industrial EE (Wang et al., 2017).
Some literatures have further empirically tested the role of these factors in China’s HTM (Peng et al., 2022). Related studies show that in addition to IURC and RD, marketization level (MAR), enterprise size (ES), human capital (HC), government support (GS), FDI, and regional factors may also be important factors affecting the EE of HTM. Therefore, these variables were selected as control variables.
Degree of marketization (MAR): the share of private firms in HTM’s production value is used to represent MAR (Wang et al., 2021).
Enterprise scale (ES): The logarithm value of the average production value of the enterprises in HTM is used to represent ES (Li et al., 2018).
Human capital (HC): It is expressed as the proportion of HTM’s employees in the local population (Wang and Zhao, 2021).
Government support (GS): GS is represented by the proportion of government funds in R&D funds (Li and Zeng, 2020).
Foreign direct investment: It is measured by the percentage of foreign-funded enterprises in HTM (Wei and Liu, 2006).
Location factor: The National Bureau of Statistics divides China into eastern, central, and western regions. Different regions have different environmental policies. The eastern region is relatively strict, while the central region is relatively loose. In this article, EAST is used to represent the dummy variable in the eastern region, and CEN is used to represent the dummy variable in the central region.
The panel data of the HTM from 2006 to 2017 in 28 provinces in China (with seriously missing data in other provinces) were selected for empirical analysis. We have clarified the abbreviations and descriptions of all variables in Table 1. The descriptive statistics of the variables are shown in Table 2. The data is obtained from the EPS data platform.
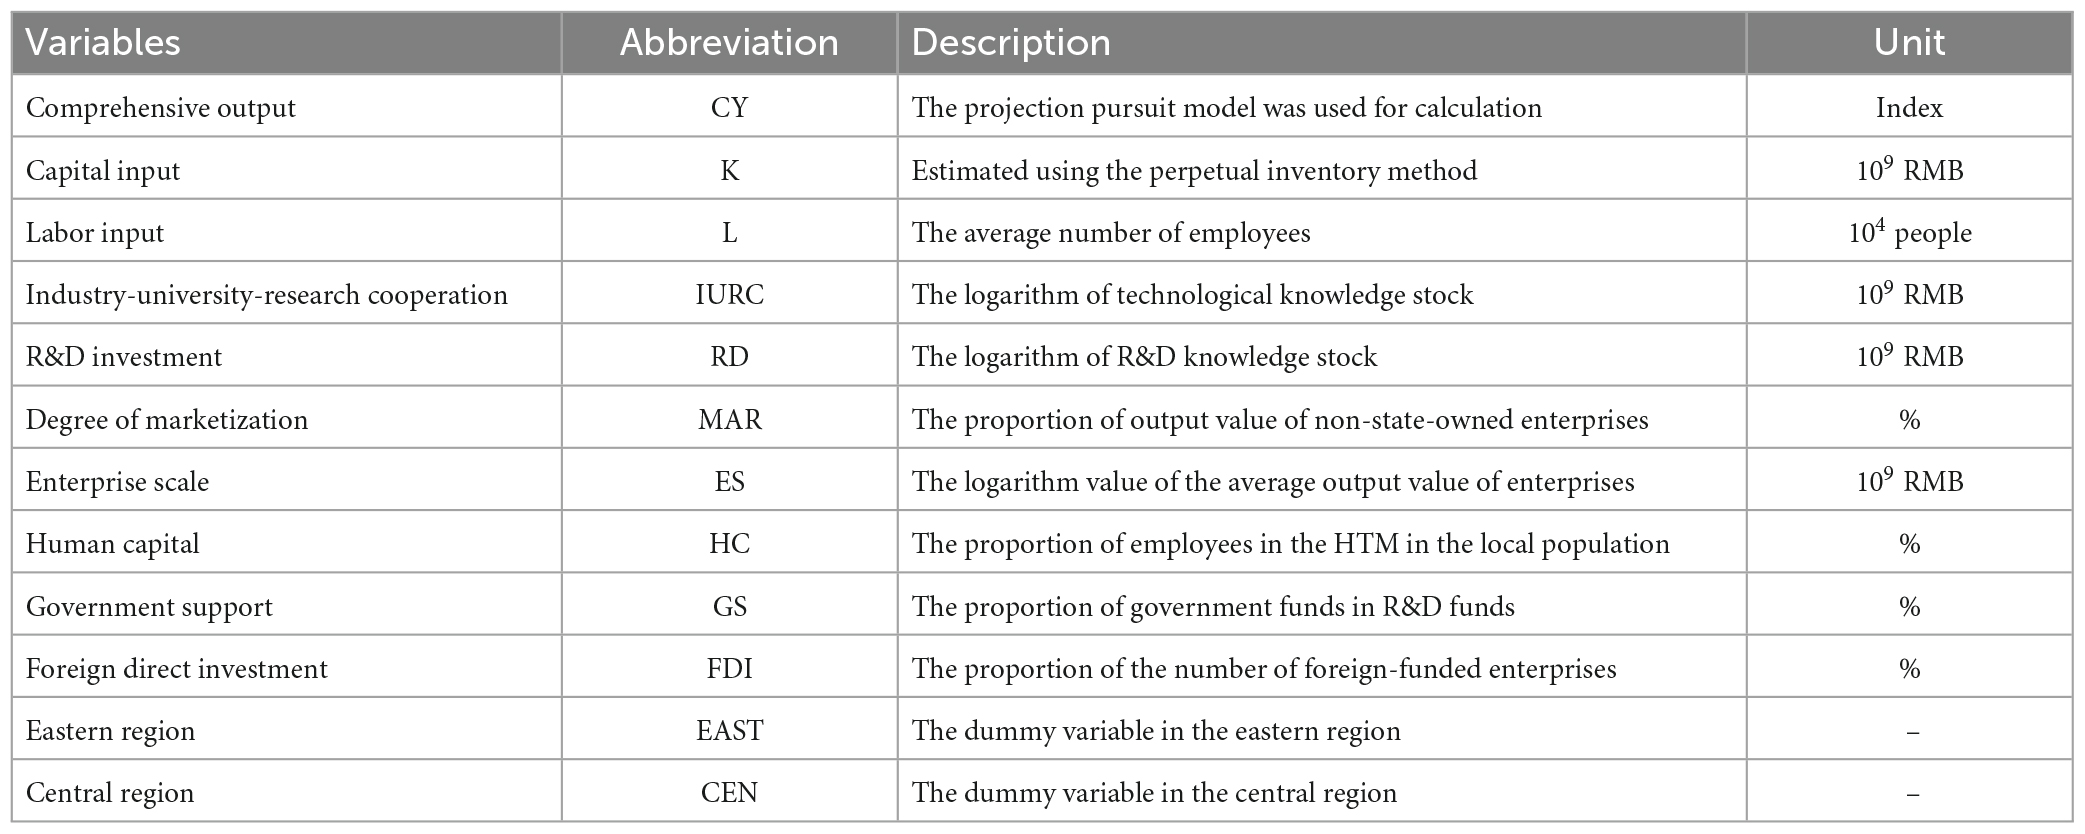
Table 1. The description of variables.

Table 2. Descriptive statistical results.
The correlation matrix in Table 3 examines the relationship between variables. Both IURC and RD are significantly positively correlated with CY, and all control variables are also significantly correlated with CY.

Table 3. Correlation matrix of variables.
4. Results and discussion
4.1. Compositive output index
When the PP model is used for solving the projection index function, an accelerating genetic algorithm was used to better obtain the optimal solution (Wang and Zhan, 2019). We used MATLAB software to obtain the compositive output index of HTM, as shown in Table 4.
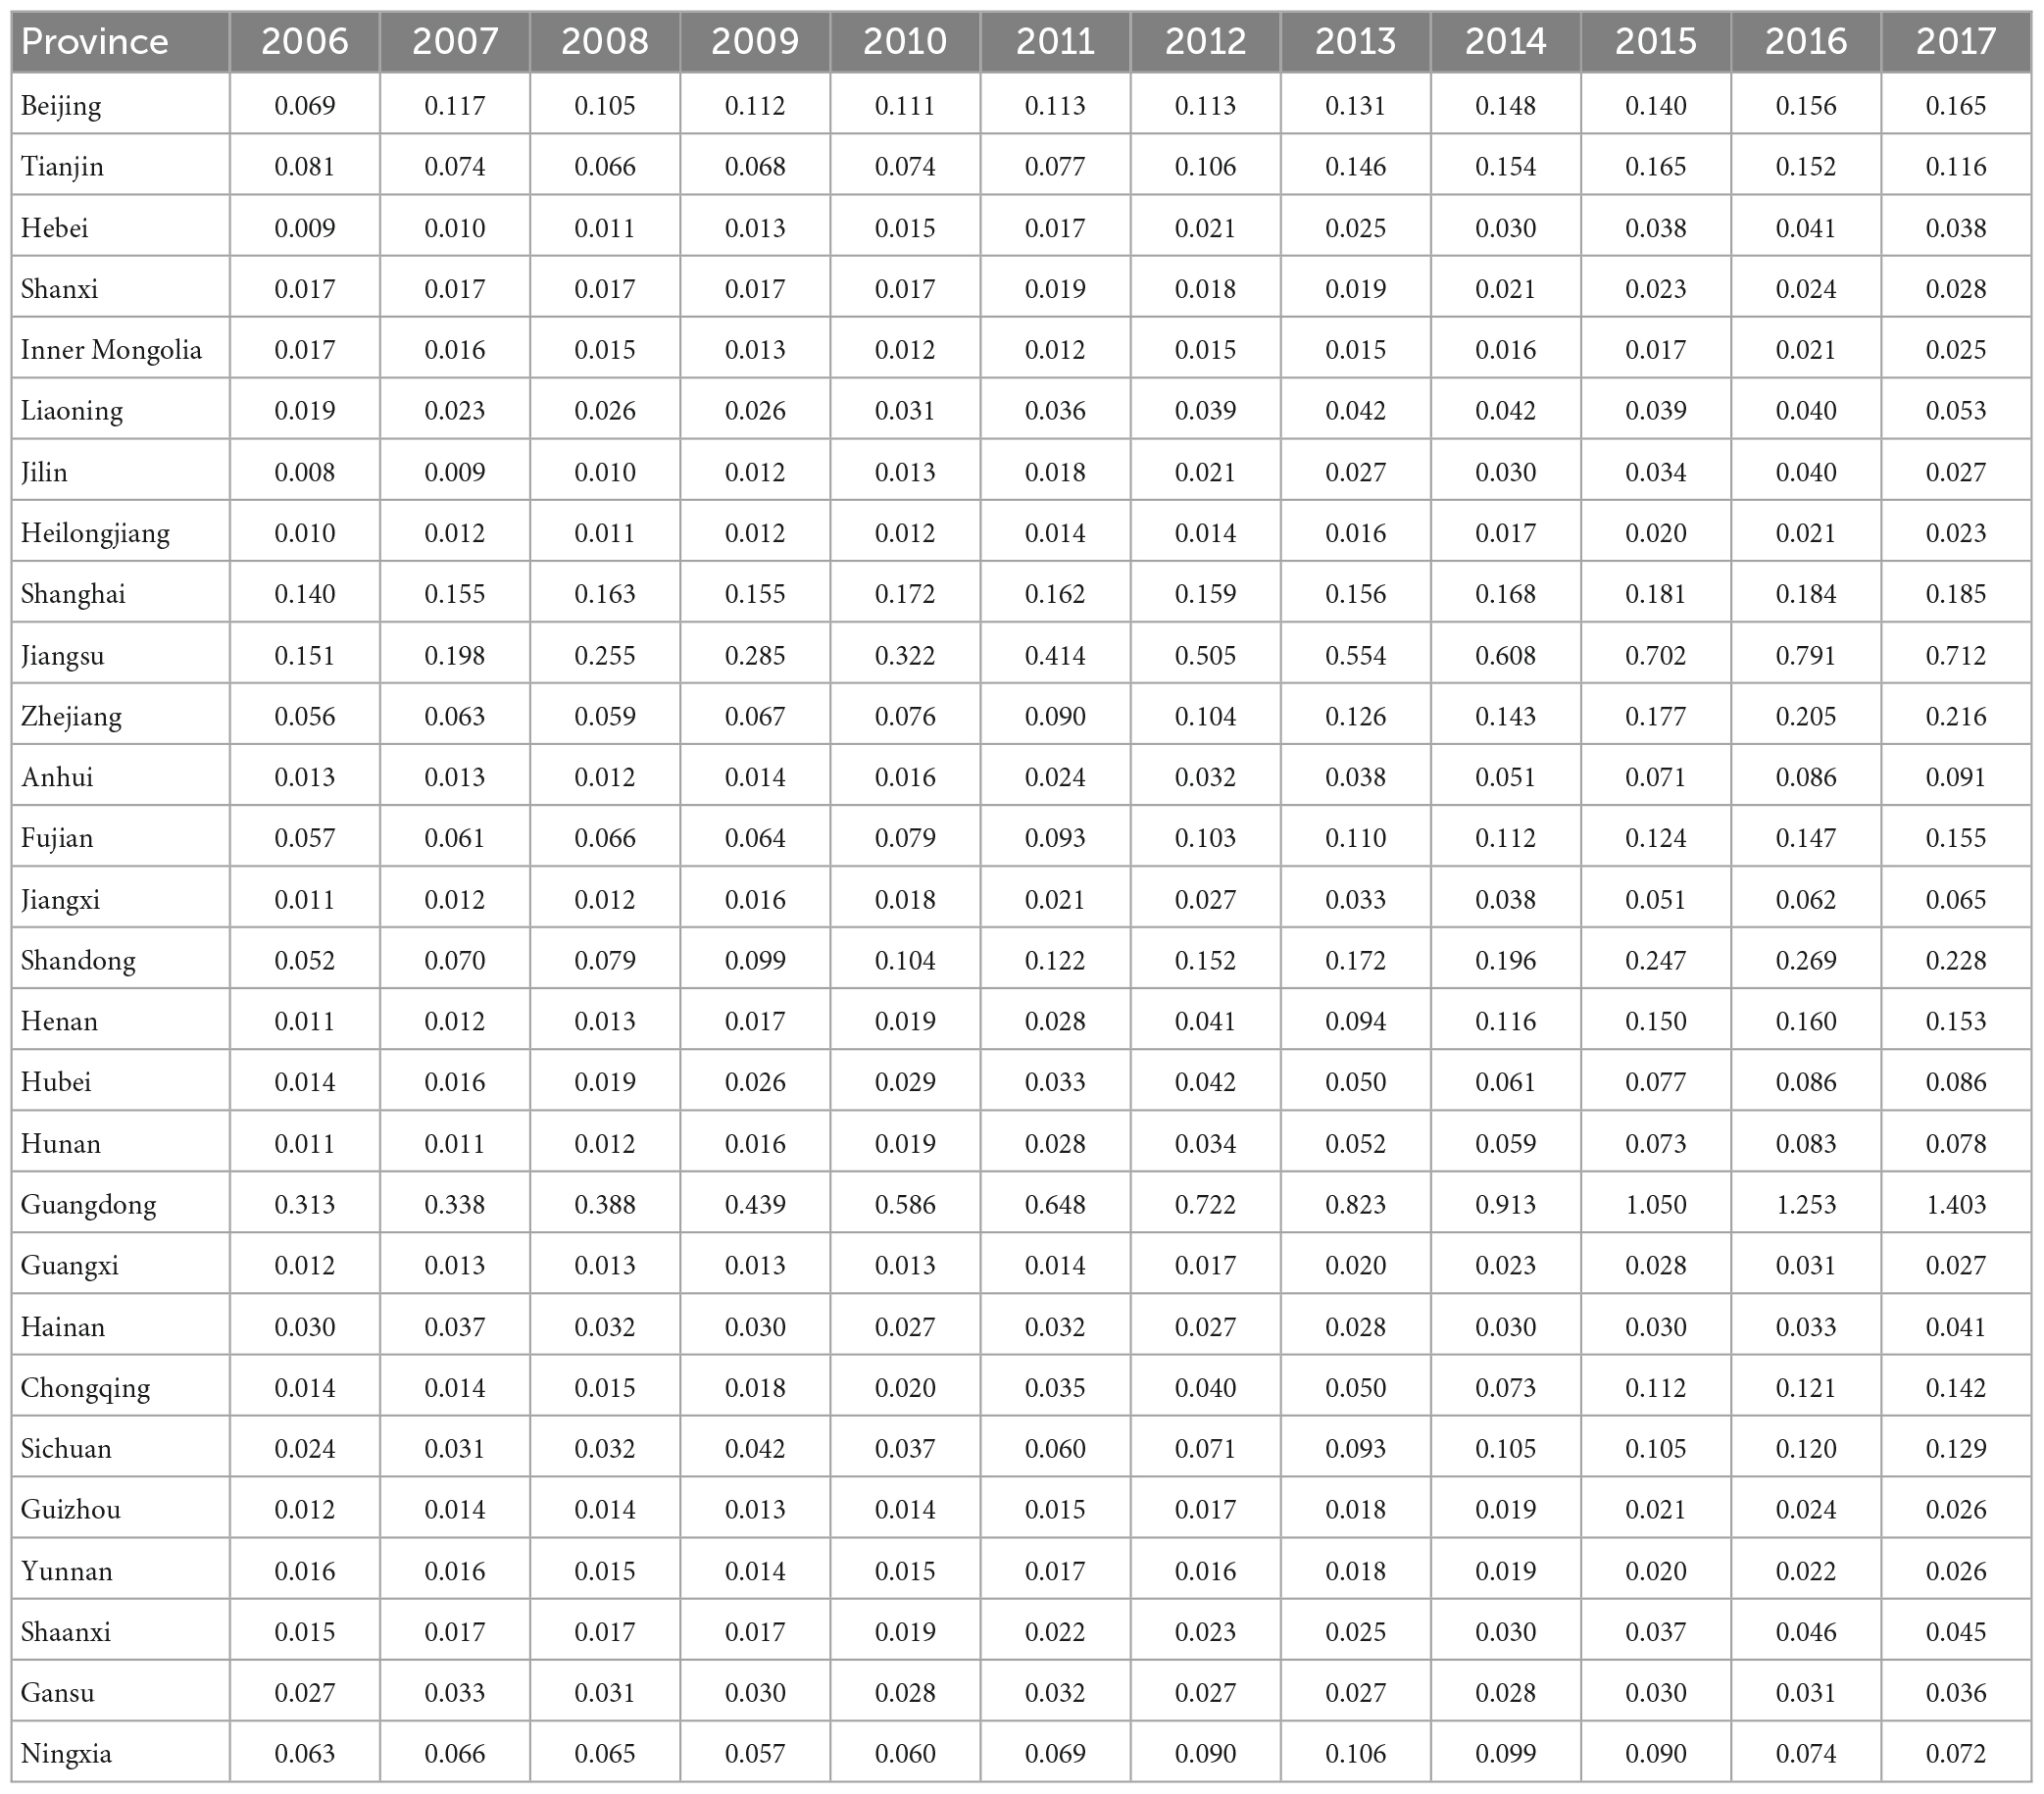
Table 4. Compositive output index.
Table 4 shows that the comprehensive output index of HTM in all provinces showed an increasing trend from 2006 to 2017. On the one hand, it is due to the growth of the output value of HTM in each province. On the other hand, it benefits from strengthening environmental regulation in China. Guangdong, Jiangsu, and Shanghai have the highest comprehensive output index, these provinces are economically developed, their HTM output is higher, and these provinces have more strict controls on environmental pollution. The lowest comprehensive output index is Guizhou, Inner Mongolia, and Heilongjiang. The economy of these provinces is relatively backward, and the development of their HTM is relatively slow. Therefore, the comprehensive output index can accurately reflect the actual output level of HTM.
4.2. Estimation results of stochastic frontier model
When using Equation 9 to analyze the impact of IURC on the EE of China’s HTM, it is necessary to determine the form of the frontier production function. That is, Cobb–Douglas production frontier or translog production frontier, which production function is better? We make our choices through LR tests (see Table 5). The results show that translog production frontier is more suitable than Cobb–Douglas production frontier.
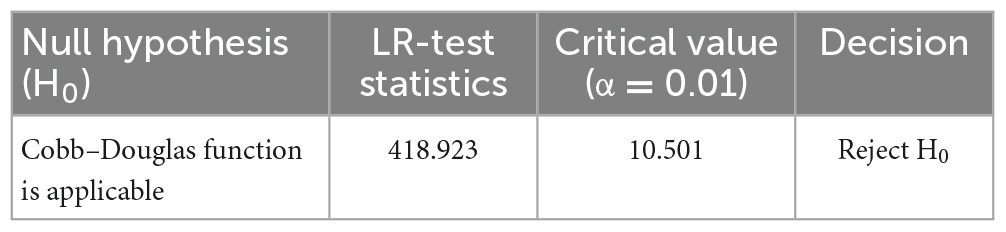
Table 5. Results of LR tests.
To test whether IURC can promote the EE of China’s HTM, this article uses the stepwise regression method to introduce control variables in turn (see Table 6). The variation coefficients of the four models are all greater than 0.95 and are significant at a 1% significance level, showing that the stochastic frontier model is more reasonable than the traditional production function. At the same time, the test results also show that the translog production function has good applicability to the sample data.
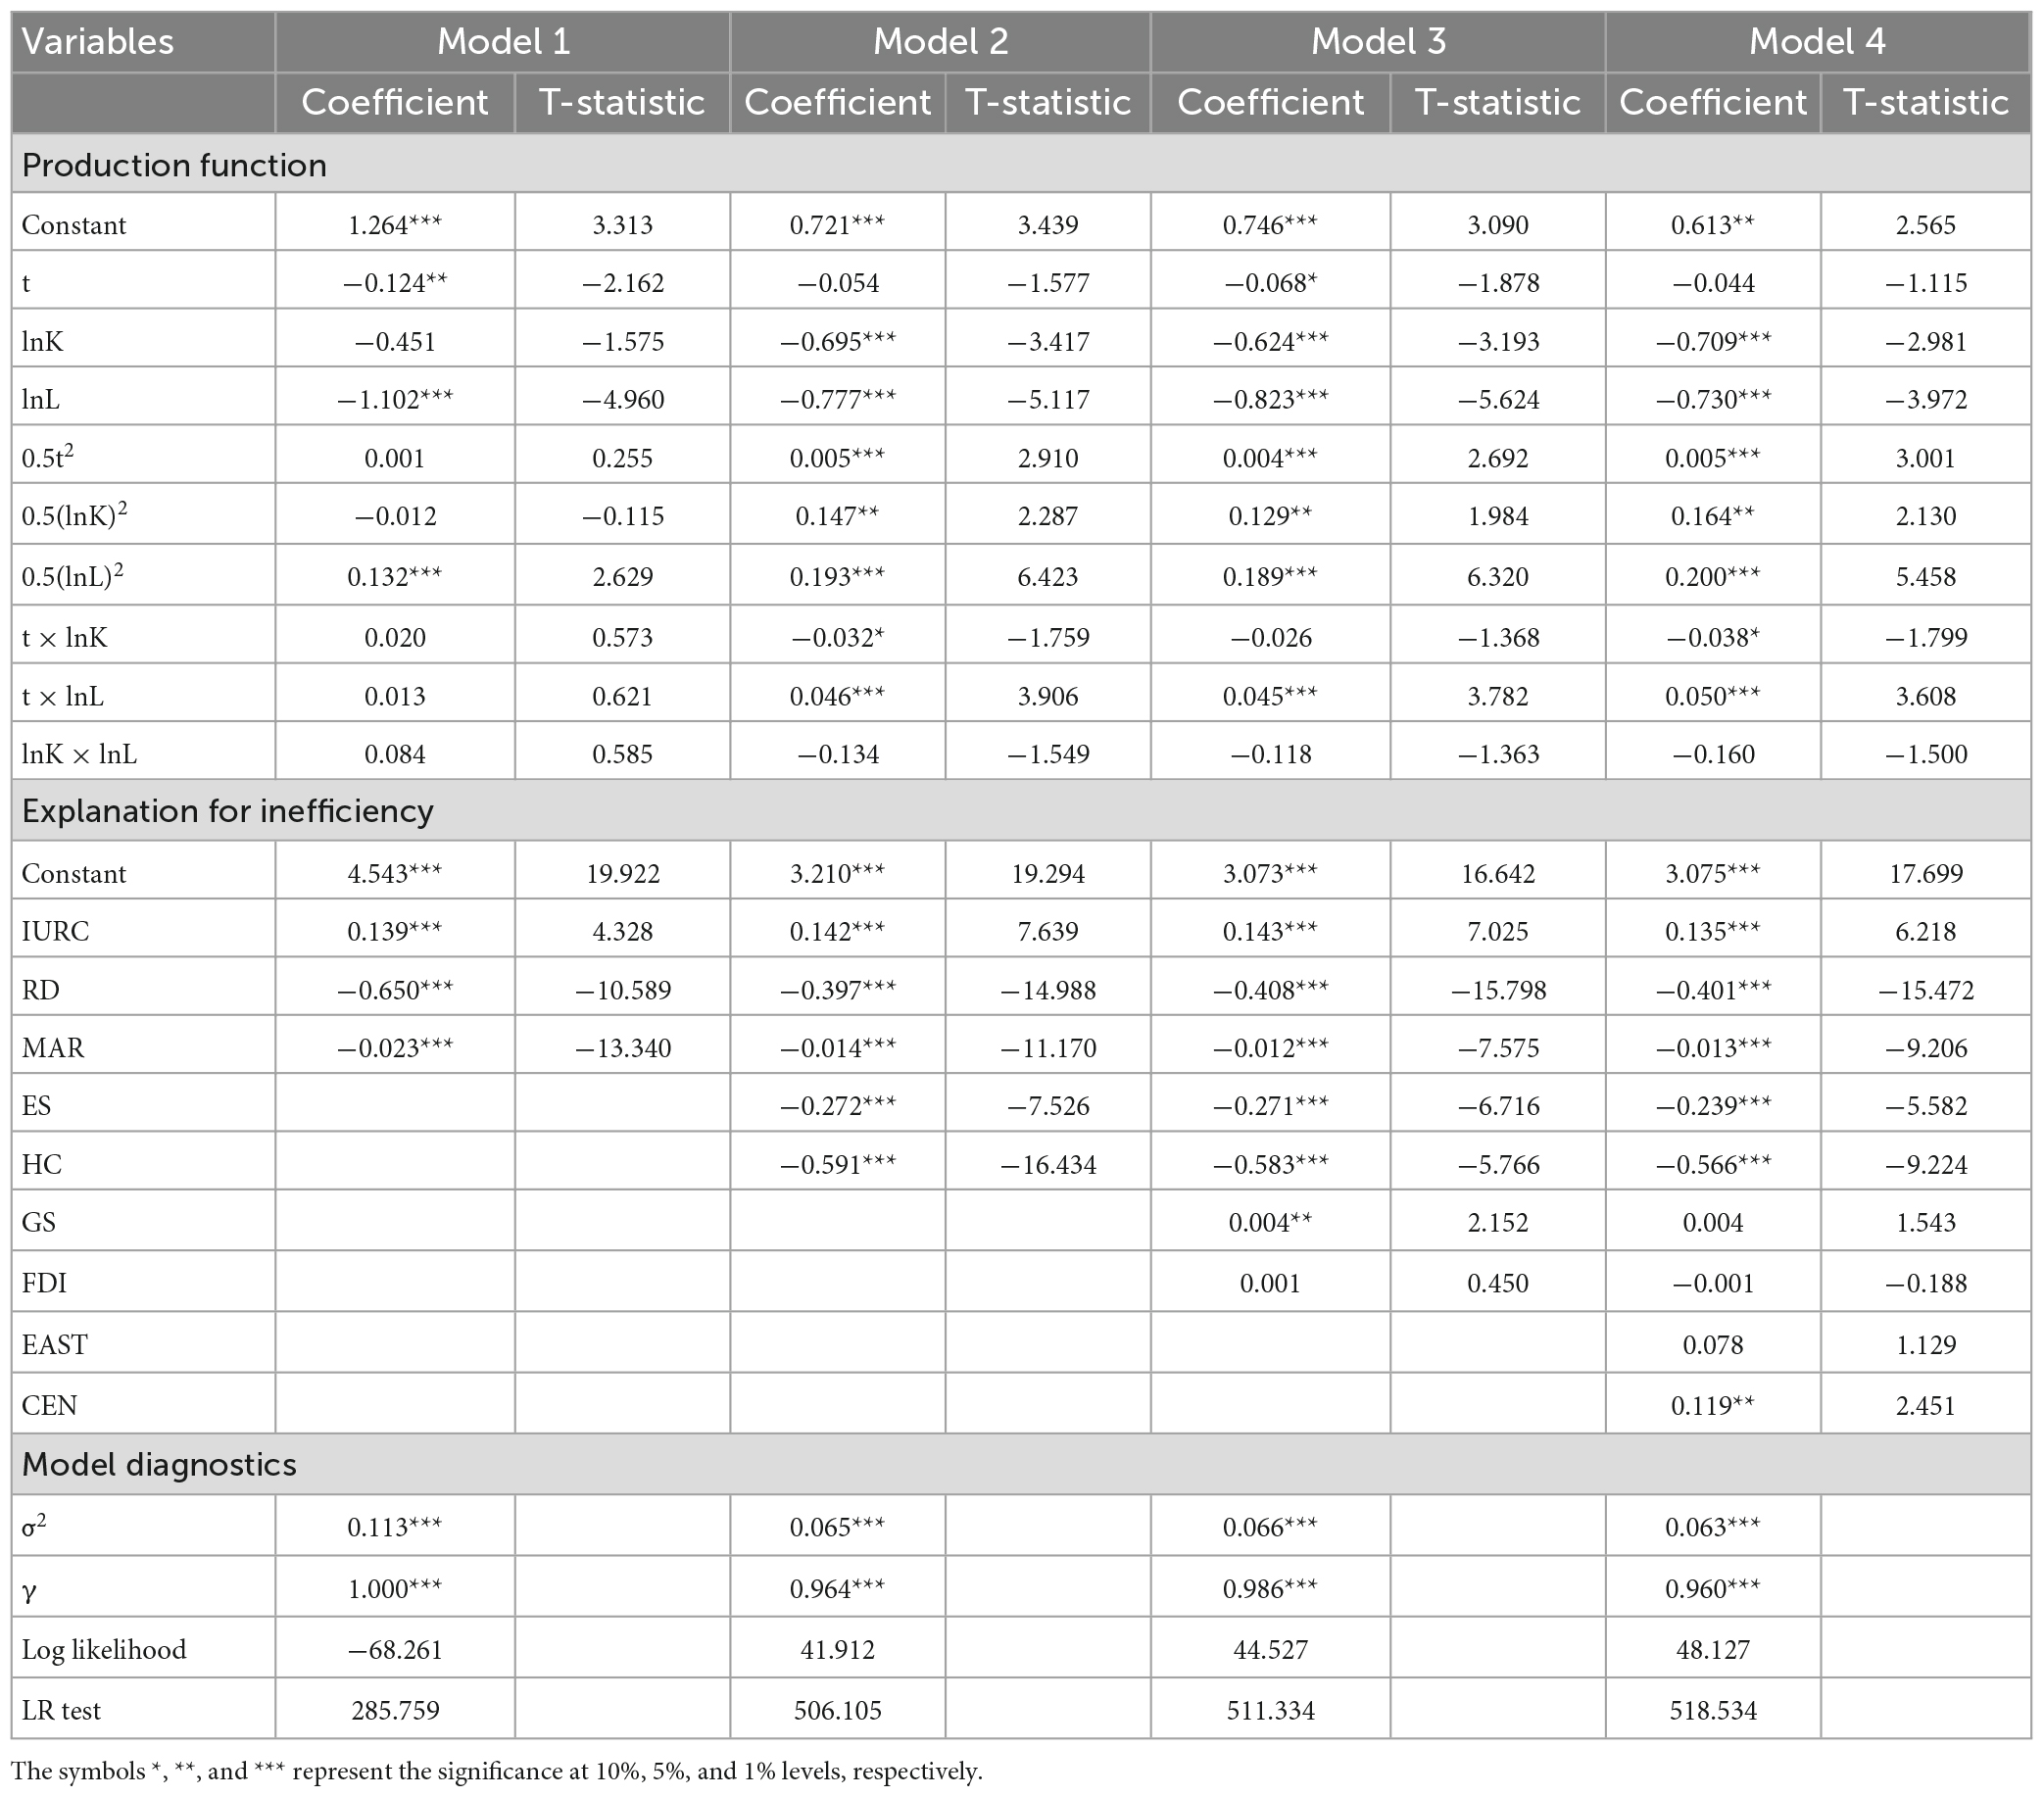
Table 6. Estimates of the direct effect of IURC.
Among the factors that influence EE (inefficiency), the four models all showed that the coefficient of IURC is significantly positive (coefficient values are 0.139, 0.142, 0.143, and 0.135, respectively), while the coefficient of RD is significantly negative (coefficient values are −0.650, −0.397, −0.408, and −0.401, respectively). This shows that IURC can significantly promote the inefficiency of environmental technology, while RD can significantly hinder the inefficiency of environmental technology. That is, IURC has a significant inhibitory effect on the EE of HTM, while RD has a significant promoting effect on the EE of HTM.
All four models show that the coefficients of MAR, ES, and HC are significantly negative. This shows that HC, ES, and MAR play a significant role in promoting the EE of HTM. Model 4 shows that the effects of GS and FDI on EE are not significant. Model 4 also shows that the coefficient of EAST is not significant, while the coefficient of CEN is significantly positive. This shows that location factors also have a significant impact on EE.
To further examine the relationship between IURC and EE, Table 7 shows the results of adding the interaction terms of IURC and the R&D investment. Models 5, 6, 7, and 8 were added control variables by stepwise regression. The variation coefficients of the four models are all greater than 0.95 and are significant at a 1% significance level, which shows that the stochastic frontier model is more accurate than the traditional production function. At the same time, the test results also show that the translog production function has good applicability to the sample data.
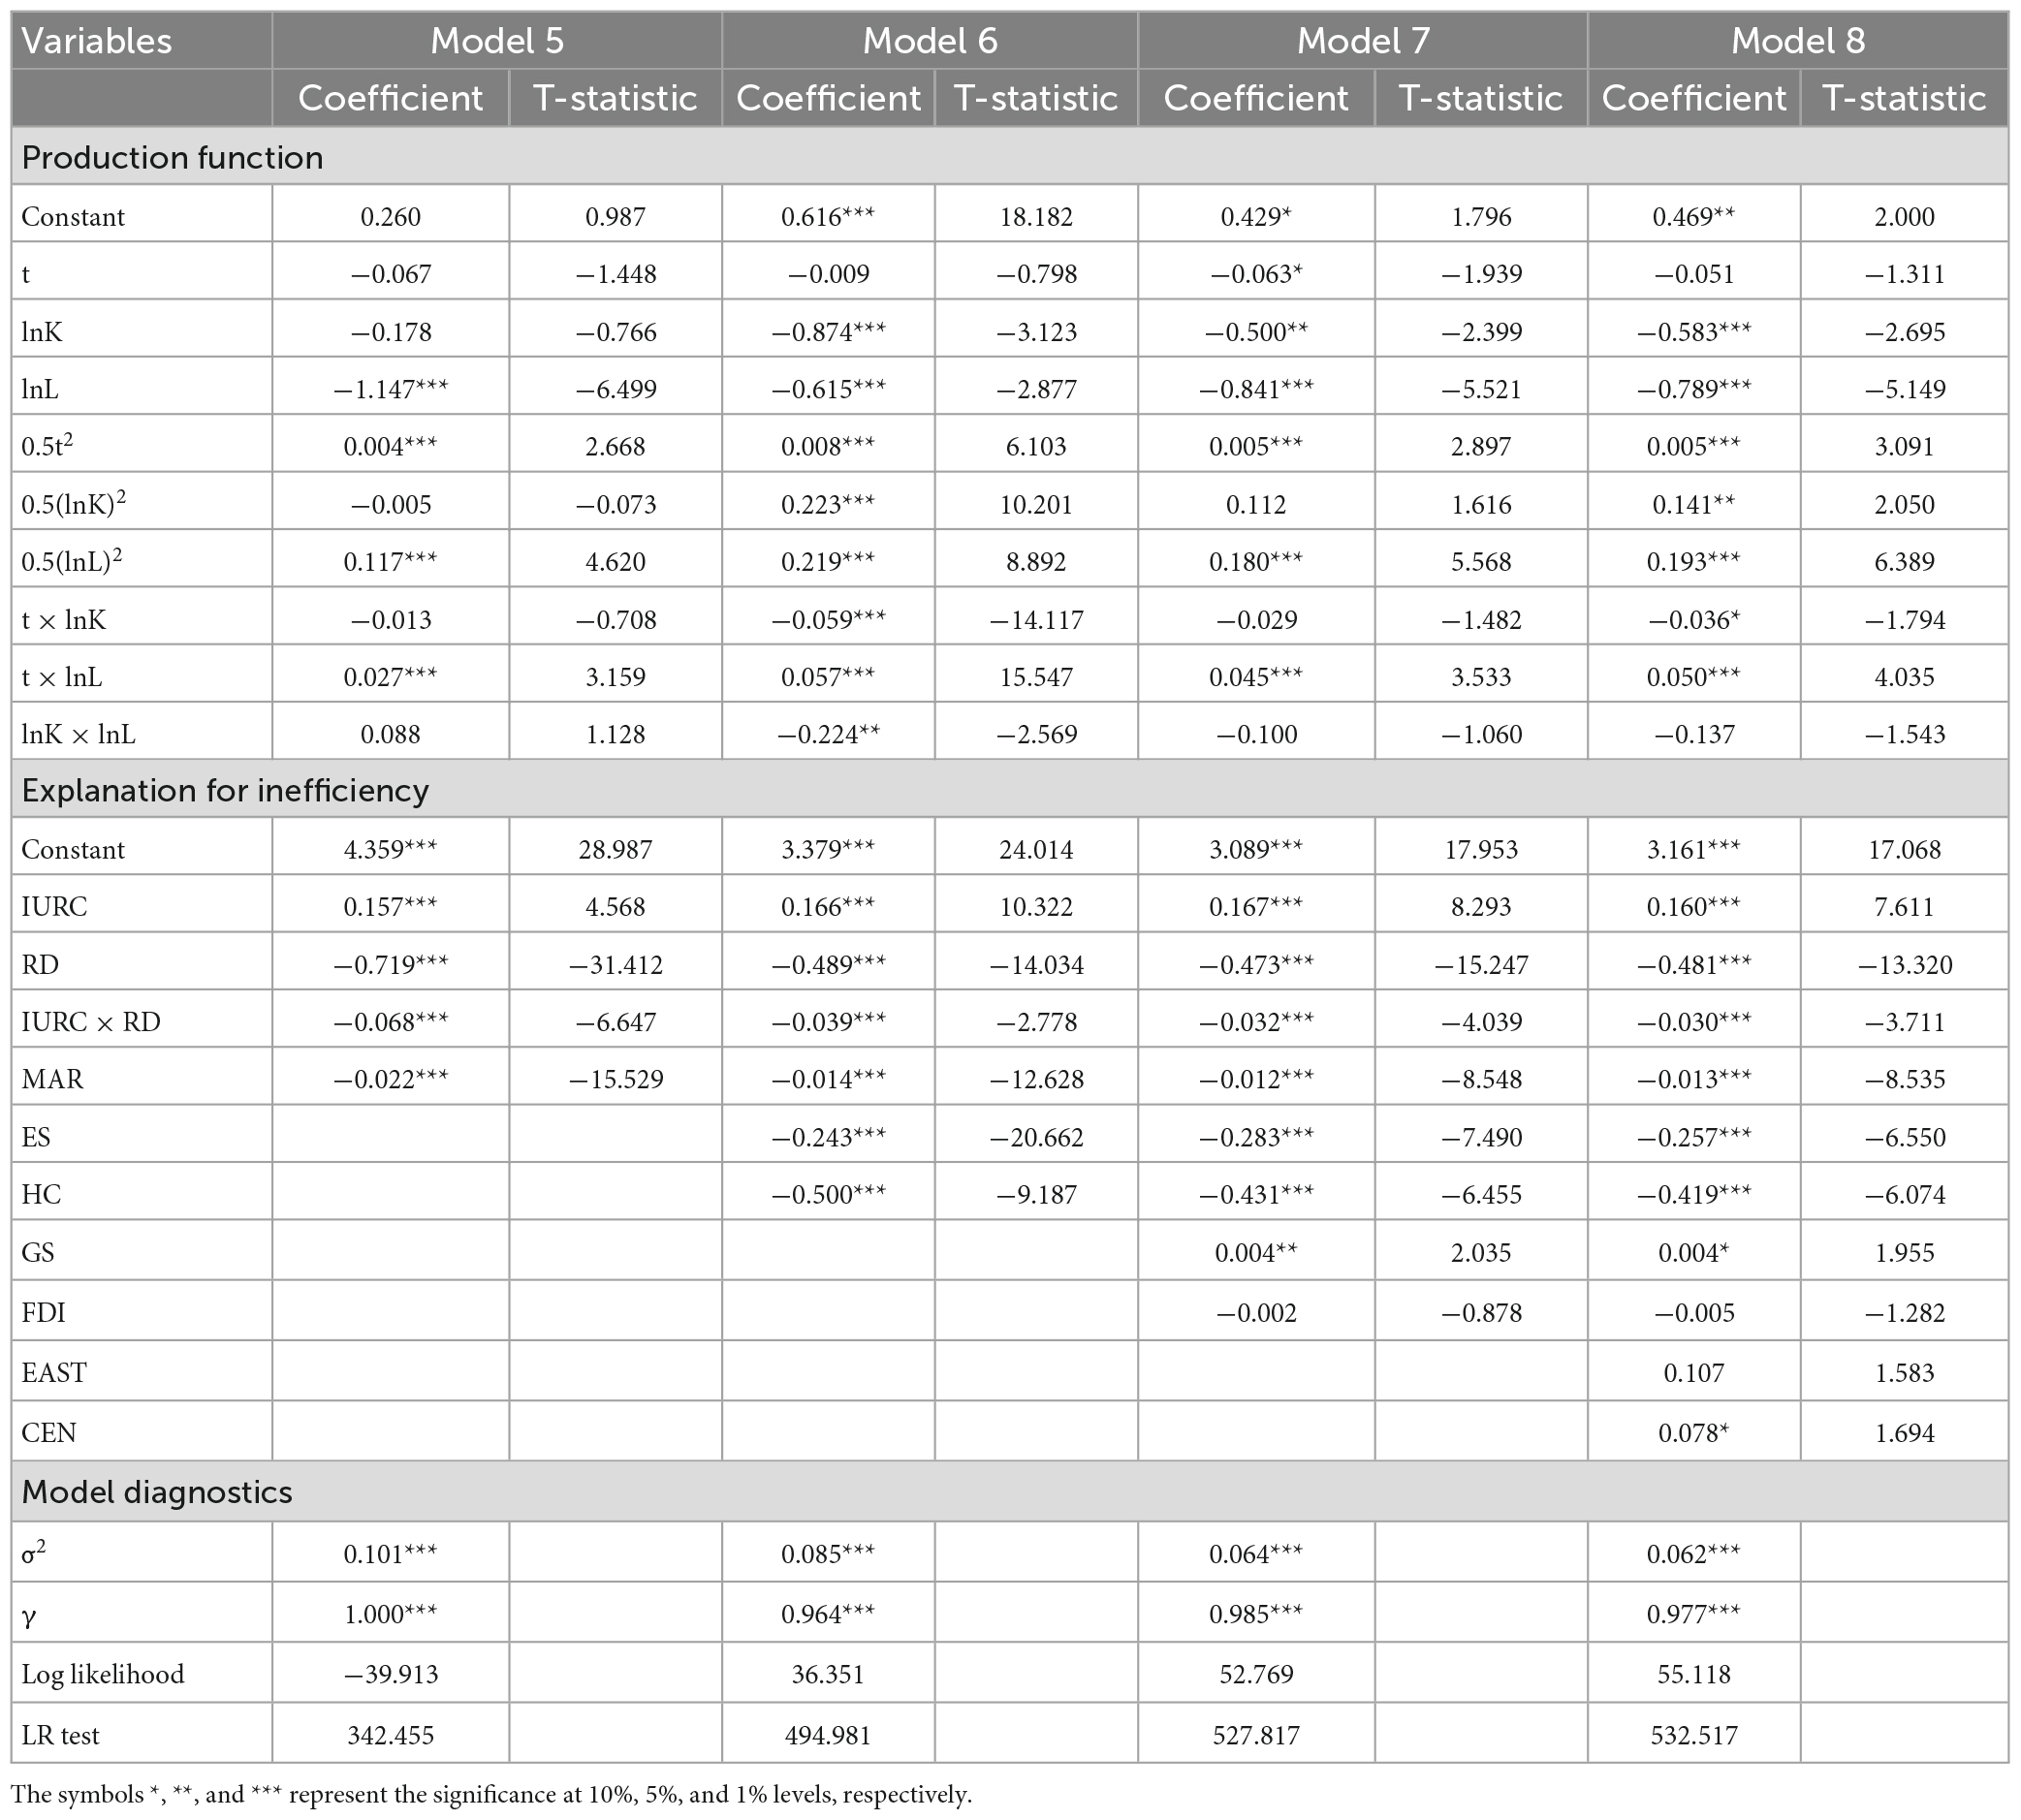
Table 7. Estimates of the dual effects of IURC.
Among the factors that influence EE (inefficiency), the four models show that the coefficient of IURC was significantly positive (0.157, 0.166, 0.167, and 0.160, respectively), while the coefficient of RD was significantly negative (−0.719, −0.489, −0.473, and −0.481, respectively). This shows that IURC hinders the EE of HTM, while RD significantly promotes the EE of HTM. In these four models, the interaction terms of IURC and R&D investment are significantly negative (−0.068, −0.039, −0.032, and −0.030, respectively). This shows that there is a complementary effect between IURC and R&D investment, which significantly promotes HTM’s EE.
The four models all show that the coefficients of MAR, ES, and HC are significantly negative. This confirms that HC, ES, and MAR all promote the EE of HTM. Both Models 7 and 8 show that the influence of GS was significant and positive, while that of FDI was not significant. Model 8 also shows that location factors have a significant impact on EE. When comparing the estimated results of the factors affecting EE in Tables 3, 4, it is found that the sign and significance of the coefficient values of the explanatory variables are consistent. This also shows that the estimation of the links between IURC and the EE of HTM is robust.
4.3. EE of China’s HTM
Since both government support and regional differences have significant impacts on the EE of HTM, and IURC and R&D investment have significant complementary effects, the analysis result of Model 8 on the EE of HTM is more accurate. The EE results of China’s HTM based on Model 8 are shown in Table 8.
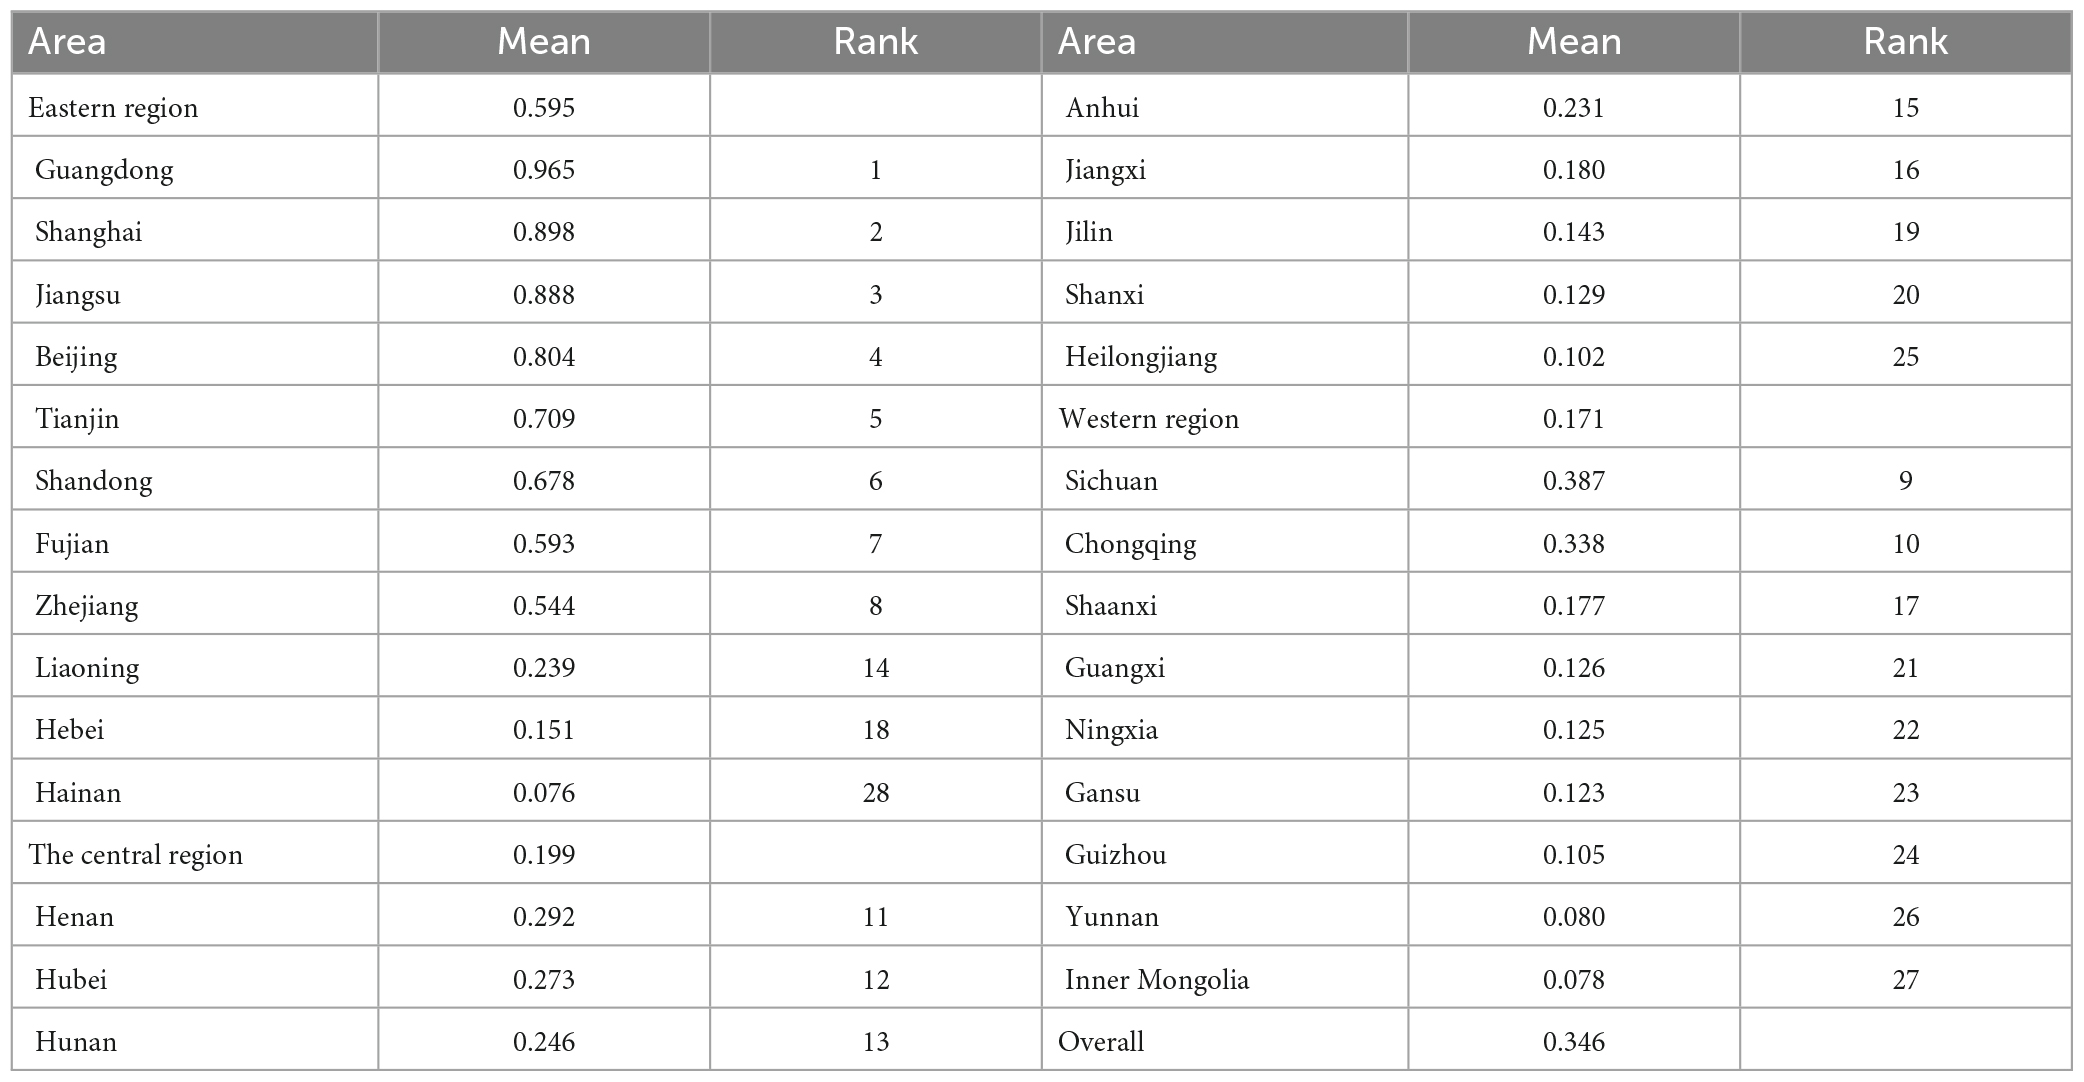
Table 8. Environmental efficiency of China’s HTM.
As can be seen in Table 8, the EE of China’s HTM is on the low side from 2006 to 2017. The average EE of the whole country is only 0.346, while that of the eastern area is 0.595, and that of the central and western areas are 0.199 and 0.171, respectively. In the eastern area, the HTM’s EE in Guangdong is the highest, which is much higher than that in other provinces. However, the EE of HTM in Hebei and Hainan is much lower than that of other provinces in the eastern area, and lower than the average value of the western and central areas. In west and central China, most provinces except Sichuan and Chongqing have low EE values. This also shows that improving EE is particularly urgent for sustainable development in Chinese HTM.
4.4. Robustness test
Do different forms of production functions lead to inconsistent estimates? To this end, we change the form of the production function, that is, excluding the time variable t from Equation 9, and then reanalyze the impact of IURC on the EE of HTM. Table 9 shows the results of the robustness test for the direct effect of IURC. All four models show that IURC is significantly positively correlated with the environmental technology inefficiency of HTM, indicating that the direct effect of IURC on the EE of HTM is significantly negative.
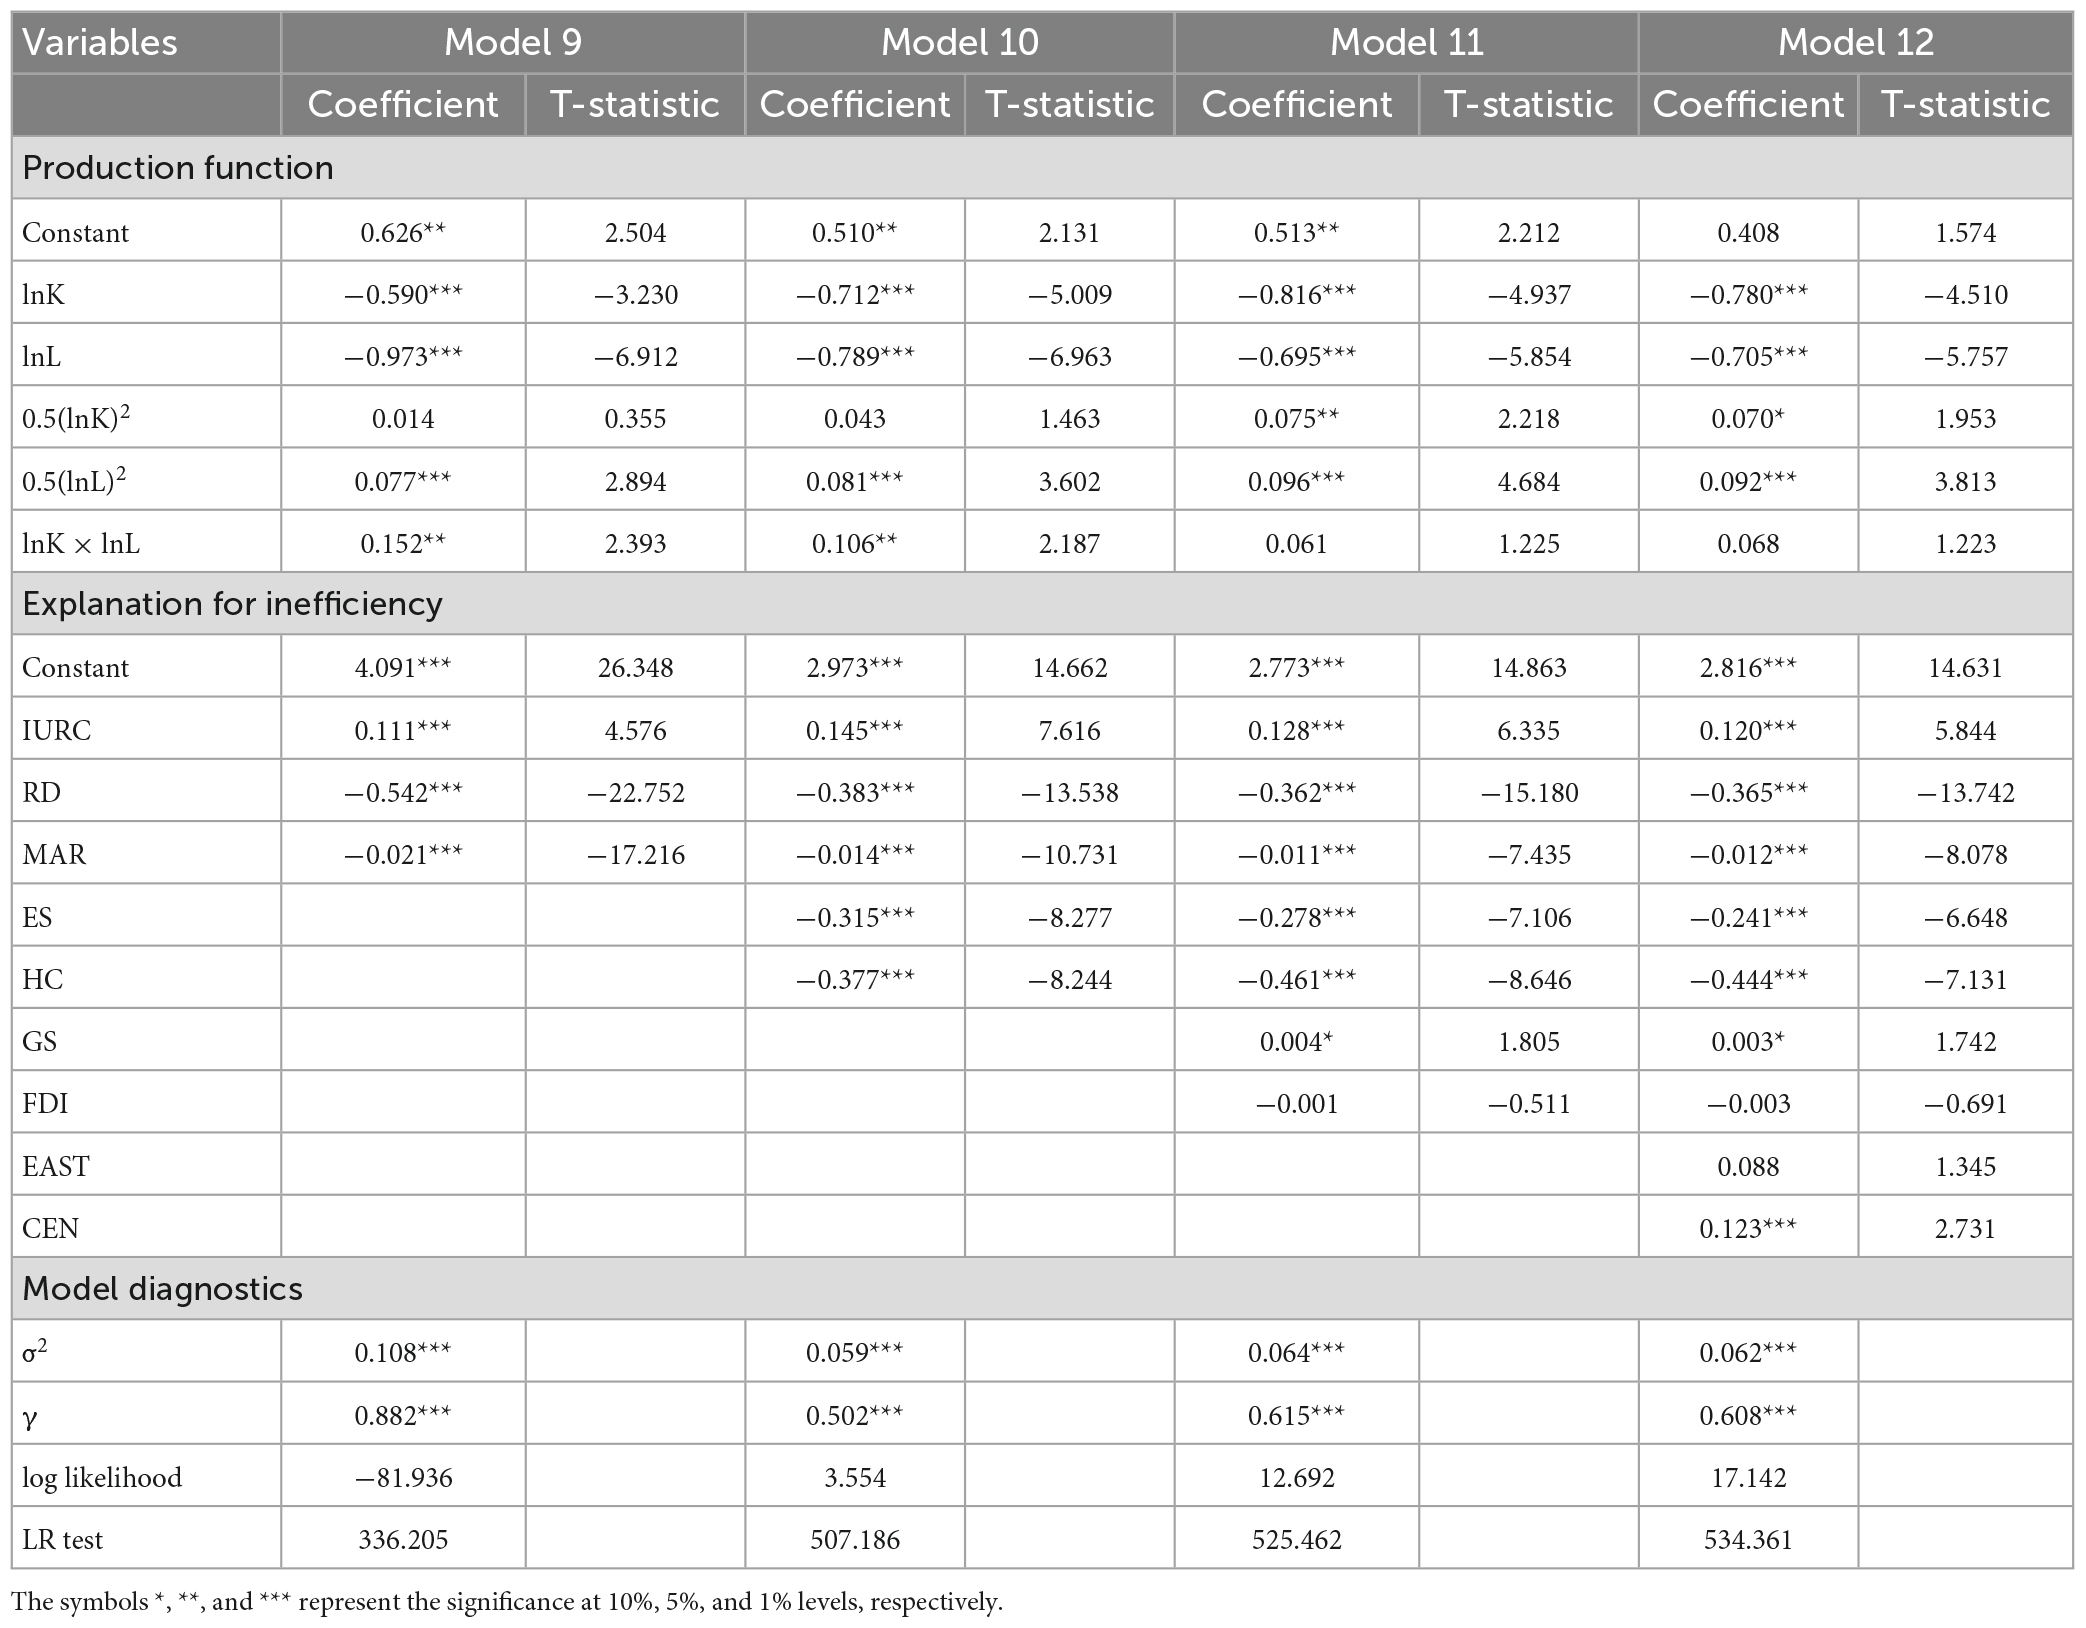
Table 9. Results of the robustness test of the direct effect of IURC.
Table 10 shows the results of the robustness test for the dual effects of IURC. All four models show that although IURC has a negative direct impact on the EE of HTM, IURC has a positive indirect effect on the EE of HTM through its complementary effect with RD. In addition, the same conclusion is obtained by using the Cobb–Douglas production function to estimate. Thus, the estimated result will not change due to the change in the form of the function. Therefore, the estimated results of this article are robust.
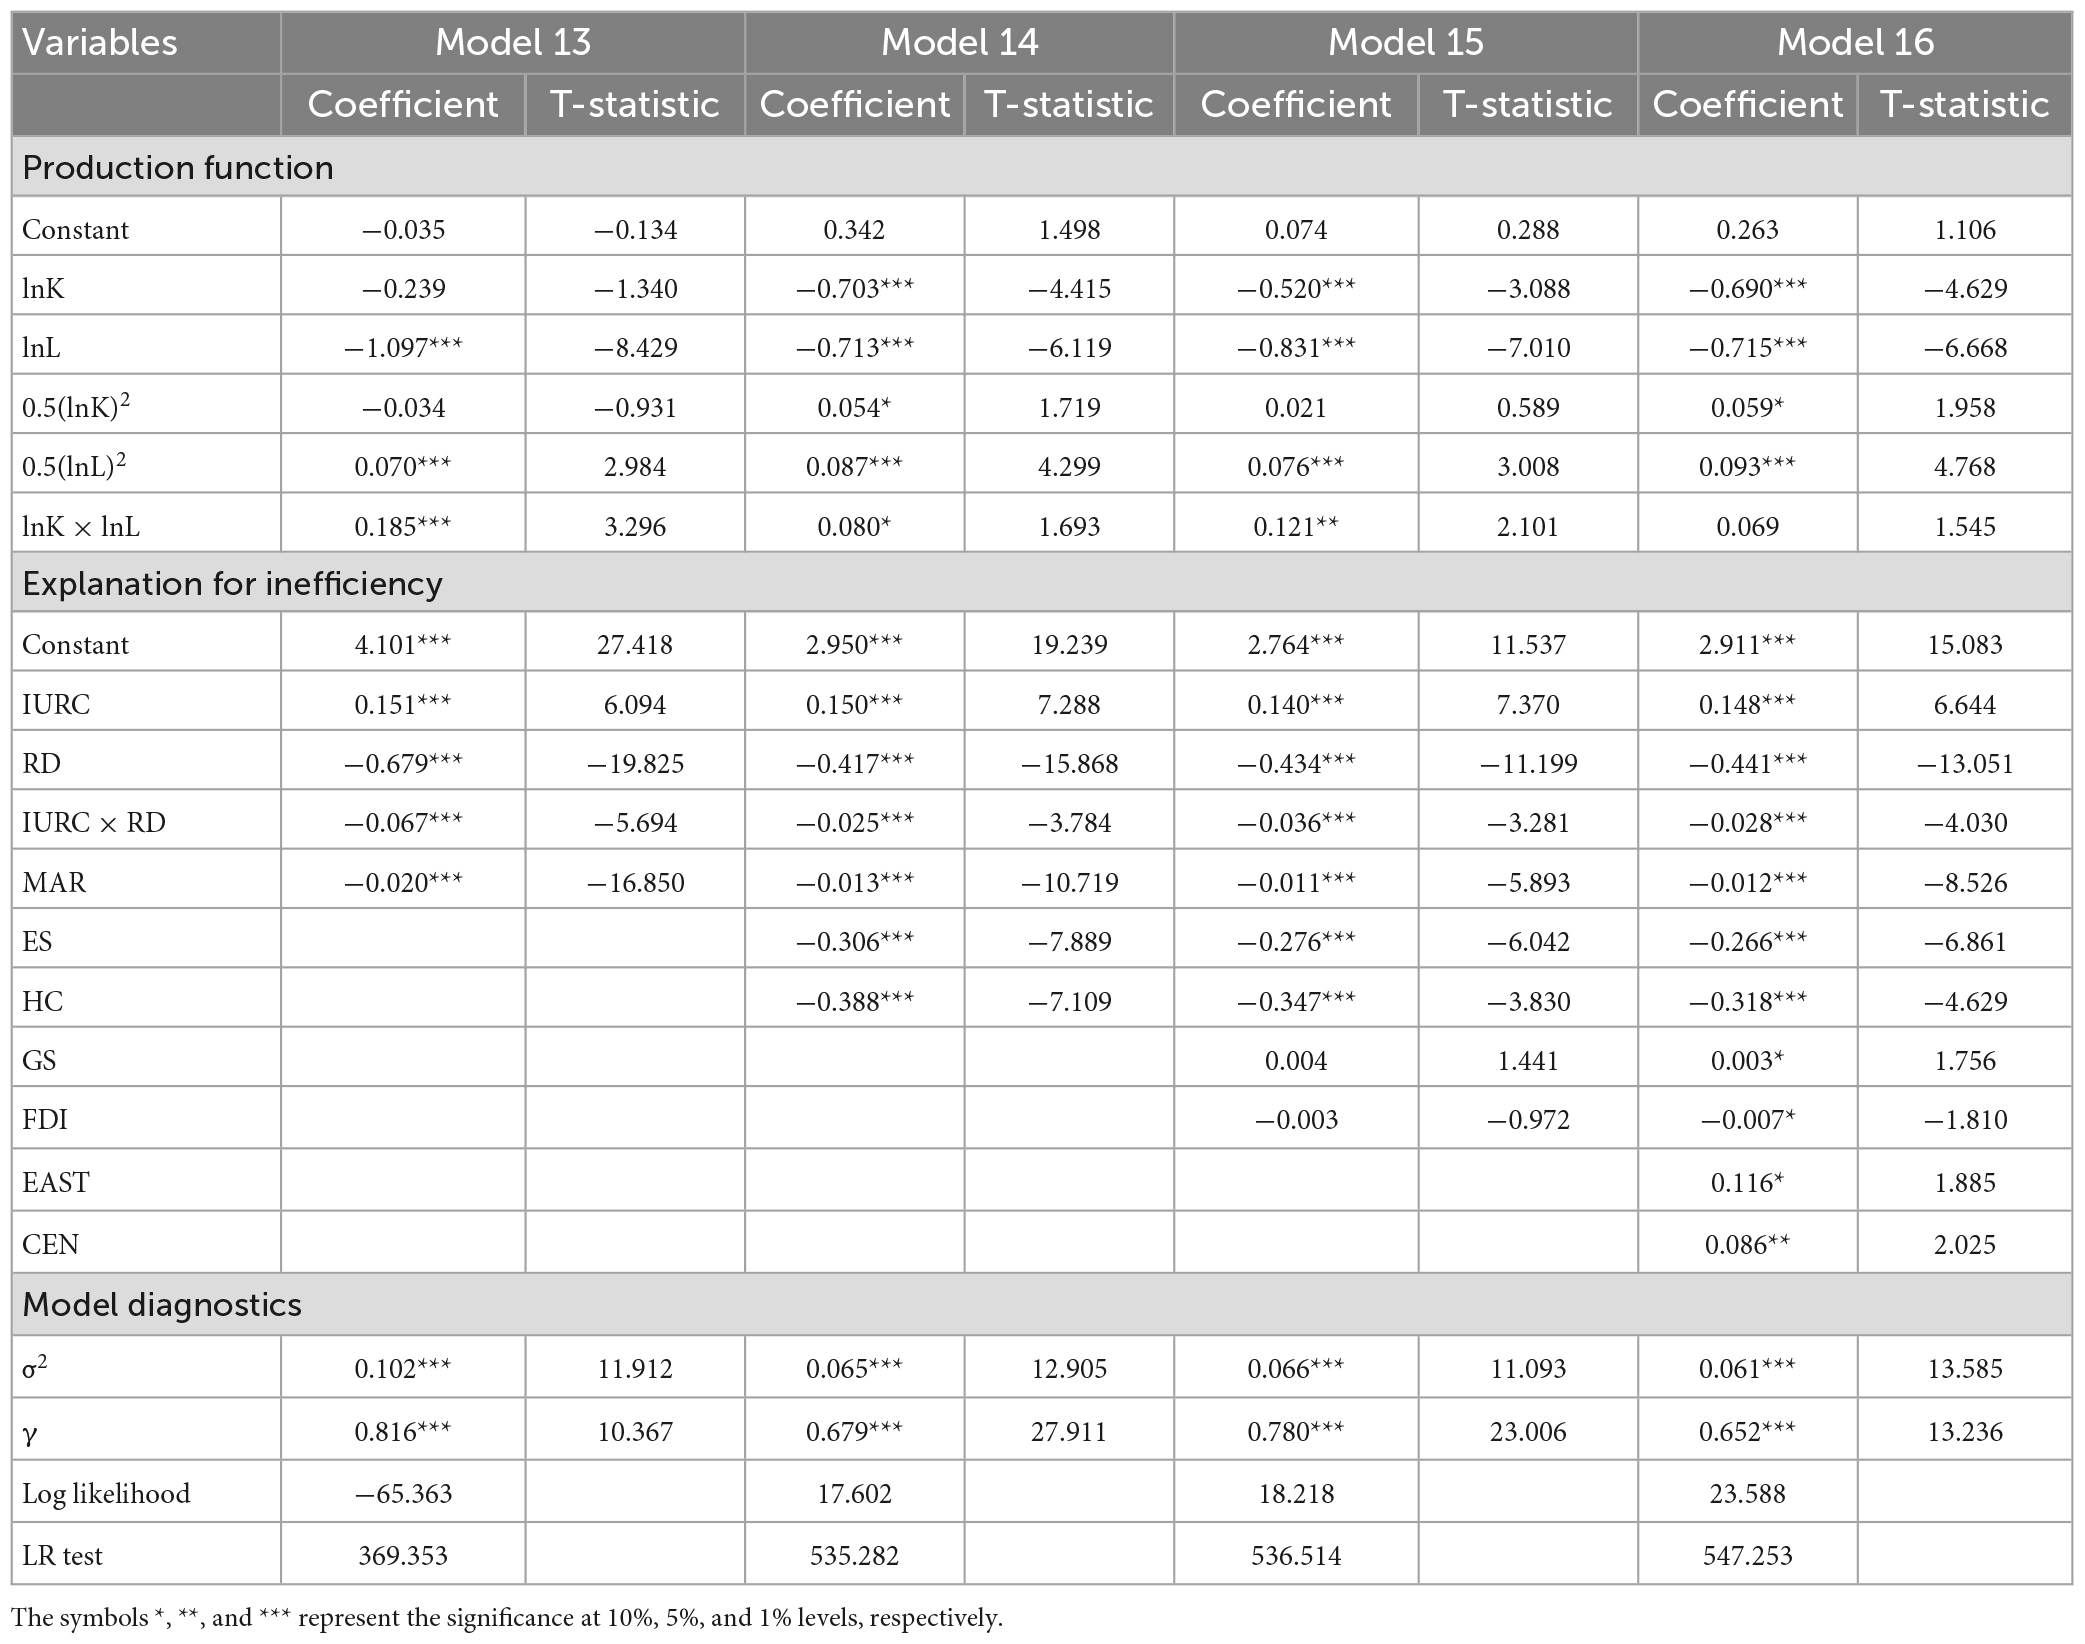
Table 10. Results of the robustness test of the dual effects of IURC.
It should be noted that the LR test of the time variable t shows that Equation 9 containing the time variable t is more applicable to the sample data. We take the estimated results of excluding the time variable t as a supplement to clarify whether the change in the form of the function will lead to the deviation of the estimated results. It shows that the estimated results are consistent regardless of whether the time variable t is considered.
4.5. Discussion
Compared with traditional pollution-intensive industries, there are relatively few literatures on the EE of HTM. The results of this article show that IURC significantly inhibits the EE of Chinese HTM, while R&D investment has a significant positive effect on the EE of China’s HTM. This is analogous to the research conclusion of Peng et al. (2022).
The direct effect of IURC on HTM’s EE is significantly negative. The possible reason is that, overall, the environmental technology obtained through IURC is not at the forefront of technology. At the same time, these technologies are easy to be replaced by foreign technologies (Peng et al., 2018). From the point of view of cost and benefit, backward enterprises will not actively purchase environmental technology from domestic universities and scientific research institutions, while domestic technology leading enterprises are reluctant to transfer their own environmental technology to other enterprises for maintaining their own technological advantages. All these things make it difficult for IURC to have a direct and positive effect on the EE of HTM.
Research and development investment has significantly improved the EE of China’s HTM. R&D investment increases the environmental technology accumulation of HTM enterprises in the production process and urges these enterprises to launch more environmentally friendly new products and technologies (Chen et al., 2020), which has a significant positive impact on the EE of HTM.
In addition, both Models 5, 6, 7, and 8 show that there is a significant complementary effect between IURC and R&D investment, and this complementary effect significantly promotes the EE of HTM. As the environmental technology gap between Chinese high-tech enterprises is relatively small, R&D investment has enhanced the absorptive capacity of HTM enterprises to indigenous technology (Spithoven et al., 2010; Aldieri et al., 2018). These not only make the purchased indigenous technology easy to be digested and absorbed by the receiver, but also enable the technology receiver to develop more environmentally friendly technologies based on absorbing indigenous technology. As a result, the receiver improves EE in the process of absorbing and improving the acquired indigenous technology.
The results also indicate that in developing countries, external technology does not necessarily contribute to efficiency improvement, but the complementary effect of external technology and R&D has a positive impact on efficiency. Similar studies, Danquah (2018) confirmed that although import has an obstructive effect on the efficiency of sub-Saharan African countries, the complementary effect of import and R&D promotes its efficiency (Danquah, 2018). Barasa et al. (2019) found that although foreign technology has a negative impact on the technical efficiency of African manufacturing enterprises, the complementary effect of foreign technology and R&D investment is very important to improve efficiency (Barasa et al., 2019).
However, different from Peng et al. (2022), this article focuses on the direct and indirect effects of IURC on the EE of HTM. This article found that although IURC cannot directly improve EE, it has a positive impact on the EE of HTM through its complementary effect with R&D investment. This means that ignoring the indirect effect will exaggerate the adverse impact of IURC on HTM’s EE. In addition, Peng et al. (2022) used the SBM-Tobit model to analyze the influencing factors of EE of HTM, which did not consider the impact of random factors, while the PP-SFA model proposed in this study further improved the reliability of the analytical results.
5. Conclusion and policy implications
In this study, a translog stochastic frontier model considering undesirable outputs was proposed by combining the PP model with the SFA. Based on the interprovincial data of Chinese HTM from 2006 to 2017, this study analyzed the links between IURC and HTM’s EE. The results show that IURC has both a significant negative direct effect and a significant positive indirect effect on the EE of HTM. On the surface, IURC suppresses the improvement of EE. However, there is a significant complementary effect between IURC and R&D investment, which has a significant positive impact on the EE of HTM. The results also confirm that there are significant regional differences in HTM’s EE in China. In general, there is much room for improvement in the EE of China’s HTM.
Although IURC has a direct inhibitory effect on the EE of HTM, there is a significant complementary effect between IURC and R&D investment. Therefore, in the process of actively promoting the green development of HTM, we should not only pay attention to increasing R&D investment in environmental technology, but also pay attention to promoting IURC. In the process of facilitating HTM enterprises to introduce indigenous technology from universities and scientific research institutions, decision-makers should pay more attention to improving the institutional environment of IURC. All of these can have a positive impact on the EE of China’s HTM. With the transfer of HTM from eastern China to other regions, the green development of eastern HTM will depend more on R&D investment. In the process of undertaking the transfer of HTM, the central and western provinces should combine the local industrial foundation and the technological capacity of enterprises and introduce suitable indigenous technology to improve the technological process, to promote the transformation of HTM to green development. At the same time, the central and western regions should also learn from the experience of IURC in the eastern region to improve the market-oriented management level of their technology transfer institutions.
There are also some shortcomings in this study. China’s HTM includes computer manufacturing, medical equipment manufacturing, and other subsectors, which have different environmental pollution status and environmental technology level. It is necessary to deeply analyze the EE of HTM and its influencing factors in specific subsectors. In addition, the differences in industrial base and environmental policies between the three areas of China will also affect decision-making on IURC and R&D investment. However, we reckoned without these factors in this article, which will be the next focus of research.
Data availability statement
The original contributions presented in this study are included in the article/supplementary material, further inquiries can be directed to the corresponding author.
Author contributions
FP: conceptualization, methodology, software, validation, formal analysis, data curation, writing—review and editing, supervision, and project administration. XZ: conceptualization, writing—original draft preparation, and formal analysis. Both authors had read and agreed to the published version of the manuscript.
Funding
This research was funded by the Project of Humanities and Social Sciences of Ministry of Education of China (grant number: 18YJC630131).
Acknowledgments
The authors are grateful to the reviewers and the editor for their constructive comments and suggestions for this manuscript.
Conflict of interest
The authors declare that the research was conducted in the absence of any commercial or financial relationships that could be construed as a potential conflict of interest.
Publisher’s note
All claims expressed in this article are solely those of the authors and do not necessarily represent those of their affiliated organizations, or those of the publisher, the editors and the reviewers. Any product that may be evaluated in this article, or claim that may be made by its manufacturer, is not guaranteed or endorsed by the publisher.
References
Aldieri, L., Kotsemir, M., and Vinci, C. P. (2020). The role of environmental innovation through the technological proximity in the implementation of the sustainable development. Bus. Strategy Environ. 29, 493–502. doi: 10.1002/bse.2382
Aldieri, L., Sena, V., and Vinci, C. P. (2018). Domestic R&D spillovers and absorptive capacity: Some evidence for US, Europe and Japan. Int. J. Prod. Econ. 198, 38–49. doi: 10.1016/j.ijpe.2018.01.015
An, Q. X., Tao, X. Y., Dai, B., and Li, J. L. (2020). Modified distance friction minimization model with undesirable output: An application to the environmental efficiency of China’s regional industry. Comput. Econ. 55, 1047–1071. doi: 10.1007/s10614-019-09888-w
Bai, X. J., Li, Z. Y., and Zeng, J. (2020). Performance evaluation of China’s innovation during the industry-university-research collaboration process—An analysis basis on the dynamic network slacks-based measurement model. Technol. Soc. 62:101310. doi: 10.1016/j.techsoc.2020.101310
Barasa, L., Vermeulen, P., Knoben, J., Kinyanjui, B., and Kimuyu, P. (2019). Innovation inputs and efficiency: Manufacturing firms in Sub-Saharan Africa. Eur. J. Innov. Manag. 22, 59–83. doi: 10.1108/ejim-11-2017-0176
Battese, G. E., and Coelli, T. J. (1995). A model for technical inefficiency effects in a stochastic frontier production function for panel data. Empir. Econ. 20, 325–332. doi: 10.1007/BF01205442
Ben Arfi, W., Hikkerova, L., and Sahut, J. M. (2018). External knowledge sources, green innovation and performance. Technol. Forecast. Soc. Chang. 129, 210–220. doi: 10.1016/j.techfore.2017.09.017
Bibi, Z., Khan, D., and Haq, I. U. (2020). Technical and environmental efficiency of agriculture sector in South Asia: A stochastic frontier analysis approach. Environ. Dev. Sustain. 23, 9260–9279. doi: 10.1007/s10668-020-01023-2
Caloghirou, Y., Kastelli, I., and Tsakanikas, A. (2004). Internal capabilities and external knowledge sources: Complements or substitutes for innovative performance? Technovation 24, 29–39. doi: 10.1016/s0166-4972(02)00051-2
Chang, Y., Chen, L., Zhou, Y., and Meng, Q. (2022). Elements, characteristics, and performances of inter-enterprise knowledge recombination: Empirical research on green innovation adoption in China’s heavily polluting industry. J. Environ. Manage. 310:114736. doi: 10.1016/j.jenvman.2022.114736
Chen, H., Yang, Y., Yang, M., and Huang, H. (2022). The impact of environmental regulation on China’s industrial green development and its heterogeneity. Front. Ecol. Evol. 10:967550. doi: 10.3389/fevo.2022.967550
Chen, L., and Jia, G. Z. (2017). Environmental efficiency analysis of China’s regional industry: A data envelopment analysis (DEA) based approach. J. Clean. Prod. 142, 846–853. doi: 10.1016/j.jclepro.2016.01.045
Chen, X. F., Liu, Z. Y., and Zhu, Q. Y. (2018). Performance evaluation of China’s high-tech innovation process: Analysis based on the innovation value chain. Technovation 74–75, 42–53. doi: 10.1016/j.technovation.2018.02.009
Chen, X., Liu, X., Gong, Z., and Xie, J. (2021). Three-stage super-efficiency DEA models based on the cooperative game and its application on the R&D green innovation of the Chinese high-tech industry. Comput. Ind. Eng. 156:107234. doi: 10.1016/j.cie.2021.107234
Chen, Y. H., Zhu, B., Sun, X. X., and Xu, G. H. (2020). Industrial environmental efficiency and its influencing factors in China: Analysis based on the Super-SBM model and spatial panel data. Environ. Sci. Pollut. Res. 27, 44267–44278. doi: 10.1007/s11356-020-10235-y
Coe, D. T., Helpman, E., and Hoffmaister, A. W. (2009). International R&D spillovers and institutions. Eur. Econ. Rev. 53, 723–741. doi: 10.1016/j.euroecorev.2009.02.005
Cohen, W. M., and Levinthal, D. A. (1990). Absorptive capacity: A new perspective on learning and innovation. Adm. Sci. Q. 35, 128–152. doi: 10.2307/2393553
Danquah, M. (2018). Technology transfer, adoption of technology and the efficiency of nations: Empirical evidence from sub Saharan Africa. Technol. Forecast. Soc. Change 131, 175–182. doi: 10.1016/j.techfore.2017.12.007
De Marchi, V., and Grandinetti, R. (2013). Knowledge strategies for environmental innovations: The case of Italian manufacturing firms. J. Knowl. Manag. 17, 569–582. doi: 10.1108/jkm-03-2013-0121
Diez-Martinez, I., Peiro-Signes, A., and Segarra-Ona, M. (2022). The links between active cooperation and eco-innovation orientation of firms: A multi-analysis study. Bus. Strategy Environ. 32, 430–443. doi: 10.1002/bse.3145
Fei, R. L., Cui, A. X., and Qin, K. Y. (2020). Can technology R&D continuously improve green development level in the open economy? Empirical evidence from China’s industrial sector. Environ. Sci. Pollut. Res. 27, 34052–34066. doi: 10.1007/s11356-020-09357-0
Hou, J., Chen, H., and Xu, J. Z. (2017). External knowledge sourcing and green innovation growth with environmental and energy regulations: Evidence from manufacturing in China. Sustainability 9:342. doi: 10.3390/su9030342
Hu, D., Wang, Y., and Li, Y. (2017). How does open innovation modify the relationship between environmental regulations and productivity? Bus. Strategy Environ. 26, 1132–1143. doi: 10.1002/bse.1974
Kafouros, M. I., and Buckley, P. J. (2008). Under what conditions do firms benefit from the research efforts of other organizations? Res. Policy 37, 225–239. doi: 10.1016/j.respol.2007.11.005
Kafouros, M. I., and Forsans, N. (2012). The role of open innovation in emerging economies: Do companies profit from the scientific knowledge of others? J. World Bus. 47, 362–370. doi: 10.1016/j.jwb.2011.05.004
Kang, Y. Q., Xie, B. C., Wang, J., and Wang, Y. N. (2018). Environmental assessment and investment strategy for China’s manufacturing industry: A non-radial DEA based analysis. J. Clean. Prod. 175, 501–511. doi: 10.1016/j.jclepro.2017.12.043
Khan, D., Nouman, M., and Ullah, A. (2022). Assessing the impact of technological innovation on technically derived energy efficiency: A multivariate co-integration analysis of the agricultural sector in South Asia. Environ. Dev. Sustain. 1–23. doi: 10.1007/s10668-022-02194-w
Khan, D., Nouman, M., Popp, J., Khan, M. A., Ur Rehman, F., and Oláh, J. (2021). Link between technically derived energy efficiency and ecological footprint: Empirical evidence from the ASEAN region. Energies 14:3923. doi: 10.3390/en14133923
Kwan, C. H. (2020). The China-US trade war: Deep-rooted causes, shifting focus and uncertain prospects. Asian Econ. Policy R. 15, 55–72. doi: 10.1111/aepr.12284
Leiponen, A., and Helfat, C. E. (2010). Innovation objectives, knowledge sources, and the benefits of breadth. Strateg. Manage. J. 31, 224–236. doi: 10.1002/smj.807
Li, D., and Zeng, T. (2020). Are China’s intensive pollution industries greening? An analysis based on green innovation efficiency. J. Clean. Prod. 259:120901. doi: 10.1016/j.jclepro.2020.120901
Li, H., Fang, K. N., Yang, W., Wang, D., and Hong, X. X. (2013). Regional environmental efficiency evaluation in China: Analysis based on the Super-SBM model with undesirable outputs. Math. Comput. Model. 58, 1018–1031. doi: 10.1016/j.mcm.2012.09.007
Li, M. J., and Tao, W. Q. (2017). Review of methodologies and polices for evaluation of energy efficiency in high energy-consuming industry. Appl. Energy 187, 203–215. doi: 10.1016/j.apenergy.2016.11.039
Li, T., Liang, L., and Han, D. (2018). Research on the efficiency of green technology innovation in China’s provincial high-end manufacturing industry based on the RAGA-PP-SFA model. Math. Probl. Eng. 2018:9463707. doi: 10.1155/2018/9463707
Lokshin, B., Belderbos, R., and Carree, M. (2008). The productivity effects of internal and external R&D: Evidence from a dynamic panel data model. Oxford B. Econ. Stat. 70, 399–413. doi: 10.1111/j.1468-0084.2008.00503.x
Lu, C. H., and Pang, Y. (2017). An anatomy of China’s eco-efficiency gains: The role of FDI. Asia Pac. J. Account. E. 24, 106–126. doi: 10.1080/16081625.2015.1062244
Ma, D. L., Xiong, H. T., Zhang, F. T., Gao, L., Zhao, N., Yang, G. M., et al. (2022). China’s industrial green total-factor energy efficiency and its influencing factors: A spatial econometric analysis. Environ. Sci. Pollut. Res. 29, 18559–18577. doi: 10.1007/s11356-021-17040-1
Oke, A. (2013). Linking manufacturing flexibility to innovation performance in manufacturing plants. Int. J. Prod. Econ. 143, 242–247. doi: 10.1016/j.ijpe.2011.09.014
Ouyang, X., Wang, J., Chen, X., Zhao, X., Ye, H., Watson, A. E., et al. (2021). Applying a projection pursuit model for evaluation of ecological quality in Jiangxi Province, China. Ecol. Indic. 133:108414. doi: 10.1016/j.ecolind.2021.108414
Peng, F., Zhang, X., and Zhou, S. (2022). The role of foreign technology transfer in improving environmental efficiency: Empirical evidence from China’s high-tech industry. Front. Environ. Sci. 10:855427. doi: 10.3389/fenvs.2022.855427
Peng, F., Zhou, Y. Z., and Zhou, S. Z. (2018). The impact of technology transfer on the efficiency of high-tech industries from an environmental perspective. Wuhan: Wuhan University Press.
Qu, Y., Yu, Y., Appolloni, A., Li, M. R., and Liu, Y. (2017). Measuring green growth efficiency for Chinese manufacturing industries. Sustainability 9:637. doi: 10.3390/su9040637
Rabal-Conesa, J., Jimenez-Jimenez, D., and Martinez-Costa, M. (2022). Organisational agility, environmental knowledge and green product success. J. Knowl. Manag. 26, 2440–2462. doi: 10.1108/jkm-06-2021-0486
Rasheed, N., Khan, D., and Magda, R. (2022). The influence of institutional quality on environmental efficiency of energy consumption in BRICS countries. Front. Energy Res. 10:943771. doi: 10.3389/fenrg.2022.943771
Shahabadi, A., Kimiaei, F., and Arbab Afzali, M. (2018). The evaluation of impacts of knowledge-based economy factors on the improvement of total factor productivity (a comparative study of emerging and G7 economies). J. Knowl. Econ. 9, 896–907. doi: 10.1007/s13132-016-0379-3
Shao, Y. M., and Wang, S. Y. (2016). Productivity growth and environmental efficiency of the nonferrous metals industry: An empirical study of China. J. Clean. Prod. 137, 1663–1671. doi: 10.1016/j.jclepro.2016.03.041
Song, M. L., Peng, J., Wang, J. L., and Zhao, J. J. (2018). Environmental efficiency and economic growth of China: A Ray slack-based model analysis. Eur. J. Oper. Res. 269, 51–63. doi: 10.1016/j.ejor.2017.03.073
Song, M., An, Q., Zhang, W., Wang, Z., and Wu, J. (2012). Environmental efficiency evaluation based on data envelopment analysis: A review. Renew. Sustain. Energ. Rev. 16, 4465–4469. doi: 10.1016/j.rser.2012.04.052
Song, Y., Yang, T., and Zhang, M. (2019). Research on the impact of environmental regulation on enterprise technology innovation-an empirical analysis based on Chinese provincial panel data. Environ. Sci. Pollut. Res. 26, 21835–21848. doi: 10.1007/s11356-019-05532-0
Song, Y., Zhang, J., Song, Y., Fan, X., Zhu, Y., and Zhang, C. (2020). Can industry-university-research collaborative innovation efficiency reduce carbon emissions? Technol. Forecast. Soc. Chang. 157:120094. doi: 10.1016/j.techfore.2020.120094
Spithoven, A., Clarysse, B., and Knockaert, M. (2010). Building absorptive capacity to organise inbound open innovation in traditional industries. Technovation 30, 130–141. doi: 10.1016/j.technovation.2009.08.004
Sun, J., Du, T., Sun, W., Na, H., He, J., Qiu, Z., et al. (2019). An evaluation of greenhouse gas emission efficiency in China’s industry based on SFA. Sci. Total. Environ. 690, 1190–1202. doi: 10.1016/j.scitotenv.2019.07.093
Sun, W., and Huang, C. (2020). How does urbanization affect carbon emission efficiency? Evidence from China. J. Clean. Prod. 272:122828. doi: 10.1016/j.jclepro.2020.122828
Tao, F., Li, L., and Xia, X. H. (2012). Industry efficiency and total factor productivity growth under resources and environmental constraint in China. Sci. World J. 2012:310407. doi: 10.1100/2012/310407
Walheer, B., and He, M. (2020). Technical efficiency and technology gap of the manufacturing industry in China: Does firm ownership matter? World Dev. 127:104769. doi: 10.1016/j.worlddev.2019.104769
Wang, D. L., Wan, K. D., and Yang, J. Y. (2019). Measurement and evolution of eco-efficiency of coal industry ecosystem in China. J. Clean. Prod. 209, 803–818. doi: 10.1016/j.jclepro.2018.10.266
Wang, Q., and Zhan, L. N. (2019). Assessing the sustainability of the shale gas industry by combining DPSIRM model and RAGA-PP techniques: An empirical analysis of Sichuan and Chongqing, China. Energy 176, 353–364. doi: 10.1016/j.energy.2019.03.158
Wang, Q., and Zhao, C. (2021). Dynamic evolution and influencing factors of industrial green total factor energy efficiency in China. Alex. Eng. J. 60, 1929–1937. doi: 10.1016/j.aej.2020.11.040
Wang, X., Han, L. Y., and Yin, L. B. (2017). Environmental efficiency and its determinants for manufacturing in China. Sustainability 9:47. doi: 10.3390/su9010047
Wang, Y., Roijakkers, N., Vanhaverbeke, W., and Chen, J. (2012). How Chinese firms employ open innovation to strengthen their innovative performance. Int. J. Technol. Manage. 59, 235–254. doi: 10.1504/ijtm.2012.047245
Wang, Y., Zhao, N., Lei, X., and Long, R. (2021). Green finance innovation and regional green development. Sustainability 13:8230. doi: 10.3390/su13158230
Wei, Y., and Liu, X. (2006). Productivity spillovers from R&D, exports and FDI in China’s manufacturing sector. J. Int. Bus. Stud. 37, 544–557. doi: 10.1057/palgrave.jibs.8400209
Wu, J., An, Q. X., Yao, X., and Wang, B. (2014). Environmental efficiency evaluation of industry in China based on a new fixed sum undesirable output data envelopment analysis. J. Clean. Prod. 74, 96–104. doi: 10.1016/j.jclepro.2014.03.054
Wu, Q., Li, Y., Wu, Y., Li, F., and Zhong, S. (2022). The spatial spillover effect of environmental regulation on the total factor productivity of pharmaceutical manufacturing industry in China. Sci. Rep. 12:11642. doi: 10.1038/s41598-022-15614-8
Wu, S., Tian, C., Li, B., Wang, J., and Wang, Z. (2022). Ecological environment health assessment of lake water ecosystem system based on simulated annealing-projection pursuit: A case study of Plateau Lake. Sustain. Cities Soc. 86:104131. doi: 10.1016/j.scs.2022.104131
Xiao, C. M., Wang, Z., Shi, W. F., Deng, L. C., Wei, L. Y., Wang, Y. W., et al. (2018). Sectoral energy-environmental efficiency and its influencing factors in China: Based on S-U-SBM model and panel regression model. J. Clean. Prod. 182, 545–552. doi: 10.1016/j.jclepro.2018.02.033
Xie, B. C., Duan, N., and Wang, Y. S. (2017). Environmental efficiency and abatement cost of China’s industrial sectors based on a three-stage data envelopment analysis. J. Clean. Prod. 153, 626–636. doi: 10.1016/j.jclepro.2016.12.100
Xie, X. M., Zang, Z. P., and Qi, G. Y. (2016). Assessing the environmental management efficiency of manufacturing sectors: Evidence from emerging economies. J. Clean. Prod. 112, 1422–1431. doi: 10.1016/j.jclepro.2015.08.006
Xu, Q. R., Li, Y., and Wu, H. B. (2022). Market mechanism or non-market mechanism, which kind of technology transfer is benefit to innovation capability. J. Ind. Eng. Eng. Manage. 34, 196–206. doi: 10.13587/j.cnki.jieem.2020.04.021
Yang, Z., Chen, H., Du, L., Lin, C., and Lu, W. (2021). How does alliance-based government-university-industry foster cleantech innovation in a green innovation ecosystem? J. Clean. Prod. 283:124559. doi: 10.1016/j.jclepro.2020.124559
Yao, X., Hu, Y., Gong, H., and Chen, D. (2021). Characteristics and evolution of China’s industry–university–research collaboration to promote the sustainable development: Based on policy text analysis. Sustainability 13:13105. doi: 10.3390/su132313105
Yu, S., and Lu, H. W. (2018). An integrated model of water resources optimization allocation based on projection pursuit model – Grey wolf optimization method in a transboundary river basin. J. Hydrol. 559, 156–165. doi: 10.1016/j.jhydrol.2018.02.033
Yuan, B. L., Ren, S. G., and Chen, X. H. (2017). Can environmental regulation promote the coordinated development of economy and environment in China’s manufacturing industry? A panel data analysis of 28 sub-sectors. J. Clean. Prod. 149, 11–24. doi: 10.1016/j.jclepro.2017.02.065
Zhang, C., and Chen, P. (2021). Industrialization, urbanization, and carbon emission efficiency of Yangtze River Economic Belt-empirical analysis based on stochastic frontier model. Environ. Sci. Pollut. Res. Int. 28, 66914–66929. doi: 10.1007/s11356-021-15309-z
Zhang, X., Li, R., and Zhang, J. L. (2022). Understanding the green total factor productivity of manufacturing industry in China: Analysis based on the super-SBM model with undesirable outputs. Sustainability 14:9310. doi: 10.3390/su14159310
Keywords: environmental efficiency, industry-university-research cooperation (IURC), high-tech manufacturing, stochastic frontier analysis, undesirable outputs, research and development investment, projection pursuit model
Citation: Peng F and Zhang X (2023) Does industry-university-research cooperation promote the environmental efficiency of China’s high-tech manufacturing? Front. Ecol. Evol. 11:1148018. doi: 10.3389/fevo.2023.1148018
Received: 19 January 2023; Accepted: 15 March 2023;
Published: 30 March 2023.
Edited by:
Magdalena Klimczuk-Kochańska, University of Warsaw, PolandReviewed by:
Dilawar Khan, Kohat University of Science and Technology, PakistanNing Ma, Hainan College of Economics and Business, China
Yuan Xu, Dalian Maritime University, China
Copyright © 2023 Peng and Zhang. This is an open-access article distributed under the terms of the Creative Commons Attribution License (CC BY). The use, distribution or reproduction in other forums is permitted, provided the original author(s) and the copyright owner(s) are credited and that the original publication in this journal is cited, in accordance with accepted academic practice. No use, distribution or reproduction is permitted which does not comply with these terms.
*Correspondence: Xichun Zhang, Y2llbm5hemhhbmdAMTYzLmNvbQ==