 Yongyang Wang
 Yanpeng Cai
 Yulei Xie1
95% of researchers rate our articles as excellent or good
Learn more about the work of our research integrity team to safeguard the quality of each article we publish.
Find out more
ORIGINAL RESEARCH article
Front. Ecol. Evol. , 02 November 2023
Sec. Urban Ecology
Volume 11 - 2023 | https://doi.org/10.3389/fevo.2023.1144244
This article is part of the Research Topic Evaluation of Urban Ecological Security and Measurement of Urban Ecological Resilience View all 18 articles
Intensive human and economic activities in urban areas have had adverse effects on local resources and ecology, leading to a decline in ecological resilience. Enhancing ecological resilience is crucial for improving the urban ecosystem's ability to withstand and recover from external risks. However, quantitative research on urban ecological resilience remains somewhat ambiguous, with many studies lacking comprehensive assessment methods from multiple perspectives. In this study, we established a comprehensive framework to assess urban ecological resilience based on four regime attributes. The study's results indicated the following key findings: The average urban ecological resilience value exhibited a trend of initially declining and then recovering. Cities proposed different approaches when considering and managing social and ecological relationships during the development process. A significant correlation between urbanization levels and ecological resilience was observed, with urban ecological resilience increasing in areas with low urbanization levels and sharply decreasing in areas with high urbanization levels. The findings from this study provide a specific theoretical foundation for decision-makers involved in urban planning and development strategies.
Considering the continuous increase of urbanization processes and human activities in the biophysical environment, it has been observed that the vulnerability of cities to uncertain risks and extreme events increases exponentially, which is mainly derived from events associated with climate change, such as storms, floods, and extreme drought (Ribeiro and Pena Jardim Gonçalves, 2019). Such extreme environmental events cause over 30,000 deaths per year and US$ 250–300 billion yearly in global economic losses, according to statistical data (Eakin et al., 2017). Against this backdrop, many policymakers have proposed some related policies, such as One NYC 2050, which aims to build a strong and fair city, and 100 Resilient Cities, which aims to help cities improve self-resilience to resist environmental risks (Zhao et al., 2021). Resilience, as an attractive concept for cities, became a core goal of urban development (Batty, 2008). As a “way of thinking” in several empirical settings (Folke et al., 2002), resilience became foundational thinking to understanding how a complex system survives under external interference and uncertainty. Moreover, the resilience theory is widely used in urban research due to the definition of cities as the “example par excellence of complex systems” (Cai et al., 2009a; Meerow and Newell, 2016). Thus, many scholars have paid increasing attention to focusing on resilience.
In sustainable urban development and strategic approaches, the notion of urban resilience describes the ability of an urban system to absorb disturbances, and reorganize through reasonable preparation and buffering while retaining essentially the same characteristics (Shi et al., 2021; Cai et al., 2009b). Many scholars have broadened their studies on urban resilience. Some studies focused on exploring urban resilience from multiple perspectives, such as engineering, the economy, society, and ecology, on seeking practical measurements to quantify urban resilience (Pickett et al., 2013; Bozza et al., 2017; McGill, 2020; Man et al., 2021). However, these studies mainly focused on the resilience assessment of urban systems in the present moment or a certain state, which cannot analyze the change of urban resilience under extreme environmental events. Therefore, several researchers have become prone to explore the dynamic change of urban resilience to particular disasters, such as floods, earthquakes, and extreme climate, and discuss how cities can be more resilient to disasters (Crowley and Elliott, 2012; Dhar and Khirfan, 2017; Wang et al., 2019). With the construction of ecological civilization and the proposal of some ecological protection-related policies, research on the resilience of urban systems gradually began to investigate the characteristics of urban resilience from an ecological perspective.
Nevertheless, there are still some problems that need to be pointed out regarding urban ecological resilience. First, the definition of urban ecological resilience provided by academics with varied perspectives has not been fully agreed upon. Conceptually speaking, many studies confused the definition of ecological resilience, using other indicators to quantify resilience, such as vulnerability, exposure, and sensitivity. However, in fact, the obvious distinction lay in the definitions of these indicators. In general, vulnerability emphasizes the susceptibility of a system to face adverse impacts (Johnson et al., 2020). Sensitivity refers to the degree to which a system is altered or affected by perturbation (Fekete et al., 2014; Tan et al., 2010). Exposure means the degree of environmental or social stress that a system endures. The indicators mentioned above more likely reflect the impact degree to which a system is affected by risks and disasters. Differently, resilience focuses on a system’s ability to resist risks. The latter is a different understanding of the state of resilience. It can be concluded as two categories, single-state equilibrium and multiple-state equilibrium. Single-state equilibrium means the capacity of the urban ecosystem to resist disturbance and the ability to absorb interference and maintain essential function and structure (Holling, 1996; Folke et al., 2010). Multiple-state equilibrium refers to the capacity of urban systems to cause all of their socio-ecological and socio-technological networks to expand to maintain or recover perturbations of the functions needed to adapt to change and transform the system rapidly to reach a stable state (Meerow and Newell, 2015). However, both single-state equilibrium and multiple-state equilibrium tend to ignore the maximum anti-disturbance capacity of a system and pay more attention to the fundamental change of a system. In this study, combined with previous research, we suggest that there is a threshold (tipping point) in the urban ecosystem. If a system in equilibrium is perturbed but there is only one basin of attraction, it settles back to the same state. A sufficiently severe perturbation, though, might push the system into the center of another equilibrium if additional equilibria exist (Scheffer et al., 2015). Thus, the urban ecological resilience in this research is defined as the threshold of urban ecosystem transformation, that is, the capacity provided by the urban ecosystem to keep urban status stabilized in one basin of attraction.
The second problem is how to quantify and evaluate urban ecological resilience. In this respect, some quantitative frameworks for assessing urban ecological resilience have been proposed. For example, Baho et al. suggested a quantitative framework based on scales, adaptive capacity, thresholds, and alternative regime attributes to provide opportunities to supply a broader measurement of the general resilience of an ecosystem (Baho et al., 2017). Additionally, a number of studies attempted to quantify ecological resilience using the index system, which takes a variety of socioeconomic and environmental indices into account. Based on this framework, some indicator methods, such as PSR (Yang et al., 2020), DPSIR (Nathwani et al., 2019), and CAS theory (Wu et al., 2020), were used to analyze urban ecological resilience. However, there are clear disadvantages to the index method. The indicators taken into account could be insufficient or irrelevant, and spatial intangibles are not examined (Liu et al., 2022). Meanwhile, scholars claimed that it is unreasonable to ignore the function of landscape fragments and these spatial distributions with consideration of ecological resilience. The connection between landscape fragments primarily determines energy efficiency, information transfer, and biodiversity in a biophysical environment (Zhou et al., 2021). So, many studies focused on combining landscape ecology and network theory to construct the landscape ecological network for evaluating ecological resilience (Wang et al., 2021). Some specific indicators were used to represent ecological resilience, such as net primary productivity and species function (Roberts et al., 2019; Shi et al., 2022). Based on previous studies, we have found that when it comes to urban ecological resilience, whether it involves constructing an indicator system or incorporating other specific factors into the evaluation framework, the focus has primarily been on utilizing a particular characteristic of ecological resilience for quantitative assessment. However, these studies have lacked a quantitative assessment approach that considers the attribute of resilience. In fact, the multiple characteristics required to evaluate ecological resilience have a complex nature in their genesis, which allows them to interact and collectively represent resilience. Thus, in this study, our framework is based on decomposing ecological resilience as an ecosystem phenomenon into complementary attributes to evaluate resilience through multi-attribute analysis.
Based on the abovementioned, this study aimed to build a quantitative framework to evaluate urban ecological resilience, and four regime attributes, namely, adaptation, robustness, redundancy, and diversity, were chosen to conduct a comprehensive assessment of resilience and analyze the trends and characteristics of ecological resilience. In all, 48 cities from three major urban agglomerations in China were selected as targets to explore the spatiotemporal changing characteristics of urban ecological resilience during the period from 1985–2020. The results provided valuable information for decision-makers to manage urban sustainability and resilience development.
A city eventually acquires a wide range of natural resources and policy support and develops into a complex and diverse social, economic, and ecological ecosystem. Thus, it is essential to strengthen ecological resilience for a city to develop sustainably. In this study, 48 cities from three typical urban agglomerations, namely, the Yangtze River Delta (YRD), the Beijing-Tianjin-Hebei (BTH), and the Pearl River Delta (PRD), were selected as the case study (Figure 1). These cities occupy a main regional strategic position in China and are the most competitive economic core areas in the world. The BTH, situated in the North China Plain, is a political and cultural center comprising two province-level municipalities (Beijing and Tianjin) and 11 cities in Hebei province. It occupies 1.9% of the land area in China (182,000 km2) but contains 118 million permanent residents. The region contributed to 8.5% of the country’s overall gross domestic product (GDP) in 2018, amounting to a total of 8,600 billion yuan. The YRD, which is located in the lower Yangtze River basin of China, consists of 26 cities spread across three provinces and one city, with a total size of 217,700 km2, or approximately 2.2% of the country’s total land area. It generated roughly 21,200 billion yuan in 2020 with an average GDP growth rate of 4%, outpacing the country as a whole (2.3%). Situated on the southern coast, the PRD region comprises nine cities spanning an area of 55,000 km2. In 2020, it played a vital role in contributing to the national GDP by accounting for a substantial 8.9% of the GDP (equivalent to 9,000 billion yuan), with the GDP per capita surpassing 110,000 yuan.
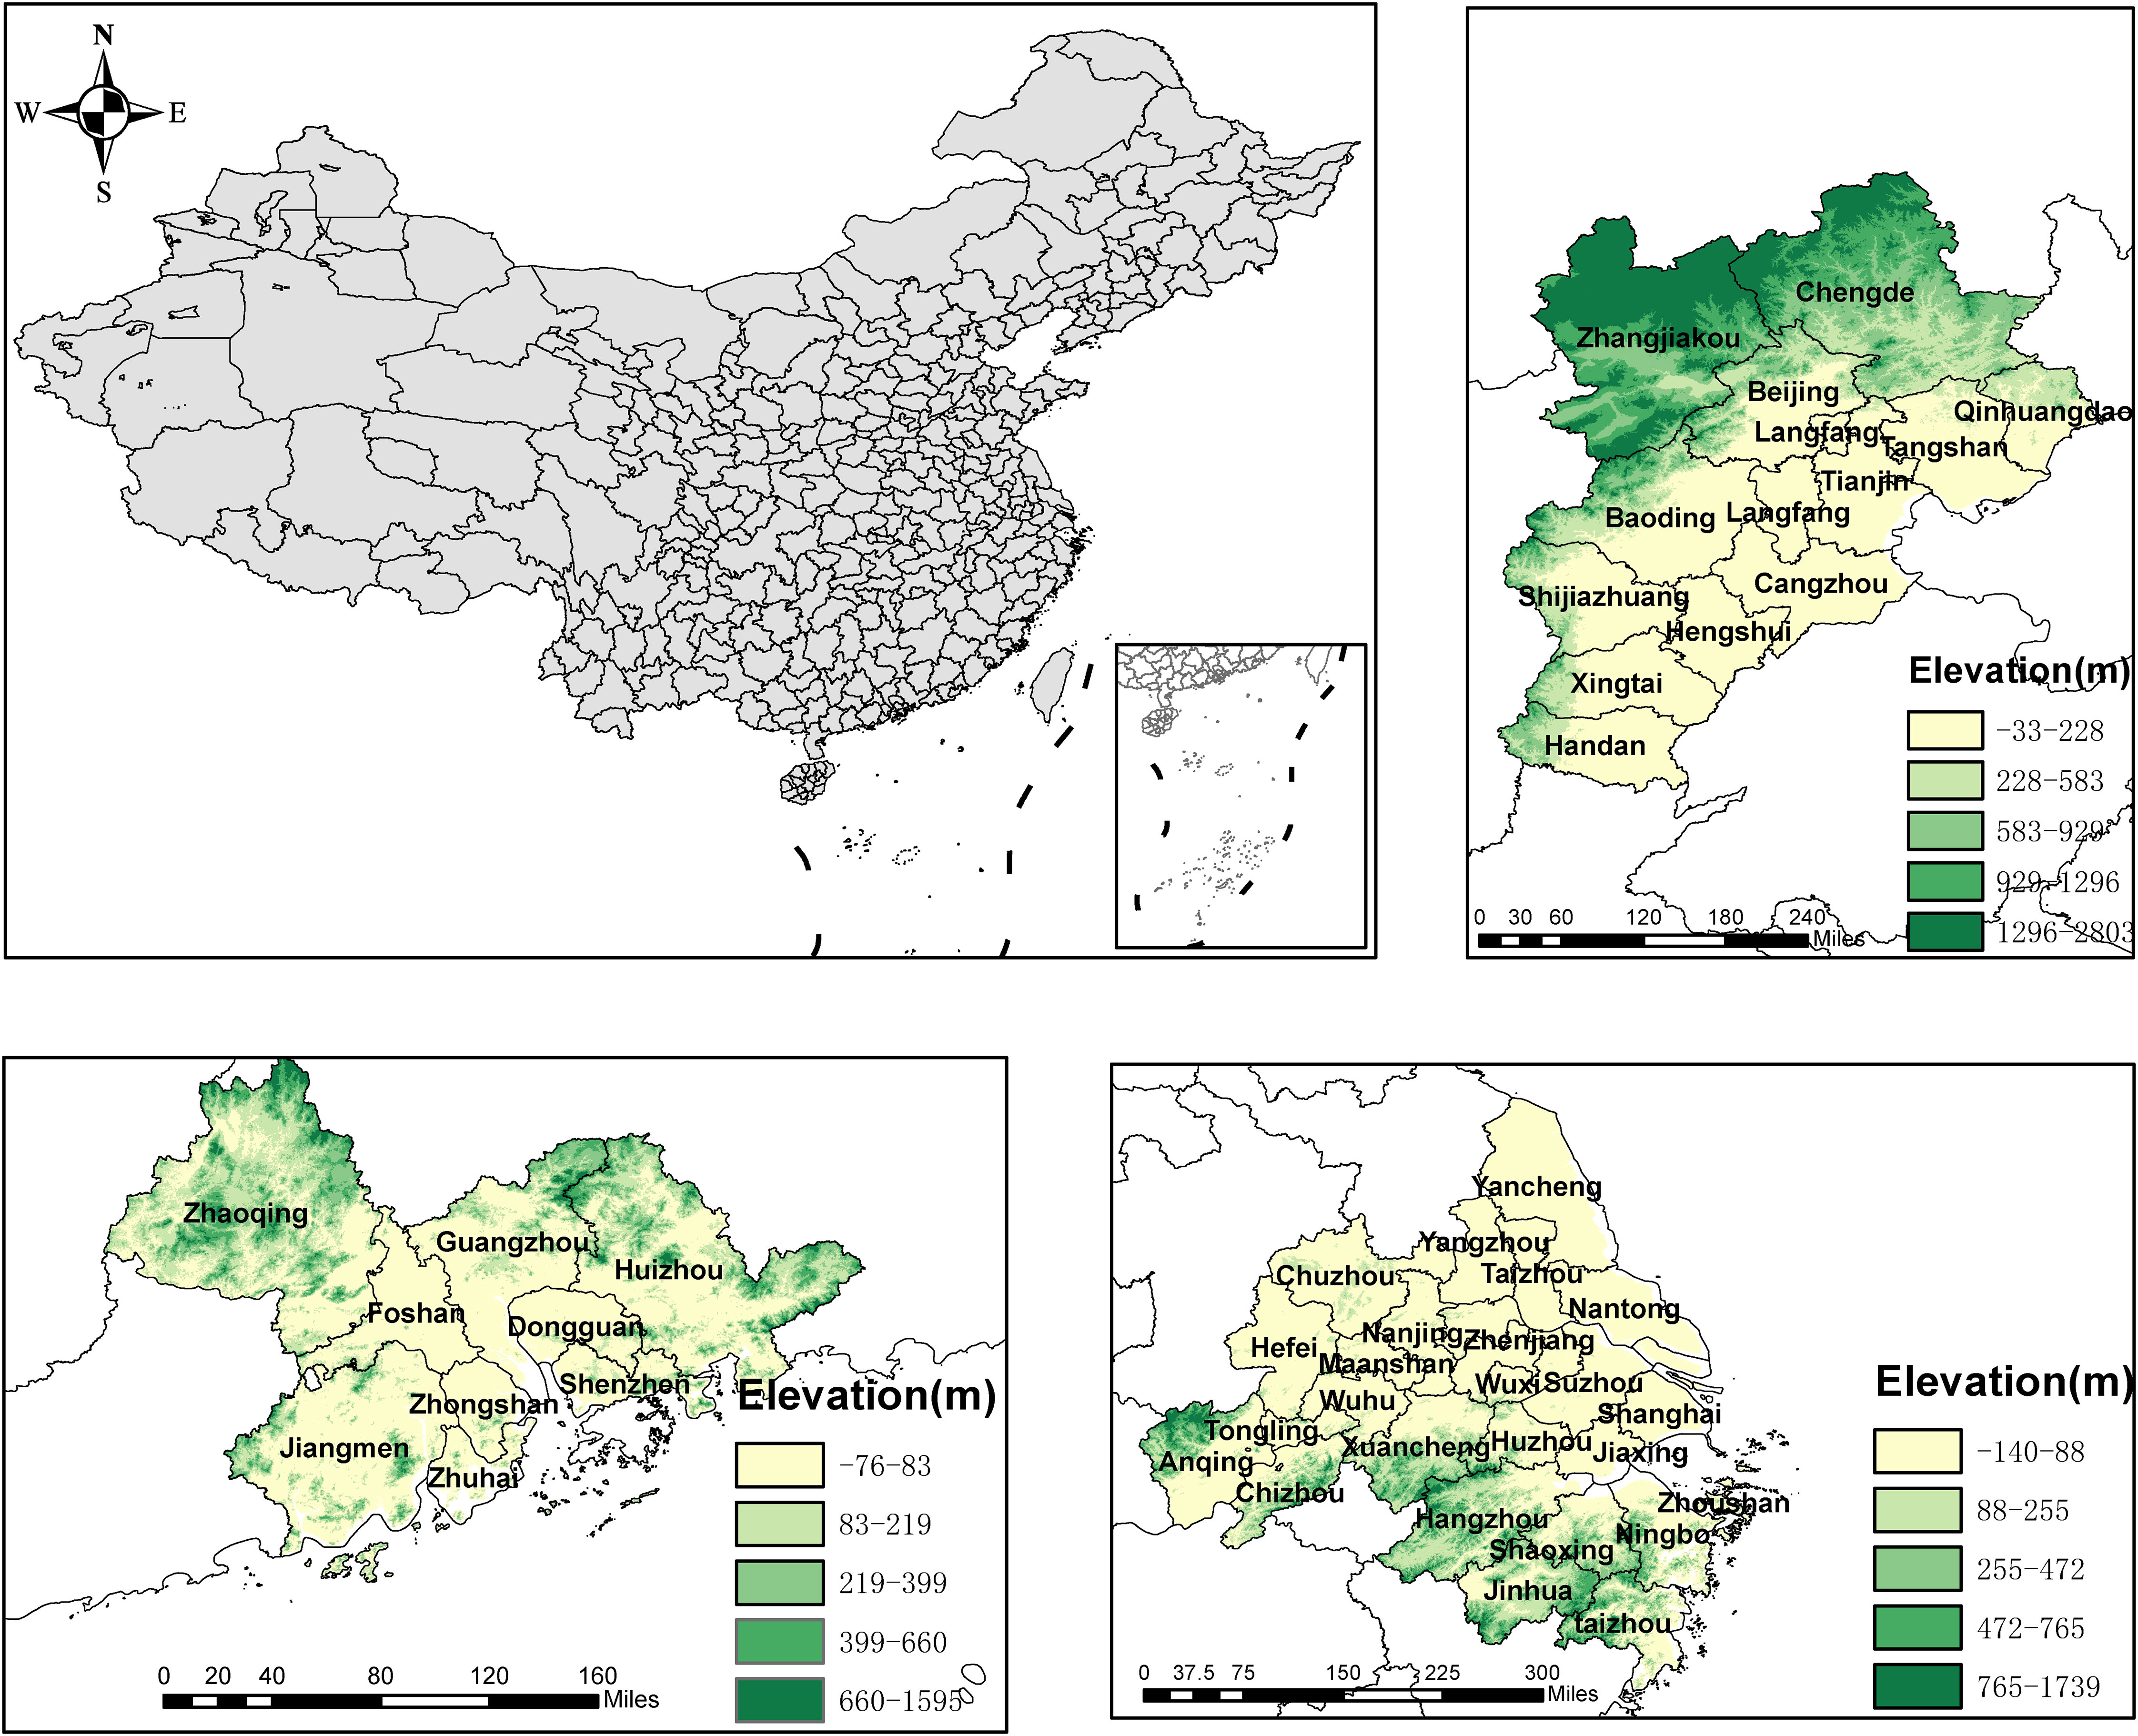
Figure 1 The study area of 48 cities in China.
Urban ecological resilience is characterized by distinct attributes of ecosystems and other complex systems (Baho et al., 2017). By dissecting the characteristics of ecological resilience, it has been summarized that the ability to provide ecosystem services needs to be demonstrated in the whole urban area. Simultaneously, in the urban area, patches or infrastructures that can provide ecosystem functions should not be overaggregated or fragmented, because overaggregation causes a system to need more time to recover and fragmentation weakens the interconnection between ecosystem services and provision area, leading to ecosystem services having to spend more energy. Ecological resilience also ensures the redundancy of ecosystem services in a system. The reason is that a system becomes weak and unable to endure disruption from chance events without redundancy. To ensure the system continues to function normally, sufficient redundancy must be assured (Yun et al., 2007). To assure the diversity of service functions, a single function enhances the vulnerability of the system even if it can provide more services. In this paper, ecological resilience was decomposed into four measurable regime attributes: adaptation, robustness, redundancy, and diversity (Figure 2). Urban ecological resilience focused on the capacity of the urban ecosystem to absorb disturbances and concentrated on the persistence of a combination of interdependent structures and activities (Smit and Wandel, 2006). The ecological adaptive capacity is often used to emphasize that ecosystem properties constantly adapt to absorb ecological loss. A system must deploy scarce resources to respect perceived or ongoing pressures. Thus, adaptation is described as the capacity of actors to manage and influence the system by maintaining the status of the system (Engle, 2011). We used the ecosystem services provided by the urban ecosystem to quantify adaptation, demonstrating how many ecosystem services are needed to keep the current status. The spatial distribution of urban areas that can supply ecological function embodies a certain degree of robustness, which is another attribute of urban ecological resilience. The spatial network structure constructed by patches can indicate robustness, which denotes that the loss or damage of patches alone or in part cannot affect the city’s ability to provide adequate resistance to external disturbances. Concurrently, the provision of ecological function, whether it satisfies or not the demands of a city in urban development, may improve the city’s vulnerability, which is solved by functional redundancy. For systems to withstand disruption, extremely high-pressure levels, or demand spikes, redundancy needs to rely on the offers of extra capacity that have been purposefully constructed within the systems (Spaans and Waterhout, 2017). The redundancy attribute represents the components in an urban ecosystem that have the same function so that the system does not fail when one of the components fails. Simultaneously, ecological resilience also has diverse attributes; although a system can supply a single excessive type of ecological function, the system still has a high vulnerability and low capacity to resist risk. Diversity refers to the existence of many functionally completely different parts to guard the system against varied threats. The additional diversity the system possesses, the higher the flexibility to adapt to a good variety of circumstances (Allan et al., 2013).
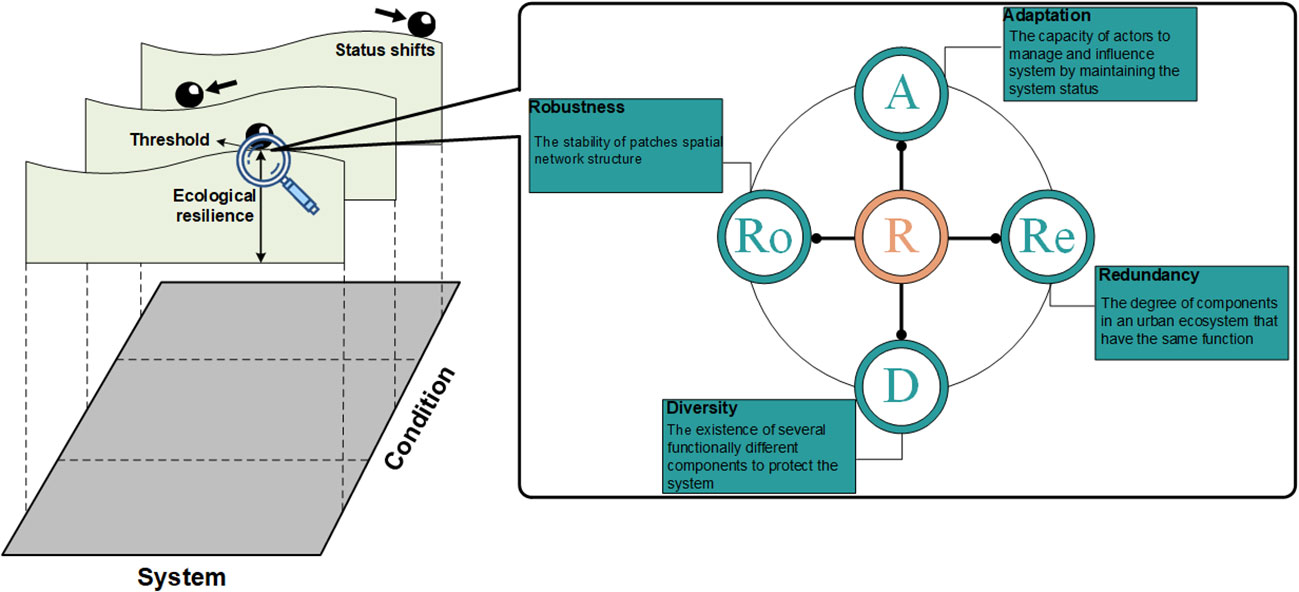
Figure 2 The theory framework of urban ecological resilience.
The adaptation of urban ecological resilience describes the capacity of the urban ecosystem to cope with environmental changes in order to survive. Ecosystem services provide the natural environment conditions and effects that human beings depend on for survival from the formation of the ecosystem and ecological process. The provision ability of ecosystem services denotes the maximum adverse effects the system adopted from external risks (Pettorelli et al., 2021). In this study, we used the support capacity of ecosystem services to denote their adaptation. With the increasing attention to ecosystem services, many methods are now used to quantify them. The Emergy method is widely utilized to calculate ecosystem services because it incorporates the interaction between human preference and natural systems. Odum first developed the concept of Emergy in 1996, quantifying it by converting different kinds of substances, energy, and services into the same units for calculation (Odum, 1996). Based on this method, a non-monetary ecosystem services accounting framework is established to evaluate the adaptation capability of ecosystem services in an urban area. The global emergy baseline in this study was 12.0 E+24 seJ/yr (Brown and Ulgiati, 2016). All the unit emergy values (UEVs) in this study were modified based on the global emergy baseline. The calculation process for each ecosystem service can be seen in the Appendix, direct services, indirect services, and existing services were calculated by equations (1–3), and the total ecosystem service was the sum of direct services, indirect services and existing services (equation (4)):
where Edirect is the emergy of direct services (seJ/yr), Eindirect is the emergy of indirect services (seJ/yr), Eexisting is the emergy of existing services (seJ/yr), Etotal is the emergy of the total ecosystem services (seJ/yr), Erenewable is the emergy of renewable resources (seJ/yr), EGR is the emergy of the groundwater recharge service (seJ/yr), EAP is the emergy of the air purification service (seJ/yr), EWP is the emergy of the water purification service (seJ/yr), ETR is the emergy of temperature mitigation service (seJ/yr), ESR is the emergy of the soil retention service (seJ/yr), ENR is the emergy of the nutrient recycling service (seJ/yr), ERR is the emergy of runoff regulation service (seJ/yr), EPO is the emergy of pollination service (seJ/yr), ENOR is the emergy of the noise regulation service (seJ/yr), EWT is the emergy of waste treatment service (seJ/yr), ECUS is the emergy of the cultural service (seJ/yr), and EGCC is the emergy of the global climate change service (seJ/yr).
Robustness refers to the potential to resist attacks or different external forces and denotes a sturdy style that anticipates potential system failures, ensuring systems are foreseeable, secure, and not disproportionate to their causes (Spaans and Waterhout, 2017). It is essential to consider the spatial distribution of ecological function in the ecological resilience quantification process. That is, consider whether the spatial correlation degree of the ecological sources provides the ecological function that can ensure that the whole region can maintain a stable ecological structure and function when a certain source area is damaged. The spatial distribution of ecological source areas in urban areas has a crucial impact on the resilience of the whole region, and the linkage between ecological sources can effectively enhance information transfer and substance migration. The network structure constructed with the source area as the node can reveal ecological robustness. When the system is subjected to external shocks, high robustness will enable the system to maintain the ability to provide ecological functions. Ecological networks (ENs), with the help of landscape ecology, are considered an effective method to maintain a system’s high robustness. The ecological network is introduced as an effective tool for recovering and maintaining ecological connectivity and environmental continuity. The basic research paradigm of “identification of ecological sources construction of resistance surfaces extraction of ecological corridors” was formed (Miao et al., 2019). The details can be seen in the Appendix. First, it is necessary to examine the aggregation degree of network nodes to ensure that any damaged node can be efficiently replaced with a similar functional node. Additionally, maintaining high connectivity between nodes is crucial for the smooth flow of materials and information within the network. It is also important to consider the degree of correlation between nodes and the network as a whole, as a low degree of correlation can result in a decentralized network structure that may have poor stability. High connectivity between modes can reflect the system’s capacity to adapt to ecological challenges, which is manifested by trans-information between nodes and edges (Gao et al., 2021). Furthermore, some investigations showed the incredible precision of network efficiency as a robustness indicator by measuring the distance between nodes and links (Li and Yang, 2011). Thus, five network structure analysis indicators, namely, network agglomeration, network connectivity, network density, network diversity, and network transformation, were chosen to evaluate the robustness of the network. The equations are as follows:
(1) Network agglomeration
The degree of aggregation of network nodes and clustering of the entire network can be defined as the degree of aggregation. The higher the agglomeration value, the closer the connection degree between nodes and the entire network. The expressions are as follows:
where A is the agglomeration index, ki represents the degree of node I, Ci is the local clustering coefficient of node i, Ei represents the actual number of edges between adjacent nodes of node i, and n represents the total number of nodes in the network.
(2) Network connectivity
Network connectivity, as an important indicator to measure the characteristics of the network, refers to the degree of ecological nodes, which is calculated by the number of edges between each node. The equation is as follows:
where C represents the mean connectivity degree of the network, ki represents the degree of node i, and n represents the total number of nodes in the network.
(3) Network density
Network density describes the degree of the closeness of node relationships in the network. Higher indicators mean that the network is closely related. The calculation formula is:
where D is the network density, E is the number of edges, and N is the number of nodes.
(4) Network diversity
Network diversity depicts the average number of independent paths. When one independent path is affected by the disturbance, the other independent paths guarantee normal operation between the two nodes. The expression is as follows:
where V is the average of independent paths, nij is the number of independent paths between node i and node j, and n is the total number of nodes in the network.
(5) Network transformation
Network transformation is used to evaluate the effectiveness of information transfers between network nodes. The equation is:
where T is the transformation index, n is the total number of the network, and dij is the distance between node i and node j in the network.
Thus, the robustness of the network was calculated as follows:
In the formula, A’, C’, D’, V’, and T’ are the normalization of the A, C, D, V, and T index.
Redundancy refers to the diversity of response and the presence of multiple or alternative interactions, which is beneficial to mitigating the impacts of shocks and faults within a system. Redundancy can increase the resilience of ecological processes to environmental stressors as long as functionally redundant ones respond differently to environmental conditions (Feit et al., 2019). Four indicators related to redundancy were identified: the ratio of ecosystem service supply and demand, urban population density, urban road area per capital, and nighttime light index. The mismatch between the supply and the demand of ecosystem services can be utilized to judge whether the services provided by the urban ecosystem are redundant. The heterogeneity of ecosystem services supply and demand can ensure that supply meets or exceeds the demand, and provides an effective way to evaluate redundancy. It is calculated by equations (12)–(14). Meanwhile, population density, road area per capita, and nighttime light index were used to demonstrate the redundancy state of social vitality (equations (25)–(27) in Supplementary Materials), which can provide solid assurance for the functioning of a city and increasing its redundancy in the event of disasters (Huang et al., 2021). The four indicators were given equal weight to get the final redundancy.
where ESS is the ecosystem services supply, ESD is the ecosystem services demand, ESM is the ratio of ecosystem services supply and demand, n is the type of ecosystem services, and TESM is the total ratio of ecosystem services supply and demand.
Ecological diversity could be a primary characteristic of ecological communities, which shows necessary variation around the globe, and impacts several aspects of community and scheme functioning (Calcagno et al., 2017). Global ecological diversity includes genetic diversity, species diversity, and landscape diversity. We used landscape diversity to represent the diversity attribute of ecological resilience. The reason is that compared with the other two, landscape diversity can improve the stability and functionality of the ecosystem, and also improve the diversity of plant species. Landscape diversity refers to a specific location on the geographical scale and is made up of a variety of interdependent abiotic and biotic systems. This concept takes into account dimensions and represents the landscape ecosystem’s structural, functional, and temporal patterns (Yeh and Huang, 2009). Shannon’s diversity index, a widely used indicator of diversity in community ecology, is used in this context to describe landscapes. Simpson’s diversity index is less sensitive to uncommon patch types than Shannon’s index. One measure of biodiversity that aims to assess both species richness and species evenness within an ecosystem or community is Shannon’s index. The equation is as follows:
where SHDI is Shannon’s diversity index and Pi is the proportion of the landscape occupied by patch type i.
Based on the abovementioned indicators, all indicators were normalized to 0–1. This approach assumes that all the components or indicators are equally important in contributing to the overall resilience of the ecosystem. By assigning the same weight ratio to all the components or indicators, the index can provide a comprehensive and balanced assessment of the overall ecological resilience of the urban ecosystem (Timpane-Padgham et al., 2017). Adaptation, robustness, redundancy, and diversity belong to different attributes (Yu et al., 2023), thus urban ecological resilience can be calculated as follows:
where UER is the urban ecological resilience, A is the adaptation, Ro is the robustness, Re is the redundancy, and D is the diversity. All indicators were normalized into the range of 0–1.
Adaptation capacity is related to the functional supply capacity of the ecosystem to maintain critical functions and processes (Angeler et al., 2014). The adaptation of the urban area in this study was defined to be equal to the total ecosystem services. Figure 3A shows the normalization result of the ecological adaptation of 48 cities from 1985 to 2020. The results showed that the cities with high adaptation provision were Hangzhou, Chengde, and Zhaoqing, indicating that the ecological functions inside these cities were not ignored in the whole process of urban development. By contrast, Zhoushan was the lowest city ranked, resulting from the disadvantages of geographical conditions and the city’s development, although the adaptation capacity in Zhoushan expanded from 0 to 0.03. Its forest area (6.66 E+4 ha) is only one-tenth of that in Hangzhou (117.79 E+4 ha). Land use changes are widely used to guide urban development, which in turn can impact the adaptation capacity that supplies within urban areas. The low proportion of non-ecological land can provide enough ecosystem services to address natural hazards and enhance the urban resistance capacity. For example, the proportion of non-ecological land in Hangzhou (3.24%), Chengde (0.71%), and Zhaoqing (1.89%) in 2020 was less than 5%, whereas, at the other extreme, Zhoushan and Tongling had 8.62% and 5.42% of non-ecological land, respectively. Furthermore, the temporal feature of the adaptation capacity of cities presented a gradually increasing trend with a 60% growth rate owing to decision-makers seeking a balance between economic development and ecological civilization rather than focusing on the improvement of a single item; the development pattern of cities transited from the traditional economy-oriented development pattern to ecological and economic melodic construction pattern.
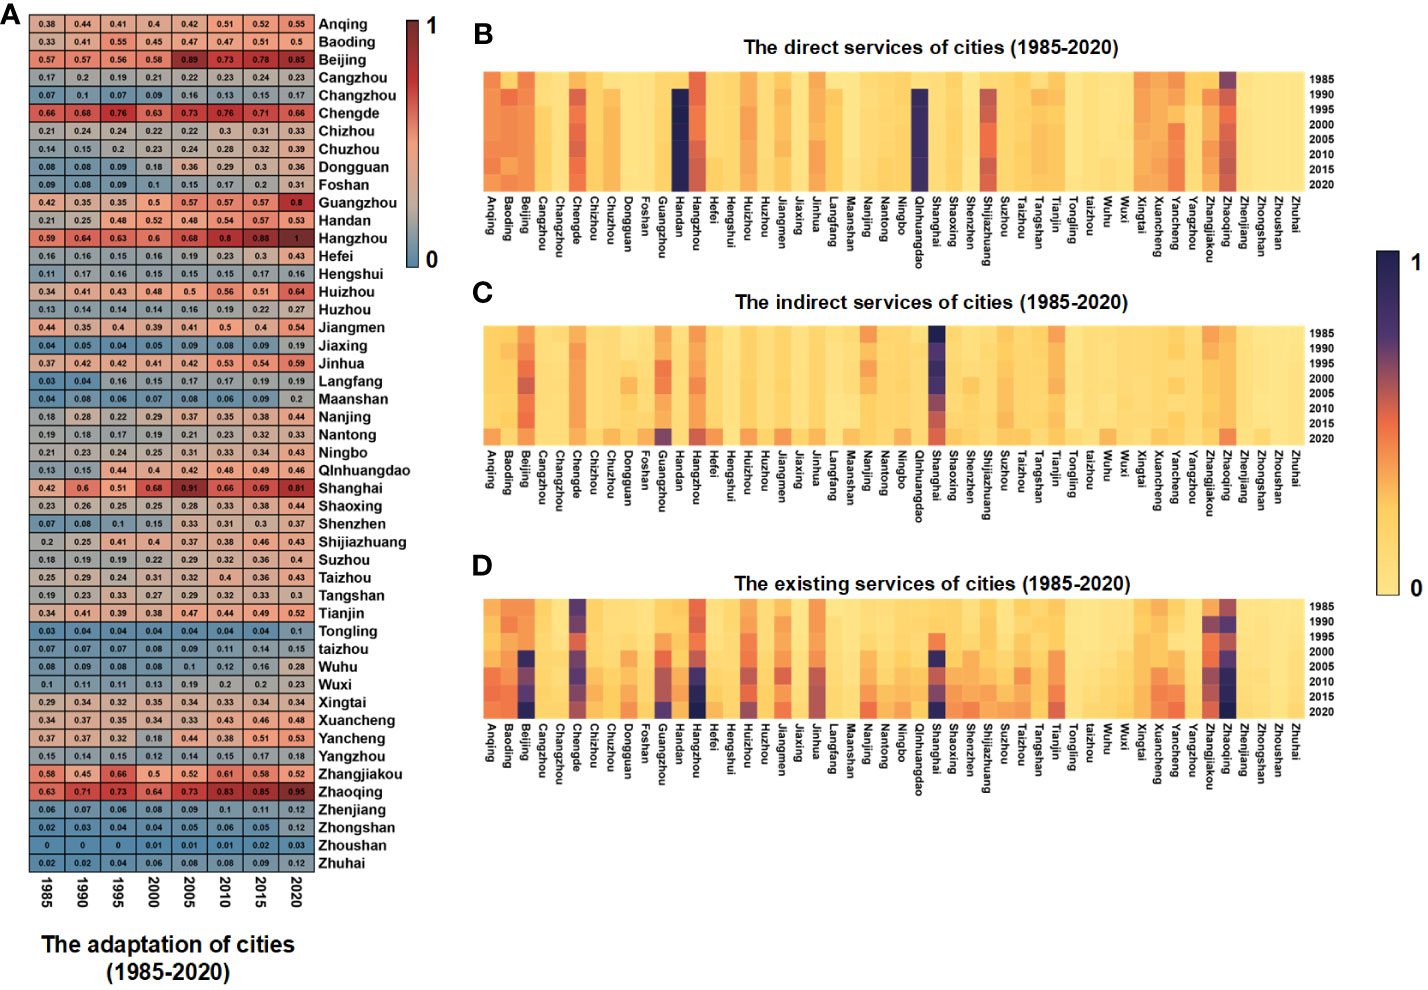
Figure 3 (A) The ecological adaptation of 48 cities from 1985 to 2020; (B) direct services of cities; (C) indirect services of cities; (D) existing services of cities.
Furthermore, we explored the contribution of each ecosystem service category to the city’s adaptation capacity (Figures 3B–D). The amount of flows and storage in the examined ecosystems is referred to as the direct services, which mainly depend on natural resources, such as sunlight and climate-related factors. It can be seen that Qinhuangdao and Handan have higher direct services compared with other cities. Indirect services indicate the additional services generated by the ecological process. Shanghai had the most extensive indirect services and Zhoushan had the lowest indirect services. The local allocation of global services and human preference-focused services is the existing services. Beijing, Zhaoqing, and Chengde were senior suppliers from 1985 to 2020, which reflects the value that can be shared based on human preferences and global services.
The ecological network analysis was chosen to evaluate the robustness of the urban ecosystem. The ENs were constructed based on ecological sources and resistance surface and five indicators were selected to analyze the robustness. As seen in Figure 4A, the average value of the robustness presented a fluctuating trend in the interval of 0.71 and 0.73, determining that the spatial distribution and material flow and connection between the ecological source of the city changed slightly, and the overall structure did not change significantly. From 1985 to 2015, the most robust city was Yancheng with an average value of 0.91, and Zhaoqing (0.86) became the most robust city in 2020 (Figure 4B), indicating that a city can efficiently reduce external risk and maintain a relatively stable ecological environment in urban areas, which is a safeguard measure for ecological protection and restoration. The least robust city was Nantong, owing to it having the lowest ratio of ecological land occupied in urban areas; the ecological land area of Nantong in 2020 was 7,492 ha, which is 50% of that of Yancheng. It is necessary to increase the effectiveness of connection between ecological sources and reduce unnecessary material flow costs for decision-makers in urban planning. The number of ecological sources and their links have an important impact on robustness, and the increase of ecological sources and links may enhance robustness, such as seen in Yancheng, Cangzhou, and Zhaoqing. At the same time, over-concentration of the spatial distribution of ecological sources or reduced connectivity between ecological sources would reduce robustness, as seen in Langfang and Chengde. The change in land cover and biophysical conditions caused by urban development would decrease ecological sources and links, resulting in reduced connectivity between plaques and increasing the difficulty of information transfer in the urban ecological environment. To enable biological beings, data, and materials to move and communicate between various locations and varied habitats it is necessary to build ecological corridors that link the remaining ecological sources rationally.
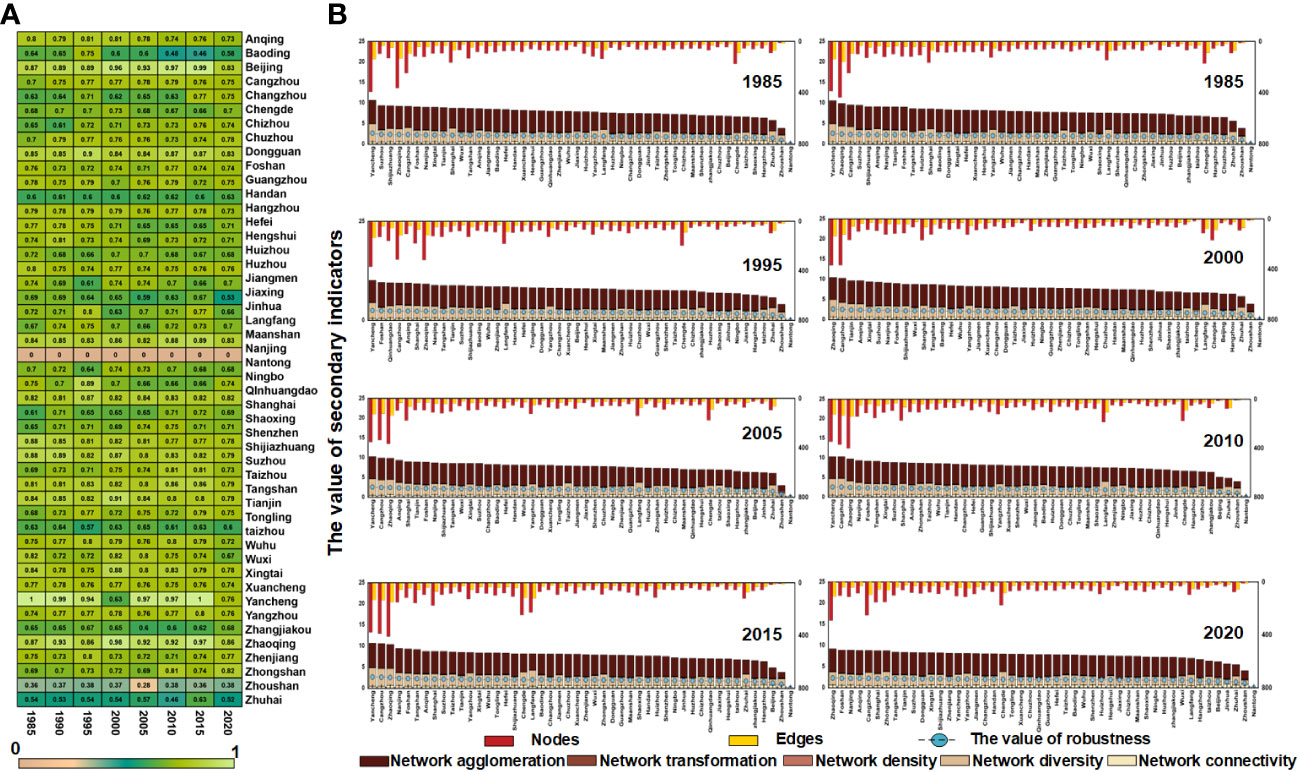
Figure 4 (A) The redundancy of 48 cities from 1985 to 2020; (B) the value of redundancy indicator of 48 cities
Redundancy indicates the diversity of response and presence of multiple or alternative interactions in urban areas, which is beneficial to mitigating the impacts of shocks and faults within a system. It can reflect the system’s capacity to adapt to ecological challenges. The mismatch between the supply and the demand of ecosystem services can be used to assess the redundancy in urban areas. As seen in Figure 5, the top-level redundancy of cities was in Shenzhen, Dongguan, and Guangzhou, with the main reason being that the per capita resources in these cities are relatively high, especially in Shenzhen. Comparatively, the redundancy in Zhuhai and Zhoushan was the lowest in all of the 48 cities due to the limitation of ecological resources. As with Shenzhen, the redundancy of Guangzhou, Dongguan, and Nanjing was increased by enhancing reasonable urban planning and effective ecological protection strategies. Comparatively, the trend of redundancy in some cities, such as Yancheng and Xuancheng, decreased sharply due to the reduction of green space caused by rapid urban expansion.
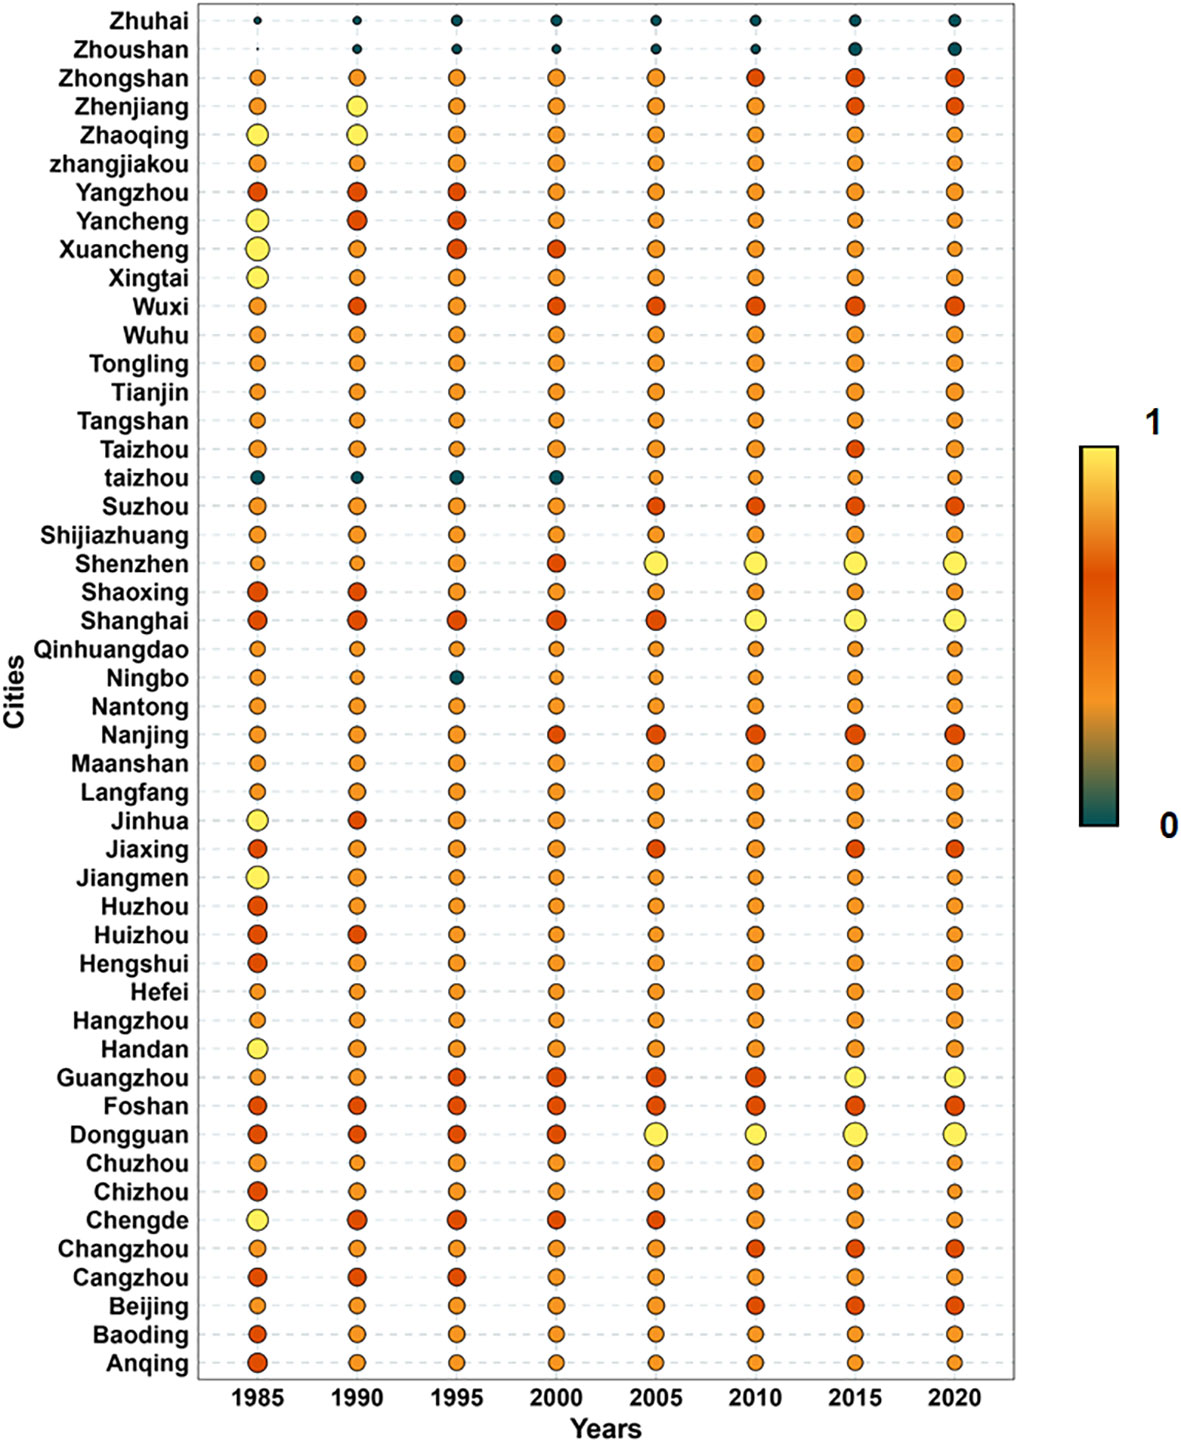
Figure 5 The ecological redundancy of 48 cities from 1985 to 2020.
Figure 6 illustrates the ecological diversity among 48 cities from 1985 to 2020. The findings indicated a notable decline in the average diversity value, ranging from Dongguan (0.93) to Nantong (0.04). Dongguan was the city with the largest diversity, the main reason being the implementation of ecological city construction, vigorously implementing measures to increase the greening of the city, and the construction of a large area of urban parks. Therefore, various landscape types in this city led to a landscape patch of intricate distribution resulting in powerful landscape diversity and heterogeneity, which reflect ecological and environmental quality. Compared to other cities, the diversity in Chizhou and Nanjing increased from 1985 to 2020, indicating that during the rapid urbanization stage, the landscape pattern of these cities underwent drastic changes, the level of landscape diversity improved significantly, and the landscape patches tended to be more evenly distributed. In stark contrast to the cities mentioned earlier, there was little difference between the characteristics of landscape diversity in Dongguan and Zhangjiakou; this was mainly due to the richer diversity in land use, the presence of living green infrastructure, and the gradual improvement in traffic layout, all of which contributed to the superior ecological environment conditions in these cities. Hengshui and Nantong showed that the dominant landscape patches in these regions were concentrated and distributed, mainly for constructed land and cultivated land. The landscape diversity level was low, with better physical connectivity.
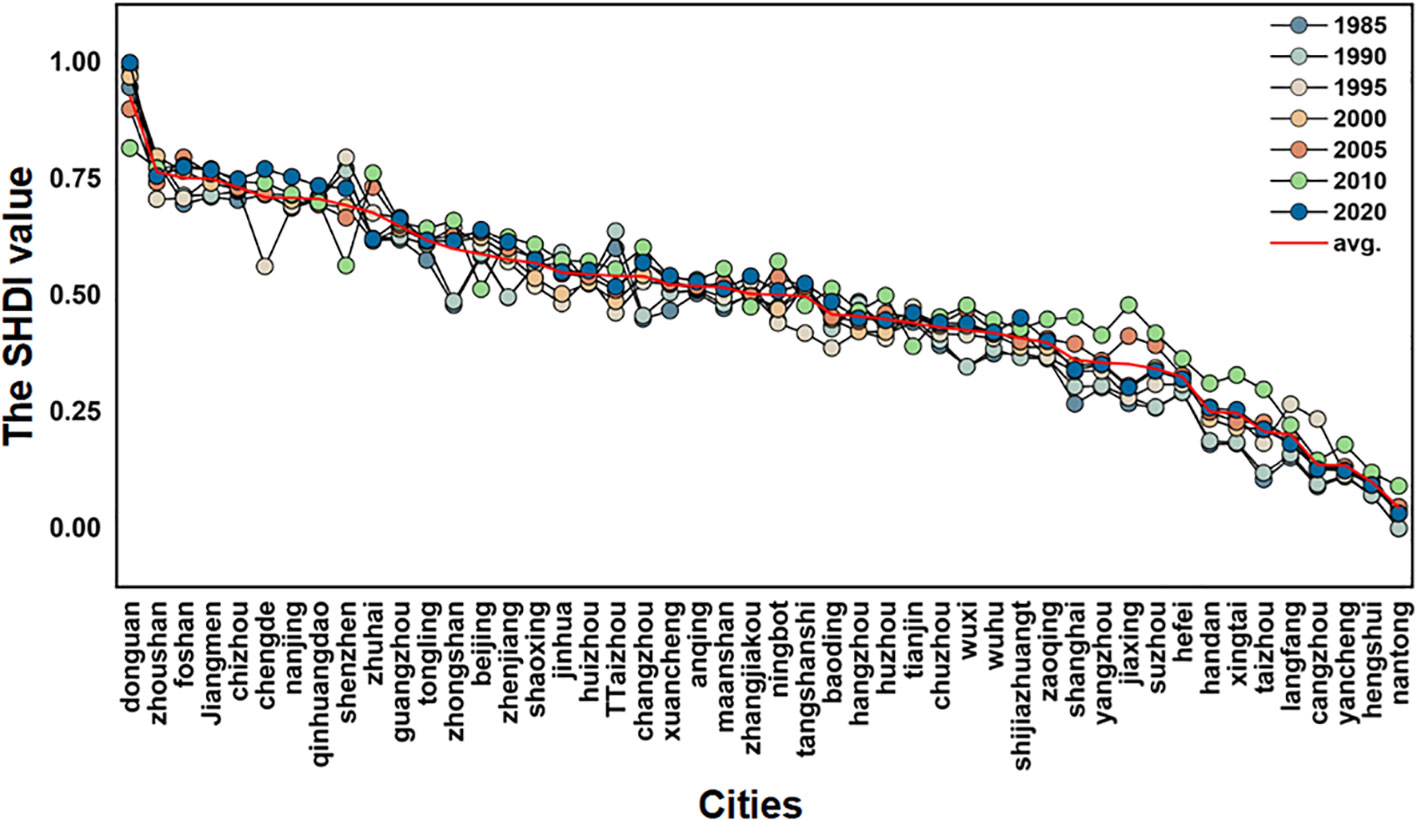
Figure 6 The ecological diversity of 48 cities from 1985 to 2020.
Urban ecological resilience (UER) refers to when the urban ecological environment system is disturbed by uncertain risks. The larger the value is, the stronger the capability is to maintain the regular operation of the urban ecological environment system or to produce dynamic changes to reach a new equilibrium system state. Based on the ecological indicator system, the UER was calculated to evaluate the ecological condition in the urban areas analyzed. The results are presented in Figure 7. The results showed that the UER of 48 cities presented an increasing trend over 20 years, and ecological resilience was enhanced through the implementation of the ecological civilization construction policy, which emphasizes the adherence to the ecological protection red line and the preservation of the natural ecological security boundary. This was especially true in Nanjing and Zhuhai. Zhuhai made noticeable advancements in its journey toward ecological and resilient urban development, moving from a previously low ecological resilience level to firmly establishing itself at a moderate ecological resilience level. This progress reflects the city’s commitment to embracing ecological principles and enhancing its ability to adapt and withstand environmental challenges. On the other hand, Nanjing continues to intensify its focus on bolstering ecological resilience, signaling a continued dedication to strengthening its capacity to thrive in an ever-changing environmental landscape. The factors influencing the change of a city’s UER in different orientations are complex and one of the crucial reasons is that the difference between the direction of considering and dealing with ecological problems in the development process was proposed by cities. On the UER enhancement of direction, the main development activity is the expansion of urban green areas, which is required to improve the living environment and promote positive interaction between people and the natural environment, enhancing regional habitability issues. The area of artificial development construction of moderate intensity is an aspect of social and ecological benefits. The green area in Changzhou increased from 95.6 ha in 1985 to 11,934 ha in 2020. Increasing the urban green area can also improve the quality of life and enable people to have closer contact with nature, improving their comfort levels, and is essential for a city to adapt to and mitigate thermal shocks of local weather changes. However, the decreasing trend of UER, such as observed in Xuancheng and Zhangjiakou, was mainly concentrated in industrial parks and other high-intensity artificial development and construction areas, The industrial land in Xuancheng increased by 131.95 km2 since 2000. Developers of industrial parks tend to pay more attention to economic benefits rather than focus on other aspects of their developments such as the local environment and community, resulting in areas surrounding industrial parks that are usually dirty, chaotic, and poor. The ecological and social benefits of these developments and subsequent development processes are often ignored. The UER is influenced by the intensity of pressure disturbance, the stability of ecosystem structure, and the response of ecosystem service function. Therefore, the UER can be enhanced by improving the stability of urban system structure and ecosystem service function when facing risk disturbance of uncertain external factors. Some policies, such as promoting balanced development within the city region, strictly controlling wetland development, strengthening the quality and quantity of ecological land construction, and enhancing overall urban resilience, are required to be implemented. For example, Hangzhou implements ecological protection and strengthens the original ecological protection of West Lake, Xixi Wetland, and Qiandao Lake. The proportion of ecological protection red line areas in the whole city has reached more than 33.2%, the soil and water loss rate has been controlled to within 6.5%, and the ecological environment status index (EI) has increased to more than 79, effectively improving urban ecological resilience.
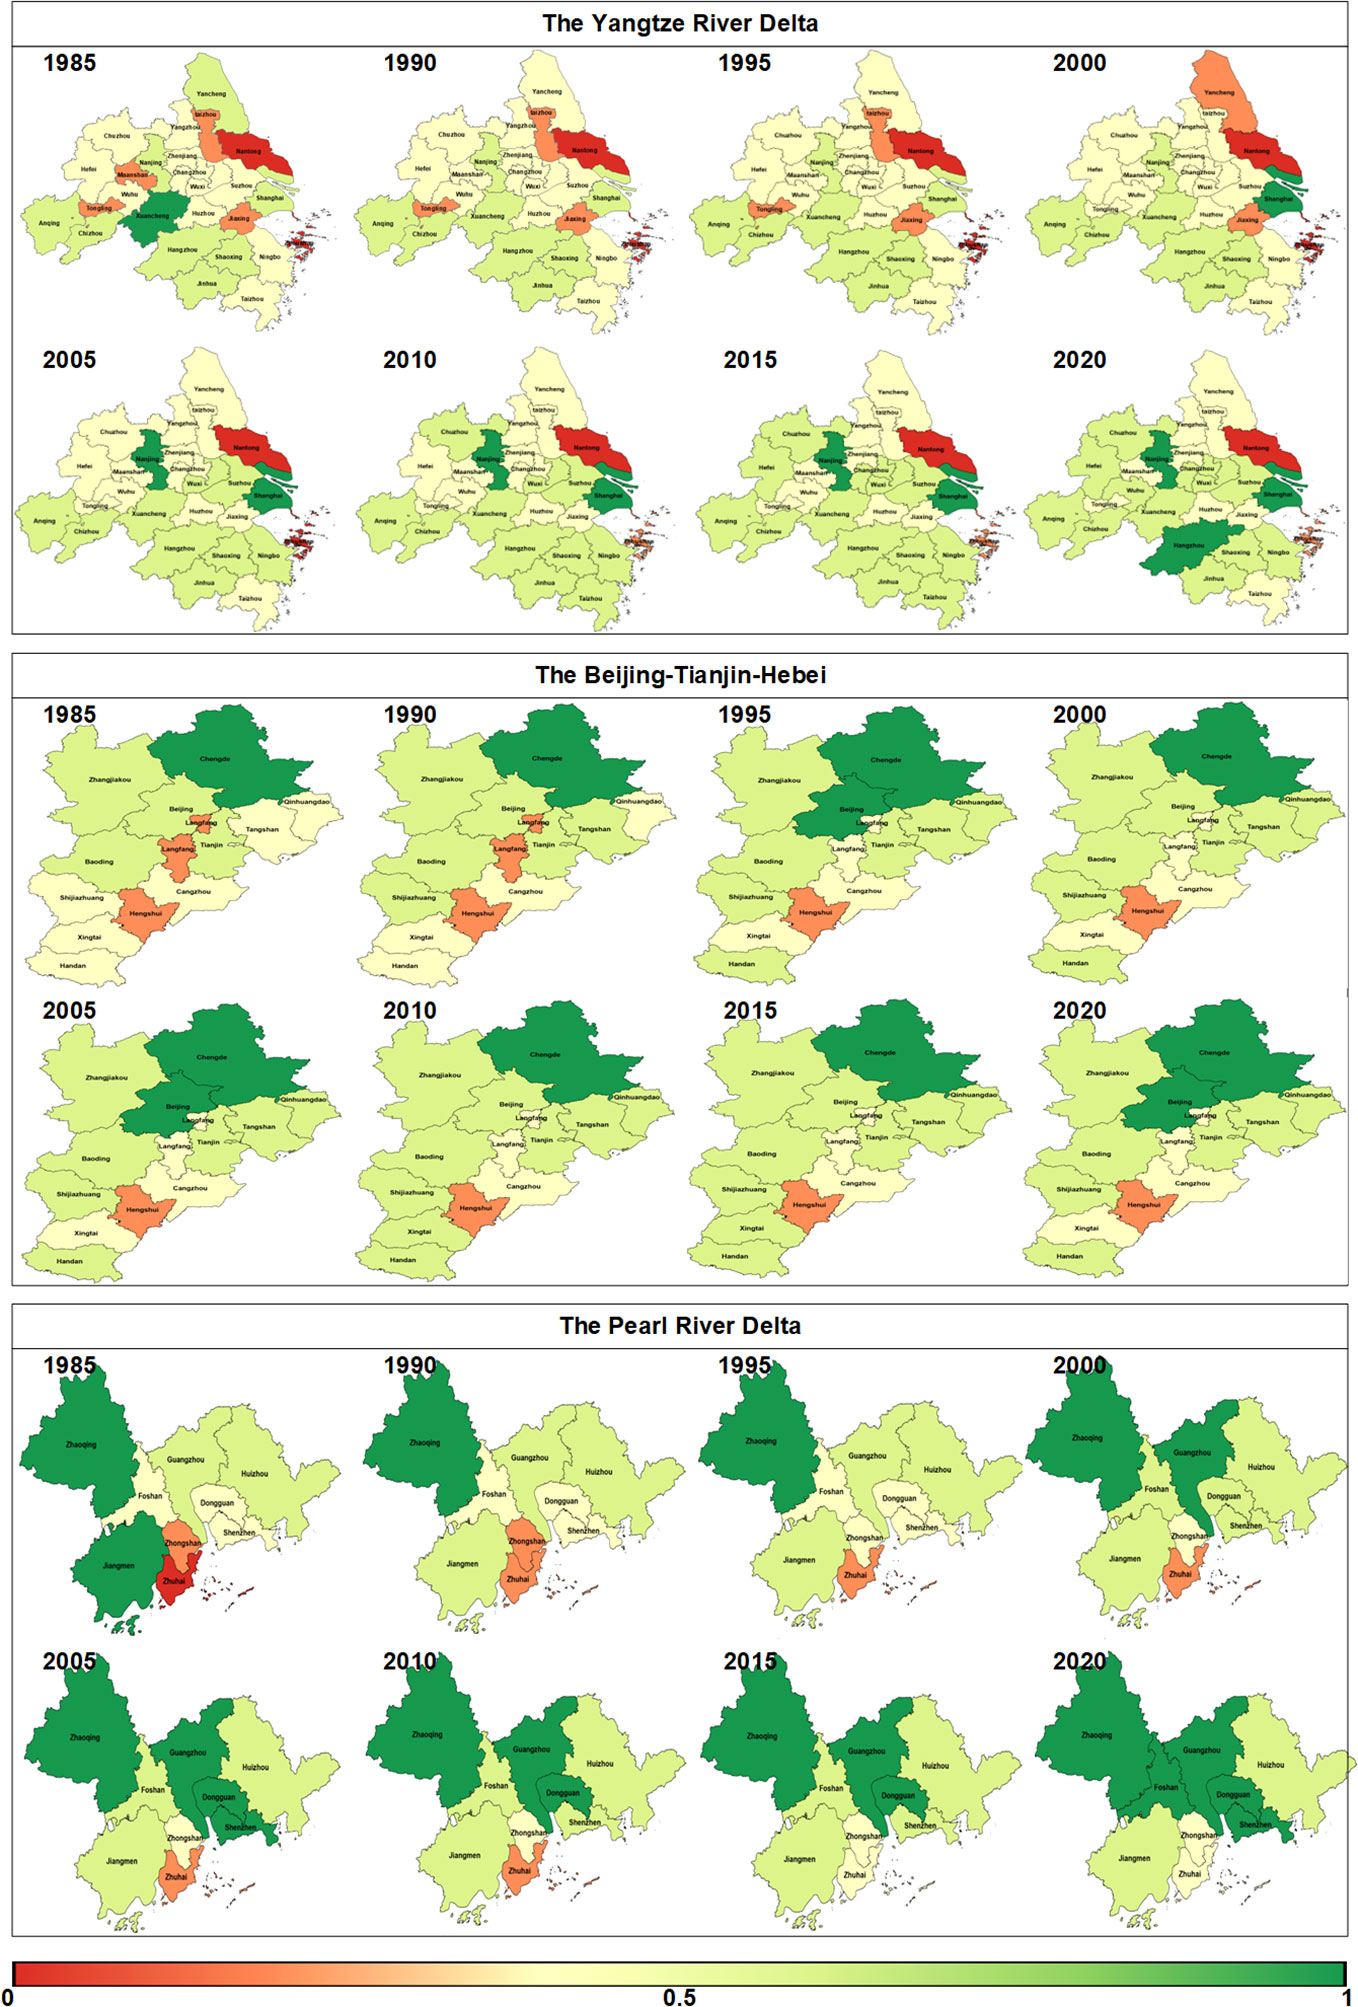
Figure 7 The evaluation of urban ecological resilience.
Urbanization is a multifaceted global process that is implemented by rapidly changing land cover and human population densities (Ernstson et al., 2010). The urbanization development in China made remarkable achievements, with the country’s urbanization rate rising from 17.9% in 1978 to 59.6% in 2018 (see Supplementary Materials). Urbanization derives materially from the natural world, and the need for ecological services among people makes it sustainable (Wang et al., 2022). We further investigated the connection between the urbanization level and the UER based on the findings of the UER and urbanization level in the analyzed cities. As seen in Figure 8, we used the restricted cubic spline (RCS) to make the model flexible and to visualize the relationship between the urbanization level and the UER (details can be found in Supplementary Materials). The change of the UER was relatively flat until around 44.11 of the urbanization level and then started to decrease rapidly afterward (P for non-linearity < 0.001). Above 44.1%, the UER increased slowly with the increase in urbanization level, and the areas with an urbanization level of less than 25 were mainly rural areas that primarily consist of undeveloped or natural stage land. Some infrastructure construction in the urbanization process can enhance ecological and resilience functions in urban areas. Below 44.1%, the UER decreased sharply with the increase in urbanization level, and high urbanization rates mean that there could be problems in terms of improving a city’s vulnerability when risk and disturbance are present, especially in locations closer to a city’s central area or where more urbanization is concentrated. Overexploitation and utilization of land resources can reduce ecological resources leading to a decrease in resilience. In general, the UER increased in places with low levels of urbanization and drastically dropped in areas with high levels of urbanization. In the present study, the changes in UER were found to be closely related and stage-specific, despite the consensus that ecosystem conditions are seriously harmed by increasing urbanization levels. This can be used as a reference for the development of various ecological protection strategies in urban areas at various stages of development.
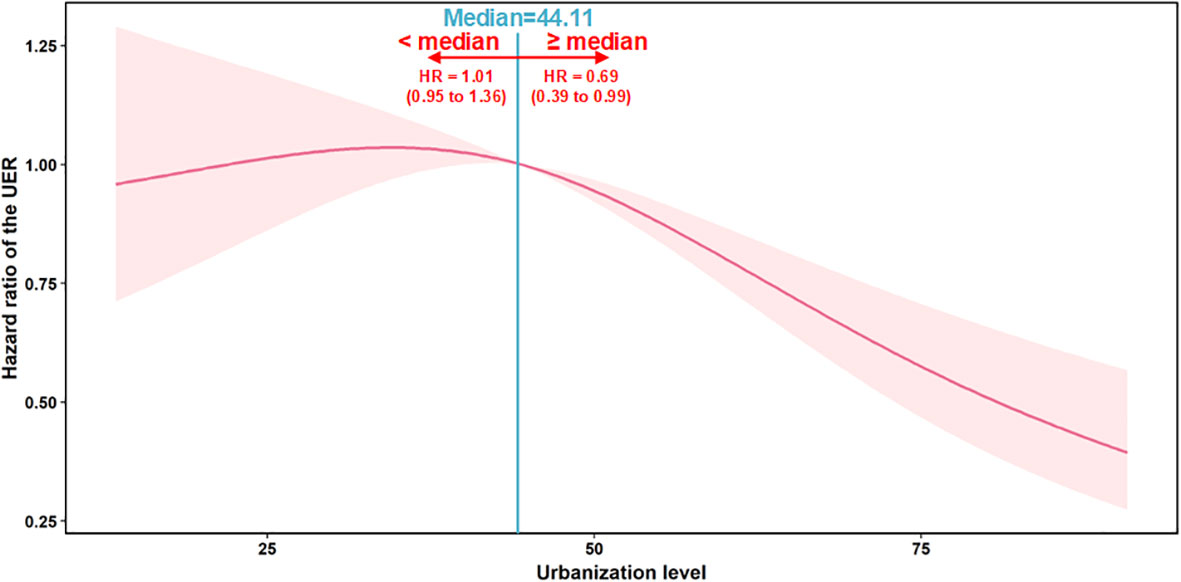
Figure 8 The correlation between urbanization level and the UER.
Urban ecosystems are the best examples of mosaics of vegetational cover and land use of any other landscape, enormously influencing the capacity of ecological function provision and disturbance resistance (Colding, 2007). The change or loss of land can also cause the loss of ecological resilience and options for future generations. Decision-makers need to improve ecological resilience by reasonably managing land occupation. First, it is suggested that ecological source protection and restoration should be implemented in urban planning and design. According to the consensus, ecological protection and restoration should be used to address the world’s ecological concerns (Tao et al., 2022; Cai et al., 2018). As the origin of the ecological process, the ecological source is important for the survival of species, the stability of the ecosystem, and for ecological flow. Ecological sources directly determine ecological resilience, thus, they should be classified into the no-construction area and all development and construction activities should be prohibited from encroachment or destruction of ecological source areas, maintaining their natural development (Wu et al., 2020). The limitation of expansion of surrounding construction land for the ecological sources that were destroyed by human activities is an efficient way to restore and improve the habitat quality and ecological function. Meanwhile, ecological protection and restoration should be proposed in a timely manner through land reclamation, regulation, and vegetation cover type change. Furthermore, what should be emphasized is that optimization and adjustment of land use structure and giving priority to protecting ecological space cannot be avoided and eliminated in the development of a city. A profound shift is necessary for urban planners to strengthen the general land planning and ecological environment-related planning and to prioritize, via layout optimization, the coordination of cohesive, reasonable arrangement of land space, and the maximum protection of rivers, lakes, mountains and other natural ecological land (Cai et al., 2011). Focusing on maintaining ecological functional land, improving ecological quality by combining the characteristics of natural resources, and protecting preferentially ecological red lines are of great significance to ecological resilience. Finally, local governments could implement regulations limiting new construction by regulating how land is used. Institutions for urban planning could create a series of plans, such as the Land Use Plan and Master Plan, that alter the city’s spatial patterns and land use. It might encourage proactive attention to urban ecological resilience in urban areas. By taking into account diverse demands at the land use level and balancing the various needs of a particular location, a resilient city can be governed effectively and fairly (Du et al., 2020). However, the acceleration of urbanization is inevitable and aims to meet human survival needs. Effective policies need to be proposed to enhance urban ecological resilience in the later stages. It is essential to adhere to the concepts of ecological industrialization and industrial ecological development, promote coordinated development of ecological construction within and outside the city, synchronize ecological construction with economic development, and advance the construction of key ecological functional areas. This is all achieved through human intervention, optimizing the morphology, structure, and network connectivity of blue-green infrastructure, and ensuring the continuous supply and transmission of ecosystem services. This idea is based on natural solutions to ensure the continuous functioning of ecological processes and enhance urban ecological resilience.
Furthermore, we explored the impact of different socioeconomic factors on urban ecological resilience. Ecosystem services, GDP, population, road length, green space, and municipal capacity were selected as factors in this study (Figure 9). The random forest method was used to identify the impact of each socioeconomic index on urban ecological resilience. It was observed that ecological services have the greatest impact on ecological resilience, and the improvement of ecological services can effectively improve ecological resilience. In contrast, municipal capacity, which refers to the treatment process of sewage and other wastes, for example, is the least important factor, with its effect on urban ecology being relatively low.
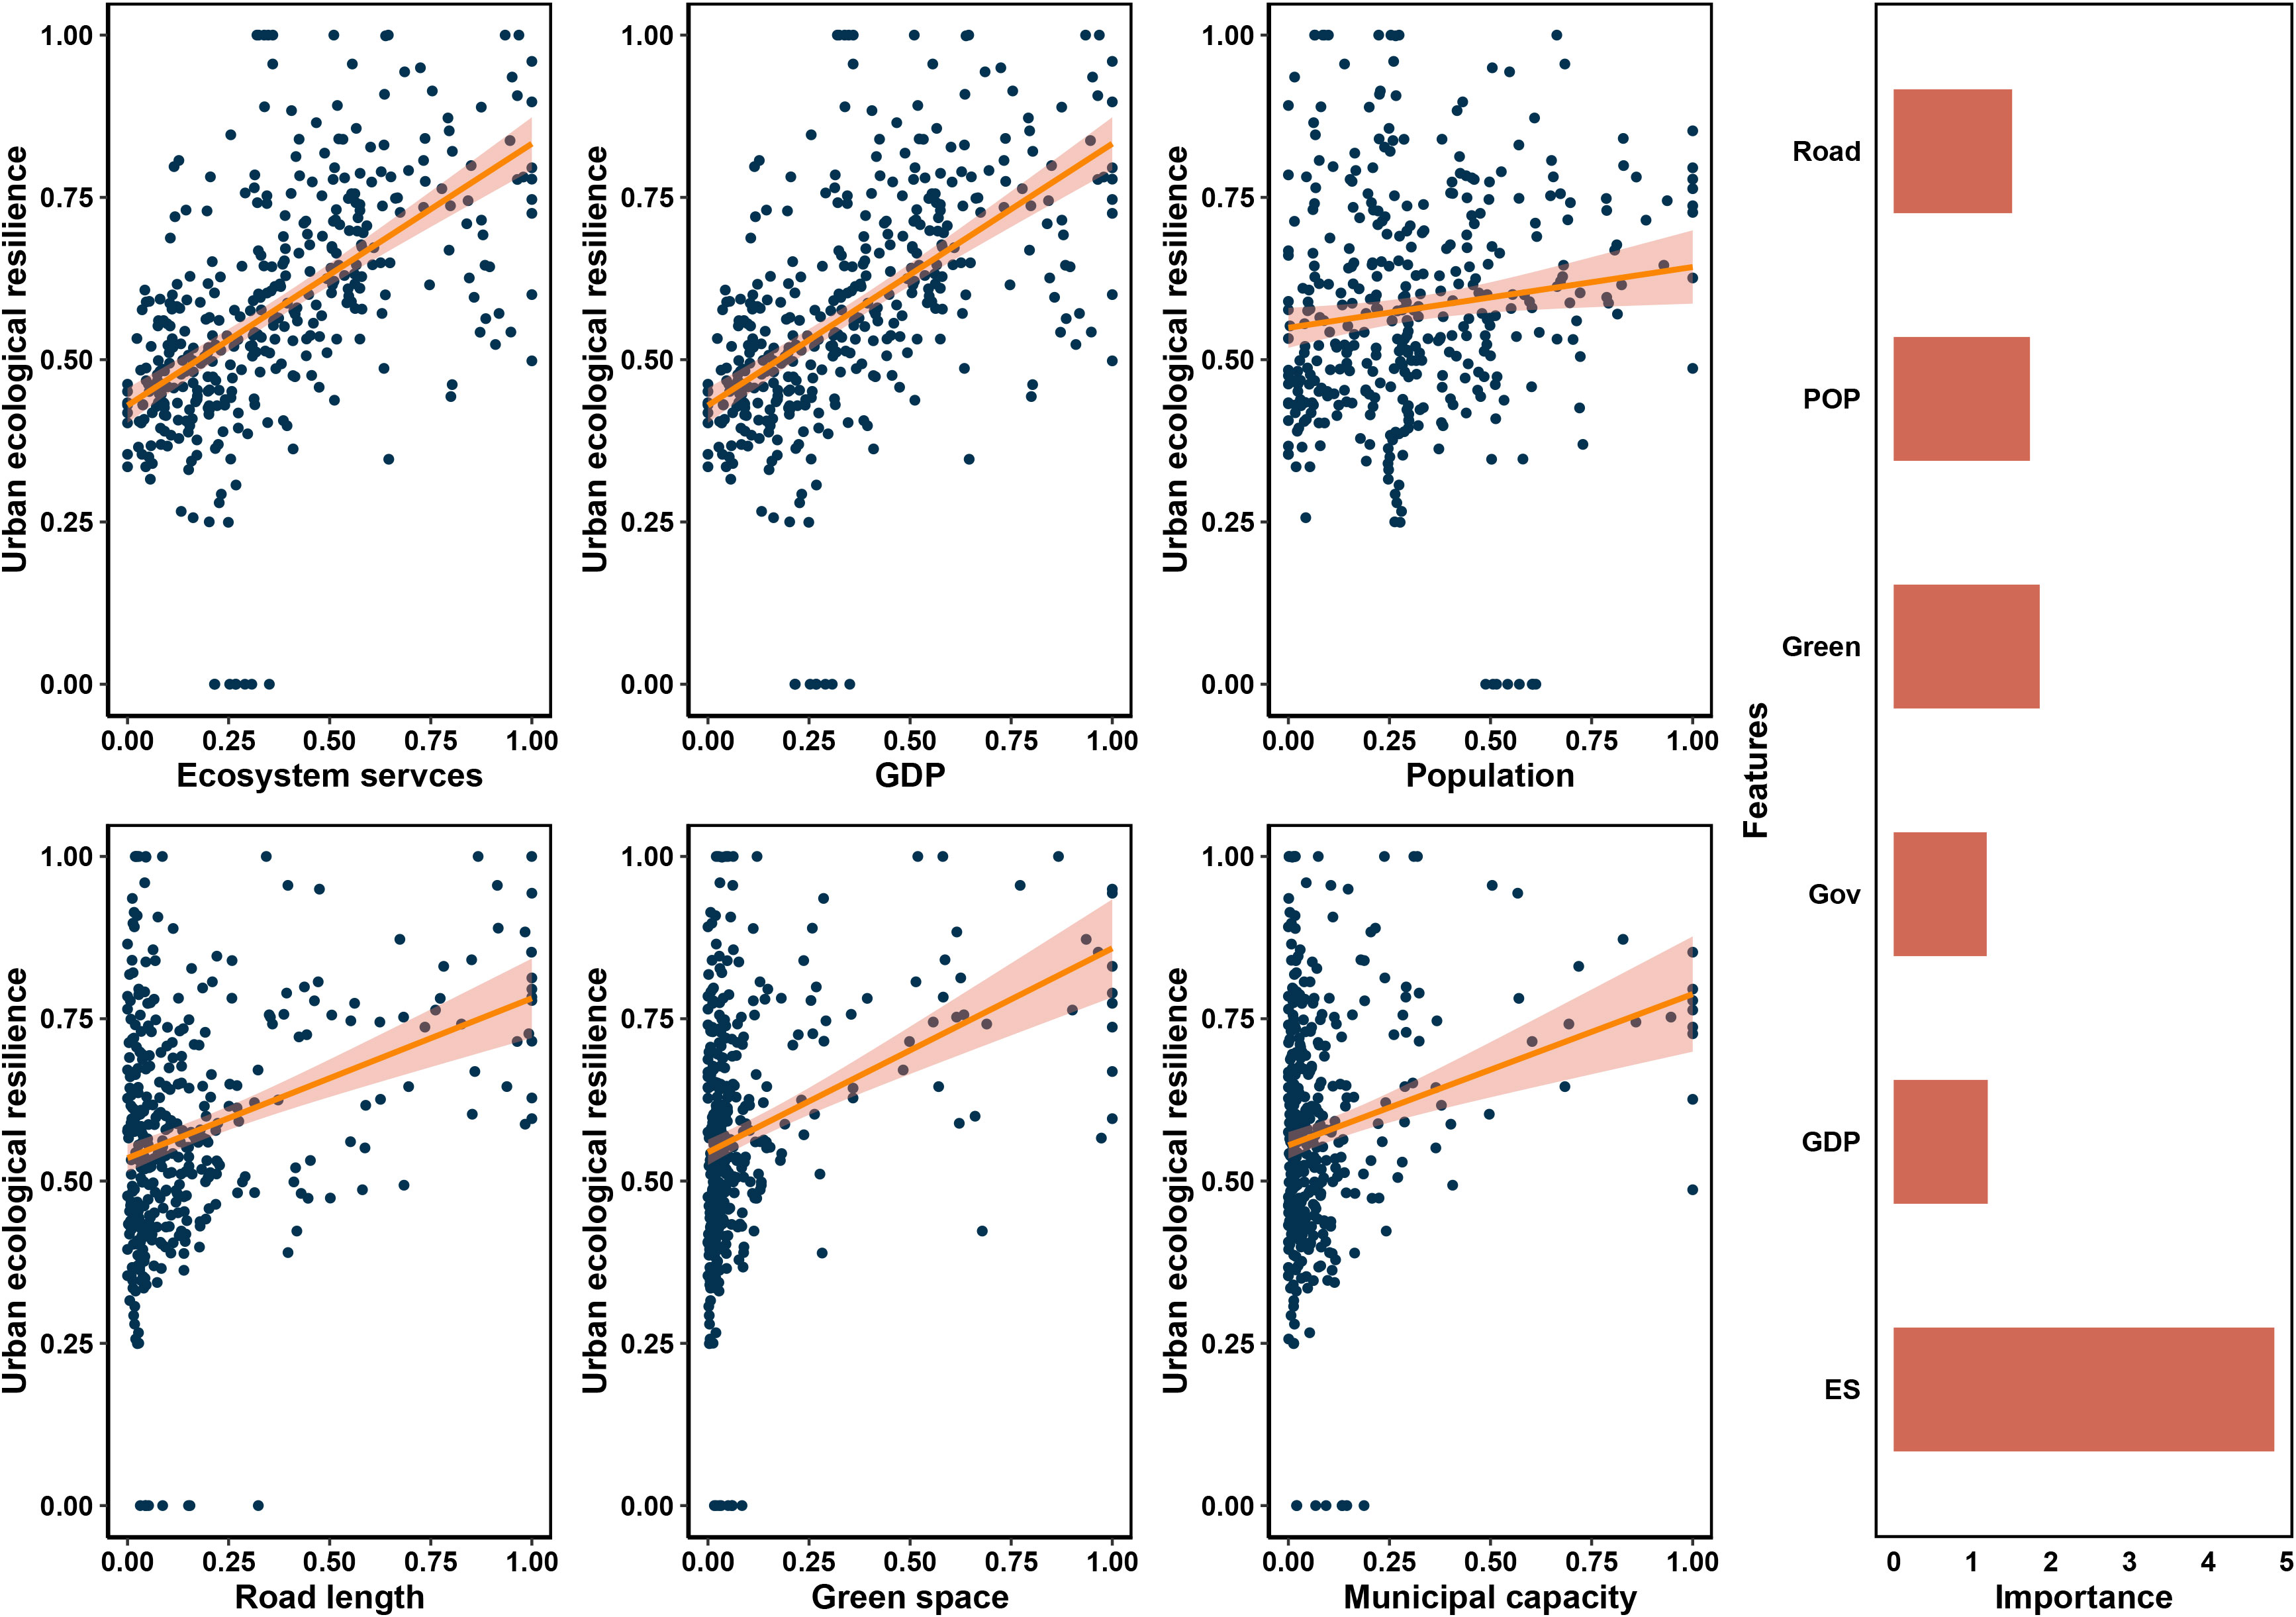
Figure 9 The importance of indicators to urban ecological resilience.
In this study, an ecological indicator system was established to evaluate urban ecological resilience. Compared with other methods, we established a multi-attribute quantitative framework to comprehensively assess ecological resilience by decomposing its properties, namely, adaption, robustness, redundancy, and diversity, and analyzing the trends and characteristics of ecological resilience. Simultaneously, we further explored the relationship between urbanization level and ecological resilience. However, some limitations require improvements. First, we selected four indicators to calculate urban ecological resilience, but, due to the accuracy of the data, some characteristics were not considered, such as efficiency and resources. Second, we identified ecological resilience more from a one-dimensional perspective and did not quantify resilience in terms of overall system transformation processes. The main reason is that a time factor was not added, however, future research will introduce the time variable. Finally, resilience is a dynamic process, and the next step will be to make an analysis in combination with the system dynamics model. This study is more about the quantitative framework of resilience. Next, we will try to explore the changes in urban ecological resilience under climate change or flood disaster scenarios.
This study proposed to establish an urban ecological resilience assessment model from four aspects of the basic characteristics of resilience (adaptation, robustness, redundancy, and diversity). A total of 48 cities from three major urban agglomerations in China were selected as targets to explore the changing characteristics of urban ecological resilience during the period from 1985 to 2020. The results showed that the average urban ecological resilience value presented a trend of first declining and then rising, indicating that the rapid expansion and development of cities in the context of the cost of ecological degradation at the first stage and a series of issues such as ecological protection were considered in the process of urban development. Meanwhile, the difference in dealing with ecological and social relationships led to a change in the development trend of urban ecological resilience. Reasonable planning and design of urban space and increasing urban green areas will enhance urban ecological resilience. Comparatively, pursuing excessive economic and human activities will lead to the decline of urban ecological resilience. Furthermore, the correlation between urbanization level and ecological resilience indicated that urban ecological resilience was increased in the areas with low urbanization levels and decreased sharply in the areas with high urbanization levels. It was indicated that the urbanization process affects urban ecological resilience in different stages. The current findings serve as a case study for urban ecological resilience and assist decision-makers in developing workable recommendations for urban design from an ecological standpoint.
The original contributions presented in the study are included in the article/Supplementary Material. Further inquiries can be directed to the corresponding author.
YW: Conceptualization, Writing – original draft. YC: Funding acquisition, Project administration. YX: Investigation. LC: Visualization. PZ: Investigation. All authors contributed to the article and approved the submitted version.
This research was supported by the National Natural Science Foundation of China (U20A20117), the Key-Area Research and Development Program of Guangdong Province (2020B1111380003), and the Program for Guangdong Introducing Innovative and Entrepreneurial Teams (2021ZT090543). The authors would also like to extend their gratitude to the reviewers and editors for their suggestions and comments, which were extremely helpful in improving the quality of the paper.
The authors declare that the research was conducted in the absence of any commercial or financial relationships that could be construed as a potential conflict of interest.
All claims expressed in this article are solely those of the authors and do not necessarily represent those of their affiliated organizations, or those of the publisher, the editors and the reviewers. Any product that may be evaluated in this article, or claim that may be made by its manufacturer, is not guaranteed or endorsed by the publisher.
The Supplementary Material for this article can be found online at: https://www.frontiersin.org/articles/10.3389/fevo.2023.1144244/full#supplementary-material
Allan P., Bryant M., Wirsching C., Garcia D., Teresa Rodriguez M. (2013). The influence of urban morphology on the resilience of cities following an earthquake. J. Urban Design 18 (2), 242–262. doi: 10.1080/13574809.2013.772881
Angeler D. G., Allen C. R., Birge H. E., Drakare S., McKie B. G., Johnson R. K. (2014). Assessing and managing freshwater ecosystems vulnerable to environmental change. Ambio 43, 113–129. doi: 10.1007/s13280-014-0566-z
Baho D. L., Allen C. R., Garmestani A. S., Fried-Petersen H. B., Renes S. E., Gunderson L. H., et al. (2017). A quantitative framework for assessing ecological resilience. Ecol. Soc. 22 (3), 1–17. doi: 10.5751/ES-09427-220317
Batty M. (2008). The size, scale, and shape of cities. Science 319 (5864), 769–771. doi: 10.1126/science.1151419
Bozza A., Asprone D., Fabbrocino F. (2017). Urban resilience: A civil engineering perspective. Sustainability 9 (1), 103. doi: 10.3390/su9010103
Brown M. T., Ulgiati S. (2016). Assessing the global environmental sources driving the geobiosphere: A revised emergy baseline. Ecol. Model. 339, 126–132. doi: 10.1016/j.ecolmodel.2016.03.017
Cai Y., Huang G.H, Yang Z.F., Tan Q. (2009b). Identification of optimal strategies for energy management systems planning under multiple uncertainties. Appl. Energ. 86(4), 480–495. doi: 10.1016/j.apenergy.2008.09.025
Cai Y., Huang G.H, Wang X., et al. (2011). An inexact programming approach for supporting ecologically sustainable water supply with the consideration of uncertain water demand by ecosystems. Stoch. Environ. Res. Risk Assess. 25, 721–735. doi: 10.1007/s00477-011-0477-5
Cai Y. P., Huang G. H., Yang Z. F., Lin Q. G., Tan Q. (2009a). Community-scale renewable energy systems planning under uncertainty – An interval chance-constrained programming approach. Renew. Sust. Energ. Rev. 13 (4), 721–735. doi: 10.1016/j.rser.2008.01.008
Cai Y., Rong Q., Yang Z., Yue W., Tan Q. (2018). An export coefficient based inexact fuzzy bi-level multi-objective programming model for the management of agricultural nonpoint source pollution under uncertainty. Journal of Hydrology 557, 713–725. doi: 10.1016/j.jhydrol.2017.12.067
Calcagno V., Jarne P., Loreau M., Mouquet N., David P. (2017). Diversity spurs diversification in ecological communities. Nat. Commun. 8, 15810. doi: 10.1038/ncomms15810
Colding J. (2007). ‘Ecological land-use complementation’ for building resilience in urban ecosystems. Landsc. Urban Plan. 81 (1-2), 46–55. doi: 10.1016/j.landurbplan.2006.10.016
Crowley K., Elliott J. R. (2012). Earthquake disasters and resilience in the global North: lessons from New Zealand and Japan. Geographical J. 178, 208–215. doi: 10.1111/j.1475-4959.2011.00453.x
Dhar T. K., Khirfan L. (2017). A multi-scale and multi-dimensional framework for enhancing the resilience of urban form to climate change. Urban Climate 19, 72–91. doi: 10.1016/j.uclim.2016.12.004
Du M., Zhang X., Wang Y., Tao L., Li H. (2020). An operationalizing model for measuring urban resilience on land expansion. Habitat Int. 102, 102206. doi: 10.1016/j.habitatint.2020.102206
Eakin H., Bojorquez-Tapia L. A., Janssen M. A., Georgescu M., Manuel-Navarrete D., Vivoni E. R., et al. (2017). Urban resilience effortsmust consider social and political forces. Proc. Natl. Acad. Sci. U. S. A. 114 (2), 186–189. doi: 10.1073/pnas.1620081114
Engle N. L. (2011). Adaptive capacity and its assessment. Global Environ. Change 21 (2), 647–656. doi: 10.1016/j.gloenvcha.2011.01.019
Ernstson H., van der Leeuw S. E., Redman C. L., Meffert D. J., Davis G., Alfsen C., et al. (2010). Urban transitions: on urban resilience and human-dominated ecosystems. Ambio 39 (8), 531–545. doi: 10.1007/s13280-010-0081-9
Feit B., Bluthgen N., Traugott M., Jonsson M. (2019). Resilience of ecosystem processes: a new approach shows that functional redundancy of biological control services is reduced by landscape simplification. Ecol. Lett. 22 (10), 1568–1577. doi: 10.1111/ele.13347
Fekete A., Hufschmidt G., Kruse S. (2014). Benefits and challenges of resilience and vulnerability for disaster risk management. Int. J. Disaster Risk Reduct. 5 (1), 3–20. doi: 10.1007/s13753-014-0008-3
Folke C., Carpenter S., Elmqvist T., Gunderson L., Holling C. S., Walker B. (2002). Resilience and sustainable development: Building adaptive capacity in a world of transformations. Ambio 31 (5), 437–440. doi: 10.1639/0044-7447(2002)031[0437:Rasdba]2.0.Co;2
Folke C., Carpenter S. R., Walker B., Scheffer M., Chapin T., Rockstrom J. (2010). Resilience thinking: integrating resilience, adaptability and transformability. Ecol. Soc 15 (4), 20. doi: 10.5751/es-03610-150420
Gao L., Wang M., Liu A., Gong H. (2021). Comprehensive evaluation of urban road network resilience facing earthquakes. Math. Probl. Eng. 2021, 6659114. doi: 10.1155/2021/6659114
Holling C. S. (1996). Engineering Resilience versus Ecological Resilience[J].Engineering Within Ecological Constraints.
Huang G., Li D., Zhu X., Zhu J. (2021). Influencing factors and their influencing mechanisms on urban resilience in China. Sust. Cities Soc 74, 103210. doi: 10.1016/j.scs.2021.103210
Johnson P. M., Brady C. E., Philip C., Baroud H., Camp J. V., Abkowitz M. (2020). A factor analysis approach toward reconciling community vulnerability and resilience indices for natural hazards. Risk Anal. 40 (9), 1795–1810. doi: 10.1111/risa.13508
Li Y., Yang Z. F. (2011). Quantifying the sustainability of water use systems: Calculating the balance between network efficiency and resilience. Ecol. Model. 222 (10), 1771–1780. doi: 10.1016/j.ecolmodel.2011.03.001
Liu L., Lei Y., Zhuang M., Ding S. (2022). The impact of climate change on urban resilience in the Beijing-Tianjin-Hebei region. Sci. Total. Environ. 827, 154157. doi: 10.1016/j.scitotenv.2022.154157
Man S., Wu X., Yang Y., Meng Q. (2021). An assessment approach to urban economic resilience of the rust belt in China. Complexity 2021 1935557. doi: 10.1155/2021/1935557
McGill R. (2020). Urban resilience - An urban management perspective. J. Urban Manage. 9 (3), 372–381. doi: 10.1016/j.jum.2020.04.004
Meerow S., Newell J. P. (2015). Resilience and complexity A bibliometric review and prospects for industrial ecology. J. Ind. Eco 19 (2), 236–251. doi: 10.1111/jiec.12252
Meerow S., Newell J. P. (2016). Urban resilience for whom, what, when, where, and why? Urban Geogr. 40 (3), 309–329. doi: 10.1080/02723638.2016.1206395
Miao Z., Pan L., Wang Q., Chen P., Yan C., Liu L. (2019). Research on urban ecological network under the threat of road networks-A case study of Wuhan. ISPRS Int. J. Geo-Inf. 8 (8), 342. doi: 10.3390/ijgi8080342
Nathwani J., Lu X., Wu C., Fu G., Qin X. (2019). Quantifying security and resilience of Chinese coastal urban ecosystems. Sci. Total. Environ. 672, 51–60. doi: 10.1016/j.scitotenv.2019.03.322
Odum H. (1996). Environmental accounting: Emergy and environmental decision making. 1st (New York: John Wiley).
Pettorelli N., Graham N. A. J., Seddon N., da Cunha Bustamante M. M., Lowton M. J., Sutherland W. J., et al. (2021). Time to integrate global climate change and biodiversity science-policy agendas. J. Appl. Ecol. 58 (11), 2384–2393. doi: 10.1111/1365-2664.13985
Pickett S. T. A., Boone C. G., McGrath B. P., Cadenasso M. L., Childers D. L., Ogden L. A., et al. (2013). Ecological science and transformation to the sustainable city. Cities 32, S10–S20. doi: 10.1016/j.cities.2013.02.008
Ribeiro P. J. G., Pena Jardim Gonçalves L. A. (2019). Urban resilience: A conceptual framework. Sust. Cities Soc 50, 101625. doi: 10.1016/j.scs.2019.101625
Roberts C. P., Twidwell D., Angeler D. G., Allen C. R. (2019). How do ecological resilience metrics relate to community stability and collapse? Ecol. Indic. 107, 105552. doi: 10.1016/j.ecolind.2019.105552
Scheffer M., Carpenter S. R., Dakos V., van Nes E. H. (2015). Generic indicators of ecological resilience: inferring the chance of a critical transition. Annu. Rev. Ecology Evolution Systematics 46 (1), 145–167. doi: 10.1146/annurev-ecolsys-112414-054242
Shi Y., Zhai G., Xu L., Zhou S., Lu Y., Liu H., et al. (2021). Assessment methods of urban system resilience: From the perspective of complex adaptive system theory. Cities 112, 103141. doi: 10.1016/j.cities.2021.103141
Shi C., Zhu X., Wu H., Li Z. (2022). Assessment of urban ecological resilience and its influencing factors: A case study of the Beijing-Tianjin-Hebei Urban agglomeration of China. Land 11 (6), 921. doi: 10.3390/land11060921
Smit B., Wandel J. (2006). Adaptation, adaptive capacity and vulnerability. Global Environ. Change 16 (3), 282–292. doi: 10.1016/j.gloenvcha.2006.03.008
Spaans M., Waterhout B. (2017). Building up resilience in cities worldwide - Rotterdam as participant in the 100 Resilient Cities Programme. Cities 61, 109–116. doi: 10.1016/j.cities.2016.05.011
Tan Q., Huang G.H., Cai Y. (2010). A Superiority-Inferiority-Based Inexact Fuzzy Stochastic Programming Approach for Solid Waste Management Under Uncertainty. Environ. Model. Assess. 15, 381–396. doi: 10.1007/s10666-009-9214-6
Tao Q., Gao G., Xi H., Wang F., Cheng X., Ou W., et al. (2022). An integrated evaluation framework for multiscale ecological protection and restoration based on multi-scenario trade-offs of ecosystem services: Case study of Nanjing City, China. Ecol. Indic. 140, 108962. doi: 10.1016/j.ecolind.2022.108962
Timpane-Padgham B. L., Beechie T., Klinger T. (2017). A systematic review of ecological attributes that confer resilience to climate change in environmental restoration. PloS One 12 (3), e0173812. doi: 10.1371/journal.pone.0173812
Wang S., Cui Z., Lin J., Xie J., Su K. (2022). The coupling relationship between urbanization and ecological resilience in the Pearl River Delta. J. Geogr. Sci. 32 (1), 44–64. doi: 10.1007/s11442-022-1935-3
Wang T., Li H., Huang Y. (2021). The complex ecological network’s resilience of the Wuhan metropolitan area. Ecol. Indic. 130, 108101. doi: 10.1016/j.ecolind.2021.108101
Wang Y., Meng F., Liu H., Zhang C., Fu G. (2019). Assessing catchment scale flood resilience of urban areas using a grid cell based metric. Water Res. 163, 114582. doi: 10.1016/j.watres.2019.114852
Wu X., Zhang J., Geng X., Wang T., Wang K., Liu S. (2020). Increasing green infrastructure-based ecological resilience in urban systems: A perspective from locating ecological and disturbance sources in a resource-based city. Sust. Cities Soc 61, 102354. doi: 10.1016/j.scs.2020.102354
Yang X., Jia Y., Zhang D., Zhang X., Zhang H., Hou Y. (2020). Research on the anti-interference capability of the tourism environment system for the core stakeholders of semi-arid valley-type cities: analysis based on the multi-scenario and time series diversity perspectives. Environ. Sci. pollut. Res. 27 (32), 40020–40040. doi: 10.1007/s11356-020-09059-7
Yeh C.-T., Huang S.-L. (2009). Investigating spatiotemporal patterns of landscape diversity in response to urbanization. Landsc. Urban Plan. 93 (3-4), 151–162. doi: 10.1016/j.landurbplan.2009.07.002
Yu S., Kong X., Wang Q., Yang Z., Peng J. (2023). A new approach of Robustness-Resistance-Recovery (3Rs) to assessing flood resilience: A case study in Dongting Lake Basin. Landsc. Urban Plan. 230, 104605. doi: 10.1016/j.landurbplan.2022.104605
Yun W. Y., Song Y. M., Kim H.-G. (2007). Multiple multi-level redundancy allocation in series systems. Reliab. Eng. Syst. Saf. 92 (3), 308–313. doi: 10.1016/j.ress.2006.04.006
Zhao R., Fang C., Liu H., Liu X. (2021). Evaluating urban ecosystem resilience using the DPSIR framework and the ENA model: A case study of 35 cities in China. Sust. Cities Soc 72, 102997. doi: 10.1016/j.scs.2021.102997
Keywords: ecological resilience, quantitative framework, urbanization, spatialtemporal pattern evolution, urban agglomeration
Citation: Wang Y, Cai Y, Xie Y, Zhang P and Chen L (2023) A quantitative framework to evaluate urban ecological resilience: broadening understanding through multi-attribute perspectives. Front. Ecol. Evol. 11:1144244. doi: 10.3389/fevo.2023.1144244
Received: 14 January 2023; Accepted: 25 September 2023;
Published: 02 November 2023.
Edited by:
Xueru Zhang, Hebei University of Economics and Business, ChinaReviewed by:
Xiao Ouyang, Hunan University of Finance and Economics, ChinaCopyright © 2023 Wang, Cai, Xie, Zhang and Chen. This is an open-access article distributed under the terms of the Creative Commons Attribution License (CC BY). The use, distribution or reproduction in other forums is permitted, provided the original author(s) and the copyright owner(s) are credited and that the original publication in this journal is cited, in accordance with accepted academic practice. No use, distribution or reproduction is permitted which does not comply with these terms.
*Correspondence: Yanpeng Cai, eWFucGVuZy5jYWlAZ2R1dC5lZHUuY24=
Disclaimer: All claims expressed in this article are solely those of the authors and do not necessarily represent those of their affiliated organizations, or those of the publisher, the editors and the reviewers. Any product that may be evaluated in this article or claim that may be made by its manufacturer is not guaranteed or endorsed by the publisher.
Research integrity at Frontiers
Learn more about the work of our research integrity team to safeguard the quality of each article we publish.