
95% of researchers rate our articles as excellent or good
Learn more about the work of our research integrity team to safeguard the quality of each article we publish.
Find out more
METHODS article
Front. Ecol. Evol. , 31 May 2023
Sec. Chemical Ecology
Volume 11 - 2023 | https://doi.org/10.3389/fevo.2023.1141832
This article is part of the Research Topic Methods in Chemical Ecology: 2022/23 View all 8 articles
 Gemma Nydia Villagómez1
 René-Chris Brachvogel2
 Zsolt Kárpáti1,3Sara D. Leonhardt4
 Thomas Schmitt1
 Fabian A. Ruedenauer4*
Introduction: Pollen is an important tissue in plants that plays a vital role in plant reproduction as it carries male gametes and occasionally also serves as a pollinator reward. There has been an increasing interest in pollen chemistry due to the impact of chemical variation on pollinator choices and well-being, especially in bees. The pollen fat content and lipid-to-protein ratio have been shown to play a crucial role in regulating pollen intake, and some bee species avoid overconsumption of fatty acids while specific pollen fatty acid ratios are essential for bee cognition. Therefore, knowledge of the fatty acid composition of plant pollen is crucial for understanding plant-pollinator interactions. However, existing methods for fatty acid analyses are not always specific to pollen fatty acids, and non-pollen-derived fatty acids can easily contaminate samples, making comparison between different methods impossible. Hence, the objectives of our study were to highlight the common mistakes and pitfalls made during pollen fatty acid extraction and analysis and propose a common protocol for reliable comparisons of pollen samples.
Methods: The proposed method, developed in two different labs using different gas chromatograph/mass spectrometers and gas chromatograph/flame ionization detectors, involved manually homogenizing pollen, extracting it with chloroform:methanol (2:1), and analyzing it using gas chromatography (GC) and mass spectrometry (MS) and a flame ionization detector (FID) for identification and quantification.
Results: We found that many fatty acids were present in plastic materials and many solvents commonly used in the labs, cautioning against the use of plastic and recommending blank samples to determine the level of contamination. We also suggest adding an internal standard and checking the MS and FID’s saturation limit before starting pollen homogenization.
Discussion: Our proposed method generated reliable fatty acid profiles of pollen from two different plant species analyzed in the two labs, and we hope it serves as a blueprint for achieving a common methodology for characterizing and comparing pollen fatty acid profiles in ecological research.
Plant pollen is an intriguing plant tissue, which carries the male gametes from one plant individual to another. In some plant species, pollen additionally serves as a reward for pollinators. In fact, pollen is a major dietary source for many bee pollinators (Waser and Ollerton, 2006; Michener, 2007). However, pollen is chemically very complex, containing not only all micro- and macro-nutrients considered essential for bees but also a diverse array of plant secondary metabolites which can be either beneficial or toxic to pollinators (Palmer-Young et al., 2019a,b; Stevenson, 2020; Thakur and Nanda, 2020). Recent years have seen a substantial increase in interest in pollen chemistry, possibly due to growing concerns about pollinator declines and a subsequent strong scientific interest in understanding the underlying mechanisms and halting this trend.
The chemical characteristics of floral pollen are believed to have a significant impact on the well-being of pollinators that consume it, including bees. Pollen from different plant species has been found to have varying effects on bee behavior, development, survival, and reproduction (Eckhardt et al., 2014; Vanderplanck et al., 2014; Roger et al., 2017; Ruedenauer et al., 2020b). These effects are likely attributed to differences in pollen chemical profiles and may account for why bees exhibit greater selectivity when gathering pollen than when collecting nectar (Waser and Ollerton, 2006; Nicholls and Hempel de Ibarra, 2017).
Floral pollen consists of a manifold of different chemicals, including micronutrients, such as vitamins and minerals (Togasawa et al., 1967; Loper et al., 1980) as well as macronutrients like carbohydrates, e.g., sugars and starch (Roulston and Cane, 2000), protein and peptides (Roulston and Cane, 2000; Vanderplanck et al., 2014) and lipids. The latter contain various compounds, such as fatty acids (FAs) and sterols (Manning, 2001; Vanderplanck et al., 2011). Recent studies have found that the protein-to-lipid ratio in particular, as well as the contents and ratios of various FAs are strongly related to bee foraging decisions and larval development (Vaudo et al., 2016a,b, 2020; Kraus et al., 2019; Arien et al., 2020; Ruedenauer et al., 2020a). These findings indicate that pollen FAs may play a hitherto underestimated role in determining the dietary quality of pollen for various bee species.
FAs and other lipids are found in the pollenkitt, an oily layer on the pollen exine, as well as inside the pollen (Pacini and Hesse, 2005). Fat inside pollen is mainly used as energy storage and can be converted to sugar in case of metabolic needs (Beevers, 1980). Pollenkitt appears to serve multiple functions, including adhesion (e.g., on anthers and pollinators), protection against microorganisms and UV radiation, and attraction of pollinators (Pacini and Hesse, 2005). Hence, fat in pollen (like pollen itself) is primarily used for plant reproduction. Interestingly, the lipid and fat content of pollen varies significantly among different plant species (e.g., Roulston and Cane, 2000; Manning, 2001; Ruedenauer et al., 2019), which may, among other reasons, explain the differences in bee choices and effects on their well-being mentioned above.
Pollen lipids, especially pollen fatty acids (FAs), have been found to have a strong and partly unexpected effect, leading to increased interest in analyzing their content over the past years. Previous methods used to assess pollen fat or lipid content have focused on analyzing the total lipid content, such as the Folch and Bligh & Dyer assays. These methods use chloroform: methanol and water or a salt solution to separate the polar from the non-polar pollen fraction (Folch et al., 1957; Bligh and Dyer, 1959). Another method is the vanillin assay, which uses sulfuric acid that reacts with the double bonds of FAs and vanillin-phosphoric acid, leading to a color change following the reaction; the color absorbance correlates with the pollen lipid amount (Cheng et al., 2011). The above-mentioned approaches are rather crude since they extract a variety of other substances, such as sterols, tocols, and phenolic compounds (Peterson et al., 2007; Ulusoy and Kolayli, 2014) besides FAs (Folch and Bligh & Dyer), or only target a specific group of FAs (unsaturated FAs in the vanillin assay) (Knight et al., 1972, see Lau et al. (2022) for a detailed review of the different methods for extracting lipids from pollen). Alternative, more accurate approaches use gas chromatographic analyses (e.g., Markowicz Bastos et al., 2004; Kostić et al., 2017; Wu et al., 2019; Gercek et al., 2022; Lau et al., 2022; Peters et al., 2022). However, existing protocols have detected relatively few FAs (e.g., Markowicz Bastos et al., 2004; Lau et al., 2022), used plastic during extraction (e.g., Lau et al., 2022), did not run blank samples (e.g., Markowicz Bastos et al., 2004; Kostić et al., 2017), used FAs that are naturally present in pollen (e.g., tetracosanoic acid) as internal standard (e.g., Lau et al., 2022), added the internal standard later in the analysis or did not add any internal standard for quantification. These differences in methodological approaches render comparisons among studies difficult. This study aimed to (i) identify the most common mistakes and pitfalls in extracting and analyzing pollen FAs, and (ii) suggest a common protocol for improving their analysis to enable reliable comparison between pollen samples. Based on other protocols in the literature, we propose a chromatography method that uses only one internal standard and can overcome common pitfalls while being simple and precise. This method can be used for comparative studies, primarily needed in the field of ecology. Considering the natural variation in pollen of the same plant species, the method can be considered reliable and of sufficient accuracy. However, further improvements may be necessary to obtain the most accurate quantifications possible (e.g., for comparison of intraspecfic variance).
We utilized a combination of gas chromatography–mass spectrometry (GC–MS) and gas chromatography-flame ionization detection (GC-FID) (GC: 7890B and 6890N for comparison, MSD: 5977B and 5975 for comparison, Agilent Technologies, Santa Clara, United States) to conduct a qualitative and quantitative analysis of FAs. Both GCs had a single taper liner for splitless injection with 4 mm inner diameter and glass wool. GC 7890B had a liner with ultra inert deactivation (Joint Analytical Systems GmbH, Moers Germany) and GC 6890N had a liner with standard deactivation (Agilent Thechnologies). Trimethylsulfonium hydroxide (TMSH) (0.2 M in methanol, Macherey Nagel, Düren, Germany) was used as FA derivatization agent. A standard mix of fatty acid methyl esters (FAME) with a carbon chain length of C8-C24 (Sigma-Aldrich, Darmstadt, Germany) was used to verify the reliability of GC–MS and GC-FID for FAME quantification and identification. The solvents used were: chloroform (ROTISOLV® HPLC, Carl Roth GmbH + Co. KG, Karlsruhe, Germany), methanol, heptane, and dichloromethane (all SupraSolv®, Merck, Darmstadt, Germany). The materials used were: Eppendorf tubes (Hartenstein GmbH, Würzburg, Germany), screw thread bottles (with plastic lids, Schott, Mainz, Germany), micropipette tips (Greiner Bio-One GmbH, Frickenhausen, Germany), 4 mL glass vials with screw caps with polytetrafluoroethylene (PTFE)/Butyl/PTFE without adhesive, 1.5 mL GC vials with screw caps with silicone/PTFE, and 300 μL glass inserts (all from Chromatographie Zubehör Trott, Kriftel, Germany).
During the development of our protocol and a literature review of FA analyses, we identified several common mistakes in pollen FA extraction and analysis. These include: (i) the use of high sample concentrations that may exceed the saturation limit of gas chromatography detectors (such as mass spectrometers and flame ionization detectors); (ii) quantification of FAs only by GC–MS without generating standard curves for individual fatty acids which can result in varying peak areas in the chromatograms (see below); and (iii) the use of plastic materials for FA extraction, which can lead to fatty acid contamination. To address these issues we: (a) determined the maximum sample concentration that does not exceed the saturation level of our MS and FID; (b) evaluated which GC detector (i.e., MS or FID) is more suitable for FA quantification when using one internal standard; and (c) assessed the occurrence of FAs in potential sources of contamination, such as Eppendorf tubes (which are commonly used for pollen storage and extraction) and other plastic materials.
To improve the analysis of FAs in pollen samples, it is recommended to convert them to their fatty acid methyl ester (FAME) form due to their poor vaporization and potential tailing peaks in gas chromatography (GC) caused by their polar groups (Řezanka et al., 2016; Chiu and Kuo, 2020). To assess the saturation levels of our GC-mass spectrometry (GC–MS) and GC-flame ionization detection (GC–FID) methods for FA analysis, we used a FAME standard (FAME mix C8–C24) with total standard concentrations ranging from 10 to 600 ng/μL in heptane (see Supplementary Table S1 for compound details). Each concentration was injected three times in both GC–MS and GC-FID, except for the 10 ng/μL standard, which was run only once due to inadequate results.
In both, GC–MS and GC-FID, helium was used as carrier gas. For the GC–MS, 1 μL of each sample was injected with an autosampler in splitless mode at 300°C (following Peters et al., 2022). The initial oven temperature was set to 60°C. After 1 min, the temperature was increased to 150°C at 15°C/min, which was held for 10 min, then increased to 320°C at 10°C/min and held for 10 min. Electron ionization mass spectra were recorded from 40 to 650 m/z. MS source temperature was 230°C. For data acquisition, we used the software MSD ChemStation F.01.00.1903 (Agilent Technologies, Santa Clara, United States).
Interestingly, 9,12,15-octadecatrienoic acid methyl ester was not detected in the chromatograms with this GC–MS method, so we changed the GC program for the GC-FID runs. After the injection at an initial oven temperature of 60°C, the temperature was directly increased to 320°C at 5°C/min and held for 10 min (i.e., in the FID runs we only had one ramp instead of two). FID temperature was set to 300°C and the gas flows were set to 400 mL/min for air, 30 mL/min for H2, and 25 mL/min for makeup gas (N2). For these GC-FID runs, samples were manually injected.
Note that the FAMEs have varying concentrations in the FAME standard (Supplementary Table S1). To enable the use of a single internal standard for fatty acid (FA) analysis, we adjusted for concentration differences by calculating the expected peak area of each FAME at 5% concentration in the standard. For visualization and comparison among FAMEs, we plotted the total sample concentration (x-axis) and peak area of each FAME at 5% (y-axis) (Figures 1, 2) (plots without correction: Supplementary Figures S3–S5). We determined the saturation limit of the detectors by observing the non-linear increase in the correlation curve of sample concentration peak area, beyond which peak areas cannot be reliably quantified. To demonstrate the loss of linearity and increased variation between FAMEs after reaching saturation, we obtained the adjusted R values of linear models with the peak area as the response variable and sample concentration as the explanatory variable for both MS and FID data [software R version 4.2.2 (R Core Team, 2022)]. The first set of models used the standard concentrations of 10, 100, 200, and 300 ng/μL. The second set used concentrations between 400, 500, and 600 ng/μL.
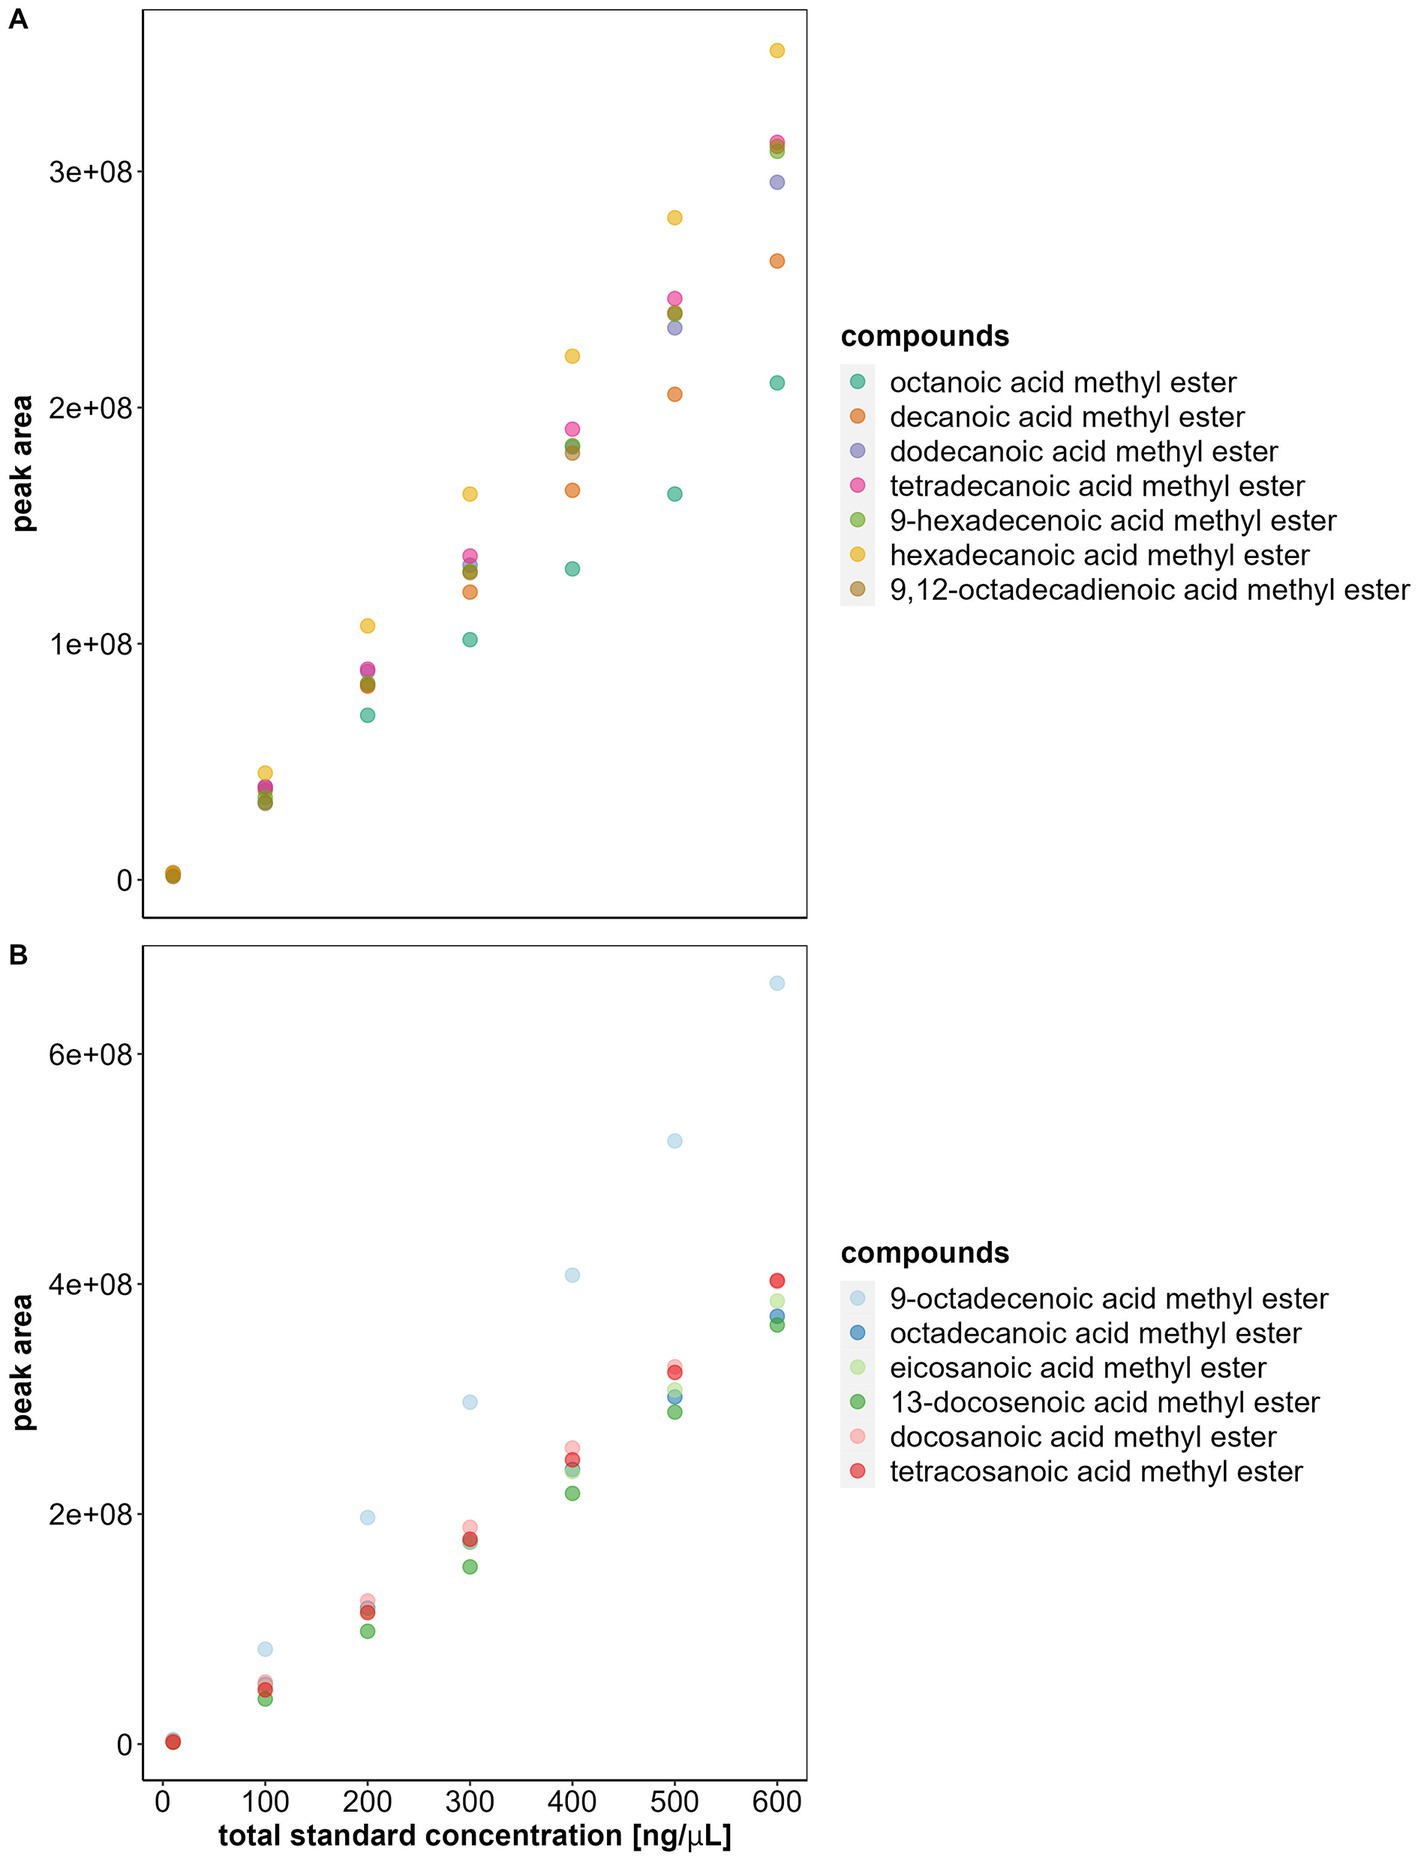
Figure 1. Saturation level of the mass spectrometer (MS). The plots show the total fatty acid methyl esters (FAMEs) standard concentration and the average peak area of each FAME (all at 5% concentration) at the corresponding total standard concentration. Each solution with its specific concentration was injected three times in the GC–MS, the average of these 3 runs is represented as a dot in the plot. Note that after 400 ng/μL the correlation between standard concentration and area is no longer linear and variation increases substantially. (A) FAMEs with carbon-chain lengths between 8 and 18. (B) FAMEs with carbon-chain lengths between 18 and 24.
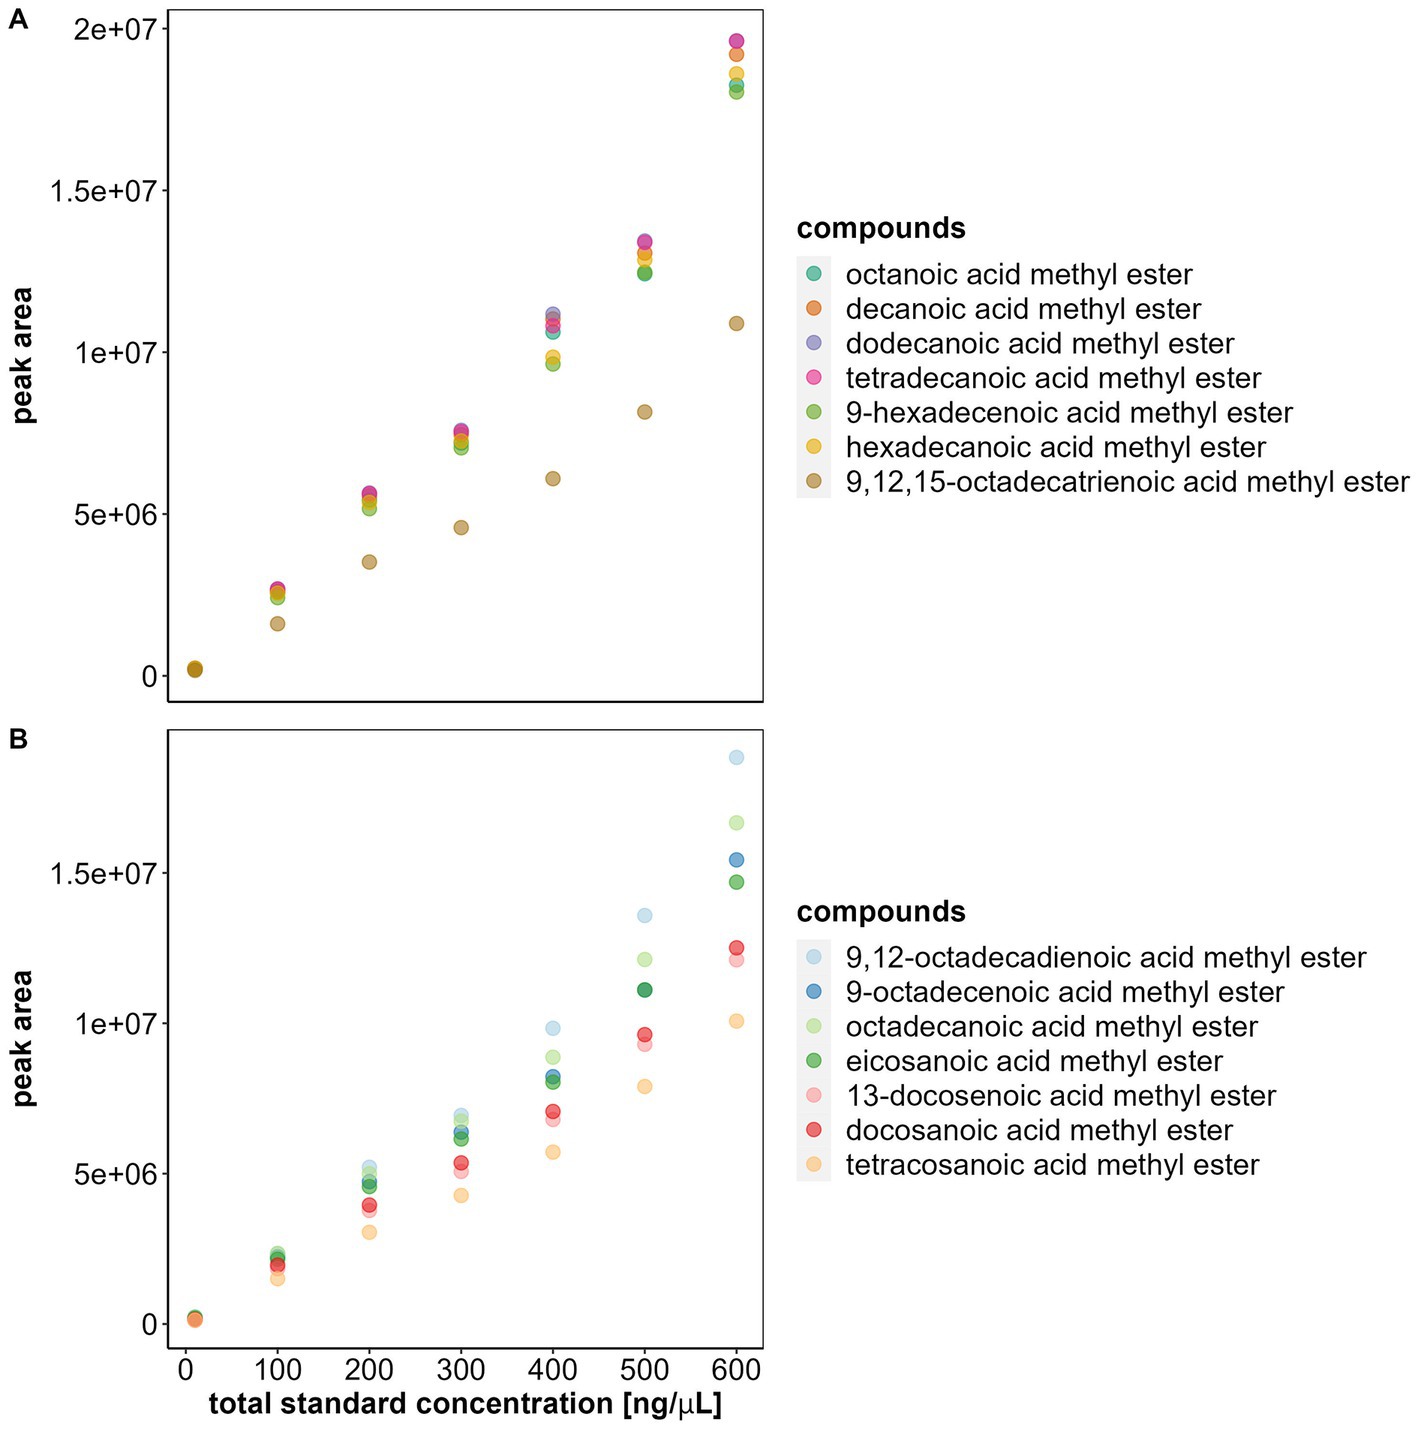
Figure 2. Saturation level of the flame ionization detector (FID) of the gas chromatograph. The plots show the total fatty acid methyl esters (FAMEs) standard concentration and the average peak area of each FAME (all at 5% concentration) at the corresponding total standard concentration. Each solution with its specific concentration was injected three times in the GC-FID, the average of these 3 runs is represented as a dot in the plot. Note that after 400 ng/μL the correlation between standard concentration and area is no longer linear and variation increases substantially. (A) FAMEs with carbon-chain lengths between 8 and 18. (B) FAMEs with carbon-chain lengths between 18 and 24.
Despite the possibility of over- or underestimation of some compounds (see Results “Selection of a detector and saturation limit for FA quantification”) we opted to use a single internal standard for quantification due to the high variability of samples, such as pollen, which can contain over 60 different FAs with unknown compositions. Using an internal standard, we assumed that all compounds should have the same peak area for the same concentration. Therefore, we additionally compared the peak area between GC–MS and GC-FID for the same FAMEs at the same concentrations (300 ng/μL, Figure 3). We also calculated the R2 values of a linear model with area and sample concentration for all concentrations (10–600 ng/μL) to compare the variation between samples in MS and FID. Additionally, we calculated the coefficient of variation (CV) between all FAs at the same concentration (5%).
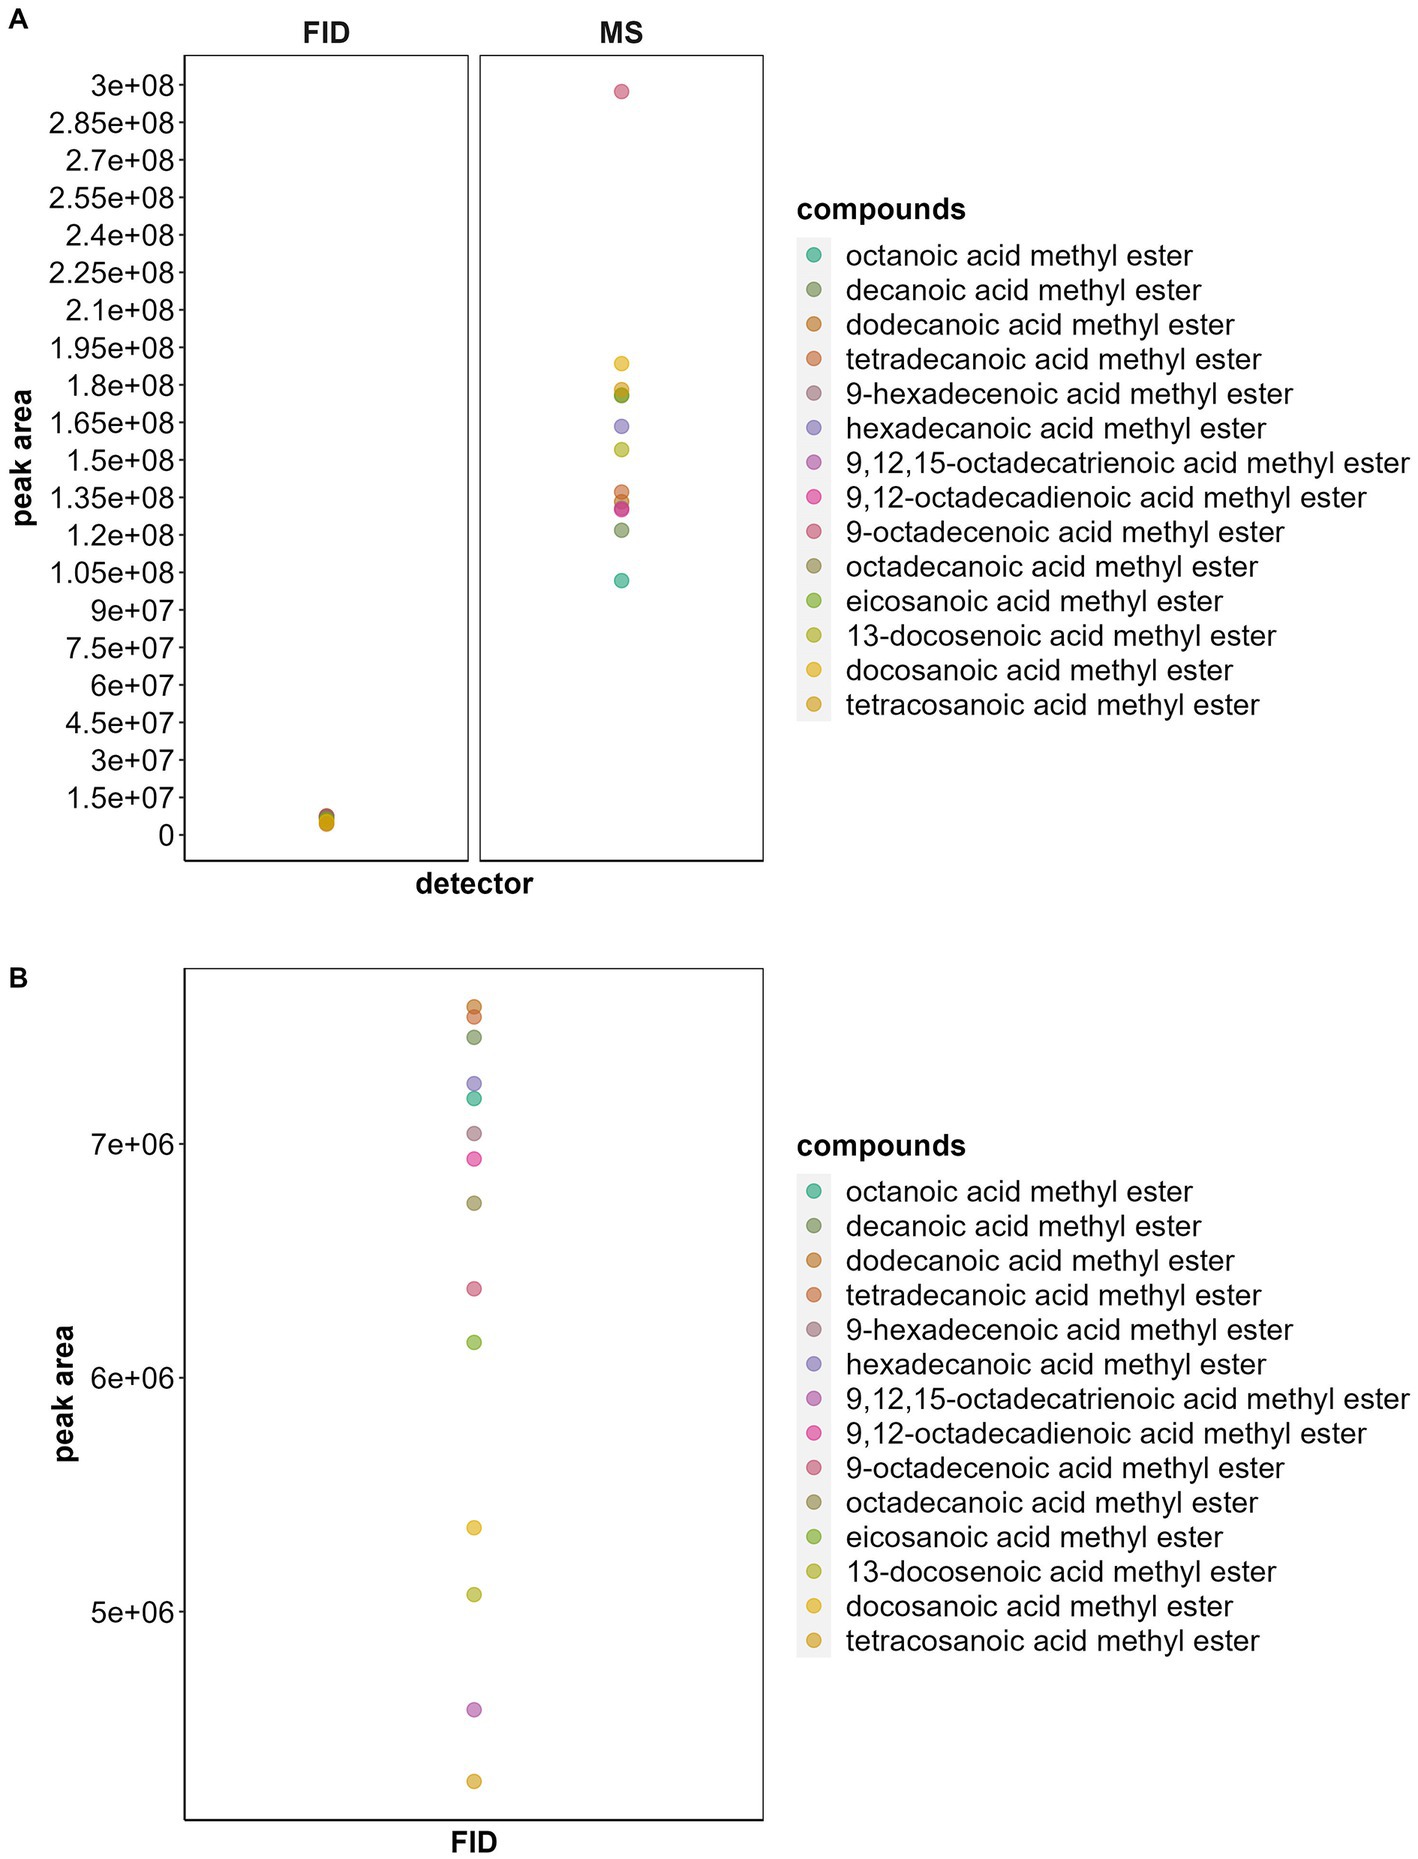
Figure 3. (A) Comparison of average peak areas of fatty acid methyl esters (FAME) at the same concentration (5%) using two different analytical methods to quantify FAs: gas chromatography–mass spectrometry (GC–MS) and gas chromatography-flame ionization detector (GC-FID). Note the high variation between areas when using MS (CV = 0.663) compared to FID (CV = 0.427). (B) Zoom-in of the peak areas obtained with GC-FID. There is some variation between areas when using FID but it is less than when using MS. The total standard concentration was 300 ng/μL and it was injected three times, the average of these 3 runs is represented as a dot in the plot.
In nutrient chemical analyses, it is common to use plastic materials such as screw thread bottles (with plastic lids), micropipette tips and Eppendorf tubes for solvent storage, pipetting and the extraction process. We investigated if these materials can release FAs during extraction with chloroform and methanol. We extracted the following materials in chloroform: methanol (2:1): (a) a lid from a screw thread bottle (the bottle was placed upside down and left at room temperature for 24 h), (b) an Eppendorf tube (we added 1.5 mL to the solution and left it for 24 h), and (c) a micropipette tip (submerged for 24 h). We also added 7 μL of chloroform to a 300 μL insert of a glass vial using (d) a plastic micropipette tip and (e) a glass Pasteur pipette. We finally produced a (f) blank control by only using glass vials and a single-use plastic micropipette (for adding 7 μL of 200 ng/μL nonadecanoic acid in chloroform, as internal standard), but without adding pollen nor FAME standard.
For (a), (b), (c), and (f) extracts were evaporated under a gentle stream of CO2 or nitrogen (depending on the laboratory where the samples were prepared) until they could be transferred into a 300 μL insert of a glass vial to be completely evaporated. The extracts of (d) and (e) were also completely evaporated. For GC analysis, all FAs obtained in the extracts were converted to FAMEs by adding 20 μL of trimethylsulfonium hydroxide (TMSH) with a glass syringe to the samples (a) and (c). In order to adjust the concentration, for (b), (d), (e), and (f) only 10 μL of TMSH were added to the samples, while extracts (b) and (f) were then further diluted with 150 μL of dichloromethane.
FAs were analyzed via GC–MS using an autosampler and the GC program for the FID runs above mentioned. FAs were identified based on their mass spectra, retention times, and by comparing their spectra to respective compounds of the FAME standard (FAME mix C8–C24, Supplementary Table S1), and the NIST 17 library using the NIST MS Search 2.0 software.
Our initial experiments revealed that the linear correlation between concentration and peak area stopped for total FAME concentrations above 400 ng/μL. Specifically, our results showed that the linear correlation existed between 10 and 300 ng/μL (MS results: linear model between 10 and 300 ng/μL adjusted R2 = 0.81, F1, 154 = 651.2, p < 0.0001; linear model between 400 and 600 ng/μL adjusted R2 = 0.29, F1, 115 = 48.86, p < 0.0001. FID results: linear model between 10 and 300 ng/μL adjusted R2 = 0.84, F1, 138 = 745.3, p < 0.0001; linear model between 400 and 600 ng/μL adjusted R2 = 0.5, F1, 124 = 126.4, p < 0.0001). These results corresponded to a chromatogram abundance between 2.2e+07 and 2.3e+07, in our GC–MS, and to a chromatogram response between 700,000 and 750,000, in our GC-FID (Figures 1, 2).
Furthermore, differences among peak areas of FAMEs increased with sample concentration, particularly for sample concentrations above 400 ng/μL (Figures 1, 2) (MS: adjusted R2 = 0.81 between 10 and 300 ng/μL and adjusted R2 = 0.29 between 400 and 600 ng/μL. FID: adjusted R2 = 0.84 between 10 and 300 ng/μL and adjusted R2 = 0.5 between 400 and 600 ng/μL). This loss of the linear relationship and the increase of variation between peak areas implied that we had reached the saturation levels of the detectors at 400 ng/μL and that the peak areas obtained after this threshold were no longer reliable for FA quantification. Therefore, before analyzing FA, the saturation limit of the MS and FID should be investigated to ensure that the sample concentrations are within the reliable detection range.
We also observed that different FAMEs injected at the same concentration were represented by completely different peak areas in the GC–MS (Figure 3A), rendering quantification impossible when assuming that the FAMEs at the same concentration have identical peak areas (MS linear model adjusted R2 = 0.79, F1, 271 = 1,036, p < 0.0001; MS CV: 0.663). GC–MS should thus only be used to quantify FAMEs when standard curves for individual FAMEs are used. Although we also observed slight differences between peak areas of FAMEs at the same concentration in GC–FID (Figure 3B), the variation was smaller (FID linear model adjusted R2 = 0.82, F1, 264 = 1,203, p < 0.0001; FID CV: 0.427). For example, when comparing the minimum and maximum peak areas obtained with GC-FID (considering all FAMEs at 5%) the compound with the smallest peak area (tretracosanoic acid methyl ester, area = 3,333,767) had half the area of the compound with the largest area (tetradecanoic acid methyl ester, area = 7,655,164). Hence, assuming equal peak areas for all FAMEs at the same concentration and using only one internal standard for FAME quantification may lead to an under or overestimation of certain compounds by up to a factor of two. When examining the maximum and minimum peak areas obtained using GC–MS (all FAMEs at 5%) the compound with the smallest peak area (octanoic acid methyl ester, area = 96,746,730) had only a third of the area of the compound with the largest area (9-octadecenoic acid methyl ester area = 302,655,200), which further increases the potential for under/overestimation.
We found FAs in different plastic materials, i.e., lids of screw thread bottles, new Eppendorf tubes, and new micropipette tips (Supplementary Figures S1A–C, e.g., Supplementary Table S2). Whether and how many FAs were extracted depended on the contact times of plastics with the solvents. For example, chloroform briefly transferred with a micropipette tip did not substantially differ from a chloroform extract using only glass (Supplementary Figures S2A,B). However, when the micropipette was extracted for 24 h, many FAs were found (Supplementary Figure S1C). Plastic contains generally fewer FAs than pollen, however, which fatty acids are present seems to depend on the product (Supplementary Table S2). Although plastic has some FAs that are not present in pollen (e.g., methylundecanoic and nonadecanoic acid) (Supplementary Figures S1A,C), some plastic FAs overlap with pollen FAs (compare Supplementary Figure S1 and Figure 4B, and Supplementary Tables S2, S5).
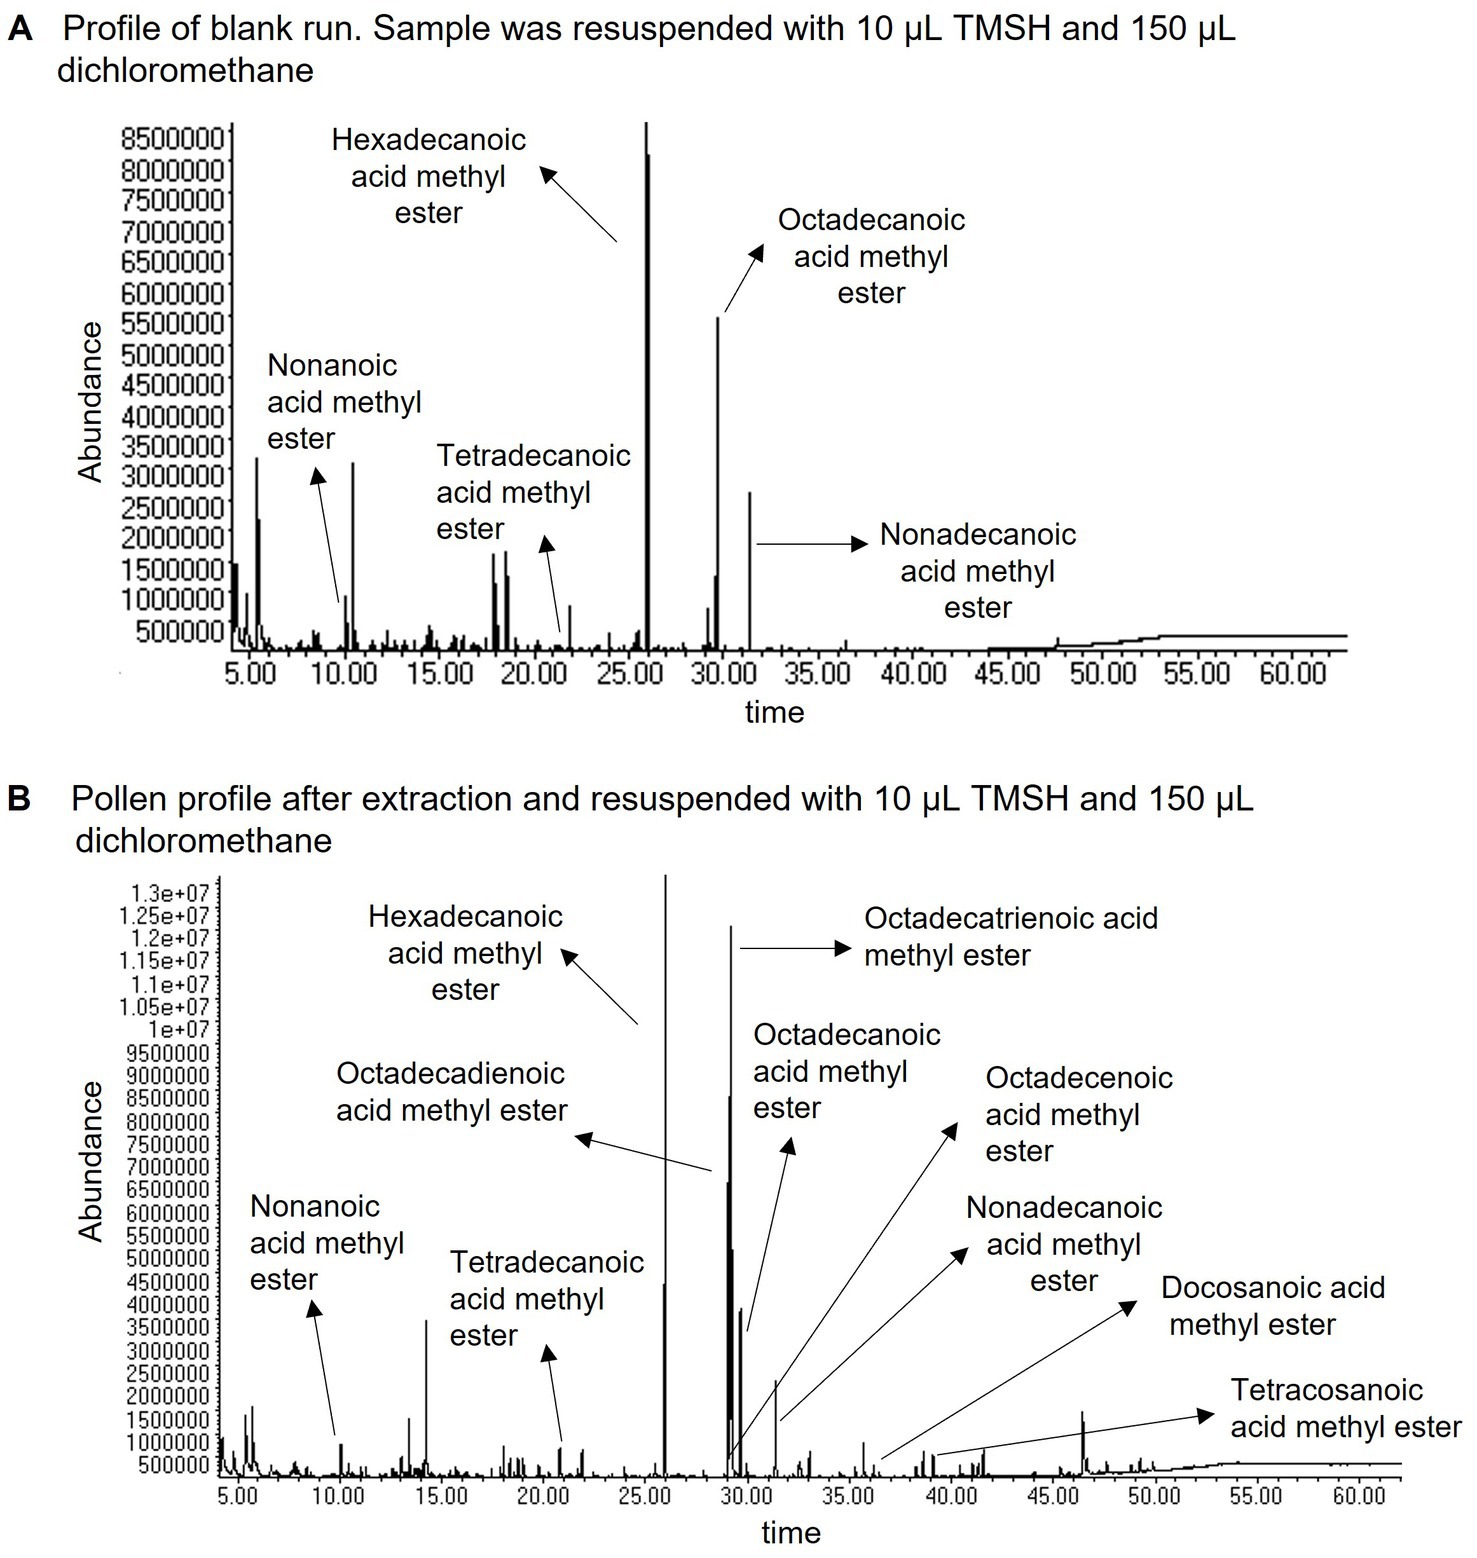
Figure 4. Chromatograms of (A) a blank run using our method and adding nonadecanoic acid as internal standard (no pollen), and (B) a pollen sample of Sambucus nigra after extraction. Both extracts were resuspended with 10 μL TMSH and 150 μL dichloromethane. The chromatograms show some of the FAs found in each extract. Note the higher diversity of FAs in pollen samples but also the overlap of some with the FAs present in the blank. The chromatograms were obtained using gas chromatography–mass spectrometry.
It is important to note that FAs in plastic and solvents, as seen in the blank run (Figure 4A), are ubiquitous and difficult to avoid. Even when avoiding plastic as much as possible, we found hexadecanoic and octadecanoic acid in blank runs (6,304 ng and 4,353 ng respectively) likely because FAs are present in solvents and TMSH. Based on these results, we suggest some common steps that should be implemented to improve pollen FA analysis. Including these steps, we developed a protocol (based on the protocols from Glew et al., 1997; Brückner et al., 2017; Lau et al., 2022; Peters et al., 2022) for the extraction, identification, quantification, and comparison of FAs in pollen, and for the determination of the total FA content of pollen by summing the amounts of all FAs. We also provide suggestions for further improving the proposed protocol (see Supplementary material “Methods used to develop a common protocol and suggestions for its improvement” for details).
The adapted protocol was employed to extract, identify, and quantify fatty acids (FAs) from the pollen of two plant species (Supplementary Table S5): Sambucus nigra (Adoxaceae) and Acer negundo (Sapindaceae). We tested this protocol by conducting three repetitions of FA extraction from the pollen samples. Pollen samples were freeze-dried for 24 h to preserve their nutritional properties (Conte et al., 2017) and weighed subsequently, yielding weights between 0.5 mg to 0.9 mg (Supplementary Table S3). We used the above-mentioned GC–MS (for FAME identification) and GC-FID (for FAME quantification) programs and an autosampler for sample injection in the GC–MS and GC-FID. Pollen FAs were identified based on their mass spectra, retention times, and retention indices and by comparing their spectra to respective compounds of the FAME standard (FAME mix C8-C24, Supplementary Table S1), and to compounds in the NIST 17 library. Retention indices of FAs were obtained for both MS and FID runs to determine the corresponding peaks of the FAME in the FID output. Some substances related to FAs, such as dicarboxylic acids (containing two carboxyl groups (―COOH)), FA ethyl esters, and hydroxy FAs (with a hydroxyl group ―OH) were found during FA analysis (Supplementary Table S5), but only compounds that conformed to the definition of FAs, i.e., a “chain of carbon atoms with hydrogen atoms along the chain and a carboxyl group (―COOH) at one end of the chain” were included in the analyses, which includes methyl-branched FAs. Technical replicates were obtained by running all the samples two more times using MS (for FAME identification) and FID (for FAME quantification). The results showed no significant differences between these technical replicates (Supplementary material “Technical repeats,” Supplementary Figure S7).
The total fat content of both species was compared using a t-test. FA profiles were analyzed by grouping them into one of five different fatty acid groups (saturated, monounsaturated, diunsaturated, triunsaturated, and unknown) with a linear mixed effect model (LMM). In this model, we tested for differences between samples in the amount of FAs per FA group (using FA groups as random factor). We also performed pairwise comparisons between samples [by computing contrasts of estimated marginal means; adjustment method: Holm; emmeans package (Lenth, 2018)]. Total FA content differed significantly between the two plant species (t = 5.1, p = 0.021, Figure 5), and samples differed in their fatty acid profiles between the two plant species (F5, 20 = 6.4, p = 0.001, Figure 6), while there were no significant differences between samples of the same species (Supplementary Table S4). To determine which FAs separated the two plant species’ profiles visually, a volcano plot was produced (MetaboAnalyst platform 5.0)1 (Supplementary Figure S6).
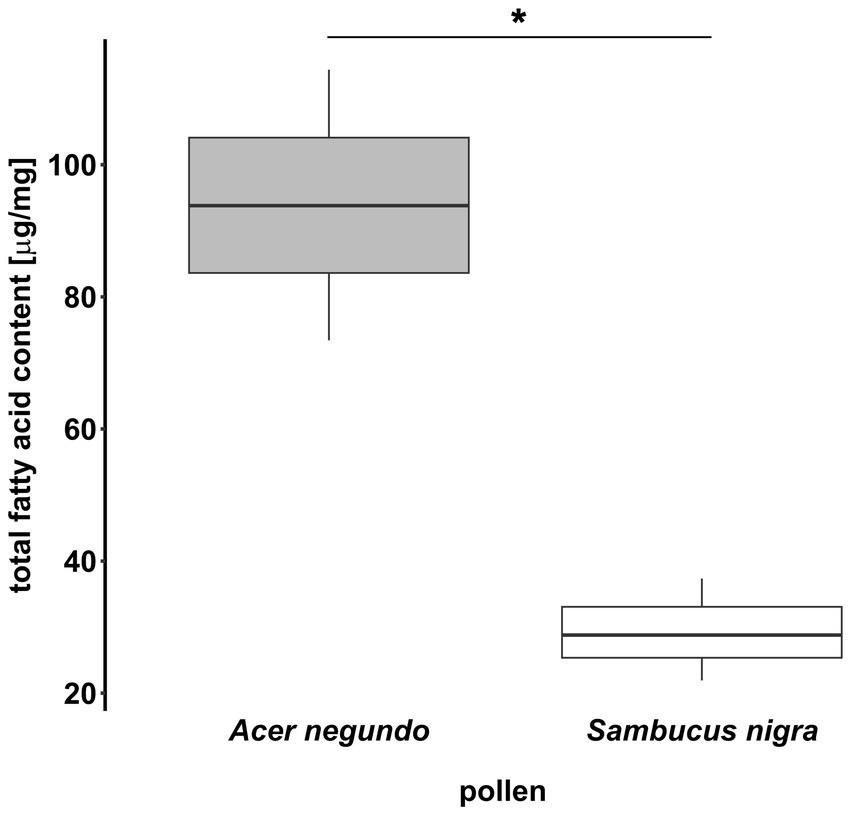
Figure 5. Total fat content of Acer negundo (N = 3) and Sambucus nigra (N = 3) pollen. Fatty acids were extracted with the protocol proposed in this manuscript. Intraspecific variation between samples was present but much lower than interspecific variation, which was significantly different.
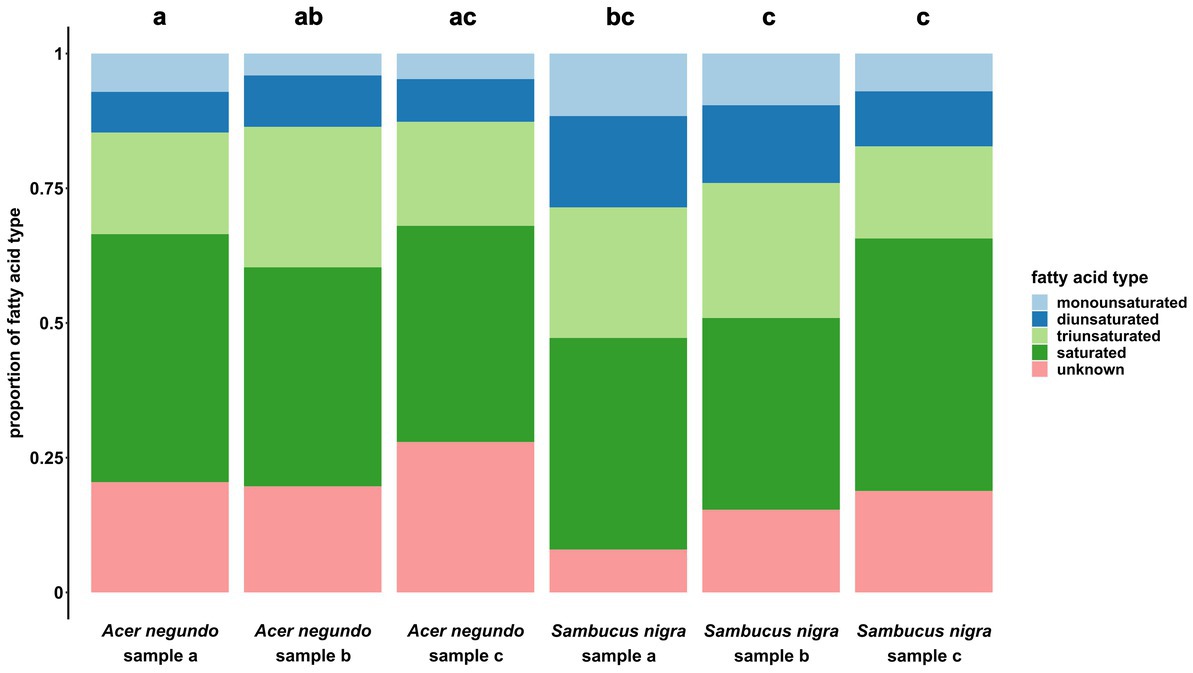
Figure 6. Proportions of five different fatty acid types (monounsaturated, diunsaturated, triunsaturated, saturated, or unknown) in each sample of Acer negundo (N = 3) and Sambucus nigra (N = 3). While there was some intraspecific variation, it was never significant, while most of the samples differed significantly between the two species (except for Acer negundo samples b and c with Sambucus nigra sample a, and sample c of Acer negundo with all samples from Sambucus nigra). Note, however, that interspecific variances can be much bigger for single fatty acids, than for grouped fatty acid types.
• Check the saturation and detection limit of the GC–MS and GC-FID used for the analysis (see “Selection of a detector and detection limit for FA quantification” as an example).
• Select a method with automatized steps for pollen homogenization and FA extraction. This method should be good enough to break the pollen grains and extract FAs from inside the grains without degrading them.
• Select an internal standard(s) that is(are) not present in pollen and add it (them) at the very beginning of the pollen extraction process.
• Before sample injection in the GC, convert FAs to FAMEs to avoid poor separation in GC and tailing peaks.
• When using one internal standard for quantification and therefore assuming that all FAs have similar peak areas in the chromatograms for the same concentrations, run samples in GC–MS only for FAME identification and in GC–FID for FAME quantification to reduce over−/underestimation of concentrations. MS and FID runs can either be done during the same run using a splitter (to divide the effluent from the GC column into the MS and FID detectors of the same GC) or be conducted separately in two subsequent runs on the same column type. In the case of using a splitter that does not automatically split in a 50–50% ratio (e.g., a simple column splitter), the concentration needs to be increased accordingly, as the MS will use most of the flow (due to the vacuum) and the FID concentration will be too low. Note that the GC-FID output does not give any information about the structure of the FA except the retention times and therefore peaks cannot be directly characterized. To identify which peak of the FID is a FAME, chromatograms of MS and FID need to be compared to determine which peaks correspond to each other. Peaks can be matched using retention indices of peaks in the MS and FID (see Supplementary material “Obtaining retention indices and retention times of the FAs”). Once you have MS and FID retention indices, identify respective peaks in GC–MS and GC-FID (retention indices are similar when using the same column), and integrate GC-FID peaks to obtain areas for quantification.
• Finally, as FAs are present in many labware materials, avoid as much as possible using plastic during the extraction process. Additionally, we strongly recommend running blank samples within all extraction steps conducted with pure solvents to determine the level of contamination from solvents and reaction agents.
Before starting analyses, it is important to check the saturation and detection limit of each GC–MS and GC-FID. This will determine how much pollen and TMSH should be used.
1. Transfer 0.5–1 mg of pollen (amounts may vary depending on the sensitivity of the GC–MS and GC-FID and the type of the pollen; note that 1 mg can easily reach the detection limit in sensitive detectors) to a clean glass vial.
2. Add 7–20 μL (amounts may vary depending on the sensitivity of the GC–MS and GC-FID if the sensitivity is low add 20 μL) of a 200 ng/μL chloroform solution of nonadecanoic acid (not found in pollen and other plant tissues) as standard to the vial with the pollen. In our study, we added 7 μL.
3. Add 0.1 mL of a mixture of chloroform and methanol (2:1) to the vial with pollen and standard.
4. Manually homogenize the pollen with a glass or ceramic mortar (until no more parts of the pollen are visible).
5. Add 0.4 mL of the mixture of chloroform and methanol (2:1) to the tube with the pollen and standard and continue homogenizing.
6. Transfer the sample extract to a new 4 mL glass vial. Wash the tube that contained the pollen with the chloroform-methanol solution (2:1) and transfer it to the glass vial until you reach a total of 3 mL (make sure to take all the extract from the homogenizer).
7. Close the vial using screw caps with polytetrafluoroethylene (PTFE) (to avoid direct contact of the sample with the plastic lid) and place it in a shaker at 250 rpm room temperature for 24 h (see Discussion and Supplementary material “Methods used to develop a common protocol and suggestions for its improvement” for comments regarding the homogenization and extraction steps).
1. Let the sample sit until all pollen particles have sedimented. Transfer the supernatant into a small glass vial (without pollen particles), and let it evaporate with the help of a gentle stream of nitrogen or CO2 until it can be transferred into a 300 μL insert of a glass vial. Let the rest of the supernatant evaporate to dryness. After this step, you can freeze the samples until their analysis in the GC.
2. For analysis in the GC, all FAs need to be converted to methyl esters by adding 10–30 μL (amounts may vary depending on the FAs amount and desired concentration) of a 0.2 M or 0.25 M trimethylsulfonium hydroxide (TMSH) solution to the vial. Vortex the sample for 1 s. If the sample is too concentrated, add up to additional 150 μL of dichloromethane to dilute the sample (the amount of dichloromethane depends on how concentrated the sample is). Vortex the sample again for 1 s. In our study, we added 10 μL of TMSH and 150 μL of dichloromethane (see Supplementary material “Methods used to develop a common protocol and suggestions for its improvement” for further details about this step).
3. Run in GC–MS and GC-FID (see programs above).
4. Identify FAMEs based on their mass spectra obtained with the GC–MS, retention times, and retention indices, and by comparing spectra to respective compounds in the FAME standard libraries for reliable identification.
5. Locate FAMEs in GC-FID output by comparing retention indices of the FAMEs in MS and FID (see “Suggested steps for improving pollen FA analysis pollen using GC–MS and GC-FID” and Supplementary material “Obtaining retention indices and retention times of the FAs” for details about this step) and integrate FAME’s GC-FID peaks to obtain areas for quantification.
6. The area of the internal standard would be equivalent to the original standard amount. Assuming all FA at the same concentration will have the peak area, the area of the internal standard can be used to calculate the amounts of other FAs. Total FA content can be obtained by summing up all FAs.
7. Do blank sample runs without pollen to see how much FA contamination you will accumulate during the process. If necessary, this needs to be subtracted from sample profiles.
See Supplementary material “Methods used to develop a common protocol and suggestions for its improvement” for more details on how this protocol could be further improved.
In this study, we have identified potential pitfalls in the extraction and quantification of FAs in plant pollen samples and have provided suggestions on how to avoid them. We also proposed a method to extract, quantify, and compare FAs from pollen that avoids these pitfalls and allows comparison of FA profiles between sample matrices that are as variable and diverse as plant pollen.
The GC detector’s saturation limit is a crucial consideration when quantifying FAs, as peak areas beyond this limit become unreliable. Thus, the saturation limit of each GC–MS and GC–FID must be determined before processing pollen samples, and dilutions and pollen amounts adjusted accordingly. Although GC–MS can identify different FAs, it is not reliable for quantification due to peak area variability for the same concentration of different FAs, except when standard curves are available to quantify each FA. In contrast, GC–FID has substantially smaller variation in peak areas for different FAs (using FID the peak with the largest peak had double the area of the smallest peak, but when using MS the largest peak had three times the area of the smallest peak).
The reproducability when using FID supports its reliability for FA quantification. Therefore, we recommend first processing the samples with MS as detector to identify the compounds and to calculate their retention index, and then processing the samples with FID as detector and identifying compounds using the indices. FA peaks obtained by FID can then be quantified by relating peak areas to an internal standard. Note, however, that, even with FID, the amount of some FAs will likely be under- or overestimated due to area variation. Additional internal standards or individual FA standard curves may be used to obtain a more precise quantification, or a mathematical correction could be applied. It is also important that the internal standard needs to be added to the sample immediately before the start of the extraction or when the pollen is covered with the solvent for the first time. Since the FAs are manipulated during the extraction process, adding the standard in a later stage of the protocol, would lead to the wrong quantification of FAs due to potential losses of the substances. In the proposed protocol, we used nonadecanoic acid as the internal standard as it is not found in plant tissues (Yu et al., 2016) and is commonly used in the literature (e.g., Glew et al., 1997; Brückner et al., 2017; Seddon et al., 2017).
Another potential pitfall that we have identified is the use of plastic materials during the extraction process. Our study revealed that many FAs are present in plastic, and thus, we strongly advise against using plastic in the extraction process. In cases where micropipette tips are utilized, they should be used only once and briefly to avoid the extraction of FAs. We also recommend running blank samples to determine the level of contamination from solvents and reaction agents during all extraction steps conducted with pure solvents.
However, our proposed protocol has several limitations that should be acknowledged. Firstly, it is time-consuming as it requires running samples in both GC–MS and GC-FID, and compounds need to be identified using two steps/programs. This necessitates expertise and experience in peak integration and identification. However, the use of retention indices and a standardized protocol for peak integration can be highly advantageous. Another limitation is that the proposed method may under- or overestimate the amount of FAs because we use only one internal standard, and we assume that all FAs exhibit the same peak area for the same concentration. We did not use more than one internal standard or calculate calibration curves for all FAMEs due to the high diversity and variation of fatty acids present in pollen (over 60), many of which cannot be commercially obtained. Moreover, natural variation between pollen samples, even of the same plant species, may be higher than the variation induced by using only one internal standard. Thus, we suggest that our approach would be most beneficial for comparative studies. Finally, we did not compare our proposed method with other existing protocols as we did not test other methods using the same pollen samples.
We would also like to emphasize the importance of proper pollen preparation and extraction. Recent studies by Wu et al. (2019) and Lau et al. (2022) have highlighted that FAs from inside the pollen may not be extracted if the homogenization is not done correctly or if the pollen grains are not sufficiently broken up, leading to erroneous results. However, over-homogenization might also destroy FAs (as shown for DNA by Swenson and Gemeinholzer, 2021). In our approach, we, therefore, used manual pollen grain homogenization and extraction for 24 h. We were able to extract a comparatively high diversity of FAs from pollen, i.e., up to 65 (Supplementary Table S5), while other studies have reported only seven (Lau et al., 2022) or ten (Markowicz Bastos et al., 2004) FAs. Future studies could develop an automated pollen homogenization protocol, which is faster than manual homogenization.
In addition to FAs, we also detected substances with carboxylic groups that do not meet the strict definition of FAs (e.g., dicarboxylic acids, FA ethyl esters, and hydroxy fatty acids). Little is known about their nutritional properties for pollinators, although dicarboxylic acids have been shown to be produced during FA oxidation (Verkade, 1938; Miura, 2013) and have been found in the urine of mammals fed with triglycerides (Verkade, 1938). Traces of dicarboxylic acids have been found in the content of Dufour’s gland in the genus Colletes and the royal jelly of honey bees (Çelik et al., 2022). FA ethyl esters have been reported in nectar and floral volatiles (i.e., in Dactylanthus taylorii and Passiflora mucronata, respectively) (Ecroyd et al., 1995; della Cuna et al., 2018). One of these esters (ethyl oleate) has been shown to act as an inhibitory factor and delay aging in honey bees (Leoncini et al., 2004). Hydroxy FAs have been detected in the honey bee queen mandibular pheromone (Wu et al., 2017), the oil of some seeds (e.g., Chen et al., 2011, 2017), and the royal jelly of honey bees (Weaver and Law, 1960). However, to the best of our knowledge, none of these substance classes have been studied for their nutritional role in pollinators and they have not been previously reported in pollen (e.g., Manning, 2001; Estevinho et al., 2012). Future studies are needed to investigate the potential (nutritional) role of these substances for insects.
FAs in pollen occur in the form of diglycerides, triglycerides, or as free FAs (Idiem’ Opute, 1978; Dobson, 1988; Conte et al., 2017; Li et al., 2017). The conversion of diglycerides and triglycerides into their individual FAMEs is required for GC analysis. Thus, the proposed method can identify all FAs in pollen, but not the original molecule state (e.g., free fatty acids, di- or triglycerides). Some protocols for separating the different FA types have been proposed in food and human science (e.g., Bareth et al., 2003; Firl et al., 2013) but to our knowledge no such method exists for pollen analysis using common GC columns and temperature programs [for example, Bareth et al., 2003 used an FID temperature of 360°C]. Separating different fractions would be informative, improving our understanding of the nutritional role of glycerides and free FAs. This would be useful in assessing pollen quality during foraging (Dobson, 1988; Ruedenauer et al., 2020a, 2021). We hope that future research will develop novel methods for pollen analysis that do not require methylation or come up with a protocol for glyceride fractionation. Finally, we emphasize the importance of interdisciplinary and interlaboratory collaborations to establish a common method of FA identification and quantification in pollen for comparative studies in ecology.
The datasets presented in this study can be found in online repositories. The names of the repository/repositories and accession number(s) can be found below: osf.io, 39MAH; doi.org/10.17605/OSF.IO/39MAH.
GV, ZK, R-CB, and FR performed the laboratory work. GV and FR performed the data analysis and wrote the first draft of the manuscript. R-CB, ZK, TS, and SL wrote sections of the manuscript. All authors contributed to the article and approved the submitted version.
Funding was provided by the Deutsche Forschungsgemeinschaft (DFG: LE2750/5-2) and through the 2018–2019 BiodivERsA joint call for research proposals under the BiodivERsA3 ERA-Net COFUND programme (DFG: LE 2750/8-1). GV received funding from the Mexican National Council for Science and Technology (CONACYT) and the German Academic Exchange Agency (DAAD) (Fellowship reference: 600737/438665) and the SCIENTIA fellowship from the University of Würzburg.
GV is thankful to the CONACYT, DAAD and the SCIENTIA Program of the University of Würzburg for their provided fellowship. We would like to thank Doris Waffler and Stefanie Siebler for their support in the lab. We would also like to thank the reviewers, whose comments and suggestions helped us to improve the manuscript.
The authors declare that the research was conducted in the absence of any commercial or financial relationships that could be construed as a potential conflict of interest.
All claims expressed in this article are solely those of the authors and do not necessarily represent those of their affiliated organizations, or those of the publisher, the editors and the reviewers. Any product that may be evaluated in this article, or claim that may be made by its manufacturer, is not guaranteed or endorsed by the publisher.
The Supplementary material for this article can be found online at: https://www.frontiersin.org/articles/10.3389/fevo.2023.1141832/full#supplementary-material
Arien, Y., Dag, A., Yona, S., Tietel, Z., Lapidot Cohen, T., and Shafir, S. (2020). Effect of diet lipids and omega-6:3 ratio on honey bee brood development, adult survival and body composition. J. Insect Physiol. 124:104074. doi: 10.1016/j.jinsphys.2020.104074
Bareth, A., Strohmar, W., and Kitzelmann, E. (2003). Gas chromatographic determination of mono- and diglycerides in milk and milk products. Eur. Food Res. Technol. 216, 365–368. doi: 10.1007/s00217-002-0650-7
Beevers, H. (1980). “4 – the role of the glyoxylate cycle” in Lipids: structure and function. ed. P. K. Stumpf (London: Academic Press), 117–130.
Bligh, E. G., and Dyer, W. J. (1959). A rapid method of total lipid extraction and purification. Can. J. Biochem. Physiol. 37, 911–917. doi: 10.1139/o59-099
Brückner, A., Hilpert, A., and Heethoff, M. (2017). Biomarker function and nutritional stoichiometry of neutral lipid fatty acids and amino acids in oribatid mites. Soil Biol. Biochem. 115, 35–43. doi: 10.1016/j.soilbio.2017.07.020
Çelik, S., Gerçek, Y. C., Özkök, A., and Ecem Bayram, N. (2022). Organic acids and their derivatives: minor components of bee pollen, bee bread, royal jelly and bee venom. Eur. Food Res. Technol. 248, 3037–3057. doi: 10.1007/s00217-022-04110-y
Chen, G. Q., Lin, J.-T., and Lu, C. (2011). Hydroxy fatty acid synthesis and lipid gene expression during seed development in Lesquerella fendleri. Ind. Crop. Prod. 34, 1286–1292. doi: 10.1016/j.indcrop.2010.08.003
Chen, G. Q., Riiff, T. J., Johnson, K., Morales, E., Kim, H. U., Lee, K.-R., et al. (2017). Seed development and hydroxy fatty acid biosynthesis in Physaria lindheimeri. Ind. Crop. Prod. 108, 410–415. doi: 10.1016/j.indcrop.2017.06.065
Cheng, Y.-S., Zheng, Y., and VanderGheynst, J. S. (2011). Rapid quantitative analysis of lipids using a colorimetric method in a microplate format. Lipids 46, 95–103. doi: 10.1007/s11745-010-3494-0
Chiu, H.-H., and Kuo, C.-H. (2020). Gas chromatography-mass spectrometry-based analytical strategies for fatty acid analysis in biological samples. J. Food Drug Anal. 28, 60–73. doi: 10.1016/j.jfda.2019.10.003
Conte, G., Benelli, G., Serra, A., Signorini, F., Bientinesi, M., Nicolella, C., et al. (2017). Lipid characterization of chestnut and willow honeybee-collected pollen: impact of freeze-drying and microwave-assisted drying. J. Food Compos. Anal. 55, 12–19. doi: 10.1016/j.jfca.2016.11.001
della Cuna, F. S. R., Calevo, J., Giovannini, A., Boselli, C., and Tava, A. (2018). Characterization of the essential oil of the bat-pollinated Passiflora mucronata. Nat. Prod. Commun. 13, 1727–1730. doi: 10.1177/1934578X1801301236
Dobson, H. E. M. (1988). Survey of pollen and Pollenkitt lipids–chemical cues to flower visitors? Am. J. Bot. 75, 170–182. doi: 10.1002/j.1537-2197.1988.tb13429.x
Eckhardt, M., Haider, M., Dorn, S., and Müller, A. (2014). Pollen mixing in pollen generalist solitary bees: a possible strategy to complement or mitigate unfavourable pollen properties? J. Anim. Ecol. 83, 588–597. doi: 10.1111/1365-2656.12168
Ecroyd, C. E., Franich, R. A., Kroese, H. W., and Steward, D. (1995). Volatile constituents of Dactylanthus taylorii flower nectar in relation to flower pollination and browsing by animals. Phytochemistry 40, 1387–1389. doi: 10.1016/0031-9422(95)00403-T
Estevinho, L. M., Rodrigues, S., Pereira, A. P., and Feás, X. (2012). Portuguese bee pollen: palynological study, nutritional and microbiological evaluation. Int. J. Food Sci. Technol. 47, 429–435. doi: 10.1111/j.1365-2621.2011.02859.x
Firl, N., Kienberger, H., Hauser, T., and Rychlik, M. (2013). Determination of the fatty acid profile of neutral lipids, free fatty acids and phospholipids in human plasma. Clin. Chem. Lab. Med. 51, 799–810. doi: 10.1515/cclm-2012-0203
Folch, J., Lees, M., and Stanley, G. H. S. (1957). A simple method for the isolation and purification of total lipids from animal tissues. J. Biol. Chem. 226, 497–509. doi: 10.1016/S0021-9258(18)64849-5
Gercek, Y. C., Celik, S., and Bayram, S. (2022). Screening of plant pollen sources, polyphenolic compounds, fatty acids and antioxidant/antimicrobial activity from bee pollen. Molecules 27:117. doi: 10.3390/molecules27010117
Glew, R. H., Vanderjagt, D. J., Lockett, C., Grivetti, L. E., Smith, G. C., Pastuszyn, A., et al. (1997). Amino acid, fatty acid, and mineral composition of 24 indigenous plants of Burkina Faso. J. Food Compos. Anal. 10, 205–217. doi: 10.1006/jfca.1997.0539
Idiem’ Opute, F. D. (1978). Mesocarp, seed and pollen lipids of Raphia palms. J. Sci. Food Agric. 29, 115–120. doi: 10.1002/jsfa.2740290207
Knight, J. A., Anderson, S., and Rawle, J. M. (1972). Chemical basis of the Sulfo-phospho-vanillin reaction for estimating total serum lipids. Clin. Chem. 18, 199–202. doi: 10.1093/clinchem/18.3.199
Kostić, A. Ž., Mačukanović-Jocić, M. P., Špirović Trifunović, B. D., Vukašinović, I. Ž., Pavlović, V. B., and Pešić, M. B. (2017). Fatty acids of maize pollen – quantification, nutritional and morphological evaluation. J. Cereal Sci. 77, 180–185. doi: 10.1016/j.jcs.2017.08.004
Kraus, S., Monchanin, C., Gomez-Moracho, T., and Lihoreau, M. (2019). “Insect diet” in Encyclopedia of animal cognition and behavior. eds. J. Vonk and T. Shackelford (Cham: Springer International Publishing), 1–9.
Lau, P., Lesne, P., Grebenok, R. J., Rangel, J., and Behmer, S. T. (2022). Assessing pollen nutrient content: a unifying approach for the study of bee nutritional ecology. Philos. Trans. R. Soc. Lond. B Biol. Sci. 377:20210510. doi: 10.1098/rstb.2021.0510
Lenth, R. (2018). Emmeans: estimated marginal means, aka least-squares means. R package version 1.2.3. Available at: https://CRAN.R-proje ct.org/package=emmeans
Leoncini, I., le Conte, Y., Costagliola, G., Plettner, E., Toth, A. L., Wang, M., et al. (2004). Regulation of behavioral maturation by a primer pheromone produced by adult worker honey bees. Proc. Natl. Acad. Sci. U. S. A. 101, 17559–17564. doi: 10.1073/pnas.0407652101
Li, Q., Liang, X., Zhao, L., Zhang, Z., Xue, X., Wang, K., et al. (2017). UPLC-Q-Exactive Orbitrap/MS-based Lipidomics approach to characterize lipid extracts from bee pollen and their in vitro anti-inflammatory properties. J. Agric. Food Chem. 65, 6848–6860. doi: 10.1021/acs.jafc.7b02285
Loper, G. M., Standifer, L. N., Thompson, M. J., and Gilliam, M. (1980). Biochemistry and microbiology of bee-collected almond (Prunus dulcis) pollen and bee bread. I- fatty acids, sterols, vitamins and minerals. Apidologie 11, 63–73. doi: 10.1051/apido:19800108
Manning, R. (2001). Fatty acids in pollen: a review of their importance for honey bees. Bee World 82, 60–75. doi: 10.1080/0005772X.2001.11099504
Markowicz Bastos, D. H., Monika Barth, O., Isabel Rocha, C., da Silva Cunha, I. B., de Oliveira Carvalho, P., Torres, E. A. S., et al. (2004). Fatty acid composition and palynological analysis of bee (Apis) pollen loads in the states of São Paulo and Minas Gerais, Brazil. J. Apic. Res. 43, 35–39. doi: 10.1080/00218839.2004.11101107
Miura, Y. (2013). The biological significance of ω-oxidation of fatty acids. Proc. Jpn. Acad. Ser. B Phys. Biol. Sci. 89, 370–382. doi: 10.2183/pjab.89.370
Nicholls, E., and Hempel de Ibarra, N. (2017). Assessment of pollen rewards by foraging bees. Funct. Ecol. 31, 76–87. doi: 10.1111/1365-2435.12778
Pacini, E., and Hesse, M. (2005). Pollenkitt – its composition, forms and functions. Flora: Morphol. Distrib. Funct. Ecol. 200, 399–415. doi: 10.1016/j.flora.2005.02.006
Palmer-Young, E. C., Farrell, I. W., Adler, L. S., Milano, N. J., Egan, P. A., Irwin, R. E., et al. (2019a). Secondary metabolites from nectar and pollen: a resource for ecological and evolutionary studies. Ecology 100:e02621. doi: 10.1002/ecy.2621
Palmer-Young, E. C., Farrell, I. W., Adler, L. S., Milano, N. J., Egan, P. A., Junker, R. R., et al. (2019b). Chemistry of floral rewards: intra- and interspecific variability of nectar and pollen secondary metabolites across taxa. Ecol. Monogr. 89:e01335. doi: 10.1002/ecm.1335
Peters, B., Keller, A., and Leonhardt, S. D. (2022). Diets maintained in a changing world: does land-use intensification alter wild bee communities by selecting for flexible generalists? Ecol. Evol. 12:e8919. doi: 10.1002/ece3.8919
Peterson, D. M., Jensen, C. M., Hoffman, D. L., and Mannerstedt-Fogelfors, B. (2007). Oat Tocols: saponification vs. direct extraction and analysis in high-oil genotypes. Cereal Chem. 84, 56–60. doi: 10.1094/CCHEM-84-1-0056
Řezanka, T., Pádrová, K., and Sigler, K. (2016). “Derivatization in gas chromatography of lipids” in Encyclopedia of lipidomics. ed. M. R. Wenk (Dordrecht: Springer), 1–9.
Roger, N., Michez, D., Wattiez, R., Sheridan, C., and Vanderplanck, M. (2017). Diet effects on bumblebee health. J. Insect Physiol. 96, 128–133. doi: 10.1016/j.jinsphys.2016.11.002
Roulston, T. H., and Cane, J. H. (2000). “Pollen nutritional content and digestibility for animals” in Pollen and pollination. eds. A. Dafni, M. Hesse, and E. Pacini (Vienna: Springer), 187–209.
Ruedenauer, F. A., Biewer, N. W., Nebauer, C. A., Scheiner, M., Spaethe, J., and Leonhardt, S. D. (2021). Honey bees can taste amino and fatty acids in pollen, but not sterols. Front. Ecol. Evol. 9:684175. doi: 10.3389/fevo.2021.684175
Ruedenauer, F. A., Raubenheimer, D., Kessner-Beierlein, D., Grund-Mueller, N., Noack, L., Spaethe, J., et al. (2020a). Best be(e) on low fat: linking nutrient perception, regulation and fitness. Ecol. Lett. 23, 545–554. doi: 10.1111/ele.13454
Ruedenauer, F. A., Spaethe, J., van der Kooi, C. J., and Leonhardt, S. D. (2019). Pollinator or pedigree: which factors determine the evolution of pollen nutrients? Oecologia 191, 349–358. doi: 10.1007/s00442-019-04494-x
Ruedenauer, F. A., Sydow, D., Spaethe, J., and Leonhardt, S. D. (2020b). Young bumblebees may rely on both direct pollen cues and early experience when foraging. Proc. R. Soc. B Biol. Sci. 287:20201615. doi: 10.1098/rspb.2020.1615
Seddon, A. W. R., Jokerud, M., Barth, T., Birks, H. J. B., Krüger, L. C., Vandvik, V., et al. (2017). Improved quantification of UV-B absorbing compounds in Pinus sylvestris L. pollen grains using an internal standard methodology. Rev. Palaeobot. Palynol. 247, 97–104. doi: 10.1016/j.revpalbo.2017.08.007
Stevenson, P. C. (2020). For antagonists and mutualists: the paradox of insect toxic secondary metabolites in nectar and pollen. Phytochem. Rev. 19, 603–614. doi: 10.1007/s11101-019-09642-y
Swenson, S. J., and Gemeinholzer, B. (2021). Testing the effect of pollen exine rupture on metabarcoding with Illumina sequencing. PLoS One 16:e0245611. doi: 10.1371/journal.pone.0245611
Thakur, M., and Nanda, V. (2020). Composition and functionality of bee pollen: a review. Trends Food Sci. Technol. 98, 82–106. doi: 10.1016/j.tifs.2020.02.001
Togasawa, Y., Katsumata, T., Fukada, M., and Motoi, T. (1967). Biochemical studies on pollen: part VII. Vitamins of pollen. Nippon Nogeik Kaishi 41, 184–188. doi: 10.1271/nogeikagaku1924.41.5_184
Ulusoy, E., and Kolayli, S. (2014). Phenolic composition and antioxidant properties of Anzer bee pollen. J. Food Biochem. 38, 73–82. doi: 10.1111/jfbc.12027
Vanderplanck, M., Michez, D., Vancraenenbroeck, S., and Lognay, G. (2011). Micro-quantitative method for analysis of sterol levels in honeybees and their pollen loads. Anal. Lett. 44, 1807–1820. doi: 10.1080/00032719.2010.526271
Vanderplanck, M., Moerman, R., Rasmont, P., Lognay, G., Wathelet, B., Wattiez, R., et al. (2014). How does pollen chemistry impact development and feeding behaviour of polylectic bees? PLoS One 9:e86209. doi: 10.1371/journal.pone.0086209
Vaudo, A. D., Patch, H. M., Mortensen, D. A., Tooker, J. F., and Grozinger, C. M. (2016a). Macronutrient ratios in pollen shape bumble bee (Bombus impatiens) foraging strategies and floral preferences. Proc. Natl. Acad. Sci. U. S. A. 113, E4035–E4042. doi: 10.1073/pnas.1606101113
Vaudo, A. D., Stabler, D., Patch, H. M., Tooker, J. F., Grozinger, C. M., and Wright, G. A. (2016b). Bumble bees regulate their intake of essential protein and lipid pollen macronutrients. J. Exp. Biol. 219, 3962–3970. doi: 10.1242/jeb.140772
Vaudo, A. D., Tooker, J. F., Patch, H. M., Biddinger, D. J., Coccia, M., Crone, M. K., et al. (2020). Pollen protein: lipid macronutrient ratios may guide broad patterns of bee species floral preferences. Insects 11:132. doi: 10.3390/insects11020132
Verkade, P. E. (1938). The role of dicarboxylic acids in metabolism. J. Soc. Chem. Ind. 57, 704–711. doi: 10.1002/jctb.5000573005
Waser, N. M., and Ollerton, J. eds. (2006). Plant-pollinator interactions: from specialization to generalization. Chicago, IL: University of Chicago Press.
Weaver, N., and Law, J. H. (1960). Heterogeneity of fatty Acids from Royal Jelly. Nature 188, 938–939. doi: 10.1038/188938b0
Wu, W., Wang, K., Qiao, J., Dong, J., Li, Z., and Zhang, H. (2019). Improving nutrient release of wall-disrupted bee pollen with a combination of ultrasonication and high shear technique. J. Sci. Food Agric. 99, 564–575. doi: 10.1002/jsfa.9216
Wu, Y., Zheng, H., Corona, M., Pirk, C., Meng, F., Zheng, Y., et al. (2017). Comparative transcriptome analysis on the synthesis pathway of honey bee (Apis mellifera) mandibular gland secretions. Sci. Rep. 7:4530. doi: 10.1038/s41598-017-04879-z
Keywords: pollination, fatty acids, lipids, extraction, quantification, diet, chemical ecology, nutrients
Citation: Villagómez GN, Brachvogel R-C, Kárpáti Z, Leonhardt SD, Schmitt T and Ruedenauer FA (2023) A common protocol for reliable comparison of pollen fatty acid profiles: highlighting pitfalls and proposing a methodology for ecological research. Front. Ecol. Evol. 11:1141832. doi: 10.3389/fevo.2023.1141832
Edited by:
Ping Wen, Chinese Academy of Sciences (CAS), ChinaReviewed by:
Michael Lattorff, University of Nairobi, KenyaCopyright © 2023 Villagómez, Brachvogel, Kárpáti, Leonhardt, Schmitt and Ruedenauer. This is an open-access article distributed under the terms of the Creative Commons Attribution License (CC BY). The use, distribution or reproduction in other forums is permitted, provided the original author(s) and the copyright owner(s) are credited and that the original publication in this journal is cited, in accordance with accepted academic practice. No use, distribution or reproduction is permitted which does not comply with these terms.
*Correspondence: Fabian A. Ruedenauer, ZmFiaWFuLnJ1ZWRlbmF1ZXJAdHVtLmRl
Disclaimer: All claims expressed in this article are solely those of the authors and do not necessarily represent those of their affiliated organizations, or those of the publisher, the editors and the reviewers. Any product that may be evaluated in this article or claim that may be made by its manufacturer is not guaranteed or endorsed by the publisher.
Research integrity at Frontiers
Learn more about the work of our research integrity team to safeguard the quality of each article we publish.