
94% of researchers rate our articles as excellent or good
Learn more about the work of our research integrity team to safeguard the quality of each article we publish.
Find out more
ORIGINAL RESEARCH article
Front. Ecol. Evol., 01 August 2023
Sec. Population, Community, and Ecosystem Dynamics
Volume 11 - 2023 | https://doi.org/10.3389/fevo.2023.1139441
This article is part of the Research TopicNew Frontiers in the Application of Stable Isotopes to Ecological and Ecophysiological ResearchView all 16 articles
 Mathew A. Vanderklift1*
 Richard D. Pillans2
 Wayne Rochester2
 Jessica L. Stubbs3
 Grzegorz Skrzypek3
 Anton D. Tucker4Scott D. Whiting4
Ontogenetic changes in habitat and diet are widespread among marine species. Most species of sea turtles are characterized by extreme ontogenetic changes in habitat use and diet, with large changes occurring in early developmental stages (e.g., neonates to juveniles). Changes can continue even after recruitment to shallow coastal habitats. In places where substantial transitions in habitat occur across short distances, it is possible that the distances of developmental movements from one habitat to another could be short. We investigated ontogenetic changes in home range size, home range location and diet of Chelonia mydas in a tropical coastal lagoon in north-western Australia by combining acoustic telemetry with stable isotope analysis. There was a substantial (but nonlinear) increase in home-range size (kernel utilization distribution: KUD) with length, and an increase in the average distance of the center of home ranges from shore with length: larger turtles tended to occupy larger areas further from the shore. These patterns were accompanied by complex nonlinear changes in δ13C, δ15N and δ34S of red blood cells and nails; changes were rapid from 36 cm (the length of the smallest individual captured) to 50 cm, before reversing more gradually with increasing size. δ15N and δ34S (but not δ13C) of red blood cells and nails increased monotonically with KUD and distance from shore. Seagrass was likely an important food for all sizes, macroalgae was potentially important for small (< 60 cm CCL) individuals, and the proportion of scyphozoan jellyfish in diet increased monotonically with size. The combination of acoustic telemetry and stable isotope analysis revealed ontogenetic shifts in use of space and diet across short distances in a tropical coastal lagoon.
Ontogenetic changes in habitat use and diet are widespread among marine species (Snover, 2008). They frequently include changes in habitat type and location, combined with changes in diet. Such changes can be understood in the context of optimizing a trade-off between growth and mortality (Werner and Gilliam, 1984). Effective management (whether for conservation, harvest, or other purposes) of species that change habitat type and location as they grow needs to account for ontogenetic changes in the types and magnitudes of the threats that they face. For example, body size can be an important predictor of the risk of predation (although evidence for this is equivocal: Preisser and Orrock, 2012), and so management might need to accommodate ontogenetic changes in probability of natural and human-induced mortality.
Most species of sea turtles are characterized by extreme ontogenetic changes in habitat and diet (Bolten, 2003). Young individuals of most species occupy oceanic areas far from mainland coasts, moving to shallower coastal habitats as they attain a certain size. The green sea turtle Chelonia mydas adheres to this pattern: after hatching, neonates swim immediately offshore and spend years in oceanic habitats, travelling up to thousands of kilometers (Hays and Scott, 2013) before moving to shallow coastal habitats. The size at which this occurs varies among populations (Musick and Limpus, 1996). After they recruit to shallow coastal habitats, juvenile C. mydas in some places remain resident until maturity. In other places, there are further movements to different habitats as they mature (Musick and Limpus, 1996). The distances of these movements away from developmental habitat can be large, up to hundreds of kilometers (e.g., Chambault et al., 2018; Doherty et al., 2020). However, in places where substantial transitions in habitat occur across short distances, it is possible that distances of developmental shifts to different habitats could also be short.
Coincident with ontogenetic habitat shifts, C. mydas also changes its diet. The diet of juveniles inhabiting oceanic habitats is probably primarily carnivorous (e.g., Reich et al., 2007; Turner Tomaszewicz et al., 2018). Once they have recruited to shallow coastal habitats, they are primarily herbivorous, although there is ample evidence that many individuals are omnivorous (indeed, this might be the norm: Seminoff et al., 2021). Most studies indicate that the switch to herbivory is maintained as they mature into adults, but Arthur et al. (2008) found that δ15N (an indicator of trophic level) of sexually-mature individuals was slightly higher than that of immature individuals.
Diet is fundamental to energetics, which in turn determines growth and reproduction, so changes to diets of individuals could manifest as population-level demographic changes through altering egg production (Stubbs et al., 2020). One of the most widely used tools to understand diet of sea turtles is stable isotope analysis. Investigations of patterns in stable isotope composition with size have yielded trends that suggest changes in diet extend for decades after juveniles recruit to shallow coastal habitats (e.g., Arthur et al., 2008; Burgett et al., 2018; Roche et al., 2021). However, conclusions about changing diets inferred from stable isotopes can be complicated by expectations that stable isotope discrimination between prey and consumer scales with body size (Martínez del Rio et al., 2009; Pecquerie et al., 2010). Evidence for this from controlled diet studies of sea turtles is equivocal (Reich et al., 2008; Vander Zanden et al., 2012).
We investigated ontogenetic changes in the diet of C. mydas in a tropical coastal lagoon in north-western Australia. C. mydas at this location are long-term residents that show size-related changes in home range size, home range location, and diet (Pillans et al., 2022; Stubbs et al., 2022). Size is a good predictor of age (Mayne et al., 2022), and here we use size as a proxy for age to further explore ontogenetic patterns in the home range location and diet of C. mydas.
The study was conducted in and around Mangrove Bay, in the Ningaloo Marine Park, north-western Australia (21.9 °S, 113.9 °E). Mangrove Bay is a small, shallow (<1.5 m at Highest Astronomical Tide) embayment located shoreward of a lagoon which is bordered on the seaward side by a fringing coral reef. The lagoon is approximately 2–3 km wide, and the reef flat is approximately 250–500 m wide (Cassata and Collins, 2008). The seabed in the lagoon is predominantly sand veneer over rock, interspersed with low-relief rocky surfaces and coral bommies. Seaward of the reef flat, coral extends to ~35 m; beyond this depth, the seabed is predominantly low-relief rock (Turner et al., 2018). Seagrass (Halophila ovalis and Halodule uninervis) occurs within Mangrove Bay, and Halophila ovalis occurs on sandy areas in the lagoon. Multiple species of large brown and red macroalgae occur on rocky surfaces throughout Mangrove Bay and the lagoon (Vanderklift et al., 2020a). Episodically, gelatinous zooplankton, especially scyphozoan jellyfish, are abundant (often in April–May: Keesing et al., 2016).
Several times each year, from 2013 to 2019, green turtles Chelonia mydas were sought in multiple habitats by observers in a boat, and once located were captured by hand and transferred into the boat. Turtles were then transferred to a beach, where they were measured (curved carapace length: CCL, to the nearest millimeter), and titanium tags (Stockbrands Co Pty Ltd, Australia) were attached to the left and right fore flippers. Individuals ranged from 36.5 to 105.6 cm, and included mature males and females, and immature individuals; the sex of individuals over 80 cm CCL were determined from external morphological characteristics.
Large females (>90 cm CCL) captured from October to February were excluded from analyses because of the possibility that they were present for nesting and therefore would not reflect patterns of resident individuals (M. Vanderklift & R. Pillans, unpublished data). If an individual was captured more than once, only data from the first occasion was included.
Nail clippings were taken from the distal edge of a fore flipper using surgical scissors (Vanderklift et al., 2020b). A 2-mL blood sample was taken by inserting a 22G × 1.5-inch needle attached to a 5-mL syringe into the dorsal surface of the neck and gently creating suction (following Owens and Ruiz, 1980); the sample was spun in a portable centrifuge (Digital Zip-Spin; LW Scientific, Lawrenceville, GA, USA) at 6000 rpm for 2 min, and the red blood cell portion was extracted using a disposable pipette. All samples were kept on ice in microcentrifuge tubes, frozen at −20 °C later in the day, and then transported to CSIRO laboratories in Perth (Australia), where they were stored. All procedures were conducted according to permits issued by the CSIRO Wildlife and Large Animal Ethics Committee.
Seagrass and macroalgae were collected by hand from multiple places throughout the study area on nine occasions encompassing six years, stored on ice and then frozen at −20 °C later in the day, before being transported to CSIRO laboratories in Perth (Australia), where they were stored. Red jellyfish Crambione mastigophora were collected by hand, the mesoglea were then removed, rubbed in seawater, and frozen at −20 °C.
In a laboratory, samples were thawed at room temperature. Microcentrifuge tubes with red blood cells were placed directly in an air-circulating oven. Nail clippings were prepared according to Vanderklift et al. (2020b). Seagrass and macroalgae were cleaned with distilled water, and epiphytic organisms and detritus were scraped or picked off if necessary, and then placed into microcentrifuge tubes in an air-circulating oven. Jellyfish mesoglea were placed into aluminum foil trays in an air-circulating oven. All samples were dried in an air-circulating oven at 60 °C for at least 48 h (jellyfish mesoglea took longer, up to 72 h).
After drying, all samples were ground into a fine powder, either manually using a mortar and pestle, or using a mixer mill (MM200; Retsch, Dusseldorf, Germany), and 0.7–0.8 mg were placed into tin capsules. Elemental compositions (%C, %N, %S by weight) and stable isotope compositions (δ13C, δ15N and δ34S) were measured at the West Australian Biogeochemistry Centre, The University of Western Australia (Perth, Australia).
The stable carbon and nitrogen isotope compositions were analyzed using a continuous-flow system consisting of an elemental analyser (EA Thermo Flash 1112) connected via a Conflo IV to a Delta V Plus mass spectrometer (Thermo-Finnigan, Germany). In the elemental analyser samples were combusted with oxygen added to the helium stream (grade 99.999% purity; BOC, Australia, 100 mL/min) at a temperature of 1000°C in a reactor comprised of chromium oxide and silvered oxides of cobalt (Thermo, Germany) and then NOx gases were reduced at 650°C with electrolytic copper to produce N2. N2 and CO2 were separated with a gas chromatography column and transferred into the isotope ratio mass spectrometer. Raw δ for CO2 and N2 were obtained relative to working gases in high-pressure cylinders (BOC, Australia) using Isodat 2.5 software (Thermo Scientific, Bremen, Germany). For CO2 “SSH” 17O correction was applied.
The stable sulfur isotope composition was analyzed using an Elemental Analyser and a 20-22 Sercon isotope ratio mass spectrometer (Sercon, UK). Samples were mixed with V2O5 and packed into tin capsules (Sercon, UK). Samples were converted to SO2 in the reaction column filled with tungsten oxides on zirconium and copper (Sercon, UK) at 1020°C (Studley et al., 2002). The produced gases, after passing through the Nafion water trap, were separated using a gas chromatography column and introduced to an ion source as SO2 gas in the stream of helium (grade 99.999% purity; BOC, Australia, 100 mL/min) and masses 48/49/50 of fragmented ions were measured.
Data were generated in standard δ-notation normalized to Vienna Pee Dee Belemnite (for δ13C), atmospheric N2 (for δ15N) or Vienna Canyon Diablo Troilite (for δ34S) after multi-point normalization to the stable isotope international reference scale. International standards provided by the International Atomic Energy Agency (IAEA, Vienna, Austria) and United States Geological Survey (USGS, Reston, VA, USA) (δ13C: NBS22, USGS24, NBS19, LSVEC; δ15N: N1, N2, USGS32; δ34S: IAEA-S1, IAEA-S2, IAEA-S3, NBS127) and internal laboratory standards (glutamic acid) were used (Skrzypek et al., 2010; Skrzypek, 2013). The uncertainty associated with the repeated measurements of the internal standards (±1 standard deviation) was not more than 0.10 ‰ for δ13C and δ15N and <0.40 ‰ for δ34S.
Acoustic receivers were deployed in an area encompassing ~28 km2 from <1 m water depth near the shoreline to >50 m water depth beyond the reef slope, forming an array of 77 acoustic receivers spaced 200–800 m apart (Supplementary Figure 1). Detection ranges typically did not overlap (for a detailed description, see Pillans et al., 2014; Pillans et al., 2022).
Post marginal scutes of C. mydas were cleaned using a cloth soaked in a disinfectant mixture of 10 mL Hexacon, 90 mL distilled H2O and 900 mL ethanol, and then either one or two 3-mm diameter holes were drilled through the carapace. Acoustic tags were secured by 3 mm stainless steel bolts soaked in the same disinfectant mixture. A 20-mm diameter rubber washer and a similar sized stainless-steel washer were placed over the bolts on the dorsal surface and secured with a nylon insert self-locking nut. The protruding ends of the bolts were cut off and a two-part epoxy resin (Sika AnchorFix®-3+, Sika Australia Pty Ltd) was placed over the bolts to smooth their profile. All acoustic tags were painted with antifouling paint before being attached. Depending on size, individuals were tagged with either a V13-1L, V16-4H or V16-6H Vemco coded transmitter (tag). These transmitters range in length between 36–98 mm and weigh between 11–37 g in air. The pulse rate of transmitters varied from 30–180 s and battery life varied from 1,090–3,650 d depending on the frequency of each ping and the power output of the tag. Receivers were downloaded every 12 months throughout the study, and the batteries were changed at the same time.
Home range measures were calculated for each individual that was detected for more than 30 days and on two or more receivers to ensure we excluded data from tags that might have detached immediately after release. The measures were calculated separately for day and night using the maptools package (Bivand and Lewin-Koh, 2013) in the R statistical software environment. A simple measure of roaming extent was provided by the total number of receivers at which a turtle was detected. Other measures were calculated from kernel utilization distributions (KUD), which were calculated using the adehabitatHR package (Calenge, 2006) in R. The methods for applying the package to the acoustic array were as described in Pillans et al. (2021): the smoothing parameter was set to 200 m, detections were binned into 20-min intervals, and the output grid resolution was 50 m KUD (95%, in km2). The average distance from shore of each turtle was calculated as the weighted average distance from shore of the KUD grid cells, where the weights were the kernel densities. The shoreline was defined by the mainland high water mark of the polygonised coast of Western Australia.
We had no a priori expectation of the shape of the relationship between the response and explanatory variables; indeed, there was some evidence that patterns might be complex and nonlinear. Consequently, we preferred a statistical framework that did not assume particular relationships, and so we used generalized additive models (Wood, 2011). We used the mgcv package in the R statistical software environment (Wood, 2017) to fit and test models, using restricted maximum likelihood to select the smoothing parameter, and a Gaussian probability distribution. We tested for patterns in metrics of roaming and location with turtle size (as CCL), patterns in stable isotope composition with CCL, and patterns in roaming and location with stable isotope composition. We compared models with and without a term for sex using Akaike’s information Criterion (AIC); in each case sex did not improve model and so it was not included in final analyses.
For stable isotope mixing models, primary producers (i.e., seagrasses, macroalgae) were first grouped using k-means clustering (Borcard et al., 2011) using the vegan package in the R statistical software environment (Oksanen et al., 2022). All species of primary producers (Supplementary Table 1) were included. Two clusters were clearly defined, one containing only seagrasses, the other containing only macroalgae. Further subdivisions created classes in which samples from the same macroalgae taxa were split, and so did not create useful additional information. For subsequent mixing models seagrasses and macroalgae were considered separate diet categories. The red jellyfish Crambione mastigophora was included as a third category. Although benthic invertebrates are consumed by C. mydas in some places, we found no evidence of this in our study area. Mangrove leaves are also eaten by green turtles in some places but analysis of >80,000 accurate locations (Fastloc GPS) from n=35 satellite-tagged C. mydas in Mangrove Bay (74.6–108.6 cm CCL), showed no foraging among mangroves, so we did not include them (M. Vanderklift & R. Pillans, unpublished data). The source dataset, therefore, included seagrass (n=30), macroalgae (n=82) and jellyfish (n=13): we used the means and standard deviations for each of δ13C, δ15N and δ34S.
The potential contributions of seagrass, macroalgae and jellyfish to the diet of C. mydas were analysed using the Bayesian tracer mixing model MixSIAR (Stock and Semmens, 2016; Stock et al., 2018). We included CCL as a covariate to explore how diet changes with the size of n=89 individuals for which δ13C, δ15N and δ34S of red blood cells were measured. We included residual and process error (following Stock et al., 2018 this model formulation is appropriate for applications in which a consumer effectively samples a prey source multiple times), and uninformative priors. For trophic discrimination factors (TDF) of δ13C and δ15N, we used data for captive feeding experiments by Vander Zanden (2012): 0.3 ± 0.5 ‰ for δ13C and 2.4 ± 0.5 ‰ for δ15N. We are not aware of any studies of TDF for δ34S in comparable taxa, but the scant evidence available for other taxa (Florin et al., 2011) suggests that TDF for δ34S might be negatively correlated with δ34S of diet; noting this pattern we used a TDF of 1.5 ± 1.5 ‰, with the comparatively higher standard deviation reflecting the uncertainty in choice of TDF. We selected the “normal” MCMC parameters of chainLength=100,000, burn=50,000, thin=50, chains=3.
More receivers received transmissions during the day than at night for 72 of the 74 acoustically-tagged individual Chelonia mydas; there was no difference for the other two individuals (Figure 1A). No individuals were detected on more receivers at night than during the day. The absolute difference tended to be higher and more variable with length (Figure 1B), a reflection that larger individuals roam more widely (Pillans et al., 2022). Since turtles are more likely to move around when they are feeding, this result suggests that individuals were likely feeding during the day and so subsequent analyses focused on metrics of movement calculated from daytime detections only.
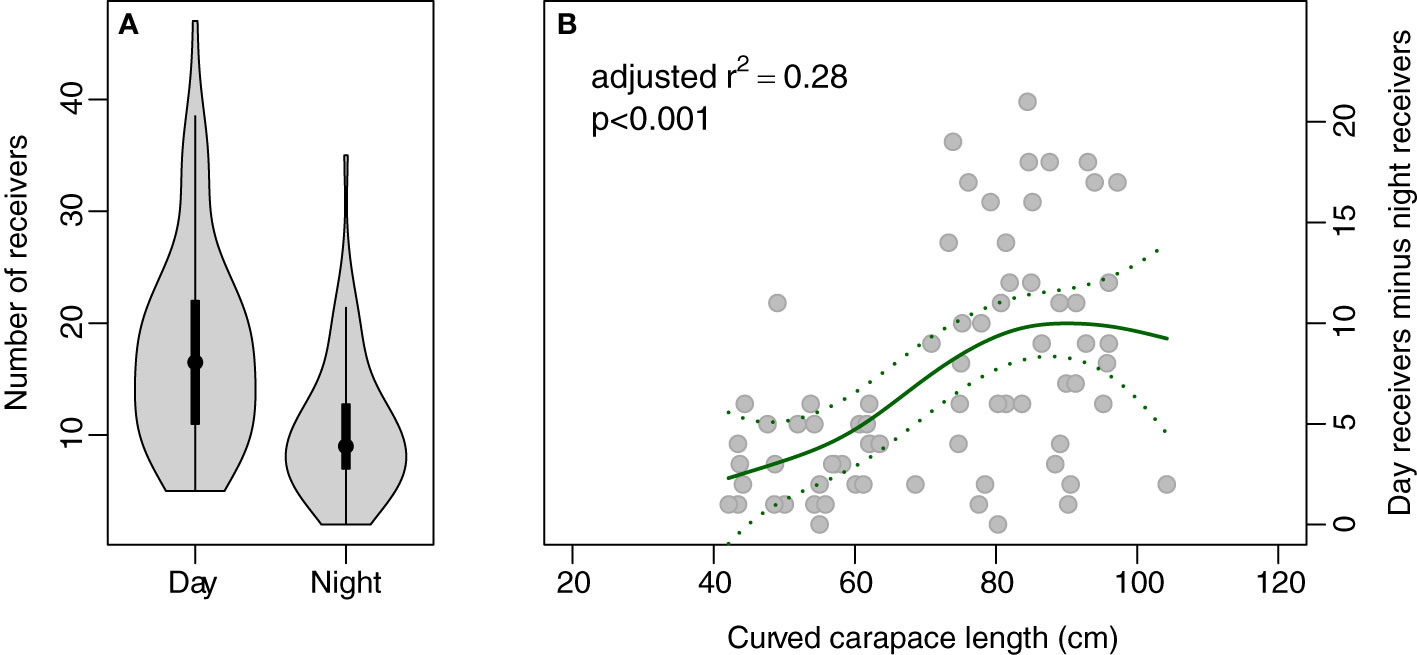
Figure 1 Plot of number of receivers at which each individual was recorded (A) during day and night, and (B) the difference in the number of receivers each individual was recorded on during day and night plotted against length (curved carapace length, cm).
There was a substantial (but nonlinear) increase in 95% KUD with length, and an increase in average distance from shore with length (Figure 2): larger turtles tended to occupy larger areas and be found further from the shore. KUD tended to remain relatively constant at ~1.3–1.5 km2 up to lengths of around 65 cm, then there was a steep increase in KUD between lengths of between 65 cm and 85 cm to ~5.0 km2. There was a concomitant increase in average distance from shore from ~200 m at 35–40 cm to ~1,100 m at 90 cm (Figure 2).
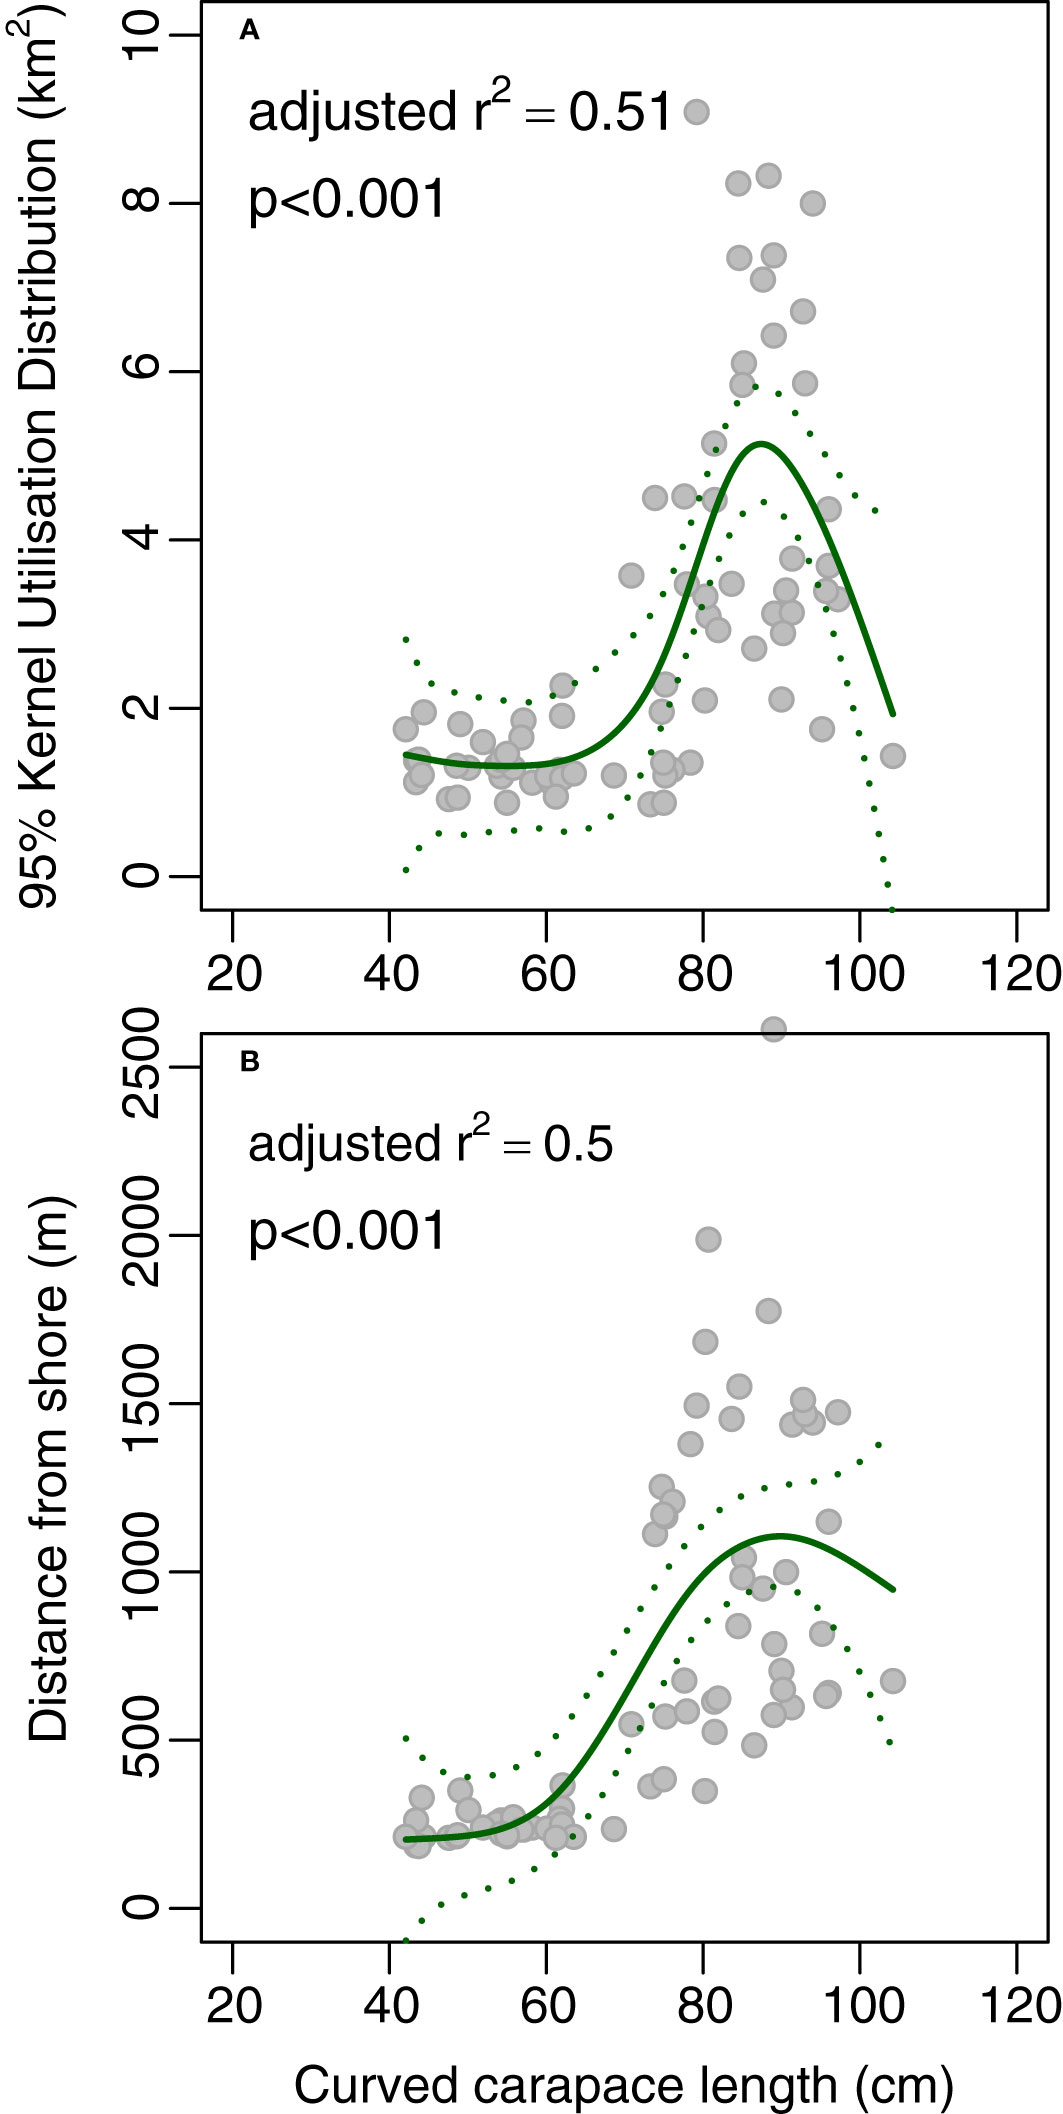
Figure 2 Plot of length (curved carapace length, cm) against (A) 95% Kernel Utilisation Distribution and (B) average distance from shore yielded by acoustic telemetry of green turtles Chelonia mydas. The solid line is the fit from a generalised additive model, and the dotted lines are the 95% confidence intervals for the fit.
Red blood cells were collected from 128 individual C. mydas and nail clippings from 100 individual C. mydas. Each of δ13C, δ15N and δ34S varied significantly in a nonlinear pattern with turtle length, although the amount of variation explained by length was greatest for δ15N and δ34S (Figure 3). The steepest changes in δ13C and δ15N occurred at the smallest lengths, and these were followed by more gradual changes towards maximum length. For example, from 36 cm (the length of the smallest individual captured) to 50 cm, δ13C of red blood cells increased by 2.8 ‰, then decreased by 1.5 ‰ to 105 cm (the length of the largest individual). Similarly, δ15N of red blood cells decreased by 3.4 ‰ from 36 cm to 50 cm before increasing by 2.5 ‰. δ34S of red blood cells yielded similar patterns, but the change at smaller lengths was less, decreasing by 0.8 ‰ from 36 cm to 50 cm before increasing by 1.1 ‰ at 105 cm. Patterns for nails were similar.
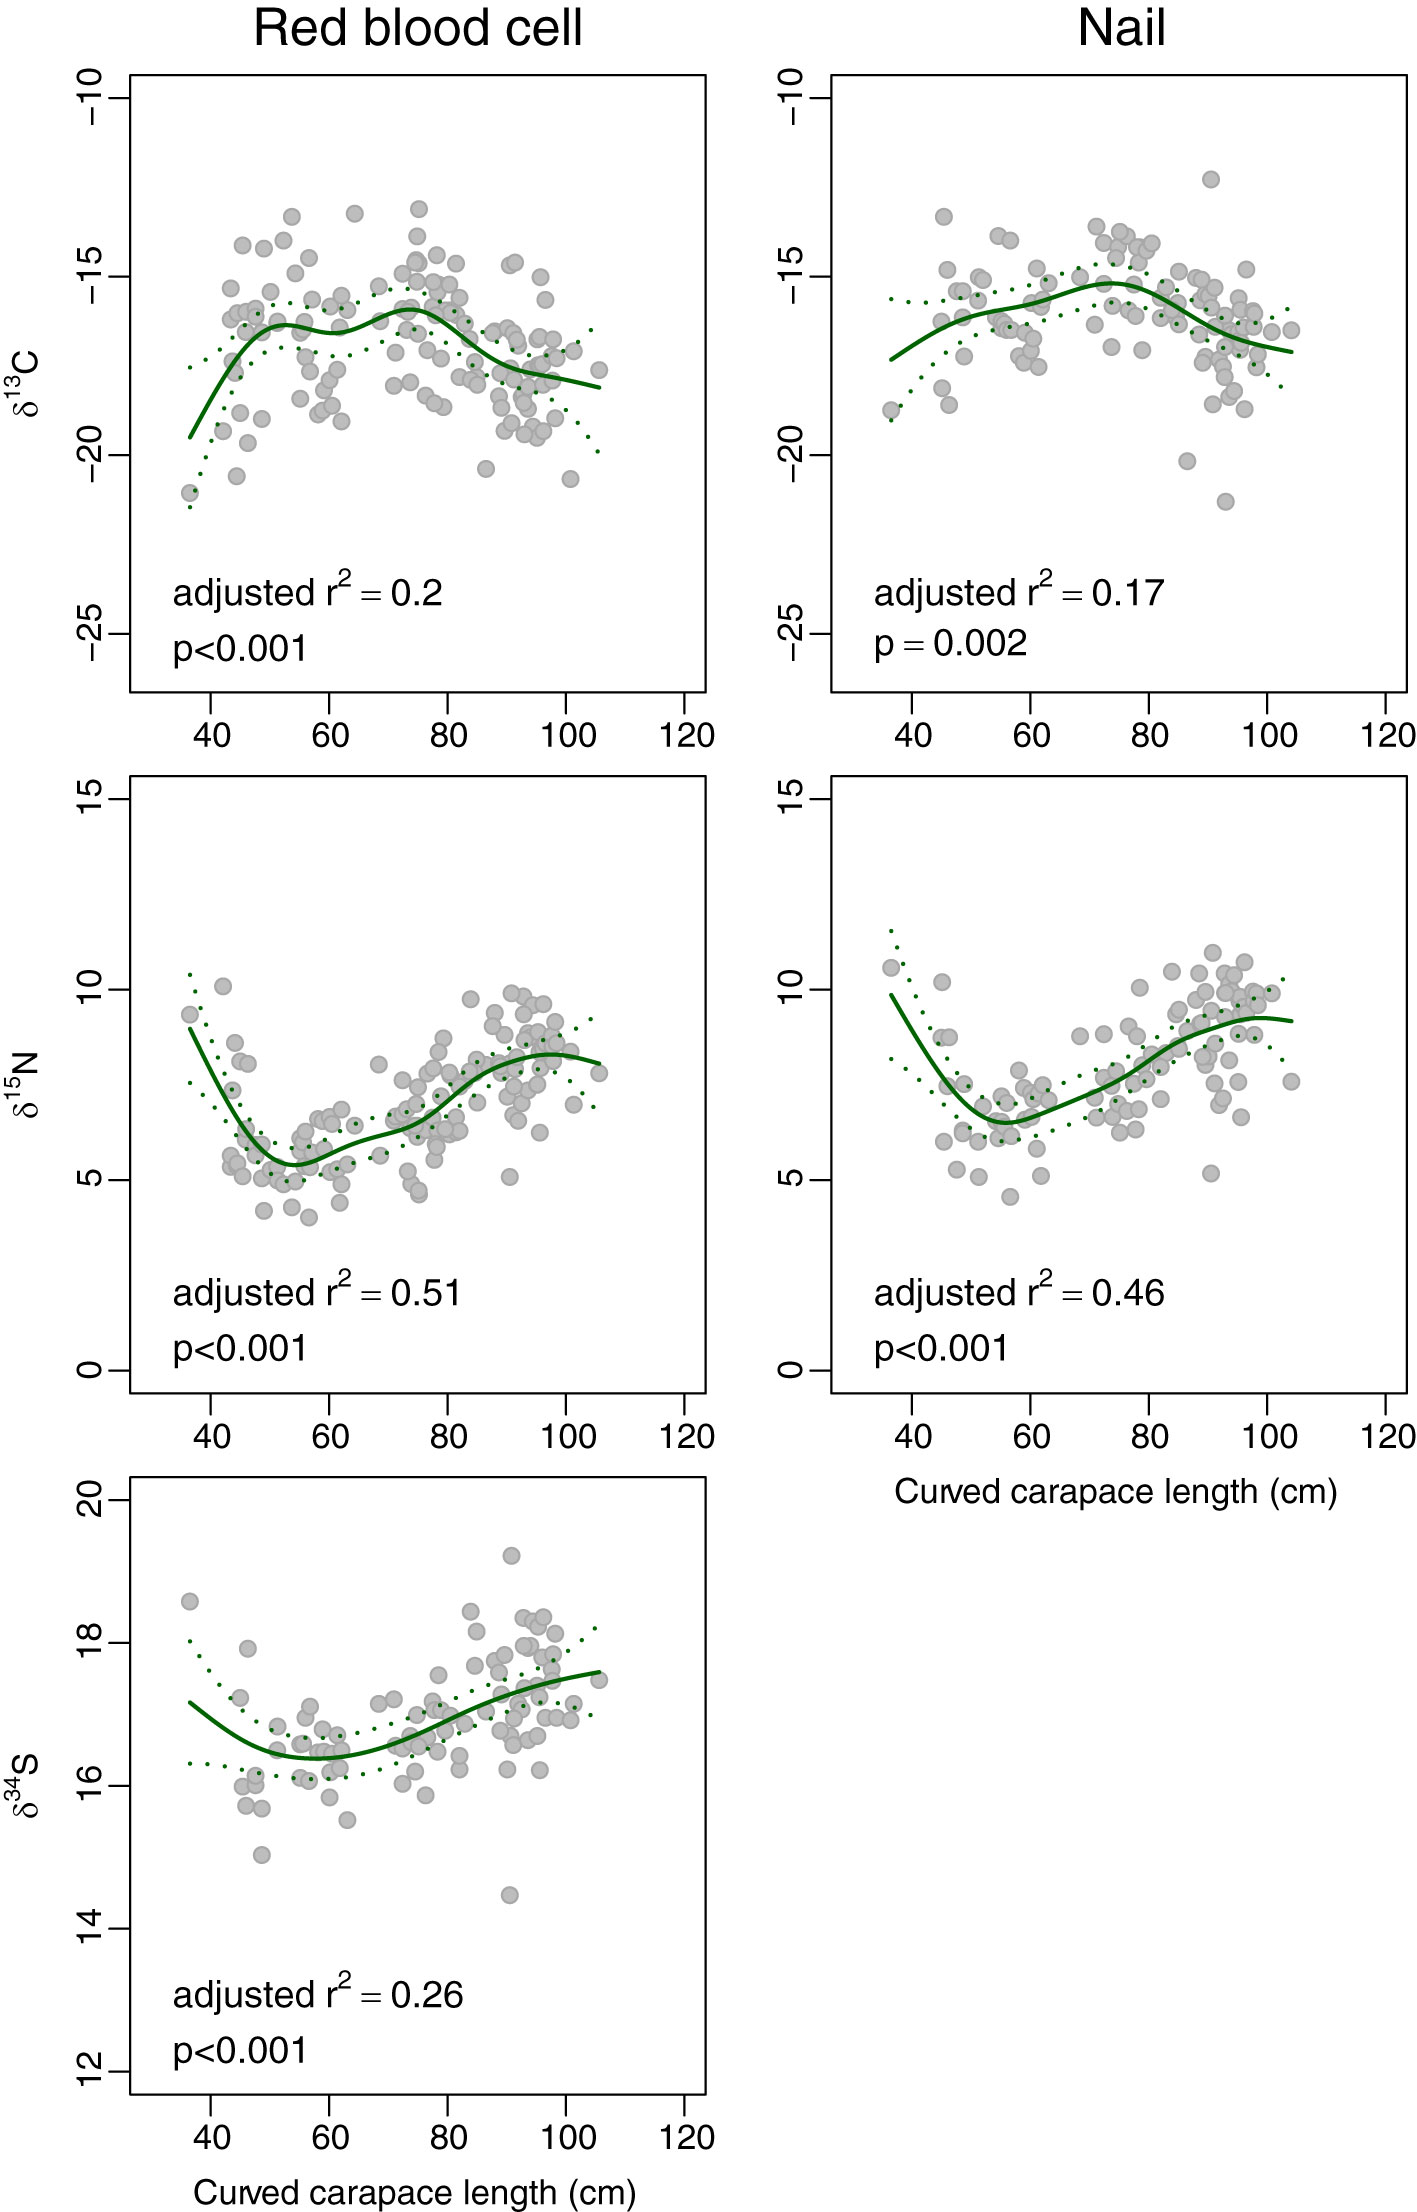
Figure 3 Plot of length (curved carapace length, in cm) against δ13C, δ15N and δ34S of red blood cells (left panel) and nails (right panel) of green turtles Chelonia mydas. The solid line is the fit from a generalised additive model, and the dotted lines are the 95% confidence intervals for the fit.
Neither red blood cells nor nails showed significant variation in δ13C with either KUD or distance from shore (r2 adj<0.04 in each case; Figure 4). However, δ15N and δ34S of both red blood cells and nails (Figures 5, 6, respectively) increased monotonically with KUD and distance from shore (r2 adj>0.25 in each case). To illustrate, δ15N of red blood cells of turtles foraging ~1,600 m from shore was 2.4 ‰ higher than that of those foraging ~200 m from shore and δ34S of red blood cells of turtles foraging further from shore was 1.7 ‰ higher than that of those foraging inshore. The amount of variation explained by models using δ15N from nails was greater than that of models involving red blood cells.
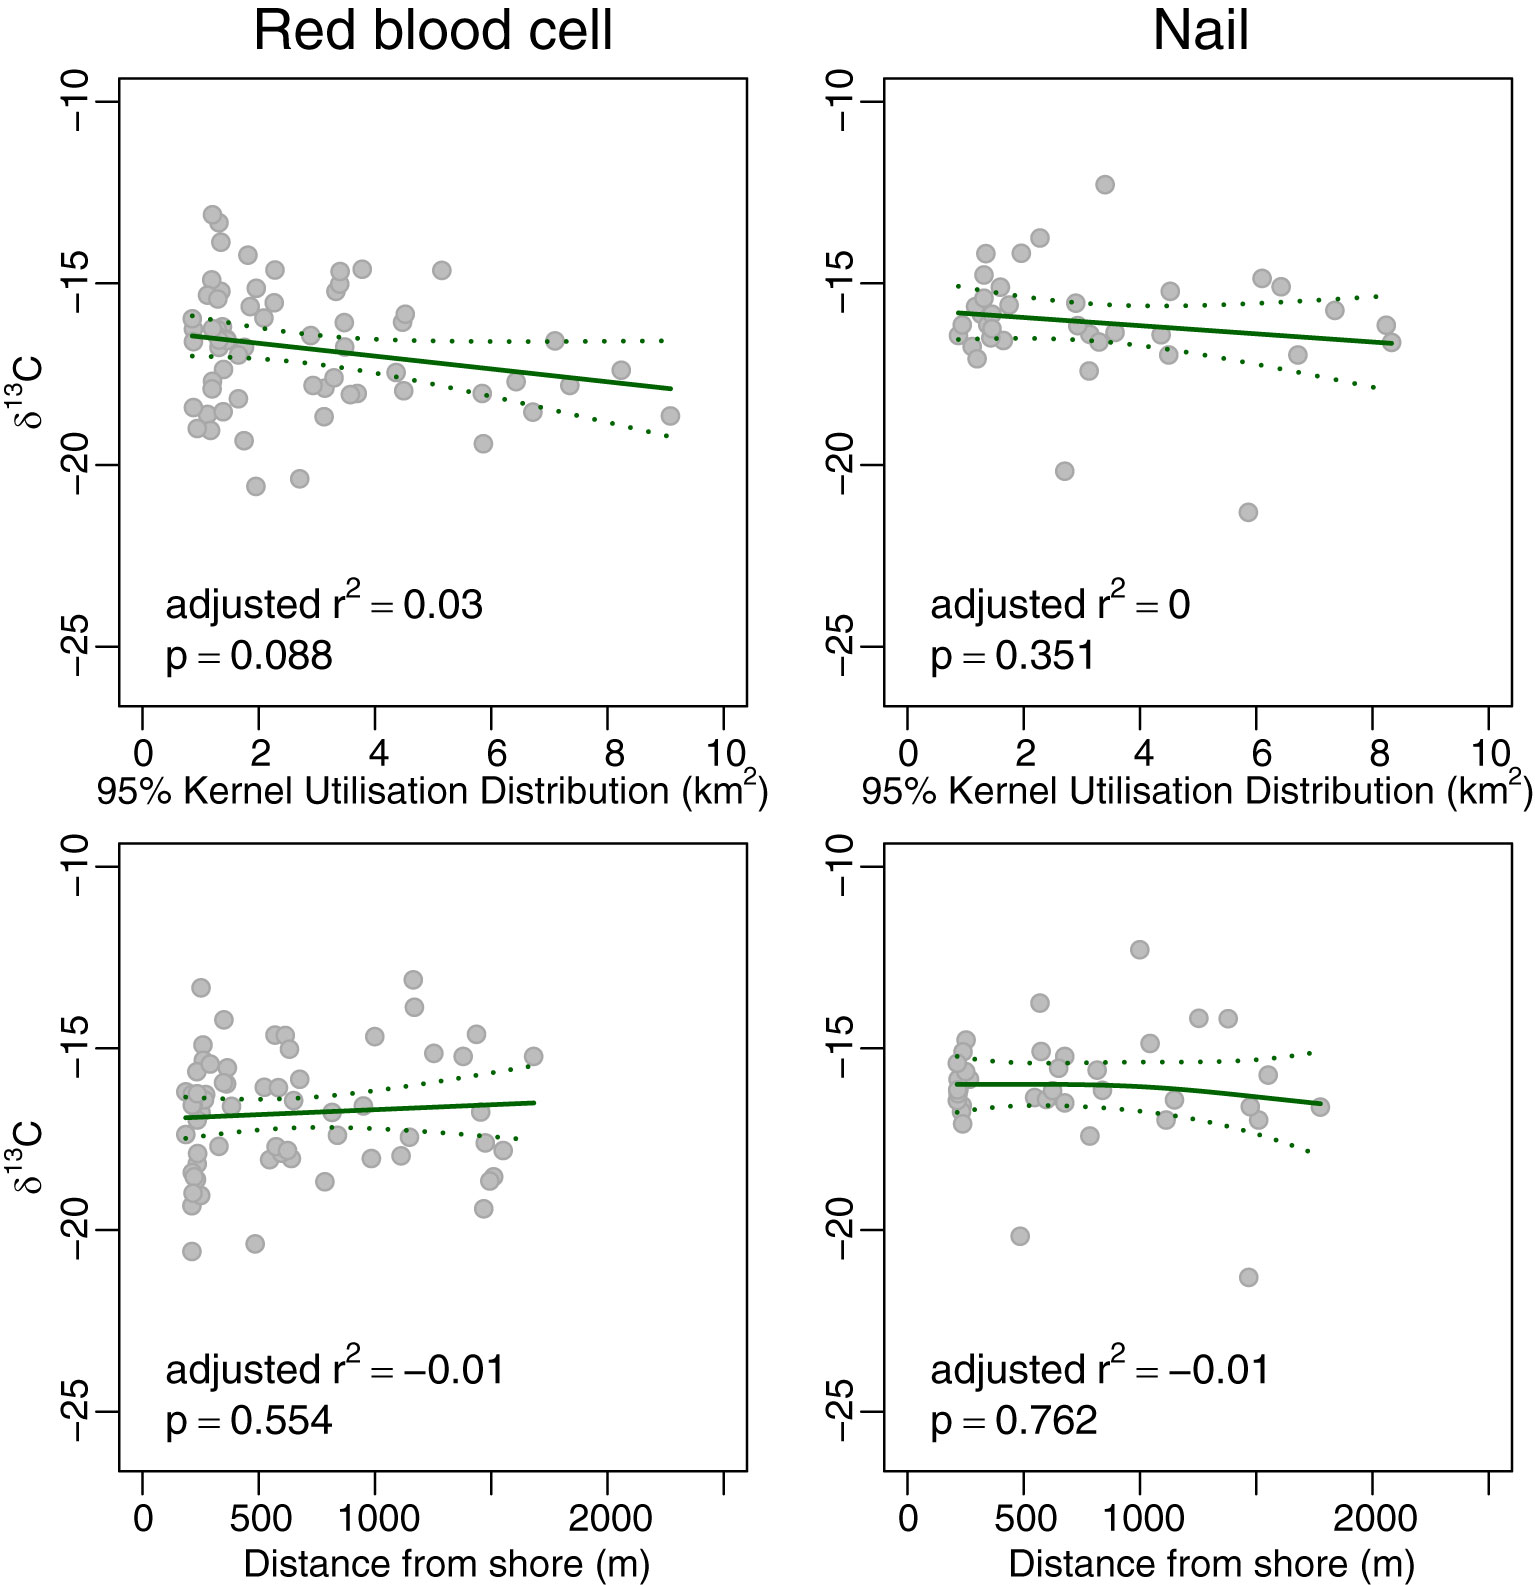
Figure 4 Plot of 95% Kernel Utilisation Distribution and average distance from shore yielded by acoustic telemetry against δ13C of red blood cells (left panels) and nail (right panels) of green turtles Chelonia mydas. The solid line is the fit from a generalised additive model, and the dotted lines are the 95% confidence intervals for the fit.
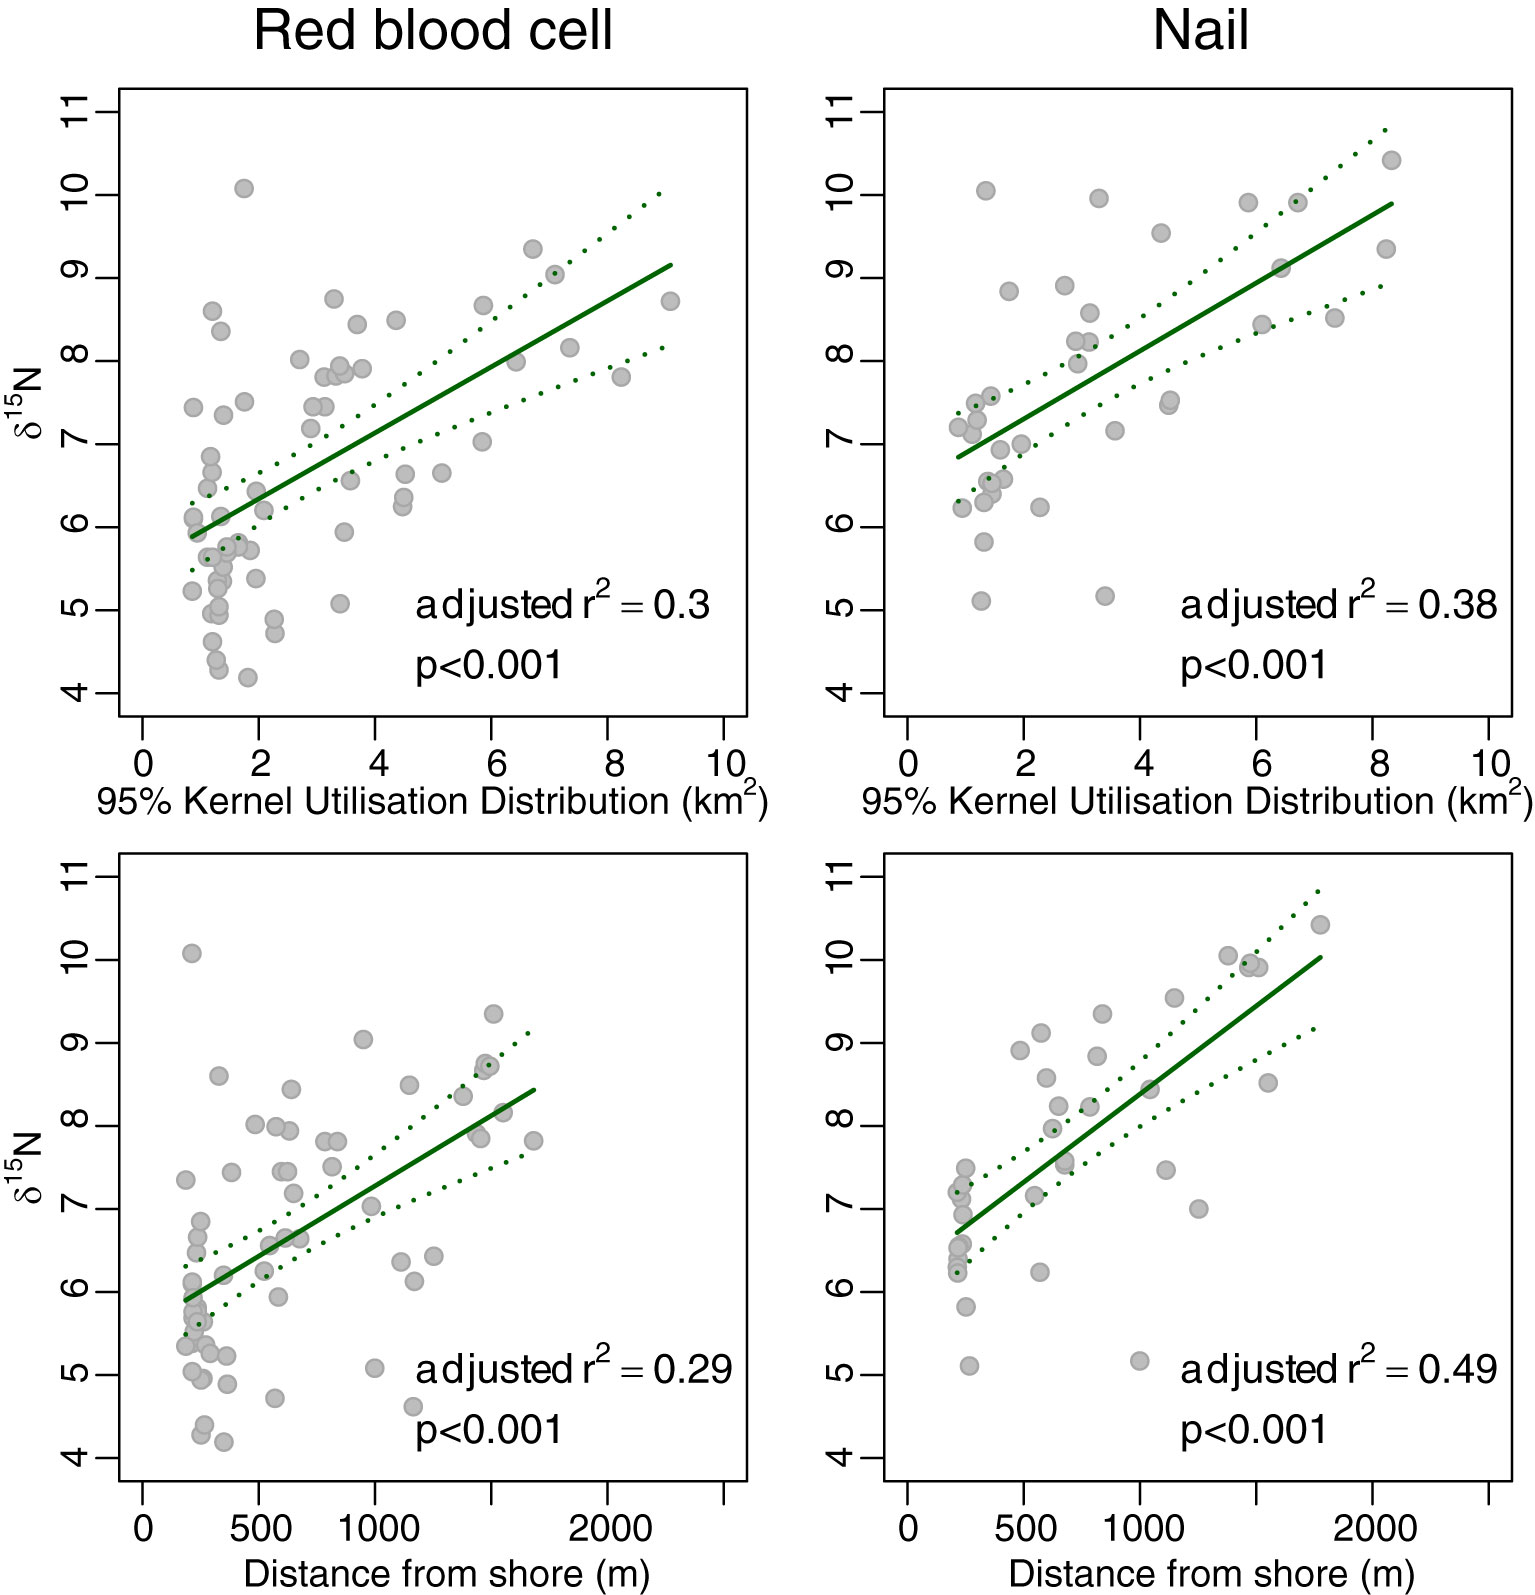
Figure 5 Plot of 95% Kernel Utilisation Distribution and average distance from shore yielded by acoustic telemetry against δ15N of red blood cells (left panels) and nail (right panels) of green turtles Chelonia mydas. The solid line is the fit from a generalised additive model, and the dotted lines are the 95% confidence intervals for the fit.
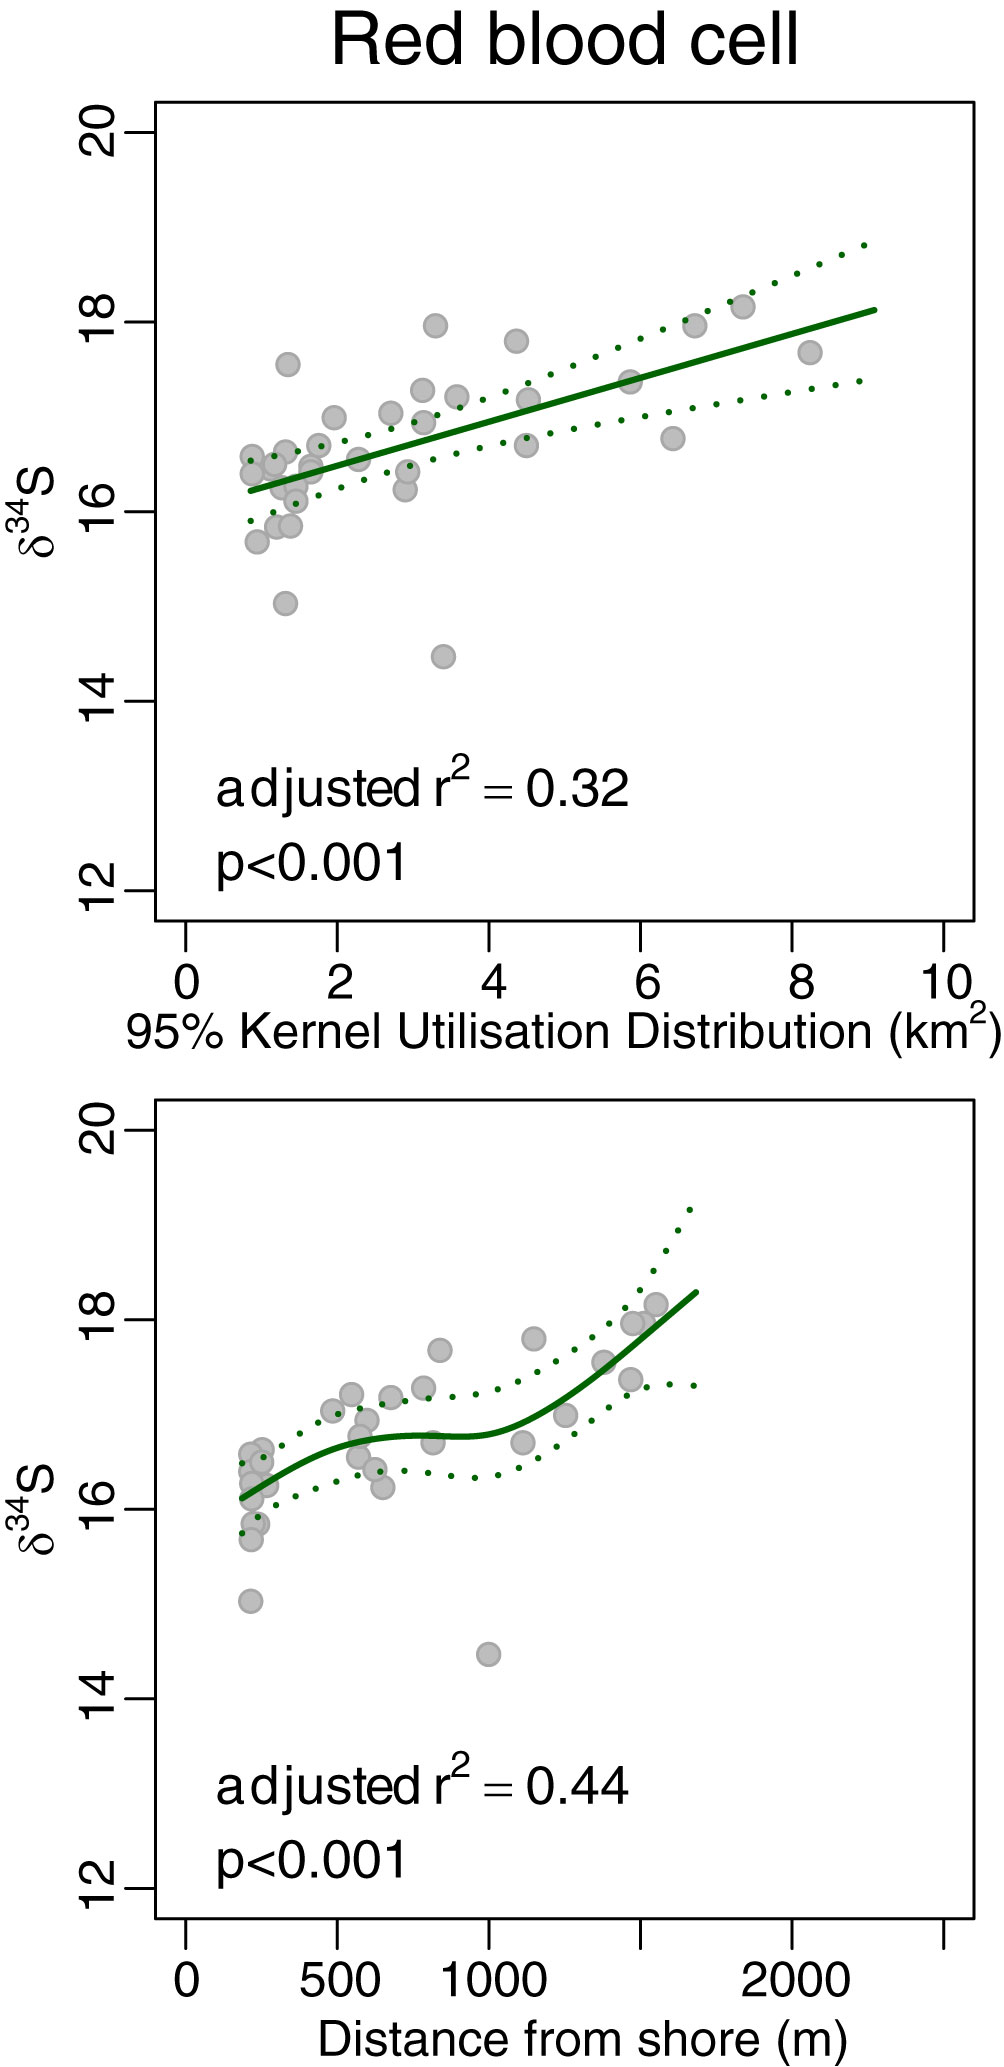
Figure 6 Plot of 95% Kernel Utilisation Distribution and average distance from shore yielded by acoustic telemetry with δ34S of red blood cells of green turtles Chelonia mydas. The solid line is the fit from a generalised additive model, and the dotted lines are the 95% confidence intervals for the fit.
Seagrass, macroalgae and jellyfish were distinguished by one or more of δ13C, δ15N and δ34S (Figure 7). Seagrass tended to have lower δ15N (range: −7.1 to 3.6 ‰) than macroalgae (range: 1.0 to 5.1 ‰), and lower δ34S (range: 17.3 to 20.8 ‰) than macroalgae (range: 19.8 to 21.8 ‰). Jellyfish tended to have higher δ15N (range: 5.3 to 7.2 ‰), and lower δ13C (range: −22.4 to −19.7 ‰) than primary producers.
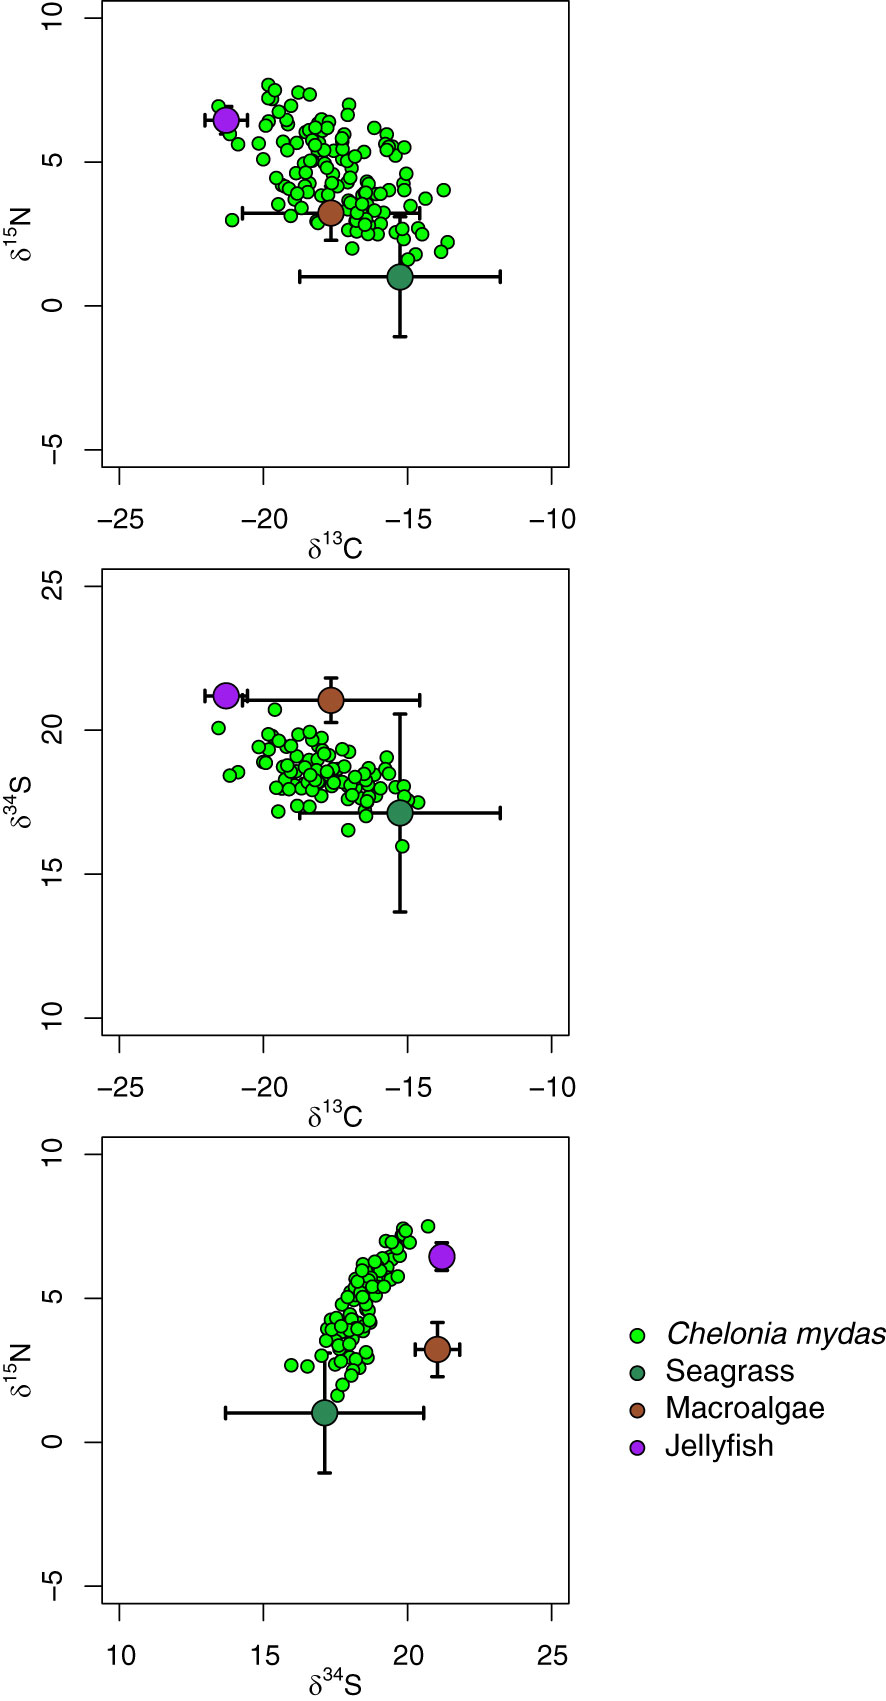
Figure 7 Plot of individual measurements of δ13C, δ15N and δ34S of green turtle Chelonia mydas red blood cells and mean ± SD of macroalgae, seagrass and the scyphozoan jellyfish Crambione mastigophora. δ13C, δ15N and δ34S of C. mydas are adjusted for TDF as follows: 0.3 ‰ for δ13C, 2.4 ‰ for δ15N, 1.5 ‰ for δ34S.
The mixing model supported inferences of ontogenetic changes in diet of C. mydas (Figure 8). Model results indicated that the proportion of seagrass was consistently high across the size range. The proportion of macroalgae was potentially substantial in small (< 60 cm CCL) individuals, but unlikely to be a major contributor to the diet of larger individuals. The proportion of jellyfish increased monotonically with size; this trend was present regardless of the TDF used, but the proportion was higher when a low TDF was tested (results not shown).
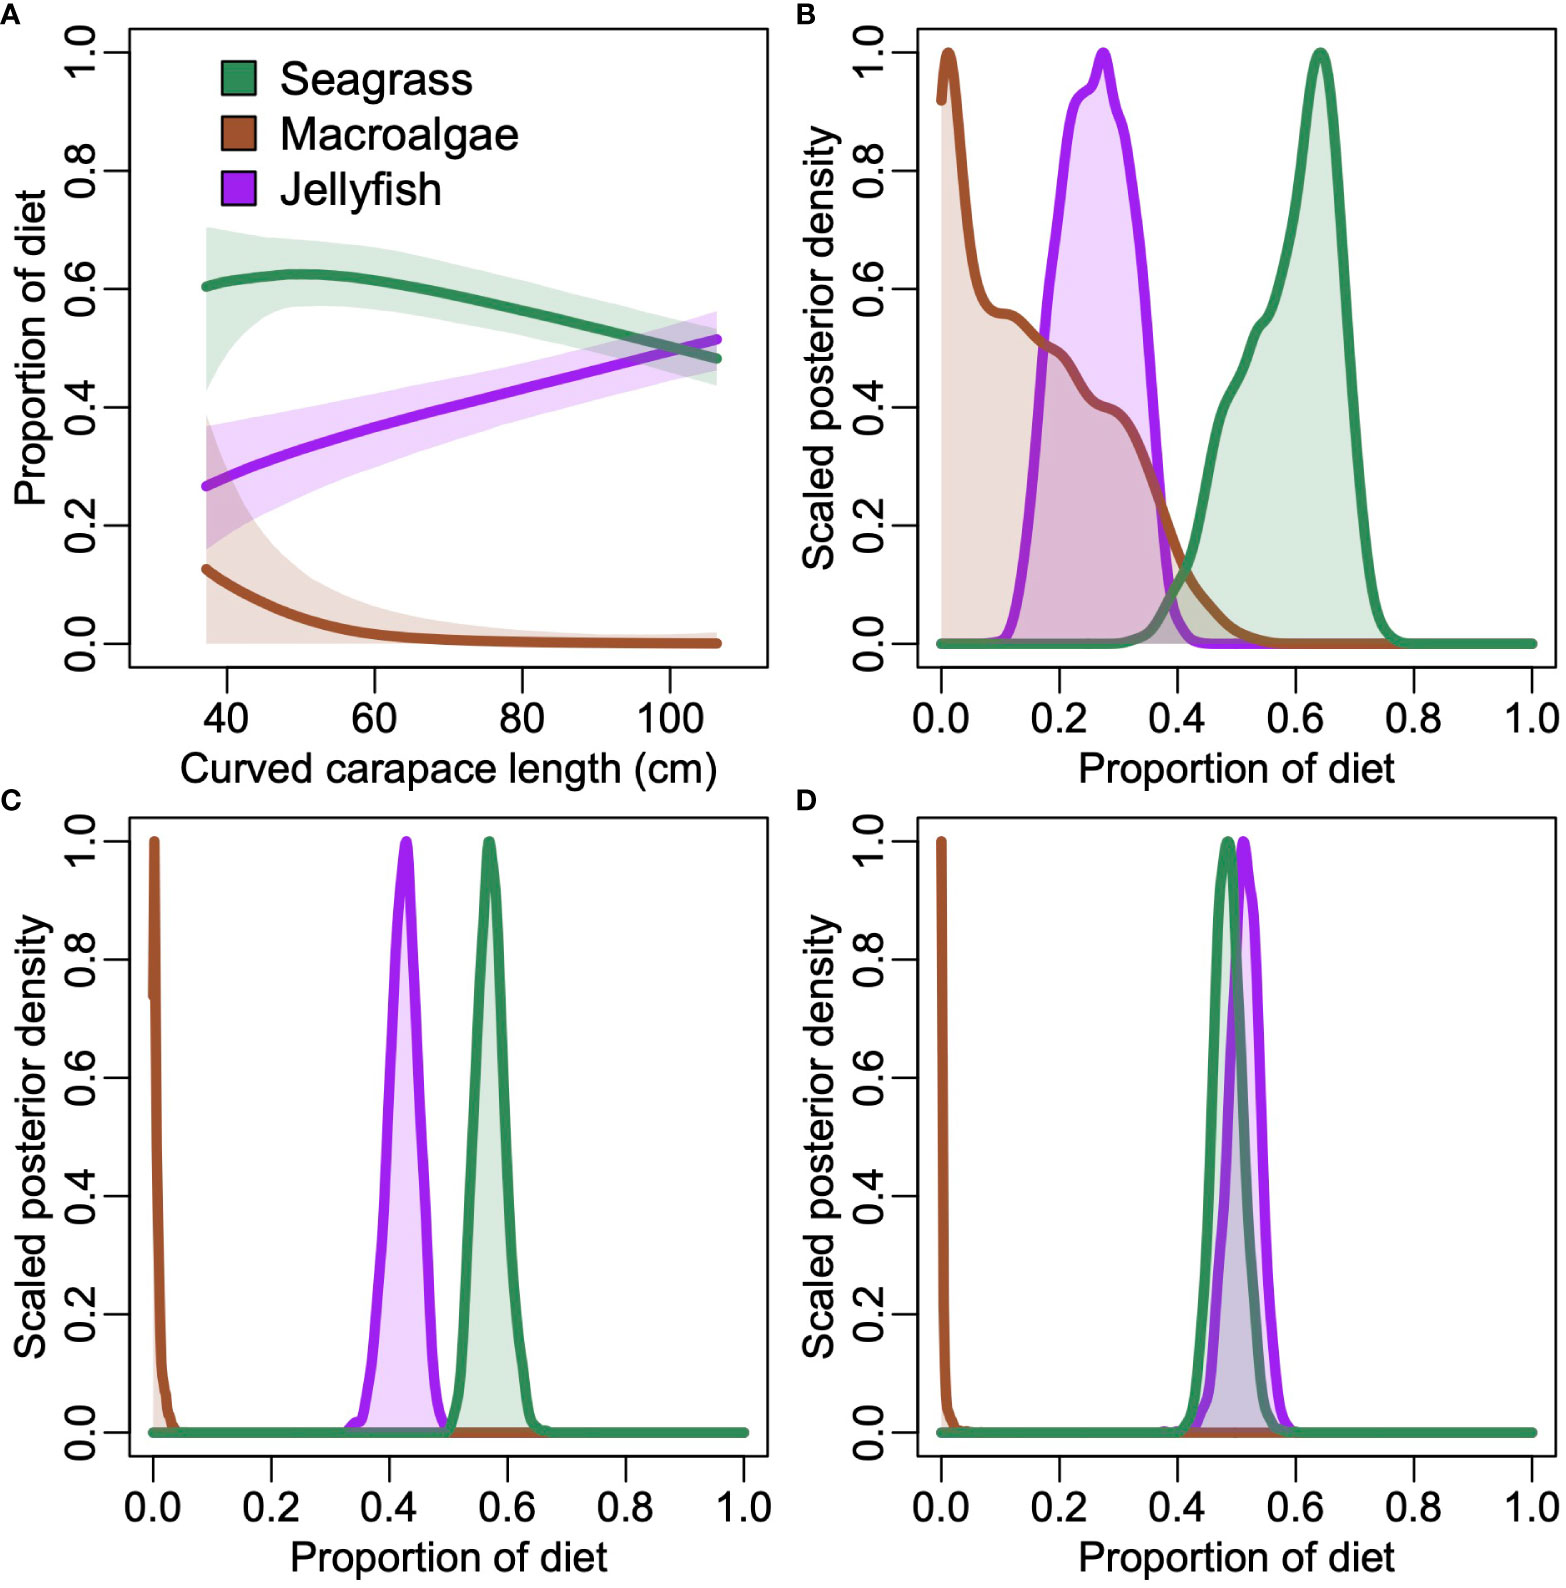
Figure 8 (A) Posterior distributions for estimated proportion of three likely foods of the green turtle C. mydas as a function of length. Lines depict medians and shaded area is 90% credible intervals. (B–D) Posterior plots showing the scaled probability for each potential food for the (B) smallest, (C) median, and (D) largest individuals.
Green turtles Chelonia mydas resident in a tropical lagoon in Ningaloo Marine Park exhibited size-related patterns in home range size, home range location, and diet. Small individuals tended to have small (<1.5 km2) home ranges close to the shore and have a mixed diet including macroalgae, seagrass and scyphozoan jellyfish. Larger individuals tended to have larger (~5 km2) home ranges located further from the shore, and a diet comprising mostly seagrass and jellyfish. Green turtle size is reliably correlated with age (Mayne et al., 2022), so these results confirm the presence of ontogenetic changes in habitat use and diet within the lagoon, across distances of ~1.5–2.0 km.
Ontogenetic changes in habitat use are a feature of green turtle life history — in particular, the migration of hatchlings from the beaches where they hatch to oceanic habitats, and then back again to shallow coastal habitats. Changes in diet associated with developmental migrations of turtles to shallow coastal habitats are well-established (e.g., Reich et al., 2007; Arthur et al., 2008). Our results were consistent with this, and further suggested that changes might continue to be reflected in tissues for some time after recruitment to coastal habitats — the stable isotope composition of all three elements included in this study changed between 40 cm and 50 cm CCL. The decrease in δ15N was ~2 ‰ for red blood cells and nails, quite a substantial decrease equivalent to almost an entire trophic level (Seminoff et al., 2021). Mixing model results suggest that there is unlikely to be a substantial difference in diet at these lengths and they did not correspond with changes in home range size or location, so it seems plausible that the changes are due to continuation of the trajectory towards isotopic equilibrium. If so, noting that the span in size reflects several years of growth, it might imply that the residence times of elements in red blood cells are quite long. The residence times of elements within the tissues of sea turtles remains poorly known; Reich et al. (2008) found median residence times of 36–40 days for δ13C and δ15N in very small juvenile C. mydas (9.0–13.1 cm straight carapace length) but the residence times of turtles of sizes in our study are unknown. An alternative explanation, proposed by Cardona et al. (2010) following similar observations of patterns in stable isotope composition of scute layers, is that newly-recruited juveniles do not yet have the gut microbiome necessary to effectively digest plants. Campos et al. (2018) subsequently found that patterns in microbiota of juvenile green turtles suggest that acquisition of polysaccharide fermenting microbiota (which allow turtles to extract nutrition from seagrass) in the gut occurs rapidly after recruitment to shallow coastal habitats.
Similar patterns of ontogenetic change in diet have been found in other populations of green turtles (Arthur et al., 2008; Howell et al., 2016; Roche et al., 2021). Stubbs et al. (2022) found that these patterns were reflected in the δ15N of amino acids, suggesting that they are not due to size-related differences in discrimination; the inference from this is that the changes do reflect assimilated diet. Individuals at these sizes tended to have small home ranges located close to the shore and likely consumed a mixed diet of macroalgae, seagrass and jellyfish.
After recruitment to the lagoon, green turtles then exhibited further ontogenetic changes in home range size, home range location and diet as they grew. After lengths of approximately 60 cm CCL, home range size gradually increased, the location of the home range extended further from shore and diet likely became predominantly seagrass and jellyfish. Inferences about home range size and home range location are likely to be robust, because the durations of tag attachments were long (average detection span 372 days), and there was minimal emigration from the area encompassed by the array of receivers (three individuals: Pillans et al., 2022) These developmental changes occurred over relatively short distances (<2 km), and were detected by the extensive array of acoustic receivers. These shifts in home range occurred over very short distances compared to developmental changes from juvenile to adult habitats in some other green turtle populations (spanning hundreds of kilometers or more: e.g., Chambault et al., 2018; Doherty et al., 2020).
Despite the short distances, there are steep gradients in habitat type across the lagoon. Close to shore, water is very shallow (<1.5 m deep at Highest Astronomical Tide) and the seafloor is predominantly limestone pavement with macroalgae and sparse seagrass. Further from shore the water is deeper (up to 6 m) and the seafloor is predominantly sandy. The seagrass Halophila ovalis grows in the sandy habitats, which tend to be where larger turtles spend most time (Pillans et al., 2022). The mixing model suggests that seagrass is likely an important food for these individuals, a result that is supported by qualitative observations (M. Vanderklift, personal observations). Increases in seagrass consumption with size have also been reported for other populations of green turtles (e.g., Burgett et al., 2018; Palmer et al., 2021; Roche et al., 2021), and it might be common. However, there are also multiple examples of populations in which large green turtles consume other diets (e.g., see review by Jones and Seminoff, 2013), so the ecological context appears to play an important role in diet. Patterns in consumption of macroalgae are complex, with reports of greater consumption by small individuals (Howell and Shaver, 2021), by large individuals (Vélez-Rubio et al., 2016), or even selectively by only some individuals in a population (Burkholder et al., 2011; Vanderklift et al., 2021).
Jellyfish appear to be important to the diet of green turtles, and the proportion of jellyfish in the diet appears to increase with size. It is possible that other animals (such as crabs or bivalves) also contribute to their diet, but we saw no evidence of this. Jellyfish are not abundant for much of the year, but during April–May they can be superabundant, and occur in the water column above all habitats. It is possible that during these times consumption of jellyfish is nutritionally important. Some individuals fitted with satellite tags also showed episodic movements to deeper habitats outside the lagoon (M. Vanderklift & R. Pillans unpublished data), movements which might be related to a search for jellyfish or other prey. Consumption of gelatinous zooplankton has been observed in multiple green turtle populations, including to the extent where it forms a major component of the diet (González Carman et al., 2014). Facultative consumption of jellyfish when they are abundant might be advantageous if they can be quickly digested, offsetting their relatively low energetic value (Hays et al., 2018).
If the ontogenetic changes in habitat and diet reflect a trade-off between growth and mortality, then it follows that there should be differences among habitats in nutritional value of the food available, and in predation risk. We did not explicitly test for differences in predation risk, but they are plausible: probably the main predators of turtles at Ningaloo are tiger sharks Galeocerdo cuvier, which are present in the lagoon all year and tend to spend proportionally more time in the sandy lagoon habitat (R. Pillans unpublished data). In some contexts green turtles appear to select habitats based on predation risk (e.g., Smulders et al., 2023). It seems plausible that small turtles would be more vulnerable to predation by tiger sharks, and if so restricting home ranges to shallow areas beyond their reach would be a prudent strategy.
It is perhaps less obvious that the food sources in the lagoon are more nutritious. Seagrass is consumed by green turtles throughout much of their range (Esteban et al., 2020), but macroalgae is also consumed even in places where seagrass is abundant (e.g., Burkholder et al., 2011; Vanderklift et al., 2021). Green turtles appear able to extract nutrition from seagrass and macroalgae through hindgut fermentation in which structural carbohydrates (such as cellulose) are broken down by microbes into compounds that can be digested (Bjorndal, 1979; Bjorndal et al., 1991). These microflora appear to provide the nutrition for green turtles eating seagrasses (Arthur et al., 2014). In our study area, the large meadow-forming seagrasses that typify many tropical lagoons are not present in the lagoon; the small-leaved seagrass Halophila ovalis is present, but in relatively low densities throughout the sandy areas of the lagoon. Macroalgae are abundant, but the most abundant macroalgae taxa in the lagoons at Ningaloo (Sargassum spp and other large brown algae) have very low nitrogen concentrations (M. Vanderklift unpublished data). Most of these large brown algae have nitrogen concentrations (a rough indicator of protein content) of <1%, while leaves of H. ovalis contain ~1.5% nitrogen. Red algae contain higher nitrogen concentrations, but are not abundant. It is possible that even with hindgut fermentation macroalgae do not provide the increasing energetic requirements as turtles grow, when proportionally more energy is needed for somatic maintenance (Stubbs et al., 2020). The increasing proportion of jellyfish in their diet as they grow suggests that they might increasingly rely on this food source for additional nutrition. The tissue of Crambione mastigophora has low nitrogen concentrations (~0.9%), but also much lower concentrations of carbon such that C:N ratios are potentially more favorable.
It is also possible that some individuals might select for specific foods more than the overall populations. In green turtles, multiple studies have found that individuals can select some food to the extent that they are considered specialists (e.g., Vander Zanden et al., 2013; Thomson et al., 2018). There is also evidence that this occurs in our study population (Stubbs et al., 2022).
The results here refine the initial diet estimates of Stubbs et al. (2022) by the addition of local measurements of jellyfish and the inclusion of δ34S. The addition of δ34S allows a clearer distinction of the contribution of seagrass and macroalgae, because the roots of seagrass allow uptake of sulfur from porewater which contains sulfides, which have substantially lower δ34S than sulphate found in seawater (Fry et al., 1982), while macroalgae do not have roots and so obtain their sulfur from seawater. However, the model results are still sensitive to the potential foods included and the TDF used (Phillips et al., 2014). In particular, our decisions about what TDF to use for δ34S were based on tenuous evidence (the negative correlation between δ34S of diet and Δ34S from experiments using mammals by Florin et al., 2011); tests using different TDF for δ34S yielded qualitatively similar results, but lower TDF yielded a higher proportional contribution of jellyfish that was less plausible given the relatively low abundance of jellyfish for much of the year. We elected to exclude mangroves because we found no evidence that any individual was foraging in mangroves, but it is possible that mangroves might be a minor proportion of the diet of small turtles with home ranges close to the shore. Similarly, we did not include animals other than jellyfish because we saw no evidence that C. mydas consumed them. However, absence of evidence is not evidence of absence, and it is possible that some individual C. mydas in our study area might consume other animals.
Combining data from acoustic telemetry and stable isotope analysis revealed that the green turtle Chelonia mydas exhibits ontogenetic changes in home range size, home range location and diet across relatively short distances (~1.5 km) in a lagoon ecosystem at Ningaloo, north-western Australia. These changes are consistent with a hypothesis that they optimize a trade-off between risk of predation and nutrition for growth and reproduction.
The raw data supporting the conclusions of this article will be made available by the authors, without undue reservation.
The animal study was reviewed and approved by CSIRO Wildlife and Large Animal Ethics Committee.
MV and RP contributed to conception and design of the study. MV, RP, and WR conducted the statistical analyses. MV wrote the first draft of the manuscript. All authors contributed to data collection, manuscript revision, and read and approved the submitted version.
This research is funded by Ningaloo Outlook (a strategic marine research partnership between CSIRO and Woodside Energy to better understand Ningaloo Reef and its important ecological values). JS was supported by an Australian Government Research Training Program Scholarship and BHP Marine Research Scholarship at The University of Western Australia.
This study was done with the assistance of people too numerous to mention individually, but we thank them all. We thank Peter Barnes, Dani Rob and Keely Markovina from the Department of Biodiversity, Conservation and Attractions and Susie Bedford from the Exmouth District High School for their support. Animal handling procedures were conducted according to permits issued by the CSIRO Wildlife and Large Animal Ethics Committee.
The authors declare that the research was conducted in the absence of any commercial or financial relationships that could be construed as a potential conflict of interest.
All claims expressed in this article are solely those of the authors and do not necessarily represent those of their affiliated organizations, or those of the publisher, the editors and the reviewers. Any product that may be evaluated in this article, or claim that may be made by its manufacturer, is not guaranteed or endorsed by the publisher.
The Supplementary Material for this article can be found online at: https://www.frontiersin.org/articles/10.3389/fevo.2023.1139441/full#supplementary-material
Arthur K. E., Boyle M. C., Limpus C. J. (2008). Ontogenetic changes in diet and habitat use in green sea turtle (Chelonia mydas) life history. Mar. Ecol. Prog. Ser. 362, 303–311. doi: 10.3354/meps07440
Arthur K. E., Kelez S., Larsen T., Choy C. A., Popp B. N. (2014). Tracing the biosynthetic source of essential amino acids in marine turtles using δ13C fingerprints. Ecology 95, 1285–1293. doi: 10.1890/13-0263.1
Bivand R., Lewin-Koh N. (2013). maptools: Tools for reading and handling spatial objects. R package version 0.8, 23.
Bjorndal K. A. (1979). Cellulose digestion and volatile fatty-acid production in the green turtle, Chelonia mydas. Comp. Biochem. Physiol. A: Physiol. 63, 127–133. doi: 10.1016/0300-9629(79)90638-8
Bjorndal K. A., Suganuma H., Bolten A. B. (1991). Digestive fermentation in green turtles, Chelonia mydas, feeding on algae. Bull. Mar. Sci. 48, 166–171.
Bolten A. B. (2003). “Variation in Sea turtle life history patterns: neritic vs. oceanic developmental stages,” in The Biology of Sea Turtles volume 2. Eds. Lutz P. L., Musick J. A., Wyneken J. (Boca Raton, CRC Press), 243–257.
Burgett C. M., Burkholder D. A., Coates K. A., Fourqurean V. L., Kenworthy W. J., Manuel S. A., et al. (2018). Ontogenetic diet shifts of green sea turtles (Chelonia mydas) in a mid-ocean developmental habitat. Mar. Biol. 165, 33. doi: 10.1007/s00227-018-3290-6
Burkholder D. A., Heithaus M. R., Thomson J. A., Fourqurean J. W. (2011). Diversity in trophic interactions of green sea turtles Chelonia mydas on a relatively pristine coastal foraging ground. Mar. Ecol. Prog. Ser. 439, 277–293. doi: 10.3354/meps09313
Calenge C. (2006). The package adehabitat for the R software: a tool for the analysis of space and habitat use by animals. Ecol. Model. 197, 516–519. doi: 10.1016/j.ecolmodel.2006.03.017
Campos P., Guivernau M., Prenafeta-Boldú F. X., Cardona L. (2018). Fast acquisition of a polysaccharide fermenting gut microbiome by juvenile green turtles Chelonia mydas after settlement in coastal habitats. Microbiome 6, 69. doi: 10.1186/s40168-018-0454-z
Cardona L., Campos P., Levy Y., Demetropoulos A., Margaritoulis D. (2010). Asynchrony between dietary and nutritional shifts during the ontogeny of green turtles (Chelonia mydas) in the Mediterranean. J. Exp. Mar. Biol. Ecol. 393, 83–89. doi: 10.1016/j.jembe.2010.07.004
Cassata L., Collins L. B. (2008). Coral reef communities, habitats, and substrates in and near sanctuary zones of Ningaloo Marine Park. J. Coast. Res. 24, 139–151. doi: 10.2112/05-0623.1
Chambault P., de Thoisy B., Huguin M., Martin J., Bonola M., Etienne D., et al. (2018). Connecting paths between juvenile and adult habitats in the Atlantic green turtle using genetics and satellite tracking. Ecol. Evol. 8, 12790–12802. doi: 10.1002/ece3.4708
Doherty P. D., Broderick A. C., Godley B. J., Hart K. A., Phillips Q., Sanghera A., et al. (2020). Spatial ecology of sub-adult green turtles in coastal waters of the Turks and Caicos islands: implications for conservation management. Front. Mar. Sci. 7. doi: 10.3389/fmars.2020.00690
Esteban N., Mortimer J. A., Stokes H. J., Laloë J.-O., Unsworth R. K. F., Hays G. C. (2020). A global review of green turtle diet: sea surface temperature as a potential driver of omnivory levels. Mar. Biol. 167, 183. doi: 10.1007/s00227-020-03786-8
Florin S. T., Felicetti L. A., Robbins C. T. (2011). The biological basis for understanding and predicting dietary-induced variation in nitrogen and sulphur isotope ratio discrimination. Funct. Ecol. 25, 519–526. doi: 10.1111/j.1365-2435.2010.01799.x
Fry B., Scalan R. S., Winters J. K., Parker P. L. (1982). Sulphur uptake by salt grasses, mangroves, and seagrasses in anaerobic sediments. Geochimica Cosmochimica Acta 46, 1121–1124. doi: 10.1016/0016-7037(82)90063-1
González Carman V., Botto F., Gaitán E., Albareda D., Campagna C., Mianzan H. (2014). A jellyfish diet for the herbivorous green turtle Chelonia mydas in the temperate SW Atlantic. Mar. Biol. 161, 339–349. doi: 10.1007/s00227-013-2339-9
Hays G. C., Doyle T. K., Houghton J. D. R. (2018). A paradigm shift in the trophic importance of jellyfish? Trends Ecol. Evol. 33, 874–884. doi: 10.1016/j.tree.2018.09.001
Hays G. C., Scott R. (2013). Global patterns for upper ceilings on migration distance in sea turtles and comparisons with fish, birds and mammals. Funct. Ecol. 27, 748–756. doi: 10.1111/1365-2435.12073
Howell L. N., Reich K. J., Shaver D. J., Landry A. M., Gorga C. C. (2016). Ontogenetic shifts in diet and habitat of juvenile green sea turtles in the northwestern Gulf of Mexico. Mar. Ecol. Prog. Ser. 559, 217–229. doi: 10.3354/meps11897
Howell L. N., Shaver D. J. (2021). Foraging habits of green sea turtles (Chelonia mydas) in the northwestern Gulf of Mexico. Front. Mar. Sci. 8. doi: 10.3389/fmars.2021.658368
Jones T., Seminoff J. (2013). “Feeding biology: advances from field-based observations, physiological studies, and molecular techniques,” in Biology of Sea Turtles Volume III. Eds. Wyneken J., Lohmann K. J., Musick J. A. (Boca Raton: Taylor & Francis), 211–247.
Keesing J. K., Gershwin L. A., Trew T., Strzelecki J., Bearham D., Liu D. Y., et al. (2016). Role of winds and tides in timing of beach strandings, occurrence, and significance of swarms of the jellyfish Crambione mastigophora Mass 1903 (Scyphozoa: Rhizostomeae: Catostylidae) in north-western Australia. Hydrobiologia Mass 768, 19–36. doi: 10.1007/s10750-015-2525-5
Martínez del Rio C., Wolf N., Carleton S. A., Gannes L. Z. (2009). Isotopic ecology ten years after a call for more laboratory experiments. Biol. Rev. 84, 91–111. doi: 10.1111/j.1469-185X.2008.00064.x
Mayne B., Mustin W., Baboolal V., Casella F., Ballorain K., Barret M., et al. (2022). Age prediction of green turtles with an epigenetic clock. Mol. Ecol. Resour. 22, 2275–2284. doi: 10.1111/1755-0998.13621
Musick J. A., Limpus C. J. (1996). “Habitat utilization and migration in juvenile sea turtles,” in The Biology of Sea Turtles. Eds. Lutz P. L., Musick J. A. (Boca Raton: CRC Press), 137–163.
Oksanen J., Guillaume Blanchet F., Friendly M., Kindt R., Legendre P., Dan McGlinn P., et al. (2022). “Vegan: community ecology package.” R package version 2.5-7. 2020.
Owens D. W., Ruiz G. J. (1980). New methods of obtaining blood and cerebrospinal fluid from marine turtles. Herpetologica 36 (17), 17–20. Available at: http://www.jstor.org/stable/3891847.
Palmer J. L., Beton D., Çiçek B. A., Davey S., Duncan E. M., Fuller W. J., et al. (2021). Dietary analysis of two sympatric marine turtle species in the eastern Mediterranean. Mar. Biol. 168, 94. doi: 10.1007/s00227-021-03895-y
Pecquerie L., Nisbet R. M., Fablet R., Lorrain A., Kooijman S. (2010). The impact of metabolism on stable isotope dynamics: a theoretical framework. Philos. Trans. R. Soc. B-Biological Sci. 365, 3455–3468. doi: 10.1098/rstb.2010.0097
Phillips D. L., Inger R., Bearhop S., Jackson A. L., Moore J. W., Parnell A. C., et al. (2014). Best practices for use of stable isotope mixing models in food-web studies. Can. J. Zool. 92, 823–835. doi: 10.1139/cjz-2014-0127
Pillans R. D., Bearham D., Boomer A., Downie R., Patterson T. A., Thomson D. P., et al. (2014). Multi year observations reveal variability in residence of a tropical demersal fish, Lethrinus nebulosus: implications for spatial management. PloS One 10, e0118869. doi: 10.1371/journal.pone.0105507
Pillans R. D., Rochester W., Babcock R. C., Thomson D. P., Haywood M. D. E., Vanderklift M. A. (2021). Long-term acoustic monitoring reveals site fidelity, reproductive migrations, and sex specific differences in habitat use and migratory timing in a large coastal shark (Negaprion acutidens). Front. Mar. Sci. 8. doi: 10.3389/fmars.2021.616633
Pillans R. D., Whiting S. D., Tucker A. D., Vanderklift M. A. (2022). Fine-scale movement and habitat use of juvenile, subadult, and adult green turtles (Chelonia mydas) in a foraging ground at Ningaloo Reef, Australia. Aquat. Conservation-Marine Freshw. Ecosyst. 32, 1323–1340. doi: 10.1002/aqc.3832
Preisser E. L., Orrock J. L. (2012). The allometry of fear: interspecific relationships between body size and response to predation risk. Ecosphere 3, art77. doi: 10.1890/ES12-00084.1
Reich K. J., Bjorndal K. A., Bolten A. B. (2007). The ‘lost years’ of green turtles: using stable isotopes to study cryptic lifestages. Biol. Lett. 3, 712–714. doi: 10.1098/rsbl.2007.0394
Reich K. J., Bjorndal K. A., Martínez del Rio C. (2008). Effects of growth and tissue type on the kinetics of 13C and 15N incorporation in a rapidly growing ectotherm. Oecologia 155, 651–663. doi: 10.1007/s00442-007-0949-y
Roche D. C., Cherkiss M. S., Smith B. J., Burkholder D. A., Hart K. M. (2021). Stable isotopes used to infer trophic position of green turtles (Chelonia mydas) from Dry Tortugas National Park, Gulf of Mexico, United States. Regional studies in marine science 48, 10211.
Seminoff J. A., Komoroske L. M., Amorocho D., Arauz R., Chacon-Chaverrı D., Paz N.D., et al. (2021). Large-scale patterns of green turtle trophic ecology in the eastern pacific ocean. Ecosphere 12, e03479. doi: 10.1002/ecs2.3479
Skrzypek G. (2013). Normalization procedures and reference material selection in stable HCNOS isotope analyses: an overview. Analytical Bioanalytical Chem. 405, 2815–2823. doi: 10.1007/s00216-012-6517-2
Skrzypek G., Sadler R., Paul D. (2010). Error propagation in normalization of stable isotope data: a Monte Carlo analysis. Rapid Commun. Mass Spectrom. 24, 2697–2705. doi: 10.1002/rcm.4684
Smulders F. O. H., Bakker E. S., O’Shea O. R., Campbell J. E., Rhoades O. K., Christianen M. J. A. (2023). Green turtles shape the seascape through grazing patch formation around habitat features: experimental evidence. Ecology 104, e3902. doi: 10.1002/ecy.3902
Snover M. (2008). Ontogenetic habitat shifts in marine organisms: influencing factors and the impact of climate variability. Bull. Mar. Sci. 83, 53–67.
Stock B., Jackson A., Ward E., Parnell A., Phillips D., Semmens B. (2018). Analyzing mixing systems using a new generation of Bayesian tracer mixing models. PeerJ 6, e5096. doi: 10.7717/peerj.5096
Stock B. C., Semmens B. X. (2016). MixSIAR GUI user manual, version 3.1. Available at: https://github.com/brianstock/MixSIAR.
Stubbs J. L., Marn N., Vanderklift M. A., Fossette S., Mitchell N. J. (2020). Simulated growth and reproduction of green turtles (Chelonia mydas) under climate change and marine heatwave scenarios. Ecol. Model. 431, 109185. doi: 10.1016/j.ecolmodel.2020.109185
Stubbs J. L., Revill A. T., Pillans R. D., Vanderklift M. A. (2022). Stable isotope composition of multiple tissues and individual amino acids reveals dietary variation among life stages in green turtles (Chelonia mydas) at ningaloo reef. Mar. Biol. 169, 72. doi: 10.1007/s00227-022-04055-6
Studley S. A., Ripley E. M., Elswick E. R., Dorais M. J., Fong J., Finkelstein D., et al. (2002). Analysis of sulfides in whole rock matrices by elemental analyzer–continuous flow isotope ratio mass spectrometry. Chem. Geology 192, 141–148. doi: 10.1016/S0009-2541(02)00162-6
Thomson J. A., Whitman E. R., Garcia-Rojas M. I., Bellgrove A., Ekins M., Hays G. C., et al. (2018). Individual specialization in a migratory grazer reflects long-term diet selectivity on a foraging ground: implications for isotope-based tracking. Oecologia 188, 429–439. doi: 10.1007/s00442-018-4218-z
Turner J. A., Babcock R. C., Hovey R., Kendrick G. A. (2018). AUV-based classification of benthic communities of the Ningaloo shelf and mesophotic areas. Coral Reefs 37, 763–778. doi: 10.1007/s00338-018-1700-3
Turner Tomaszewicz C., Seminoff J., Avens L., Goshe L., Rguez-Baron J., Peckham S., et al. (2018). Expanding the coastal forager paradigm: long-term pelagic habitat use by green turtles Chelonia mydas in the eastern pacific ocean. Mar. Ecol. Prog. Ser. 587, 217–234. doi: 10.3354/meps12372
Vanderklift M. A., Babcock R. C., Barnes P. B., Cresswell A. K., Feng M., Haywood M. D. E., et al. (2020a). The oceanography and marine ecology of ningaloo, a world heritage area. Oceanography and marine biology: an annual review, vol 58. Eds. Hawkins S. J., Allcock A. L., Bates A. E., Firth L. B., Smith I. P., Swearer S. E., Evans A. J., Todd P. A., Russell B. D., Mcquaid. C. D. (Taylor & Francis), 143–178.
Vanderklift M. A., Pillans R. D., Hutton M., De Wever L., Kendrick G. A., Zavala-Perez A., et al. (2021). High rates of herbivory in remote northwest Australian seagrass meadows by rabbitfish and green turtles. Mar. Ecol. Prog. Ser. 665, 63–73. doi: 10.3354/meps13657
Vanderklift M. A., Pillans R. D., Robson N. A., Skrzypek G., Stubbs J. L., Tucker A. D. (2020b). Comparisons of stable isotope composition among tissues of green turtles. Rapid Commun. Mass Spectrom. 34, e8839. doi: 10.1002/rcm.8839
Vander Zanden H. B., Bjorndal K. A., Bolten A. B. (2013). Temporal consistency and individual specialization in resource use by green turtles in successive life stages. Oecologia 173, 767–777. doi: 10.1007/s00442-013-2655-2
Vander Zanden H. B., Bjorndal K. A., Mustin W., Ponciano J. M., Bolten A. B. (2012). Inherent variation in stable isotope values and discrimination factors in two life stages of green turtles. Physiol. Biochem. Zool. 85, 431–441. doi: 10.1086/666902
Vélez-Rubio G. M., Cardona L., López-Mendilaharsu M., Martínez Souza G., Carranza A., González-Paredes D., et al. (2016). Ontogenetic dietary changes of green turtles (Chelonia mydas) in the temperate southwestern Atlantic. Mar. Biol. 163, 57. doi: 10.1007/s00227-016-2827-9
Werner E. E., Gilliam J. F. (1984). The ontogenetic niche and species interactions in size structured populations. Annu. Rev. Ecol. Systematics 15, 393–425. doi: 10.1146/annurev.es.15.110184.002141
Wood S. (2011). Fast stable restricted maximum likelihood and marginal likelihood estimation of semiparametric generalized linear models. J. R. Stat. Soc. B 73, 3–36. doi: 10.1111/j.1467-9868.2010.00749.x
Keywords: stable isotope, home range, mixing model, Ningaloo, seagrass, macroalgae, jellyfish
Citation: Vanderklift MA, Pillans RD, Rochester W, Stubbs JL, Skrzypek G, Tucker AD and Whiting SD (2023) Ontogenetic changes in green turtle (Chelonia mydas) diet and home range in a tropical lagoon. Front. Ecol. Evol. 11:1139441. doi: 10.3389/fevo.2023.1139441
Received: 07 January 2023; Accepted: 12 June 2023;
Published: 01 August 2023.
Edited by:
Yixin Zhang, Soochow University, ChinaReviewed by:
Graeme Clive Hays, Deakin University, AustraliaCopyright © 2023 Vanderklift, Pillans, Rochester, Stubbs, Skrzypek, Tucker and Whiting. This is an open-access article distributed under the terms of the Creative Commons Attribution License (CC BY). The use, distribution or reproduction in other forums is permitted, provided the original author(s) and the copyright owner(s) are credited and that the original publication in this journal is cited, in accordance with accepted academic practice. No use, distribution or reproduction is permitted which does not comply with these terms.
*Correspondence: Mathew A. Vanderklift, bWF0LnZhbmRlcmtsaWZ0QGNzaXJvLmF1
Disclaimer: All claims expressed in this article are solely those of the authors and do not necessarily represent those of their affiliated organizations, or those of the publisher, the editors and the reviewers. Any product that may be evaluated in this article or claim that may be made by its manufacturer is not guaranteed or endorsed by the publisher.
Research integrity at Frontiers
Learn more about the work of our research integrity team to safeguard the quality of each article we publish.