 Boyuan Zhu
 Jianghui Meng1,2*
- 1School of Geosciences, Yangtze University, Wuhan, China
- 2Hubei Cooperative Innovation Center of Unconventional Oil and Gas, Yangtze University, Wuhan, China
Porosity, total organic carbon content, brittle mineral content, and gas content are now the primary references for classifying and evaluating marine shale gas reservoirs in China. Is there a more effective and appropriate reservoir classification scheme for deep marine shale? The Longmaxi Formation in Luzhou, southern Sichuan Basin, China, is the main object of study. Quantitative analysis and modeling using data from field emission scanning electron microscopy, nitrogen adsorption, and logging were used to characterize organic matter (OM) pore multi-scale development and reveal the relationship between OM pore and the high-quality reservoirs. Microscopic and macroscopic indications from OM pores show that a large number of OM pores were developed in high-quality reservoirs. OM surface porosity occupancy of the high-quality reservoir in the Luzhou area was more than 60%. OM porosity occupancy was more than 50%. The nitrogen adsorption–desorption hysteresis loops demonstrate the development of bottleneck and wedge-shaped OM pores. Characterization of multi-scale pore structure by box dimension, pore volume and specific surface area. It is found that the key to the formation of high-quality reservoirs was the massive development of OM mesopores in siliceous shale and the relatively homogeneity structure, which was conducive to the enrichment and migration of shale gas. Furthermore, the improved model decreased the relative error in predicting the OM porosity by about 32.5%. The use of OM porosity occupancy for high-quality reservoir classification was better, and the results were consistent with geological understanding. OM porosity occupancy showed that the area from Lunanxi to Luzhou to Rongchang to Jiangjin was the key exploration area for high-quality reservoirs in southern Sichuan. This study is expected to provide a new idea for OM pore modeling analysis and deep marine shale gas reservoir classification.
1. Introduction
Currently, the (ultra) deep shale gas favorable areas are mainly concentrated in the southern and southeastern regions of the Longmaxi Formation in the Sichuan Basin, with representative areas such as Luzhou, Yongchuan, and Dingshan (Guo et al., 2020; Liu et al., 2021; Lu et al., 2021). When compared to the middle or shallow areas, the differences in reservoir characteristics in deeper areas are focused on porosity and gas content. As deep shale occurs in an environment with relatively high temperatures and pressures, the reservoir pressure coefficient is high. Although the formation of overpressure has the function of protecting pores, it cannot resist the decrease in pores induced by compaction (Hu et al., 2022; Nie et al., 2022). Overall, the deep porosity of the Longmaxi Formation is smaller than that of the shallow and middle layers. Along with the increased thermal evolution, the deeper shale contains more gas than the shallow and middle shale (Zhang et al., 2021).
Porosity, total organic carbon content (TOC), brittle mineral concentration, and gas content are the main criteria for classifying and evaluating marine shale gas reservoirs in China (Hu et al., 2019). A high-quality reservoir (Type I) has porosity ≥5%, TOC ≥ 3 wt%, brittle mineral content ≥55 wt%, and gas content ≥3 m3/t according to the internal and industry standards of China Petroleum (Zhao et al., 2016; Hu et al., 2019; Zhang et al., 2021). It is used for target design. Non-quality reservoirs are classified as effective shale reservoirs (Type II) and prospective shale reservoirs (Type III), which are utilized for reserve calculation decision-making and calculating proven reserves, respectively (Ma et al., 2020). However, only shallow and middle formations are subject to this quantitative classification criterion. Since the porosity and gas content of deep shale differ greatly from those of the middle or shallow formations. Chinese researchers have yet to create quantitative criteria for the classification of deep shale reserves based on these four parameters. Furthermore, lithofacies division determines the high-quality reservoir of the Longmaxi Formation. The dominant lithofacies of the Longmaxi Formation is siliceous shale, which has the highest reservoir quality and the most developed OM pore network (Jia et al., 2021; Wang et al., 2022; Zhang et al., 2022).
The predominant pore type of marine shale in southern China is OM-hosted pores (Borjigin et al., 2021). OM-hosted pores have become dominant, particularly in deep shale pore systems (Liu, 2021). In a deep shale formation, when the temperature and pressure increase, the degree of thermal evolution also increases, accelerating the development of the OM pore space (Inan et al., 2018). Therefore, the quantitative study of OM pore development characteristics in deep shale pore systems becomes important for the formation of high-quality reservoirs. SEM can be used to effectively observe the development of OM pores, pore morphology, and distribution (Chalmers et al., 2012; Sun et al., 2022a,b,c). Quantitative analysis of pore structure in microscopic images by surface analysis techniques (Sun et al., 2019; Garum et al., 2020). The pore volume (PV) and specific surface area (SSA) can be obtained by experiments such as low-temperature gas adsorption to reveal the methane gas behavior (Jiang et al., 2016; Sun et al., 2022a,b,c). The most frequently used method for predicting OM porosity is based on SEM models to determine the OM porosity (Li et al., 2014; Chen et al., 2018; Zhang et al., 2018; Zhu et al., 2022). However, SEM was unable to extract the surface area of the micropores, resulting in low OM porosity predictions. Furthermore, the parameters in the chemical kinetic technique to determine the OM porosity model (Chen et al., 2014) are more difficult to obtain and only apply to reservoirs where OM pores are not developed. The indirect estimation of OM pore space by the NMR method (Ge et al., 2016), whose reliability still needs to be improved (Zhao et al., 2022).
The deep shale of the Longmaxi Formation in the Luzhou area of southern Sichuan is selected as the research object. Low-temperature gas adsorption, microscopic imaging technology, and logging technology are used to perform quantitative analysis and modeling of OM pore space, and to describe the multi-scale characteristic pattern of OM pore development (Figure 1). The relationship between OM pore development and high-quality reservoir characteristics is studied from both micro-and macro-scale perspectives (Figure 1). Finally, the quantitative criteria for classifying high-quality reservoirs established based on OM pore development characteristics (Figure 1). When the high-quality reservoir is divided by OM porosity occupancy, it becomes more continuous and efficient. Additionally, it is accurately predicting the distribution of core exploration areas for high-quality reservoirs in southern Sichuan. In comparison to porosity, brittle mineral content, and TOC, the OM pore classification scheme is more appropriate to the deep shale gas reservoir of the Longmaxi Formation. The quantitative characteristics of OM pore development serve as the basis for the classification of deep shale reservoirs, in order to provide a new idea for the classification of deep marine shale gas reservoirs with very developed OM pores.
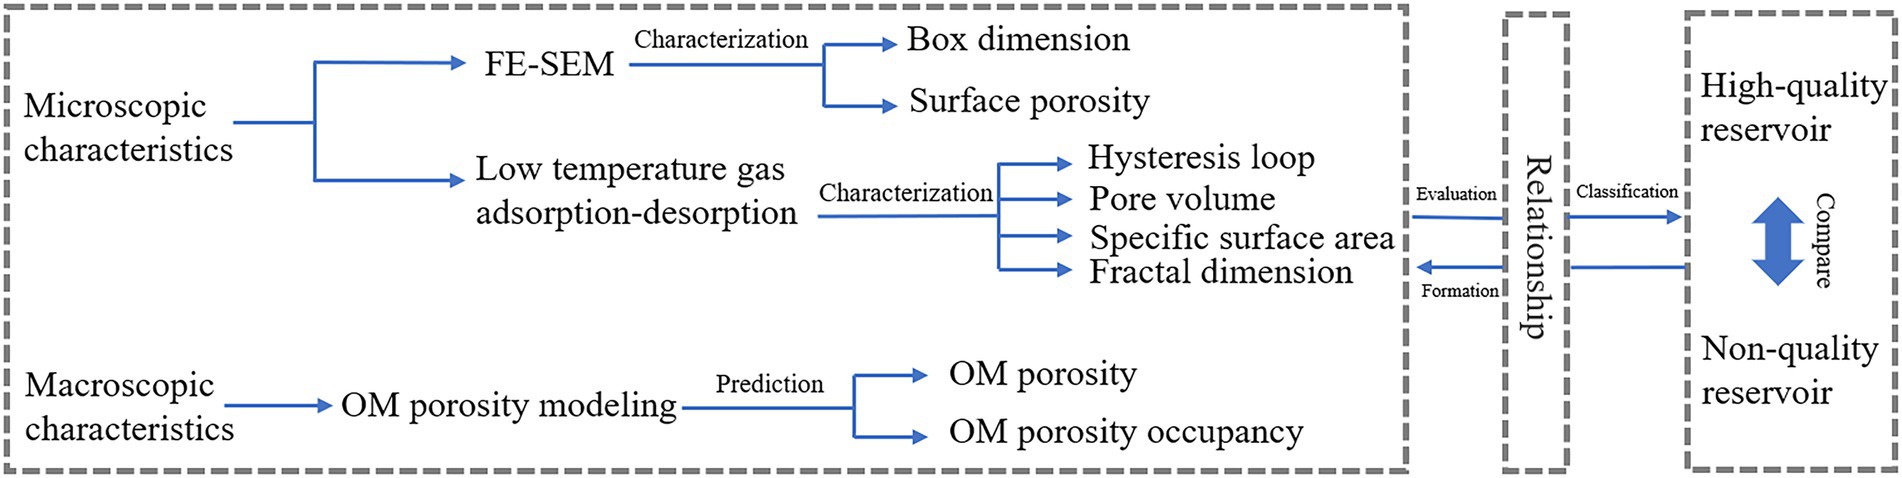
Figure 1. Diagram of study based on OM pore space development characteristics.
2. Samples and methods
The main samples are from the Luzhou Block in the southern region of the Sichuan Basin, China. Their reservoir burial depths generally range from 3,500 to 4,500 m (Figure 2), and become progressively deeper from north to south (Guo, 2021). Samples are selected from 14 silty and siliceous shale (Table 1) located in the sublayers 1–4 of the 11th sub-segment of the Longmaxi Formation of the Lower Silurian. Among them, eight OM-rich siliceous shale are among the best lithofacies for shale gas exploration in Sichuan Basin. Compared with silty shale, siliceous shale has better parameter characteristics than silty shale (Table 1; Figure 2).
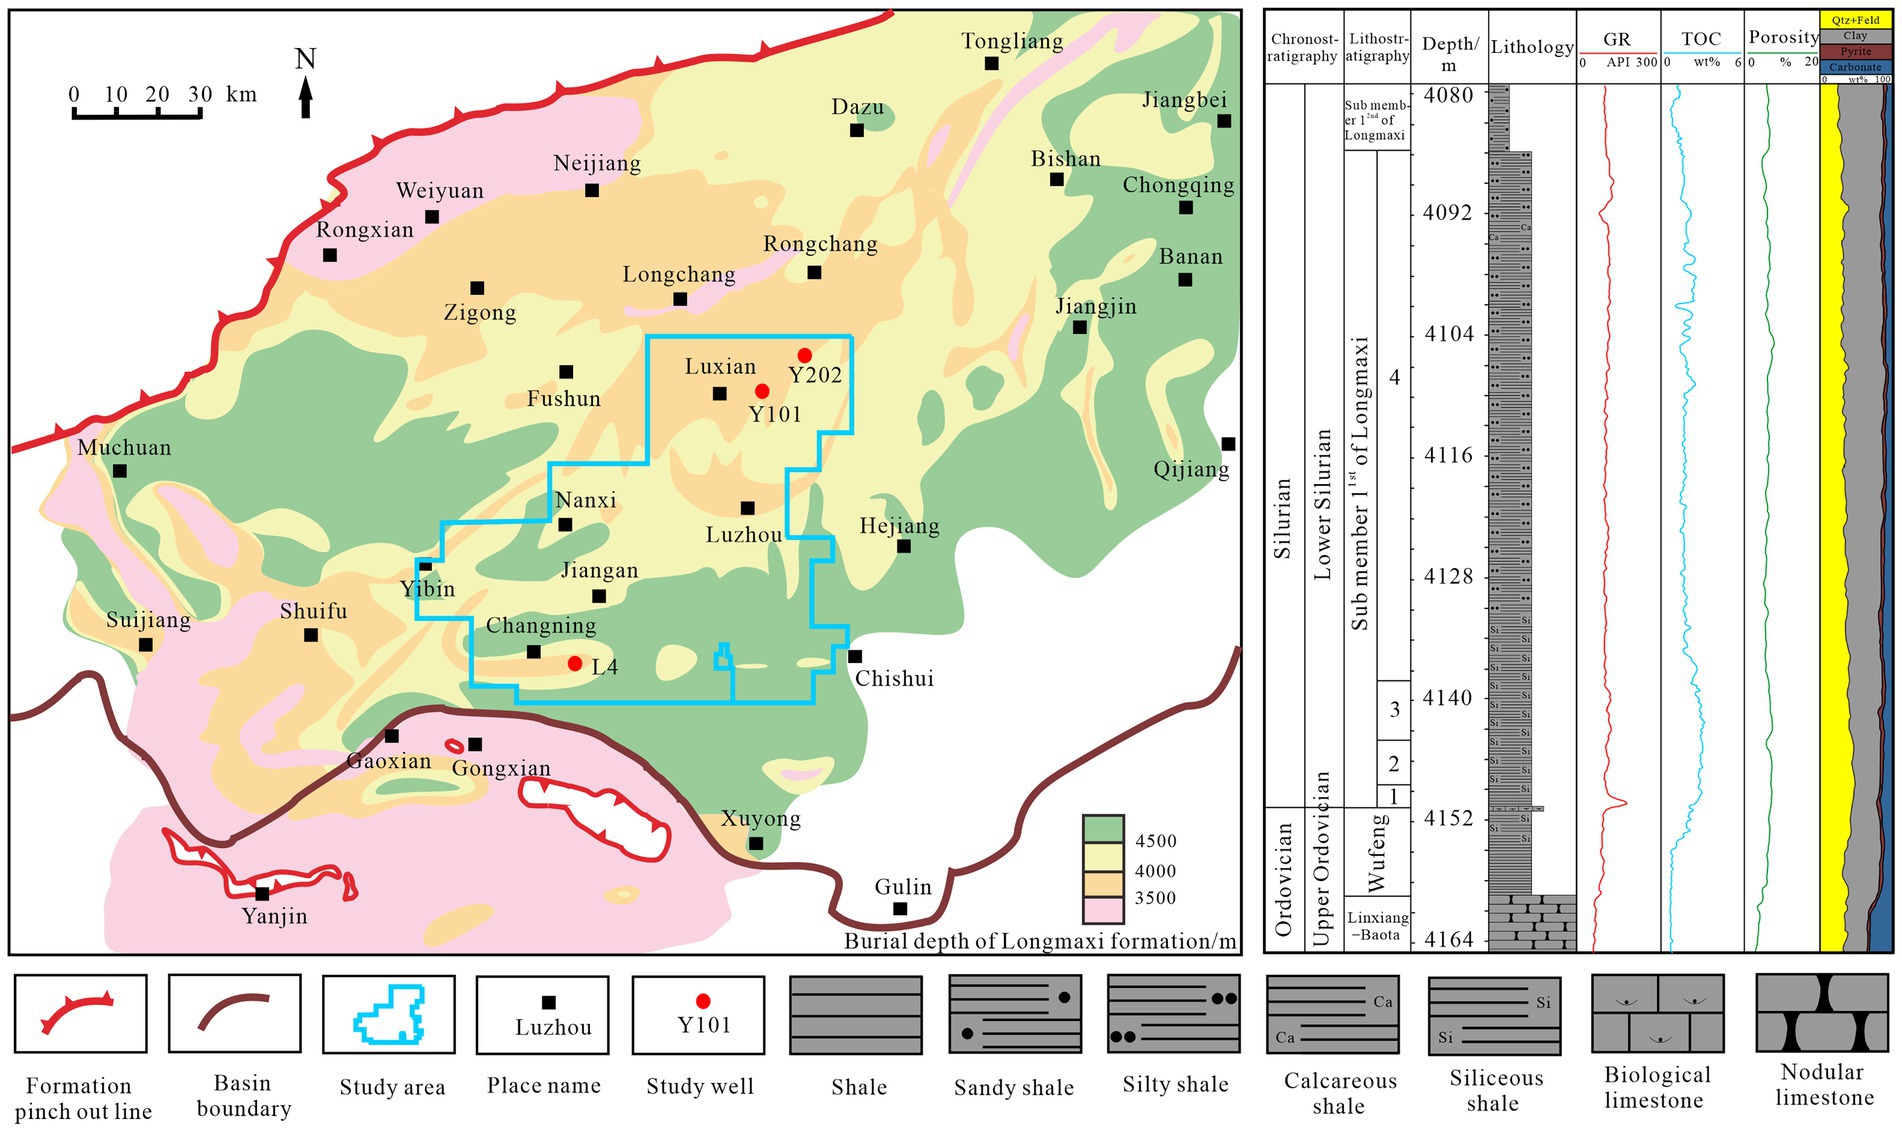
Figure 2. Location of the research area in southern Sichuan of Sichuan Basin (Ma et al., 2020) and formation histogram of Y101 of research well.

Table 1. Shale sample parameters.
Deep samples show a higher TOC, a lower total porosity (φt), and a higher gas content than shallow and middle samples (Table 1) (Zhu et al., 2019). The relative enrichment of OM and natural gas in deep samples suggests that the organic matter pore space in deep shale is more developed.
2.1. SEM image analysis technology
Shale samples from the Luzhou region were examined by FE-SEM to determine their pore structure. The experimental instruments were a LeicaRES102 ion polisher and a ZEISS high-resolution FE-SEM. Then, the entire shale surface was argon ion-polished with an ion polisher to make the sample surface smoother. This FE-SEM is generally equipped with a 1.2 kV working voltage and 0.4 nA current with a working distance of 3.6 mm.
2.1.1. Threshold segmentation of the gray image
For each sample, 2–5 images with a width of 1,024 pixels and a height of 711 pixels were selected, and multiples of approximately 10 KX were used for statistics. All the statistical results of a single sample must be accumulated to obtain the pore surface information elements. Firstly, threshold segment of the photos were set to obtain key element information. As an illustration, sample Y101-5 (Figure 3) is set as an 8-bit grayscale image with grayscale values between 0 and 255. Then, according to the gray value, the OM area, OM-hosted pore area, and inorganic matter area of the image were segmented and extracted (Figure 3).
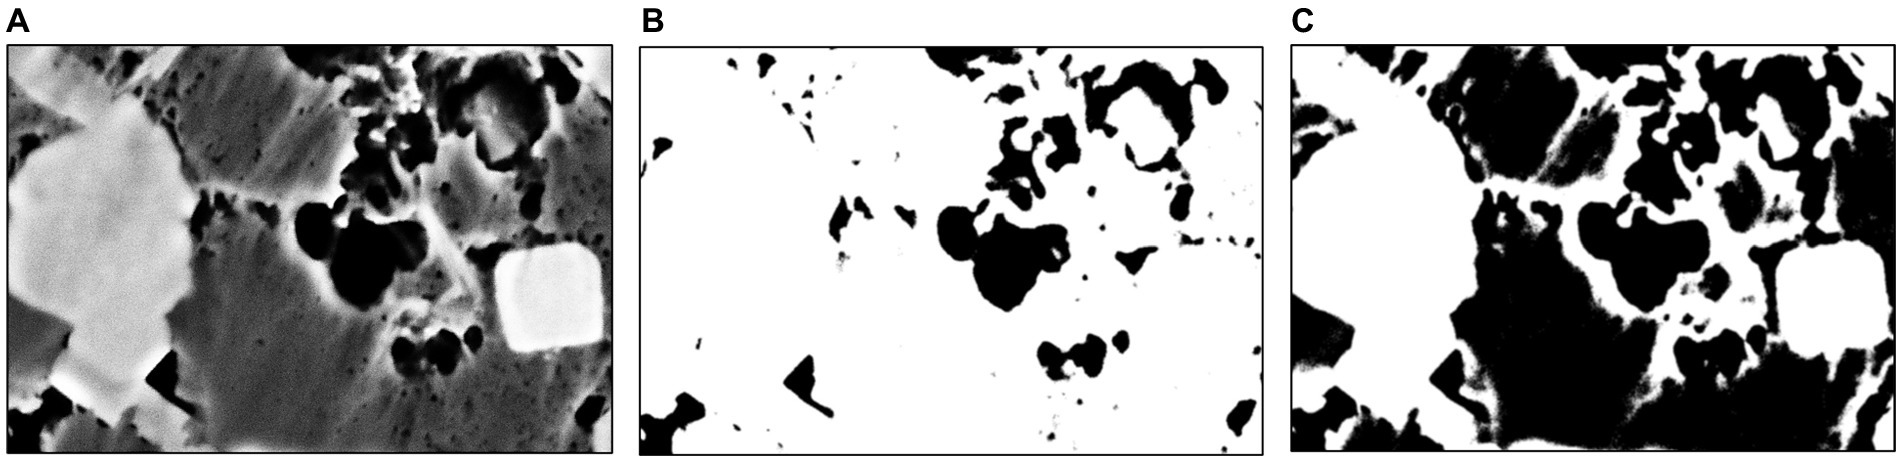
Figure 3. FE-SEM image analysis of the Y101-5 sample. (A) Original image, (B) Gray threshold segmentation of OM-hosted pores, threshold 30, (C) Gray threshold segmentation of OM and OM-hosted pores, threshold 100.
2.1.2. Box dimension
The shape and roughness of the OM-hosted pore surface can be quantitatively evaluated using the box dimension method on FE-SEM images. The box dimension method is based on the relationship between the number of boxes required to fill the OM-hosted pores and the constant scaling box size (Smith et al., 1996). The box dimension can be defined as
where Nδ is the number of boxes needed each time to cover the material in two dimensions and δ is the box size (nm). By continuously reducing the size of the cube box and recording the number of boxes of different sizes required to completely cover the pore structure, a linear fitting between the two was established in the logarithmic coordinate system, where the box dimension is the absolute value of the slope (Panigrahy et al., 2019). The box dimensions can then be obtained from the following equation:
The FE-SEM image of sample Y101-1, for instance, was binarized to display OM pores (Figure 4). Then, the decreasing box size was used to calculate the number of boxes needed to fill the pores of the OM (Figure 4). Finally, 100 data points were counted on a logarithmic scale. The slope was the box dimension, according to the linear connection between the number of boxes required to fill the OM-hosted pores and the continually scaled box size (Figure 4). Grayscale images of mesopores and macropores are obtained through particle size analysis, and then box dimensions are estimated, respectively (Figure 4).
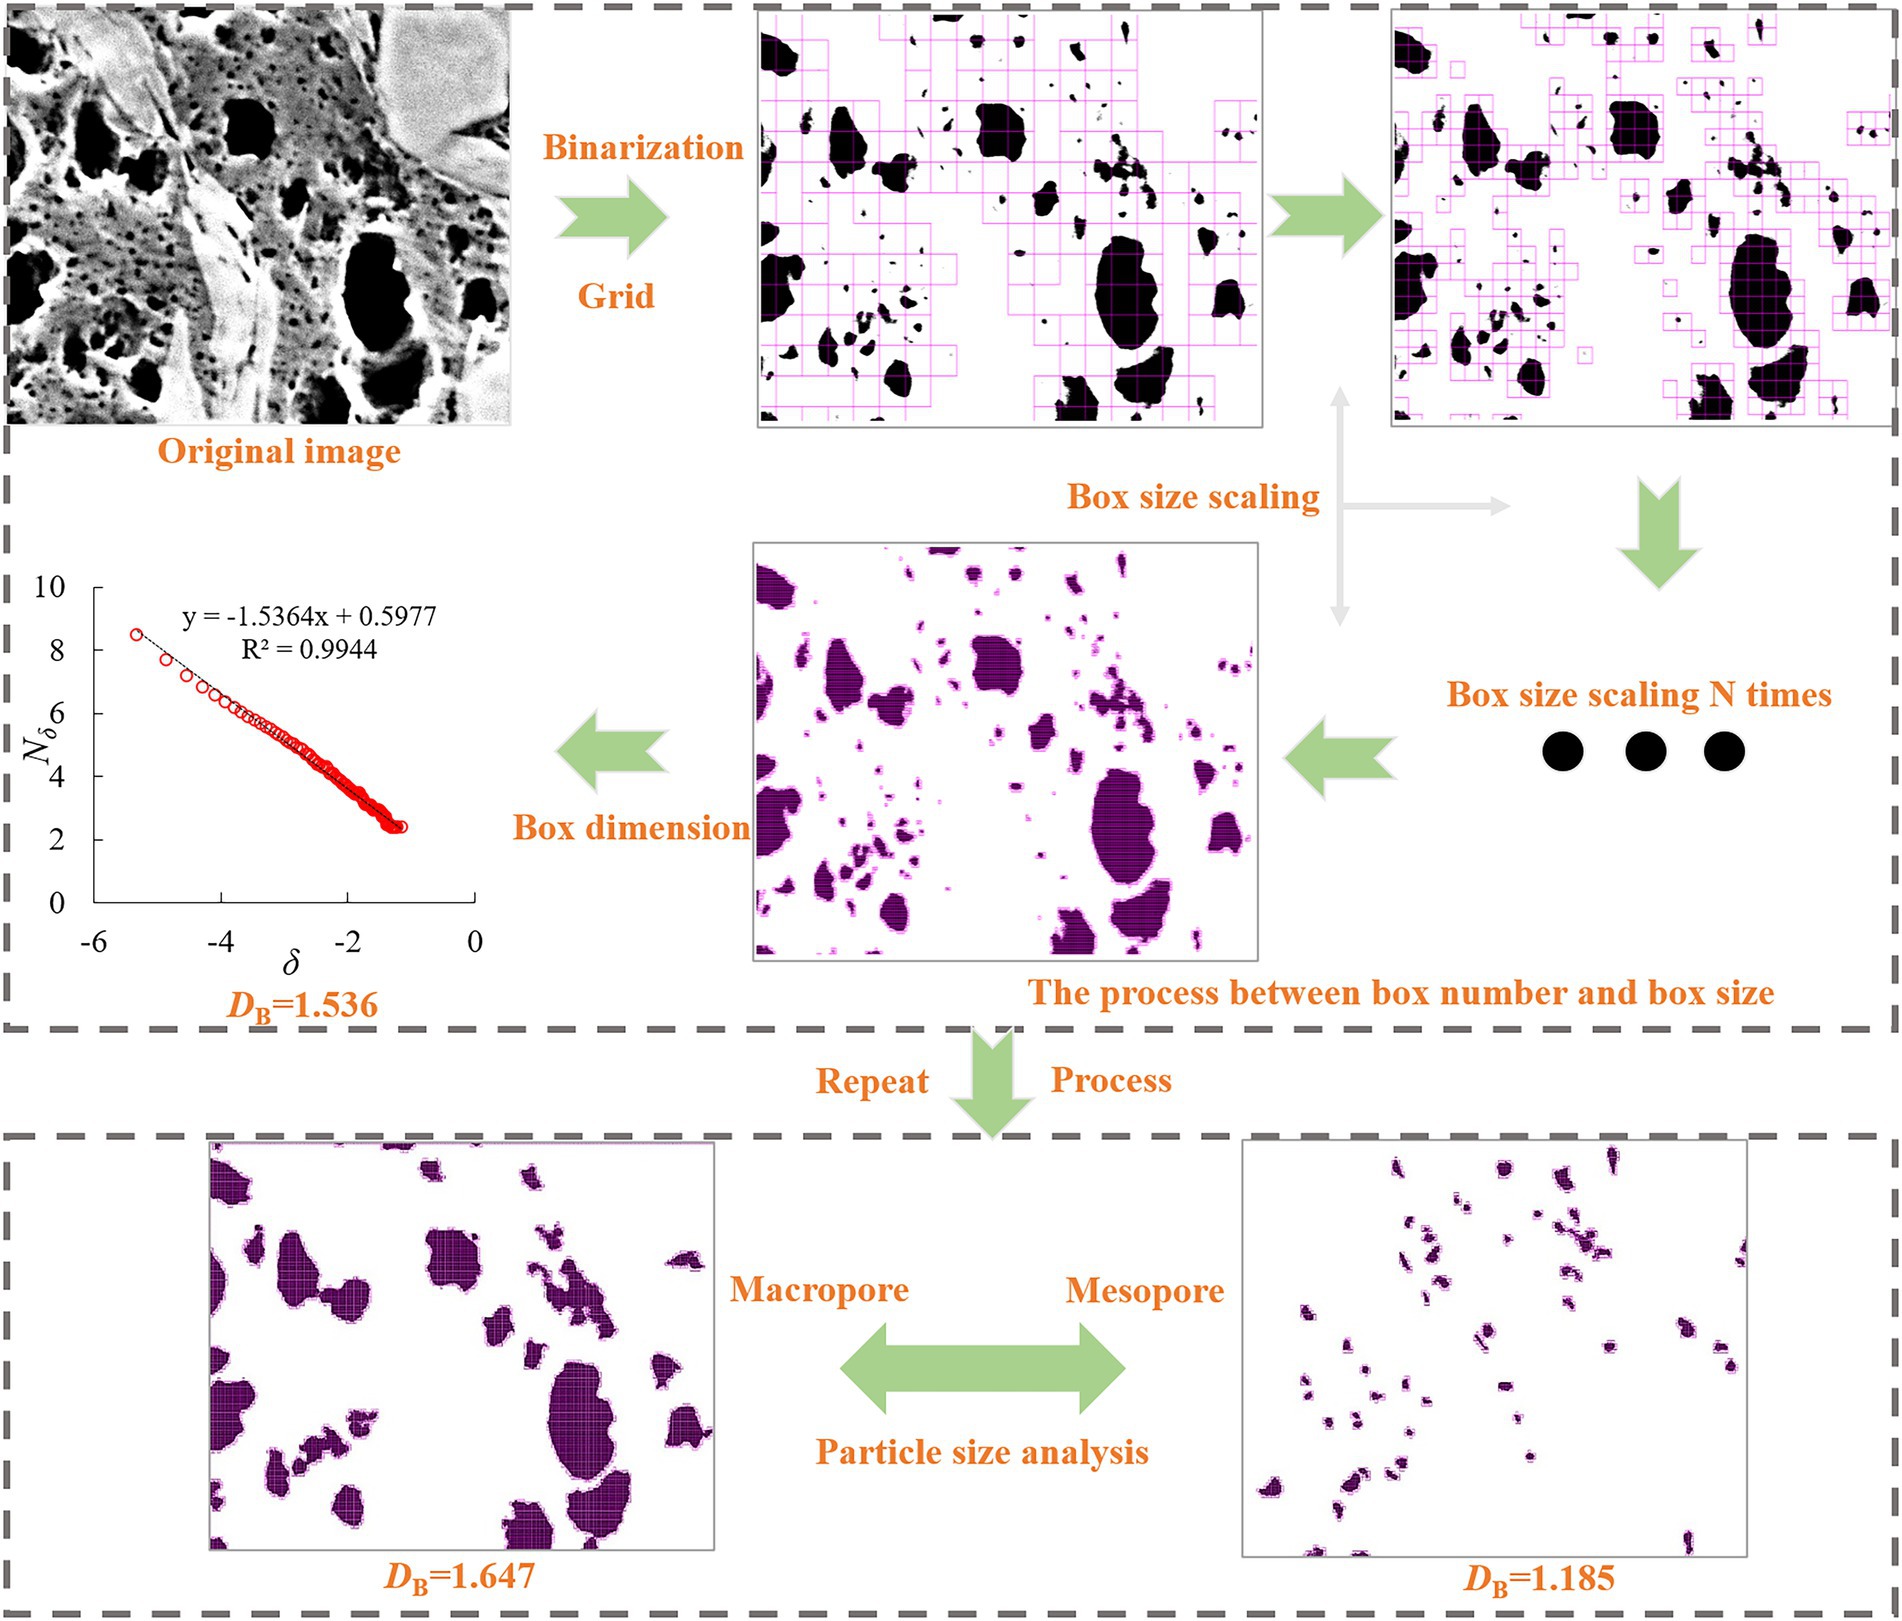
Figure 4. Schematic of the box dimension of the Y101-1 sample.
2.2. Low-temperature adsorption experiments
A Quantachrome Autosorb-IQ3 specific surface and pore size distribution analyzer was used to perform a specific surface test for the low-temperature N2 adsorption experiment. The measuring aperture range of the instrument was 0.35–400 nm, and the minimum measurable SSA was 0.0005 m2/g. The N2 adsorption amount was obtained by measuring the sample under equilibrium vapor pressure at a low temperature (77 K) and low pressure. Subsequently, using the BET theory, a relative pressure (p/p0) of 0.05–0.35 MPa was used to determine the SSA of shale (Zhang et al., 2015). The equivalent PV can then be calculated using the BJH model at various relative pressures based on the volume of liquid nitrogen injected into pores of various sizes (Liu et al., 2018). The relationship between the nitrogen adsorption quantity and relative pressure can be used to define the development properties of mesopores.
2.3. OM porosity model
OM porosity is closely related to OM content, and the model can be expressed as:
where φorg represents the shale OM porosity (%), Vorg represents the volume content of shale OM (%), and α represents the OM-hosted pore scale coefficient.
In Equation (4) (Sing, 1985), the relationship between the volume content of OM and the parameters associated with the OM porosity model discussed above can be represented as follows:
where K represents the kerogen conversion factor, and southern Sichuan is saprophytic type I kerogen, with a value of 1.2 (Zhang et al., 2018), TOC represents the dry weight of total organic carbon, %, ρ represents rock density, g/cm3, and ρorg equals 1.1 g/cm3 to reflect the density of OM.
OM-hosted pores are considered to be evenly distributed in the OM, and the fraction of OM-hosted pores in the OM (α) was the same in any cross-section of the reservoir. The OM-hosted pore area to OM area ratio may approximate the average value of numerous samples in the same layer. The OM porosity scale coefficient can be written as:
where Sφorg represents the OM-hosted pore surface area under an SEM, nm2; Sorg represents the OM surface area under the SEM, nm2; n represents the number of samples. Due to the limitation of SEM resolution, Sφorg can only extract the surface areas of mesopores and macropores. It is assumed that the PV contribution rate from micropores to macropores can be equivalent to the area contribution rate from micropores to macropores on the SEM image. Then the organic matter surface porosity (OMSP) of SEM micropores can be estimated from the total PV contribution. Then Equation (5) can be transformed into:
Where PV2 + 3 is the mesopore and macropore PV contribution rate, %. Equations (4) and (6) were applied to produce the final OM porosity model, as shown below.
3. Results
3.1. Microscopic characteristics of OM pore structure
3.1.1. FE-SEM characterization
As shown in Figure 5, the rock components are characterized by a significant proportion of brittle minerals and a negligible quantity of OM, clay minerals, and pyrite. A comparison between the two types of shale revealed that silty shale has much fewer OM and OM pores than siliceous shale (Figures 5A–D). As shown in Figures 5E,F, through microscopic magnification, cracks are common in inorganic matter pores, and irregular wedge-shaped and bottleneck-shaped elliptical pores are common in OM pores. Inorganic matter pores frequently had fissures visible under microscopic magnification, whereas OM pores frequently had irregular wedge-and bottleneck-shaped elliptical pores. In the OM pore system, the number of macropores is the lowest, followed by mesopores, and the number of pores smaller than about 10 nm is the highest (Figure 5F).
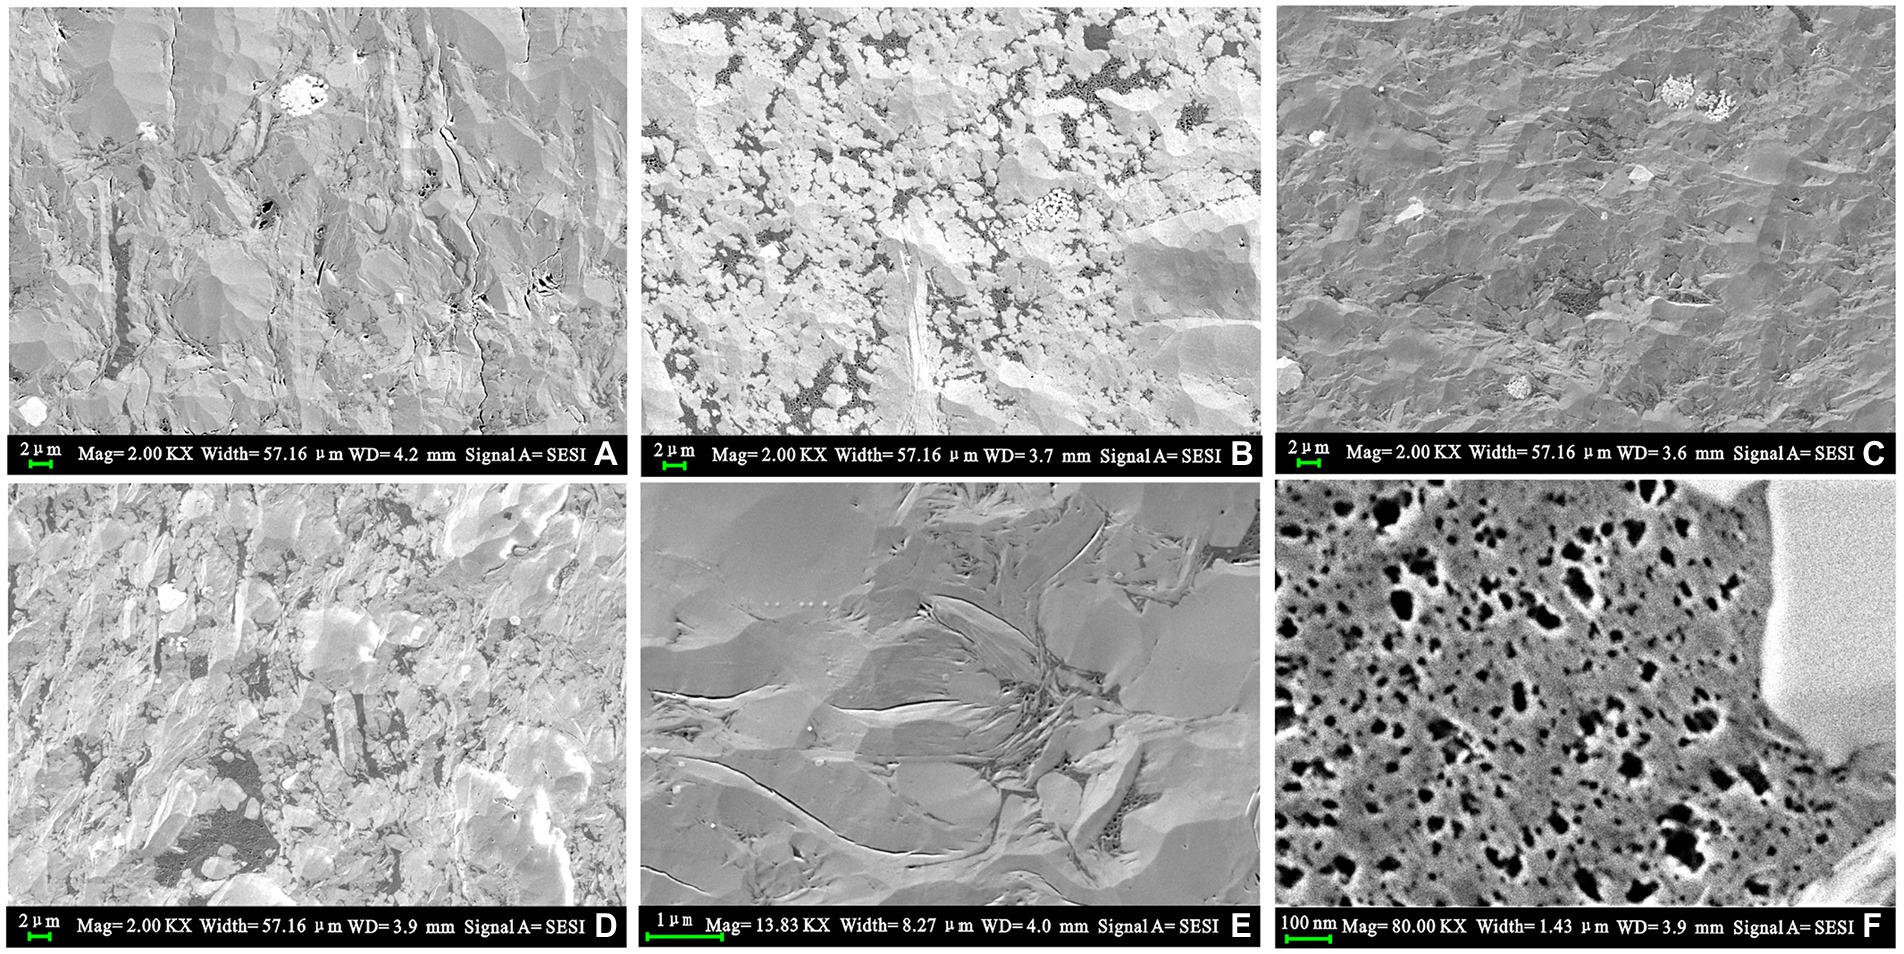
Figure 5. Microscopic characteristics of shale. (A) Sample L4-1 is silty shale with a TOC value of 1.74 wt%; (B) L4-3 is siliceous shale, with a TOC value of 4.95 wt%, (C) Y202-1 is silty shale with a TOC value of 2.56 wt%, (D) Y202-2 is siliceous shale with a TOC value of 5.47 wt%; (E) Y202-1 inorganic matter pores mainly develop fractures, and (F) Y202-2 organic matter pores mainly develop irregularities. Wedge-shaped and bottleneck shaped pores.
As shown in Table 2, the relationship between organic matter surface porosity (OMSP) and inorganic matter surface porosity (IMSP) obtained the value of OM surface porosity occupancy (OMSPO). Siliceous shale formed pores and was richer in OM than silty shale. Compared to silty shale, the OMSP and OMSPO were substantially greater (Table 2). The OMSPO of the silty shale was approximately 60%, and that of the siliceous shale was more than 70%. The OM pores accounted for approximately 30% of the total OM (Table 2).
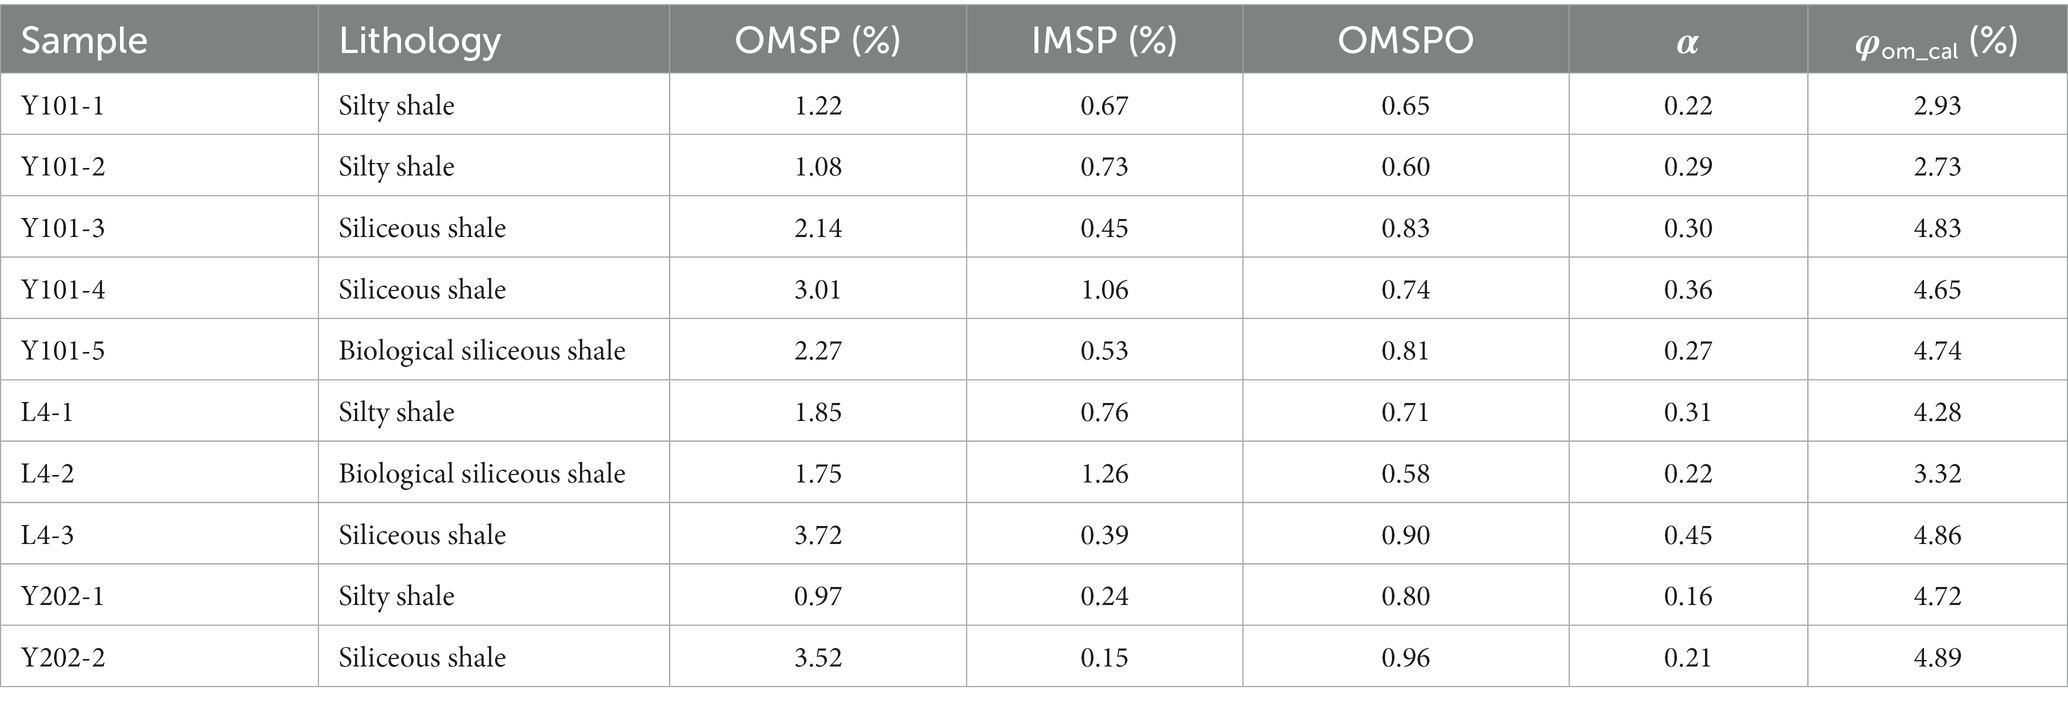
Table 2. Surface area parameters of the shale samples.
The calibrated value of OM porosity (φom_cal) can be obtained from the product of total porosity and OMSPO (Table 2; Yang et al., 2021). φom_cal can be used to measure the accuracy of OM porosity calculation results.
The box fractals of mesopores (DB2), macropores (DB3), and whole pores (DB4) are listed in Table 3. The smoother the organic matter pore surface, the simpler the structure tends to be as the pore size gradually decreases. The box dimension (DB) was changing with the pore size. DB showed that silty shale had a lower DB2 than siliceous shale. DB3 of silty shales and siliceous shales was almost unchanged, and DB4 of siliceous shales was less than that of silty shales (Figure 6). Therefore, it can be inferred that the difference between silty and siliceous shale is mainly determined by the structural characteristics of the mesopores, with the more developed mesopores (which may contain micropores) and homogeneous structure in siliceous shale causing a lower DB4 in siliceous shale.
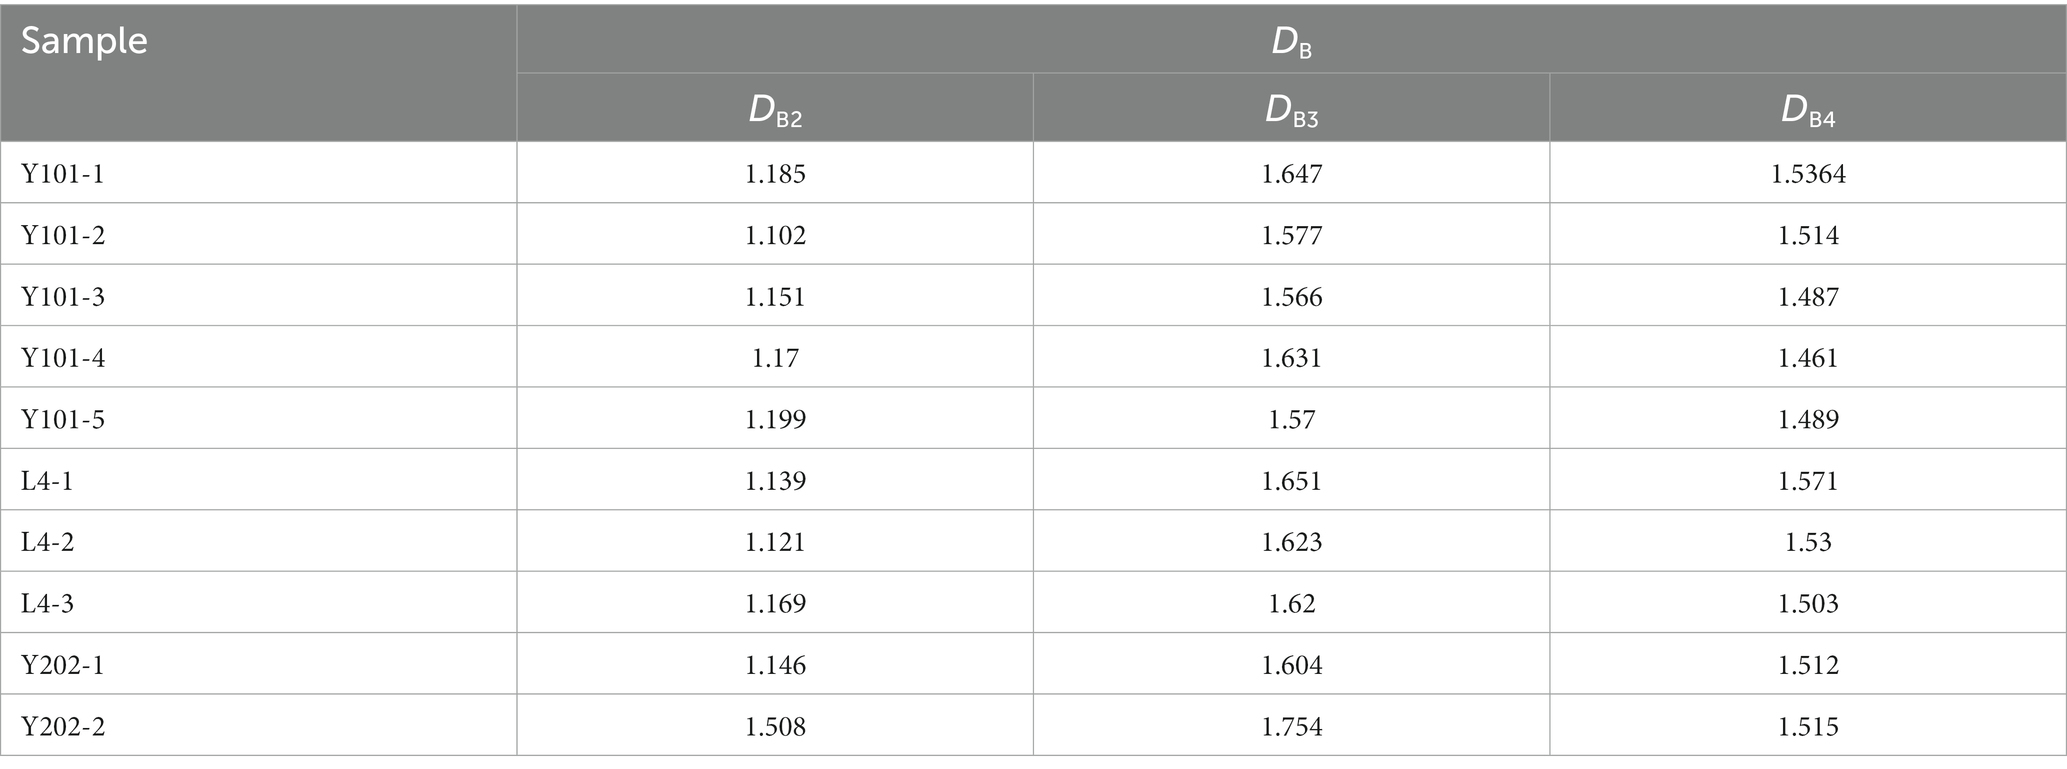
Table 3. Box dimension of shale samples.
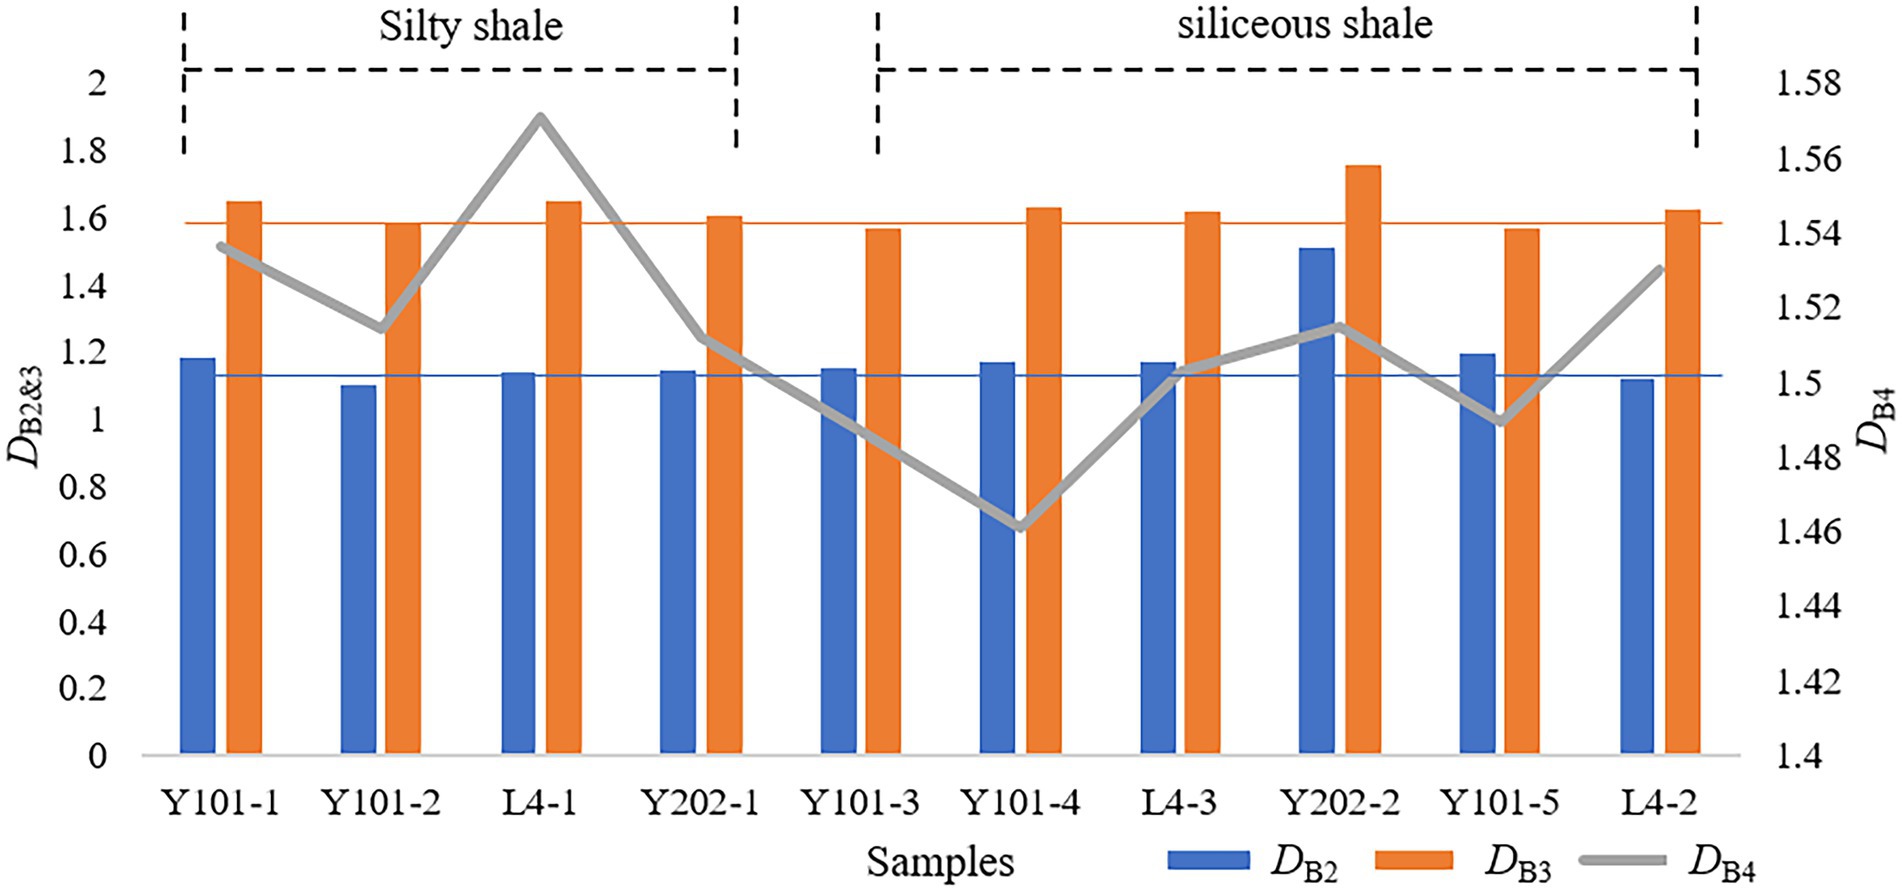
Figure 6. Full-scale box dimension of samples.
3.1.2. N2 adsorption–desorption hysteresis loop
The hysteresis loop composed of N2 adsorption–desorption is related to capillary condensation in the pores, so each type of hysteresis loop can express a structural feature of the pores. According to the IUPAC hysteresis line classification criteria (Carpentier et al., 1991), the hysteresis loops of all samples in Table 1 in the Luzhou area are between the H2 and H3 types (H2&3 for short) (Figure 7), which correspond to bottleneck pores and wedge pores, respectively. Figure 6 indicates that the adsorption curves of all samples rise slowly in the low-and medium-pressure regions of 0–0.8 and rise rapidly in the high-pressure region of 0.8–1.0, which is a typical H3 type. The desorption curve was flat at the beginning of the desorption branch and became steeper at moderate pressures with a wider hysteresis loop, a feature very similar to that of the H2 type. The pore structure of samples Y101-3, Y101-4, and Y101-5 (Figure 7) is an H2&3 type composite. The adsorption volume of this composite pore significantly increased, and the adsorption hysteresis loop was large, indicating that the pore structure was complex. In combination with the characteristics of the OM-hosted pore shape and N2 adsorption hysteresis loop shown in Figure 5, bottleneck and wedge-shaped OM pores were mainly developed in the Luzhou deep shale.
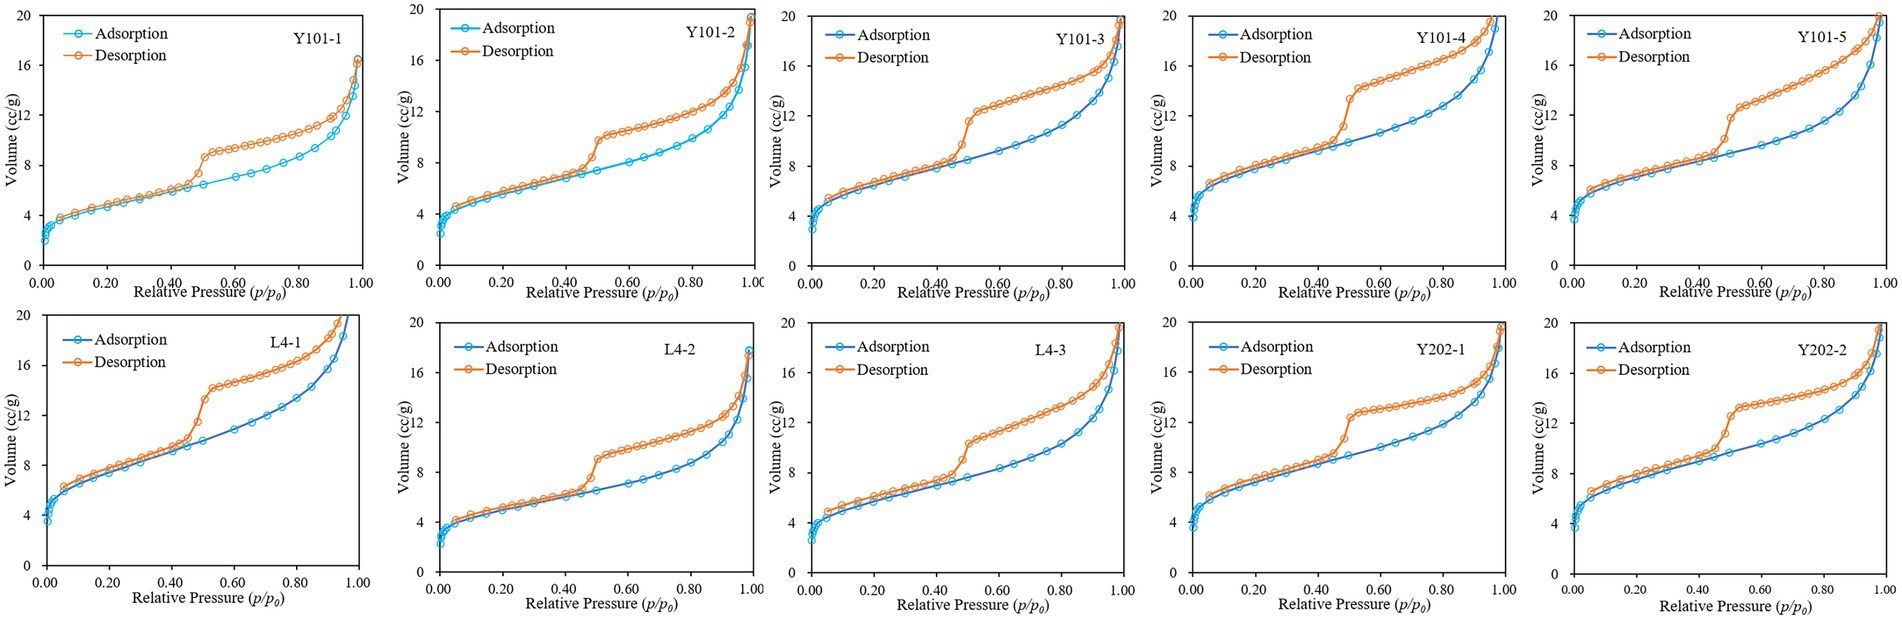
Figure 7. Characteristics of N2 adsorption–desorption.
3.1.3. Pore volume and specific surface area
According to the PV and SSA results, siliceous shale generally has a more developed pore structure than silty shale (Table 4). The mesopores and macropores contributed 49.3 and 28.9%, respectively, to the PV of the Luzhou deep shale. Micropores and mesopores contributed 74.5 and 24.7% of the SSA, respectively. As a result, the Luzhou region had the largest mesopore contribution to shale PV. Micropores still contribute the most to the SSA. This result is consistent with the pore structure parameters of deep shales such as Dazu and Yongchuan in southern Sichuan (Guan et al., 2016; Jiang et al., 2021).
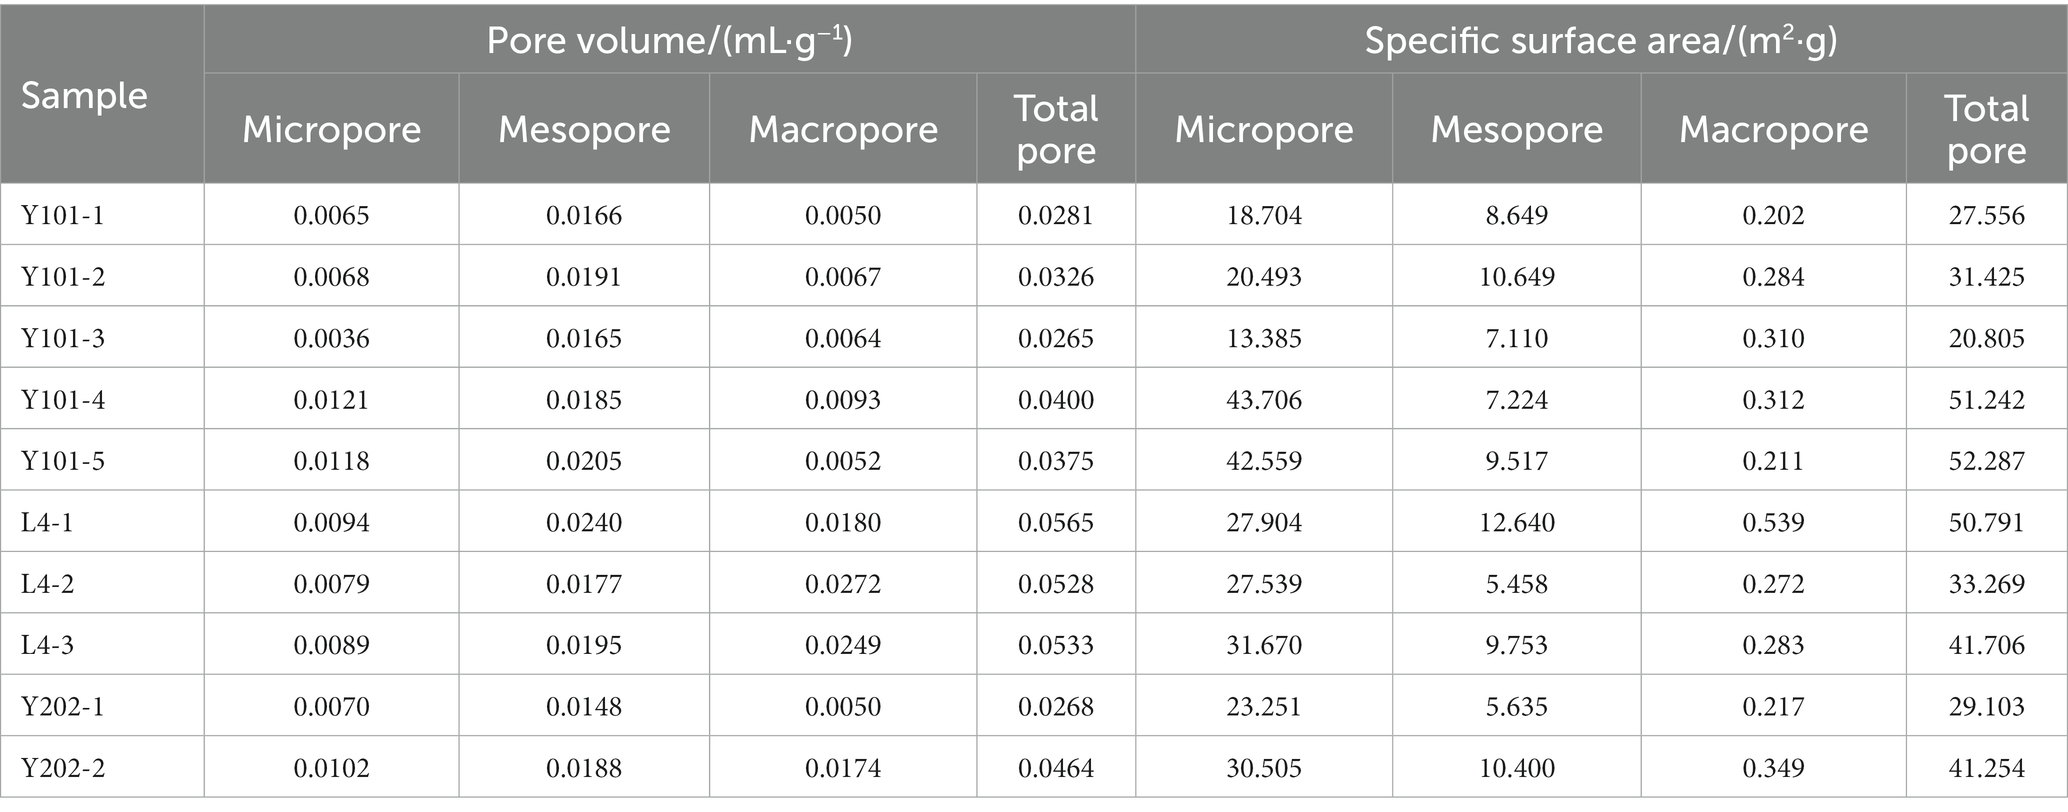
Table 4. PV and SSA of shale samples.
3.2. Shale OM porosity
3.2.1. Prediction results for OM porosity
Equation (7) depicts the method for estimating the OM porosity, which was calculated as 0.28 (Table 2). The random forest method (TOC M) was used to predict the TOC content. As can be seen from Figure 8, the results calculated by the original method (φoom) are compared with the OM porosity calculated by the SEM model with improved coefficients (φom1). φom1 agreed better with φom_cal, but φom1 was still smaller than φom_cal overall.
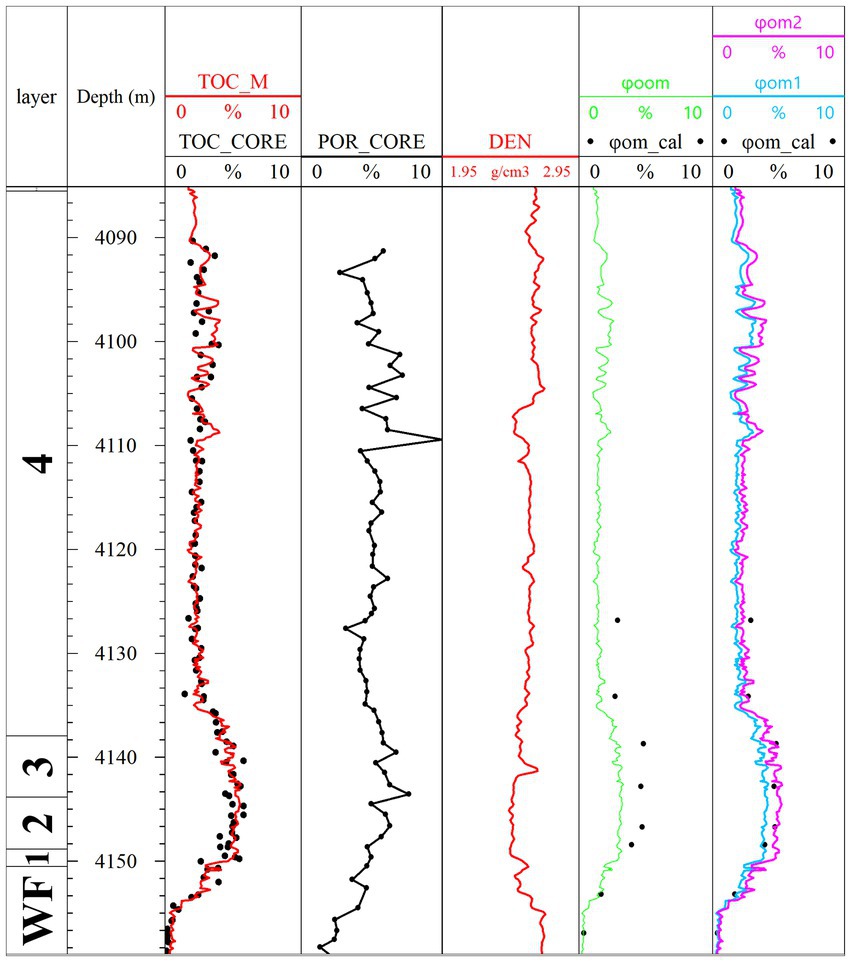
Figure 8. Calculation results of OM porosity of well Y101.
The error analysis reveals that the relative error between φoom and φom_cal was around 44.6% on average, while the relative error between φom1 and φom_cal was around 23.5% on average (Figure 9). For the error of φom1, increase 1.24 times for Equation (7). The OM porosity model can then be simplified from Equation (7) to φom2.
where DEN represents logging density, g/cm3.
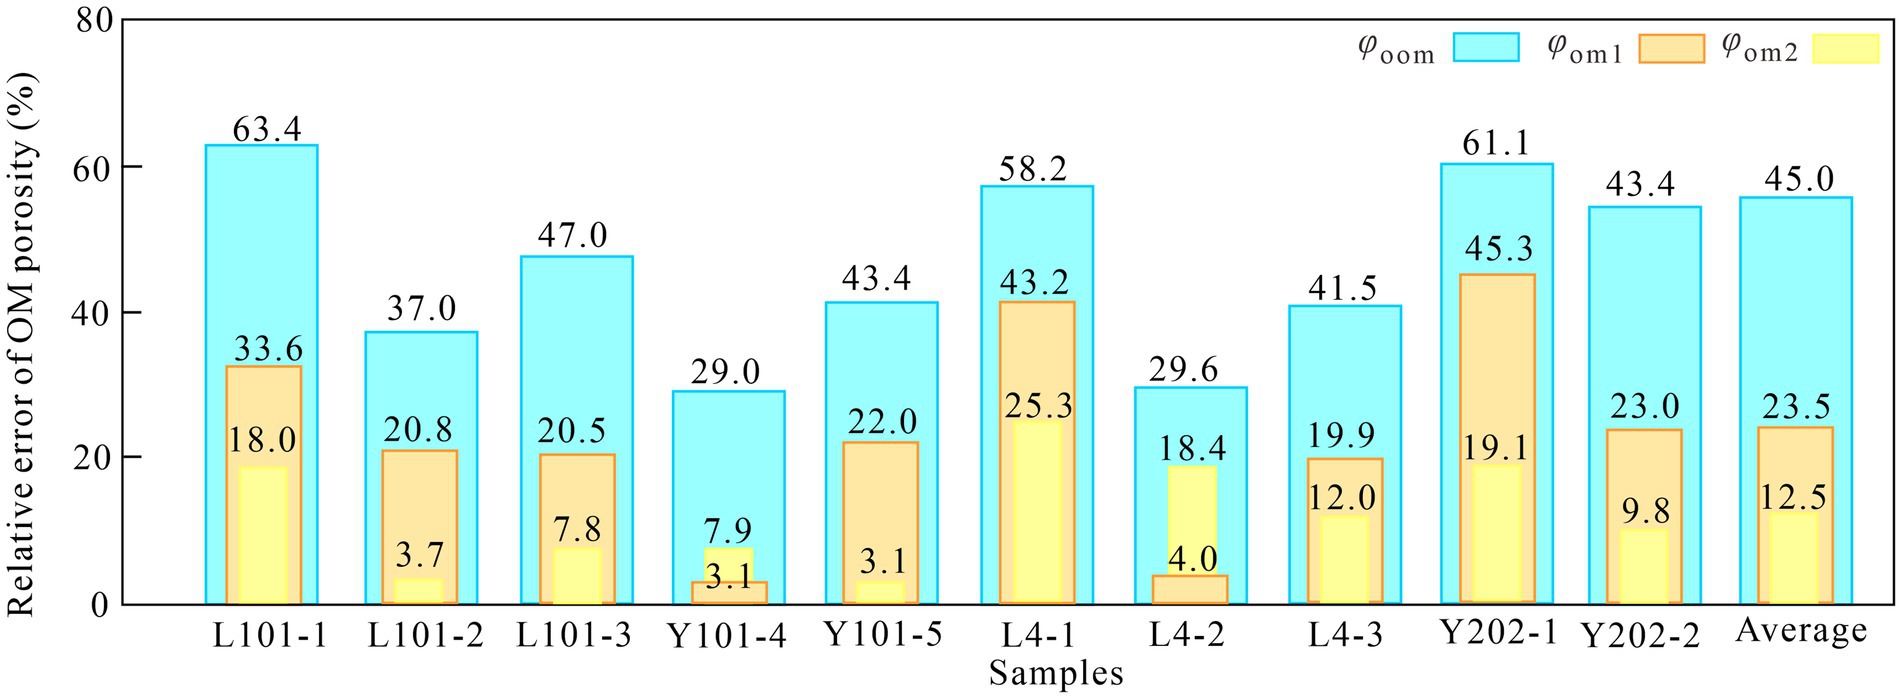
Figure 9. Relative error between OM porosity and calibration value.
The TOC content has a direct impact on the accuracy of the OM porosity measurement. There was good agreement between the measured TOC content (TOC_CORE) and the TOC content computed using machine learning (TOC_M) (Figure 8). As illustrated in Figure 8, the OM porosity calculated using the improved SEM model (φom) and calibrated OM porosity (φom_cal) were both positive. The results estimated using the original approach (φoom), φom, and φom were closer to the actual values (Figure 8).
In Figure 8, φom2 corresponds most closely with φom_cal. The relative error of φom2 was approximately 32.5% less than that of φoom (Figure 9).
3.2.2. Developmental characteristics of OM pores
From the relationship between OM porosity and total porosity, it was found that the organic matter porosity occupancy (OMPO) of high-quality shale was higher, mainly concentrated in sublayers 1–3 (Figure 8). OMPO is the proportion of organic porosity to total porosity. Therefore, the OMPO can be used to distinguish high-quality reservoirs.
According to the data of the OMPO of 8 wells in the Luzhou Block, the OMPO of silty shale composed of 4 sublayers was primarily below 50% (Table 5). However, 1–3 sublayers dominated by siliceous shale were predominantly greater than 50% (Table 5).
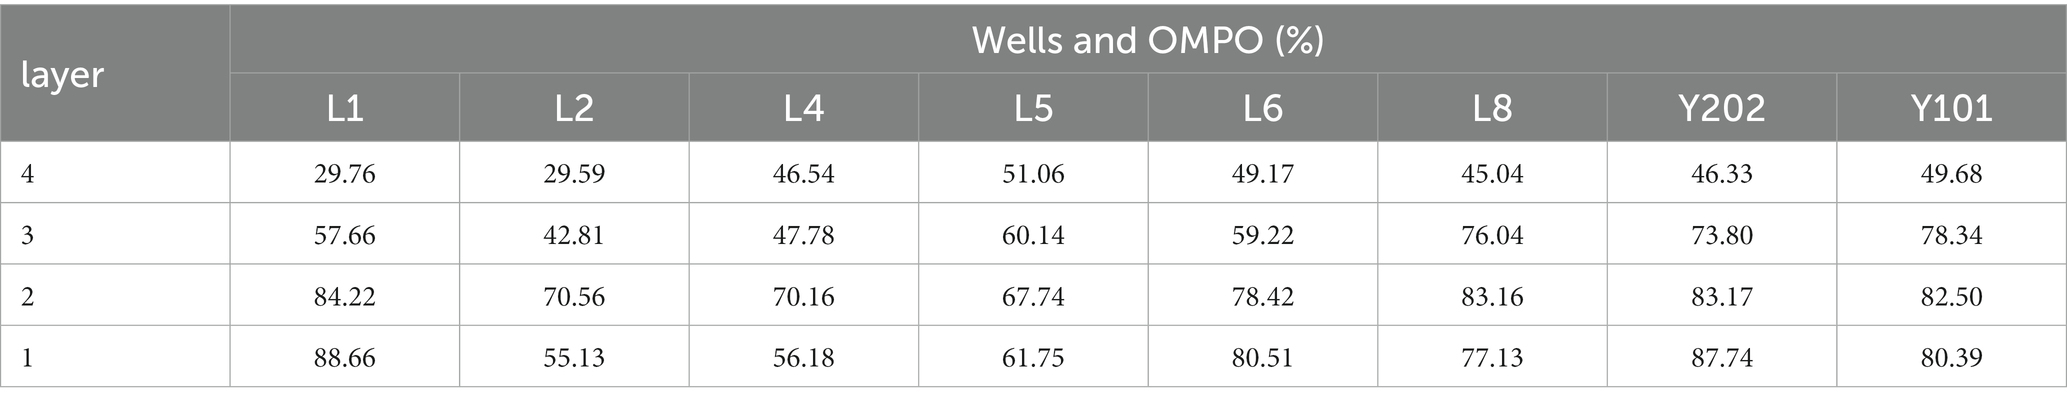
Table 5. OMPO of shale gas reservoir in Luzhou block.
OMPO of 50% was used as the baseline to delineate the high-quality reservoir (I) in the Luzhou Y101 well (Figure 10). OMPO classification results were consistent with TOC, porosity (POR), and brittle mineral content classification results (Figure 10). Meanwhile, the results of the OMPO classification were more continuous and more applicable to deep shale.
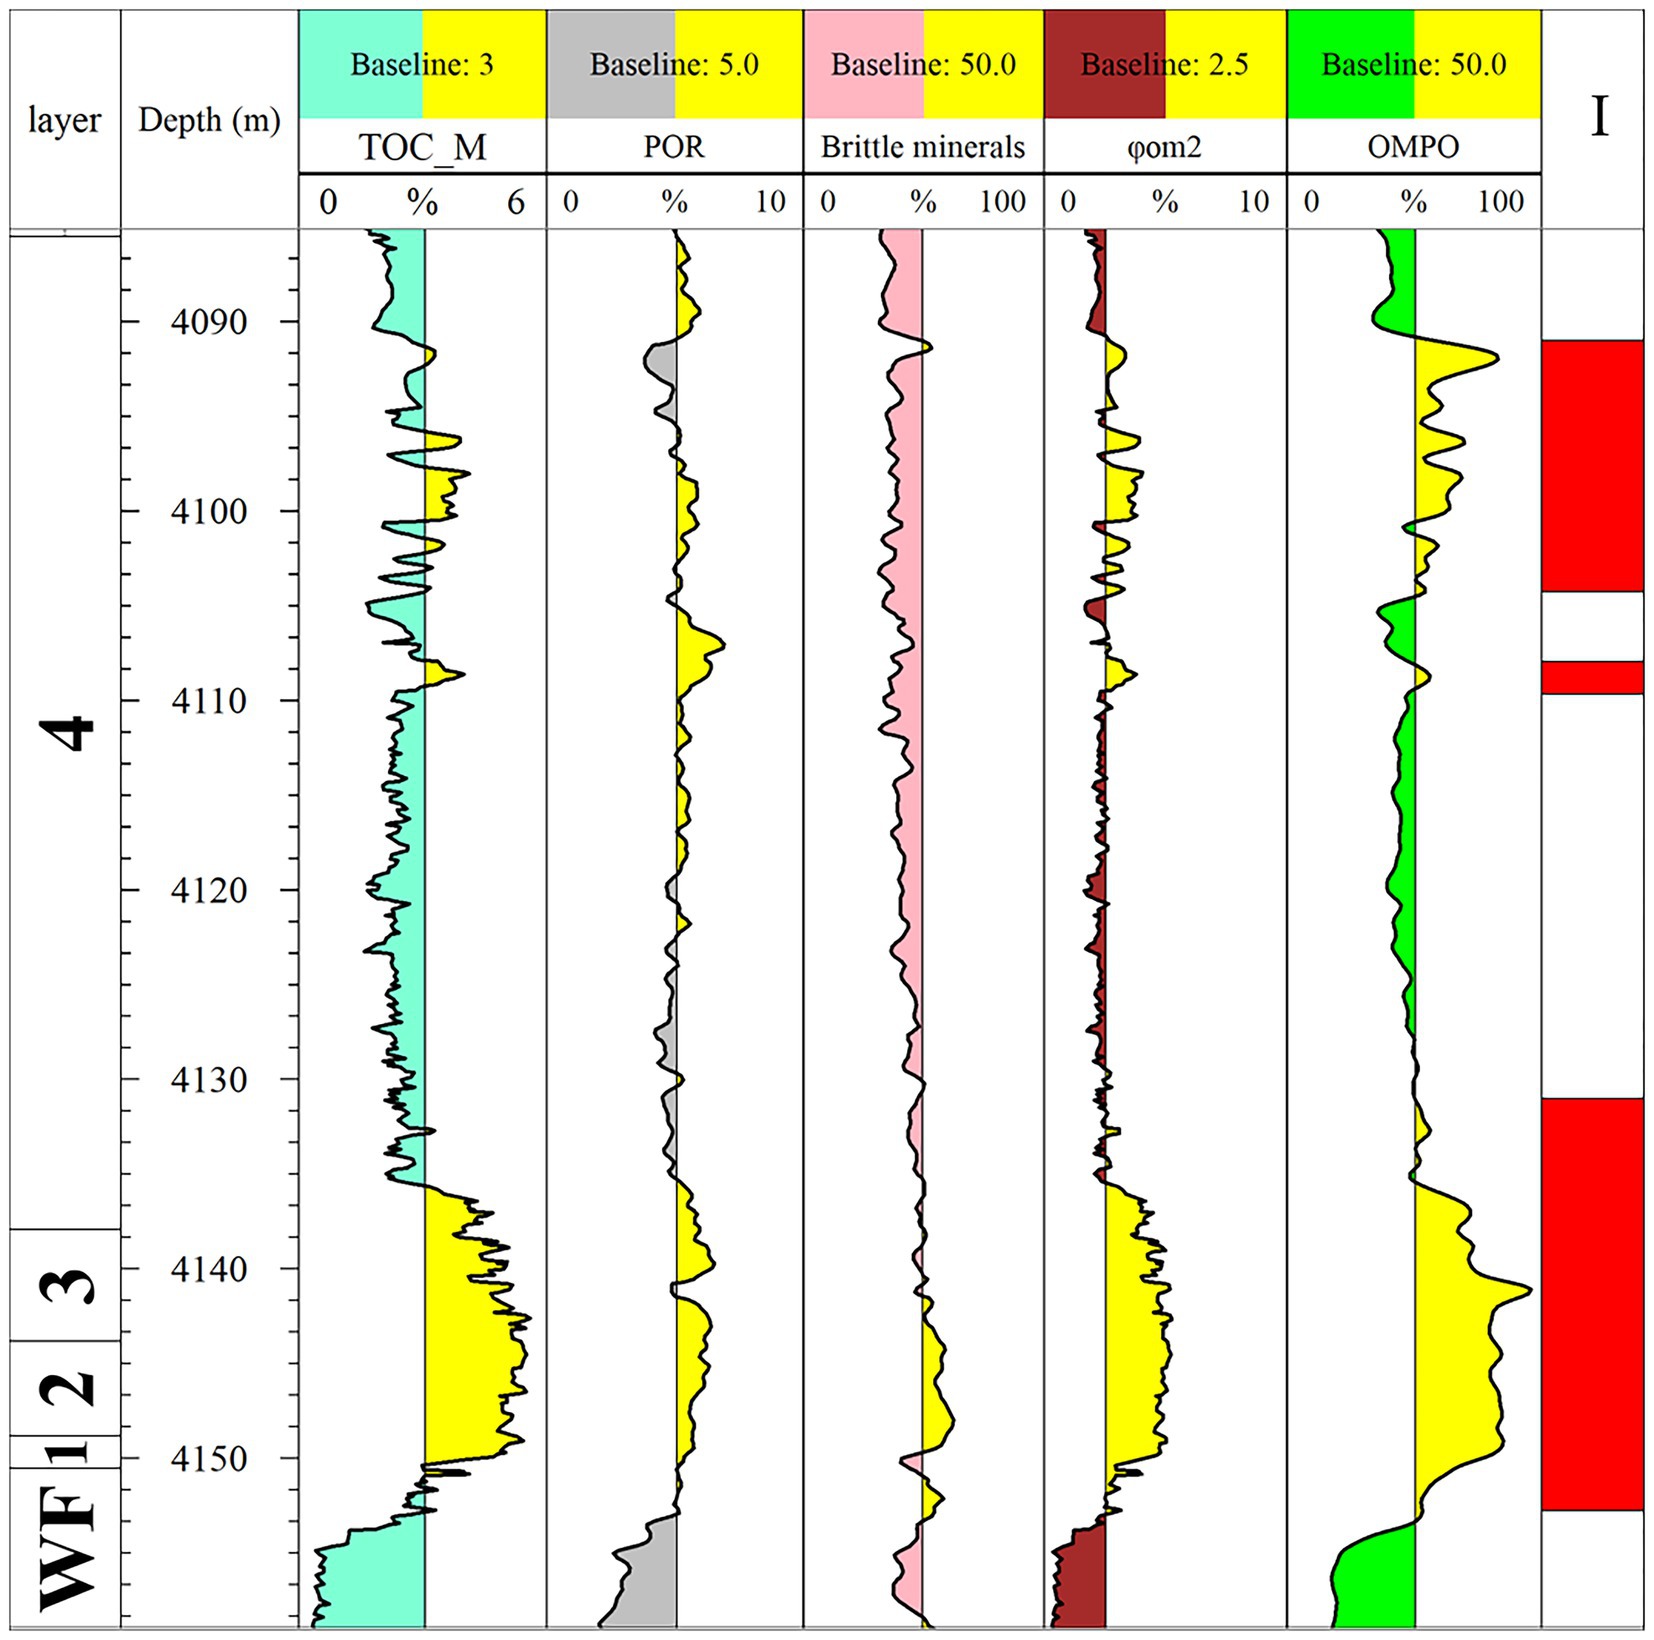
Figure 10. Division of high-quality reservoirs in Well Y101.
3.2.3. Om porosity distribution in high-quality reservoirs in southern Sichuan
The OM porosity of the siliceous shale reservoirs in the Dazu, Rongchang, Zigong, Luzhou, Yongchuan, and Hejiang areas was predicted. The Hejiang to Yongchuan area had the highest OM porosity, at about 4.5–5.5% (Figure 11A). It was followed by the Rongchang to Nejiang region, about 4.0–5.0% (Figure 11A). Therefore, the OM pore space is most developed in the deep central region and southeast region of southern Sichuan.
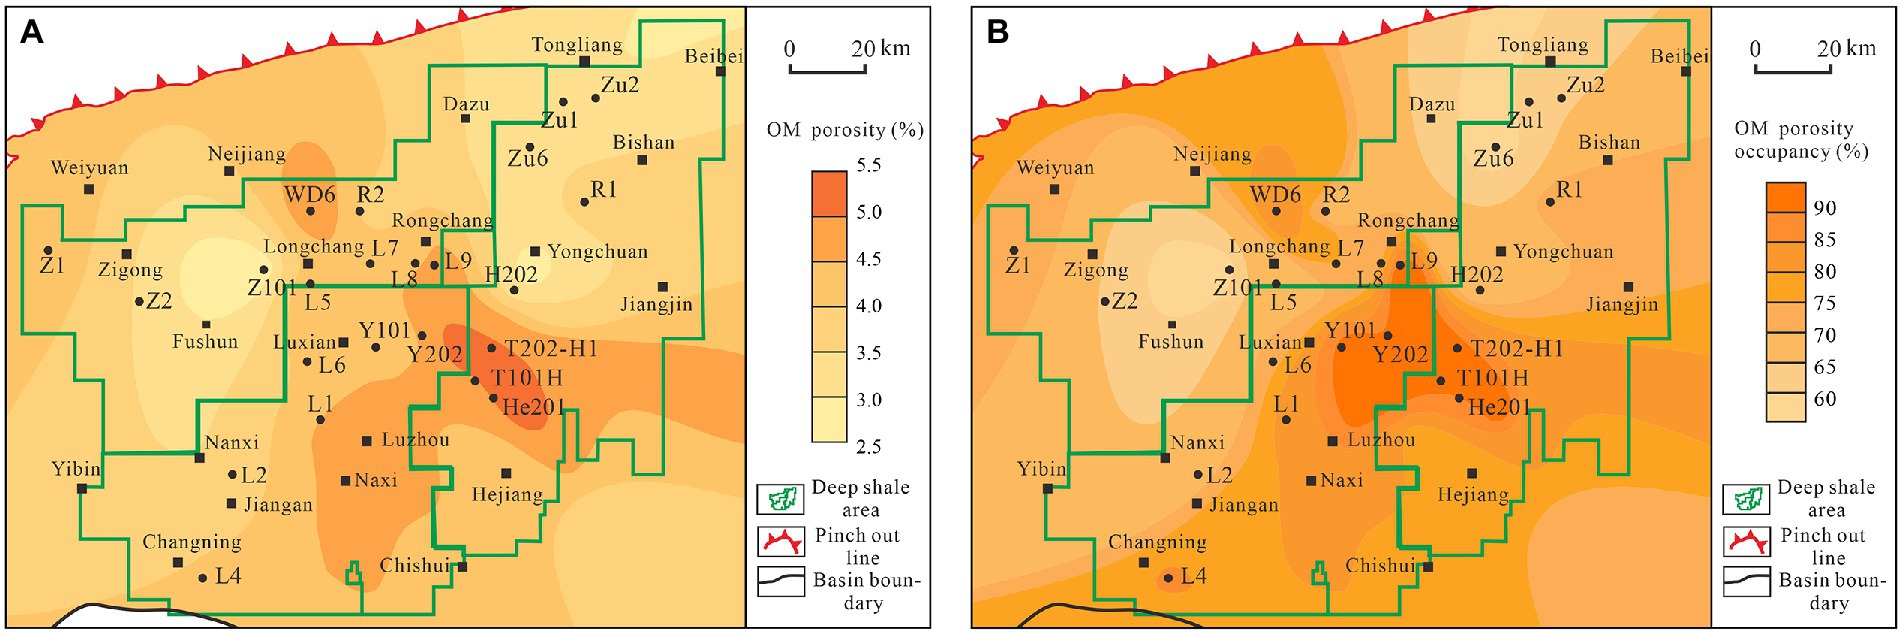
Figure 11. Distribution of OM porosity and OMPO of deep shale reservoir in South Sichuan. (A) OM porosity distribution; (B) OMPO distribution.
To unify the results, combined with porosity (Ma et al., 2020), the OMPO in the deep layer of southern Sichuan was obtained (Figure 11B). From Figure 11B, it can be seen that the OMPO in the Nanxi to Luzhou to Rongchang to Jiangjin area is the highest, reaching more than 80%. This is followed by the Weiyuan to Zigong and Changning regions, at around 70–80% (Figure 11B).
4. Discussion
4.1. OM pore development characteristics
4.1.1. Reservoir characteristics and OM pore space
Measurement of the OMSP (Table 2) showed a positive correlation with OM abundance (Figure 12A). Accordingly, OM pore space is mainly controlled by OM abundance.
Figure 12B shows that φom_cal is positively correlated with φt. Combining the characteristics of Figures 5, 7, the deep shale pore system of the Longmaxi Formation is mainly an OM pore.
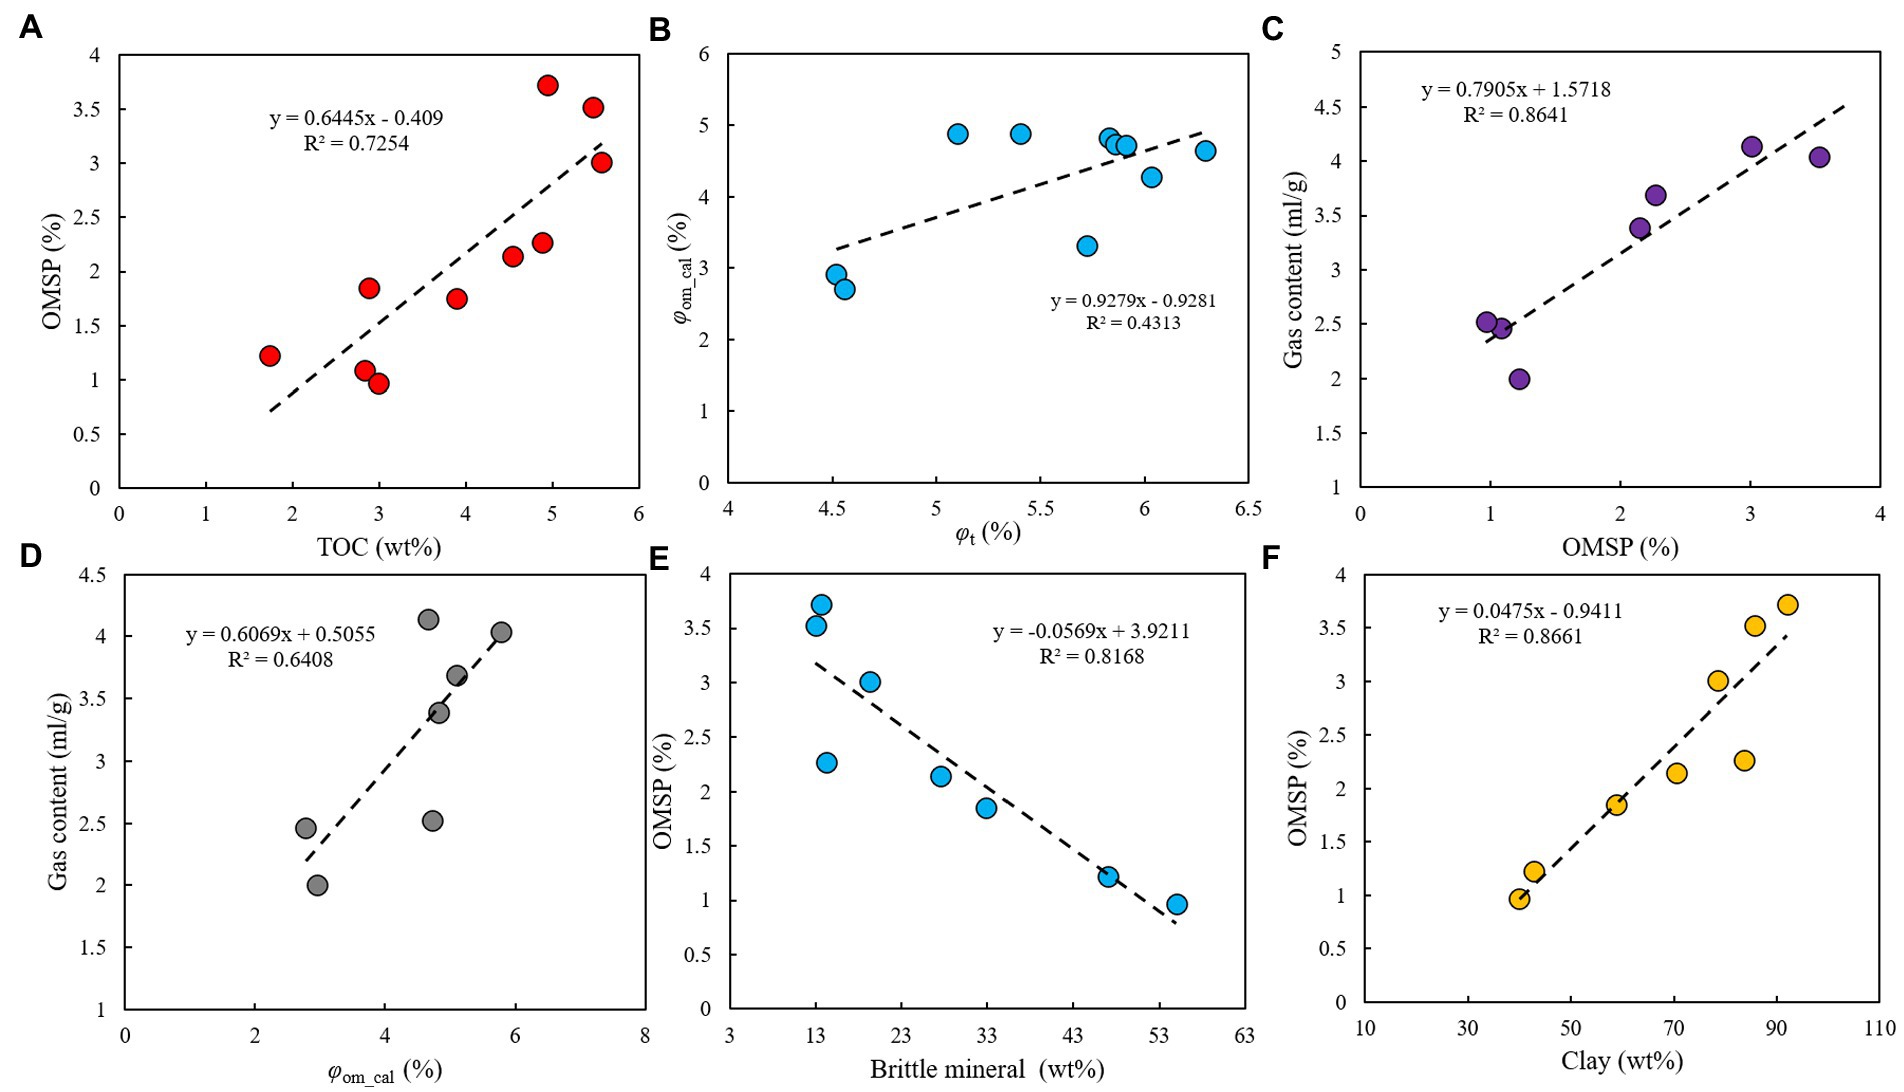
Figure 12. Relationship between reservoir characteristics and OM pore space. (A) OMSP and TOC, (B) φom_cal and φt, (C) gas content and OMSP, (D) gas content and φom_cal, (E) brittle mineral and OMSP, (F) clay and OMSP.
A large amount of OM is pyrolyzed to generate hydrocarbons, which are accompanied by a large number of OM-hosted pores (Liu et al., 2011). Therefore, the OM-hosted pore is positively correlated with the gas content, which proves that the OM pores control the gas content (Figures 12C,D).
Many studies have been conducted on the relationship between OM abundance and mineral content in deep marine shale (Li et al., 2022; Qian et al., 2022). It is generally agreed that clay minerals have a negative correlation with TOC, whereas brittle minerals have a positive correlation. As the development of OM pores is influenced by OM abundance. The OMSP is also positively correlated with brittle minerals and negatively correlated with clay minerals (Figures 12E,F). In conclusion, an increase in brittle minerals is beneficial to OM and promotes the development of OM pores. As a brace for pores, the rich siliceous mineral lattice plays a crucial role in their maintenance (Borjigin et al., 2021). Siliceous shale is the most developed lithofacies of OM pores in southern Sichuan because of the high brittleness and low clay content of shale with developed OM pores.
4.1.2. Microstructural characteristics of OM pores
The OM-hosted pore internal structure could be characterized by the PV, SSA, and fractal dimensions (Zhu et al., 2018; Xiong et al., 2022). In Figure 13, OMSP is positively correlated with PV and SSA. A significant number of OM-hosted pores formed by hydrocarbon production in the deep environment of high overmaturity contributed to PV and SSA Liu et al. (2011). All the aforementioned traits indicate the dominant development of OM-hosted pores in deep shale.
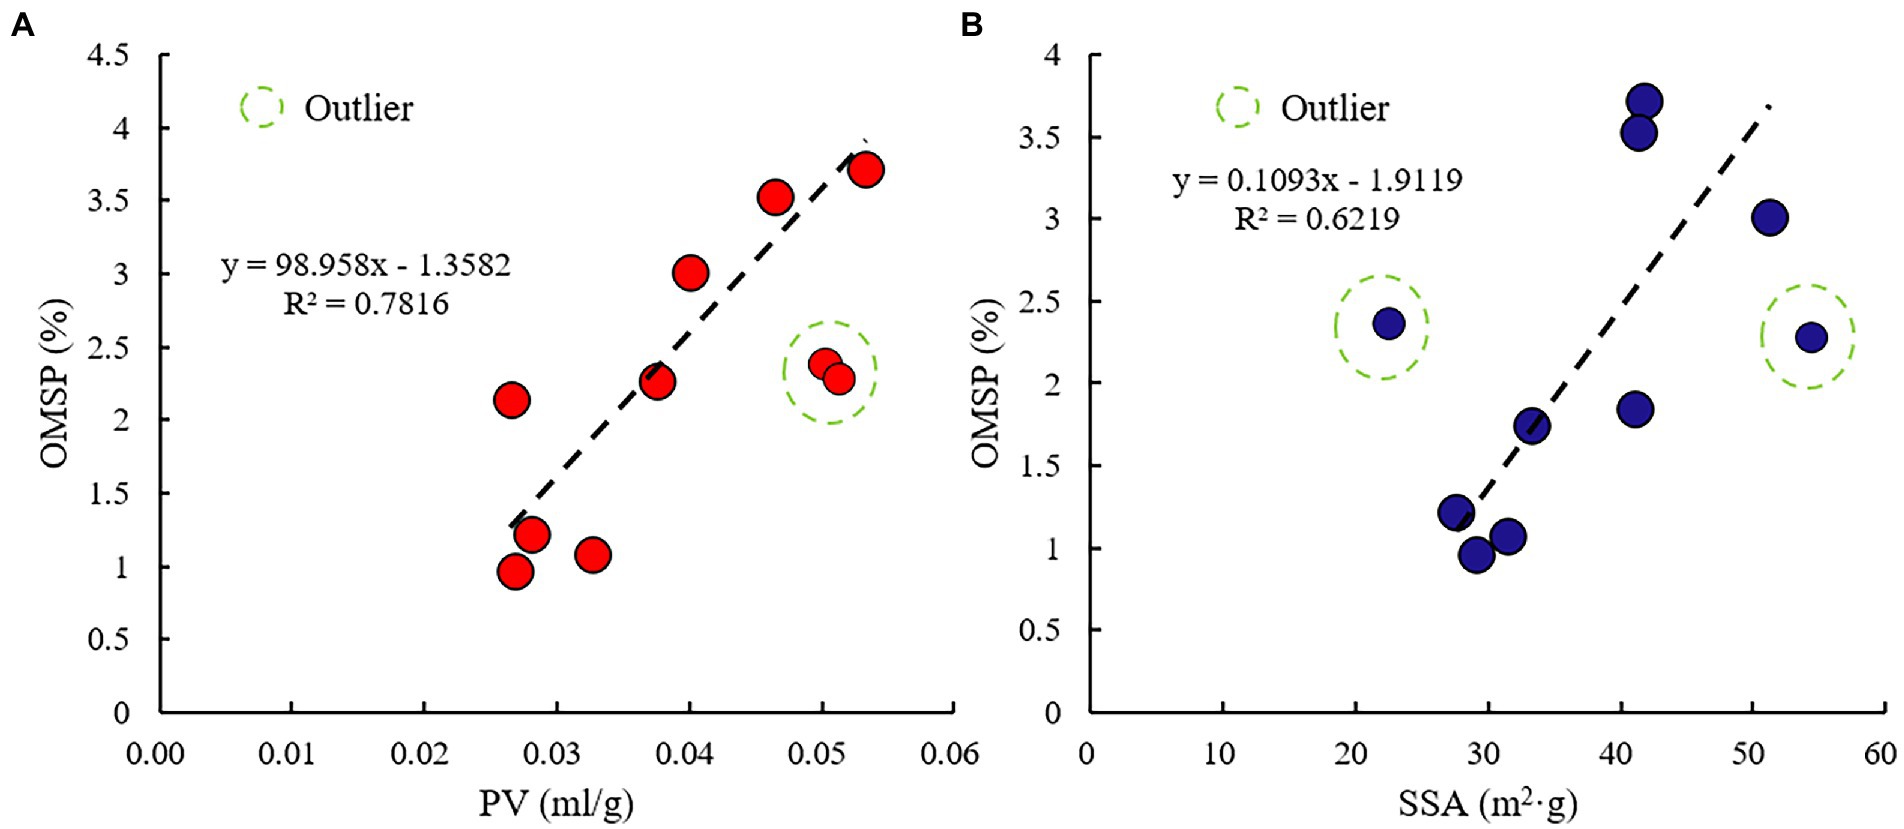
Figure 13. Relationship between OMSP and pore structure parameters. (A) OMSP and PV, (B) OMSP and SSA.
The difference between the Frenkel-Halsey-Hill (FHH) fractal dimension and the box dimension is that the FHH fractal is obtained in a cylindrical volume, whereas the box dimension is obtained in a planar image. According to the FHH fractal dimension and box dimension, it was found that the variation in mesopores caused the difference in pore structure in different lithofacies (Figure. 6; Supplementary material 1). In summary, deep shale has more complicated pore structures than middle-and shallow-depth shale. Mesopores play a major role in controlling a variety of pore structures in different lithofacies. Silty shale has more heterogeneity in its pore structure than siliceous shale.
4.2. Classification and distribution of high-quality deep shale reservoirs
Currently, there are no specific unified criteria for the classification of shale reservoirs in China. In particular, the deep shale in southern Sichuan also uses middle-shallow reservoir classification criteria (Zhao et al., 2016; Guo et al., 2021). However, deep marine shale reservoirs are characterized by relatively low porosity and high gas content (Nie et al., 2022; Figure 14). From the logging vertical, it was not obvious how the porosity of the Longmaxi Formation varies (Figures 1, 10). Additionally, Figure 14 shows that the brittle minerals in various deep range blocks differ significantly from one another. High-quality reservoirs cannot be classified based on brittle mineral content (Figure 10). The classification of high-quality reservoirs is therefore made difficult by the use of conventional parameters. The use of OMPO to classify high-quality reservoirs has better results (Figure 10).
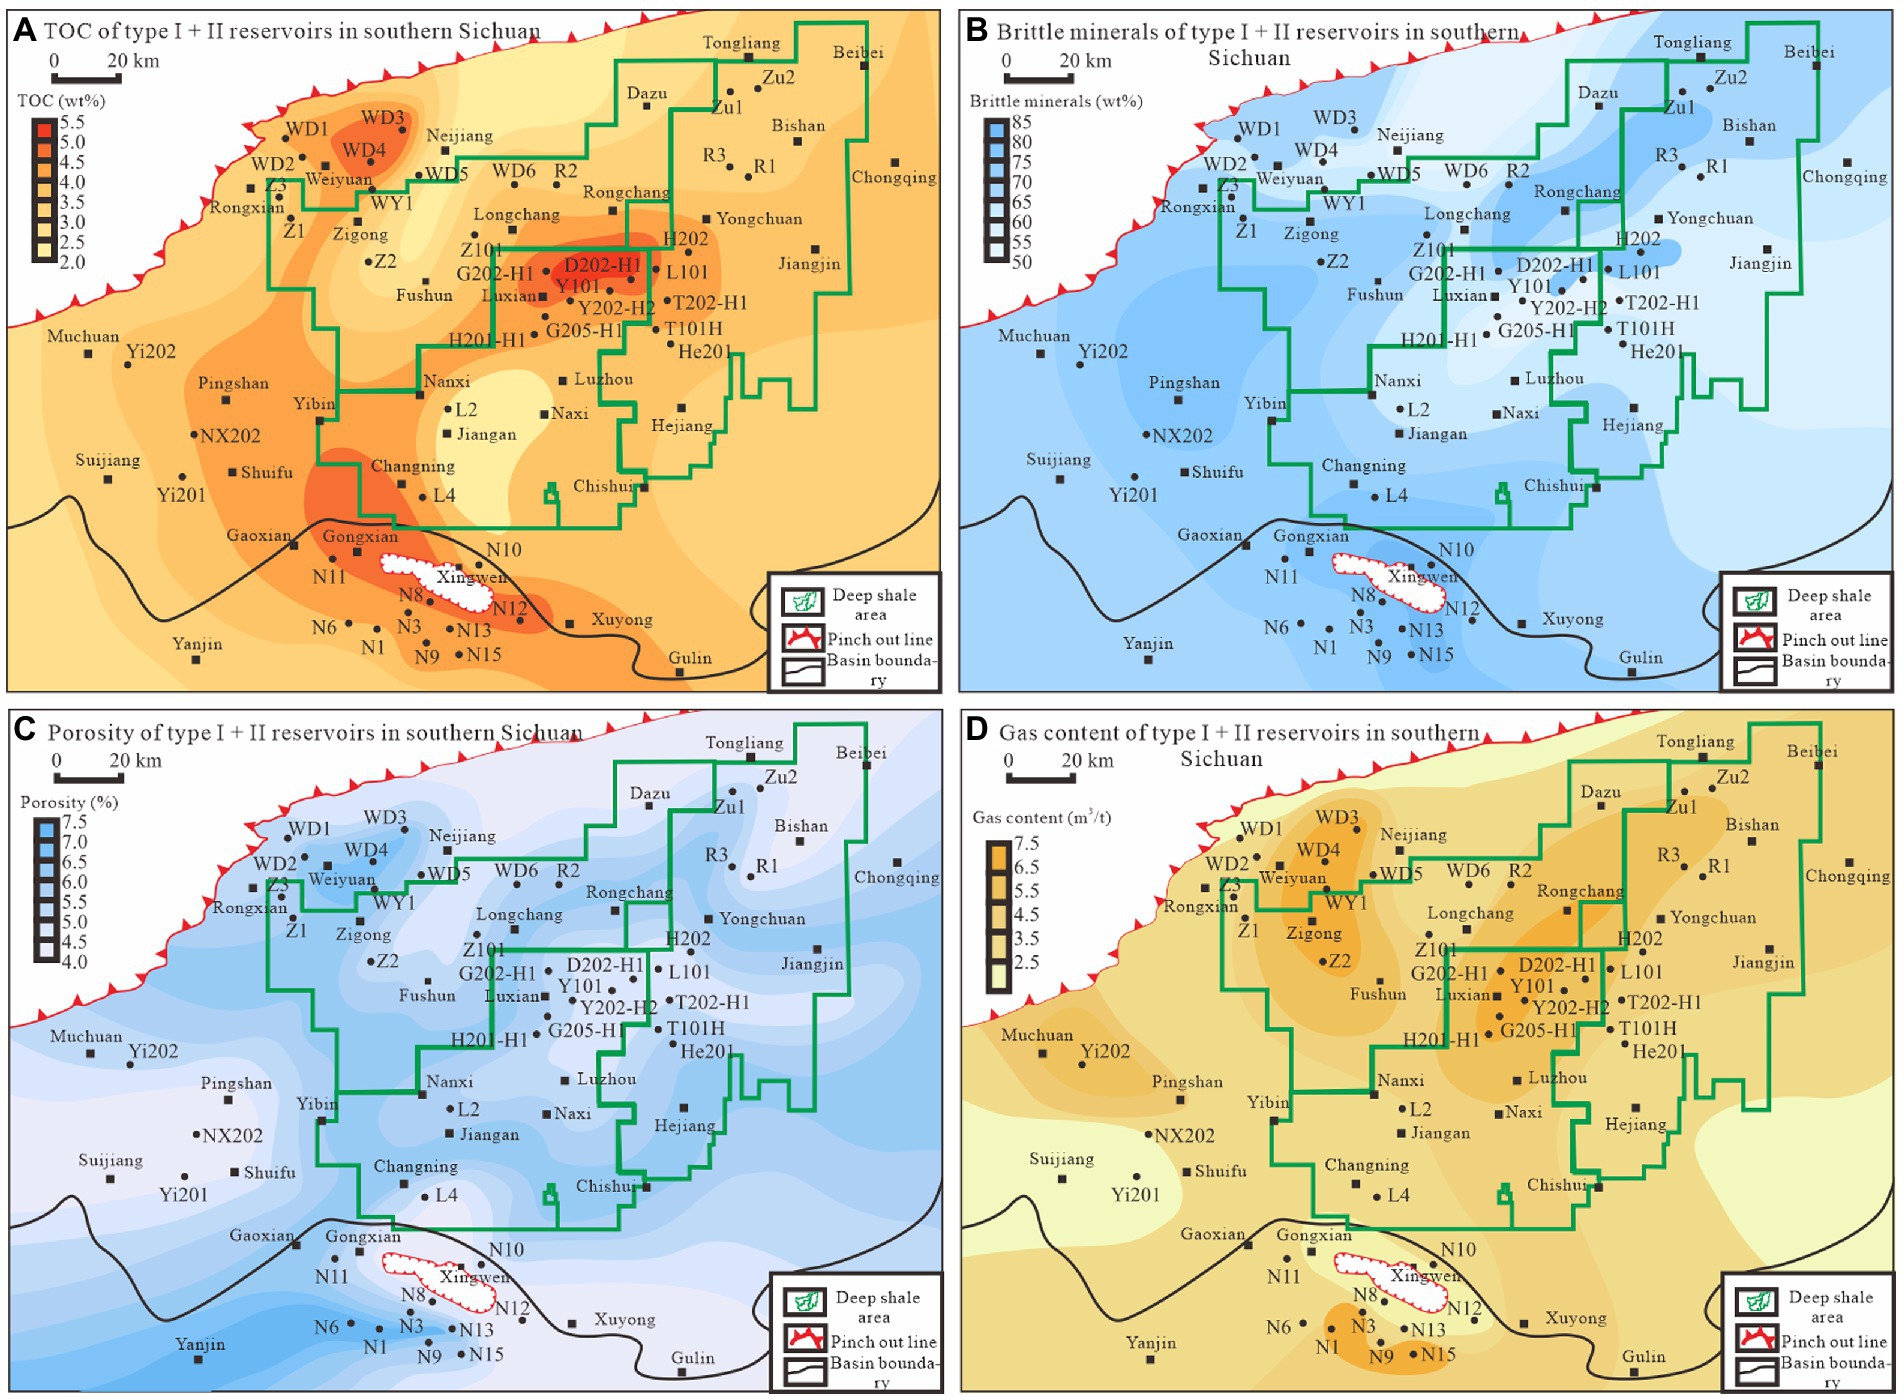
Figure 14. Modified according to the I + II reservoir parameters in the southern Sichuan area (Ma et al., 2020). (A) TOC distribution, (B) brittle mineral distribution (C) porosity distribution, (D) gas content distribution.
OMPO (Figure 11) discusses the distribution of high-quality reservoirs in combination with porosity, brittle content, TOC, reservoir thickness (Yang et al., 2019), and gas content. The Nanxi to Luzhou to Rongchang to Jiangjin region has the highest OMPO and also has the highest TOC, gas content, and reservoir thickness (Figures 11, 14). Currently, the core deep exploration areas in southern Sichuan are mainly located in Nanxi to Luzhou to Rongchang to Yongchuan to Jiangjin and Weiyuan to Zigong, and the high-rate producers in the favorable shale sections of 3,500–4,500 m are mainly located in southern Weiyuan, Luzhou, and western Chongqing (Ma et al., 2020). Therefore, based on the OMPO, it is confirmed that the Lunanxi to Luzhou to Rongchang to Jiangjin area is a key exploration area for high-quality shale reservoirs, followed by Weiyuan to Zigong.
4.3. Limitations of quantitative characterization of OM pore space
After looking at the development of OM pores from both a microscopic and a macroscopic point of view, it was found that there was a link between OM pore space and high-quality reservoirs. At the micro level, FE-SEM analysis and N2 gas adsorption experiments show that the pore network of OM in deep shale was well developed (Tables 2, 3; Figures 5–7). In high-quality reservoirs, the key to the formation was the massive development of OM mesopores in siliceous shale and the relative homogeneity of their structure. At the macro level, an OM porosity prediction model was established based on well logging data. High-quality reservoirs were classified using the OMPO (Figures 8, 11). The OMPO also confirms that the Nanxi to Luzhou to Rongchang to Jiangjin area is a core exploration area for high-quality reservoirs in southern Sichuan. Based on the organic pore development characteristics, it provides a new idea for the classification of deep marine shale gas reservoirs.
However, in terms of quantitative characterization of microscopic pore structure, it is a challenge to characterize micropores smaller than 2 nm. Only pore networks with a minimum pore size of about 10 nm can be observed by FE-SEM. Then, when utilizing the box dimension to describe the pore structure, the influence of the micropore proportion is ignored. As shown by the box dimension, the difference between silty shale and siliceous shale was mainly controlled by the mesopore structural characteristics (Figure 5). However, the reason for the smaller DB4 of siliceous shale than silty shale is not only the co-development of mesopores but also that it may contain micropores. The micropores part cannot be well characterized.
Differences in OM porosity prediction results can affect the evaluation and classification of reservoirs. The calibration of OM porosity may be used to determine the accuracy of the predicted results (Figure 8). However, core test methods are presently unable to provide OM porosity calibration results (Yang et al., 2021). As a consequence, the accuracy of the calibration results interferes with OM porosity prediction.
5. Conclusion
Based on FE-SEM analysis and modeling, N2 adsorption experiments show that OM pores are the most developed pore type in the deep marine shale of the Longmaxi Formation. In the Luzhou area, the OMSPO in high-quality reservoirs exceeds 60%, and the OMPO exceeds 50%.
Siliceous shale in the high-quality reservoir is the lithofacies with the most developed OM pores. Due to the mesopores of siliceous shale are largely developed and their structures are relatively homogeneity. Siliceous shale reservoirs are more conducive to shale gas enrichment and migration.
Compared to the original OM porosity model, the relative error of the improved OM porosity model was reduced by approximately 32.5%. Through the analysis of OM porosity, the most developed OM-hosted pores are found in the central and southeastern areas at a deep scale in southern Sichuan. Concerning the OMPO, it is confirmed that the Lunanxi to Luzhou to Rongchang to Jiangjin area is the key exploration area for high-quality shale reservoirs. OMPO is an indicator of high-quality reservoir development in the deep marine shale of the Longmaxi Formation. This reservoir classification pattern based on OM porosity will play a guiding role in the exploration of deep shale in the future.
Data availability statement
The original contributions presented in the study are included in the article/Supplementary material, further inquiries can be directed to the corresponding author.
Author contributions
BZ: conceptualization, sorting out ideas, and writing-original draft. JM: review, editing, funding, and sorting out ideas. RP: review, editing, and funding. CS: review and editing. ZZ: review and editing. JJ: review and editing. HH: review and editing. All authors contributed to the article and approved the submitted version.
Funding
This research is supported by the National Natural Science Foundation of China (No. 41472123); Youth Project of the National Natural Science Foundation of China (No. 41402114); Outstanding Young and Middle-aged Scientific and Technological Innovation Team Plan Project of Colleges and Universities in Hubei Province (No. t201905).
Conflict of interest
The authors declare that the research was conducted in the absence of any commercial or financial relationships that could be construed as a potential conflict of interest.
Publisher’s note
All claims expressed in this article are solely those of the authors and do not necessarily represent those of their affiliated organizations, or those of the publisher, the editors and the reviewers. Any product that may be evaluated in this article, or claim that may be made by its manufacturer, is not guaranteed or endorsed by the publisher.
Supplementary material
The Supplementary material for this article can be found online at: https://www.frontiersin.org/articles/10.3389/fevo.2023.1138991/full#supplementary-material
References
Borjigin, T., Lu, L., Yu, L., Zhang, W., Pan, A., Shen, B., et al. (2021). Formation, preservation and connectivity control of organic pores in shale. Petrol. Explor. Dev. 48, 798–812. doi: 10.1016/s1876-3804(21)60067-8
Carpentier, B., Huc, A., and Bessereau, G. (1991). Wire logging and source rocks-estimation of organic carbon content by the CARBOLOG method. Log. Anal. 32, 279–297.
Chalmers, G., Bustin, R., and Power, I. (2012). Characterization of gas shale pore systems by porosimetry, pycnometry, surface area, and field emission scanning electron microscopy/transmission electron microscopy image analyses: examples from the Barnett, Woodford, Haynesville, Marcellus, and Doig units. AAPG Bull. 96, 1099–1119. doi: 10.1306/10171111052
Chen, F., Lu, S., and Ding, X. (2014). Organoporosity evaluation of shale a case study of the lower Silurian Longmaxi shale in Southeast Chongqing. China. Sci. World J. 2014. 1–9. doi: 10.1155/2014/893520
Chen, F., Lu, S., and Ding, X. (2018). Pore types and quantitative evaluation of pore volumes in the Longmaxi formation shale of Southeast Chongqing. China. Acta Geol. Sin-Engl. 92, 342–353. doi: 10.1111/1755-6724.13509
Garum, M., Glover, P., Lorinczi, P., Rik, D., and Hassanpour, A. (2020). Micro-and nano-scale pore structure in gas shale using Xμ-CT and FIB-SEM techniques. Energ. Fuel. 34, 12340–12353. doi: 10.1021/acs.energyfuels.0c02025
Ge, X., Fan, Y., Cao, Y., Li, J., Cai, J., Liu, J., et al. (2016). Investigation of organic related pores in unconventional reservoir and its quantitative evaluation. Energ. Fuel. 30, 4699–4709. doi: 10.1021/acs.energyfuels.6b00590
Guan, Q., Dong, D., Wang, S., Huang, J., Wang, Y., Lu, H., et al. (2016). Preliminary study on shale gas microreservoir characteristics of the lower Silurian Longmaxi formation in the southern Sichuan Basin. China. J. Nat. Gas Sci. Eng. 31, 382–395. doi: 10.1016/j.jngse.2016.03.023
Guo, T. (2021). Progress and research direction of deep shale gas exploration and development. Reserv. Eval. Dev. 11, 1–6. (in Chinese with English Abstract). doi: 10.13809/j.cnki.cn32-1825/te.2021.01.001
Guo, X., Hu, D., Huang, R., Wei, Z., Duan, J., Wei, X., et al. (2020). Deep and ultra-deep natural gas exploration in the Sichuan Basin: Progress and prospect. Nat. Gas Ind. 40, 1–14. (in Chinese with English Abstract). doi: 10.3787/j.issn.1000-0976.2020.05.001
Guo, J., Jia, C., He, D., and Meng, F. (2021). Classification and evaluation on shale gas reservoir for Wufeng-Longmaxi formation in Chuannan area, Sichuan Basin. Lithosphere Special 2021:3364731. doi: 10.2113/2021/3364731
Hu, X., Chen, L., Qi, L., Lei, Z., and Luo, Y. (2019). Marine shale reservoir evaluation in the Sichuan Basin-a case study of the lower Silurian Longmaxi marine shale of the B201 well in the Baoluan area, Southeast Sichuan Basin. China. J. Petrol. Sci. Eng. 182:106339. doi: 10.1016/j.petrol.2019.106339
Hu, D., Wei, Z., Li, Y., Liu, Z., Yuan, T., and Liu, X. (2022). Deep shale gas exploration in complex structure belt of the southeastern Sichuan Basin: Progress and breakthrough. Nat. Gas Ind. 42, 35–44. (in Chinese with English Abstract). doi: 10.3787/j.issn.1000-0976.2022.08.004
Inan, S., Al, B., Inan, T., and Al, Z. (2018). Formation and occurrence of organic matter-hosted porosity in shales. Int. J. Coal Geol. 199, 39–51. doi: 10.1016/j.coal.2018.09.021
Jia, Y., Han, D., Zhang, J., Wang, C., Lin, W., Ren, X., et al. (2021). Differences in pore-forming efficiency among organic Macerals and its restriction against reservoir quality: a case study based on the marine shale reservoir in the Longmaxi formation, Southern Sichuan Basin, China. Lithosphere (Special 1, 2700912.
Jiang, Z., Li, X., Wang, X., Wang, G., Chou, H., Zhu, D., et al. (2021). Characteristic differences and controlling factors of pores in typical South China shale. Oil Gas Geol. 42, 41–53. (in Chinese with English Abstract). doi: 10.11743/ogg20210104
Jiang, Z., Tang, X., Li, Z., Huang, H., Yang, P., Yang, X., et al. (2016). The whole aperture pore structure characteristics and its effect on gas content of the Longmaxi formation shale in the southeastern Sichuan basin. Earth Sci. Front. 23, 126–134. (in Chinese with English Abstract). doi: 10.13745/j.esf.2016.02.013
Li, Y., Liu, X., Cai, C., Hu, Z., Wu, B., Mu, Y., et al. (2022). Pore structure characteristics and their controlling factors of deep shale: a case study of the lower Silurian Longmaxi formation in the Luzhou area, southern Sichuan Basin. ACS Omega 7, 14591–14610. doi: 10.1021/acsomega.1c06763
Li, J., Lu, J., Li, Z., Wu, Q., and Nan, Z. (2014). ‘Four-pore’ modeling and its quantitative logging description of shale gas reservoir. Oil Gas Geol. 35, 266–271. (in Chinese with English Abstract). doi: 10.11743/ogg20140214
Liu, G. (2021). Challenges and countermeasures of log evaluation in unconventional petroleum exploration. Petrol. Explor. Dev. 48, 1033–1047. doi: 10.1016/S1876-3804(21)60089-7
Liu, Y., Lai, F., Zhang, H., Tan, Z., Wang, Y., Zhao, X., et al. (2021). A novel mineral composition inversion method of deep shale gas reservoir in Western Chongqing. J. Pet. Sci. Eng. 202:108528. doi: 10.1016/j.petrol.2021.108528
Liu, S., Ma, W., Luba, J., Huang, W., Zen, X., and Zhang, C. (2011). Characteristics of the shale gas reservoir rocks in the lower Silurian Longmaxi formation, East Sichuan basin. China. Acta Petrol. Sin. 31, 187–219. doi: 10.1260/0144-5987.31.2.187
Liu, K., Mehdi, O., and Kong, L. (2018). Multifractal characteristics of Longmaxi shale pore structures by N2 adsorption: a model comparison. J. Pet. Sci. Eng. 168, 330–341. doi: 10.1016/j.petrol.2018.04.072
Lu, Y., Liang, B., Wang, C., Liu, C., and Ji, J. (2021). Shale gas exploration and development in the lower Paleozoic Jiangdong block of Fuling gas field, Sichuan Basin. Oil Gas Geol. 42, 241–250. (in Chinese with English Abstract). doi: 10.11743/ogg20210120
Ma, X., Xie, J., Yong, R., and Zhu, Y. (2020). Geological characteristics and high production control factors of shale gas reservoirs in Silurian Longmaxi formation, southern Sichuan Basin SW China. Petrol. Explor. Dev. 47, 901–915. doi: 10.1016/s1876-3804(20)60105-7
Nie, H., Li, P., Dang, W., Ding, J., Sun, C., Liu, M., et al. (2022). Enrichment characteristics and exploration directions of deep shale gas of Ordovician-Silurian in the Sichuan Basin and its surrounding areas. China. Petrol. Explor. Dev. 49, 744–757. doi: 10.1016/s1876-3804(22)60307-0
Panigrahy, C., Seal, A., Mahato, N., and Bhattacharjee, D. (2019). Differential box counting methods for estimating fractal dimension of gray-scale images: a survey. Chaos Soliton. Fract. 126, 178–202. doi: 10.1016/j.chaos.2019.06.007
Qian, C., Li, X., Shen, W., Zhang, Q., Guo, W., Hu, Y., et al. (2022). Study on the pore structure and fractal characteristics of different lithofacies of Wufeng–Longmaxi formation shale in southern Sichuan Basin China. ACS Omega 7, 8724–8738. doi: 10.1021/acsomega.1c06913
Sing, K. (1985). Reporting physisorption data for gassolid systems with special reference to the determination of surface area and porosity. Pure Appl. Chem. 57, 603–619. doi: 10.1351/pac198557040603
Smith, T., Lange, G., and Marks, W. (1996). Fractal methods and results in cellular morphology-dimensions, lacunarity and multifractals. J. Neurosci. Methods 69, 123–136. doi: 10.1016/s0165-0270(96)00080-5
Sun, Z., Huang, B., Liu, Y., Jiang, Y., Zhang, Z., Hou, M., et al. (2022b). Gas-phase production equation for CBM reservoirs: interaction between hydraulic fracturing and coal orthotropic feature. J. Pet. Sci. Eng. 213:110428. doi: 10.1016/j.petrol.2022.110428
Sun, Z., Huang, B., Yan, S., Wang, S., Wu, K., Yu, W., et al. (2022c). Nanoconfined methane thermodynamic behavior below critical temperature: liquid–vapor coexistence curve under wettability effect. Ind. Eng. Chem. Res. 61, 4971–4979. doi: 10.1021/acs.iecr.2c00079
Sun, Z., Wang, S., Xiong, H., Wu, K., and Shi, J. (2022a). Optimal nanocone geometry for water flow. AICHE J. 68:e17543. doi: 10.1002/aic.17543
Sun, W., Zuo, Y., Wu, Z., Liu, H., Xi, S., Yue, S., et al. (2019). Fractal analysis of pores and the pore structure of the lower Cambrian Niutitang shale in northern Guizhou province: investigations using NMR, SEM and image analyses. Mar. Petrol. Geol. 99, 416–428. doi: 10.1016/j.marpetgeo.2018.10.042
Wang, S., Man, L., Wang, S., Wu, L., Zhu, Y., Li, L., et al. (2022). Lithofacies types, reservoir characteristics and silica origin of marine shales: a case study of the Wufeng formation-Longmaxi formation in the Luzhou area, southern Sichuan Basin. Nat. Gas Ind. B 9, 394–410. doi: 10.1016/j.ngib.2022.07.004
Xiong, J., Li, Y., Zhou, S., Liu, X., Han, H., Liang, L., et al. (2022). Insights into the pore structure characteristics of the lower Silurian Longmaxi formation shale in the Jiaoshiba area, southern Sichuan Basin, China. J. Petrol. Explor. Prod. Technol 12, 2857–2868. doi: 10.1007/s13202-022-01486-1
Yang, X., Liu, C., Liu, W., and Ren, H. (2021). Characteristics of and factors influencing organic pores in the lower Silurian long-maxi formation, Fushun-Yongchuan area, Sichuan Basin. Oil Gas Geol. 42, 1321–1333. (in Chinese with English Abstract). doi: 10.11743/ogg20210607
Yang, H., Zhao, S., Liu, Y., Wu, W., Xia, Z., Wu, T., et al. (2019). Main controlling factors of enrichment and high-yield of deep shale gas in the Luzhou block, southern Sichuan Basin. Nat. Gas Ind. 39, 55–63. (in Chinese with English Abstract). doi: 10.3787/j.issn.1000-0976.2019.11.007
Zhang, S., Dong, D., Liao, Q., Sun, S., Huang, S., Guan, Q., et al. (2021). Geological characteristics and resource prospect of deep marine shale gas in the southern Sichuan Basin. Nat. Gas Ind. 41, 35–45. (in Chinese with English Abstract). doi: 10.3787/j-issn-1000-0976-2021.09-004
Zhang, L., Guo, J., Tang, M., Liu, J., Li, Q., and He, J. (2015). Pore structure characteristics of Longmaxi shale in the southern Sichuan Basin. Nat. Gas Ind. 2015 35, 22–29. (in Chinese with English Abstract). doi: 10.3787/j.issn.1000-0976.2015.03.003
Zhang, C., Shan, W., and Wang, X. (2018). Quantitative evaluation of organic porosity and inorganic porosity in shale gas reservoirs using logging data. Energ. Source. Part A 41, 811–828. doi: 10.1080/15567036.2018.1520361
Zhang, Z., Xu, S., Gou, Q., and Li, Q. (2022). Reservoir characteristics and resource potential of marine shale in South China: a review. Energies 15:8696. doi: 10.3390/en15228696
Zhao, P., He, B., Zhang, B., and Liu, J. (2022). Porosity of gas shale: is the NMR-based measurement reliable? Petrol. Sci. 19, 509–517. doi: 10.1016/j.petsci.2021.12.013
Zhao, S., Yang, Y., Zhang, J., Wang, L., Wang, X., Luo, C., et al. (2016). Micro-layers division and fine reservoirs contrast of lower Silurian Longmaxi formation shale, Sichuan Basin, SW China. Nat. Gas Geosci. 27, 470–487. (in Chinese with English Abstract). doi: 10.11764/j.issn.1672-1926.2016.03.0470
Zhu, L., Ma, Y., Cai, J., Zhang, C., Wu, S., and Zhou, X. (2022). Key factors of marine shale conductivity in southern China-part II: the influence of pore system and the development direction of shale gas saturation models. J. Pet. Sci. Eng. 209:109516. doi: 10.1016/j.petrol.2021.109516
Zhu, H., Zhang, T., Liang, X., Zhang, Z., and Zhang, L. (2018). Insight into the pore structure of Wufeng-Longmaxi black shales in the South Sichuan Basin. China. J. Petrol. Sci. Eng. 171, 1279–1291. doi: 10.1016/j.petrol.2018.08.061
Keywords: organic matter pore, deep marine shale, multi-scale, Luzhou, Longmaxi formation, Sichuan basin
Citation: Zhu B, Meng J, Pan R, Hu H, Song C, Zhu Z and Jin J (2023) New insights into the evaluation criteria for high-quality deep marine shale gas reservoirs in the Longmaxi formation: Evidence from organic matter pore development characteristics. Front. Ecol. Evol. 11:1138991. doi: 10.3389/fevo.2023.1138991
Edited by:
Yanan Miao, Shandong University of Science and Technology, ChinaReviewed by:
Zheng Sun, China University of Mining and Technology, ChinaTao Zhang, Southwest Petroleum University, China
Copyright © 2023 Zhu, Meng, Pan, Hu, Song, Zhu and Jin. This is an open-access article distributed under the terms of the Creative Commons Attribution License (CC BY). The use, distribution or reproduction in other forums is permitted, provided the original author(s) and the copyright owner(s) are credited and that the original publication in this journal is cited, in accordance with accepted academic practice. No use, distribution or reproduction is permitted which does not comply with these terms.
*Correspondence: Jianghui Meng, ✉ bWpoQHlhbmd0emV1LmVkdS5jbg==