- 1College of Economics and Management, Jilin Agricultural University, Changchun, Jilin, China
- 2School of Geographical Sciences, China West Normal University, Nanchong, Sichuan, China
Energy is an important resource for human survival and development. China has become the world’s second largest energy consumer, and its energy consumption growth rate ranks first in the world. With the rapid growth of China’s economy, such a way of energy consumption will inevitably hinder the rapid development of China’s economy in the long run, so it is necessary to improve China’s energy consumption way. In order to explore the impact of energy consumption on regional agricultural economic growth, improve the negative impact of unscientific energy consumption, and improve the level of regional economic development, this paper takes three regions as the research object to study the relationship between energy consumption and economic development. The research results show that there is no one-way or two-way causality in Type I areas with high economic development and high energy consumption, no matter in the short-term or long-term; in Type II areas with high economic development and low consumption, there is a bidirectional causal relationship between energy consumption and economic development in the short term. In the long run, economic growth is a one-way causal relationship. In Type III regions with slow economic growth and low energy consumption, only the single causal relationship between long-term energy consumption and economic development is less than 10% significant. This suggests that the long- and short-term causality between energy consumption and economic development varies across regions. Therefore, in order to coordinate regional economic development and narrow regional gaps, it is necessary to formulate appropriate regional energy consumption policies and strategies.
1. Introduction
Currently, all countries regard their own energy situation as a major consideration for economic development. As the most populous country on the planet, it has a growing role in the global economy. This means that China would become an energy-demanding country. China’s economy has developed rapidly after the reform and opening up. China’s current economic aggregate ranks second in the world. However, the structural problems of its development mode make it still far behind developed countries. As an important factor of production, energy plays an important role in the development of national economy. Unreasonable energy consumption can only promote short-term economic growth and cannot improve the quality of the economy. With the in-depth development of econometrics theory, panel data has made great progress and has been widely used in various professional fields, such as finance, commerce, technological innovation and tax policy. Based on panel data, the analysis of energy consumption in various regions can effectively provide objective reference for local economic development.
In recent years, the research on economic growth has increasingly become a realistic problem. Kochetkov D studied different methods of evaluating universities. The first was global university rankings, and each ranking method assessed different functional areas; there was currently a lack of a unified method for evaluating universities as a complex system. The function mechanism of universities in regional economy was tried to be defined (Kochetkov et al., 2017). Mikheeva analyzed all aspects of regional economic diversification through the study of the changes of the value-added of the employment structure and the industrial output from 2000 to 2014 (Mikheeva, 2017). How to correctly evaluate the economic and social effects in Northeast China was the key to realize regional sustainable development in China. In order to illustrate this problem, Ren W used a comprehensive view and compared the relationship between economic development and social development in Northeast China with differentiation methods and strategies. The results showed that this strategy made the regional Agricultural GDP increase by 25.70% and the per capita Agricultural GDP increase by 46.00%, thus realizing the obvious improvement of regional economic growth and per capita income (Ren et al., 2020). Kameswara B pointed to the links between Indonesia’s infrastructure and the regional economy, and noted that the use of long-distance transport, such as airports, was essential to support equitable economic activity and support sustainable development (Kameswara and Suryani, 2021). Previous studies have achieved good results. However, with the deepening of China’s energy consumption and economic development, the analysis of the relationship between the two based on panel data can better meet this demand.
Panel data is a new econometric analysis method that combines time and individual factors to better mine information in sample data. Ali H S made a dynamic correlation between bioenergy consumption, capital stock, human capital and economic development in some parts of sub-Saharan Africa. The panel co-integration method was used to analyze the research results of biomass energy consumption, capital stock, human capital and economic growth (Ali et al., 2017). Chen Y analyzed the impact of Economic Growth (EG), Renewable Energy Consumption (REC) and Non-renewable Energy Consumption (NREC) on carbon dioxide emissions based on panel, and verified the Environmental Kuznets Curve (EKC) at regional level in China. The test showed that there was a mixed trend of short-term and long-term causal relationship between regions (Chen et al., 2019). Firmansyah C. A. analyzed how increased female participation in the economy could boost economic growth in Indonesia. By using the data of 34 provinces in Indonesia from 2014 to 2018, the regression of panel data showed that the number of women’s empowerment had a positive impact on regional Agricultural GDP (Firmansyah and Sihaloho, 2021). Khan S used the equilibrium panel data of 184 countries in the world from 1990 to 2017 to examine the impact of financial development and energy consumption on CO2 emissions (Khan et al., 2021). The researchers all considered to study the impact of energy consumption on regional economic growth based on panel data. However, most of the current research focuses on the application and discussion at the theoretical level to conduct in-depth research in combination with the current practical development.
This paper made an empirical study on the impact of panel data from 2000 to 2018 combined with time section and other factors on China’s energy consumption. The test results of the energy elasticity coefficient of each region and the impact of energy consumption on economic growth are verified, which not only promotes the scientific development of energy consumption to a certain extent, but also has a certain guiding role for regional economic development.
2. Investigation method on the influence of energy consumption on economic growth
2.1. Economic growth theory
Economic growth theory refers to the study on the influence of production factors on economic decision-making (Zhao et al., 2019; Kim, 2020). The general feature of the economic growth theory is to use the equilibrium analysis method to investigate the equilibrium conditions needed to achieve stable equilibrium growth in the long-term dynamic process of economic growth by establishing various economic models.
2.2. Definition and classification of energy
Energy is a collective term for a natural resource that provides energy. Energy includes mechanical energy, chemical energy, electrical energy, thermal energy, biological energy, etc.
The use nature method, the form method, the pollution degree method, the source method and the form method are the commonly used energy classification methods.
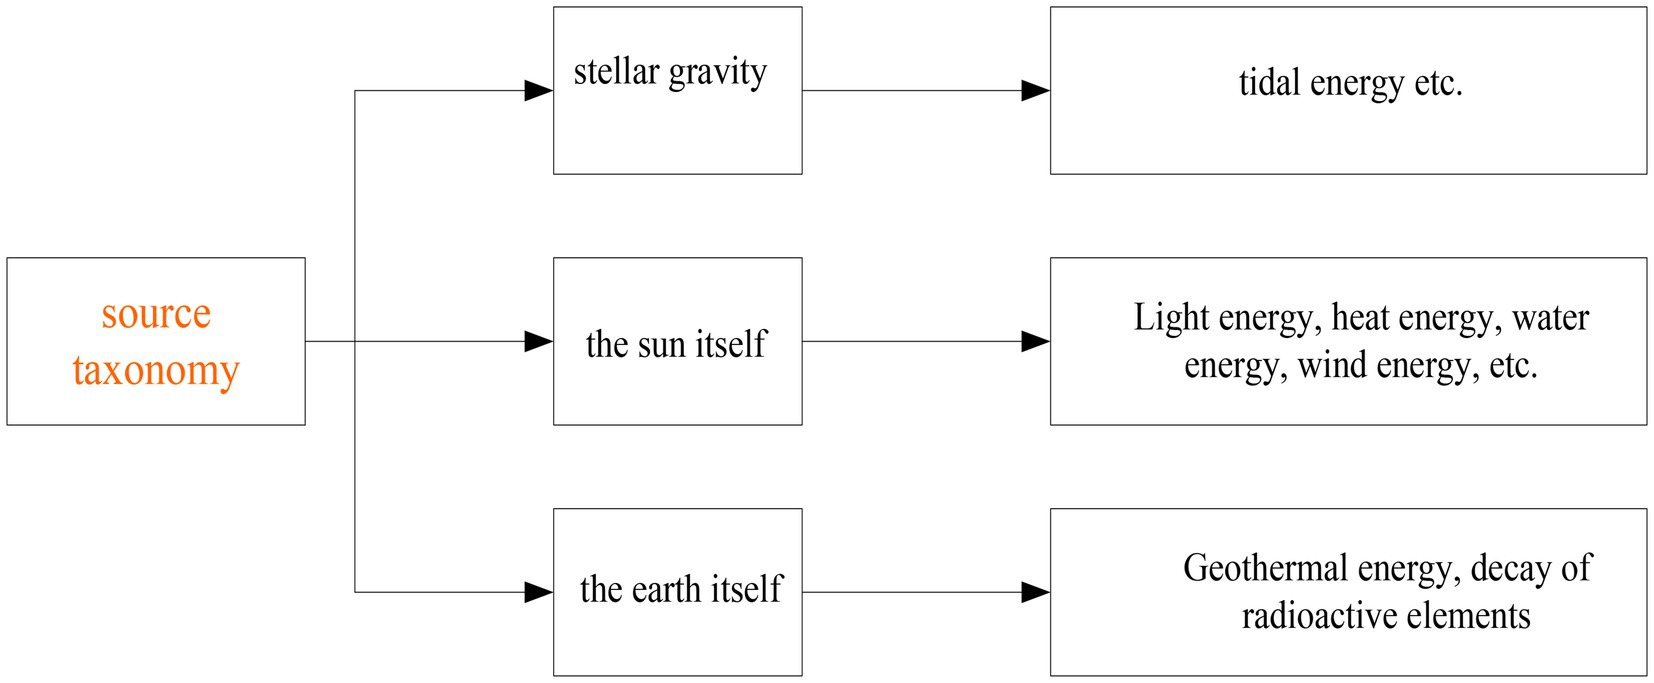
The source method divides energy into three categories: The first is generated by the gravity of various celestial bodies and the earth. By far the greatest gravitational force on Earth by humans comes from the sun and moon, and gravity causes the oceans to fluctuate to form tides; the second is the energy of the sun, which includes direct and indirect energy. Its direct energy comes from the heat of the sun, while the indirect energy comes from solar energy, wind energy, water energy, etc. Thousands of years ago; the third source of energy comes from the interior of the earth, which comes from the chemical action of various nuclear fuels in the ground. The classification of energy sources is shown in Figure 1.
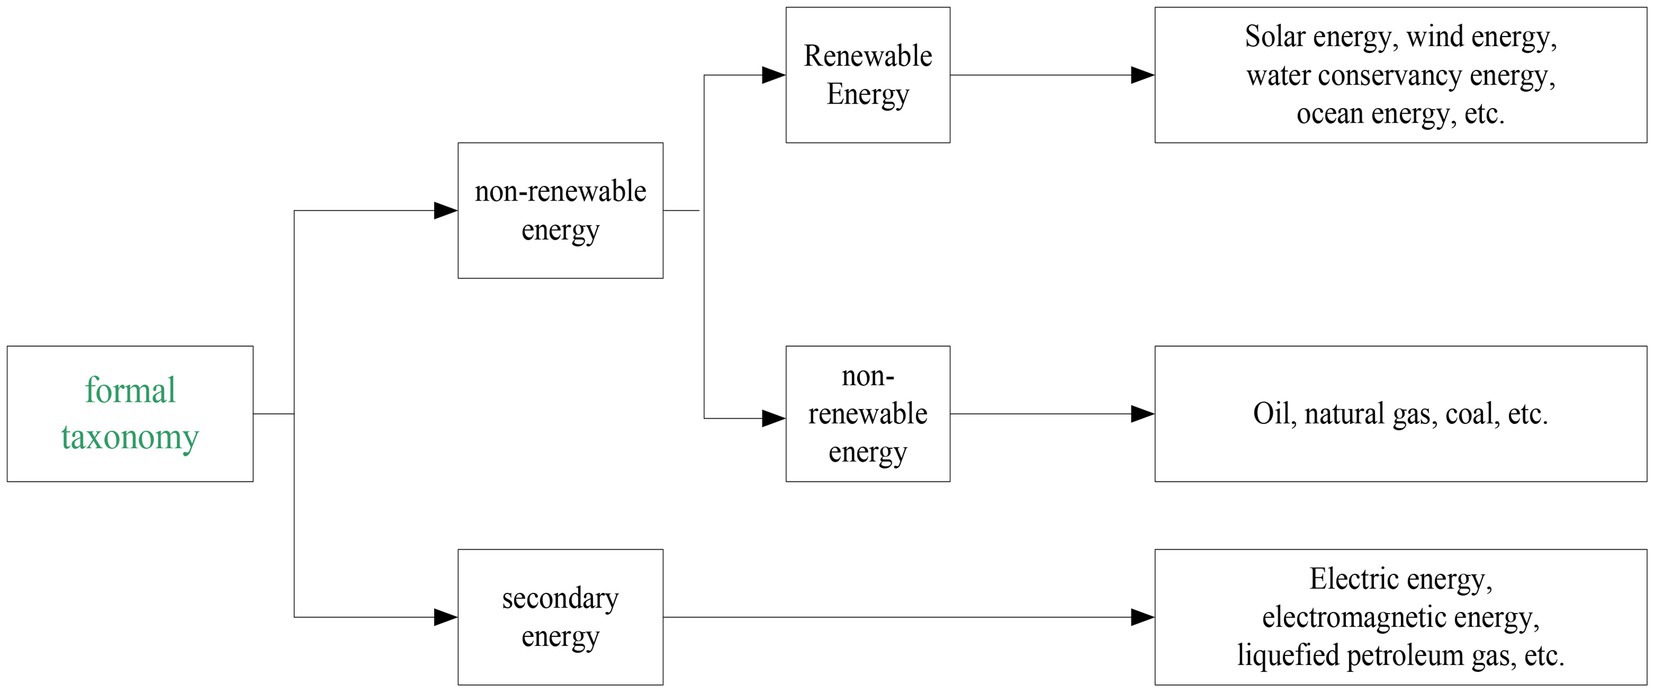
The formal method divides energy into two categories: The first is a kind of energy, which can be divided into traditional and new types according to the use and total amount of energy. The second is renewable energy, which is obtained by processing and converting primary energy. The classification of energy sources is shown in Figure 2.
According to the nature of use, energy is divided into fuel energy and non-fuel energy; According to the physical form, energy is divided into solid energy, liquid energy and gas energy. According to the degree of environmental pollution caused by energy, it can be divided into clean energy and non-clean energy.
2.3. Definition of panel data
Panel data analysis is a new econometric technique (Soava et al., 2018). “Panel data” refers to data collected on observations such as households, countries, or businesses at a particular time. Panel data are cross-sectional observations made up of multiple individuals at a certain point in time. From a longitudinal perspective, each individual is a time series. Its main characteristics are that it contains two dimensions of data, the section dimension and the time dimension. The cross-sectional dimension includes individuals, companies and countries, while the time dimension includes days, months, quarters and years.
2.4. Panel data regression model
The regression model selection of panel data has certain independence, but it must be tested by hypothesis. Models that are directly adopted without hypothesis testing can make the results of the study irrelevant. The basic form of the panel data regression model is as follows:
It can be represented by a matrix as:
Among them,
For this general form, various assumptions would be added based on Formula (1) according to different research questions, thereby obtaining different models (Huang, 2020). This section would introduce two modes.
2.4.1. Mixed Regression models
Mixed regression model is a combination of several different models. It allows a project to develop along the most effective path. It can also be defined as a statistical analysis model consisting of fixed effects and random effects (excluding random errors). If a set of panel data is not significantly different in time and also in profile, the series of data can be combined. The parameters are estimated using Ordinary Least Squares (hereinafter referred to as “OLS”). The model is represented as follows:
The matrix is represented as:
Among them,
This model assumes that the effect of the explanatory variable on the explained variable does not change by individual or time. Some scholars disagree with this assumption, because in purely theoretical research it may be correct. However, in empirical research, it would be too harsh to require all explanatory variables to be independent.
The mixed regression model can greatly enrich the sample capacity and can use OLS for regression analysis, so it has been widely used. To evaluate the fitness of the model, it must be checked for settings (Dauda et al., 2019).
2.4.2. Fixed effect model
Fixed-effect model means that the experimental results only want to compare the differences between the specific categories or categories of each autovariable and the interaction effects with the specific categories or categories of other autovariables, and do not want to infer the empirical design of other categories or categories that are not included in the same autovariable. If the explained variable is explained, its relevant information is incomplete and there may be omissions. However, the influencing factors of explanatory variables on the explained variables do not vary with individuals and time. It can be described by introducing dummy variables that reflect individual or temporal characteristics. The following is a further definition of the random error term :
The entire fixed effects model can be expressed as:
The matrix of the model is represented as follows:
Among them, i is a T × 1 unit vector.
If the definition is supplemented, the formula is as follows:
is a TN × 1 vector, and the model can be further written as follows:
The D matrix in Formula 9 is a matrix composed of dummy variables. Therefore, this fixed influence model is also called the Least Squares Dummy Variable (LSDV) model.
Individual fixed effect model, time fixed effect model and time point fixed effect model can be obtained by classifying fixed effect models. By taking a single fixed effects model as an example, its representation is:
The matrix is represented as follows:
Among them,
It is assumed that , and . After substitution, the model can be written in the following matrix form:
The residual term would have the following properties. For the convenience of discussionhere, it is assumed that = . Therefore, the expected value of the matrix is E( ) = 0 and .
Based on the above characteristics, the parameters of the model are estimated by OLS method, and the formula is as follows:
Under the fixed effect model, the real effect amount of each study is the same. The fixed effect model solves the problem of missing variables that do not change with time but vary with individuals. The introduction of time fixed effect can solve the problem of missing variables that do not change with individuals but change with time.
3. Empirical evaluation of the relationship between energy consumption and economic growth in different regions
3.1. Selection of indicators and sources of data
This paper queries the economic development data of various regions in the economic database. In view of the operability and comparability of data, the sampling range of China excluding Hong Kong, Macao and Taiwan within 1 year is selected; (Chongqing is separated from Sichuan, so Chongqing is merged into Sichuan Province; Tibet lacks data, and the sampling range is deleted) There are 552 data in total (Mukhametzhan et al., 2020). According to the situation of each province and municipality from 2000 to 2018, 29 administrative divisions are classified:
I. Areas with high economic development and high energy consumption: There are 11 provinces and municipalities directly under the Central Government in this area: Anhui, Beijing, Fujian, Hainan, Hebei, Liaoning, Inner Mongolia, Shandong, Shanghai, Tianjin, and Zhejiang. These regions are highly industrialized and economically developed.
II. High economic development and low energy consumption area: There are 16 provinces in this area: Gansu, Guangdong, Guangxi, Guizhou, Henan, Heilongjiang, Hubei, Hunan, Jilin, Jiangsu, Jiangxi, Ningxia, Qinghai, Shanxi, Shaanxi, Xinjiang. These regions have a higher degree of economic development and a higher degree of industrialization.
III. Low economic development and low energy consumption area: There are only two provinces in this area, Sichuan and Yunnan. In these two regions, economic development lags behind.
3.2. Unit root test
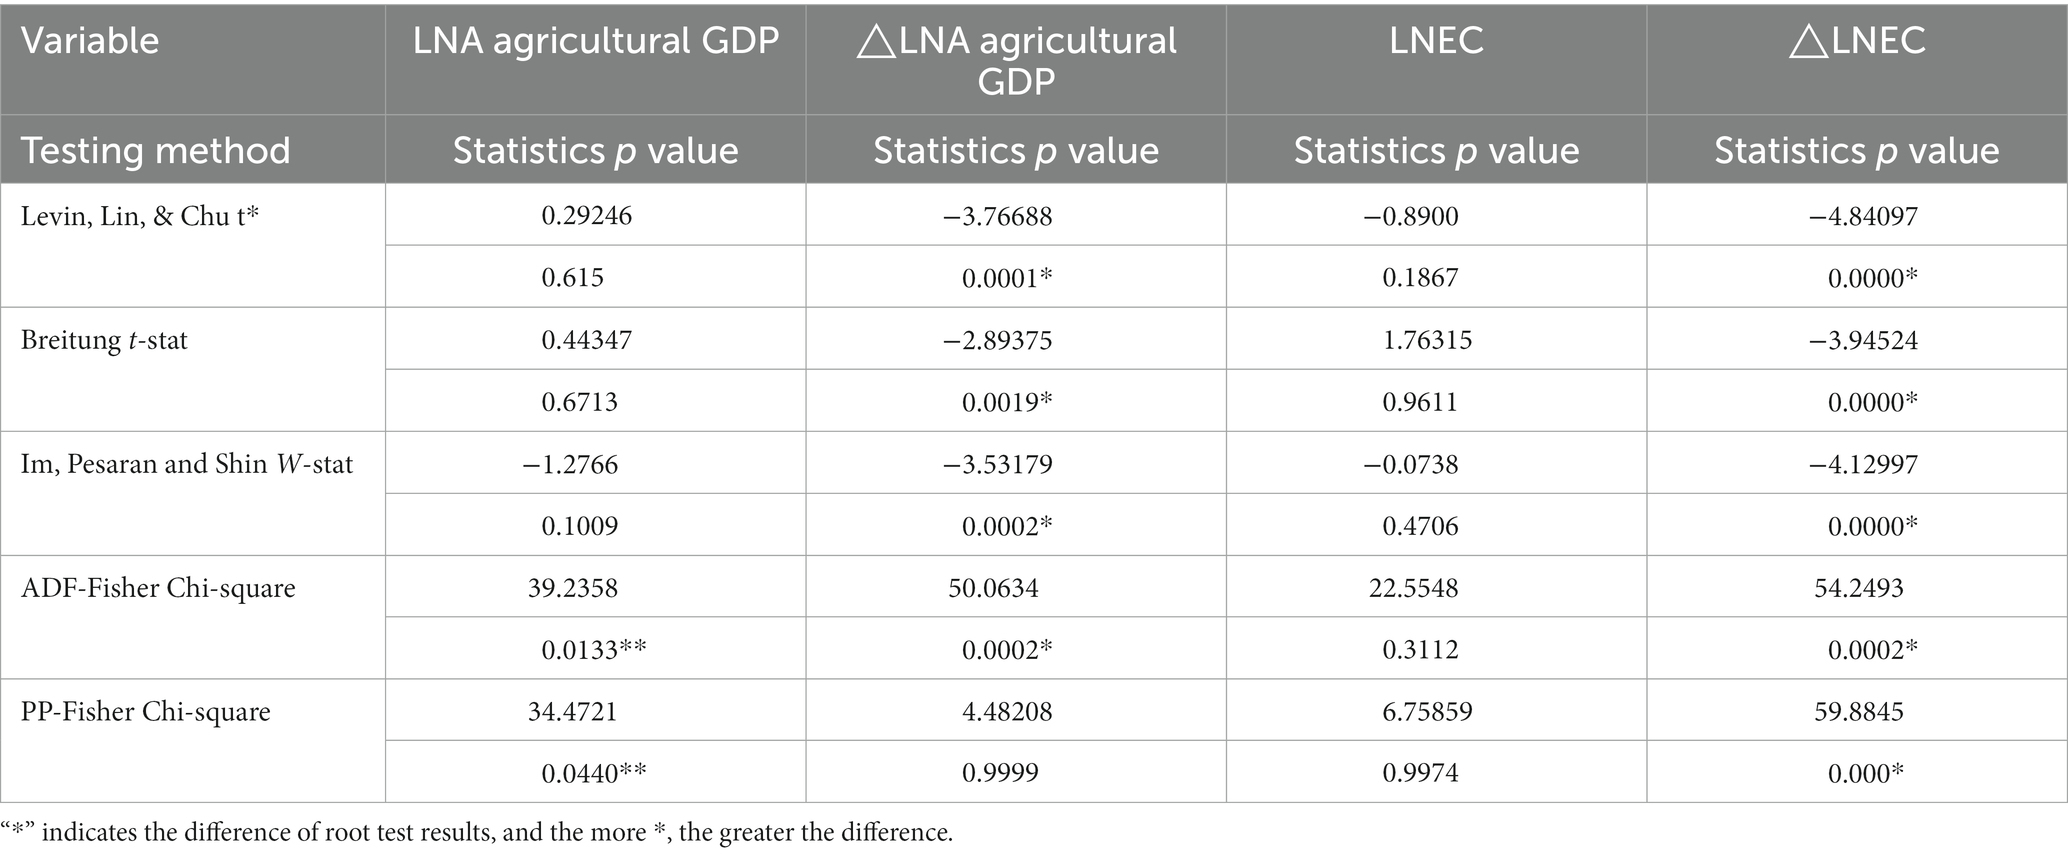
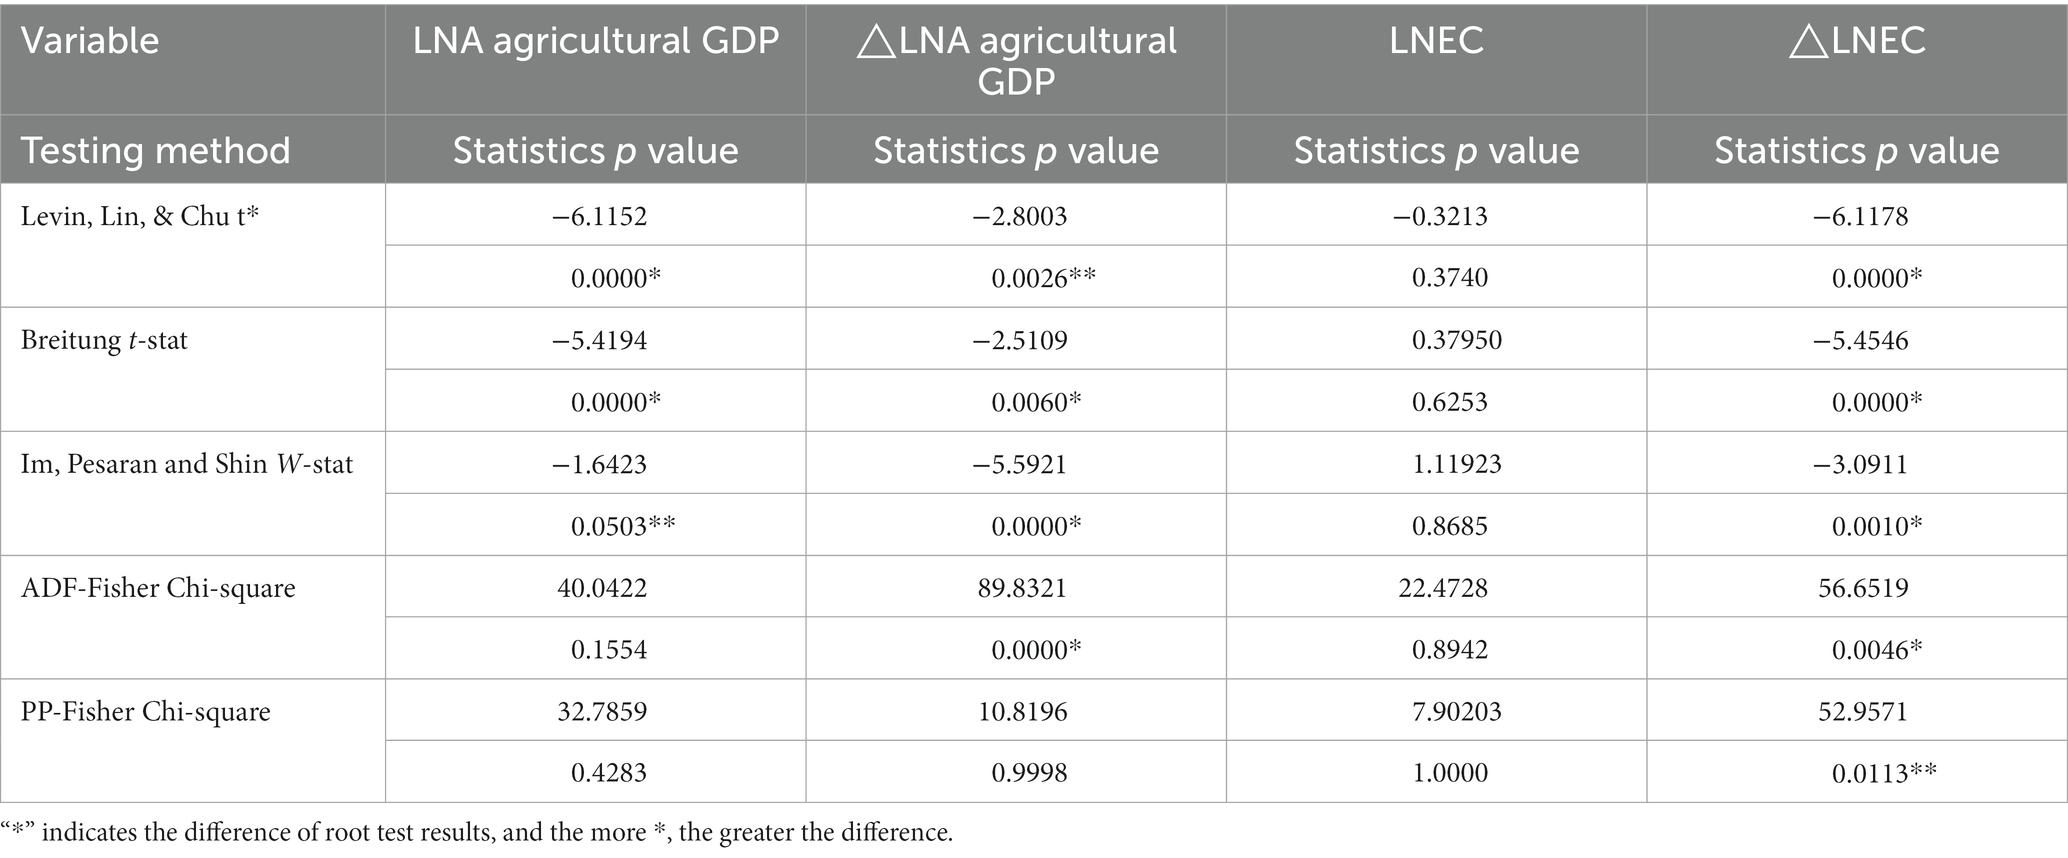
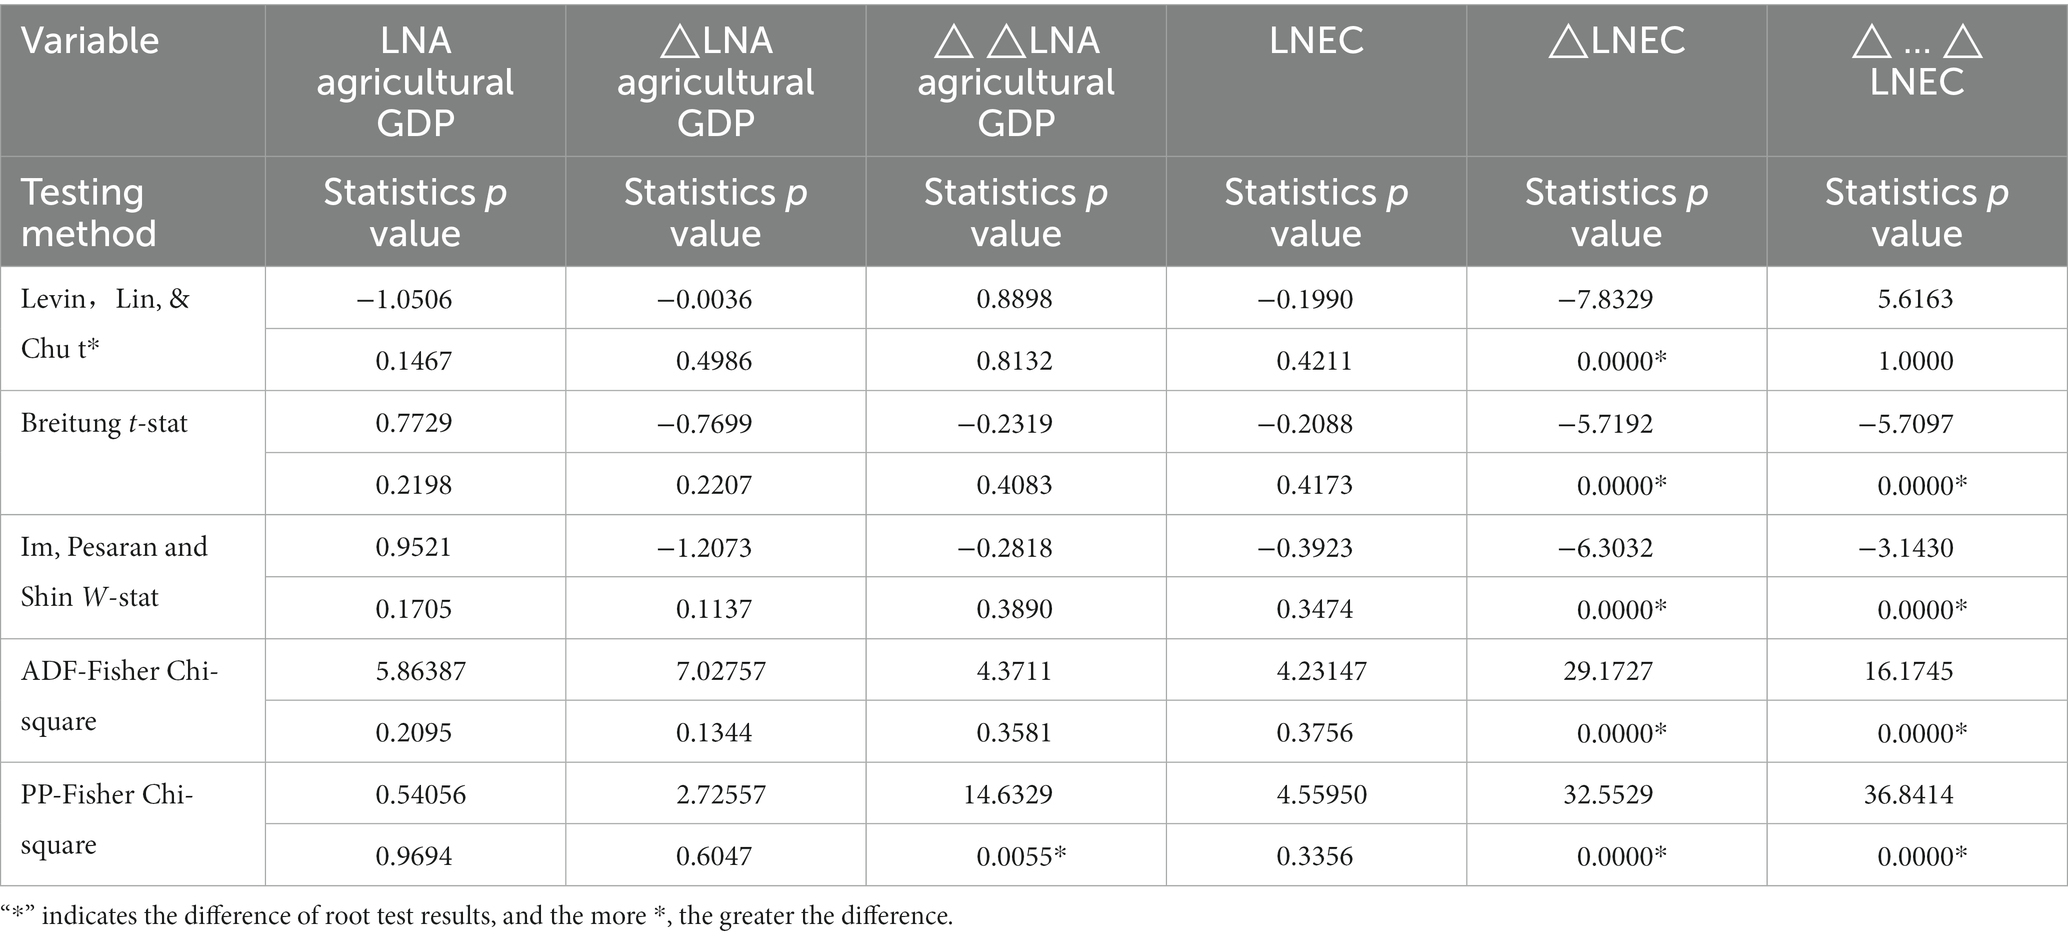
Before the unit root test, the format of the intercept and trend items should be determined first, including time trend items, only including intercept items, no intercept items, and time-direction items (Tu and Ma, 2017). The Agricultural GDP and EC of each region contain time and distance, so the index with time and distance is adopted in the unit root test Specific test results are shown in Tables 1–3.
The order of energy consumption and economic development after first-order and second-order difference is obtained and analyzed by panel element root test, as shown in Tables 1–3.
3.3. Cointegration test
As everyone know, cointegration test is based on the premise that each variable is a single integral of the same order (Liu et al., 2017). Variables must be integrated with the same order to be cointegrated, and the single integration of the same order is a necessary condition for cointegration. The co-integration test of panel data mainly includes Engle and Granger two-step test and Johansen co-integration test. (Zhao and Yu, 2021).
3.3.1. Engle and granger two-step method
Using the panel element root test to study the method of panel co-integration analysis. Table 4 shows these results. From the information of cointegration test results, there are only panel Azure Data Factory (ADF) statistics and inter group ADF statistics in Class I. The hypothesis of “no cointegration relationship” is excluded at the significance level of 0.05, and other tests cannot be excluded; Class II areas only have panel V statistics and inter group ADF statistics. At the significance level of 0.01, the hypothesis of “no cointegration relationship” is excluded, and other tests cannot be excluded; there are only inter group Polypropylene (PP) statistics and inter group ADF statistics in Class III area. When the significance is 0.1, the hypothesis of “no cointegration relationship” is excluded. To sum up, there is a synergistic effect among regions, and the long-term balance between energy and economic development is expounded (Iqbal et al., 2020).
3.3.2. Johansen cointegration test
Based on the panel unit root test, the proposed cointegration method is used to test the effectiveness of cointegration (Li, 2020). Table 5 shows these results. From the results of cointegration test, these three regions have largely rejected the original “no cointegration vector” hypothesis and accepted the selected hypothesis of “at least one cointegration vector.”
3.3.3. Test of cointegration regression model
3.3.3.1. Test of model form (random or fixed)
3.3.3.1.1. Variable intercept model
According to the variable intercept model of different regions, the influence form is determined based on time and personal factors. Table 6 lists the test results.
3.3.3.1.2. Variable coefficient model
According to the change factor model of different regions, the influence forms of different periods and individual factors were predicted (Lai, 2020). Table 7 lists the test results. It can be seen from the results that under the 1% significance level, the three regions do not accept fixed effects but adopt arbitrary effects. Therefore, in Class I, II and III regions, the form of variable model is individual and time random variables.
3.3.3.2. Regression coefficient model construction
According to the regression formula of cointegration of regional change coefficient, the following are obtained:
Class I area:
Class II area:
Class III area:
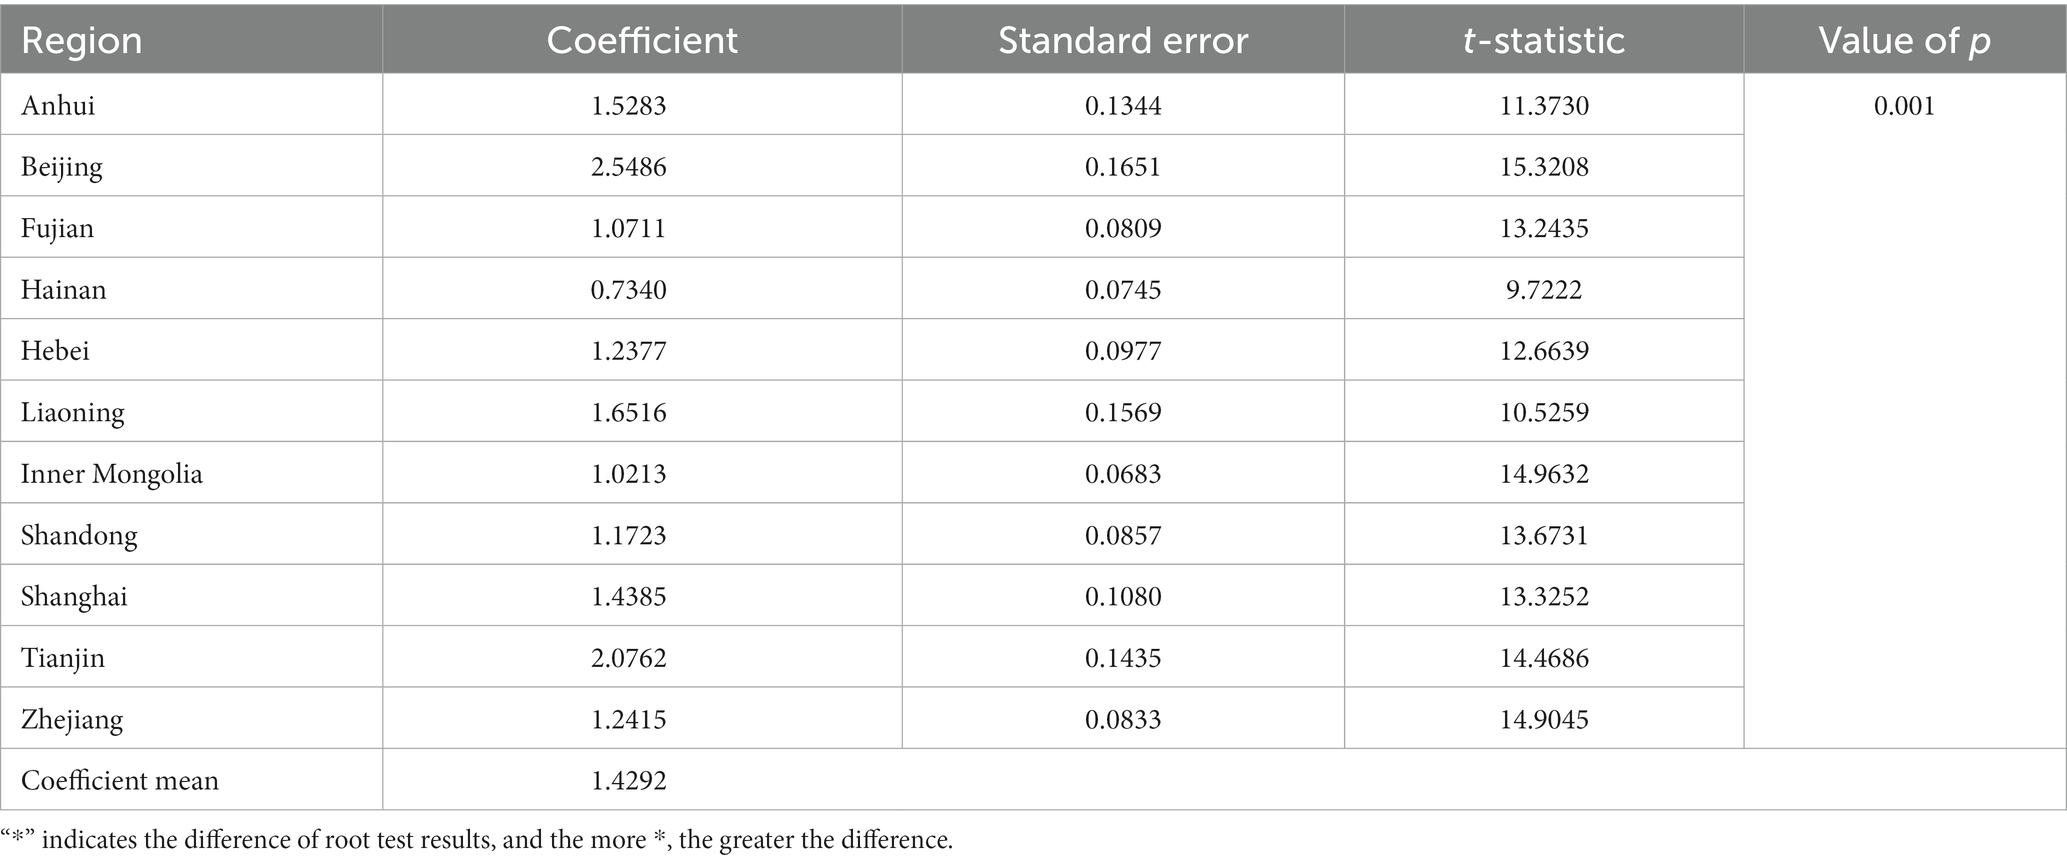
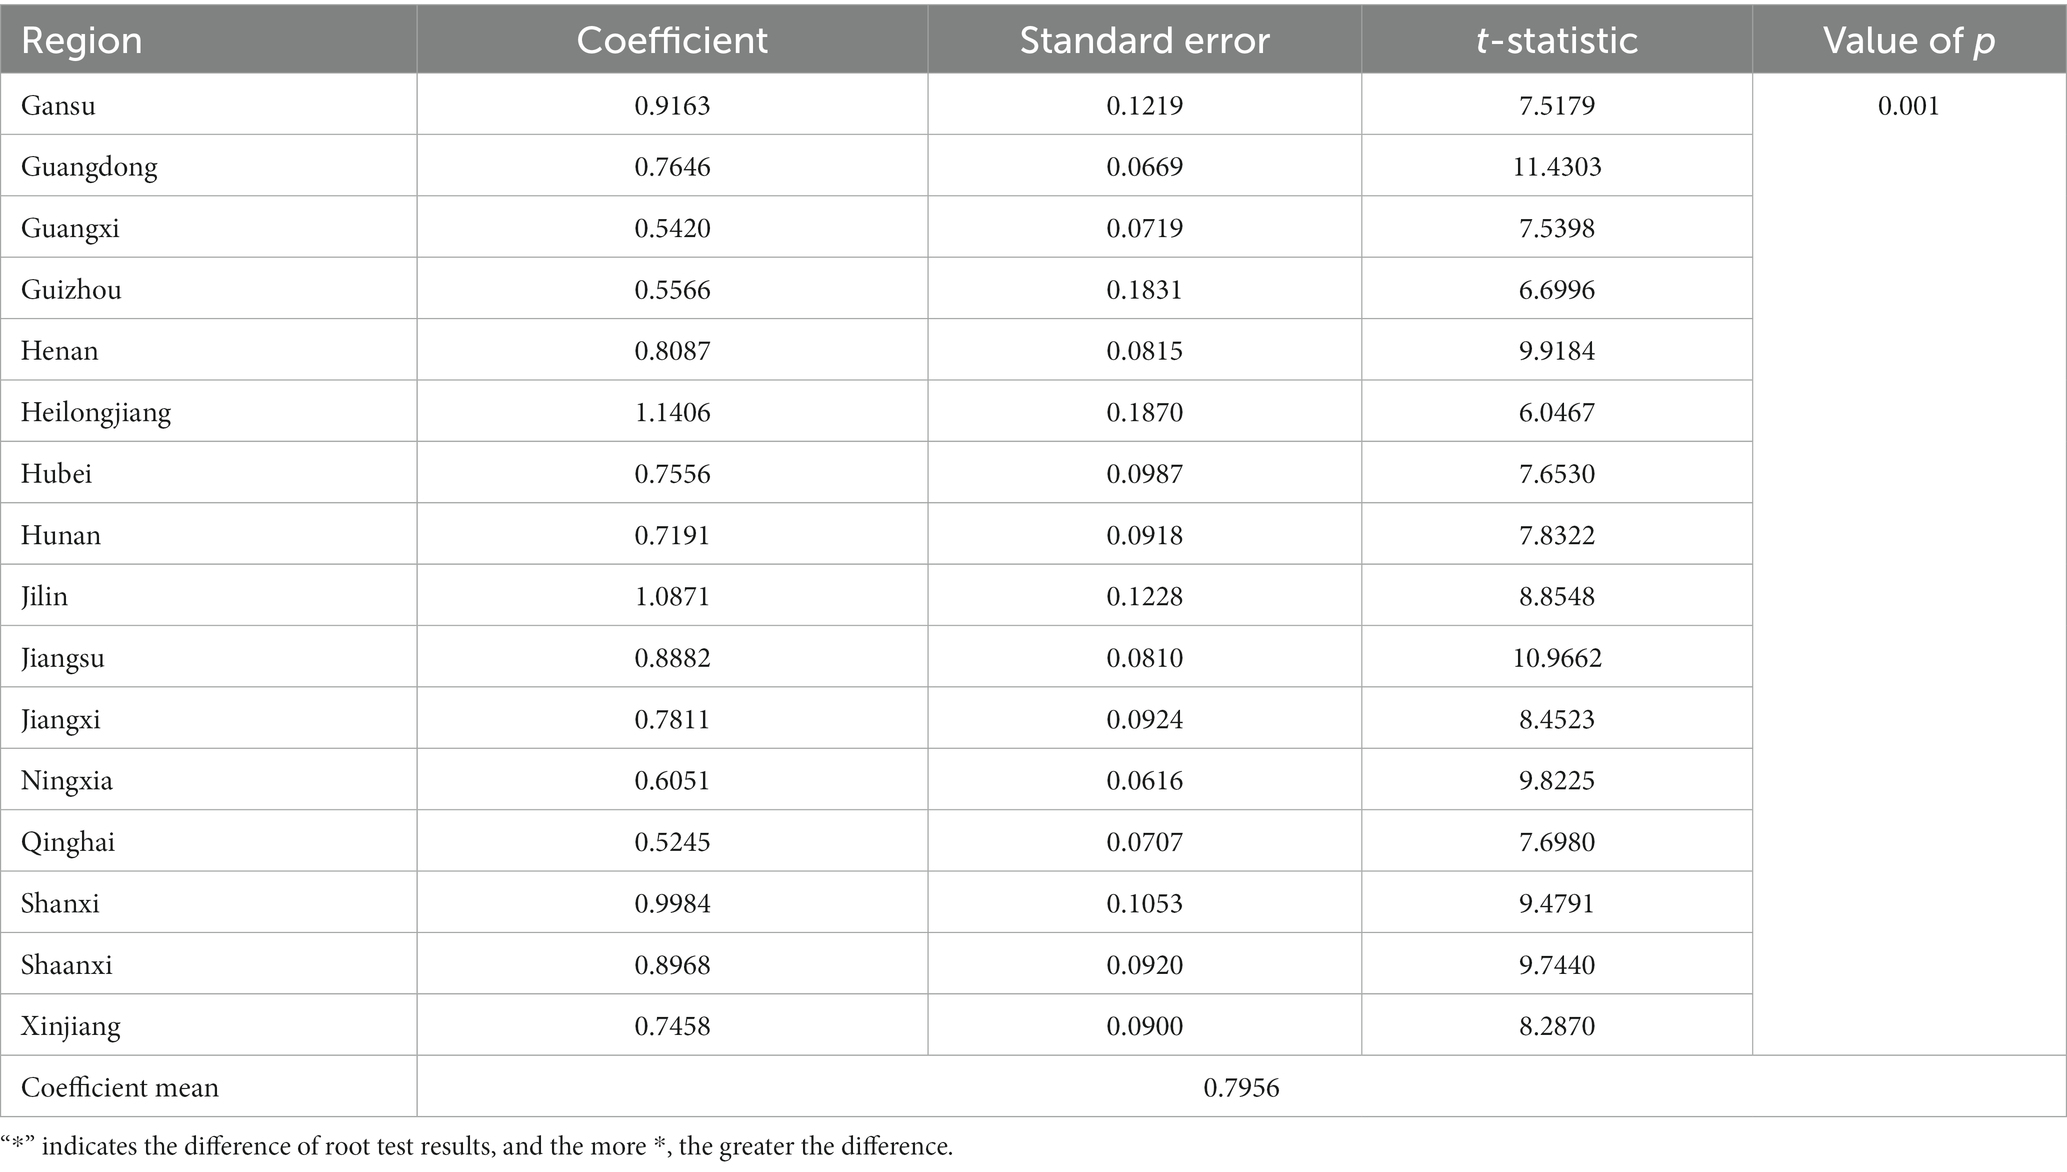
Specific coefficients for different regions are listed in Tables 8–10. From the perspective of coefficient, the energy elasticity coefficient is different between different regions, and there are differences between different regions.
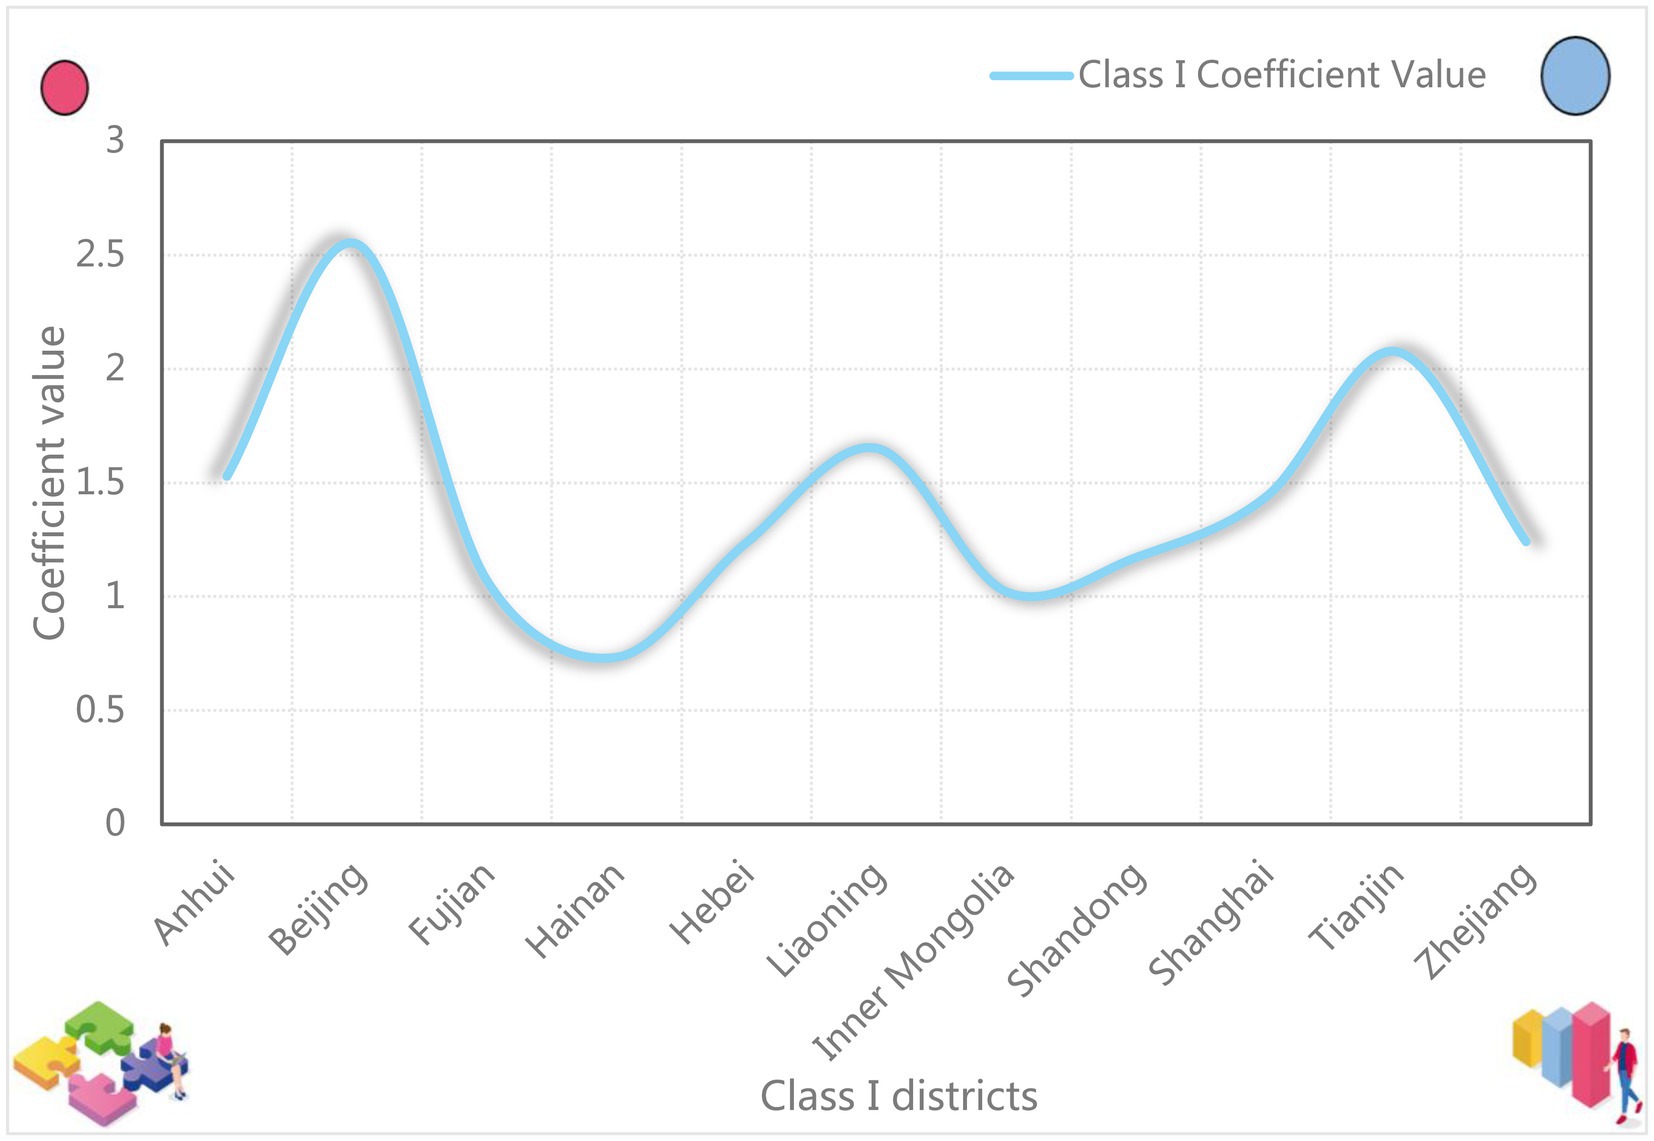
Table 8 shows that in Class I regions, the energy elasticity coefficients of all regions have passed the 1% significance level in the t-test. Except for a few provinces, most of them are 1–2. The largest number is 2.5486 and the smallest is 0.7340. The regional average is 1.4292. This shows that if one unit of energy is consumed in Class I regions, the economy would increase by 1.4292 units. The specific coefficient comparison of each province is shown in Figure 3. As shown in Figure 3, the difference between the maximum and minimum provinces in Class I regions is relatively large, with the median difference reaching 1.81 units.
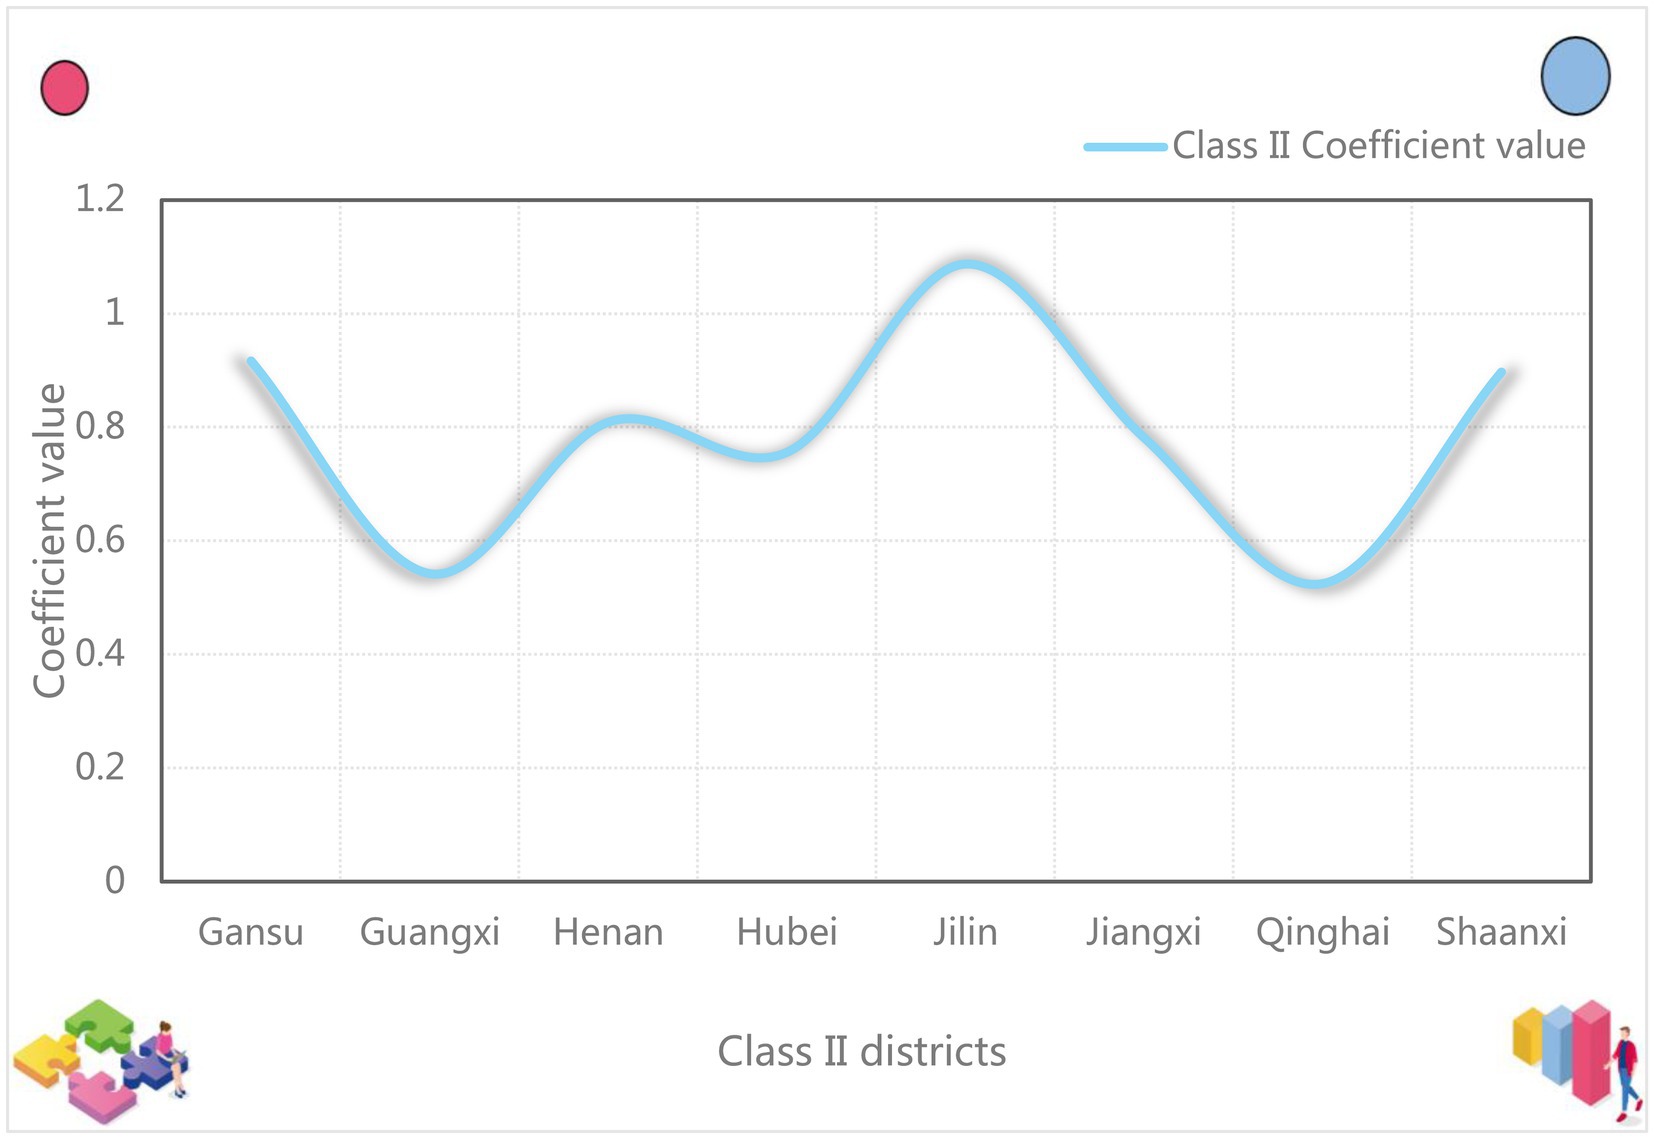
It can be seen from Table 9 that the elasticity coefficient of energy consumption of each province in the second region reaches a significant level of 1% in t test. Except for a few provinces, most areas are lower than 1. For example, the regression coefficients of Jiangxi, Ningxia, Qinghai, Shanxi, Shaanxi, Xinjiang and other provinces are only 0.7811, 0.6051, 0.5245, 0.9984, 0.8968, and 0.7458. The highest is 1.1406; the lowest is 0.5245; the regional average is 0.7956. This shows that every unit of energy consumed in Class II regions would drive the corresponding economic growth of 0.7956 units. The specific coefficient comparison of each province is shown in Figure 4. It can be seen from Figure 4 that the energy elasticity coefficients of different provinces and cities show good consistency.
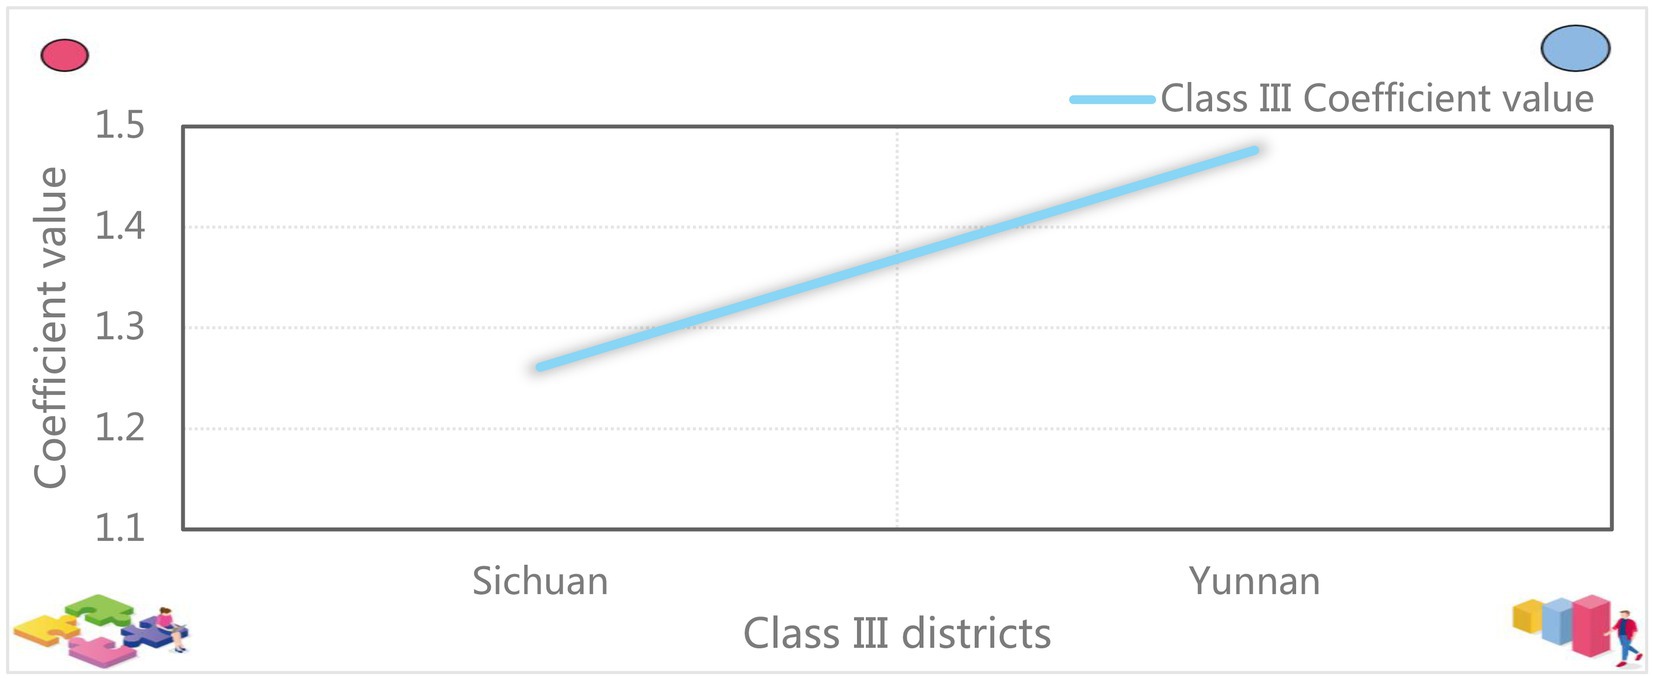
Table 10 shows that the elasticity coefficient of energy consumption of Sichuan and Yunnan provinces in Class III regions has reached a significant level of 1% in the t-test, which is 1.2609 and 1.4762, respectively. The average value reached 1.3685 and ranked first among the three regions. The coefficient comparison between provinces is shown in Figure 5. It can be seen from Figure 5 that each unit of energy consumed in Class III regions would drive the corresponding economic growth of 1.3685 units.
3.3.4. Error correction model test
The existence of cointegration shows that there is at least one causal link among different variables, but there is no clear causal link in a specific direction (Mose, 2021). Therefore, in order to understand the specific causal relationship, it is necessary to add residual items in the long-term cointegration test and establish a panel error correction model to analyze the causal relationship between the two. Table 11 lists the test results.
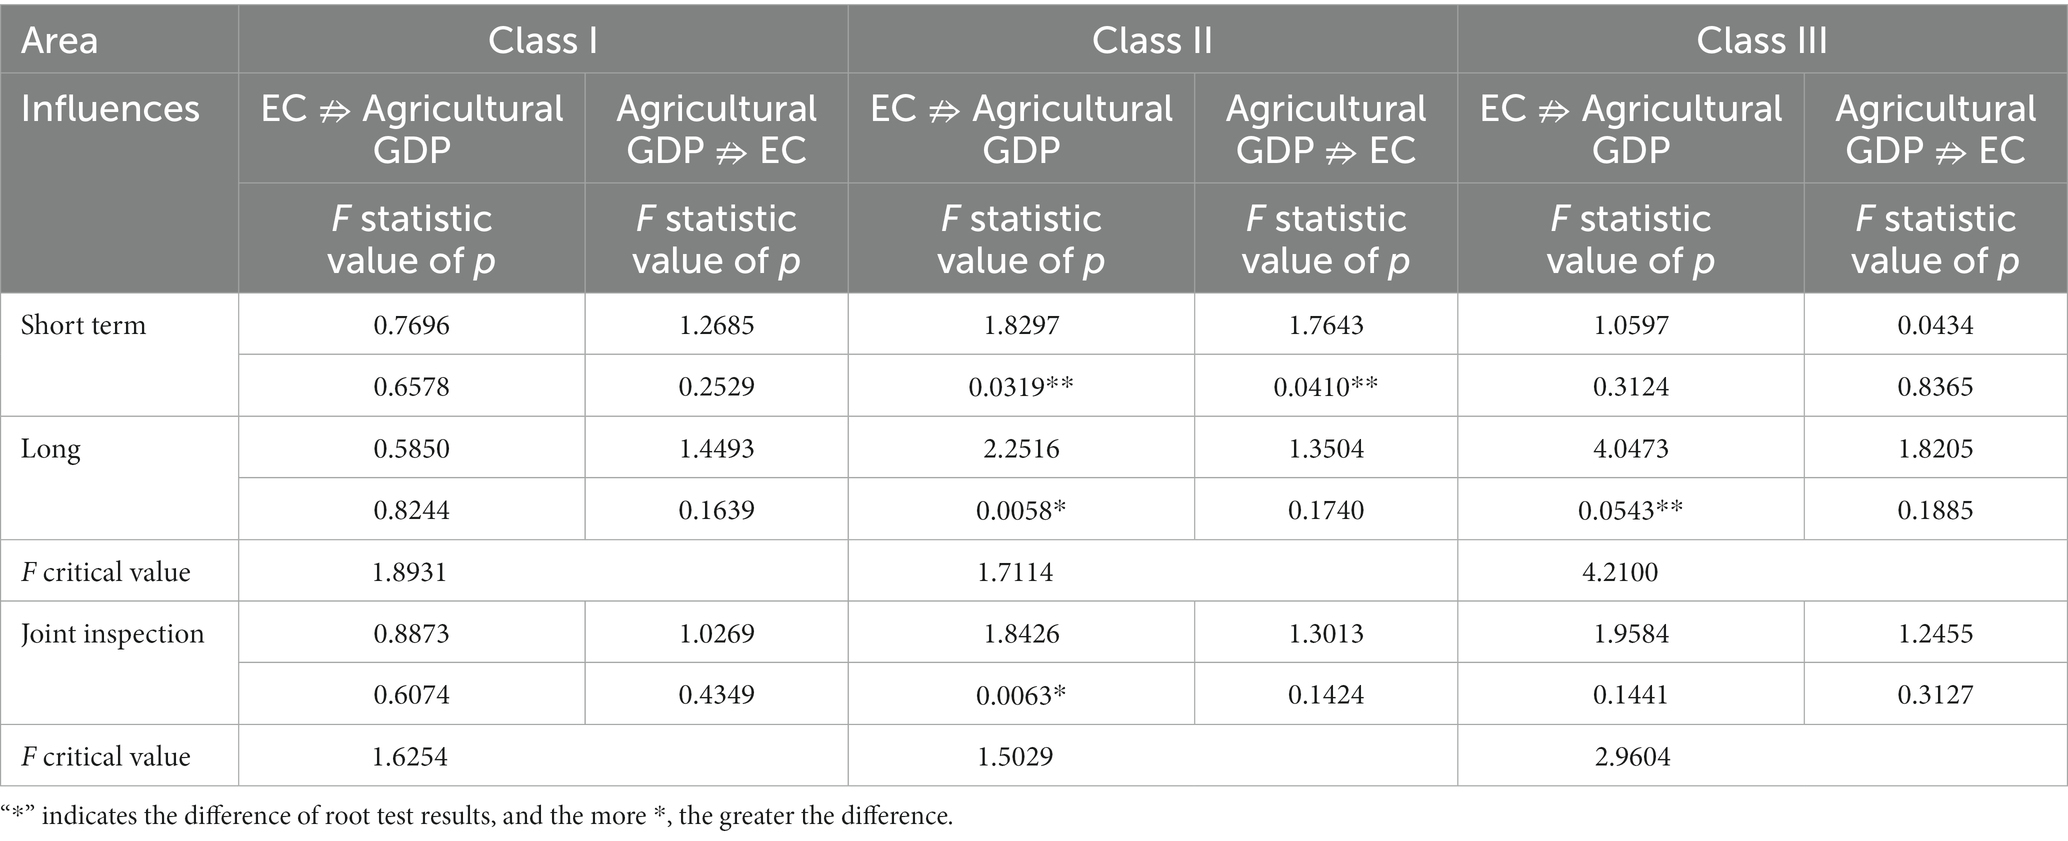
Table 11. Test results of the influence of energy consumption on economic growth among three regions.
To sum up, there is no causal relationship between energy consumption and economic development in Class I region either in the long term or in the short term. Therefore, whether it is long-term or short-term planning, a model of energy conservation development can be established in this region (Hakim and Dewi, 2021).
Similarly, under the 10% significance level, it shows that energy consumption is the main factor of economic growth in both the long run and the short run. Therefore, in order to achieve the dual goals of “energy conservation and emission reduction” and “economic growth” in Class II areas, it is necessary to adjust the energy structure, improve energy utilization, and seek ways to clean and renewable energy. In the long run, energy conservation and emission reduction are feasible.
Class III regions can only deny the long-term view that “energy consumption is not the Granger cause of economic growth” to a significant extent of 10%, while others cannot deny that only long-term energy consumption is a one-way causal relationship of economic development. In other words, in Class III regions, energy consumption has no connection with economic development in the short term, and the implementation of electricity conservation would not limit economic development. However, in the long run, it would have a certain impact on economic development (Khan et al., 2019; Marques et al., 2019). Therefore, when formulating economic development strategies, policy makers in China should correctly understand the long-term relationship between energy consumption and economic growth and formulate corresponding development strategies.
4. Conclusion
By building panel data of energy consumption and Agricultural GDP of 29 provinces, cities and autonomous regions in China, the correlation between energy consumption and economic development is obtained through the empirical analysis of panel data of different provinces in China. It could be seen from the above that the long-term and short-term causal relationship between energy consumption and economic growth in different regions was different. China is a large developing country, and there are significant spatial differences in regional resource sharing. At the same time, regional economic development is extremely uneven. In developed areas such as coastal areas and Beijing Tianjin, the economy has developed rapidly, and the degree of industrialization is also in the forefront of the country. In the central and western regions, the development is relatively slow and the industry is backward. The equipment is outdated, and the technology is disconnected. Therefore, in order to coordinate regional economic development and shorten regional gap, it is necessary to formulate appropriate regional energy consumption policies and strategies. That is to say, when formulating energy economic development strategies, decision-makers in different regions face different policy choices. Although the research in this paper has a certain reference function for regional energy consumption and economic development, the selection of the data range in this paper is still insufficient. This paper only uses the economic development data of each region for 1 year as the basis of analysis, and the universal applicability of the conclusions still needs further verification. In the future research, we will continue to expand the scope and depth of research, constantly improve the quality of research, and study the impact of energy consumption on regional economic development from more perspectives to promote the healthy development of regional economies.
Data availability statement
The original contributions presented in the study are included in the article/supplementary material, further inquiries can be directed to the corresponding author.
Author contributions
TJ: writing-original draft preparation. ZC: editing data curation and supervision. All authors contributed to the article and approved the submitted version.
Funding
This work was supported by the National Social Science Foundation of China project "Research on black land quality protection behavior and guiding policies of new agricultural operators in Northeast China" (no. 21BGL159).
Conflict of interest
The authors declare that the research was conducted in the absence of any commercial or financial relationships that could be construed as a potential conflict of interest.
Publisher’s note
All claims expressed in this article are solely those of the authors and do not necessarily represent those of their affiliated organizations, or those of the publisher, the editors and the reviewers. Any product that may be evaluated in this article, or claim that may be made by its manufacturer, is not guaranteed or endorsed by the publisher.
References
Ali, H. S., Law, S. H., Yusop, Z., and Chin, L. (2017). Dynamic implication of biomass energy consumption on economic growth in sub-Saharan Africa: evidence from panel data analysis. GeoJournal 82, 493–502. doi: 10.1007/s10708-016-9698-y
Chen, Y., Zhao, J., Lai, Z., Wang, Z., and Xia, H. (2019). Exploring the effects of economic growth, and renewable and non-renewable energy consumption on China's CO 2 emissions: evidence from a regional panel analysis. Renew. Energy 140, 341–353. doi: 10.1016/j.renene.2019.03.058
Dauda, L., Long, X., Mensah, C. N., and Salman, M. (2019). The effects of economic growth and innovation on CO 2 emissions in different regions. Environ. Sci. Pollut. Res. 26, 15028–15038. doi: 10.1007/s11356-019-04891-y
Firmansyah, C. A., and Sihaloho, E. D. (2021). The effects of women empowerment on Indonesia's regional economic growth. J. Ekonomi Pembangunan Kajian Masalah Ekonomi dan Pembangunan 22, 12–21. doi: 10.23917/jep.v22i1.11298
Hakim, D. R., and Dewi, S. (2021). Regional economic growth based on tourism, tax policy, and budget aspects. J. Ekonomi dan Bisnis 24, 211–236. doi: 10.24914/jeb.v24i2.4174
Huang, Z. (2020). The spatial spillover effect of input and output of scientific Progress on regional economic growth: the case of Guangdong Province. Open J. Stat. 10, 540–553. doi: 10.4236/ojs.2020.103032
Iqbal, M., Firdaus, M., Juanda, B., and Hakim, D. B. (2020). Impact of economic growth on regional development in Jambi Province. J. Perspektif Pembiayaan dan Pembangunan Daerah 7, 405–420. doi: 10.22437/ppd.v7i4.8275
Kameswara, B., and Suryani, T. A. (2021). Regional economic growth and air transportation in Indonesia especially outside Java: a backward method in multiple regression model. J. Tataloka 23, 190–200. doi: 10.14710/tataloka.23.2.190-200
Khan, S., Khan, M. K., and Muhammad, B. (2021). Impact of financial development and energy consumption on environmental degradation in 184 countries using a dynamic panel model. Environ. Sci. Pollut. Res. 28, 9542–9557. doi: 10.1007/s11356-020-11239-4
Khan, M. K., Teng, J. Z., and Khan, M. I. (2019). Effect of energy consumption and economic growth on carbon dioxide emissions in Pakistan with dynamic ARDL simulations approach. Environ. Sci. Pollut. Res. 26, 23480–23490. doi: 10.1007/s11356-019-05640-x
Kim, M. C. (2020). Empirical analysis of causal relationship between R&D investment, intellectual property and regional economic growth in Korea. J. Industrial Econ. Bus. 33, 853–872. doi: 10.22558/jieb.2020.6.33.3.853
Kochetkov, D., Larionova, V. A., and Vukovic, D. B. (2017). Entrepreneurial capacity of universities and its impact on regional economic growth. Econ. Reg. 1, 477–488. doi: 10.17059/2017-2-13
Lai, Q. (2020). The transportation infrastructure and regional economic growth—evidence from Dongguan Humen bridge. Mod. Econ. 11, 2055–2080. doi: 10.4236/me.2020.1112137
Li, Z. (2020). Industrial agglomeration and regional economic growth —analysis of the threshold effect based on industrial upgrading. Open J. Bus. Manag. 8, 971–982. doi: 10.4236/ojbm.2020.82061
Liu, L., Zhang, X., and Shi, L. (2017). Regional economic development level based on PCA and panel data model. Revista de la Facultad de Ingenieria 32, 426–432.
Marques, A., Martins, I. S., and Kastner, T. (2019). Increasing impacts of land use on biodiversity and carbon sequestration driven by population and economic growth. Nat. Ecol. Evol. 3, 628–637. doi: 10.1038/s41559-019-0824-3
Mikheeva, N. N. (2017). Diversification of regional economic structure as growth strategy: pros and cons. Reg. Res. Russ. 7, 303–310. doi: 10.1134/S2079970517040062
Mose, N. (2021). Do fiscal transfers foster regional economic growth? Financ. Rev. 17, 19–27. doi: 10.2478/fiqf-2021-0003
Mukhametzhan, S. O., Junusbekova, G. A., and Daueshov, M. Y. (2020). An econometric model for assessing the asymmetry of urban development as a factor of regional economic growth: the case of Kazakhstan. Industrial Eng. Manag. Syst. 19, 460–475. doi: 10.7232/iems.2020.19.2.460
Ren, W., Xue, B., Yang, J., and Lu, C. (2020). Effects of the Northeast China revitalization strategy on regional economic growth and social development. Chin. Geogr. Sci. 30, 791–809. doi: 10.1007/s11769-020-1149-5
Soava, G., Mehedintu, A., Sterpu, M., and Raduteanu, M. (2018). Impact of renewable energy consumption on economic growth: Evidence from European Union countries. Technol. Econ. Dev. Econ. 24, 914–932. doi: 10.3846/tede.2018.1426
Tu, J., and Ma, D. (2017). Regional economic growth and carbon emissions in China: a spatial econometric analysis of EKC. C e Ca 42, 815–821.
Zhao, J., Ji, G., Yue, Y. L., Lai, Z., Chen, Y., Yang, D., et al. (2019). Spatio-temporal dynamics of urban residential CO2 emissions and their driving forces in China using the integrated two nighttime light datasets. Appl. Energy 235, 612–624. doi: 10.1016/j.apenergy.2018.09.180
Keywords: economic growth, panel data, energy consumption, granger causation, regional agricultural economic
Citation: Jiang T and Chen Z (2023) Analysis of the impact of energy consumption on regional agricultural economic growth based on panel data. Front. Ecol. Evol. 11:1134448. doi: 10.3389/fevo.2023.1134448
Edited by:
Xin Ning, Institute of Semiconductors (CAS), ChinaReviewed by:
Bosede Ngozi Adeleye, University of Lincoln, United KingdomGabriel Gomes, State University of Campinas, Brazil
Haitao Yang, Beijing University of Technology, China
Copyright © 2023 Jiang and Chen. This is an open-access article distributed under the terms of the Creative Commons Attribution License (CC BY). The use, distribution or reproduction in other forums is permitted, provided the original author(s) and the copyright owner(s) are credited and that the original publication in this journal is cited, in accordance with accepted academic practice. No use, distribution or reproduction is permitted which does not comply with these terms.
*Correspondence: Zhongsheng Chen, Y2hlbnpoc0Bjd251LmVkdS5jbg==
 Tianlong Jiang1
 Zhongsheng Chen