 Hou Zhenkun
 Li Zhanlin
 Han Zejun1*
95% of researchers rate our articles as excellent or good
Learn more about the work of our research integrity team to safeguard the quality of each article we publish.
Find out more
ORIGINAL RESEARCH article
Front. Ecol. Evol. , 14 June 2023
Sec. Interdisciplinary Climate Studies
Volume 11 - 2023 | https://doi.org/10.3389/fevo.2023.1133631
This article is part of the Research Topic Curbing Global Warming with Underground Mine Space for Energy Storage View all 6 articles
The bearing capacity of drilling with pre-stressed concrete pile cased pile (hereafter referred to as DPC pile) is closely related to the grouting effect on an annular gap between a pre-stressed high-strength concrete (PHC) pipe pile wall and a hole wall (hereafter referred to as the an annular pile–soil gap). A physical grouting model testing system for the DPC pile based on a high-precision three-dimensional (3D) scanner and a multi-functional grouting box has been independently developed. In this method, 3D geometric size and spatial point information of the grouting stone have been quantitatively characterized. The influences of the water–cement ratio, grouting pressure, collapsed holes, and falling sand have been studied. The conclusions are obtained as follows: (1) a quantitative characterization method of the 3D geometric dimensions of the grouting stone based on a 3D scan is accurate and reliable and can overcome the shortcomings of traditional manual measurement. (2) In the same horizontal plane, grouting body thickness gradually decreases as its horizontal distance from the grouting outlet increases, and the higher the elevation, the greater the rate of decrease; conversely, the lower the elevation, the slower the rate of decrease. When the horizontal distance from the pulp outlet is equal, slurry thickness gradually decreases as the height increases. (3) For the grouting liquid with a water–cement ratio of 0.5, grouting pressure should not be less than 0.6 MPa. (4) When the falling sand is not far above the grouting outlet, a grouting root system can be formed, whose grout veins, complexity, and grout coverage area can be optimally improved by changing the fluidity of the grout and grouting pressure. When the falling sand is on the side of the grouting outlet or the surface of the grouting outlet but far away from the grouting outlet, it is easy to be avoided by the grout, which can greatly reduce the grouting effect.
Drilling with pre-stressed concrete pile cased pile (hereafter referred to as DPC pile) is a new type of energy-saving, environmentally friendly, and non-soil-squeezing pre-stressed high-strength concrete (PHC) pipe pile foundation with large diameters ranging from 800 to 1,400 mm (Yang, 2018; Tang et al., 2020; Hou et al., 2021, 2022a,b). Engineering practice shows that the DPC pipe is a kind of the friction end-bearing pile, and the bearing capacity of the DPC pile with a diameter of 1.0 m is usually more than 20,000 kN (Chen et al., 2018; Liu et al., 2021; Hou et al., 2022a,b). The bearing capacity of the DPC pile is higher by 33.42 and 23.16%, respectively, than bored piles and hammered pipe piles with the same pile diameter. Therefore, we strongly suggest that the DPC pile plays an active, leading, and exemplary role in super high-rise buildings, long-span bridges, large seaports, and other infrastructure projects (Fan et al., 2019, 2020a,b; Li et al., 2022a,b). The pipe wall of DPC piles supports the surrounding soil during construction; as a result, there is no need for mud to serve as wall protection, which saves energy and protects the environment (Figures 1A, B). The DPC pile is built with a hole diameter that is 20 mm larger than the outer diameter of the pipe pile. That is, an annular gap between the PHC pipe pile wall and the hole wall (hereafter the annular pile–soil gap) with a thickness of ~10 mm is formed between the hole wall and the outer wall of the PHC pipe pile, which can be referred to as the “pile–soil clearance.” This volume needs to accommodate pile-side grouting through a grouting pipe embedded in the pile pipe wall to fill the pile–soil clearance and bond the pile-side soil. Figures 1C, D depicts this, with green arrows representing the flow effect of slurry on the pile–soil gap and blue and red arrows representing the effect of the grout entering the soil mass in the form of compaction, splitting, seepage, etc. When the large-diameter PHC pipe pile is prefabricated, the grouting pipe is embedded in the pipe wall of the pipe pile. The effect of grouting fluid flow on the pile–soil clearance directly determines the pile-side friction. Relevant research results show that the bearing capacity of a DPC pile can exceed 20,000 kN, with the pile shaft resistance, accounting for 67.84–72.85% of the total. The difference in grouting effects results in more than 20% difference in the pile shaft resistance.
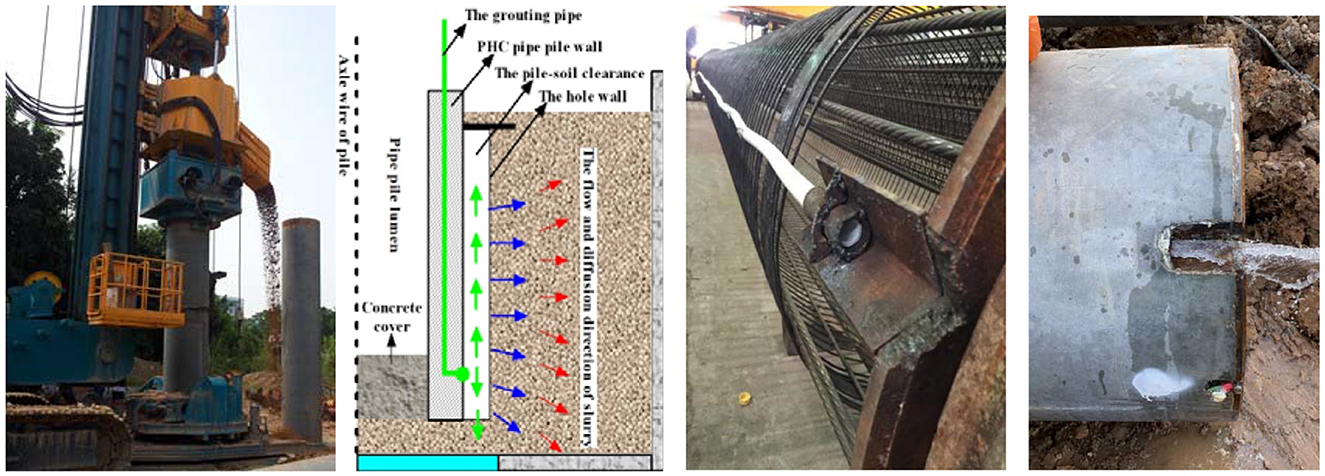
Figure 1. Drilling with pre-stressed high-strength concrete (PHC) pipe cased pile and a schematic diagram of the grouting liquid that flows and diffuses into an annular gap between the PHC pipe pile wall and the hole wall (hereafter referred to as the annular pile–soil gap). (A) Site construction drawing; (B) the construction process of a DPC pipe cased pile; (C) embedded grouting pipe in the wall of the pipe pile; and (D) water through test of the grouting pipe.
Increasing the roughness of the pile–soil contact interface can significantly improve the bearing capacity of the pile foundation (Wang et al., 2011; Fan et al., 2019, 2020a; Li et al., 2022a,b). The larger the area of the grouting stone formed on the pile side of the heel pipe pile during drilling, the better the diffusion effect to the soil in the form of capillary claws, and the greater the pile side friction generated after grouting. International researchers have conducted extensive studies on the flow and diffusion characteristics of the grout in the stratum. Obtained the morphology of concretions in different grouting conditions by excavation and quantitatively characterized the properties and sizes of grout bubbles and grout veins, but their characterization mainly depended on ruler measurement, which is approximate and inaccurate. Sha et al. (2019) analyzed the flow and diffusion characteristics of grouting materials in sand and also analyzed the change rule of the flow and diffusion distance of the grout under different grouting pressures. Zhang et al. (2019) developed a set of visual testing systems for the diffusion process of fracturing and compaction grouting slurry in the sand layer, which allows for the visual analysis of a shape of the splitting channel in the grouting diffusion process. Gao et al. (2015) performed a visual slurry diffusion test in saturated sand. They analyzed the flow and diffusion process of slurry in saturated sand and revealed the diffusion mechanism of seepage grouting in the sand.
Using transparent soil instead of natural soil is the most intuitive way to achieve visualization in soil. Lehane and Gill (2004) analyzed the deformation law inside the soil by embedding small black beads in the transparent soil and tracking their movement using a high-definition camera. Based on this observation, many scholars introduced transparent soils into their pile foundation projects and conducted indoor test research using transparent soil material and particle image velocimetry (PIV) technology and obtained good results (Cao et al., 2014; Kong et al., 2015a,b; Zhang et al., 2018; Kang et al., 2021). Regarding post-grouting engineering of the pile foundation, research on post-grouting tests using transparent soil is relatively scarce. Cao et al. (2017) conducted a visual model test on the post-grouting construction process of a tapered pipe pile tip through PIV image processing technology and synthetic transparent soil and analyzed the change rules of the shape and diameter of the enlarged head during the post-grouting of the pile tip. Wen et al. (2019) conducted a post-grouting test of a steel micropipe pile, visualized the whole post-grouting process of this pile type, and found that the diffusion form of grouting slurry is mainly the horizontal and secondary split grouting. However, transparent soils are formed by mixing a certain graded granular material with pore liquid with the same refractive index and vacuuming to saturate, which is quite different from the actual soil mass. The existence of pore fluid greatly affects the physical and mechanical properties of the grout. In addition, the permeability and deformability of transparent and natural soils are quite different. Therefore, it is necessary to investigate the post-grouting of pile foundation engineering with transparent soils.
Theoretical research on the flow characteristics of the grouting fluid in the pile–soil clearance has become extremely difficult due to the time-varying and diverse nature of the grout, the complexity of the stratum environment and soil mass, and the concealment of the grouting project along with the difficulty of excavating the grouting body. Due to the small pile–soil clearance and the complex formation conditions caused by drilling, the flow law of the grout in the clearance is complex. For this purpose, a physical model testing system for grouting of the DPC pile is established to analyze the influence of different grouting processes on the flow law of the grouting fluid to optimize key grouting parameters and to explore the method to quantify the three-dimensional (3D) geometric size of the grouting stone.
As shown in Figure 2A, polyvinyl chloride (PVC) pipes with a diameter of 250 mm, a wall thickness of 6.2 mm, and a length of 3 m are selected as model piles. A square opening (2 cm × 3 cm) is cut at the design position as a grouting outlet. As shown in Figure 2B, a matching square opening is cut near the end of the grouting pipe, the other end is sealed with a high-strength glue, and the grouting pipe is inserted into the cavity of the model pile. Then, the square opening of the grouting pipe and the square opening of the model pile are bonded with a high-strength sealant to form a grouting channel on the pile side. Finally, the bottom of the model pile is sealed with a cement mortar to prevent the grouting liquid on the pile side from flowing out of the cavity of the model pile. Notably, in the field construction of a DPC pile, a roll of indented board paper that breaks easily in water is generally used to seal the grouting outlet of a DPC pile in advance to prevent its grouting outlet from being blocked by soil or cement slurry. When the grouting of the DPC pile is to be carried out, clean water under high pressure is used for flushing the indented board paper to open the grouting pipeline. Particularly, to prevent the slurry outlet from being blocked, it cannot be designed as a one-way rubber-banded round hole. The pile end of DPC piles needs to be embedded in the rock stratum at a distance of at least 0.5 m during construction. The one-way rubber-banded round hole is easily grounded by the rock stratum during the embedding process.
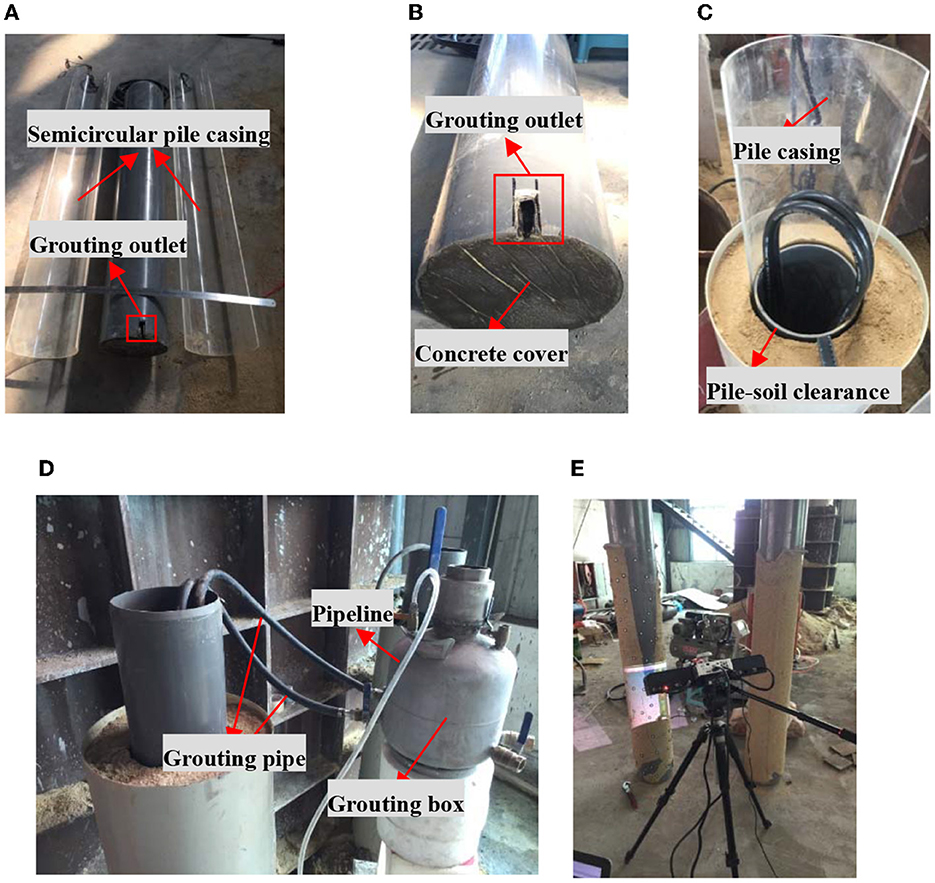
Figure 2. Multi-functional grouting system and related physical drawings. (A) Model pile and pile casing; (B) pile bottom grouting outlet and bottom sealing; (C) fabrication of pile–soil clearance; (D) photograph of the grouting site; and (E) a 3D scanning system.
As shown in Figure 2C, the model pile is clamped with two semicircular casings and fixed on a flat ground, and the pile casing and model pile are placed in the center of a cylindrical model box. The space between the outer side of the pile casing and the model box is then filled and compacted in layers. After filling, two semicircular casings are extracted. A pile–soil clearance of ~10 mm is formed between the model pile and the soil.
As shown in Figure 2D, the air inlet is connected to a multi-functional grouting box with the air outlet of the air compressor through a high-pressure air pipe. The grouting fluid is poured and mixed uniformly, and the pile-side grouting test is carried out according to the design scheme.
As shown in Figure 2E, the topsoil on the surface of the grouting body is cleaned and the identification points are posted. Based on the 3D optical surface scanning system, the point cloud data of the grouting body is quickly obtained using a multifrequency phase excitation grating technology extrapolation method and using a high-speed laser scanning measurement, which can be used to quantitatively characterize the 3D geometric dimensions of the grouting body.
The specific parameters of the sand used in the test are as follows: natural density = 2.16 g/cm3, water content = 3.12%, non-uniformity coefficient = 5.75, curvature coefficient = 2.86, fineness modulus = 2.25, sand gradation is good, and the sand density = 0.45 after filling, which is consistent with medium density sand.
As presented in Table 1, the influence of the water–cement ratio and grouting pressure on the collapse hole depends on the flow law of the grouting fluid on the pile side of the DPC pile, and, in this study, 11 physical simulation experiments on the flow law and the diffusion law of the grouting fluid on the pile side are conducted. Static pressure grouting is adopted, and the standard to stop grouting is 5 min after the grout emerges from the pile top. These 11 physical simulation experiments can be divided into three groups, whose variables include different water–cement proportions, varying grouting pressures from 0.4 to 0.6 MPa, and different positions of the collapsed hole. All grouting parameter designs are based on engineering practices and technical specifications of a DPC pile (JGJ/T 344., 2014). This design method is rational and close to reality.
Table 1. Experimental scheme.
To quantitatively analyze the flow law of the grouting fluid, manual measurement and automatic quantitative characterization methods are adopted to quantitatively characterize the size of the grouting stone. Using the grouting result of No. 1 DPC pile as an example, the advantages and disadvantages of two quantitative characterization methods are compared and analyzed.
Figure 3 shows the results of the manual measurement method. At distances of 50, 80, 95, and 125 cm from the grouting outlet, the grouting stones are cut in a direction perpendicular to the axis of the model pile with the axis of the grouting outlet as a reference line and the blue dot as the coordinate origin. Using a tape measure and a digitally displayed Vernier caliper, grouting stone thickness covered with the pile body is measured every 2 cm to the left and right sides of the blue dot, and the results are shown in a straight line in Figure 5.
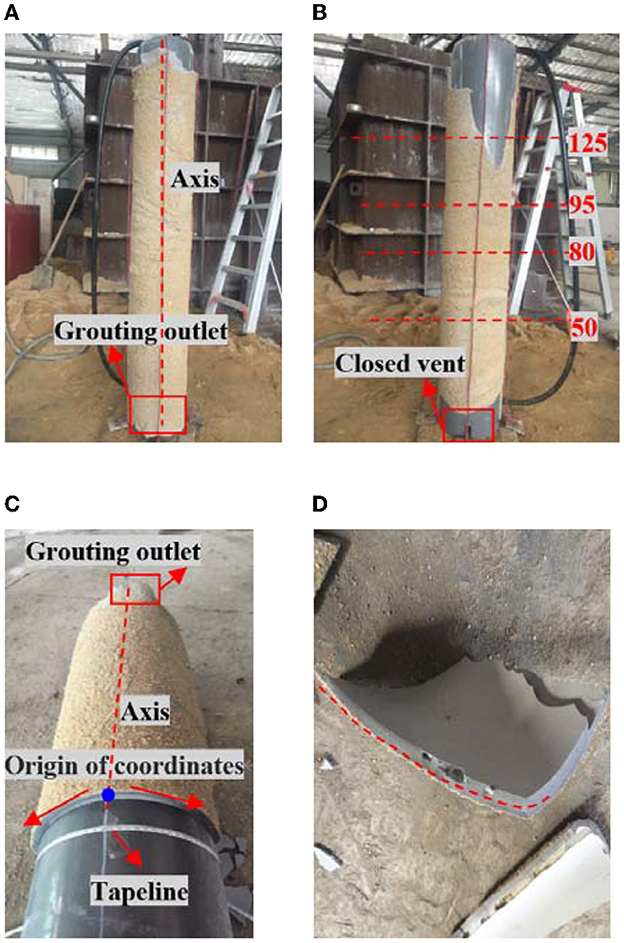
Figure 3. Manual measurement of the grouting stone. (A) Grouting stone on the side where the grouting outlet is located; (B) grouting stone on the side opposite to the grouting outlet; (C) grouting stone body thickness measurement method and left punctuation; and (D) the shape of the grouting stone.
Figure 4 shows an automatic method of quantitative characterization of the grouting stone based on a 3D scan, and its steps are as follows. As shown in Figure 4A, physical drawing by a 3D scanner can quickly obtain 3D point cloud coordinate data and spatial point position information of the grouting stone. Thus, the 3D geometric size of the grouting stone and its spatial distribution, including its length, width, and area, can be quantitatively characterized. As shown in Figure 4B, based on the 3D optical surface scanning system, the point cloud data, 3D coordinate data, and spatial point position information of the grouting stone can be obtained quickly, and then, the collected point cloud is saved as a PLY format file. As shown in Figure 4C, professional point cloud processing software is used to color the scanned empty piles and model piles, to delete their redundant points, and then to align the empty piles with the model piles using the pipe pile axes as reference points. Figure 4D shows that the thickness and 3D coordinates of the grouting stone at any position can be obtained by contrasting the results of the scanned empty pile and the model pile. Figure 4E shows that grouting thickness at different elevations can be determined to crosscut the model pile using the X–Z horizontal plane as the cross-section.
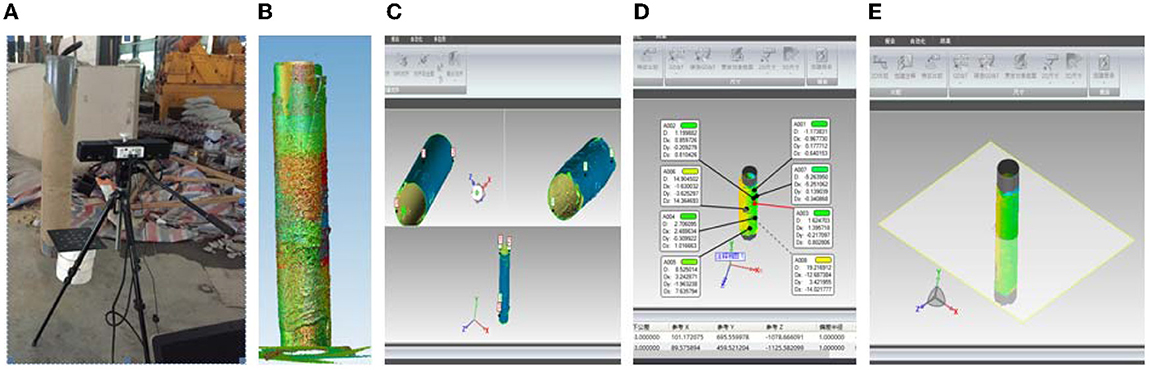
Figure 4. A 3D scanning and automatic measurement process of grouting body thickness. (A) 3D scanner; (B) 3D point cloud data; (C) alignment of an empty pile and the model pile; (D) 3D comparison to obtain differences at any position; and (E) derivation of grouting fluid thickness at different elevations.
Figure 5 shows the thickness distribution of the grouting mass of No. 1 DPC pile. The thickness distribution characteristics of the grouting stone in the axial plane perpendicular to the model pile are mainly studied to compare and analyze the manual testing method with the automatic quantitative characterization method. The positions perpendicular to the plane of the model pile axis are at 50, 80, 95, and 125 cm from the grouting outlet, and slurry thickness fitting formulas at corresponding positions are given as follows:
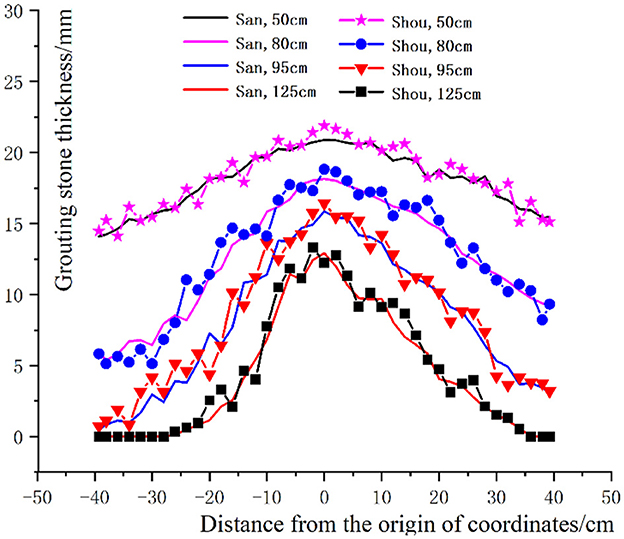
Figure 5. Distribution law of grouting stone thickness along a pile body. “Shou, 50 cm” refers to the thickness distribution rule of the grouting fluid at the elevation of 50 cm using manual test method; “San, 50 cm” refers to the thickness distribution rule of the grouting fluid at the elevation of 50 cm using the three-dimensional (3D) scanner test method.
At a distance of 50 cm from the grouting outlet at the pile bottom, the slurry thickness fitting formula is given as follows:
At a distance of 80 cm from the grouting outlet at the pile bottom, the slurry thickness fitting formula of is given as follows:
At a distance of 95 cm from the grouting outlet at the pile bottom, the slurry thickness fitting formula is given as follows:
At a distance of 125 cm from the grouting outlet at the pile bottom, the slurry thickness fitting formula is given as follows:
It is evident that both the manual measurement and automatic quantitative characterization methods can quantitatively characterize the distribution law of the grouting stone along the pile shaft. However, the results of the manual measurement method fluctuate greatly. When the grouting body is cut, it is difficult to ensure its cutting density and accuracy. Experimental data obtained by the automatic quantitative characterization method are relatively smooth, stable, and dense. As the workload is small, its testing means are fast and accurate.
The grout flows upward along an axis of the grouting outlet under the action of grouting pressure and flows horizontally to both sides of an axis. In the same horizontal plane, grouting stone thickness of the gradually decreases as its horizontal distance from the grouting outlet increases, with reduction rate increases with an increase in elevation. In the transverse direction, the thickness of the grouting stone gradually decreases with an increase in its horizontal distance from the grouting outlet. Under the same horizontal displacement from the grouting outlet, the thickness of the grouting stone gradually decreases with an increase in elevation, i.e., the thickness of the grouting stone is greater in the lower part of the pile shaft than in the upper part of the pile shaft. The filling effect of the pile–soil clearance by the slurry on the side of the axis where the grouting outlet is located is better than that on the side opposite to the grouting outlet. The filling effect of grout is poor on the side opposite to the grouting outlet, especially the pile body at the top, which is almost not covered by the grouting stone. This is because, when the grouting liquid flows into the top of the model pile, grouting pressure in the top slurry drops rapidly after the grouting liquid flows from the top pile–soil clearance into the ground, resulting in a lack of a sufficient pressure drive for the flow of the slurry in a circumferential direction. The thickness of the grouting stone exemplifies the change rule of “the grouting stone thickness is larger at the lower part of pile shaft than at the upper part of pile shaft” and “the grouting stone thickness is larger near the grouting opening than at far away from the grouting opening.”
In Figure 5, the volume of the grouting stone can be calculated by integration, namely:
Where V is the volume of the grouting stone, n is the divided section number of the grouting stone, hi is the elevation position from the pile bottom grouting outlet, i is the section corresponding to elevation hi, si is the area of the grouting body corresponding to section i, and si+1 is the area of the grouting stone corresponding to section i+ 1.
Figure 6 shows the calculation diagram of the grouting stone area si. If the thickness of the grouting body in section i is flattened and its coordinate system is consistent with Figure 5, the area si of the grouting stone is
Where xjor xj+1 is the horizontal distance from the origin coordinate; ljand lj+1are the thicknesses of the corresponding grouting stones at xjand xj+1, respectively; and C represents the perimeter of the model pile.
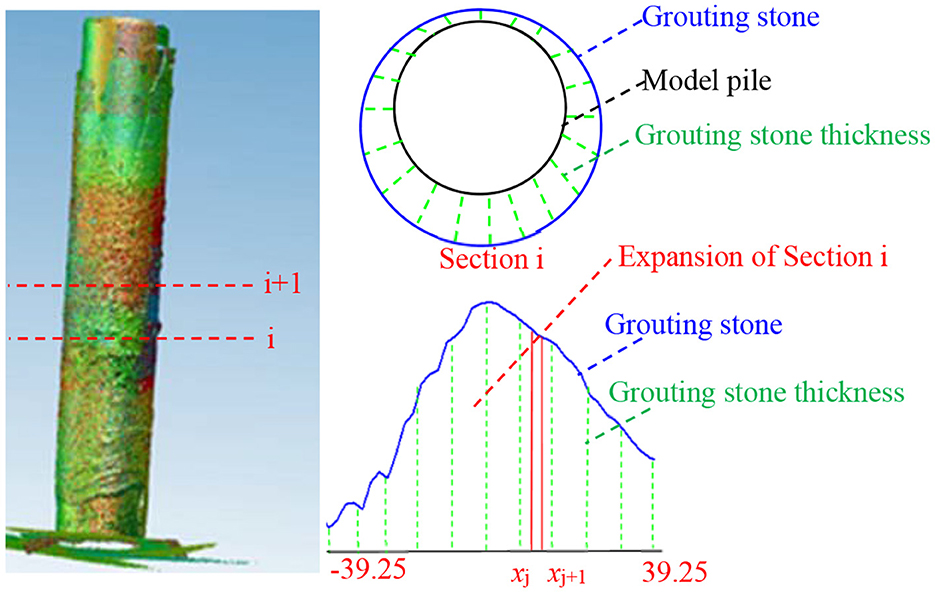
Figure 6. A schematic diagram of the calculation of the area of grouting stones.
According to the calculation, the grouting stone volume of No. 1 DPC pile calculated in Equation (2) is 18.32 L, which is slightly greater than its actual grouting volume during the experiment (15.58 L). This is due to an increase in the thickness of the grouting stone caused by the grouting fluid bonding the sand and inlay in the grouting stone.
A single-hole static pressure grouting test is conducted with water–cement ratios of 0.4, 0.45, 0.5, and 0.6 with a grouting pressure of 1 MPa, and the following conclusions are evident.
(1) As shown in Figure 7A, when the water–cement ratio is 0.4 (No. 12 pile), the grouting fluid cannot flow into the pile–soil clearance because of its poor liquidity. As shown in Figure 8A, the pile area covered by the grouting stone of No. 12 pile only accounts for 7.33% of the total area and its grouting stone volume is 1.56 L. The thickness of the grouting stone is found to be relatively uniform, i.e., the edge thickness of the grouting stone is equivalent to the average thickness, indicating that grouting fluid with poor fluidity is dragged forward and cannot flow properly in the pile–soil clearance.
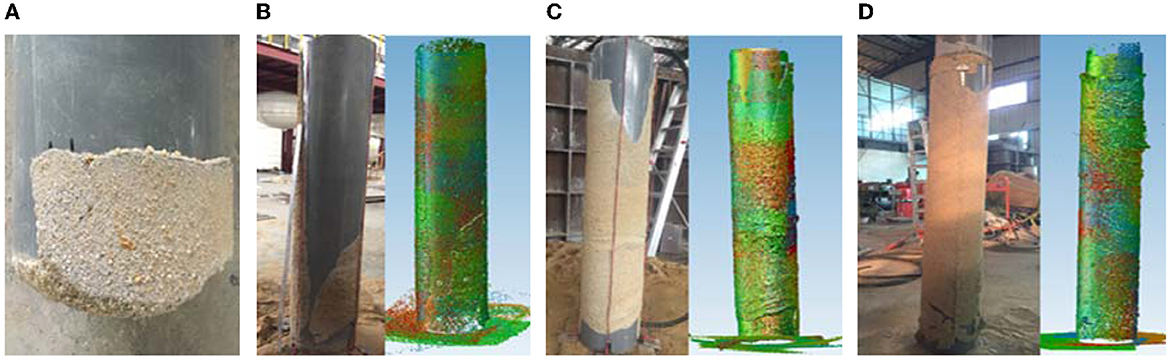
Figure 7. The influence of a water–cement ratio on the grouting effect (static pressure, single hole, grouting pressure 1 MPa). (A) No. 12 pile: water–cement ratio is 0.4; (B) No. 2 pile: water–cement ratio is 0.45; (C) No. 1 pile: water–cement ratio is 0.5; and (D) No. 4 pile: water–cement ratio is 0.6.
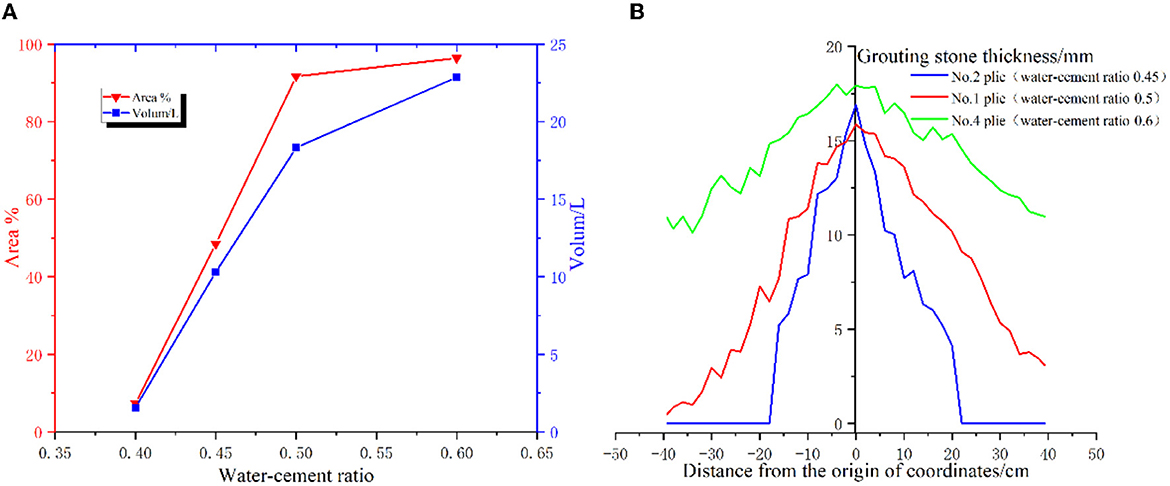
Figure 8. The influence of the water–cement ratio on the volume, area, and thickness of grouting stones (static pressure, single hole, grouting pressure 1 MPa). (A) The curve of grouting stone volume and area changing with the water–cement ratio; and (B) the distribution rule of grouting stone thickness along the pile circumference (pile shaft at an elevation of 95 cm). When the water–cement ratio is 0.4, the thickness of the grouting stone covering the pile shaft is 0 mm at an elevation of the pile shaft.
(2) As shown in Figure 7B, when the water–cement ratio is 0.45 (No. 2 pile), the fluidity of the grout improves. However, the grouting effect on the opposite side of the grouting outlet is less than ideal because the fluidity of the grouting fluid is still poor, causing the area of the pile body covering the grouting stone on the opposite side of the grouting outlet to remain small. As shown in Figure 8A, the volume of the grouting stone covering the shaft of No. 2 pile is 10.31 L and the grouting stone covers the area of No. 2 pile, which represents 48.46% of the total area of the pile shaft.
(3) As shown in Figure 7C, when the water–cement ratio is 0.5 (No. 1 pile), the grouting effect improves considerably. The volume of the grouting stone covering the shaft of No. 1 pile is 18.32 L, and the grouting stone covers the pile area of No. 1 pile, which represents 91.67% of the total area of the pile shaft. As shown in Figure 7D, when the water–cement ratio is 0.6 (No. 4 pile), the fluidity of the grout improves considerably. The volume of the grouting stone covering the shaft of No. 4 pile is 22.86 L, and the grouting stone covers the area of No. 4 pile, which accounts for 96.39% of the total area of the pile shaft. As shown in Figure 8A, the pile area covered by the grouting stone of No. 4 pile increases by 5.15%, and its grouting stone volume increases by 24.78% compared with No. 1 pile. The fundamental reason for these centers on the premise that when the water–cement ratio is <0.5, the fluidity of the grouting fluid has not reached a high level. Thus, the pile shaft is covered by a large area of the grouting stone, but the thickness of the pile shaft, especially on the side opposite to the grouting outlet, is insufficient.
(4) As shown in Figure 8B, taking as an example the thickness of the grouting stone in the horizontal plane with a vertical distance of 95 cm from the grouting outlet, the following conclusions are obtained.
When the water–cement ratio is 0.4 (No. 12 pile), the pile shaft is not covered by the grouting stone at an elevation of 95 cm. When the water–cement ratio is >0.4, the thickness of the grouting stone covered by the pile shaft decreases with an increase in its horizontal distance from the grouting outlet. The speed of descent gradually decreases with an increase in the water–cement ratio, and the area where the thickness of the grouting fluid becomes 0 also gradually decreases.
When the water–cement ratio is <0.5, the grouting effect on the pile side is poor. As the water–cement ratio increases, the area and volume of the grouting stone increase linearly, indicating that improving the liquidity of the grouting fluid can significantly improve the grouting effect. When the water–cement ratio is 0.5, although the pile area covered by the grouting stone is large, its stone thickness is insufficient and its effect is moderate. When the water–cement ratio is higher than 0.5, although the pile area covered by the grouting stone changes little, the thickness of the grouting stone increases significantly.
As shown in Figures 9, 10, single-hole static pressure grouting tests have been conducted with grouting pressures of 0.2, 0.4, 0.6, and 1.0 MPa with a water–cement ratio of 0.5, and the following conclusions can be drawn.
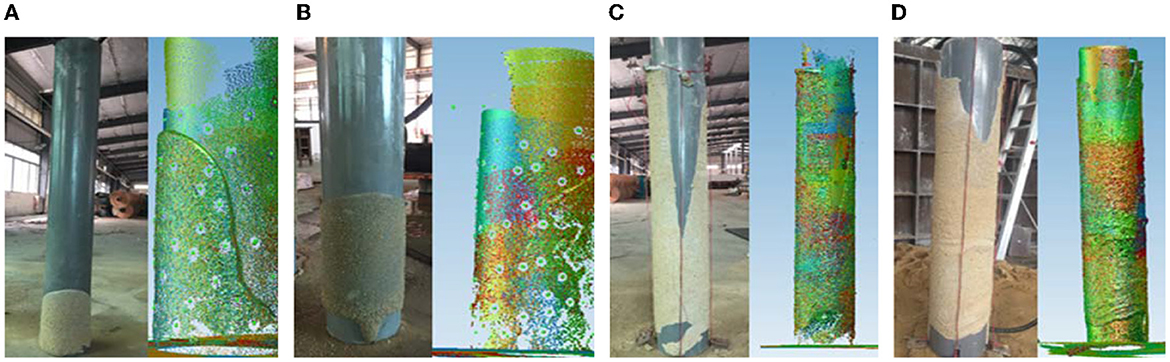
Figure 9. The influence of grouting pressure on the grouting effect (static pressure, single hole, water–cement ratio 0.5). (A) No. 7 pile: grouting pressure is 0.2 MPa; (B) No. 8 pile: grouting pressure is 0.4 MPa; (C) No. 10 pile: grouting pressure is 0.6 MPa; and (D) No. 1 pile: grouting pressure is 1 MPa.
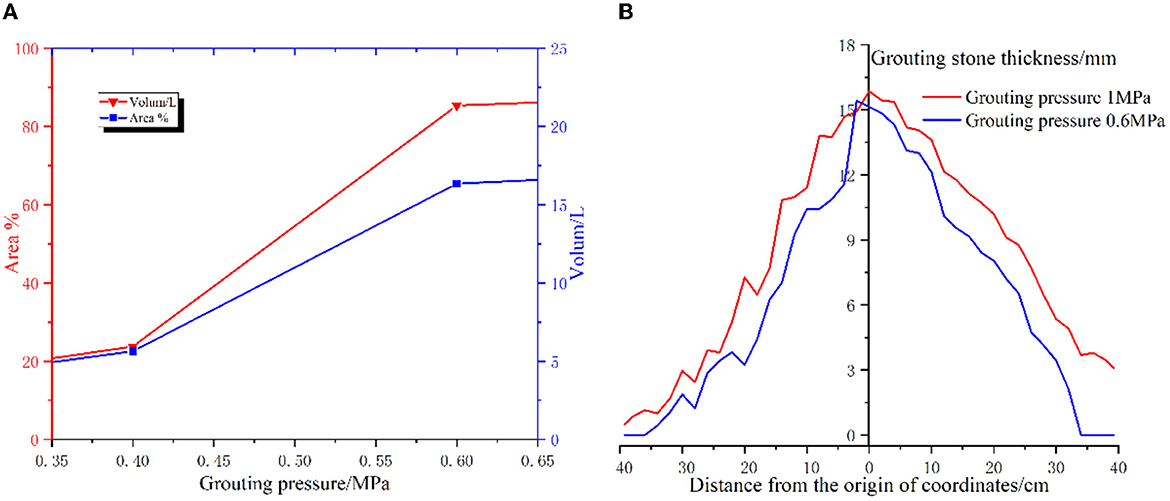
Figure 10. The influence of grouting pressure on the volume, area, and thickness of grouting stones (static pressure, single hole, water-cement ratio = 0.5). (A) The curve of grouting stone volume and area changing with the water-cement ratio, and (B) the distribution rule of grouting stone thickness along the pile circumference (pile shaft at an elevation of 95 cm).
(1) When grouting pressure is 0.2 (No. 7 pile) and 0.4 MPa (No. 8 pile), insufficient grouting pressure causes a poor flow effect of the grouting fluid in the pile–soil clearance. Two pile shaft areas covered by the grouting stone account for 11.62 and 23.75% of the total area of the pile shaft, respectively. The volume of these two pile shafts covered by the grouting stone is 2.82 and 5.64 L, respectively. Under low-pressure grouting conditions, the edge thickness of the grouting stone is equivalent to the average thickness, indicating that the grouting fluid slides around.
(2) When grouting pressure reaches 0.6 MPa (No. 10 pile), the grouting fluid flows rapidly upward, and the pile shaft on the grouting outlet side is almost completely covered by the grouting stone. The grouting effect is better in the lower pile shaft part than in the upper pile shaft part. The area of No. 10 pile covered with the grouting stone accounts for 85.35% of the pile shaft area, and its grouting stone volume is 16.34 L.
(3) When grouting pressure is 1.0 MPa (No. 1 pile), the grouting effect of the pile shaft on the side opposite to the grouting outlet increases significantly as grouting pressure increases. The area of No. 1 pile covered with the grouting stone accounts for 91.67% of the pile shaft area, and its grouting stone volume is 18.32 L. Although the grouting pressure adopted by No. 1 pile is relatively large, its grouting effect is limited compared with No. 10 pile. It is shown that, for the grouting fluid with a water–cement ratio of 0.5, the grouting effect cannot be significantly improved by blindly increasing grouting pressure because of its poor fluidity.
As shown in Figure 10B, taking as an example the grouting stone thickness in the horizontal plane at a vertical distance of 95 cm from the grouting outlet, the following conclusions can be obtained: When grouting pressure is <0.6 MPa, the pile shaft at an elevation of 95 cm is not covered by the grouting stone. When the grouting pressure exceeds 0.6 MPa, the thickness of the grouting stone covered with the pile shaft decreases as the horizontal distance from the grouting outlet increases. The speed of descent gradually decreases with an increase in grouting pressure, and the area with grouting fluid thickness of 0 also decreases gradually.
In conclusion, with an increase in grouting pressure, the area and volume of the grouting stone covered with the pile shaft increase linearly, indicating that increasing grouting pressure can significantly improve the grouting effect.
As shown in Figure 11, an experimental study on the influence of hole collapse and falling sand on the flow law of the grouting fluid on the pile side is carried out by adopting the single-hole static pressure grouting method with a water–cement ratio of 0.5.
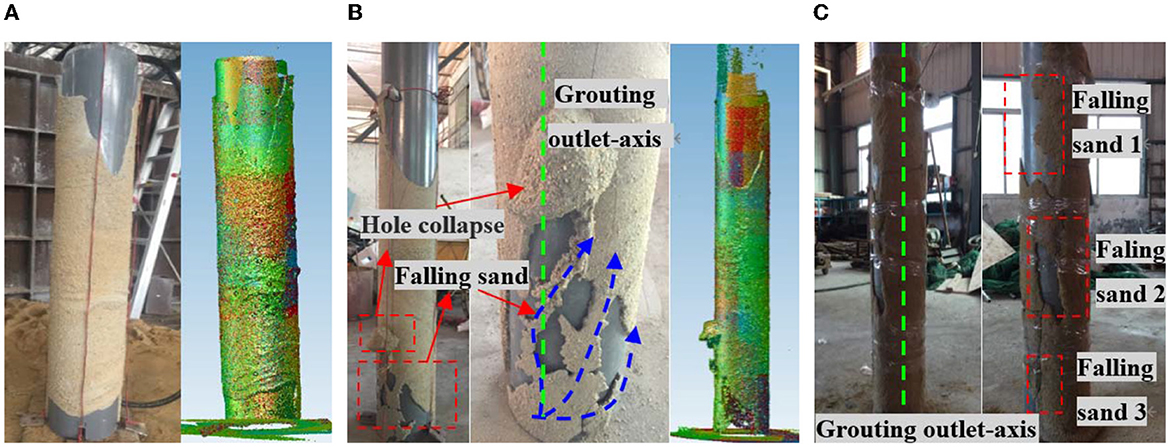
Figure 11. The influence of hole collapse and falling sand on the grouting effect (single-hole grouting, grouting pressure 1.0 MPa, water–cement ratio 0.5). (A) No. 1 pile—no sand falling and hole collapse; (B) No. 5 pile— engineering hole collapse; and (C) No. 6 pile—sand falling at the pile side.
Figure 11A shows the grouting effect of No. 1 pile, which is analyzed in previous research. Figure 11B shows the grouting effect of No. 5 pile whose hole collapses 60 cm above the grouting outlet. Except for the corresponding location of hole collapse and falling sand, the grouting effect of other pile shaft positions of No. 5 pile is similar to that of No. 1 pile. The grouting fluid flows out of the grouting outlet and is affected by falling sand, forming a root-like grout vein. That is, the grouting fluid flows along the weak area in the falling sand, forming three grout veins. The area among the three grout veins is not filled with the grout. The grouting effect of the corresponding pile shaft in the falling sand area is poor. The grout continues to flow upward after passing through the falling sand, filling the hole in the hole collapse and forming a hole collapse expansion head. Figure 11C shows the grouting effect of No. 6 pile, whose experimental results show that the flow of grouting fluid into the pile–soil clearance avoids the falling sand area, that is, there is no grout to cover the pile shaft in the corresponding position of the falling sand area. The existence of the falling sand area causes poor grouting effect on the pile side of the DPC pile, which is not conducive to pile side friction play.
Comparative test results show that a grouting root system can form when falling sand is directly over the grouting outlet and not far from the grouting outlet. When the falling sand area is on the side of the grouting outlet or above the grouting outlet but far from the grouting outlet, it will be easily bypassed by the grouting fluid, resulting in the absence of the grouting stone covering the corresponding pile shaft in the falling sand area.
Therefore, to increase the grouting effect of a DPC pile, it is absolutely necessary to prevent falling sand from filling the pile–soil clearance; for example, the soil on the pile top must be prevented from flowing into the pile–soil clearance before and after construction. During the construction process, the presence of sedimentary soil is inevitable in the pile–soil clearance at the bottom of the pile shaft due to incomplete cleaning of sediments. By improving the grouting process, grouting parameters, etc., grouting roots can be optimally formed to increase the number and coverage area of grout veins at the pile bottom.
(1) Experimental data obtained by an automatic quantitative characterization method based on a 3D scan are stable, accurate, fast, and relatively smooth, with high data density and a small workload. This is a practical and feasible method for the thickness, volume, and area of the grouting stone.
(2) The thickness of the grouting stone is consistent with the change rules of “the grouting stone thickness is larger at the lower part of pile shaft than at the upper part of pile shaft” and “the grouting stone thickness is larger near the grouting opening than at far away from the grouting opening.”
(3) With an increase in the water–cement ratio, the area and volume of the grouting stone covered by the pile shaft linearly increase, which shows that the fluidity of grouting fluid can be improved to significantly improve the grouting effect.
(4) The area and volume of the grouting body covered with the pile shaft increase linearly as grouting pressure increases. It is suggested that grouting pressure should not be <0.6 MPa for a single-hole static grouting application with a water–cement ratio of 0.5.
(5) Falling sand formed by hole collapse is easily bypassed by the grouting fluid or forms a grouting root system. Most falling sand areas cannot be filled with the grouting fluid, which greatly reduces the grouting effect.
The original contributions presented in the study are included in the article/supplementary material, further inquiries can be directed to the corresponding author.
HZh: conceptualization, methodology, software, and final approval of the version to be published. LZ: substantial contributions to the acquisition, analysis, and revising it critically for important intellectual content. HZe: data curation and writing—original draft preparation. TM: visualization and investigation. LY: supervision. WL: software, validation, visualization, and investigation. SD: writing, reviewing, and editing. All authors contributed to the article and approved the submitted version.
This study received funding from the Science and Technology Program of Guangzhou Construction Engineering Co., Ltd., Guangzhou, Guangdong, China ([2022]–KJ002 and BH20220627543), the Science and Technology Program of Guangzhou Municipal Construction Group Co., Ltd., Guangzhou, Guangdong, China (BH20220627543 and [2022]–KJ002), the National Natural Science Foundation of China (Grant Nos. 52208336 and 42002249), and the Guangdong Basic and Applied Basic Research Foundation (2023A1515012826 and 2021A1515011691). The funding organizations were involved in the study of design, collection, analysis, interpretation of data, and article writing.
TM was employed by Guangzhou Construction Engineering Co., Ltd., Guangzhou, Guangdong, China and Guangzhou Municipal Construction Group Co., Ltd., Guangzhou, Guangdong, China. SD was employed by the Guangzhou Institute of Building Science Group Co., Ltd., Guangzhou, Guangdong, China.
The remaining authors declare that the research was conducted in the absence of any commercial or financial relationships that could be construed as a potential conflict of interest.
All claims expressed in this article are solely those of the authors and do not necessarily represent those of their affiliated organizations, or those of the publisher, the editors and the reviewers. Any product that may be evaluated in this article, or claim that may be made by its manufacturer, is not guaranteed or endorsed by the publisher.
Cao, Z., Kong, G., Liu, H., and Zhou, H. (2014). Model tests on pipe pile penetration by using transparent soils. Chin. J. Geotechn. Eng. 36, 1564–1569. doi: 10.11779/CJGE201408025
Cao, Z., Kong, G., Wen, L., and Li, H. (2017). Visualization model test on tapered pipe pile installation and pile tip grouting process. J. Railway Sci. Eng. 14, 922–927. doi: 10.19713/j.cnki.43-1423/u.2017.05.006
Chen, H., Hu, H., Tang, M., Yang, X, and Zhu, J. (2018). Hybrid bored prestressed concrete cased piles: equipment and construction procedures. J. Construct. Eng. Manag. 06018006, 1–6. doi: 10.1061/(ASCE)CO.1943-7862.0001578
Fan, J., Jiang, D., Liu, W., Wu, F., Chen, J., and Daemen, J. (2019). Discontinuous fatigue of salt rock with low-stress intervals. Int. J. Rock Mech. Mining Sci. 115, 77–86. doi: 10.1016/j.ijrmms.2019.01.013
Fan, J., Liu, W., Jiang, D., Chen, J., Tiedeu, W. N., and Daemen, J. K. (2020a). Time interval effect in triaxial discontinuous cyclic compression tests and simulations for the residual stress in rock salt. Rock Mech. Rock Eng. 53, 4061–4076. doi: 10.1007/s00603-020-02150-y
Fan, J., Xie, H., Chen, J., Jaing, D., Li, C., Wiloliam, N. T., et al. (2020b). Preliminary feasibility analysis of a hybrid pumped-hydro energy storage system using abandoned coal mine goafs. Appl. Energy 258, 114007. doi: 10.1016/j.apenergy.2019.114007
Gao, Y., Sui, W. H., and Liu, J. Y. (2015). Visualization of chemical grout permeation in transparent soil. Geotech. Test. J. 38, 774–786. doi: 10.1520/GTJ20140202
Hou, Z., Tang, M., Hu, H., Li, J., Zhang, S., Xu, X., et al. (2021). Comparative study on the vertical load-bearing capacity of the drilling with prestressed concrete pipe-cased pile based on in-situ and physical simulation tests. Rock Soil Mech. 42, 419–429. doi: 10.16285/j.rsm.2020.0845
Hou, Z., Tang, M., Hu, H., Liu, C., and Su, D. (2022a). Physical model tests on bearing performance drilling with prestressed concrete pipe-cased pile considering hole collapse. Chin. J. Geotech. Eng. 44, 153–163. doi: 10.11779/CJGE202201015
Hou, Z., Tang, M., Liang, S., and Zhu, Y. (2022b). Optimization of the physical and mechanical properties of grouting material for non-soil-squeezing PHC pipe pile. Crystals 12, 10. doi: 10.3390/cryst12010010
JGJ/T 344. (2014). Technical Specification for the Drilling With Prestressed Concrete Pile Cased Pile. Beijing: Ministry of Housing and Urban-Rural Development of the People's Republic of China, China Construction Industry Press.
Kang, Y., Fan, J., Jiang, D., and Li, Z. (2021). Influence of geological and environmental factors on the reconsolidation behavior of fine granular salt. Nat. Resour. Res. 30, 805–826. doi: 10.1007/s11053-020-09732-1
Kong, G., Cao, Z., Zhou, H., and Ding, X. (2015b). Experimental study on lateral bearing capacity of enlarged wedge-shaped pile using transparent soil. China Civil Eng. J. 48, 83–89. doi: 10.15951/j.tmgcxb.2015.05.010
Kong, G., Cao, Z., Zhou, H., and Sun, X. (2015a). Analysis of piles under oblique pullout load using transparent-soil models. Geotech. Test. J. 38, 725–738. doi: 10.1520/GTJ20140109
Lehane, B. M., and Gill, D. R. (2004). Displacement fields induced by penetrometer installation in an artificial soil. Int. J. Phys. Modell. Geotech. 1, 25–36. doi: 10.1680/ijpmg.2004.040103
Li, Z., Yang, F., Fan, J., Jiang, D., and Ambre, J. (2022a). Fatigue effects of discontinuous cyclic loading on the mechanical characteristics of sandstone. Bull. Eng. Geol. Environ. 81, 336. doi: 10.1007/s10064-022-02837-2
Li, Z., Yang, Z., Fan, J., and Fourmeau, M. (2022b). Fatigue mechanical properties of salt rocks under high stress plateaus: the interaction between creep and fatigue. Rock Mech. Rock Eng. 55, 6627–6642. doi: 10.1007/s00603-022-02983-9
Liu, C., Tang, M., Hu, H., Yue, Y., Hou, Z., and Chen, H. (2021). Model test study on vertical bearing characteristics of pipe piles while drilling considering pile bottom sediment. Rock Soil Mech. 42, 177–185. doi: 10.16285/j.rsm.2020.0550
Sha, F., Li, S., Lin, C., Liu, R., Zhang, Q., Yang, L., et al. (2019). Research on penetration grouting diffusion experiment and reinforcement mechanism for sandy soil porous media. Rock Soil Mech. 40, 4259–4270. doi: 10.16285/j.rsm.2019.0133
Tang, M., Hu, H., Cui, J., and Yang, X. (2020). The vertical bearing mechanism of hybrid bored prestressed concrete cased piles. Int. J. Civil Eng. 18, 293–302. doi: 10.1007/s40999-019-00466-7
Wang, Q., Zhao, C., Zhao, C., Xue, J., and Lou, Y. (2011). Influence of normal and reverse mud circulations on hole diameter of cast-in-situ bored piles. Chin. J. Geotech. Eng. 33, 205–208.
Wen, L., Kong, G., Zhang, Z., and Li, Q. (2019). Study on the diffusion and bearing capacity of post-grouting steel pipe micropiles in marine muddy soil. Eng. Mech. 36, 214–222. doi: 10.6052/j.issn.1000-4750.2018.03.0133
Yang, X. (2018). Experimental Study on Vertical Compressive Bearing Capacity and Seismic Performance of Drilling with Large Diameter PHC Pipe Cased Pile (Master's thesis). Guangzhou University, Guangzhou, China.
Zhang, J., Li, S., Zhang, Q., Zhang, X., Yang, L., Li, P., et al. (2018). Experimental research on destruction characteristics of tunnel mud inrush using transparent soils. China J. Highway Transport 31, 177–190.
Keywords: drilling with pre-stressed concrete pile cased pile, grouting stone, grouting pressure, grouting outlet, water–cement ratio, collapse hole
Citation: Zhenkun H, Zhanlin L, Zejun H, Mengxiong T, Yupeng L, Dingli S and Lei W (2023) Experimental research on the flow law of the grouting fluid in an annular gap between a non-soil-squeezing PHC pipe pile wall and a hole wall. Front. Ecol. Evol. 11:1133631. doi: 10.3389/fevo.2023.1133631
Received: 29 December 2022; Accepted: 31 January 2023;
Published: 14 June 2023.
Edited by:
Alexandre Chemenda, UMR7329 Géoazur (GEOAZUR), FranceReviewed by:
Ge Xinbo, Shandong University of Science and Technology, ChinaCopyright © 2023 Zhenkun, Zhanlin, Zejun, Mengxiong, Yupeng, Dingli and Lei. This is an open-access article distributed under the terms of the Creative Commons Attribution License (CC BY). The use, distribution or reproduction in other forums is permitted, provided the original author(s) and the copyright owner(s) are credited and that the original publication in this journal is cited, in accordance with accepted academic practice. No use, distribution or reproduction is permitted which does not comply with these terms.
*Correspondence: Han Zejun, empoYW5nZGd5QGdkdXQuZWR1LmNu
Disclaimer: All claims expressed in this article are solely those of the authors and do not necessarily represent those of their affiliated organizations, or those of the publisher, the editors and the reviewers. Any product that may be evaluated in this article or claim that may be made by its manufacturer is not guaranteed or endorsed by the publisher.
Research integrity at Frontiers
Learn more about the work of our research integrity team to safeguard the quality of each article we publish.