Abstract
The Yangtze River basin is a typical region of the world that has a well-developed economy but is also greatly affected by multiple climate extremes. An improved understanding of future climate trends and associated exposures in this region is urgent needed to address socioeconomic risks. This research aims to quantify historical and future projected population exposure to precipitation extremes in the Yangtze basin using meteorological records and downscaled climate models. The study found that the hazard zone for precipitation extremes during baseline period was primarily located in the mid-lower Yangtze basin, particularly around the Poyang Lake watershed. Climate projections for 2050 indicate a further increase in the occurrence of precipitation extremes in this hazard zone, while a decrease in extreme events is detectable in the upper Yangtze basin under higher radiative forcing. Future socioeconomic scenarios suggest a tendency for population growth and migration towards the lower Yangtze basin, resulting in aggravated climate risks in megacities. Multi-model simulations indicate that population exposure to precipitation extremes in the lower Yangtze basin will increase by 9–22% around 2050, with both climate and population factors contributing positively. Shanghai, Changsha, Hangzhou, Ganzhou, and Huanggang are identified as hotspot cities facing the highest foreseeable risks of precipitation extremes in the Yangtze basin.
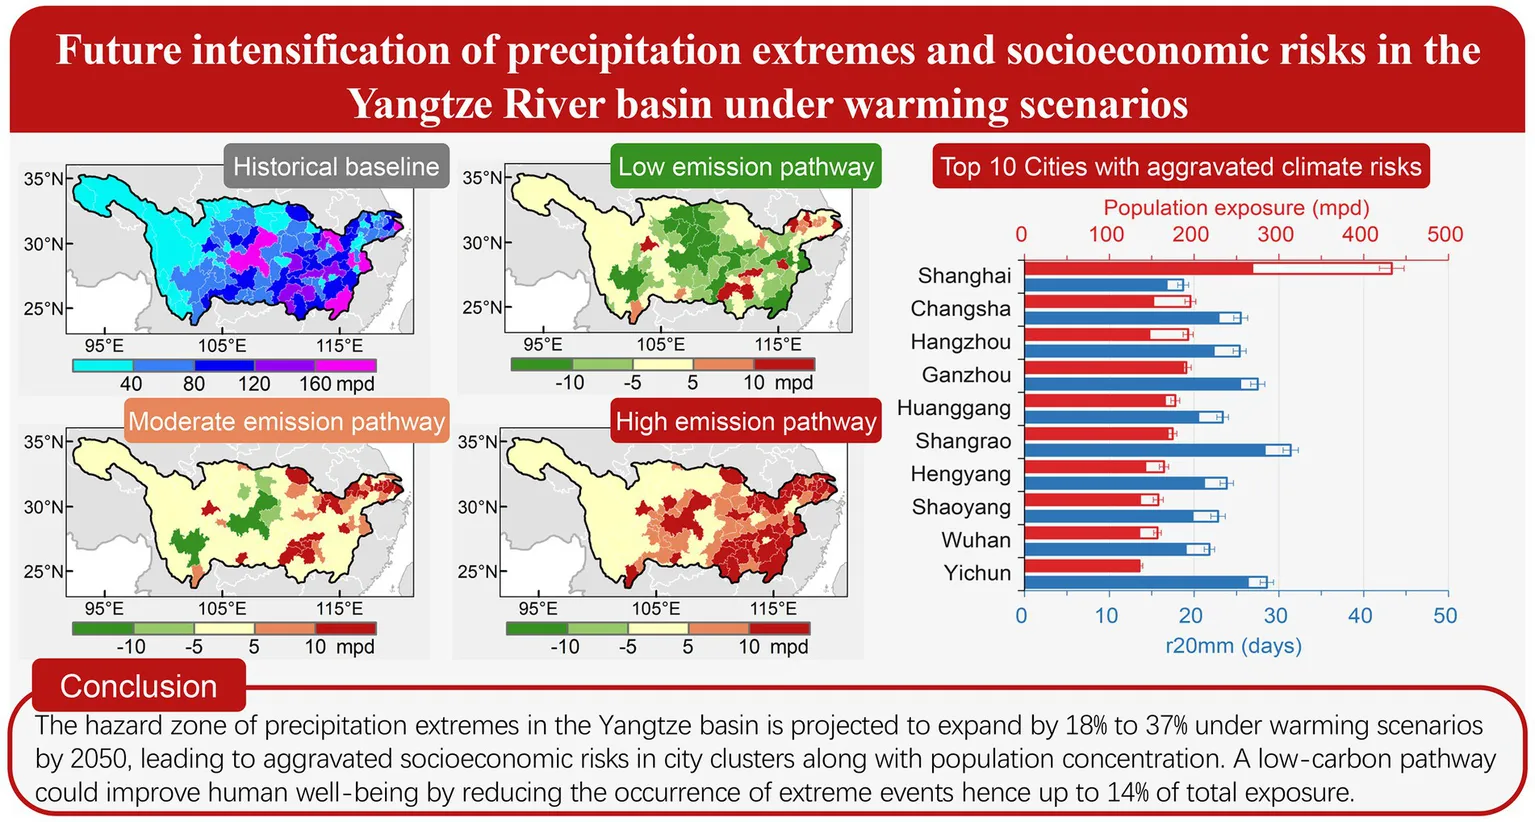
GRAPHICAL ABSTRACT
Highlights
- Climate warming leads to intensified precipitation extremes in the Yangtze basin.
- City clusters in the mid-lower Yangtze basin face elevated population exposure.
- A low-carbon pathway could substantially mitigate socioeconomic risks.
1. Introduction
The widespread emergence of precipitation extremes triggers off acute stresses on natural and human systems, and has caused extensive losses of human life, property, and infrastructures (Coumou and Rahmstorf, 2012; James et al., 2014). A warmer climate is believed to accelerate water cycle and alter precipitation patterns, leading to more extreme events in the coming future (Scoccimarro et al., 2013; Toreti et al., 2013). Recent decades, trends in the frequency, intensity, and duration of precipitation extremes have already been detected (Allan and Soden, 2008; Donat et al., 2013; Diffenbaugh et al., 2017), along with the amplified hazards and liability of climate related risks (Carleton and Hsiang, 2016). Clarification of regional complexities of extreme events has become an explicit motivation for decision makers and the public, which proves the urgency and necessity of localized climate projections.
The research into precipitation extremes has progressed enormously, partly due to the increasing number of unprecedent extreme events (Westra et al., 2014; Prein et al., 2016). Previous studies suggest that inland floods derived by precipitation extremes are likely to ascend in both frequency and magnitude as global warming (Arnell and Gosling, 2016; Wobus et al., 2017; Tellman et al., 2021). In the past half century, a rising trend of both average and extreme precipitation in China has been detected, especially in the Yangtze River basin (Guan et al., 2016; Zhou et al., 2016). Future simulations suggest that the frequency and intensity of precipitation extremes over the Yangtze basin will continue to enhance under radiative forcing (Pan et al., 2016; Li et al., 2021).
Precipitation extremes and associated secondary hazards (e.g., flash floods, landslides) are among the most destructive hazards in China. Intensified precipitation demonstrates the importance of risk projection, and population exposure is a widely used indicator to quantify potential socioeconomic risks (Jones et al., 2015). Under moderate-emission scenario, population exposure to precipitation extremes in China is expected to increase by nearly 22% by the end of 21st century (Chen and Sun, 2020), and the Yangtze Basin is identified as a global hotspot region threatened by precipitation extremes (Li et al., 2018; Sun et al., 2021). In the foreseeable future, urban land expansion and population aggregation will lead to elevated exposure to climate extremes in metropolitan regions (AghaKouchak et al., 2020). Hence, a city-level assessment of climate risks is critical for the formulation of land-use planning and urban adaptation measures.
Given that previous studies on climate risk projections are primarily conducted at global or national scales, here we take Yangtze basin, the largest river basin in China, as study region, to investigate whether there will be a significant trend in climate risks under future scenarios. We use historical observations, multi-model simulations, and socioeconomic pathways to identify (a) changes in the spatial pattern of precipitation extremes, (b) hotspot cities confronting higher socioeconomic risks, and (c) sources causing the changes in population exposure. According to hydrological and geographical differentiations, the Yangtze basin is divided into 3 sub-basins (i.e., upper, middle, and lower Yangtze basin) and 11 watersheds, as shown in Figure 1.
Figure 1
2. Materials and methods
2.1. Data sources
The observation dataset of gridded daily precipitation over 1981–2010 is provided by National Meteorological Information Center, China Meteorological Administration, with a spatial resolution of 0.25° × 0.25°. The dataset is constructed by anomaly approach method based on 2,472 meteorological stations in China, which has been widely applied as a reference to evaluate and calibrate model simulations over China (Chen et al., 2014; Wu et al., 2017). Here, we define 1981–2010 as baseline period, in consistent with the historical simulations of climate models.
The simulations from 10 climate models in the CMIP6 project (Supplementary Table S1) are selected through the availability of daily precipitation for historical run and future scenario runs (i.e., SSP1-2.6, SSP2-4.5, and SSP3-7.0; Taylor et al., 2012). The multimodel ensemble (MME) method can effectively reduce the uncertainty of the simulations, and well presents the observed patterns of daily precipitation extremes, which has been verified in numerous researches (Kharin et al., 2013; Scoccimarro et al., 2013; Sillmann et al., 2013). Only the first ensemble member (“r1i1p1f1”) of each model simulation is adopted. To facilitate the intercomparison of different models, we reformat all outputs to a common 0.25° × 0.25° resolution by bi-linearly interpolation, and only the values over the Yangtze basin are involved.
Shared Socioeconomic Pathways (SSPs) are coupled with representative concentration pathways (RCPs), and are often applied to project future scenarios of socioeconomic development (O'Neill et al., 2017). The projected population dataset is available at Socioeconomic Data and Applications Center (SEDAC), with 10-year intervals for 2010–2100 and a resolution of 1 km × 1 km on global land. SSP1, SSP2 and SSP3 scenarios in Shared.
Socioeconomic Pathways are selected to present population changes, which are corresponding to low-, moderate-, and high-emission scenarios (i.e., RCP2.6, RCP4.5, and RCP7.0), respectively.
2.2. Downscaling method
The Delta method is applied to calibrate and downscale the outputs of global climate models, in order to enhance resolution and reduce uncertainty of simulations at regional scales (Ramirez-Villegas and Jarvis, 2010). It is assumed the deviation between scenario and historical simulations is more reliable than both of them, and the observational datasets present local climate characteristics better than model simulations. For each output of climate models, the downscaling process consists of the following steps: (1) calculating the average of climate extremes in observational datasets of historical baseline period; (2) calculating the average of climate extremes in historical simulations of baseline period; (3) calculating the annual anomalies as absolute difference between scenario values and baseline values of model simulations; (4) interpolating annual anomalies into a higher-resolution grids in consistent with observation dataset by bi-linearly method; (5) appending the interpolated anomalies to observation baseline; (6) repeating the above steps for other model outputs; and (7) creating ensemble datasets of climate extremes under future scenarios by multi-model ensemble mean (MME) method.
2.3. Calculation of population exposure
The Expert Team on Climate Change Detection and Indices (ETCCDI) has defined a set of indices to facilitate analysis of the characteristics and evolution of climate extremes. Considering the warning criterion for meteorological hazards in the Yangtze basin, we adopt r20mm (count of days with daily precipitation amount ≥ 20 mm, also refer to as heavy precipitation days), r20mmtot (total precipitation within r20mm days), cr20mmd (maximum length of consecutive r20mm days), and rx5day (maximum 5-day precipitation) as extreme indices to reveal the changes in precipitation extremes over the Yangtze River basin. The historical baseline period is defined as 1981–2010, and the projected period is set as 2036–2065 to present climate state around 2050, driven by different future scenarios.
The population exposure is defined as the count of extreme events multiplied by the total population in each region (Jones et al., 2015). Gridded population datasets for 2000 and 2050 are used to represent population in baseline and future period, respectively. In order to avoid new errors in upscaling of gridded population, we resample all the extreme indices onto the same grid networks consistent with population data, then all the spatial calculations and mappings are conducted on 1 km × 1 km grid cells.
Changes in population exposure to climate extremes are linked to climate change, population growth, and their interaction effects. By factorization formula (Equations 1), the contribution of climate factor, population factor, and interaction factor can be separated and quantitatively estimated. Specifically, climate factor is represented as baseline population multiplied by extreme events anomaly, population factor is represented as baseline extreme events multiplied by population growth, and interaction factor is represented as extreme events anomaly multiplied by population growth.
where ΔEP presents the change in population exposure between baseline period and projected period, Pb presents baseline population, ΔC presents extreme events anomaly, Cb presents baseline extreme events, and ΔP presents population growth.
3. Results
3.1. Precipitation extremes in historical observation
The spatial average of r20mm in baseline period is 13.4 days/year in the Yangtze basin, while the spatial pattern shows significant regionality between sub-basins (Figure 2A). For the lower basin, the average of r20mm reaches 22.8 days/year, with 40% grids above 25 days, chiefly located in Poyang Lake watershed. The middle basin has an annual r20mm of 17.7 days in baseline period, in which the Dongting Lake watershed exceeds 20 days and Hanjiang River watershed holds less than 15 days. The frequency of heavy precipitation is comparatively lower in the upper basin, with an average of 8.5 days/year in baseline, among which the northern parts of Jinsha River and Mintuo River watershed occur less than 5 days/year.
Figure 2
The spatial pattern of r20mmtot is highly consistent with that of r20mm, and their correlation coefficient reaches 0.98 (Figure 2B). The averages of r20mmtot in the upper, middle, and lower basin are 314.7, 692.2, and 912.6 mm/year, respectively. Most of the Poyang Lake watershed has an annual r20mmtot of more than 1,000 mm in baseline. A range from 600 to 1,000 mm takes place in the mid-lower Yangtze basin, as well as Taihu and Dongting Lake watersheds. The rest of Yangtze basin broadly receives a r20mmtot below 600 mm/year, in which the northern part of Jinsha watershed less than 100 mm/year.
From the perspective of the maximum length of consecutive r20mm days, the lower Yangtze basin is still detected as the hazard zone in historical period, and the correlation coefficient is 0.83 between the spatial pattern of r20mm and cr20mmd (Figure 2C). The spatial averages of cr20mmd in the upper, middle, and lower basin are 3.0, 4.5, and 5.6 days/year, respectively. Broadly, the mid-lower basin has recorded a r20mm of more than 3 days/year in baseline period, among which the central and northern parts of Poyang Lake watershed exceed 5 days/year.
Rx5day reveals the peak intensity of heavy rainfall and is widely adopted in water-related hazard assessment. The spatial pattern of rx5day in the Yangtze basin is similar to that of r20mm, with a correlation coefficient of 0.87 (Figure 2D). The spatial averages of rx5day in the upper, middle, and lower basin are 138.9, 235.8, and 321.9 mm/year, respectively. About 80% grid cells in the lower basin have recorded a rx5day of more than 250 mm/year, and the most of Dongting Lake and Jialing River watersheds has also exceeded 200 mm/year in historical observation.
3.2. Future projection of precipitation extremes
Multi-model ensemble reveals the spatial pattern of precipitation extremes around 2050 under different emission scenarios. Given the highly correlation between extreme indices, we adopt r20mm as dominant indicator to investigate the changes in precipitation extremes across the Yangtze basin. Along the low-emission pathway, r20mm will reach 14.8 (±0.3) days in the Yangtze basin around 2050, among which the grids with r20mm > 25 days and > 30 days accounts for 11.2% and 2.3%, respectively, principally distributed in the Poyang Lake watershed (Figure 3A). Under moderate-emission scenario, the Yangtze basin will experience an additional increase of r20mm to 15.4 (±0.5) days around 2050, and the proportion of grids with r20mm >25 days and > 30 days will rise to 13.7% and 3.0%, respectively (Figure 3B). As for high-emission scenario, the proportion of grids with r20mm > 30 days will further expand to 23.7% in the lower Yangtze basin, or 3.9% in the whole basin (Figure 3C).
Figure 3
While the hazard zone expands in the mid-lower basin, it is notable that the pattern of upper basin remains basically stable, with only a very slight increase under the highest emission scenario. It indicates that the response of precipitation extremes to climate warming in the Yangtze basin is regionally varying. By comparing the spatial differences between SSP3-7.0 and SSP1-2.6 scenarios, about one-third of grids in the upper basin show a decrease in r20mm, whereas almost all the grids in the mid-lower basin show varying degrees of increment (Figure 3D). In summarize, precipitation extremes in the Yangtze basin are projected to show a Matthew effect in radiative forcing, that is, the high-intensity zone (i.e., the mid-lower basin) will continue to expand, whereas the low-intensity zone (i.e., the upper basin) will remain stable or even gradually weaken in a warmer world.
3.3. Changes in population exposure
Population exposure to climate extremes delineates potential socioeconomic risks in the future. The combinations of socioeconomic pathways and emission pathways (e.g., SSP1-2.6) are adopted to estimate the future changes in population exposure. The SSPs are reference pathways that describe plausible alternative trends in socioeconomic evolution independently with climate change, of which SSP1, SSP2, and SSP3 denote low, intermediate, and high challenges for mitigation and adaptation, respectively (O'Neill et al., 2017). Given the limitations of visual identification caused by discontinuous population distribution in the Yangtze basin, the mappings are carried out on prefecture-level cities by spatial summation, while all the calculations are based on the population grids with a precision of 1 km × 1 km.
Under future scenarios, the evolution of population distribution in the Yangtze basin also shows a Matthew effect, that is, the population move toward coastal megacities and provincial capitals, while the population among small-medium cities outflows gradually, particularly in the upper and middle basin. The prefectural average of population exposure to precipitation extremes is 68.7 million person-days (hereafter mpd) in baseline. High-exposure cities are principally scattered among Poyang and Dongting Lake watersheds, as well as the two megacities of Shanghai and Chongqing (Figure 4A). Along the low-emission pathway, about two-thirds of cities show a decrease in population exposure by 2050, among which the cities of Chongqing, Enshi, Liangshan, and Dazhou in the upper basin drop by more than 15 mpd (Figure 4B). The cities with increased exposure are broadly located in the lower basin and Taihu Lake watershed, among which the big cities such as Shanghai, Changsha, Hangzhou, and Nanjing experience an increase of more than 30 mpd in population exposure.
Figure 4
Along the moderate pathway, an increased exposure to precipitation extremes is detected in about two-thirds of cities around 2050 that mainly concentrated in the mid-lower Yangtze basin (Figure 4C). The prefectural average of population exposure raises to 74.3 (±2.8) mpd, and large coastal cities and provincial capitals remain the most exposed areas. Under the influence of population loss, some large cities in the upper basin, such as Chongqing and Liangshan, are expected to experience a decrease in total exposure.
As for high-emission scenario (i.e., SSP3-7.0), which assumes a continuous increase in greenhouse gases and a maintenance of high fertility in the future, it seems unlikely to happen from current situation. However, revealing the potential changes under SSP3-7.0 scenario has important implications for understanding the worst situation. In this scenario, the exposure is projected to reach 78.3 (±2.9) mpd at prefectural average, with more than 90% cities experiencing increased exposure to precipitation extremes, and the increment of some majority cities in the lower basin exceeds 10 mpd (Figure 4D).
3.4. Regional evolution and contributing factors
The changes in total population exposure can be decomposed into climate contribution, population contribution and their interaction. There are large differences between future scenarios regarding exposure changes in the Yangtze basin. Along the low-emission pathway, the total exposure in whole basin will remain unchanged around 2050 due to counteraction between intensified extremes and reduced population (Figure 5A). Under moderate-emission scenario, the exposure will increase by 600 (±201) mpd on baseline, of which climate change brings a positive contribution of 888 (±210) mpd, whereas population growth brings a negative contribution of 255 mpd. As for high-emission scenario, the total exposure is projected to increase by 1,032 (±202) mpd on baseline, of which climate factor holds major contribution at 91%, while population factor only accounts for less than 8% of positive contribution.
Figure 5
By comparing the exposure changes from three sub-basins, it can be seen that their climate contribution rates are relatively close under multiple scenarios, while the population contributions are quite different or even opposite. The upper basin is projected to face the greatest population decline by 2050, followed by the middle basin, whereas the lower basin shows an overall increase in population simulations. In the upper basin, the climate contribution is around 200–280 mpd, while the total exposure varies with population contributions ranging from −188 (±39) mpd under low-emission scenario, to 20 (±66) mpd under moderate-emission scenario, and then to 162 (±70) mpd under high-emission scenario (Figure 5B). In the middle basin, the total exposure increment is generally higher than that of the upper basin, despite the negative contribution of population growth (Figure 5C). To be specific, the positive contribution of intensified climate is not enough to offset population decline under low-emission scenario; under moderate-emission scenario, climate contribution greatly exceeds population effect; under high-emission scenario, exposure increment is almost entirely contributed by climate change. In the lower basin, both climate factor and population factor contribute positively to the elevated exposure, which is projected to increase by 200–517 mpd under multiple scenarios around 2050 (Figure 5D). From low to high emission forcing, the absolute contribution of climate factor increases step-wisely in the range of 150–337 mpd, and the population contribution also shows a positive response.
3.5. Hot spots in the future
Hot spots refer to areas that response dramatically to climate change and confront great risk of extreme events in the coming future (Piontek et al., 2014; Turco et al., 2015; Diffenbaugh et al., 2017; Xu et al., 2019). Here, we take totally 113 prefecture-level cities in the Yangtze basin as basic units to analyze the baseline state of population exposure to precipitation extremes, and further project its changes by 2050 under moderate-emission scenario (Supplementary Table S2). In terms of precipitation extremes, Chongqing is a big city in Southwest China with the highest population exposure in both historical baseline and future scenarios, but its absolute amount is projected to decrease from 457 to 440.4 (±20.9) mpd due to population decline (Figure 6). Shanghai, the most developed city on China’s east coast, has about half of Chongqing’s population but only a tenth of its total area. The population of Shanghai is growing rapidly which is expected to reach 22.2 million by 2050. As a result, the exposure to precipitation extremes nearly doubled from 268.6 to 433.1 (±14.5) mpd, ranking it top on the city list for intensified socioeconomic risks. The following hotspot cities are Changsha, Hangzhou, Ganzhou, Huanggang, Shangrao, Hengyang, Shaoyang, Wuhan, and Yichun. Most of these hotspots are provincial capitals and mid-sized cities with a population between 6 and 8 million, which are projected to confront a higher hazard intensity in the future, with more than 20 days of heavy precipitation per year, resulting in significantly higher population exposure than other cities in the Yangtze basin.
Figure 6
4. Conclusion
The incremental public understanding of explicit climate extremes assessments generates the urgency of calibrated and downscaled climate simulations. In this article, the Yangtze basin is taken as the study area, and the changes in precipitation extremes are analyzed on the basis of historical precipitation observations and the ensemble of multi-models. A series of assessments are established through quantitative models to reveal the evolution trends of precipitation extremes and population exposure in the Yangtze basin, laying a foundation for hotspot identification.
Historical observations indicate the hazard zone of precipitation extremes in the Yangtze basin are mainly located in the mid-lower basin and Dongting Lake watershed, where the indices of heavy precipitation, peak intensity, and maximum duration are ahead of the rest parts. Extreme precipitation events in the Yangtze basin are also observed with a broadly increasing trend in the past decades, among which the Poyang Lake watershed has seen the most significant changes. Future projections suggest a consistent intensification of precipitation extremes in the mid-lower basin as radiative forcing increases, while a stable or even slightly weakened trend has been detected in the upper Yangtze basin.
Population exposure to precipitation extremes represents potential socioeconomic risks under a combination of population growth pathways and carbon emission scenarios. The simulation shows that the future population distribution is expected to gather toward large cities in the lower Yangtze basin, while small and medium-sized cities in the middle and upper basins will face long-term population loss. As a result, although the total population exposure is expected to increase compared to baseline period, there are significant differences among the three sub-basins. To be specific, the population exposure in the upper Yangtze basin declines under low-emission scenario, remains unchanged under moderate-emission scenario, and goes up under high-emission scenario; the population exposure in the middle Yangtze basin shows a slight decrease along low-emission scenario, but increases significantly under both moderate- and high-emission scenarios; the population exposure in the lower Yangtze basin increases in all scenarios with both population and climate factors contribute positively.
From the perspective of socioeconomic risks, the top three hotspot cities are Shanghai, Changsha and Hangzhou, where the risk management of floods, waterlogs, and water-related compound hazards should be listed as priority issues. Other hotspot cities with higher hazard intensity (e.g., Ganzhou, Huanggang, Shangrao, Hengyang, Shaoyang, Wuhan) should also update their prevention standards in line with accelerated climate warming, while improving early-warning capabilities and developing emergency protocols to mitigate the risk of water-related disasters.
Funding
This research was supported by the National Key Research and Development Program of China (grant no. 2022YFD2300200), the National Natural Science Foundation of China (grant no. 41701103), the Basic Research Fund of Chinese Academy of Meteorological Sciences (grant no. 2021Z010), and Hubei low-carbon pioneer project “Action plan for climate change adaptation in Hubei Province” and “Climate change facts and impact analysis in Hubei Province”.
Publisher’s note
All claims expressed in this article are solely those of the authors and do not necessarily represent those of their affiliated organizations, or those of the publisher, the editors and the reviewers. Any product that may be evaluated in this article, or claim that may be made by its manufacturer, is not guaranteed or endorsed by the publisher.
Statements
Data availability statement
The original contributions presented in the study are included in the article/Supplementary material, further inquiries can be directed to the corresponding author.
Author contributions
YaZ: conceptualization, resources, and supervision. SS: data curation, writing—original draft preparation, and visualization. SS and YaZ: methodology. SS, YH, and SC: formal analysis. YaZ and ZX: investigation. YiZ and QS: validation. YH and SC: writing—review and editing. All authors contributed to the article and approved the submitted version.
Acknowledgments
The authors would like to thank World Climate Research Programme for providing multimodel simulations based on representative concentration pathways (https://esgfnode.llnl.gov/), and the NASA Socioeconomic Data and Applications Center (SEDAC) for providing the population projections based on the Shared Socioeconomic Pathways (https://sedac.ciesin.columbia.edu/data/set/popdynamics-1-km-downscaled-pop-base-yearprojection-ssp-2000-2100-rev01).
Conflict of interest
The authors declare that the research was conducted in the absence of any commercial or financial relationships that could be construed as a potential conflict of interest.
Supplementary material
The Supplementary material for this article can be found online at: https://www.frontiersin.org/articles/10.3389/fevo.2023.1127875/full#supplementary-material
References
1
AghaKouchakA.ChiangF.HuningL. S.LoveC. A.MallakpourI.MazdiyasniO.et al. (2020). Climate extremes and compound hazards in a warming world. Annu. Rev. Earth Planet. Sci.48, 519–548. doi: 10.1146/annurev-earth-071719055228
2
AllanR. P.SodenB. J. (2008). Atmospheric warming and the amplification of precipitation extremes. Science321, 1481–1484. doi: 10.1126/science.1160787
3
ArnellN.GoslingS. (2016). The impacts of climate change on river flood risk at the global scale. Clim. Change134, 387–401. doi: 10.1007/s10584-014-1084-5
4
CarletonT. A.HsiangS. M. (2016). Social and economic impacts of climate. Science353:aad9837. doi: 10.1126/science.aad9837
5
ChenH.SunJ. (2020). Increased population exposure to precipitation extremes in China under global warming scenarios. Atmospher Ocean Sci Lett13, 63–70. doi: 10.1080/16742834.2020.1697168
6
ChenX. C.XuY.XuC. H.YaoY. (2014). Assessment of precipitation simulations in China by cmip5 multi-models. Adv. Clim. Chang. Res.10:217. doi: 10.3969/j.issn.1673-1719.2014.03.011
7
CoumouD.RahmstorfS. (2012). A decade of weather extremes. Nat. Clim. Chang.2, 491–496. doi: 10.1038/nclimate1452
8
DiffenbaughN. S.SinghD.MankinJ. S.HortonD. E.SwainD. L.ToumaD.et al. (2017). Quantifying the influence of global warming on unprecedented extreme climate events. Proc. Natl. Acad. Sci.114, 4881–4886. doi: 10.1073/pnas.1618082114
9
DonatM. G.AlexanderL. V.YangH.DurreI.VoseR.DunnR. J. H.et al. (2013). Updated analyses of temperature and precipitation extreme indices since the beginning of the twentieth century: the HadEX2 dataset. J. Geophys. Res. Atmos.118, 2098–2118. doi: 10.1002/jgrd.50150
10
GuanY.ZhengF.ZhangX.WangB. (2016). Trends and variability of daily precipitation and extremes during 1960-2012 in the Yangtze River basin, China. Int. J. Climatol.37, 1282–1298. doi: 10.1002/joc.4776
11
JamesR.OttoF.ParkerH.BoydE.CornforthR.MitchellD.et al. (2014). Characterizing loss and damage from climate change. Nat. Clim. Chang.4:938939, 938–939. doi: 10.1038/nclimate2411
12
JonesB.O'NeillB. C.McdanielL.McginnisS.MearnsL. O.TebaldiC. (2015). Future population exposure to US heat extremes. Nat. Clim. Chang.5, 652–655. doi: 10.1038/nclimate2631
13
KharinV. V.ZwiersF. W.ZhangX.WehnerM. (2013). Changes in temperature and precipitation extremes in the cmip5 ensemble. Clim. Change119, 345–357. doi: 10.1007/s10584-013-0705-8
14
LiH.ChenH.WangH.YuE. (2018). Future precipitation changes over China under 1.5°C and 2.0°C global warming targets by using cordex regional climate models. Sci. Total Environ.640-641, 543–554. doi: 10.1016/j.scitotenv.2018.05.324
15
LiX.ZhangK.GuP.FengH.YinY.ChenW.et al. (2021). Changes in precipitation extremes in the Yangtze River basin during 1960–2019 and the association with global warming, ENSO, and local effects. Sci. Total Environ.760:144244. doi: 10.1016/j.scitotenv.2020.144244
16
O'NeillB. C.KrieglerE.EbiK. L.Kemp-BenedictE.RiahiK.RothmanD. S.et al. (2017). The roads ahead: narratives for shared socioeconomic pathways describing world futures in the 21st century. Glob. Environ. Chang.42, 169–180. doi: 10.1016/j.gloenvcha.2015.01.004
17
PanZ.ZhangY.LiuX.GaoZ. (2016). Current and future precipitation extremes over Mississippi and Yangtze River basins as simulated in CMIP5 models. J. Earth Sci.27, 22–36. doi: 10.1007/s12583-016-0627-2
18
PiontekF.MüllerC.PughT. A. M.ClarkD. B.DeryngD.ElliottJ.et al. (2014). Multisectoral climate impact hotspots in a warming world. Proc. Natl. Acad. Sci.111, 3233–3238. doi: 10.1073/pnas.1222471110
19
PreinA.RasmussenR.IkedaK.LiuC.ClarkM.HollandG. (2016). The future intensification of hourly precipitation extremes. Nat. Clim. Chang.7, 48–52. doi: 10.1038/nclimate3168
20
Ramirez-VillegasJ.JarvisA. (2010). Downscaling global circulation model outputs: the Delta method decision and policy analysis. Working paper no. 1. Policy Anal.1, 1–18.
21
ScoccimarroE.GualdiS.BellucciA.ZampieriM.NavarraA. (2013). Heavy precipitation events in a warmer climate: results from cmip5 models. J. Climate26, 7902–7911. doi: 10.1175/JCLI-D-12-00850.1
22
SillmannJ.KharinV. V.ZhangX.ZwiersF. W.BronaughD. (2013). Climate extremes indices in the CMIP5 multimodel ensemble: part 1. Model evaluation in the present climate. J. Geophys. Res. Atmos.118, 1716–1733. doi: 10.1002/jgrd.50203
23
SunS.ShiP.ZhangQ.WangJ.WuJ.ChenD. (2021). Evolution of future precipitation extremes: viewpoint of climate change classification. Int. J. Climatol.42, 1220–1230. doi: 10.1002/joc.7298
24
TaylorK. E.StoufferR. J.MeehlG. A. (2012). An overview of CMIP5 and the experiment design. Bull. Am. Meteorol. Soc.93, 485–498. doi: 10.1175/BAMS-D-11-00094.1
25
TellmanB.SullivanJ. A.KuhnC.KettnerA. J.DoyleC. S.BrakenridgeG. R.et al. (2021). Satellite imaging reveals increased proportion of population exposed to floods. Nature596, 80–86. doi: 10.1038/s41586-021-03695-w
26
ToretiA.NaveauP.ZampieriM.SchindlerA.ScoccimarroE.XoplakiE.et al. (2013). Projections of global changes in precipitation extremes from coupled model intercomparison project phase 5 models. Geophys. Res. Lett.40, 4887–4892. doi: 10.1002/grl.50940
27
TurcoM.PalazziE.HardenbergJ.ProvenzaleA. (2015). Observed climate change hotspots. Geophys. Res. Lett.42, 3521–3528. doi: 10.1002/2015GL063891
28
WestraS.FowlerH.EvansJ.AlexanderL.BergP.JohnsonF.et al. (2014). Future changes to the intensity and frequency of short duration extreme rainfall. Rev. Geophys.52, 522–555. doi: 10.1002/2014RG000464
29
WobusC.GutmannE.JonesR.RissingM.MartinichJ. (2017). Climate change impacts on flood risk and asset damages within mapped 100-year floodplains of the contiguous United States. Nat. Hazards Earth Syst. Sci.17, 2199–2211. doi: 10.5194/nhess-2017-152
30
WuJ.GaoX.GiorgiF.ChenD. (2017). Changes of effective temperature and cold/hot days in late decades over China based on a high resolution gridded observation dataset. Int. J. Climatol.37, 788–800. doi: 10.1002/joc.5038
31
XuL.WangA.WangD.WangH. (2019). Hot spots of climate extremes in the future. J. Geophys. Res. Atmos.124, 3035–3049. doi: 10.1029/2018JD029980
32
ZhouB.XuY.WuJ.DongS.ShiY. (2016). Changes in temperature and precipitation extreme indices over China: analysis of a high-resolution grid dataset. Int. J. Climatol.36, 1051–1066. doi: 10.1002/joc.4400
Summary
Keywords
climate projection, precipitation extremes, population exposure, future scenarios, attribution analysis, Yangtze River basin
Citation
Sun S, Zhao Y, He Y, Xia Z, Chen S, Zhang Y and Sun Q (2023) Exacerbated climate risks induced by precipitation extremes in the Yangtze River basin under warming scenarios. Front. Ecol. Evol. 11:1127875. doi: 10.3389/fevo.2023.1127875
Received
20 December 2022
Accepted
15 May 2023
Published
16 June 2023
Volume
11 - 2023
Edited by
Edward A. Byers, International Institute for Applied Systems Analysis (IIASA), Austria
Reviewed by
Mohammed Magdy Hamed, Arab Academy for Science, Technology and Maritime Transport (AASTMT), Egypt; Shuang Yu, Lawrence Livermore National Laboratory (DOE), United States
Updates
Copyright
© 2023 Sun, Zhao, He, Xia, Chen, Zhang and Sun.
This is an open-access article distributed under the terms of the Creative Commons Attribution License (CC BY). The use, distribution or reproduction in other forums is permitted, provided the original author(s) and the copyright owner(s) are credited and that the original publication in this journal is cited, in accordance with accepted academic practice. No use, distribution or reproduction is permitted which does not comply with these terms.
*Correspondence: Yanxia Zhao, zhaoyanxia@cma.gov.cn
†ORCID: Shao Sun, https://orcid.org/0000-0003-3411-5466
Disclaimer
All claims expressed in this article are solely those of the authors and do not necessarily represent those of their affiliated organizations, or those of the publisher, the editors and the reviewers. Any product that may be evaluated in this article or claim that may be made by its manufacturer is not guaranteed or endorsed by the publisher.