 Jieqing Shi
 Dengao Li
 Chaoyong Shen
 Jing Yang
 Fanming Wu
94% of researchers rate our articles as excellent or good
Learn more about the work of our research integrity team to safeguard the quality of each article we publish.
Find out more
ORIGINAL RESEARCH article
Front. Ecol. Evol., 14 March 2023
Sec. Urban Ecology
Volume 11 - 2023 | https://doi.org/10.3389/fevo.2023.1127028
Introduction: Open-pit coal mining could disrupt the ecosystem and lead to the loss of service values for the ecosystem through direct occupation or indirect impacts on adjacent ecosystems.
Methods: In this research, we combined a new accounting system, gross ecosystem product (GEP), with spatial–temporal analyses to quantify the ecological variation and explore its driving factors in Pingshuo, a large-scale open-pit coal mining area in China. GEP is an aggregate accounting system that can summarize the value of provisioning, regulating, and cultural ecosystem services (ES) in a single monetary metric. The spatial–temporal approaches used in our study were known as exploratory spatial data analyses and interpretable models in machine learning. Both spatial and non-spatial data, including remote sensing images, meteorological data, and official statistics, were applied in the research.
Results: The results indicated the following: (i) From 1990 to 2020, the annual average growth rates of GEP decreased from 30.78 to 9.1%. Furthermore, the classified results of GEP revealed that the regions with rich ES quality rapidly reduced from 51.90 to 32.18%. (ii) Spatial correlation of GEP was significant, and the degree of spatial clustering was relatively high in the mining areas. Moreover, the mining areas also continually presented concentrated high-density and hot spot areas of GEP changes. (iii) The spatial–temporal effects were notable in the relationship between GEP and three socioeconomic factors, i.e., the mining effects, human activity intensity, and gross domestic product (GDP). (iv) The win–win development for both the economy and ecological environment in Pingshuo could be realized by restricting the annual growth rate of mining areas to between 4.56 and 5.03%.
Discussion: The accounting results and spatial–temporal analyses of GEP will contribute to the future regional sustainable development and ecosystem management in Pingshuo.
Coal is the most important source of energy and sustains social and economic progress for human wellbeing (Qian et al., 2018; Zhang et al., 2021). While mineral resources can provide the impetus for the rapid development of the economy, mining and processing of coal could result in ecological and environmental problems (Worlanyo and Jiangfeng, 2021; Xiang et al., 2021). It is significant to note that, among the various types of mining, open-pit coal mining is one of the most destructive activities in terms of its impact on the surface landscape and the surrounding environment (Kibria, 2014; Balasubramanian, 2016; Lechner et al., 2017). The reason for this is that the construction, exploitation, and rehabilitation of an open-pit mining site essentially involve large-scale earth movements in space and time. Furthermore, these movements often lead to massive and irreversible changes to landscape, such as removing vegetation cover, stripping topsoil, and reshaping topography (Wang Z. Y. et al., 2022). Because of the spatial and temporal features of open-pit mining, the negative impacts on the ecosystem are also spatial and temporal. Specifically, the adverse effects occur not only in the mining area but also in the surroundings (Sonter et al., 2017). Moreover, mining projects generate unique and diverse environmental impacts at every stage of the process (Lechner et al., 2017; Wang Z. Y. et al., 2018). The precise measurement of ecosystem services (ES) in open-pit coal mining areas, with spatial and temporal dimensions, is the first step in seeking out methods to minimize the negative impacts on the ecosystem, thus achieving sustainable development of mining areas, and it will help provide great convenience to further realizing the necessity of green mines (Hu et al., 2020).
Ecosystem services (ES) are the benefits people directly or indirectly derive from functioning ecosystems (MA, 2005). Since the 1990's, researchers have been studying ecosystem functions and attempting to quantify the ES they provide for human survival and development (Daily, 1997; Costanza et al., 1998). Ecosystem service value (ESV) and gross ecosystem product (GEP) were then proposed, in turn, to provide the fundamental theories and methodologies for ES accounting (Daily et al., 2009; Ouyang et al., 2013). Due to the relative ease of ESV accounting, most researchers have assessed the ES of coal mining areas through ESV (Zhang et al., 2013; Qian et al., 2018; Xiao et al., 2020). Initially, studies of ES in mining areas were carried out following the environmental impact assessment requirements (Rigina, 2002; Gomez and Herbert, 2015; Preece et al., 2016). Later, researchers increasingly considered the spatial and temporal characteristics of the coal mining areas in their assessment of the ESV (Qian et al., 2018; Liu and Chen, 2021). Wang et al. (2020) assessed ES by mapping and quantifying changes at multiple spatial and temporal scales, confirming that ES in mining areas has distinct spatial patterns in different years. Yang et al. (2022) further focused on the spatial and temporal evolution of past mining and exposed the cumulative ecological losses due to open-pit mining. In addition, the research on the driving factors of ES changes has gradually increased. Furthermore, the relationship between changes in land use/land cover (LULC) and ESV was the most extensively researched topic (Bian and Lu, 2013; Kumar et al., 2022; Zhang L. J. et al., 2022). However, studies still need to be conducted on quantitative analysis of ES changes, especially on the driver of economic development and physical conditions within mining areas. More research on how these factors affect ES and how they change over time needs to be conducted.
While the unit value-based approach is more convenient for ES accounting in ESV (Gashaw et al., 2018; Jiang W. et al., 2021), the method cannot differentiate the value of the same type of ES in different regions (Zou et al., 2020). The accounting methods for ES measurement models in the GEP can address this problem by considering the variation in ecosystem types and quality conditions in different locations. It was in 1985 that Hannon first came up with this theory (Hannon, 1985), and the basic concept of the GEP has been further defined by Chinese scholars (Ouyang et al., 2013; Ma et al., 2015). GEP is a statistical and accounting system that translates the ES to the economy into monetary terms (Ouyang et al., 2013). Currently, the National Development and Reform Commission of China and other related departments have launched pilot projects for GEP in 15 provinces and 23 cities (https://seea.un.org/home/Natural-Capital-Accounting-Project). Moreover, the International Union for Conservation of Nature (IUCN) and its partners have conducted national pilot studies of GEP accounting projects in Ordos city, Tonghua city, Xing'an county, and Xishui county in China (IUCN, 2017). At the same time, an increasing number of researchers have investigated GEP for global and national terrestrial ecosystems (Jiang H. Q. et al., 2021; Zhang J. Y. et al., 2022), provinces (Ouyang et al., 2013, 2020; Wang L. Y. et al., 2022), and megacities (Zou et al., 2020). Moreover, there has been a general recognition that the way we measure development needs to change to include nature's contribution to human wellbeing, i.e., ES, in decision-making (Ma et al., 2015; Nations, 2015; Hao et al., 2022). However, there were a few examples of ES accounting and measuring the development of mining areas through GEP. The spatial and temporal explicit characterization of GEP concerning such heterogeneity has yet to be well-studied and therefore necessarily limits our ability to manage ecosystems in mining areas sustainably.
In this research, we focused on Pingshuo and evaluated the value of ES in Pingshuo by GEP. As the largest open-pit coal mining area in China (Zhou et al., 2017), Pingshuo is a typical comprehensive land use area for mining, with the influence of coal mining and high-speed urbanization (Zhang et al., 2019a). The specific goals are as follows: (i) calculating the GEP with the help of spatial and non-spatial data to verify its feasibility in the large-scale open-pit mining area; (ii) applying the exploratory spatial data analysis methods to analyze the spatial–temporal dynamics of GEP; (iii) identifying the relationship between the four types of driving forces, including socioeconomic factors, degree of human interference, neighborhood effects of LULC, and physical conditions, and the variations of GEP applied with GeoDetector and the interpretable models in machine learning; (iv) proposing a practical measure that is beneficial to the sustainable development of Pingshuo.
The Pingshuo open-pit coal mining area is situated in the northern Shanxi province of China, and its geographical coordinates are 112°10′ 113°30′ E?39°23′ 39°37′ N (see Figure 1). It is located in the north of the Ningwu Coal Field in Shuozhou city and is linked to the world's largest coal field in the Black Triangle of the Loess Plateau—Dongsheng. It covers a large area [21 kilometers (km) in length from north to south and 22 km in width from east to west] and has a mine life of hundreds of years. The mine has a geological reserve of 12.75 gross tonnages (GT) and a construction scale of 65 metric tons (Mt), including 45 Mt of large national open pit mines and 20 Mt of local coal mines. This national large-scale open-pit coal mining area is divided into three fields: Antaibao open-pit coal mining area, Anjialing open-pit coal mining area, and the east open-pit coal mining area, with an annual average mine output of 20–30 Mt (Bai et al., 2000).
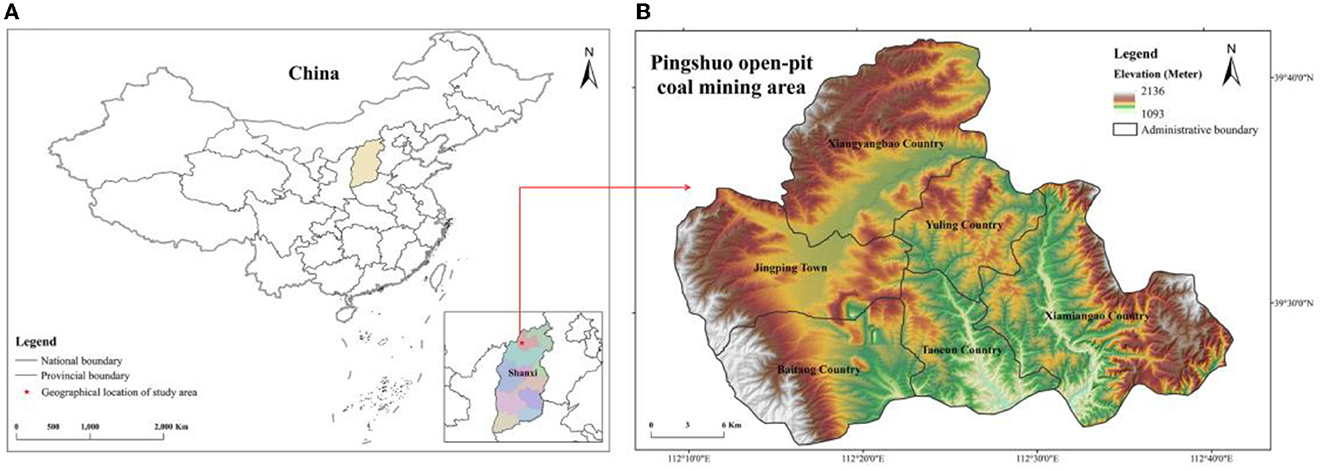
Figure 1. Geographical location and spatial scope of Pingshuo open-pit coal mining area. (A) Location of Pingshuo in China. (B) Elevation distribution and administrative boundary of Pingshuo.
Pingshuo has a typical temperate semi-arid continental monsoon climate, with few drops of rain, cold, dry, and windy winters, and cool and less windy summers. It is located in the eastern part of the Loess Plateau (see Figure 1), a highly eroded and ecologically fragile system. The ecological environment of Pingshuo is weak. It is sensitive to environmental changes and has less plasticity to maintain stability. However, the natural secondary forest has been destroyed, and the extensive grassland communities, which are rare, are scattered with low vegetation cover due to a long development history and a high reclamation index (Bai and Yun, 2018). Therefore, it is vital for the sustainable development of Pingshuo to maintain regional land and environmental security.
Spatial and publicly available official non-spatial data are the primary data used in this research. In particular, spatial data were obtained from data product service websites, namely, the National Tibetan Plateau Scientific Data Center, the Resource and Environment Science and Data Center of the Chinese Academy of Sciences, and NASA EarthData. The official non-spatial data, including statistics and monitoring data, have been maintained by the product service websites in China. Moreover, Table 1 summarizes the sources, types, resolutions, and functions of data in the GEP accounting process.
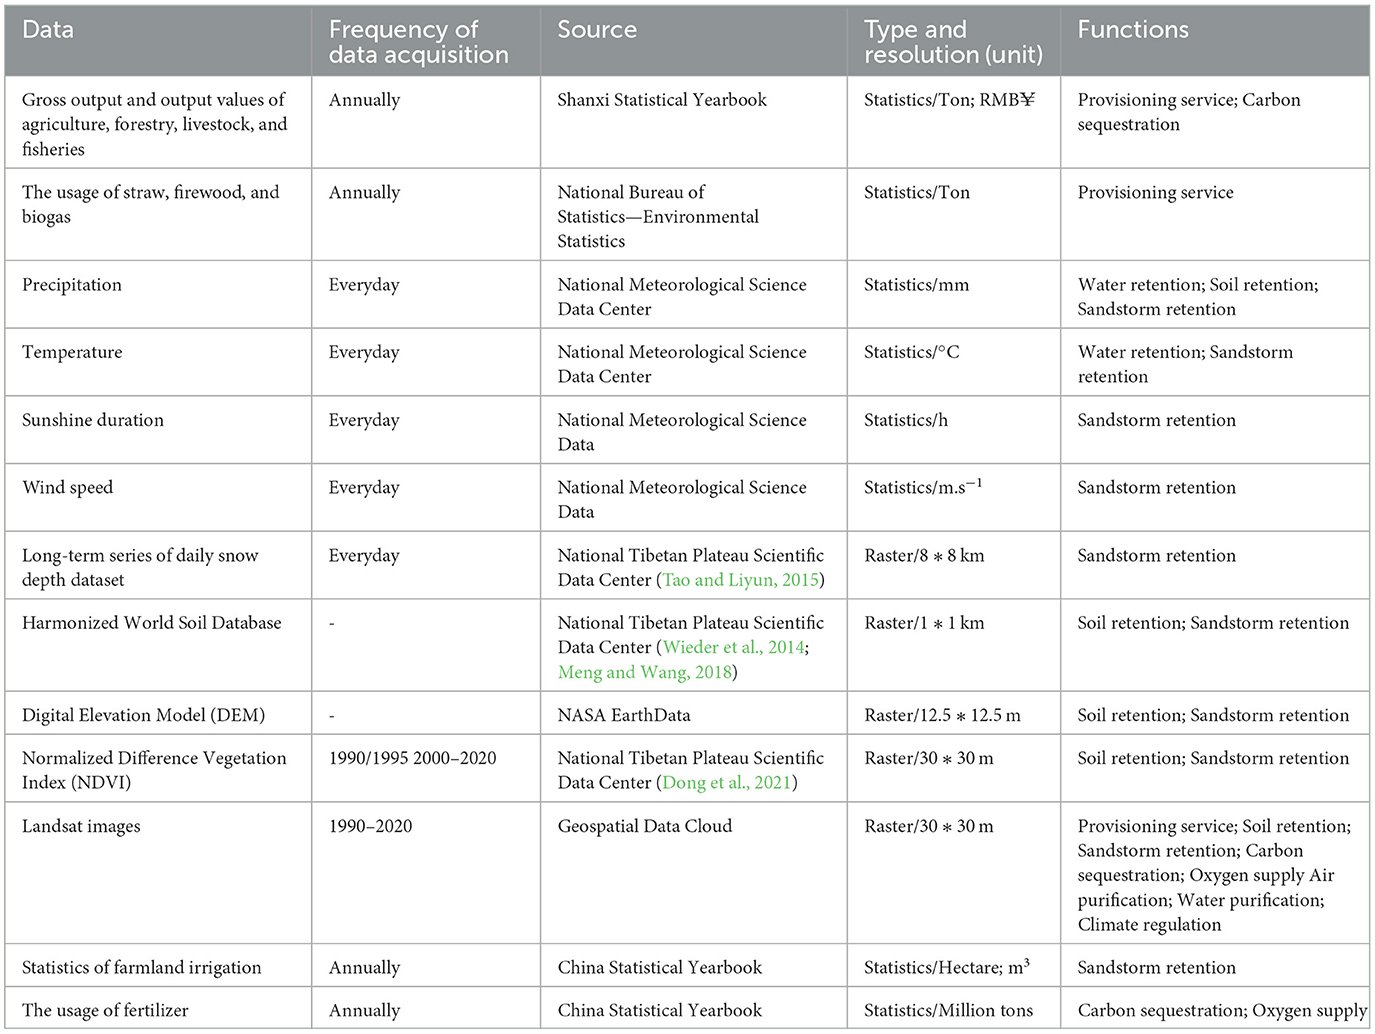
Table 1. The detailed information for data in GEP accounting.
The data for LULC were obtained from Landsat 1990–2010 Thematic Mapper (TM), Landsat 2015, and 2020 Operational Land Imager (OLI) with the strip numbers 126/33 and 126/32 in the Geospatial Data Cloud, and Landsat images were chosen because of their extended temporal coverage. For all these images, atmospheric correction and radiation normalization are essential to remove the effects of smoke, dust, and haze, as well as changes in the sun's angle (Chavez, 1996). Radiometric and atmospheric corrections were performed for these 14 scenes over seven periods using The Environment for Visualizing Images (ENVI) 5.3. The geometric correction was then performed on the above seven periods of images using the previously corrected Landsat TM images, and the geometric accuracy after the correction was 0.5 pixels (Luo et al., 2016). Moreover, the images with different periods also need to be aligned by polynomial and nearest neighbor methods, and the root mean square error after alignment can be guaranteed within 0.5 pixels (Zhang et al., 2017). Finally, the simultaneous and adjacent images were stitched and cropped using the vector boundary of the study area.
A combination of supervised classification and visual interpretation was utilized to classify the LULC types into 10 categories: shrubs, forests, grasslands, farmlands, water areas, industrial and mining lands, urban lands, rural lands, bare lands, and roads. The classification process is carried out by referencing the remote sensing monitoring dataset of China's LULC released by the Resource and Environment Science Data Center of the Chinese Academy of Sciences (Xu, 2023) and applying Google Earth to verify the LULC types. The confusion matrix method was used to assess the accuracy of the interpretation of these remote sensing images, and the overall accuracy was >85%.
The whole framework of our studies consists of three parts: the first part is the data preparation and pre-processing; the second part is the GEP accounting with temporal and spatial features; and the last part is the spatial–temporal exploration of the GEP in Pingshuo (see Figure 2).
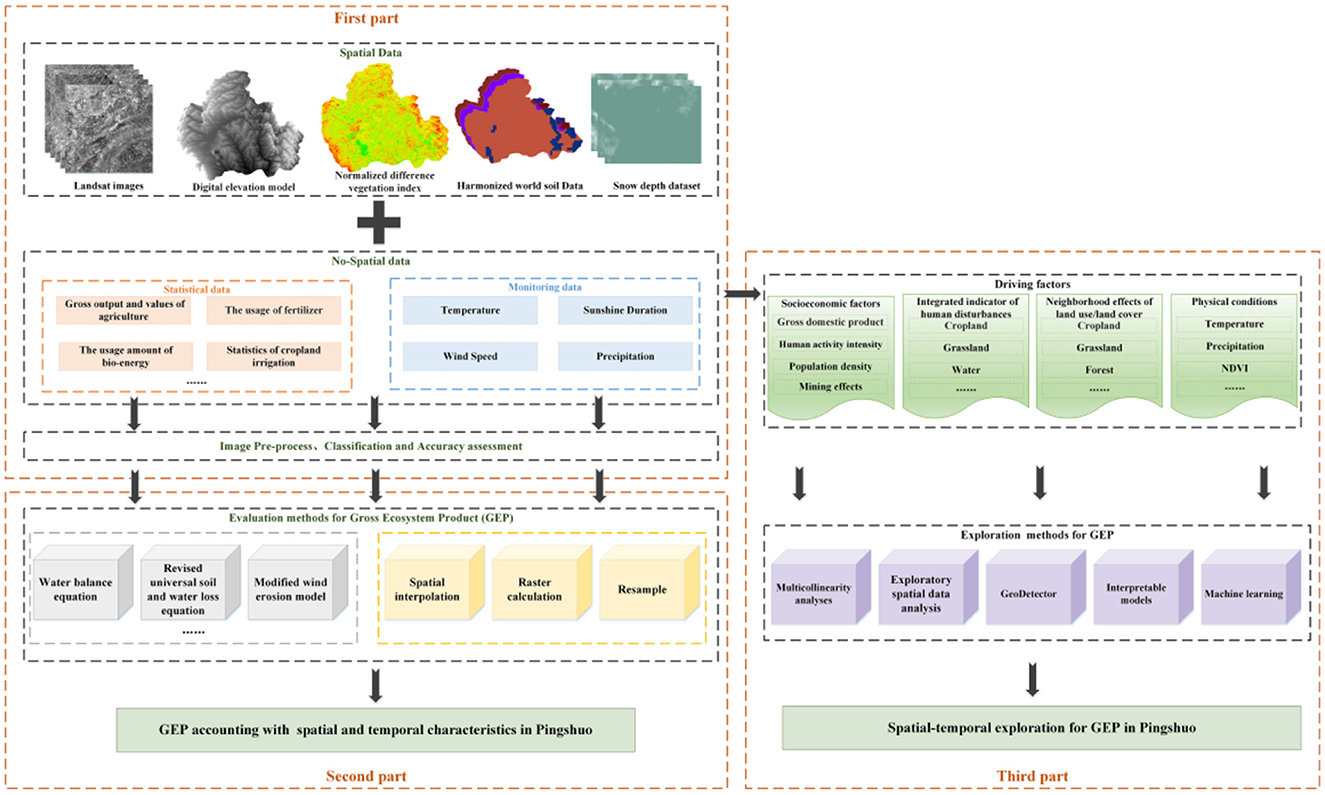
Figure 2. A flowchart of accounting and spatial–temporal exploration of GEP in Pingshuo.
The ecosystem types in Pingshuo are mainly comprised of farmland, forest, and grassland ecosystems. Moreover, after working in the field, we observed that no ecological area in Pingshuo currently provides cultural services. Based on these actual situations, the availability of data, the connotation of GEP, the values of provisioning service, and eight secondary indicators of regulating service accounted for GEP in Pingshuo.
The ES that humans directly obtain from the ecosystem to meet the material needs of human life and to finish the production of derived products that can be traded on the market are called provisioning services. The value of the provisioning services in GEP is known as the ecosystem product value (EPV).
The annual output of the agriculture, forestry, livestock, fisheries, and other ecological energy sources such as fuelwood, straw, and biogas was taken as the biophysical quantities for EPV. Moreover, the annual production values were the monetary quantities. The formulas for the biophysical and monetary quantities of EPV are shown in Supplementary Table 1. The output values of agricultural and livestock products contain the value of labor and other human inputs (Ouyang et al., 2020). The EPV has been modified to include only the share of natural inputs; the share of labor and other human inputs have been deducted. Based on the relationship between soil fertility contribution and crop yield in China, we set a transfer rate of 32.91% for agricultural products (Tang and Huang, 2009). Based on the factor contribution constituted of livestock, we set a transfer rate of 36.5% for livestock products (Liu and Dong, 2014).
Ecosystems can provide not only direct provisioning services to humans but also functions to improve the human living and survival environment (Sannigrahi et al., 2018; Zou et al., 2020), such as pollutant degradation and carbon dioxide fixation. Moreover, the value of the regulating services in GEP is known as the ecosystem regulating value (ERV). Considering the real situation in Pingshuo, eight indicators were identified for ERV: water retention, soil retention, sandstorm retention, carbon sequestration, oxygen supply, air purification, water purification, and climate regulation. The biophysical quantities of each indicator were valued using different models and methods, and the monetary quantities, where market values were unavailable, were usually valued using the replacement cost method. The formulas for the biophysical and monetary quantities are presented in Supplementary Table 1. It is worth noting that we applied the geographic information system (GIS) concept in the ERV accounting process. Specifically, the inverse distance weighted interpolation method was used to create a spatial distribution model of the monitoring data. The relationship between the indicators of GEP and LULC was mapped to the corresponding characteristics using raster calculations, thus completing the spatialization of the statistics. The resampling method mainly addressed the problem of inconsistent scales in spatial data. Consequently, all data resolutions were consistent with LULC at 30 m.
Spatial heterogeneity can be revealed by the Local Moran's I (LISA), one of the exploratory spatial data analysis (ESDA) methods. It is a decomposed form of the Global Moran's I (Anselin, 2010), and its formula is given in Equation 1. The range of LISA is from −1 to 1, and the closer the value of LISA is to 1, the stronger the positive spatial correlation is; the closer the value of LISA is to −1, the stronger the negative spatial correlation is; the closer the value of LISA is to 0, the more it is irrelevant to the spatial dimension. Accordingly, the LISA clustering maps can be divided into five categories, i.e., the positive correlation is represented by the high–high (H–H) type and the low–low (L–L) type in clustering maps; the negative correlation is represented by the high–low (H–L) type and the low–high (L–H) type; and the insignificant type represents the spatial decorrelation. In addition, the spatial characteristics of the variations for GEP within every 5 years were studied and observed through the density and hot spot analysis in ArcGIS 10.2 with the Getis-Ord Gi* index, whose equations are shown in Equations 2, 3.
where n is the number of grids; yi and yj are the attribute values of the spatial object y at the i and j points; is the average value of y; Wij is the spatial weight matrix element, appraising the spatial connection between the point i and the other points, which can be expressed by the methods such as distance, area, and accessibility; and S2 is the discrete variance of yi.
where and are represented as the mathematical expectation and variance, respectively, and Wij is the spatial weight.
The potential driving factors influencing the GEP changes and their spatial heterogeneity in this study were selected based on the experimental conditions of Pingshuo, literature reviews (Wang Y. et al., 2018; Cheng et al., 2019; Han et al., 2020), and the principle of data availability. Moreover, the driving factors fall into four classes: socioeconomic factors, degree of human interference, neighborhood effects of LULC, and physical conditions. Specifically, (i) socioeconomic factors included population density (POP), human activity intensity, gross domestic product (GDP), and the extent of mining area effects; and in this research, human activity intensity was represented by night lights; (ii) the formula for the integrated indicator of human disturbances (Hemeroby) is shown in Equation 4 (Han et al., 2020); (iv) the formula for the neighborhood effects of the six LULC types (Wang Y. et al., 2018) is given in Equation 5; and (v) physical conditions including annual average temperature, precipitation, wind speed, and NDVI.
where D is the Hemeroby; m is the number of land types; HIi is the coefficient of land type i (Table 2); Si is the area of land type i; and S is the total study area.
where Fi, j, d is the enrichment of neighborhood d of location j with land use type i; ni, d, j is the number of cells with the ith land use type in the neighborhood d of grid j; nd, j is the number of cells in the neighborhood d; Ni is the number of cells with the ith land use type in the whole raster, and N represents all cells of the study area. We set d = 2 with a 5*5 rectangular window to figure up the neighborhood interactions. The neighborhood interactions of croplands, grasslands, forests, water areas, built-up lands, and bare lands were obtained by the “Focal Statistics” tool in ArcGIS 10.2.
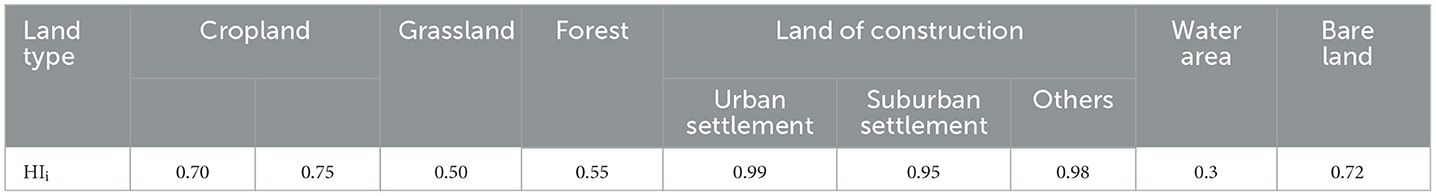
Table 2. Coefficient of Hemeroby for various land types (HIi).
The initial driving factors used for driving force analyses may be highly correlated, which can lead to a faulty system analysis (Dormann et al., 2013). Multicollinearity analyses and Pearson's correlation coefficient were applied to eliminate this problem. Specifically, multicollinearity, which uses variance inflation factors (VIFs) and tolerance VIF, can be used to determine the standard errors of these factors (Allison, 2001; Liao and Valliant, 2012). The higher the standard error, the greater the multicollinearity. If the VIF was more remarkable than 10 or the tolerance was < 0.1, it was confirmed that multicollinearity existed in the data set (Hair et al., 2006). The correlation coefficient of the two factors was evaluated by Pearson's correlation coefficient (Booth et al., 1994), and the formula is defined as follows. When the value between the two factors is >0.7, it means that there is a correlation between them.
where cov(X, Y) is expressed as the covariance of the conditioning factors X and Y; σX and σY are the standard deviations of X and Y, respectively.
GeoDetector is a statistical approach for detecting spatial heterogeneity and uncovering its potential driving forces. By analyzing the distinctions between the regional and total variances, the factor detection in GeoDetector can be used to determine the extent to which the potential driving factor explains the spatial divergence (Wang et al., 2010; Wang and Hu, 2012). The value of the q statistic can reflect how the dependent variable was affected by the values of one or more independent variables, which are between 0 and 1. When q is 0, the driving factor is independent of the dependent variable. When q is 1, the independent variable controls the spatial distribution of the dependent variable (Wang and Xu, 2017). The value of q is calculated by the formula as follows:
where SSW and SST are the sums of variance within the classified region and the whole region, respectively; h is the classification of the variable or independent variable; Nh and N are the number of rasters in the classified area h and the whole area of the study area, and σ2 are the variances of the classified region h and the whole region of the study area.
The permutation feature importance and partial dependency plot (PDP) methods in machine learning interpretable models were used to investigate the drivers of GEP changes. In the permutation feature importance method, a factor is “important” if shuffling its values increases the model error because, in this case, the model relied on the factor to make the prediction (Wieder et al., 2014; Fisher et al., 2019). Moreover, PDP can reveal the relationship between the GEP and the factors by marginalizing the model output over the feature distribution (Greenwell et al., 2018).
The results of the biophysical quantities for the GEP in Pingshuo are shown in Supplementary Table 2. Over the past 30 years, the monetary quantities of GEP increased from RMB¥ 3.34 billion Chinese yuan (RMB¥) to 46.67 billion RMB¥, accompanied by an increase in the production value of coal mining in Pingshuo from 0.65 to 30.07 billion RMB¥ (Table 3). Moreover, the monetary quantities of EPV increased from 13.46 to 128.67 million RMB¥, and the monetary quantities of ERV increased from 3.33 to 46.54 billion RMB¥. The proportion of EPV in Pingshuo remained below 0.5% (see Figure 3). This indicates that the contributions of ES to Pingshuo were mainly derived from the regulating service.
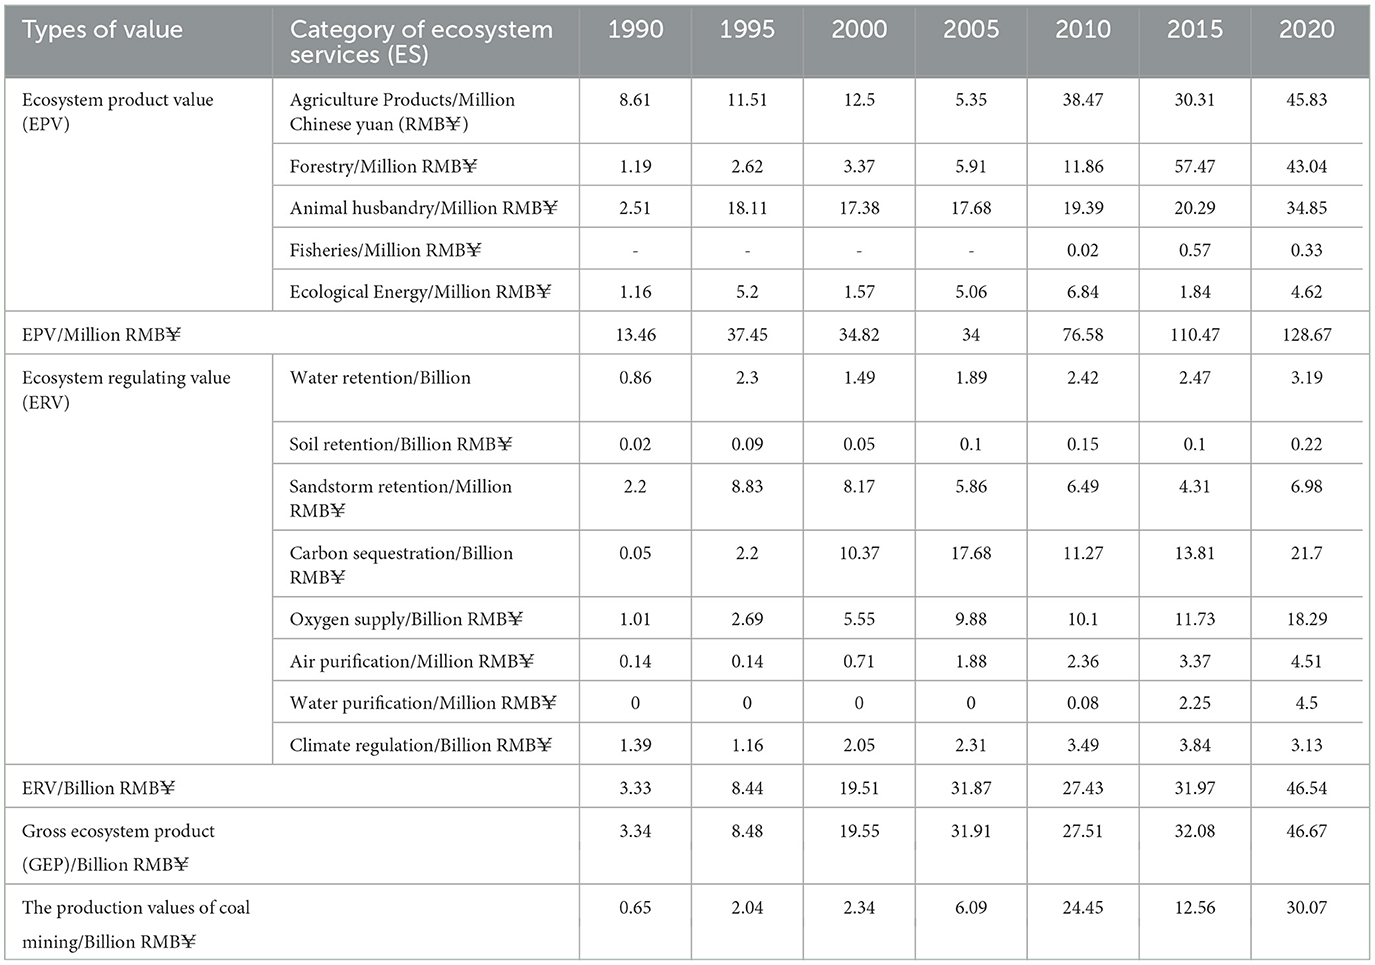
Table 3. The monetary quantities of GEP in Pingshuo from 1990 to 2020.
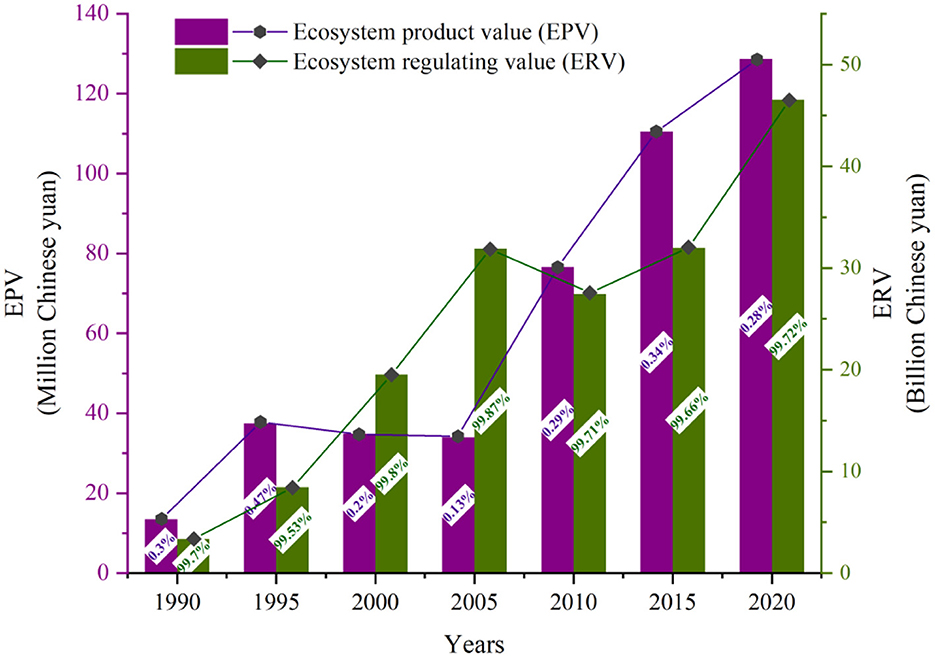
Figure 3. GEP components of Pingshuo from 1990 to 2020.
As the units of the biophysical quantities of GEP were inconsistent (Supplementary Table 2), the following research focused on the monetary quantities of GEP, abbreviated as GEP. According to its value range, the visualization of the GEP was carried out using the natural break method in ArcGIS 10.2, and the classified results are shown in Figure 4 in descending order: Level 1 (F), Level 2 (E), Level 3 (D), Level 4 (C), Level 5 (B), and Level 6 (A). In different years, the spatial distribution of GEP showed different characteristics (see Figure 4). Moreover, the proportion of the lowest grade (Level 1) increased from 4.67 to 15.33%, while the higher grades (Level 4 and above) decreased from 51.90 to 32.18% (Table 4). Therefore, it was essential to study the spatial and temporal heterogeneity of GEP.

Figure 4. Spatial distribution of GEP in Pingshuo from 1990 to 2020.
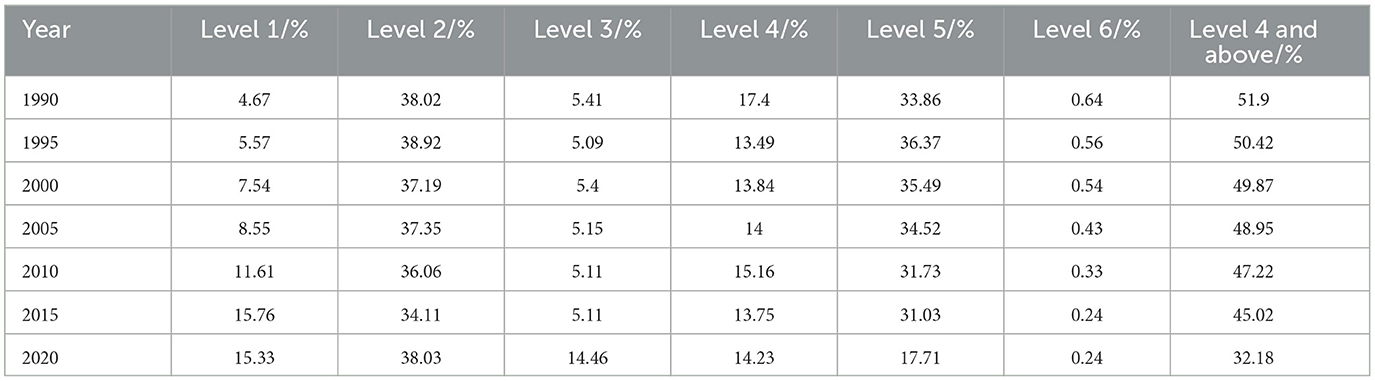
Table 4. The occupation of different levels of GEP in Pingshuo from 1990 to 2020.
Four significant correlations were found in Pingshuo, of which H–H and L–L were the main types (see Figure 5). Figure 5 shows that the boundaries of the open-pit mining areas were generally within the values of L–L, and the values of L–L gradually increased. The values of H–H were mainly situated in the northeast of the Antaibao and Anjialing open-pit coal mining areas after 1995. There were also H–L and L–H outliers, which were sporadic. The values of H–L were close to the area of L–L, while the values of L–H were close to the area of H–H.
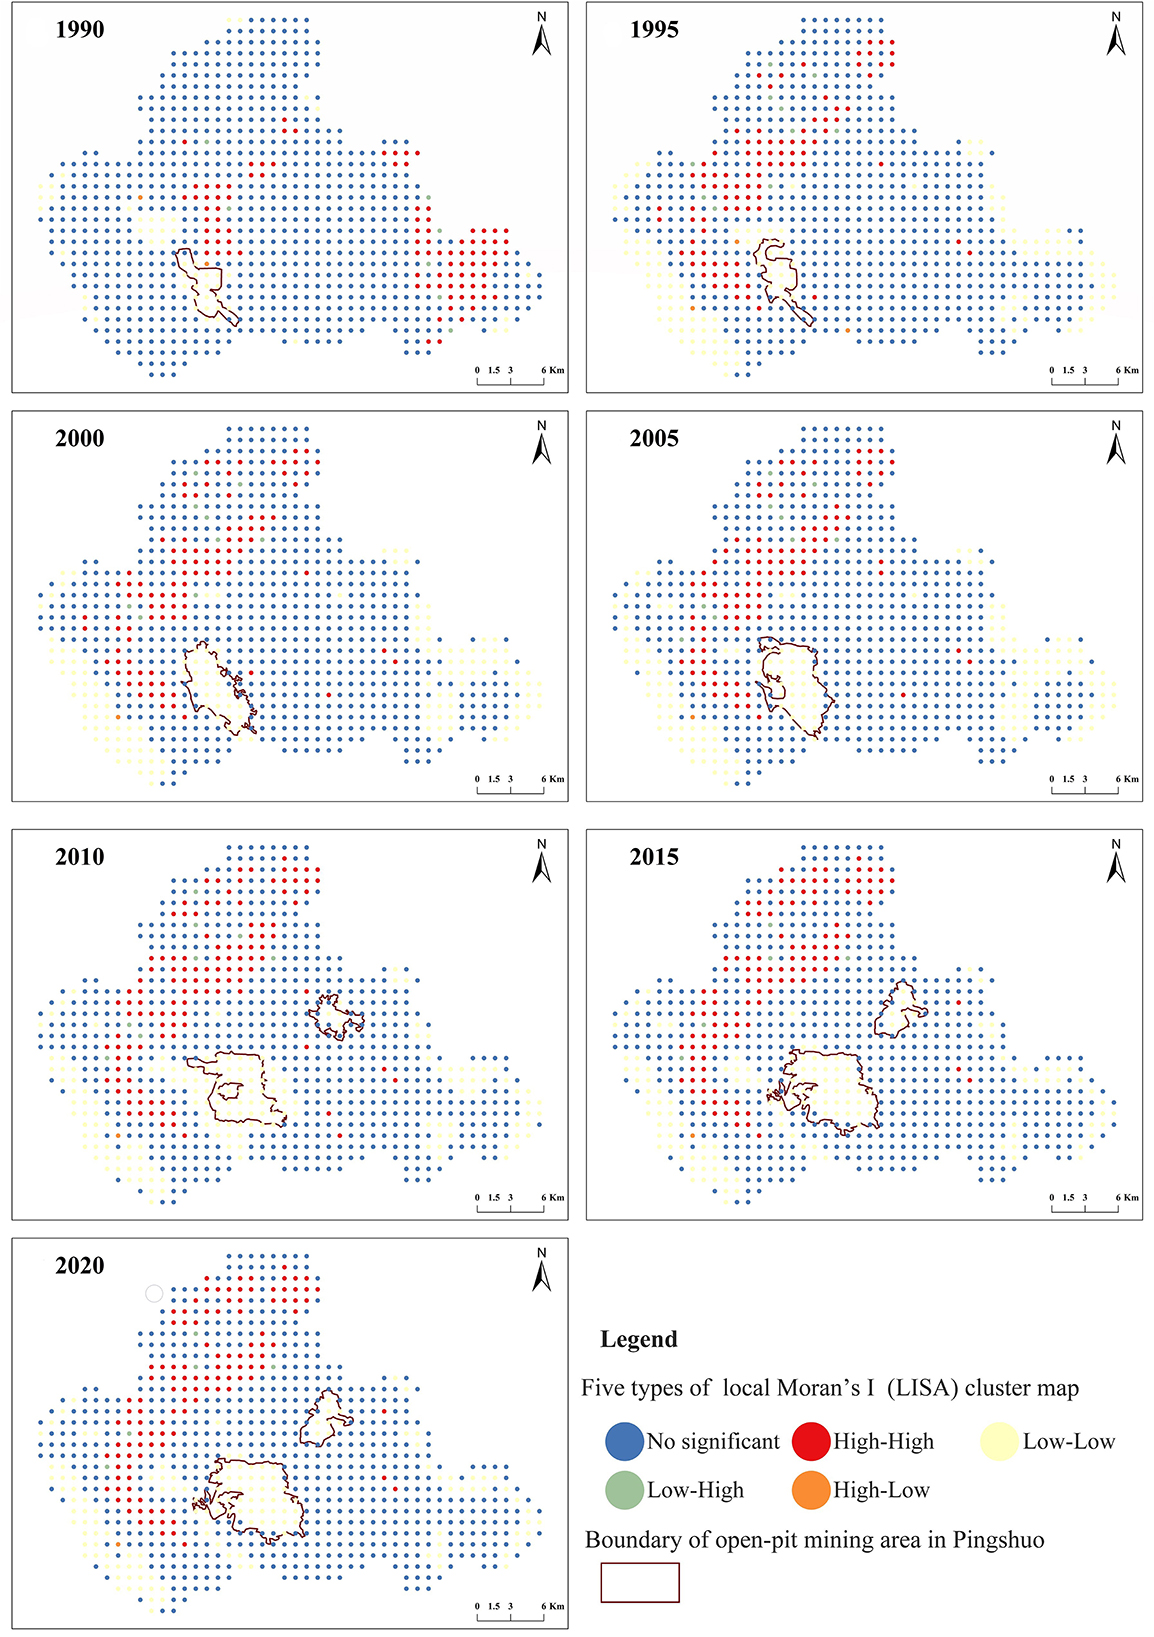
Figure 5. LISA cluster maps of GEP in Pingshuo from 1990 to 2020.
Figure 6 is the LISA significance map, which can reflect the significance level of the GEP, and it could be observed that, within the L–L and H–H areas, the significance level of the GEP was 0.001, with some values at the significance level of 0.01. In other words, the GEP of these regions was strongly positively related to the GEP of neighboring regions. In the mining areas, the significance levels were substantially >0.05, which meant that the spatial distribution of GEP was firmly convergence and showed a strong correlation. Moreover, the areas of significance (p = 0.01) and the higher significance (p = 0.001) manifested an increasing trend before 2015.
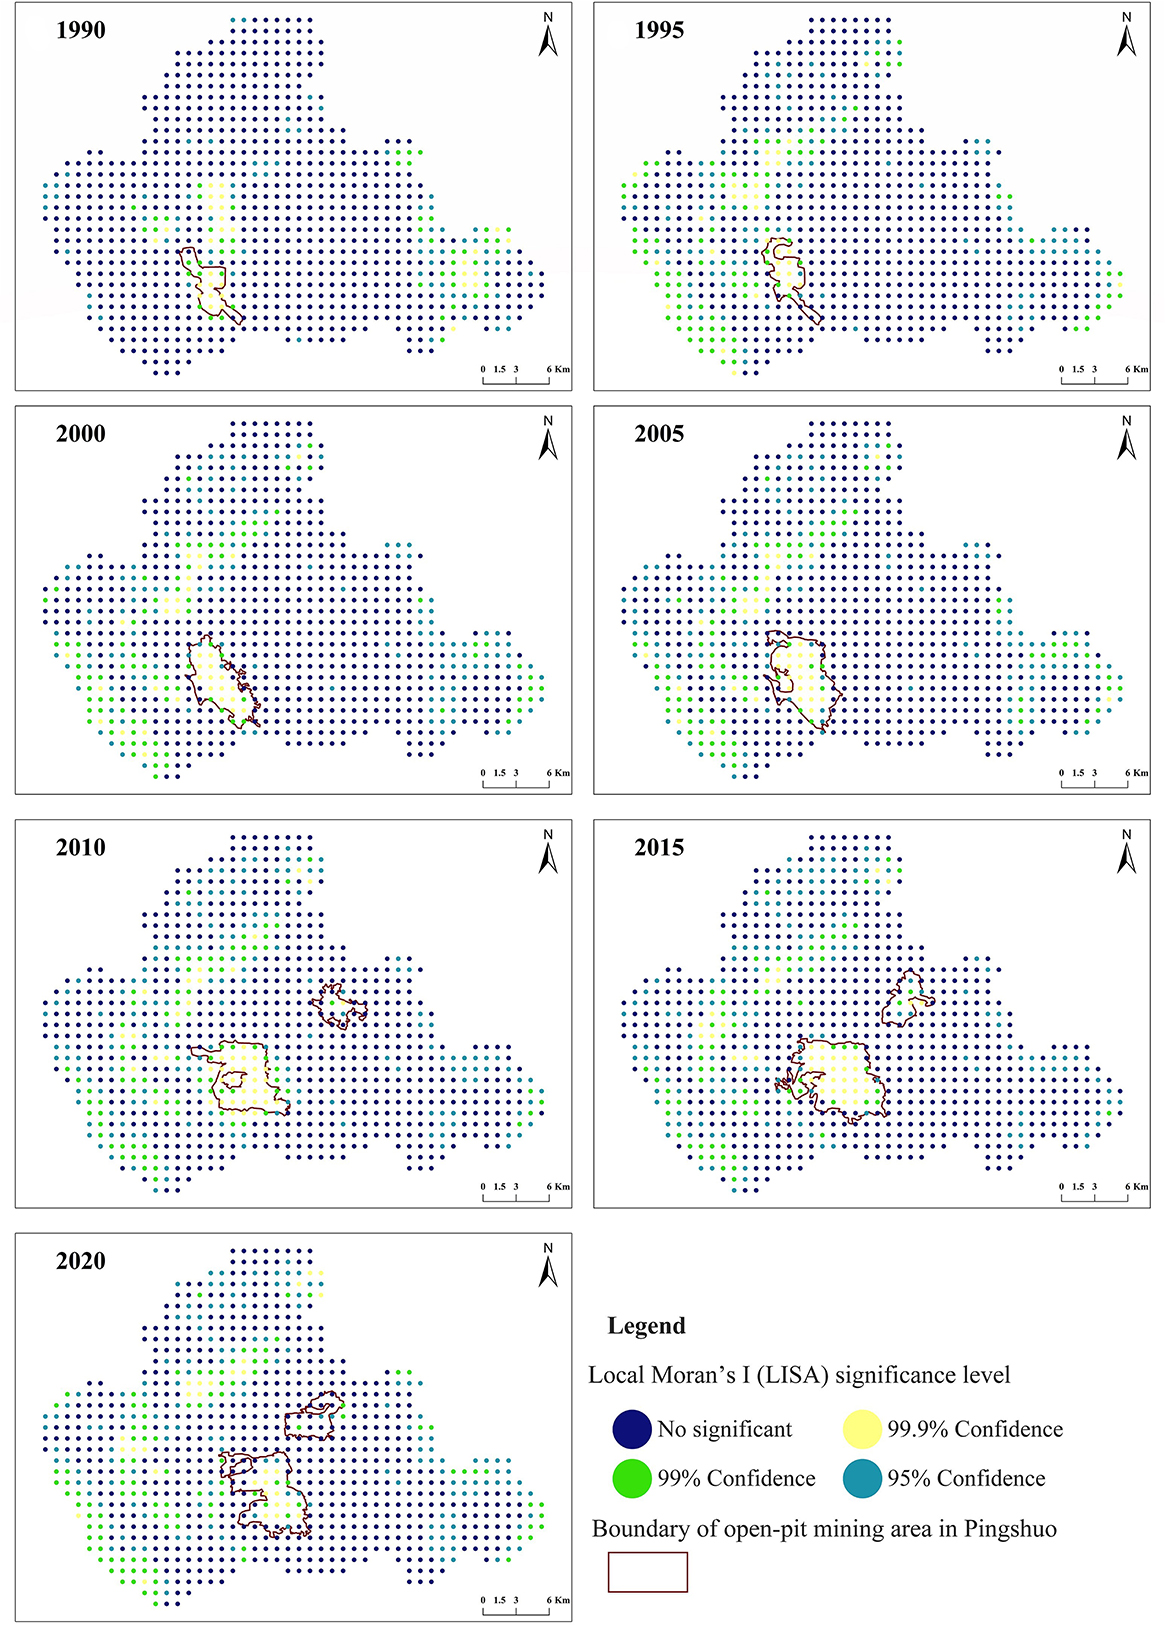
Figure 6. LISA significance maps of GEP in Pingshuo from 1990 to 2020.
Before analyzing the density and hot spot, the spatialized GEP was resampled through the 300 * 300 m fishnet and applied using the spatial linkage method in ArcGIS 10.2. The detailed spatial distributions of the GEP variation density and hot spot are presented in Figures 7, 8, supplemented by changes in the boundaries of adjacent non-contemporaneous mining areas. Areas of high density and hot spots were concentrated in and around mining areas, and these areas gradually increased before 2015. Compared with the shrunken mining areas, the extended areas were likely to lead to the variation of GEP (see Figures 7, 8). While the low-density and cold spot regions were mainly distributed within other areas, the areas of low violent artificial disturbance and, excluding 2010–2015, low-density and cold spot areas were the main areas in the study area.
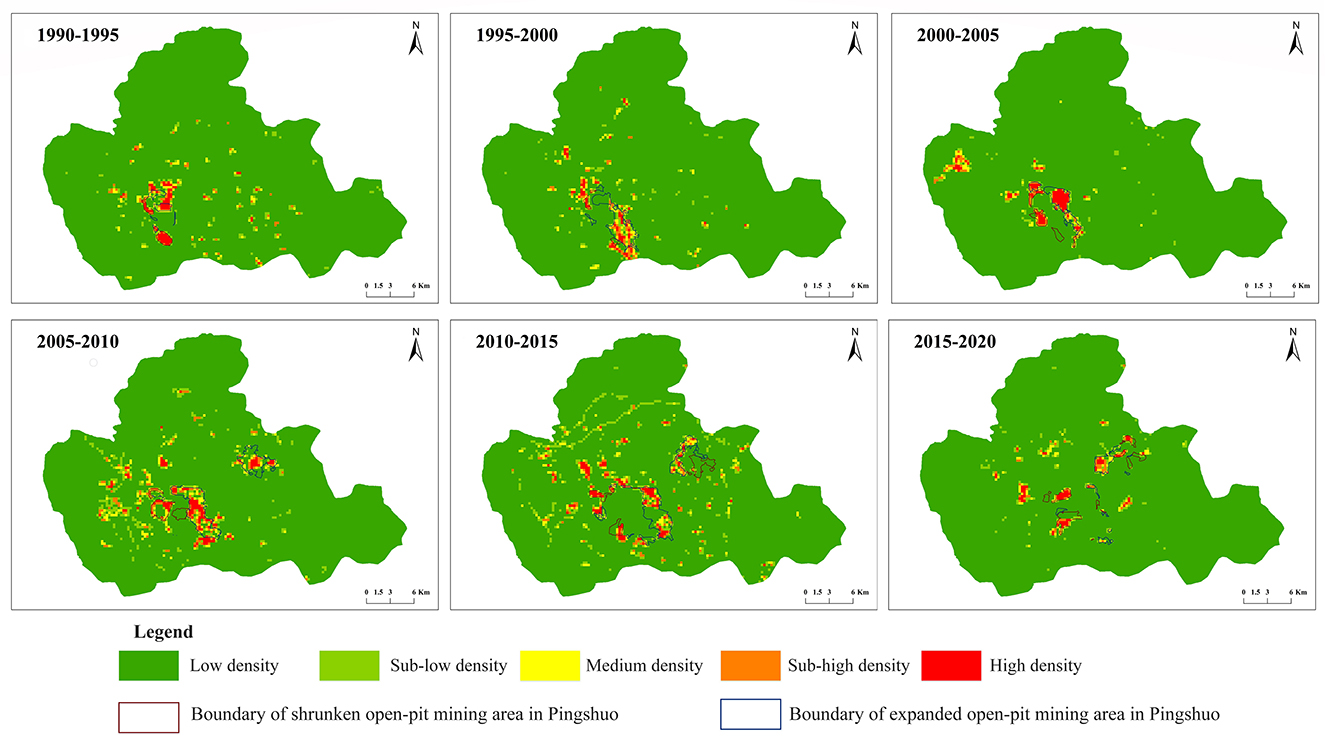
Figure 7. Spatial distribution of low density and high density of GEP changes in Pingshuo from 1990 to 2020.
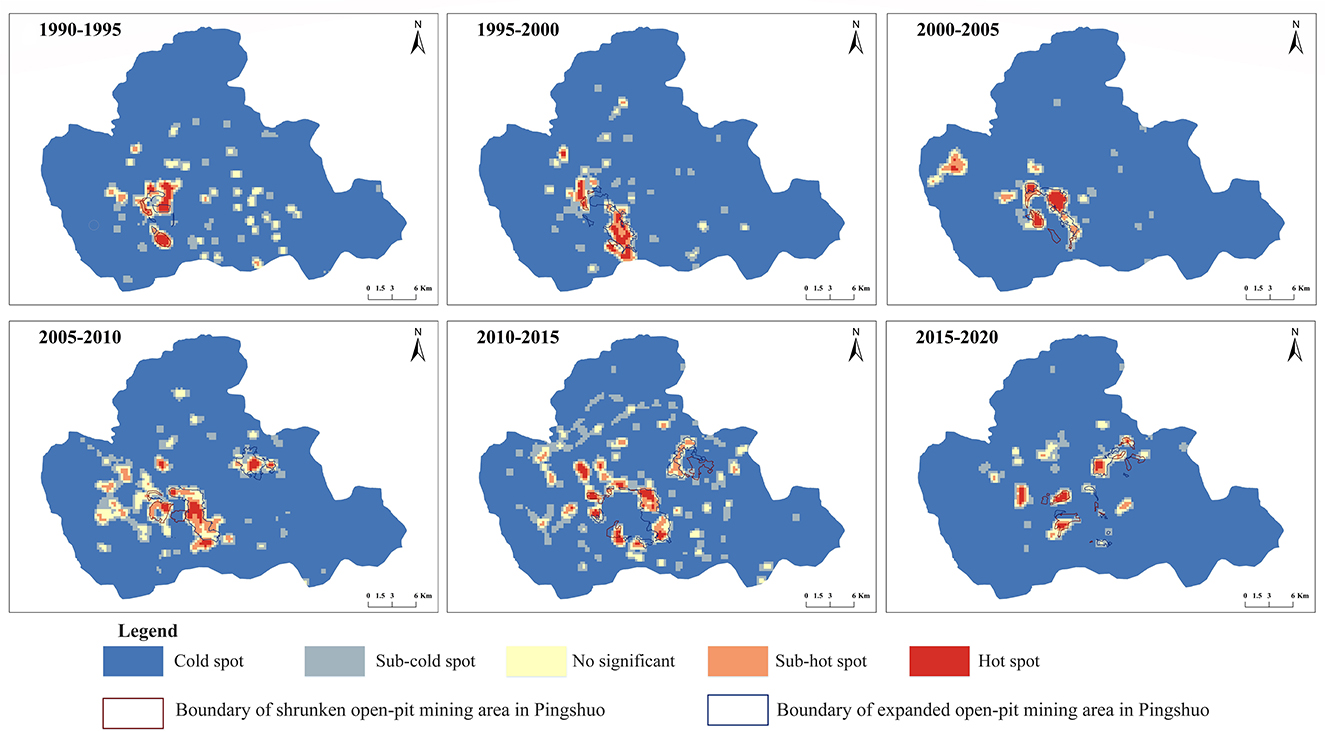
Figure 8. Spatial distribution of hot and cold spots of GEP changes in Pingshuo from 1990 to 2020.
The results revealed that temperature (tolerance = 0.018, VIF = 56.941) and POP (tolerance = 0.025, VIF = 40.412) had minor tolerances and the most significant VIF values (Table 5). Neither the tolerances of the two driving factors nor the VIF values meet the threshold values (VIF <10 or tolerance> 0.1). The maximum correlation value was between POP and night lights (0.875), and it was followed by the correlation value between GDP and Hemeroby (0.753; see Figure 9), and both of the two values were >0.7, indicating that the POP and night lights, GDP, and Hemeroby are strongly collinear. Therefore, we removed the driving factors of temperature, POP, and Hemeroby before the processes of driving force analyses.
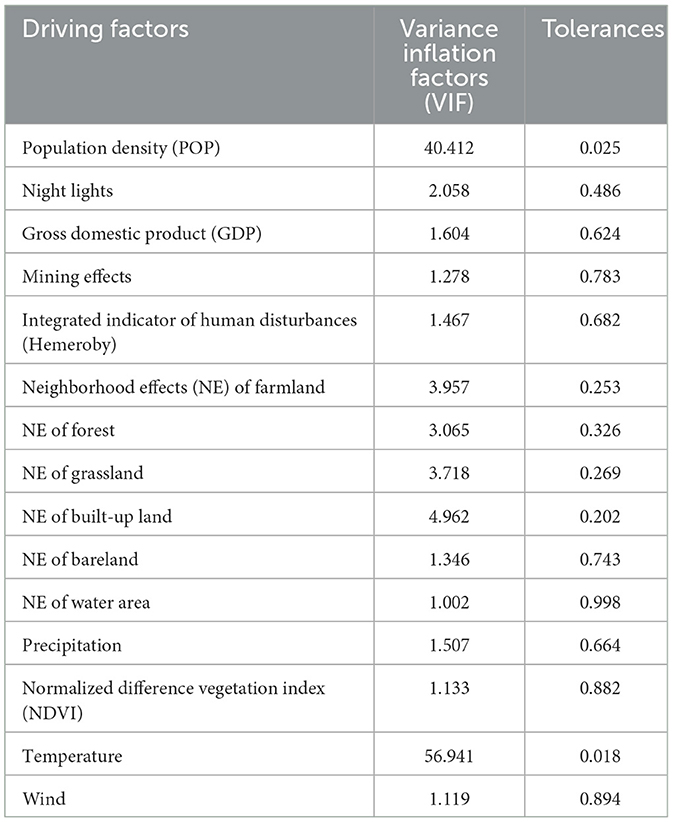
Table 5. Multicollinearity analysis of the driving factors.
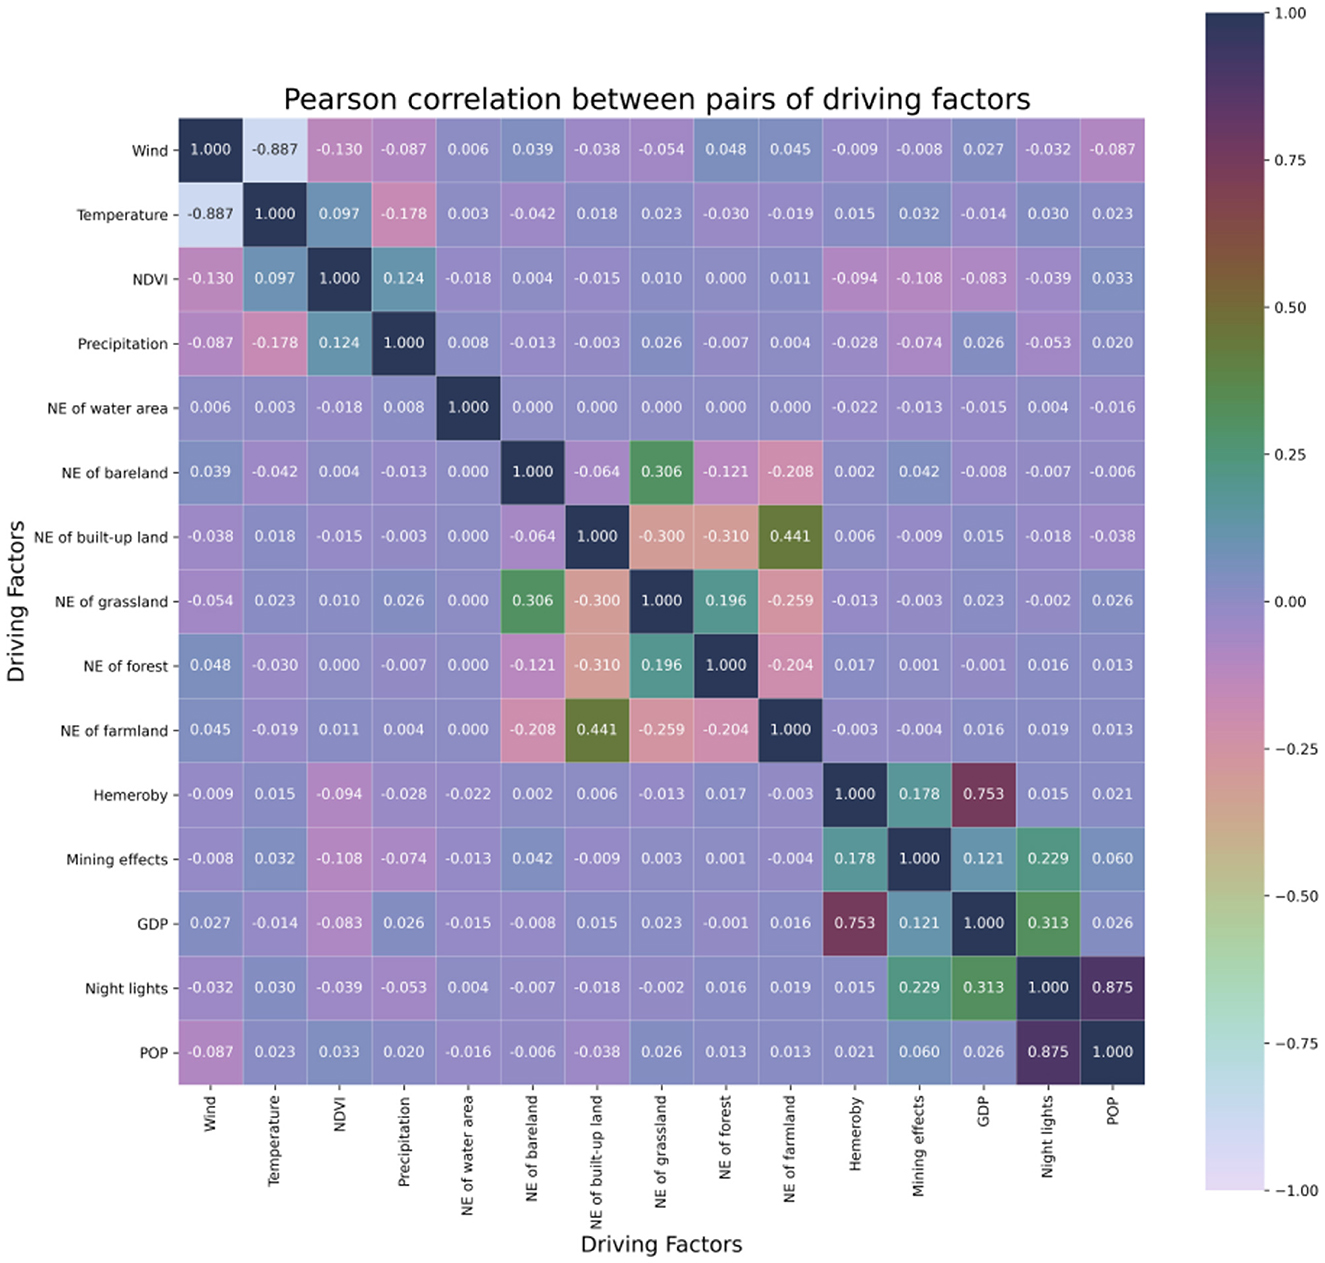
Figure 9. Pearson correlation coefficient between the pairs of driving factors. NDVI represents the normalized difference vegetation index. NE represents neighborhood effects. Hemeroby represents an integrated indicator of human disturbances. GDP represents gross domestic product. POP represents population density.
Gross domestic product (GDP; q = 0.348), NDVI (q = 0.297), night lights (q = 0.295), precipitation (q = 0.249), mining effects (q = 0.164), and wind speed (q = 0.147) had stable and dominant solid effects on the spatial heterogeneity of GEP (Table 6). However, the values of q for the neighborhood effects of LULC were all below 10%, indicating that they played a small role in the spatial distribution heterogeneity of GEP, and the impacts of neighborhood effects of LULC on GEP tended to remain constant compared with other factors (see Figure 10).
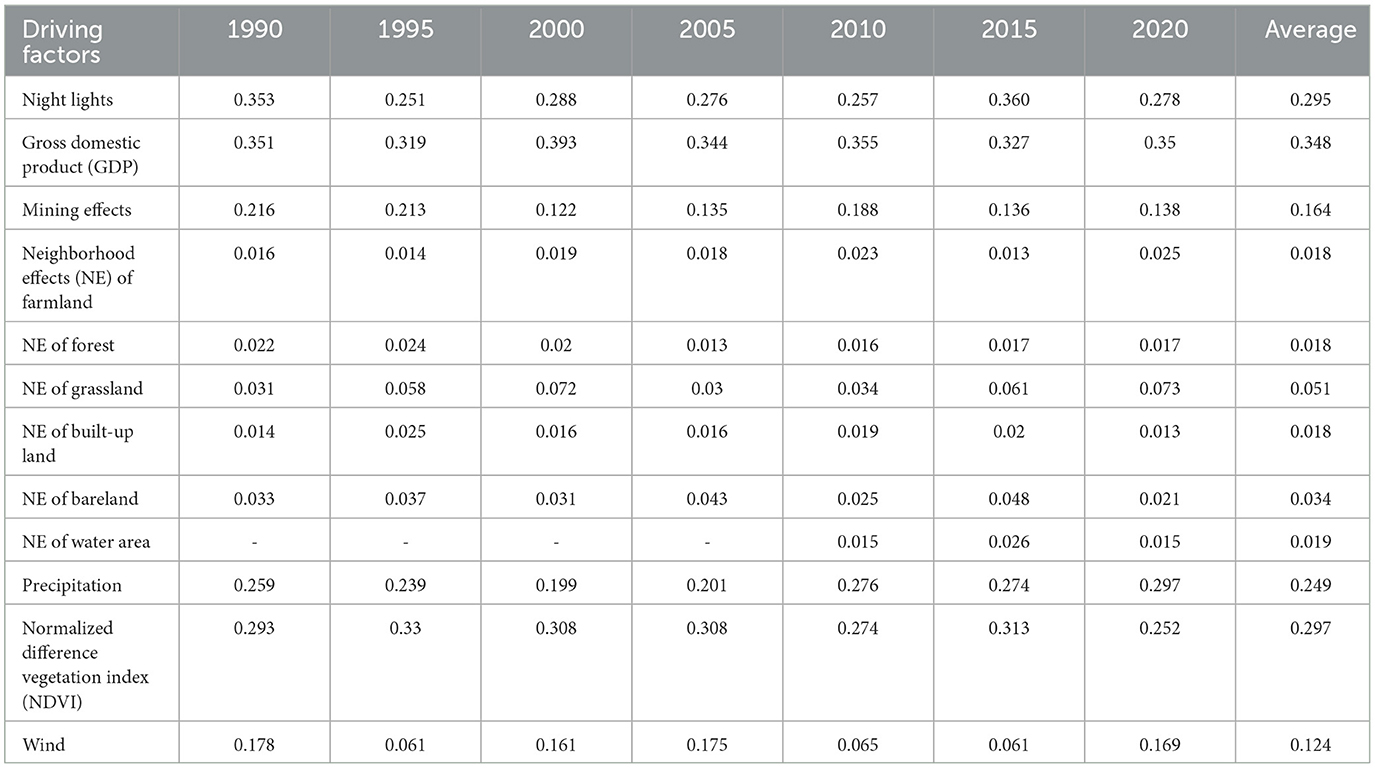
Table 6. The results of the factor detector for the spatial differentiation of GEP in Pingshuo.
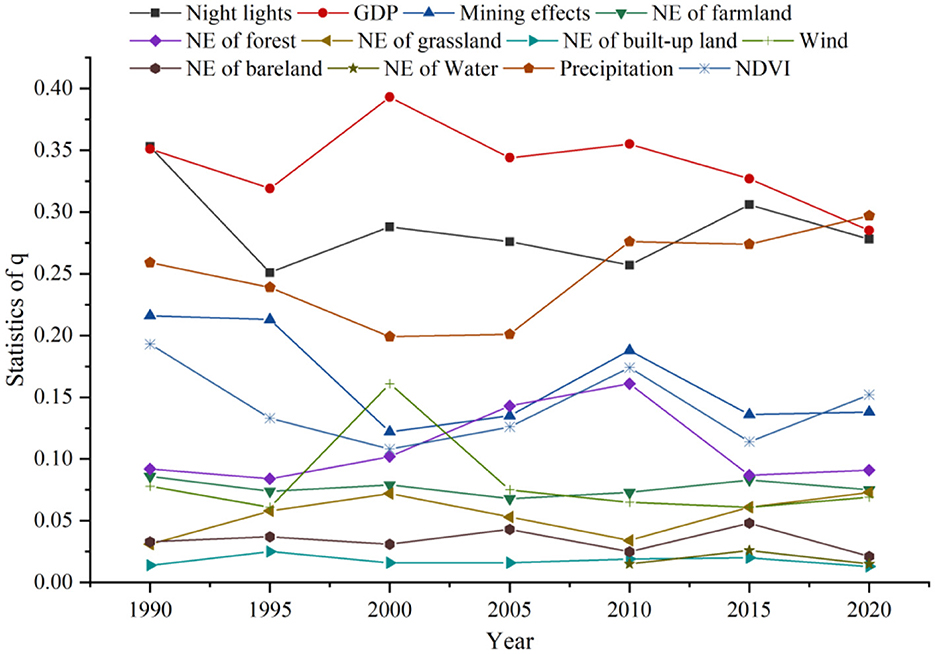
Figure 10. The variations of factor detector for the spatial differentiation of GEP in Pingshuo. NDVI represents the normalized difference vegetation index. NE represents neighborhood effects. Hemeroby represents an integrated indicator of human disturbances. GDP represents gross domestic product. POP represents population density.
Gross domestic product (GDP; mean weight = 0.400), mining effects (mean weight = 0.325), and night lights (mean weight = 0.270) were the most prominent factors contributing to the variation in GEP (see Figure 11, Table 7). However, the various factors influencing how GEP varied (see Figure 12). For example, GDP and night lights demonstrated negative trends in the variations of GEP. At the same time, the mining effects were divided into two different trends by the boundary line of the mine. Indeed, the effects of different factors on GEP varied greatly, and even the effects of the same factors could change over time. For example, the GDP and GEP were negatively correlated, with the degree of impact varying yearly. In 1995–2000 and 2000–2005, the changes in GDP on GEP were reduced to simple segmented linear functions. However, between 1990–1995 and 2005–2010, the effects became more complex and required the intervention of non-linear functions to explain them.
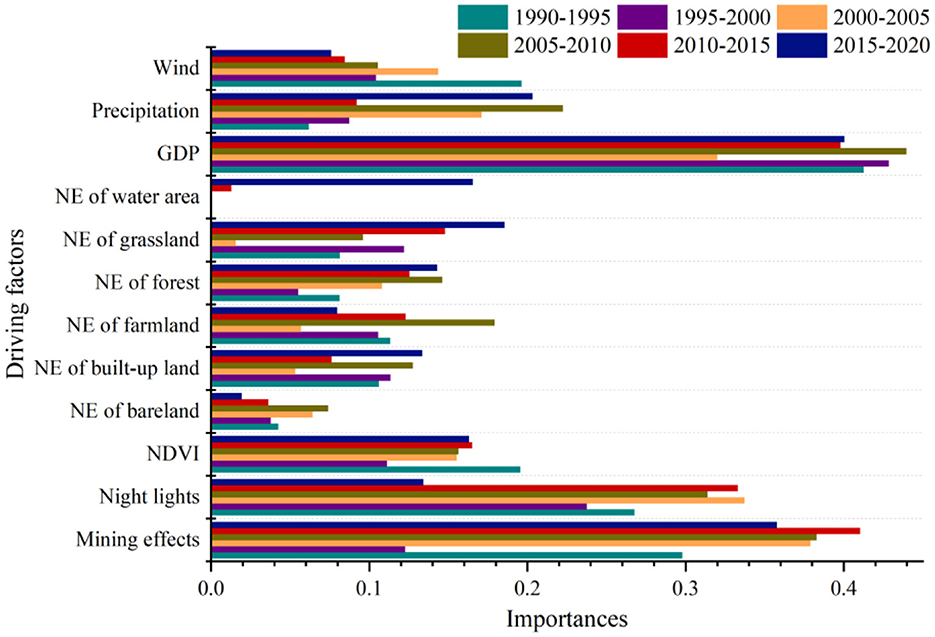
Figure 11. Results of the driver factors' importance assessment in Pingshuo for GEP changing. NDVI represents the normalized difference vegetation index. NE represents neighborhood effects. Hemeroby represents an integrated indicator of human disturbances. GDP represents gross domestic product. POP represents population density.
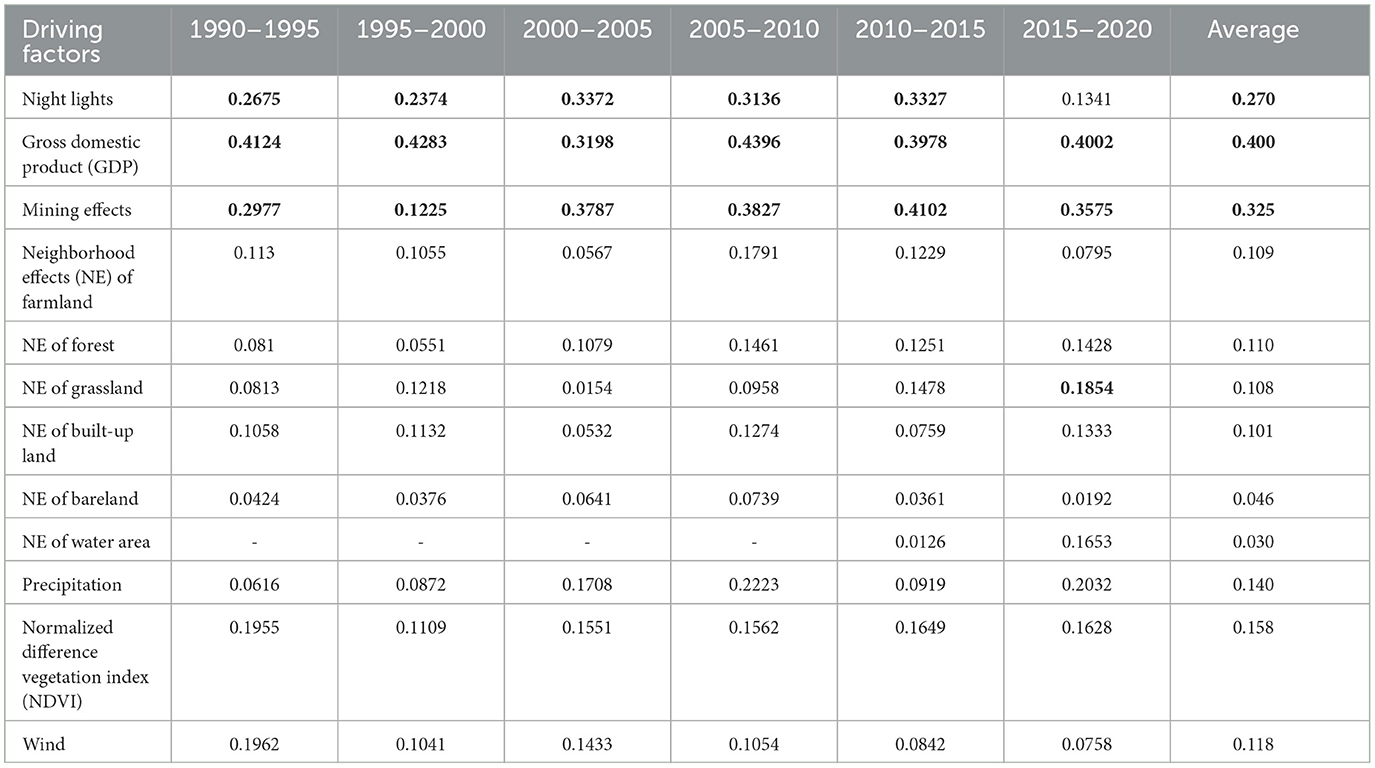
Table 7. The results of the permutation feature importance method for the variations of GEP in Pingshuo (the first three factors are bolded).
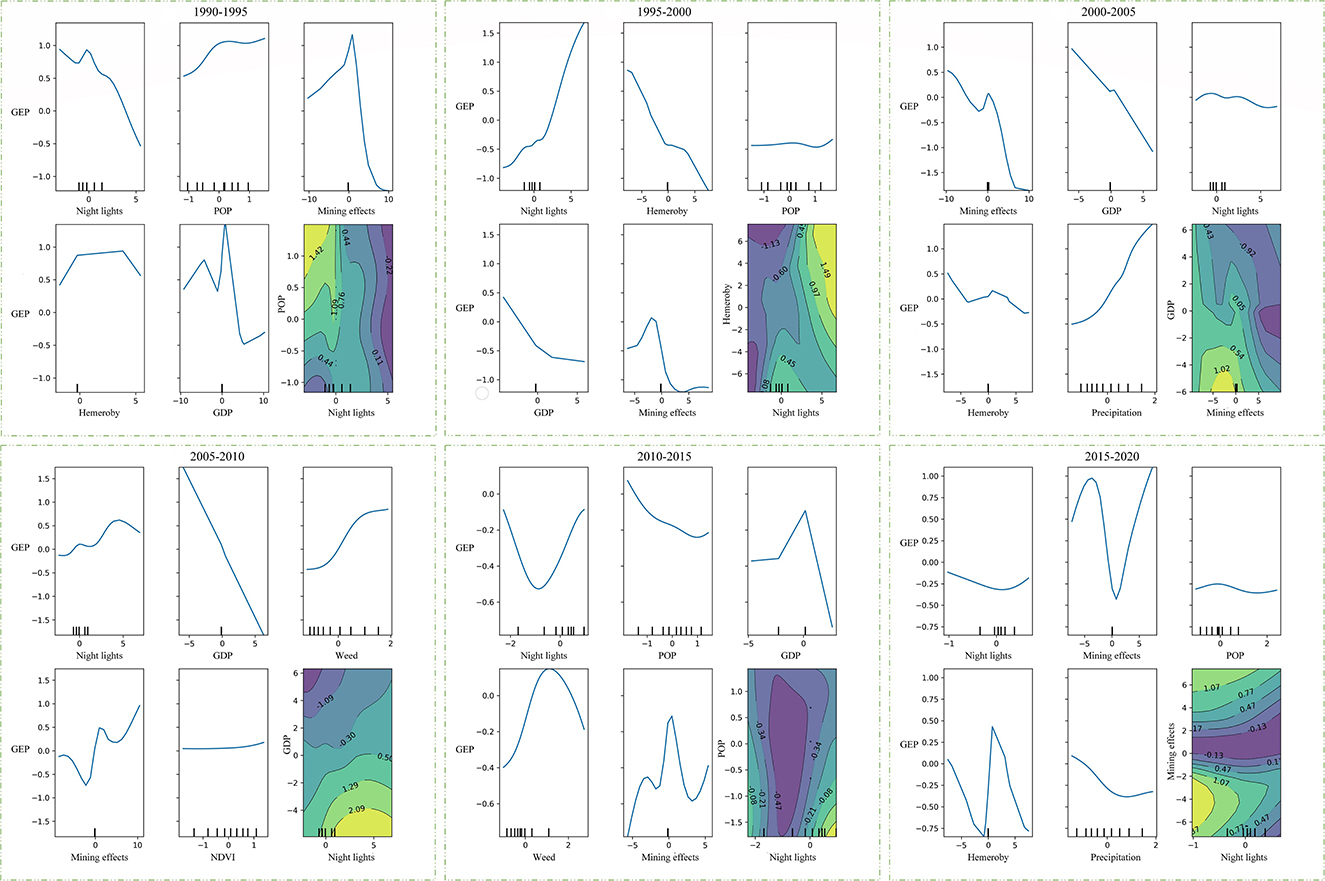
Figure 12. Partial dependency diagrams of the first three important driving factors. NDVI represents the normalized difference vegetation index. NE represents neighborhood effects. Hemeroby represents an integrated indicator of human disturbances. GDP represents gross domestic product. POP represents population density.
As for the bivariate effects, adding new variables usually resulted in a change in the trend of the single factor, although this effect could be greater or lesser (see Figure 12). For instance, night lights were more likely to cause a change in the trend of GDP than the mining effects. Generally, the bivariate results would be more varied and complex, and specific analyses would be needed for each year and situation.
While the growth of GEP from 1990 to 2020 increased from 3.34 to 46.67 billion RMB¥, the annual average growth rates of GEP decreased from 30.78 to 9.1% (see Figure 13), and the areas of GEP with high levels were decreasing year by year (see Table 4). Furthermore, the exploitation of coal resources played an essential role in the spatial distribution and the spatial–temporal heterogeneity of GEP. Therefore, we sought to investigate how to maximize the mining economy while ensuring that the impact on the ecosystem in the open-pit coal mining area was minimized by controlling the exploration seed of mining areas.
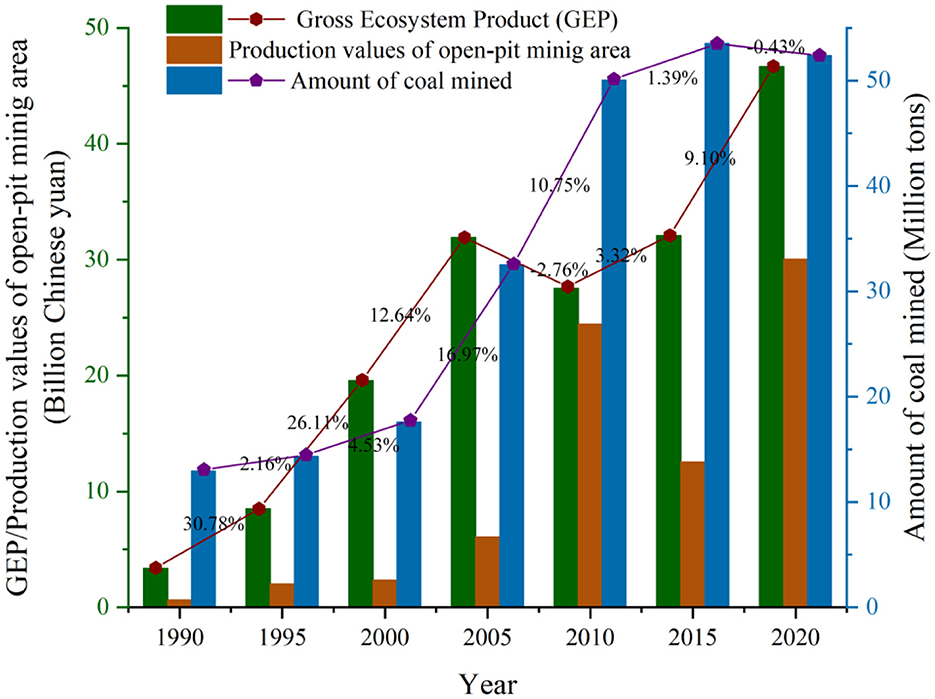
Figure 13. Statistical chart of GEP and exploitation of mineral resources in Pingshuo.
The regression analysis was carried out for the mining areas and the production values of coal mining from 1990 to 2020, and the results showed that the mining areas had a 98.2% explanatory rate for the production values (R2 = 0.982), which is the reason why we seek the balance between the economy and the ecosystem in Pingshuo with the help of mining areas. Until 2010, the increasing annual growth rate of the mining area was associated with the decreasing growth rate of the GEP. After 2010, when the annual growth rate of the mining area fell to 3.89%, the GEP experienced a simultaneous increase in both growth rates and values (Table 8). The growth rates of the mining areas in Table 8 were calculated as the ratio of the growth of the mining area to the initial area.
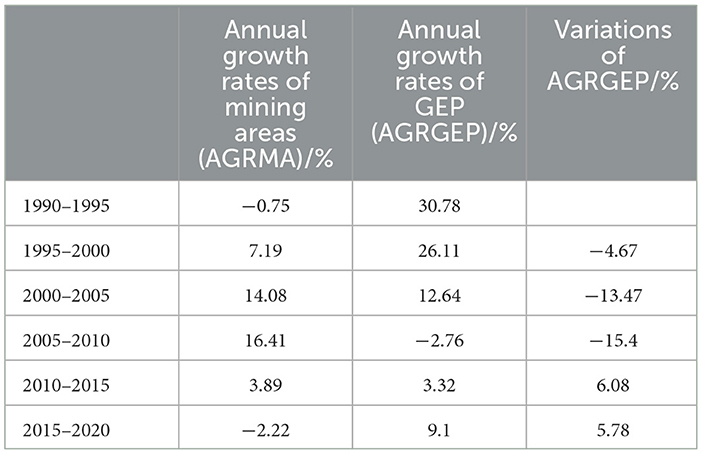
Table 8. The annual growth rates of the mining areas and GEP.
However, when the annual growth rates of the mining areas were <3.89%, the economic development of Pingshuo did not achieve the most optimal solution. To obtain the optimal solution, we accounted for the GEP and the production values from 1990 to 2020 after setting the annual growth rates of the mining areas within a range of 3.89–7.19%. It was found that, when the annual growth rate of the mining areas was restricted to between 4.56 and 5.03%, the variations in the annual growth rates of the GEP could be maintained between 0.02 and 0.08%. At that time, the GEP could reach 48.46–51.55 billion RMB¥, which is 1.04–1.10 times that of the current one, while the output values of mining could reach 23.91–26.79 billion RMB¥, which is 0.80–0.89 times that of the current ones.
Based on the GEP, this study assessed and monitored the value of ES in Pingshuo, a large open-pit coal mining area in China, from 1990 to 2020. Before 2010, GEP presented a gradually increasing tendency, rising from 3.34 to 31.91 billion RMB¥ (Table 3). However, the GEP in 2010 was 13.97% lower than that in 2005 (Table 3). Following that, GEP and the growth rate of GEP showed a steady growth trend from 2015 to 2020 (Table 8). The reasons for these changes in the GEP are relevant to the mining history and construction policies of Pingshuo. Pingshuo is composed of three open-pit mines as a large-scale open-pit coal mining area. The primary open-pit mine of Pingshuo was put into operation in 1987. Before 2009, although the mining policy was less concerned with the ecological environment, the agricultural land, forest, and grassland were the main LULC types in Pingshuo. The wide distribution of vegetated areas ensured a steady increase in GEP (Zhang et al., 2019a). After 2009, the overall production of the three open-pit mines entered a period of rapid development (Xu et al., 2021). The ecosystem had the lowest stability due to the intensification of mining activities and inadequate monitoring during 2009–2013. During this period, mining and dumping areas became the most crucial land types in Pingshuo, along with cultivated land and forest (Zhang et al., 2019a), which is the reason why GEP was lower in 2010 than in 2005 and 2015. After further research, we also found that mining effects, GDP, and night lights all had a decisive and negative impact on the GEP (see Figure 13), which reached its maximum in 2010 for the last three decades. Moreover, the simultaneous growth in the values and growth rates of GEP in 2015 and 2020 resulted from the positive implementation of the “green mine construction” in Pingshuo. In 2014, the China Federation of Mining Industry issued a notice on “National Green Mine Pilot Unit Acceptance Measures (for Trial Implementation)” (China Federation of Mining Industry, 2014). As the third batch of pilots, Pingshuo has paid particular attention to mining area governance and green reclamation, actively implementing “green mine construction” (Yu et al., 2022).
Regarding components, ERV was an essential component of GEP in Pingshuo (see Figure 3). However, the percentages of ERV were more significant compared with other types of regions. Pingshuo experienced poor production conditions, fewer crop varieties, and lower yields due to natural constraints, such as the environment and soil. It also limited the output and production of livestock, all of which resulted in a relatively low share of EPV. At the same time, the share of the different ES in ERV can be divided into two types. The years 1990 and 1995 have similar profiles and differ from the latter two decades (Supplementary Table 3). Specifically, in 1990 and 1995, water retention and oxygen supply services were considered essential ERV sources. In contrast, carbon sequestration replaced water retention as a vital part of ERV after 2000. Finally, it should be noted that the ERV was not included in our research due to the uniqueness of the regional functions and the different ecological aptitudes. Some of the results of this study were consistent with previous research (Ma et al., 2017; Miao et al., 2019), while others were unique to this mining area. Both of these indicate that it was practicable to monitor the value of ES in the large open-pit coal mining area by producing an estimate of GEP using existing data and methods.
We used the spatial–temporal analysis to quantitatively identify the driving factors for the variation and spatial distribution of GEP. The results indicated that mining effects had essential influences on the spatial–temporal variation (Table 7) and spatial distribution (Table 6) of GEP in Pingshuo.
From the point of view of variation, although the monetary quantities of the GEP were basically in the ascending states, the growth rates had a general tendency to fall (Supplementary Tables 3, 4). In addition, the number of regions with a high quality of ES decreased rapidly from 1990 to 2020. Specifically, the areas of higher levels (C-A) of GEP decreased from 51.90 to 32.18%, and the lowest level (F) increased from 4.67 to 15.33% (Table 4). Moreover, the expanded mining areas in Pingshuo were the main areas where higher values were converted to lower values. In comparison, the shrunken areas were the main areas where lower values were converted to higher values (see Supplementary Figure 1). We analyzed that the exclusive functional areas of open-pit coal mining, such as stripping areas and waste dumps, could damage forests and reduce vegetation cover and biomass (Zhang et al., 2019b). This resulted in the decline of ES with water retention, soil retention, sandstorm retention, carbon sequestration, oxygen supply, and climate regulation in Pingshuo (Supplementary Table 3). Moreover, the land degradation caused by the exploitation of coal resources cannot be ignored (Bian et al., 2020), which leads to the deduction of the ES with sandstorm retention.
The spatial correlation was significant in terms of spatial distribution, and the degree of spatial clustering was relatively high in Pingshuo. The H–H values were located in the northwest of Pingshuo, where no mining exploration had taken place. Meanwhile, L–L was situated in the coal mining areas (see Figure 5), with significant levels >0.05 (see Figure 6). As these areas have often been disturbed by mining exploration and other relevant human activities, the quality of the surrounding ecological environment has deteriorated. Moreover, the mining areas are always accompanied by drastic spatial variations in GEP (see Figures 7, 8). This is due to the inherent characteristics of duration, spatial extent, and frequent ecological disturbance that affect ES in open-pit mining areas (Gvozdkova et al., 2019; Xu et al., 2019). It is clear that, when mining development is chosen in ecologically fragile areas, economic gains are associated with corresponding ecological pressure and loss of ES value.
As the exploitation of mineral resources has contributed significantly to the spatial heterogeneity and variability of the GEP (Tables 7, 8), we investigated the balance between economic and ecosystem development in Pingshuo by controlling the rate of exploration in mining areas. Moreover, we found that the value of ES could be improved when the annual growth rate of the mining areas in Pingshuo was restricted to between 4.56 and 5.03%. Previous experiments have also confirmed that the rational usage of the land, the manageable exploitation of mineral resources, and the reducing land occupation were all beneficial for the local ecosystem (Xu et al., 2021). This may have practical implications for future resource development and utilization in Pingshuo, which could ensure the balance between mineral supply and ecosystem sustainability.
In this study, GEP was implemented in a large-scale open-pit coal mining area to quantitatively assess and monitor the value of ES from 1990 to 2020. The study presents the following conclusion:
1) The GEP changes in Pingshuo have been significant over the past 30 years, and the mining areas also continuously showed concentrated high-density and hot spot areas of GEP changes. While the GEP increased from 3.34 to 46.67 billion RMB¥, the annual average growth rate of GEP decreased from 30.78 to 9.1%, and the number of regions with high ES quality fell rapidly from 51.90 to 32.18%.
2) The spatial correlation of GEP was pronounced, the degree of spatial clustering was relatively high, and the significance levels of GEP in the mining areas were significantly higher than 0.05. The areas of significance (p = 0.01) and the higher significance (p = 0.001) showed an increasing trend before 2015.
3) Three socioeconomic factors such as GDP (q = 0.348, mean weight = 0.400), night lights (q = 0.295, mean weight = 0.270), and mining effects (q = 0.164, mean weight = 0.325) had significant effects on the spatial heterogeneity and spatial–temporal variation of GEP, and the impact on GEP varies with factors and time.
4) The GEP of the mining areas can be guaranteed to grow in value and growth rate by limiting the annual growth rate of the mining areas to between 4.56 and 5.03%.
Since the accounting methods for GEP belong to the interdisciplinary subject, the processing is relatively diverse in indicators, model algorithms, and parameter selection. Moreover, GEP accounting is still at an early stage of development. Apart from the services we mentioned and accounted for in this research, many services still need more clarity in the formation mechanisms of ES (Pandeya et al., 2016). A typical example is preventing and reducing the possibility of mass movements by ecosystems, such as debris flows, landslides, mudflows, rock falls, etc. (Kirschbaum and Stanley, 2018). Although extremely important for human survival and economic development, the quantitative relationships between ecosystems and mass movement regulation have yet to be thoroughly investigated (Bruzzese et al., 2021). Moreover, even for the types of services generally recognized by humans, it is difficult to quantify the values using immature technical methods and unreliable data. In addition, ERV indicators not available in market values are typically measured by replacement cost in this study. Even though this direct market-based method has a relatively low level of uncertainty in assessing the value of the ERV (TEEB, 2010), there are still inherent uncertainties in the valuation methodologies. For example, some common pricing mechanisms, such as carbon and industrial oxygen and the cost of reservoir construction, have different price ranges and can vary widely from different sources.
This study provides a novel way of investigating ES in large-scale open-pit coal mining areas, which can clarify the value differences of the same type of ecosystem in different regions. Despite these limitations, GEP can reflect the contribution of an open-pit coal mining area's ecosystems to human wellbeing, and the spatial and temporal trend of GEP can reflect changes in the quality of ecosystems in the area and the reasons for changes. Our research findings may be instructive not only for the future development of Pingshuo but also for policies aimed at promoting sustainability in other mining areas.
The original contributions presented in the study are included in the article/Supplementary material, further inquiries can be directed to the corresponding author.
DL, JS, and CS contributed to the study's conception and design. JS, JY, and FW performed provisioning preparation, data collection, and analysis. JS wrote the first draft of the manuscript. All authors commented on previous versions of the manuscript, read, and approved the final manuscript.
We are grateful for the financial support provided by the Shanxi Province Key Technology and Generic Technology R&D Project (2020XXX007).
The authors declare that the research was conducted in the absence of any commercial or financial relationships that could be construed as a potential conflict of interest.
All claims expressed in this article are solely those of the authors and do not necessarily represent those of their affiliated organizations, or those of the publisher, the editors and the reviewers. Any product that may be evaluated in this article, or claim that may be made by its manufacturer, is not guaranteed or endorsed by the publisher.
The Supplementary Material for this article can be found online at: https://www.frontiersin.org/articles/10.3389/fevo.2023.1127028/full#supplementary-material
Allison, P. D. (2001). Logistic Regression Using the SAS System: Theory and Application. Cary, NC: SAS Publishing.
Anselin, L. (2010). Local indicators of spatial association—LISA. Geograph. Anal. 27, 93–115. doi: 10.1111/j.1538-4632.1995.tb00338.x
Bai, Z. K., Li, J. C., Wang, W. Y., Ding, X. Q., Chai, S. J., Chen, J. J., et al. (2000). Ecological reconstruction of degraded land in an taibao open pit coal mine, Pingshuo, Shanxi, China. China Land Sci. 14, 1–4. doi: 10.13708/j.cnki.cn11-2640.2000.04.001
Bai, Z. K., and Yun, W. J. (2018). A case study on pingshuo mining area; land rehabilitation and reutilization in mining districts. Resources & Industries. 5, 32–37. doi: 10.13376/j.cnki.resourcesindustries.2008.05.01
Balasubramanian, A. (2016). An Overview of Mining Methods. Available online at: https://www.researchgate.net/publication/314502989_AN_OVERVIEW_OF_MINING_METHODS (accessed March 10, 2017).
Bian, Z. F., and Lu, Q. Q. (2013). Ecological effects analysis of land use change in coal mining area based on ecosystem service valuing: A case study in Jiawang. Environ. Earth Sci. 68, 1619–1630. doi: 10.1007/s12665-012-1855-0
Bian, Z. F., Yu, H. C., Hou, J., and Mu, S. G. (2020). Influencing factors and evaluation of land degradation of 12 coal mine areas in Western China. J. China Coal Soc. 45, 338–350. doi: 10.13225/j.cnki.jccs.YG19.1722
Booth, G. D., Niccolucci, M. J., and Schuster, E. G. (1994). Identifying proxy sets in multiple linear regression: an aid to better coefficient interpretation. Usda Forest Service Intermountain Research Station Research Paper. 470, 1–13.
Bruzzese, S., Blanc, S., Brun, F. (2021). The Forest Protection Service: a Risk Management Decision Support Tool. EGU General Assembly Conference Abstracts.
Chavez, P. (1996). Image-based atmospheric corrections revisited and improved. Photogrammetr. Eng. 62, 1025–1036.
Cheng, M., Huang, B. B., Kong, L. Q., and Ouyang, Z. Y. (2019). Ecosystem spatial changes and driving forces in the Bohai coastal zone. Int. J. Environ. Res. Publ. Health 16, 40536. doi: 10.3390/ijerph16040536
China Federation of Mining Industry (2014). National Green Mine Pilot Unit Acceptance Measures (for Trial Implementation). Available online at: http://www.chinamining.org.cn/index.php?m=content&c=index&a=show&catid=20&id=980 (accessed August 7, 2014).
Costanza, R., d'Arge, R., de Groot, R., Farber, S., Grasso, M., Hannon, B., et al. (1998). The value of the world's ecosystem services and natural capital. Ecol. Econ. 25, 3–15. doi: 10.1016/S0921-8009(98)00020-2
Daily, D. C. (1997). Nature's Services: Societal Dependence on Natural Ecosystems. Washington, DC: Island Press.
Daily, G. C., Polasky, S., Goldstein, J., Kareiva, P. M., Mooney, H. A., Pejchar, L., et al. (2009). Ecosystem services in decision making: Time to deliver. Front. Ecol. Environ. 7, 21–28. doi: 10.1890/080025
Dong, J. W., Zhou, Y, and You, N. S. (2021). China's 30 m Annual Maximum NDVI Dataset From 2000 to 2020. National Science & Technology Infrastructure. doi: 10.12199/nesdc.ecodb.rs.2021.012
Dormann, C. F., Elith, J., Bacher, S., Buchmann, C., Carl, G., Carre, G., et al. (2013). Collinearity: A review of methods to deal with it and a simulation study evaluating their performance. Ecography 36, 27–46. doi: 10.1111/j.1600-0587.2012.07348.x
Fisher, A., Rudin, C., and Dominici, F. (2019). All models are wrong, but many are useful: Learning a variable's importance by studying an entire class of prediction models simultaneously. J. Machine Learn. Res. 20, 1489. doi: 10.48550/arXiv.1801.01489
Gashaw, T., Tulu, T., Argaw, M., Worqlul, A. W., Tolessa, T., and Kindu, M. (2018). Estimating the impacts of land use/land cover changes on Ecosystem Service Values: The case of the Andassa watershed in the Upper Blue Nile basin of Ethiopia. Ecosyst. Serv. 31, 219–228. doi: 10.1016/j.ecoser.2018.05.001
Gomez, J., and Herbert, J. (2015). Environmental analysis of mining operations: Dynamic tools for impact assessment. Mineral. Eng. 76, 87–96. doi: 10.1016/j.mineng.2014.10.024
Greenwell, B. M., Boehmke, B. C., and Mccarthy, A. J. (2018). A Simple and Effective Model-Based Variable Importance Measure.
Gvozdkova, T., Stefanek, P., and Koscova, M. (2019). “On the measures to solve environmental problems of the territory with intensive open pit coal mining,” in 4th International Innovative Mining Symposium, ed T. F. Gorbachev (Kemerovo: Kuzbass State Tech Univ), 6. doi: 10.1051/e3sconf/201910502006
Hair, J. F., Black, W. C., Babin, B. J., and Anderson, R. E. (2006). Multivariate Data Analysis, 6th Edn. Upper Saddle River. NJ: Prentice Hall.
Han, R., Feng, C. C. E., Xu, N. Y., and Guo, L. (2020). Spatial heterogeneous relationship between ecosystem services and human disturbances: A case study in Chuandong, China. Sci. Tot. Environ. 721, 137818. doi: 10.1016/j.scitotenv.2020.137818
Hao, C. Z., Wu, S. Y., Zhang, W. T., Chen, Y. Q., Ren, Y. F., Chen, X., et al. (2022). A critical review of Gross ecosystem product accounting in China: Status quo, problems and future directions. J. Environ. Manag. 322, 115995. doi: 10.1016/j.jenvman.2022.115995
Hu, Z. Q., Xiao, W., and Zhao, Y. L. (2020). Re-discussion on coal mine eco-environment concurrent mining and reclamation. J. China Coal Soc. 45, 351–359. doi: 10.13225/j.cnki.jccs.YG19.1694
IUCN (2017). Gross Ecosystem Product (GEP). Available online at: https://www.iucn.org/news/china/201609/iucn-china-organises-gross-ecosystem-product-workshop-iucn-world-conservation-congress (accessed September 23, 2016).
Jiang, H. Q., Wu, W. J., Wang, J. N., Yang, W. S., Gao, Y. M., Duan, Y., et al. (2021). Mapping global value of terrestrial ecosystem services by countries. Ecosyst. Serv. 52, 101361. doi: 10.1016/j.ecoser.2021.101361
Jiang, W., Wu, T., and Fu, B. J. (2021). The value of ecosystem services in China: A systematic review for twenty years. Ecosyst. Serv. 52, 101365. doi: 10.1016/j.ecoser.2021.101365
Kibria, D. G. (2014). Mining: Friend or Foe? Economic, Environmental & Social Impacts- An Overview. Available online at: https://www.academia.edu/27550959/Mining_Friend_or_Foe_Economic_Environmental_and_Social_Impacts_An_Overview (accessed March 13, 2013).
Kirschbaum, D., and Stanley, T. (2018). Satellite-based assessment of rainfall-triggered landslide hazard for situational awareness. Earths Future 6, 505–523. doi: 10.1002/2017EF000715
Kumar, E., Subramani, T., and Karunanidhi, D. (2022). Integrated approach of ecosystem services for mine reclamation in a clustered mining semi-urban region of South India. Urban Climate 45, 101246. doi: 10.1016/j.uclim.2022.101246
Lechner, A. M., McIntyre, N., Witt, K., Raymond, C. M., Arnold, S., Scott, M., et al. (2017). Challenges of integrated modelling in mining regions to address social, environmental and economic impacts. Environ. Model. Softw. 93, 268–281. doi: 10.1016/j.envsoft.2017.03.020
Liao, D., and Valliant, R. (2012). Variance inflation factors in the analysis of complex survey data. Survey Methodol. 38, 53–62.
Liu, W. Q., and Chen, G. Z. (2021). Evolution of ecosystem service value and ecological storage estimation in huainan coal mining area. Bullet. Environ. Contamin. Toxicol. 107, 1243–1249. doi: 10.1007/s00128-021-03284-7
Liu, X., and Dong, Z. (2014). Analysis of grassland animal husbandry growth and factor contribution constitutes in Xinjiang. Xinjiang Agri. Sci. 51, 1955–1960. doi: 10.6048/j.issn.1001-4330.2014.10.030
Luo, J. H., Li, X. C., Ma, R. H., Li, F., Duan, H. T., Hu, W. P., et al. (2016). Applying remote sensing techniques to monitoring seasonal and interannual changes of aquatic vegetation in Taihu Lake, China. Ecolog. Indicat. 60, 503–513. doi: 10.1016/j.ecolind.2015.07.029
Ma, G. X., Yu, F., Wang, J. N., Zhou, X. F., Yuan, J., Mu, X. J., et al. (2017). Measuring gross ecosystem product(GEP) of 2015 for terrestrial ecosystems in China. China Environ. Sci. 37, 1474–1482.
Ma, G. X., Zhao, X. T., Wu, Q., and Pan, T. (2015). Concept definition and system construction of gross ecosystem production. Resour. Sci. 37, 1709–1715.
Meng, X., and Wang, H. (2018). Soil map based Harmonized World Soil Database (v1.2). A Big Earth Data Platform for Three Poles. Available online at: http://poles.tpdc.ac.cn/zh-hans/data/844010ba-d359-4020-bf76-2b58806f9205/ (accessed August 5, 2021).
Miao, Y., Yi, X., Zhi-yun, O., Hong, Y., Mao-tao, D., and Lei, A. (2019). Ecosystem regulation services accounting of gross ecosystem product (GEP) in Sichuan province. J. Southw. Minzu Univ. 45, 221–232. doi: 10.11920/xnmdzk.2019.03.001
Ouyang, Z. Y., Song, C. S., Zheng, H., Polasky, S., Xiao, Y., Bateman, I. J., et al. (2020). Using gross ecosystem product (GEP) to value nature in decision making. Proc. Natl. Acad. Sci. U. S. A. 117, 14593–14601. doi: 10.1073/pnas.1911439117
Ouyang, Z. Y., Zhu, C. Q., Yang, G. B., Xu, W. H., Zheng, H., Zhang, Y., et al. (2013). Gross ecosystem product: Concept, accounting framework and case study. Acta Ecol. Sin. 33, 6747–6761. doi: 10.5846/stxb201310092428
Pandeya, B., Buytaert, W., Zulkafli, Z., Karpouzoglou, T., Mao, F., and Hannah, D. M. (2016). A comparative analysis of ecosystem services valuation approaches for application at the local scale and in data scarce regions. Ecosyst. Serv. 22, 250–259. doi: 10.1016/j.ecoser.2016.10.015
Preece, L. D., van Oosterzee, P., Dungey, K., Standley, P. M., and Preece, N. D. (2016). Ecosystem service valuation reinforces world class value of Cape York Peninsula's ecosystems but environment and indigenous people lose out. Ecosyst. Serv. 18, 154–164. doi: 10.1016/j.ecoser.2016.03.001
Qian, D. W., Yan, C. Z., Xiu, L. N., and Feng, K. (2018). The impact of mining changes on surrounding lands and ecosystem service value in the Southern Slope of Qilian Mountains. Ecol. Complex. 36, 138–148. doi: 10.1016/j.ecocom.2018.08.002
Rigina, O. (2002). Environmental impact assessment of the mining and concentration activities in the Kola Peninsula, Russia by multidate remote sensing. Environ. Monitor. Assess. 75, 11–31. doi: 10.1023/A:1014248522919
Sannigrahi, S., Bhatt, S., Rahmat, S., Paul, S. K., and Sen, S. (2018). Estimating global ecosystem service values and its response to land surface dynamics during 1995-2015. J. Environ. Managment. 223, 115–131. doi: 10.1016/j.jenvman.2018.05.091
Sonter, L. J., Herrera, D., Barrett, D. J., Galford, G. L., Moran, C. J., and Soares, B. S. (2017). Mining drives extensive deforestation in the Brazilian Amazon. Nat. Commun. 8, 1013. doi: 10.1038/s41467-017-00557-w
Tang, Y., and Huang, Y. (2009). Spatial distribution characteristics of the percentage of soil fertility contribution and its associated basic crop yield in Mainland China. J. Agro Environ. Sci. 28, 1070–1078. Available online at: https://www.semanticscholar.org/paper/Spatial-Distribution-Characteristics-of-the-of-Soil-Yao/6e2872b4257af55843bcbe3fe07fd69ba1aa94d8
Tao, C., and Liyun, D. (2015). Long-Term Series of Daily Snow Depth Dataset in China (1979-2021).C. National Tibetan Plateau Data. Available online at: https://dx.doi.org/10.11888/Geogra.tpdc.270194 (accessed June 15, 2022).
TEEB (2010). The Economics of Ecosystems and Biodiversity Ecological and Economic Foundations. Pushpam Kumar. London and Washington: Earthscan.
Wang, J. F., and Hu, Y. (2012). Environmental health risk detection with GeogDetector. Environ. Model. Softw. 33, 114–115. doi: 10.1016/j.envsoft.2012.01.015
Wang, J. F., Li, X. H., Christakos, G., Liao, Y. L., Zhang, T., Gu, X., et al. (2010). Geographical detectors-based health risk assessment and its application in the neural tube defects study of the Heshun Region, China. Int. J. Geogr. Inform. Sci. 24, 107–127. doi: 10.1080/13658810802443457
Wang, J. F., and Xu, C. D. (2017). Geodetector: Principle and prospective. Acta Geograh. Sin. 72, 116–134. doi: 10.11821/dlxb201701010
Wang, L. Y., Su, K., Jiang, X. B., Zhou, X. B., Yu, Z., Chen, Z. C., et al. (2022). Measuring gross ecosystem product (GEP) in Guangxi, China, from 2005 to 2020. Land 11, 81213. doi: 10.3390/land11081213
Wang, Y., Li, X. M., Zhang, Q., Li, J. F., and Zhou, X. W. (2018). Projections of future land use changes: Multiple scenarios -based impacts analysis on ecosystem services for Wuhan city, China. Ecol. Indicat. 94, 430–445. doi: 10.1016/j.ecolind.2018.06.047
Wang, Z. Y., Lechner, A. M., and Baumgartl, T. (2018). Ecosystem services mapping uncertainty assessment: A case study in the Fitzroy Basin Mining Region. Water 10, 88. doi: 10.3390/w10010088
Wang, Z. Y., Lechner, A. M., Yang, Y. J., Baumgartl, T., and Wu, J. S. (2020). Mapping the cumulative impacts of long-term mining disturbance and progressive rehabilitation on ecosystem services. Sci. Tot. Environ. 717, 137214. doi: 10.1016/j.scitotenv.2020.137214
Wang, Z. Y., Luo, K. Y., Zhao, Y. H., Lechner, A. M., Wu, J. S., Zhu, Q. L., et al. (2022). Modelling regional ecological security pattern and restoration priorities after long-term intensive open-pit coal mining. Sci. Tot. Environ. 835, 155491. doi: 10.1016/j.scitotenv.2022.155491
Wieder, W. R., Boehnert, J., Bonan, G. B., and Langseth, M. (2014). Regridded Harmonized World Soil Database v1.2. Data set. Oak Ridge National Laboratory Distributed Active Archive Center, Oak Ridge, TN, United States. doi: 10.3334/ORNLDAAC/1247
Worlanyo, A. S., and Jiangfeng, L. (2021). Evaluating the environmental and economic impact of mining for post-mined land restoration and land-use: A review. J. Environ. Manag. 279, 111623. doi: 10.1016/j.jenvman.2020.111623
Xiang, H. X., Wang, Z. M., Mao, D. H., Zhang, J., Zhao, D., Zeng, Y., et al. (2021). Surface mining caused multiple ecosystem service losses in China. J. Environ. Manag. 290, 112618. doi: 10.1016/j.jenvman.2021.112618
Xiao, W., Zhang, W. K., Ye, Y. M., Lv, X. J., and Yang, W. F. (2020). Is underground coal mining causing land degradation and significantly damaging ecosystems in semi-arid areas? A study from an Ecological Capital perspective. Land Degrad. Dev. 31, 1969–1989. doi: 10.1002/ldr.3570
Xu, J. X., Zhao, H., Yin, P. C., Wu, L. X., and Li, G. (2019). Landscape ecological quality assessment and its dynamic change in coal mining area: A case study of Peixian. Environ. Earth Sci. 78, 5. doi: 10.1007/s12665-019-8747-5
Xu, W. X., Wang, J. M., Zhang, M., and Li, S. J. (2021). Construction of landscape ecological network based on landscape ecological risk assessment in a large-scale opencast coal mine area. J. Clean. Prod. 286, 125523. doi: 10.1016/j.jclepro.2020.125523
Xu, X. L. (2023). Remote Sensing Monitoring Dataset of Land Use Status in China for Many Years. doi: 10.12078/2023010301
Yang, W. F., Mu, Y., Zhang, W. K., Wang, W. W., Liu, J., Peng, J. H., et al. (2022). Assessment of ecological cumulative effect due to mining disturbance using google earth engine. Remote Sens. 14, 174381. doi: 10.3390/rs14174381
Yu, H. X., Li, S., Yu, L. F., and Wang, X. M. (2022). The recent progress China has made in green mine construction, part II: Typical examples of green mines. Int. J. Environ. Res. Publ. Health 19, 138166. doi: 10.3390/ijerph19138166
Zhang, J. J., Fu, M. C., Zeng, H., Geng, Y. H., and Hassani, F. P. (2013). Variations in ecosystem service values and local economy in response to land use: A case study of Wu'an, China. Land Degrad. Dev. 24, 236–249. doi: 10.1002/ldr.1120
Zhang, J. Y., Song, Y., and Wang, J. (2022). Spatiotemporal patterns of gross ecosystem product across China's cropland ecosystems over the past two decades. Front. Ecol. Evol. 10, 959329. doi: 10.3389/fevo.2022.959329
Zhang, L., Yu, X., Jiang, M., Xue, Z., Lu, X., and Zou, Y. (2017). A consistent ecosystem services valuation method based on Total Economic Value and Equivalent Value Factors: A case study in the Sanjiang Plain, Northeast China. Ecol. Complex. 29, 40–48. doi: 10.1016/j.ecocom.2016.12.008
Zhang, L. J., Zhou, X., Zhou, Y., Zhou, J., Guo, J. W., Zhai, Z. H., et al. (2022). Surface coal mining impacts on land use change and ecological service value: A case study in Shengli coalfield, Inner Mongolia. Int. J. Coal Sci. Technol. 9, 518. doi: 10.1007/s40789-022-00518-9
Zhang, M., Wang, J., and Feng, Y. (2019a). Temporal and spatial change of land use in a large-scale opencast coal mine area: A complex network approach. Land Use Pol. 86, 375–386. doi: 10.1016/j.landusepol.2019.05.020
Zhang, M., Wang, J. M., and Li, S. J. (2019b). Tempo-spatial changes and main anthropogenic influence factors of vegetation fractional coverage in a large-scale opencast coal mine area from 1992 to 2015. J. Clean. Prod. 232, 940–952. doi: 10.1016/j.jclepro.2019.05.334
Zhang, P. P., Ye, Q. Q., and Yu, Y. (2021). Research on farmers' satisfaction with ecological restoration performance in coal mining areas based on fuzzy comprehensive evaluation. Glob. Ecol. Conserv. 32, e01934. doi: 10.1016/j.gecco.2021.e01934
Zhou, W., Yang, K., Bai, Z. K., Cheng, H. X., and Liu, F. (2017). The development of topsoil properties under different reclaimed land uses in the Pingshuo opencast coalmine of Loess Plateau of China. Ecol. Eng. 100, 237–245. doi: 10.1016/j.ecoleng.2016.12.028
Keywords: open-pit coal mining area, ecosystem services (ES), gross ecosystem product (GEP), spatial-temporal dynamics, driving forces
Citation: Shi J, Li D, Shen C, Yang J and Wu F (2023) A new pattern to quantitatively evaluate the value of ecosystem services in the large-scale open-pit coal mining area. Front. Ecol. Evol. 11:1127028. doi: 10.3389/fevo.2023.1127028
Received: 19 December 2022; Accepted: 17 February 2023;
Published: 14 March 2023.
Edited by:
Amir Molajou, Iran University of Science and Technology, IranReviewed by:
Masoud Vahabzadeh, Iran University of Science and Technology, IranCopyright © 2023 Shi, Li, Shen, Yang and Wu. This is an open-access article distributed under the terms of the Creative Commons Attribution License (CC BY). The use, distribution or reproduction in other forums is permitted, provided the original author(s) and the copyright owner(s) are credited and that the original publication in this journal is cited, in accordance with accepted academic practice. No use, distribution or reproduction is permitted which does not comply with these terms.
*Correspondence: Dengao Li, bGlkZW5nYW9AdHl1dC5lZHUuY24=
Disclaimer: All claims expressed in this article are solely those of the authors and do not necessarily represent those of their affiliated organizations, or those of the publisher, the editors and the reviewers. Any product that may be evaluated in this article or claim that may be made by its manufacturer is not guaranteed or endorsed by the publisher.
Research integrity at Frontiers
Learn more about the work of our research integrity team to safeguard the quality of each article we publish.