 Xiongwei Huang
 Congtian Lin
 Liqiang Ji2*
 Gang Feng
95% of researchers rate our articles as excellent or good
Learn more about the work of our research integrity team to safeguard the quality of each article we publish.
Find out more
ORIGINAL RESEARCH article
Front. Ecol. Evol. , 06 March 2023
Sec. Biogeography and Macroecology
Volume 11 - 2023 | https://doi.org/10.3389/fevo.2023.1121422
Introduction: Species inventories based on various data sources have been widely used in biodiversity research, conservation policy formulation, reserve designation and biodiversity resource management. In this paper, we explored the relationships of species inventories obtained from different sources and whether they would affect the inference of biodiversity patterns and their environmental drivers.
Methods: We compiled the species inventories from different data sources (observational data including large amounts of citizen-based observational records and digitalized specimens, and avifauna data extracted from avifaunas which mainly integrated professional-based species surveys, expert knowledge and documentary records) at the prefectural level in China. Then we explored the relationships of different inventories and compared the correlations between the taxonomic, phylogenetic, functional diversity calculated from different datasets and the environmental factors.
Results and Discussion: The results showed that the avifauna datasets contributed more additional species to the combined species inventories when the species richness was relatively low and vice versa. Species inventories integrated from two different data sources formed complementary relationship rather than nested or totally different relationships. In addition, the species inventories based on observational data had no obvious disadvantage or were even better at inferring the biodiversity patterns than those based on avifauna data. The stepwise multiple regression analyses showed that the best models were the ones using the species inventories combined by observational and avifauna dataset, and the best models built with different datasets included inconsistent environmental variables. Thus, the species inventories from different data sources will indeed affect the inference of the correlations between taxonomic diversity, phylogenetic diversity, functional diversity and environmental factors. Moreover, although it may be more reliable to use a combined species inventory to analyze the relationship between diversity indices and environmental factors, individualized improvement schemes should be proposed for different data sources to fill the data gaps.
Fully understanding the biodiversity patterns and drivers at different scales is of persistent research interest in macroecology and biogeography (Soroye et al., 2018). Therefore, obtaining a reliable species inventory within the concerned group and geographical scope, locally to globally, is key to get credible results and correct answers to the field questions (Qian et al., 2018). An incomplete species inventory, whether at a broad- or local-scale, poses a barrier to further applications (Vale et al., 2018). First, the incomplete species inventory will affect the correct inference of the biogeographical patterns and their drivers, or the conclusions may even be contrary to reality (Qian et al., 2018). Second, because of the different rarity of each species within a certain range, it is more likely that the rare or endemic species, which should be given higher priority for protection, will not be included in the species inventory. The “pseudoabsence” of these species will affect conservation policies (Vale et al., 2018). In addition, the incomplete species inventories between different temporal periods make it difficult to infer changes in the biodiversity patterns (Boakes et al., 2010).
Regardless of the completeness, a species inventory is usually obtained from sampling survey reports, comprehensive species atlases, and scientific literature, depending on the target group and the scope of the study. However, species inventories compiled by these methods tend to underestimate or overestimate species richness within a certain range (McPherson and Jetz, 2007; Rotenberry and Balasubramaniam, 2020). In addition, it is sometimes difficult to obtain these raw data (Davis et al., 2014). Two other methods are relatively suitable for extracting local-range species inventories for larger-scale biodiversity studies. The first data source is fauna and flora compiled for a specific area, which integrate species surveys, expert knowledge, and documentary records. These fauna and flora retain basic information for native species, and they have been used for many biodiversity studies (Feng et al., 2020; Wang et al., 2020; Yang et al., 2021). The other data source is observational data (digital accessible knowledge, Sousa-Baena et al., 2014), including citizen-based observational records and digitized specimens, which have been developing in recent years and gradually used by scholars, conservation stakeholders, and policy makers more frequently (Hu et al., 2017, 2020; Shipley et al., 2018; Long et al., 2019). Although many studies have shown that there are sampling biases in various dimensions, these kinds of data are generated in real time and in huge quantities (Peterson et al., 2018), and have been widely recognized as data sources for biological conservation (Young et al., 2019).
Studies over the past 2 decades have explored the biodiversity patterns and their drivers at the global-to-regional scales by consolidating one or several data types mentioned above (Ding et al., 2006; Jetz et al., 2012; Wang et al., 2020). However, confirming the reliability of these studies is a very difficult but interesting problem. The most commonly method used to obtain relatively reliable results is integrating species inventories from as many data sources as possible (Qian et al., 2018). To the best of our knowledge, little work has been devoted to comparing the results analyzed from different sources (but see Qian et al., 2018). No studies have assessed whether the species inventories compiled from different sources result in different associations between taxonomic, phylogenetic, functional diversity, and environmental variables.
With a vast territory and high environmental diversity, China is one of the countries with the most biodiversity in the world (Fan et al., 2020; Mi et al., 2021). At present, 1,445 bird species and over 33,000 vascular plant species have been identified in China (Feng et al., 2016; The Biodiversity Committee of Chinese Academy of Sciences, 2020; Mi et al., 2021). Over the decades of field surveys and continuous expert studies, numerous faunas and floras at national, regional, provincial, and municipal scales have been published, which can provide detailed classical fauna-based (or flora) species inventories. In addition, biodiversity informatics is booming in China, and a large amount of publicly accessible observational data being generated. For instance, the National Species Information Infrastructure (NSII, http://www.nsii.org.cn) is the main source of digitalized specimen data in China at present (Huang et al., 2020). In recent years, citizen science has become popular in China, and many citizen science projects are continuously producing data, which has been used in many biodiversity studies (Dong et al., 2020; Duan et al., 2020). Although studies have indicated that such observation-based data in China have large gaps in various dimensions (Yang et al., 2013; Huang et al., 2020), China is an excellent geographical unit for exploring whether there are differences in the diversity–environment relationships between species inventories compiled from different sources.
This study will take Chinese breeding birds as an example and ask the following questions by integrating species inventories from avifauna and observational data: (1) What are the relationships (complementary, nested, or totally different) between the species inventories compiled from different data sources? (2) Will the species inventories derived from different data sources affect the inference of diversity (taxonomic, phylogenetic, and functional diversity)–environment relationships?
The avifauna dataset included bird checklist data for 214 prefecture-level cities in mainland China, which were compiled from national, provincial and regional faunas, e.g., A Checklist on the Classification and Distribution of the Birds of China (Zheng, 2017), Studies on Birds and Their Ecology in Northeast China (Gao, 2006), and The Avifauna of Yunnan China (Yang et al., 1995; Yang and Yang, 2004). This dataset included 1,130 breeding birds (1,290 species in total). Detailed descriptions of the distribution of these birds in prefecture-level cities could be extracted from these faunas. All bird distribution information was based on the expertise of many professional ornithologists and a large number of field surveys. Thus, the avifauna dataset was relatively reliable, structured, comprehensive but often had publication lags.
Because there were not applicable provincial avifauna records in Henan, Hebei, Hubei, Jiangsu, Anhui, Jiangxi, and Fujian, the cities in these provinces were not included in our analyses. The distribution of birds on islands may be influenced by factors different from those on the mainland (Baiser et al., 2018), so cities in Hainan, Taiwan, Hong Kong, and Macao were also excluded from our analyses. However, the distribution data in this dataset still included information for 90% of the domestic avifauna in China (Appendix S1).
The observational dataset included the bird checklist data compiled from observational data, including digitalized specimen and bird-watching data, i.e., bird occurrence data. The data were obtained from three main sources, which represent the digital accessible knowledge of birds in China: (1) the Global Biodiversity Information Facility (GBIF, https://www.gbif.org, GBIF, 2018), with the majority of these records coming from eBird and specimen; (2) the BirdReport,1 and (3) three sub-platforms of the National Specimen Information Infrastructure (NSII, http://www.nsii.org.cn; Huang et al., 2020). The bird checklist data for each data source were also compiled for further analyses. The observational dataset had the features of big data, and was relatively real-time, semi-structured, but error prone. We also integrated the avifauna dataset and observational dataset to form integrated bird checklist data for further analyses.
Angiosperm plant species richness in each prefecture-level city was used as an environmental variable for further analysis and compiled from the China Vascular Plant Distribution Database. This database integrated the plant distribution information from national, provincial, and regional floras, as well as some sampling information from herbarium specimens (Lu et al., 2018).
The inventory data from different data sources and publications at different periods may use different nomenclature systems. Therefore, in this study, the Catalog of Life China: 2020 Annual Checklist (The Biodiversity Committee of Chinese Academy of Sciences, 2020) was used to unify the avian naming systems. Species with matched accepted scientific names were retained for further analyses.
To make the results of the datasets comparable, only cities and species with data were retained for further analyses. For example, Siping city only had data in the avifauna dataset but not in the observational dataset, so this city was excluded; additionally, the species Arborophila ardens and Hirundo tahitica only appeared in the observational dataset but not in the avifauna dataset, and Heterophasia auricularis was only appeared in the avifauna dataset, so these species were excluded. Finally, the data for analyses included 1,088 breeding birds in 212 prefectural cities (Appendix S2).
A phylogenetic tree including 1,088 breeding birds covered by our study was extracted from a global phylogeny of birds2 under the option of “Hackett All Species: a set of 10,000 trees with 9,993 OTUs each” (Jetz et al., 2014). We sampled 5,000 trees from the pseudo-posterior distribution and calculated a maximum clade credibility tree using mean node heights in the software TreeAnnotator (version 1.8.2) of the BEAST 2 package (Bouckaert et al., 2014).
To analyze the functional diversity, four key ecological traits of 1,088 bird species, i.e., body size, trophic niche (omnivores, granivores, frugivores, nectarivores, insectivores, piscivores, and carnivores), migrant status (resident, partial migrant, and full migrant), and habitat specificity (Wang et al., 2018), were selected to construct a functional dendrogram. The dendrogram were built using Gower’s distance and “complete” cluster in the “vegan” R package (Oksanen et al., 2015).
Previous studies indicated that both paleoclimate and contemporary climate would affect the current avian biodiversity pattern (Hawkins et al., 2003; Currie et al., 2004; Qu et al., 2015; Svenning et al., 2015). Therefore, contemporary climate variables, i.e., mean annual temperature (MAT) and mean annual precipitation (MAP), were downloaded from the WorldClim database (Hijmans et al., 2005). The climate variables in the last glacial maximum (LGM), i.e., MAT in LGM and MAP in LGM, were the mean values of the Model for Interdisciplinary Research on Climate version 3.2 (MIROC3.2; Hasumi and Emori, 2004) and the Community Climate System Model version 3 (CCSM3; Hijmans et al., 2005; Otto-Bliesner et al., 2006). Anomaly in the MAT and anomaly in the MAP were calculated as the contemporary MAT/MAP minus the MAT/MAP in LGM, which were used to represent climate change (Sandel et al., 2011).
Altitudinal data were compiled from the EarthEnv-DEM90 digital elevation model3 (Robinson et al., 2014), and the altitudinal range in each prefecture city was calculated as the difference between the maximum and minimum values and extracted in ArcGIS 10.2 (ESRI, Redlands, California, United States).
The resolution of climate variables and elevation data was 2.5 arc-min, and the mean values of all cells in each prefectural city were used for the analyses. All data were extracted and calculated for subsequent analyses in ArcGIS 10.2.
The standardized effect size of phylogenetic or functional diversity were represented using standardized Faith’s PD (SES.pd; Procheş et al., 2006), which is computed as follows:
where PDobs is the observed phylogenetic diversity of birds in a city, mean(PDrnd) is the mean PD of the null models (Procheş et al., 2006), and sd(PDrnd) is the standard deviation of PD of the null models. A positive SES.pd means a higher proportion of long branches in a city than expected, i.e., species/lineages are relatively old, while a negative SES.pd means a higher proportion of short branches, i.e., species/lineages are relatively young.
Likewise, a positive functional SES.pd means the bird community in each city is more similar than expected, that is, similar in functional characteristics or functionally clustered; a negative functional SES.pd means the functional characteristics are divergent or functionally scattered.
To quantify the difference between the species inventories retrieved from the two data sources, according to the definition of the Jaccard Index (Legendre and Legendre, 2012), the species Jaccard Index (SJI) between the two species inventories in each city was defined as follows:
where Sshd is the number of species shared between two datasets, Sobs is the number of species unique to the observational dataset, and Sfau is the number of species unique to the avifauna dataset. The phylogenetic Jaccard Index (PJI) was defined as follows:
where Pshd is the Faith’s PD of species shared between two datasets, and Pint is the phylogenetic diversity of species in the integrated dataset.
The functional Jaccard index (FJI) was defined as follows:
where Fshd is the functional Faith’s PD (calculated as Faith’s PD but used the functional dendrogram) of species shared between two datasets, and Fint is the functional diversity of species in the integrated dataset.
Ordinary least squares (OLS) models were used to evaluate the relationships between species richness and the three Jaccard indices. Then OLS models were also used to assess the correlations between the taxonomic, phylogenetic, functional diversity of the avifauna dataset, observational dataset, combined dataset, each observational dataset (i.e., GBIF, BirdReport, and NSII), and each environmental variable. In addition, spatial simultaneous autoregressive models (SARs) were used for regressive analyses to control the spatial autocorrelation of residuals. These analyzes were performed using the function “errorsarlm” in the “spdep” package implemented in R (R Development Core Team, 2019). In addition, stepwise multiple regression analyses (SMR) with model simplification procedures based on Akaike information criterion (AIC) were also used to show if the environmental drivers of diversity patterns (taxonomic, phylogenetic, or functional diversity) change with the type of inventory used, and which inventory (avifauna, observational, or a combination of both) better explains the patterns of variation in diversity.
To make the correlation coefficients comparable, all other variables except for the three Jaccard indices were standardized (standard deviation = 1, mean = 0). All the above calculations and statistical analyses were performed in R v3.6.1 (R Development Core Team, 2019).
There were 43 cities with a SJI of 0–0.24, 90 cities with a SJI of 0.25–0.49, 73 cities with a SJI of 0.50–0.74, and only six cities with a SJI of 0.75–0.84. The results of the OLS model showed that the species Jaccard Index, phylogenetic Jaccard Index, and functional Jaccard Index were significantly positively correlated with species richness (SJI: R2 = 0.3363, p < 0.0001, Figure 1A; PJI: R2 = 0.3398, p < 0.0001, Figure 1B; FJI: R2 = 0.4220, p < 0.0001, Figure 1C); that is, cities with higher species richness had higher resemblance of type of inventories in terms of the species richness, phylogenetic, and functional diversity they render.
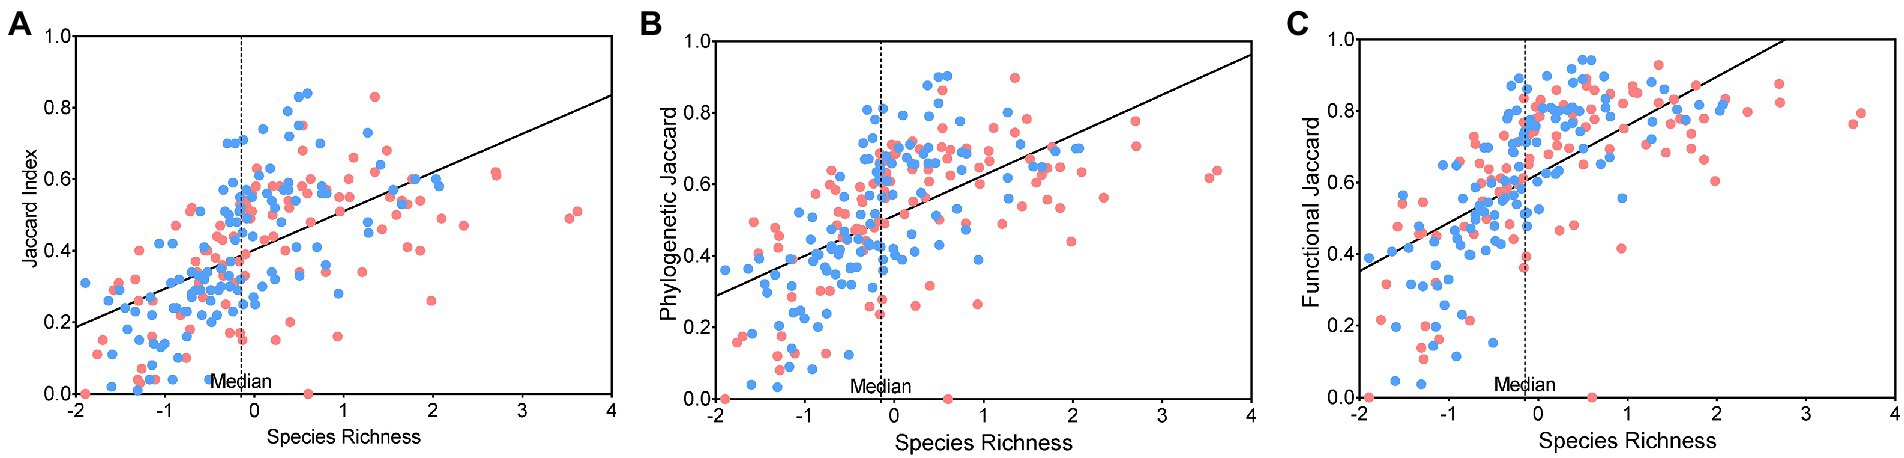
Figure 1. Scatter plots and ordinary least squares (OLS) model fitting line of relationships between the (A) species Jaccard index, (B) phylogenetic Jaccard index, and (C) functional Jaccard index and bird species richness in the species inventories compiled from combined datasets. The color of the points indicates the relative size of the number of species contributed by the “observational dataset” and “avifauna dataset” without the shared species. Specifically, a city with a red point indicates that the number of additional species contributed by the observational dataset is greater than that of the avifauna dataset and vice versa.
Taking the median species richness as the boundary, the species Jaccard Indices were below the regression line in 66 of the 106 cities with relatively low species richness (on the left of the median), namely, the similarity between the species inventories of the observational dataset and the avifauna dataset was lower than expected. Moreover, the avifauna dataset contributed more additional species in 65 of the 106 cities. However, the species Jaccard Indices were above the regression line in 62 of the 106 cities with relatively high species richness (on the right of the median), and the observational dataset contributed more additional species in 59 of the 106 cities (Figure 1A). In summary, cities with relatively low avian species richness were inclined to be under-sampled, and avifauna provided more bird information in these cities, and vice versa. The results were similar in the relationships among the phylogenetic Jaccard Index, functional Jaccard Index, and species richness (Figures 1B,C).
The OLS model and the SAR model showed similar results; that is, the results from the three datasets all showed that the two environmental factors most associated with bird species richness were plant richness and altitudinal range (Table 1; Figures 2A,D). More importantly, the associations based on the “avifauna dataset” were consistently weaker than the associations based on the “observational dataset” and the “combined dataset” (Figure 2A). Specifically, the R2s calculated from the “avifauna dataset” were smaller than those of the “observational dataset” and “combined dataset,” while the AICs using the “avifauna dataset” were larger than the other two datasets (Table 1; Figures 2A,D). In general, using R2 to comparing the performance of results analyzed by different datasets, the “observational dataset” was the best (except for the associations with plant species richness), followed by “combined dataset,” and the “avifauna dataset” was the worst.
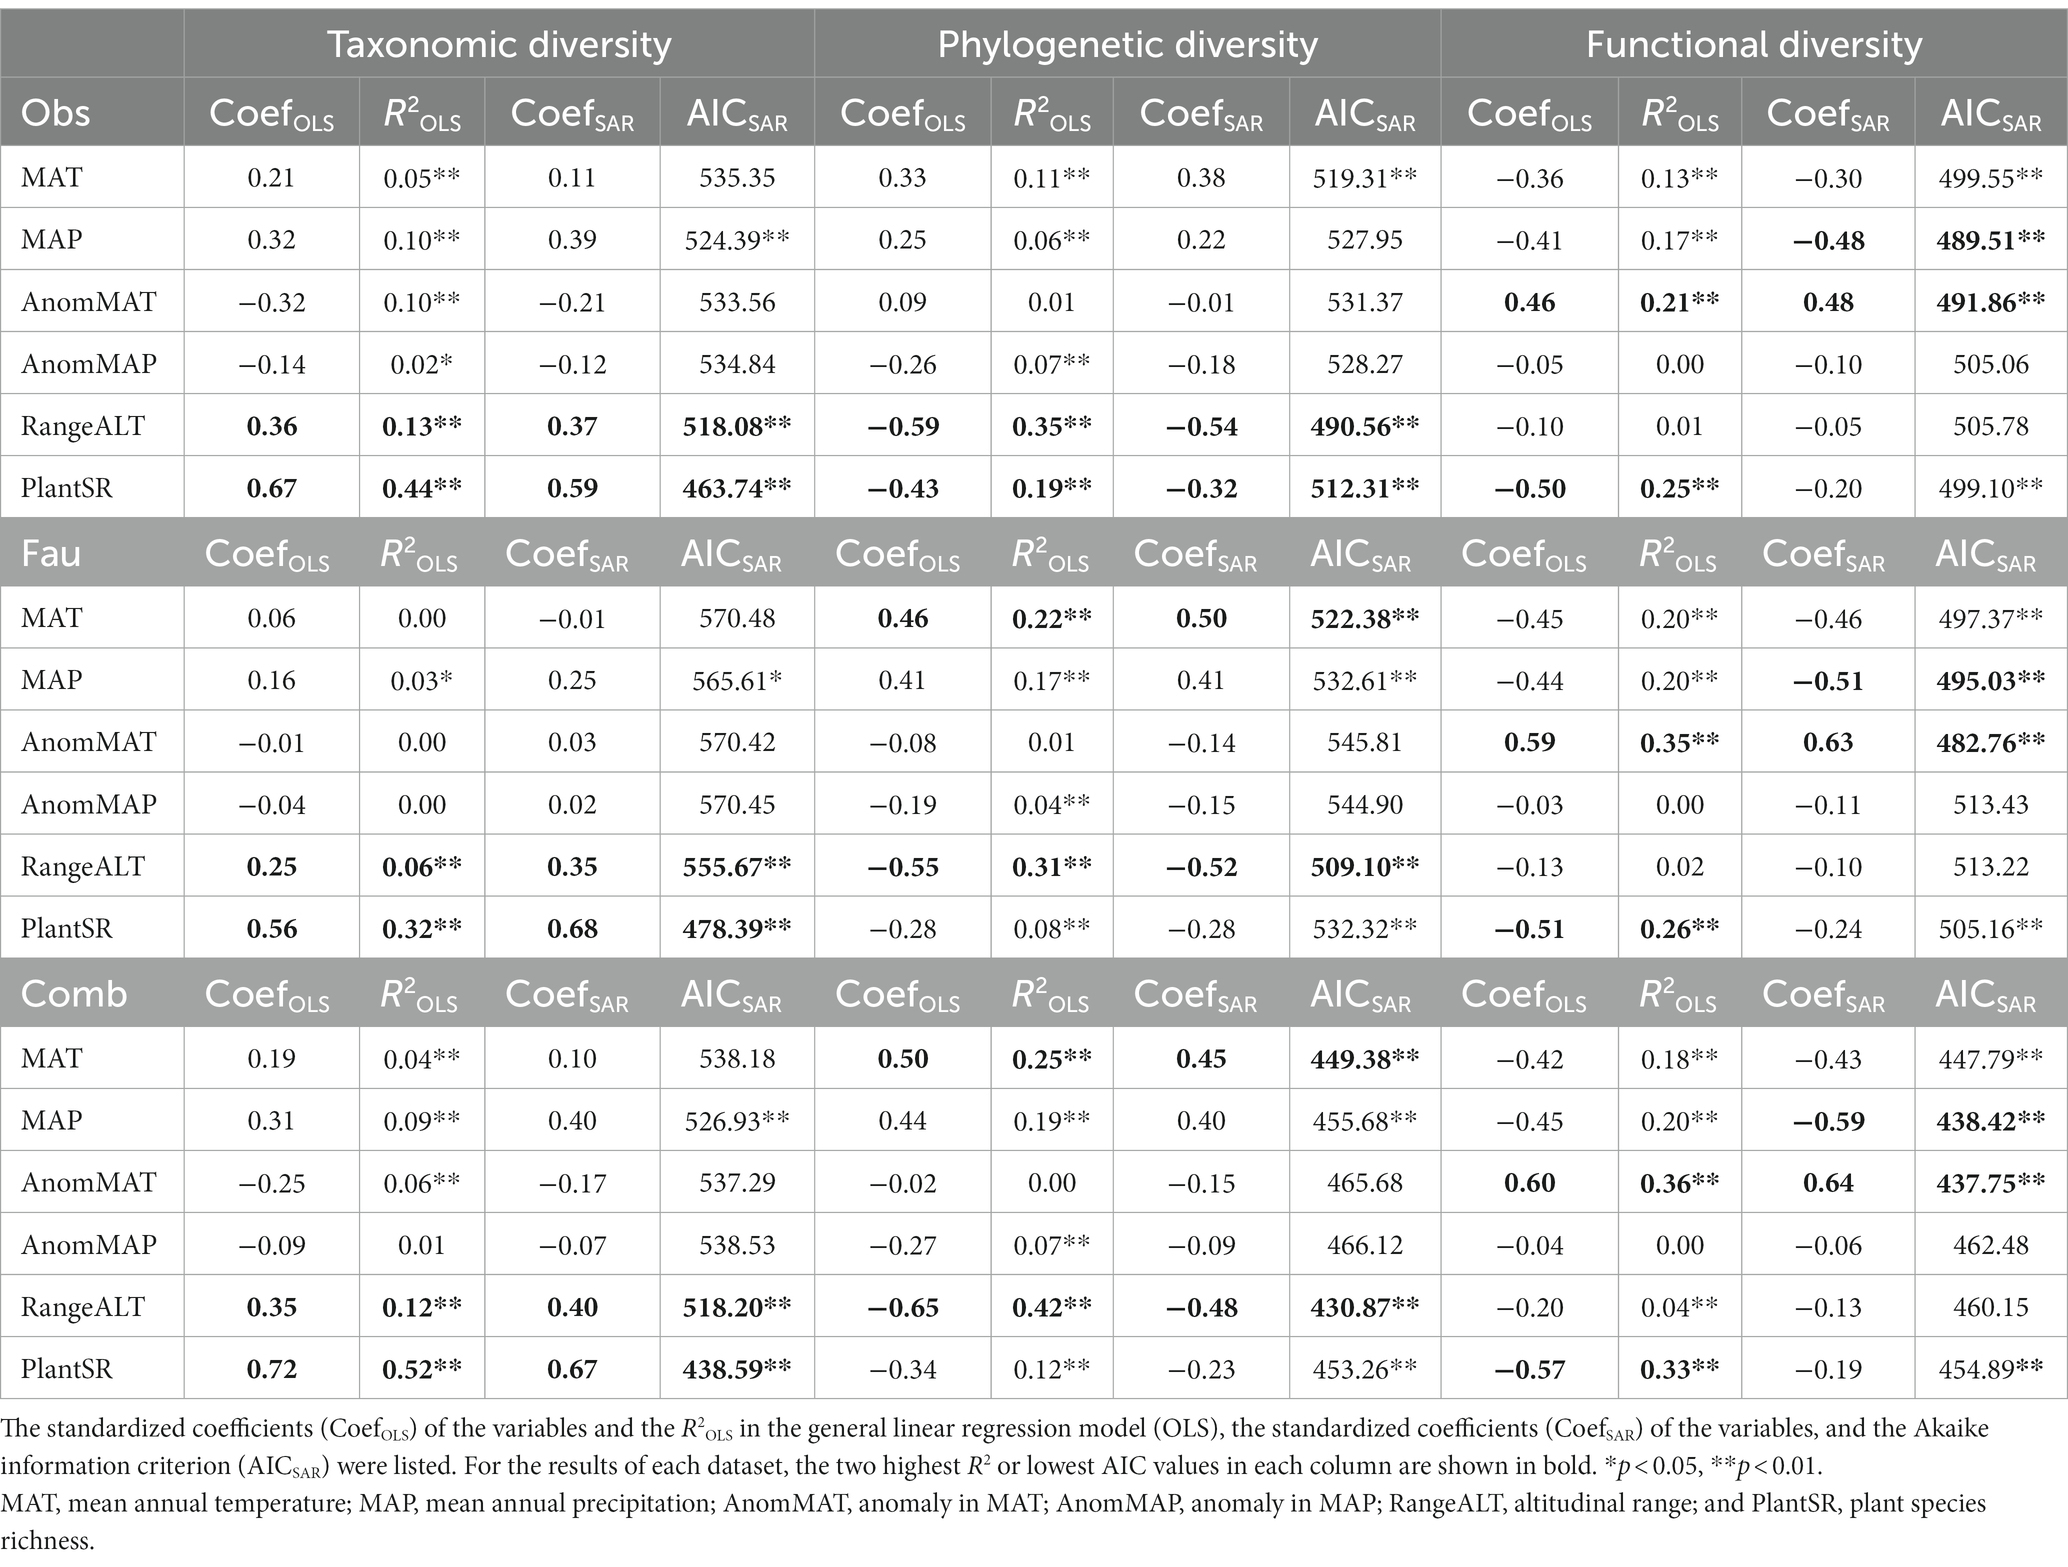
Table 1. Correlation coefficients between the diversity indices and environmental factors in observational (Obs), avifauna (Fau), and combined datasets (Comb).
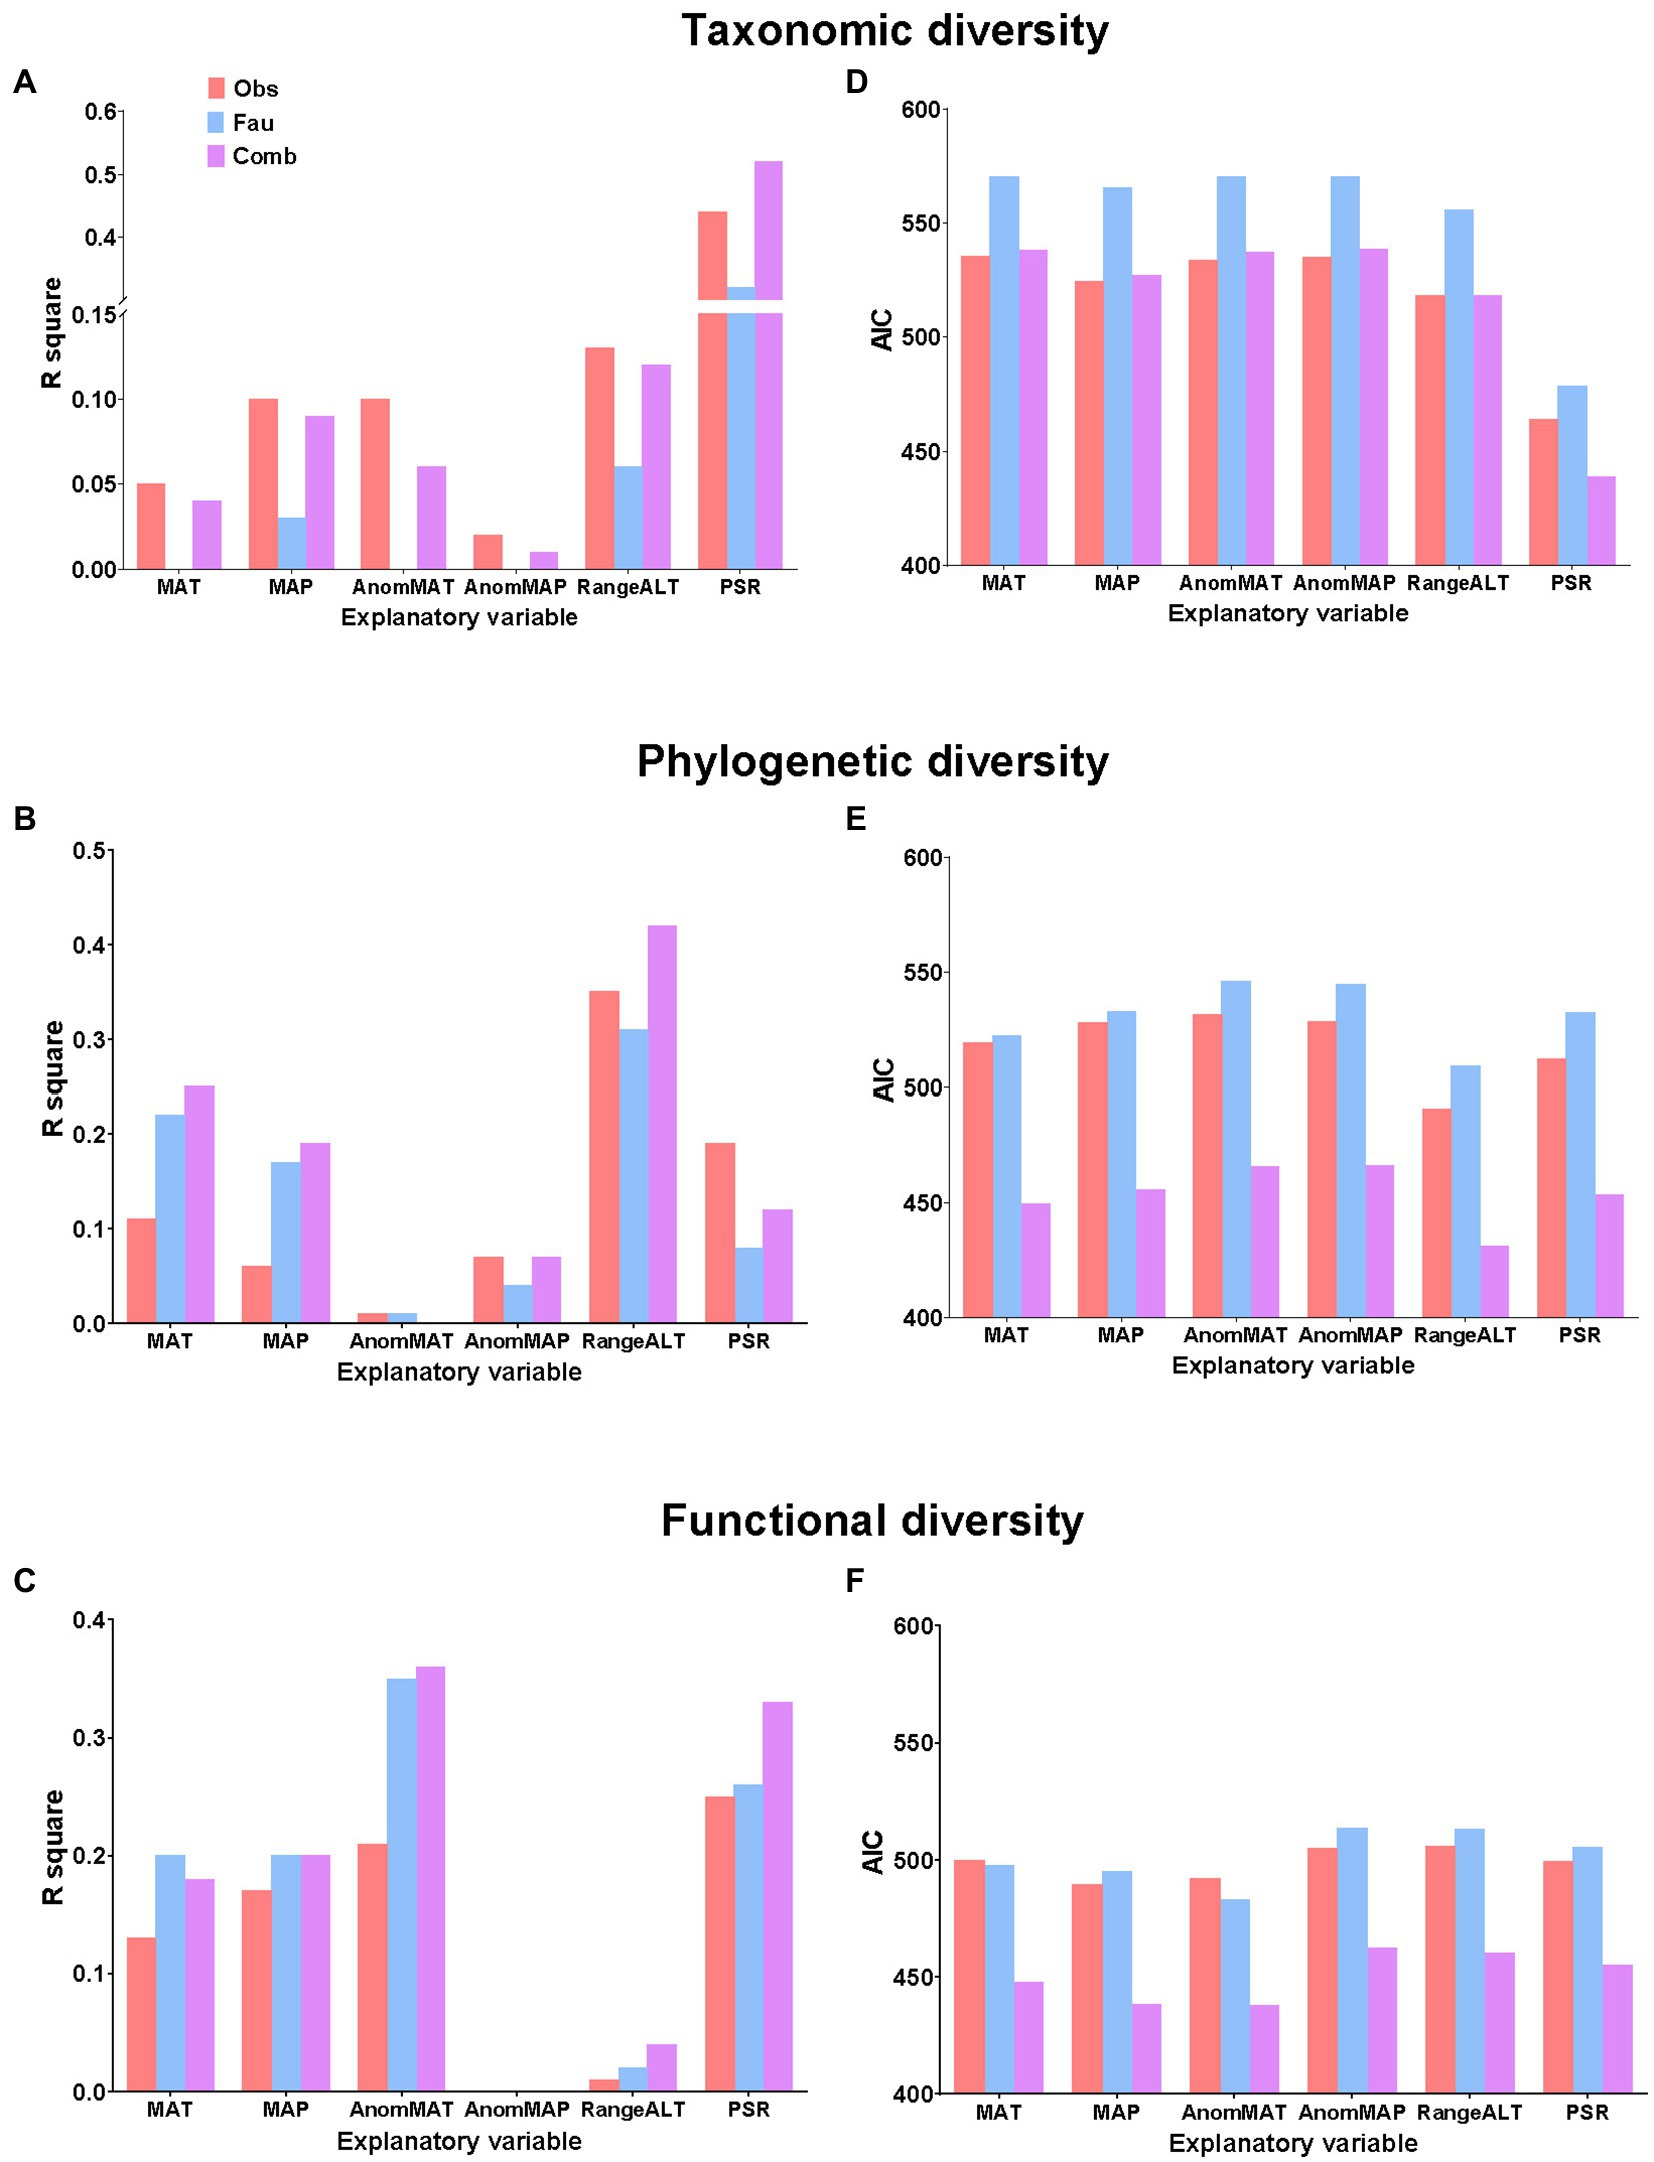
Figure 2. Relationship between each diversity index and environmental factor in observational (Obs), avifauna (Fau), and combined datasets (Comb), comparing (A–C) the R2s in the OLS models and (D–F) Akaike information criterions (AICs) in the spatial simultaneous autoregressive (SAR) models of taxonomic diversity, phylogenetic diversity, and functional diversity.
The OLS model and the SAR model again showed similar results (Table 1; Figures 2B,E). Altitudinal range was consistently the variable most associated with phylogenetic diversity across the three datasets. The second most associated variable for phylogenetic diversity in the “avifauna dataset” and “combined dataset” was MAT, while it was plant richness in the “observational dataset” (Table 1; Figure 2B,E).
More importantly, although the results showed that SES.pd had a significant negative correlation with the altitudinal range in all three datasets, the correlation was strongest in the “combined dataset,” followed by “observational dataset” and “avifauna dataset;” (Table 1; Figures 2B,E). In general, for the associations with phylogenetic diversity, the “combined dataset” had the best performance, followed by the “observational dataset” and the “avifauna dataset.”
The OLS model showed that in the three datasets, the two environmental factors most associated with functional diversity were anomaly in MAT and plant richness, while in the SAR model, they were the anomaly in MAT and contemporary MAP (Table 1; Figures 2C,F).
However, in the OLS model, comparing the strength of the relationships between the functional diversity and the two most relevant environmental factors, the correlations in the “combined dataset” was the highest, followed by the “avifauna dataset” and the “observational dataset” (Table 1; Figure 2C). In the SAR model, for the relationships between the functional diversity and the anomaly in MAT, the AIC calculated by the “observational dataset” was larger than that of the “avifauna dataset;” for the relationship between the functional SES.pd and the MAP, the AIC calculated by the “observational dataset” was smaller than that of the “avifauna dataset” (Table 1; Figure 2F). In general, for the associations with functional diversity, again the “combined dataset” had the best performance, followed by the “avifauna dataset” and the “observational dataset.”
The SMR analyses about the relationships between all the three diversity indices and environmental factors showed that best models established were the ones using the “combined dataset,” followed by the “observational dataset,” and the “avifauna dataset” (Table 2). Specifically, the adjusted R2s of models based on “combined dataset” were larger and AICs were lower than those based on the “observational dataset” and the “avifauna dataset” (Table 2). In addition, the final environmental factors included in the best models obtained from these data sources were same for phylogenetic diversity, but different for taxonomic and functional diversity (Table 2).
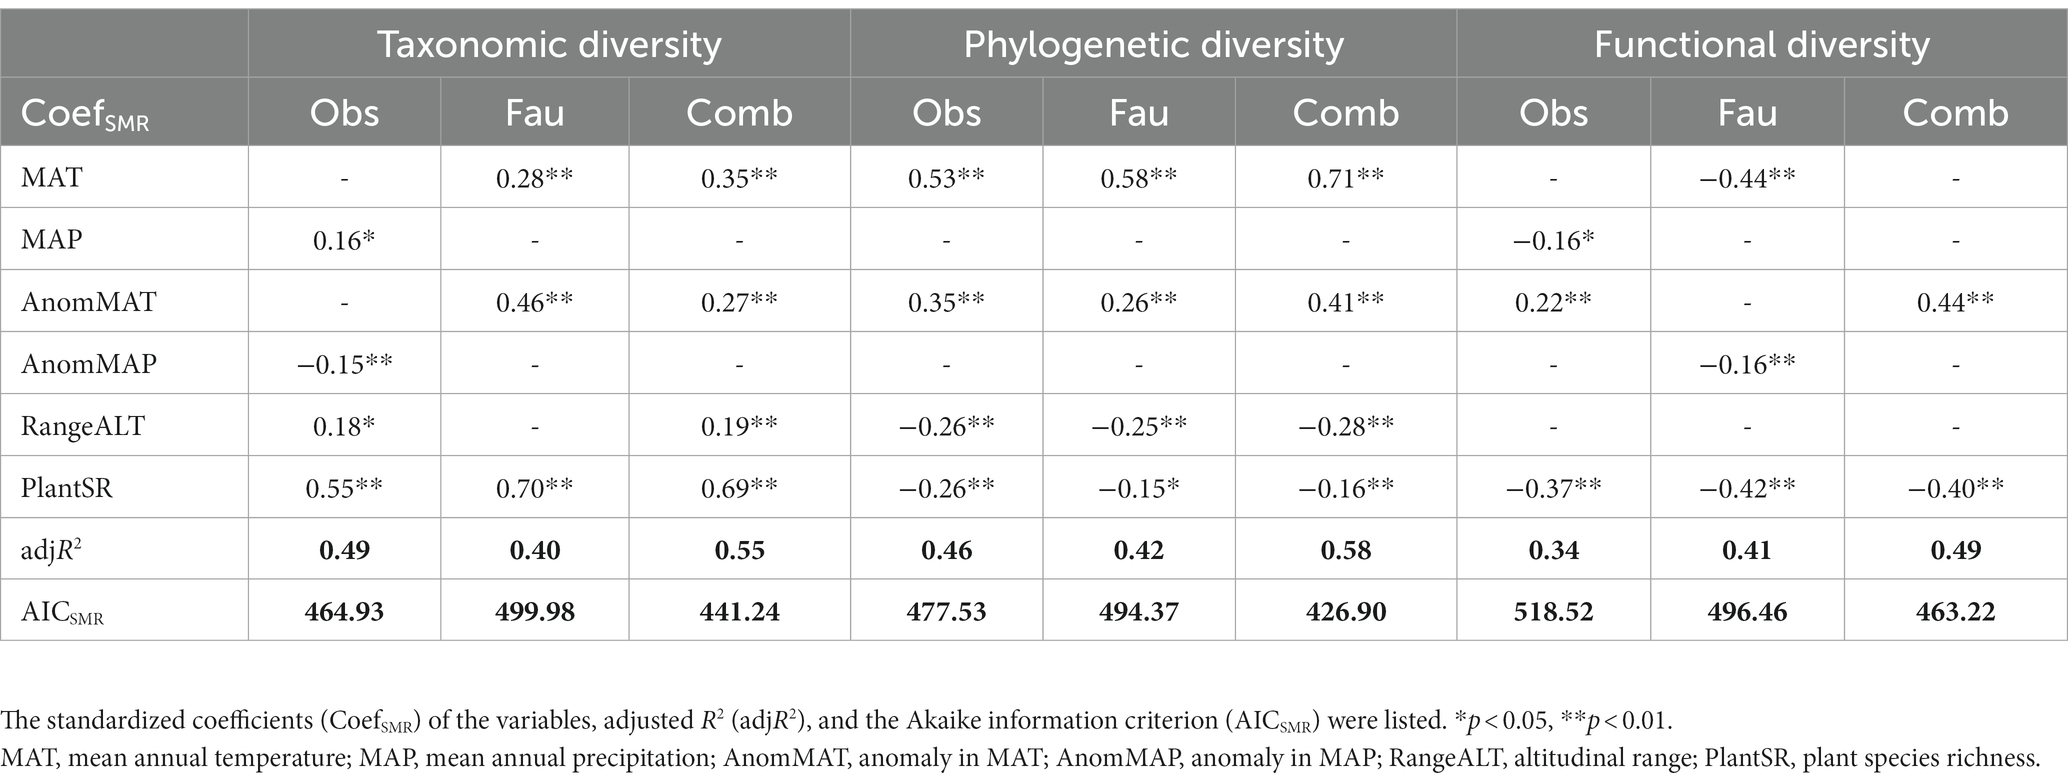
Table 2. Stepwise multiple regression analysis (SMR) results between the diversity indices and environmental factors in observational (Obs), avifauna (Fau), and combined datasets (Comb).
In terms of the consistency of the correlations, the relationships between the phylogenetic diversity and the environmental factors in each dataset branch was basically the same as that in the “combined observational dataset;” that is, the two most relevant factors were the altitudinal range and plant richness, both of which were significantly negatively correlated (Table 3). The strongest relationship was shown in the BirdReport dataset, with GBIF in the middle and NSII being the worst (Table 3).
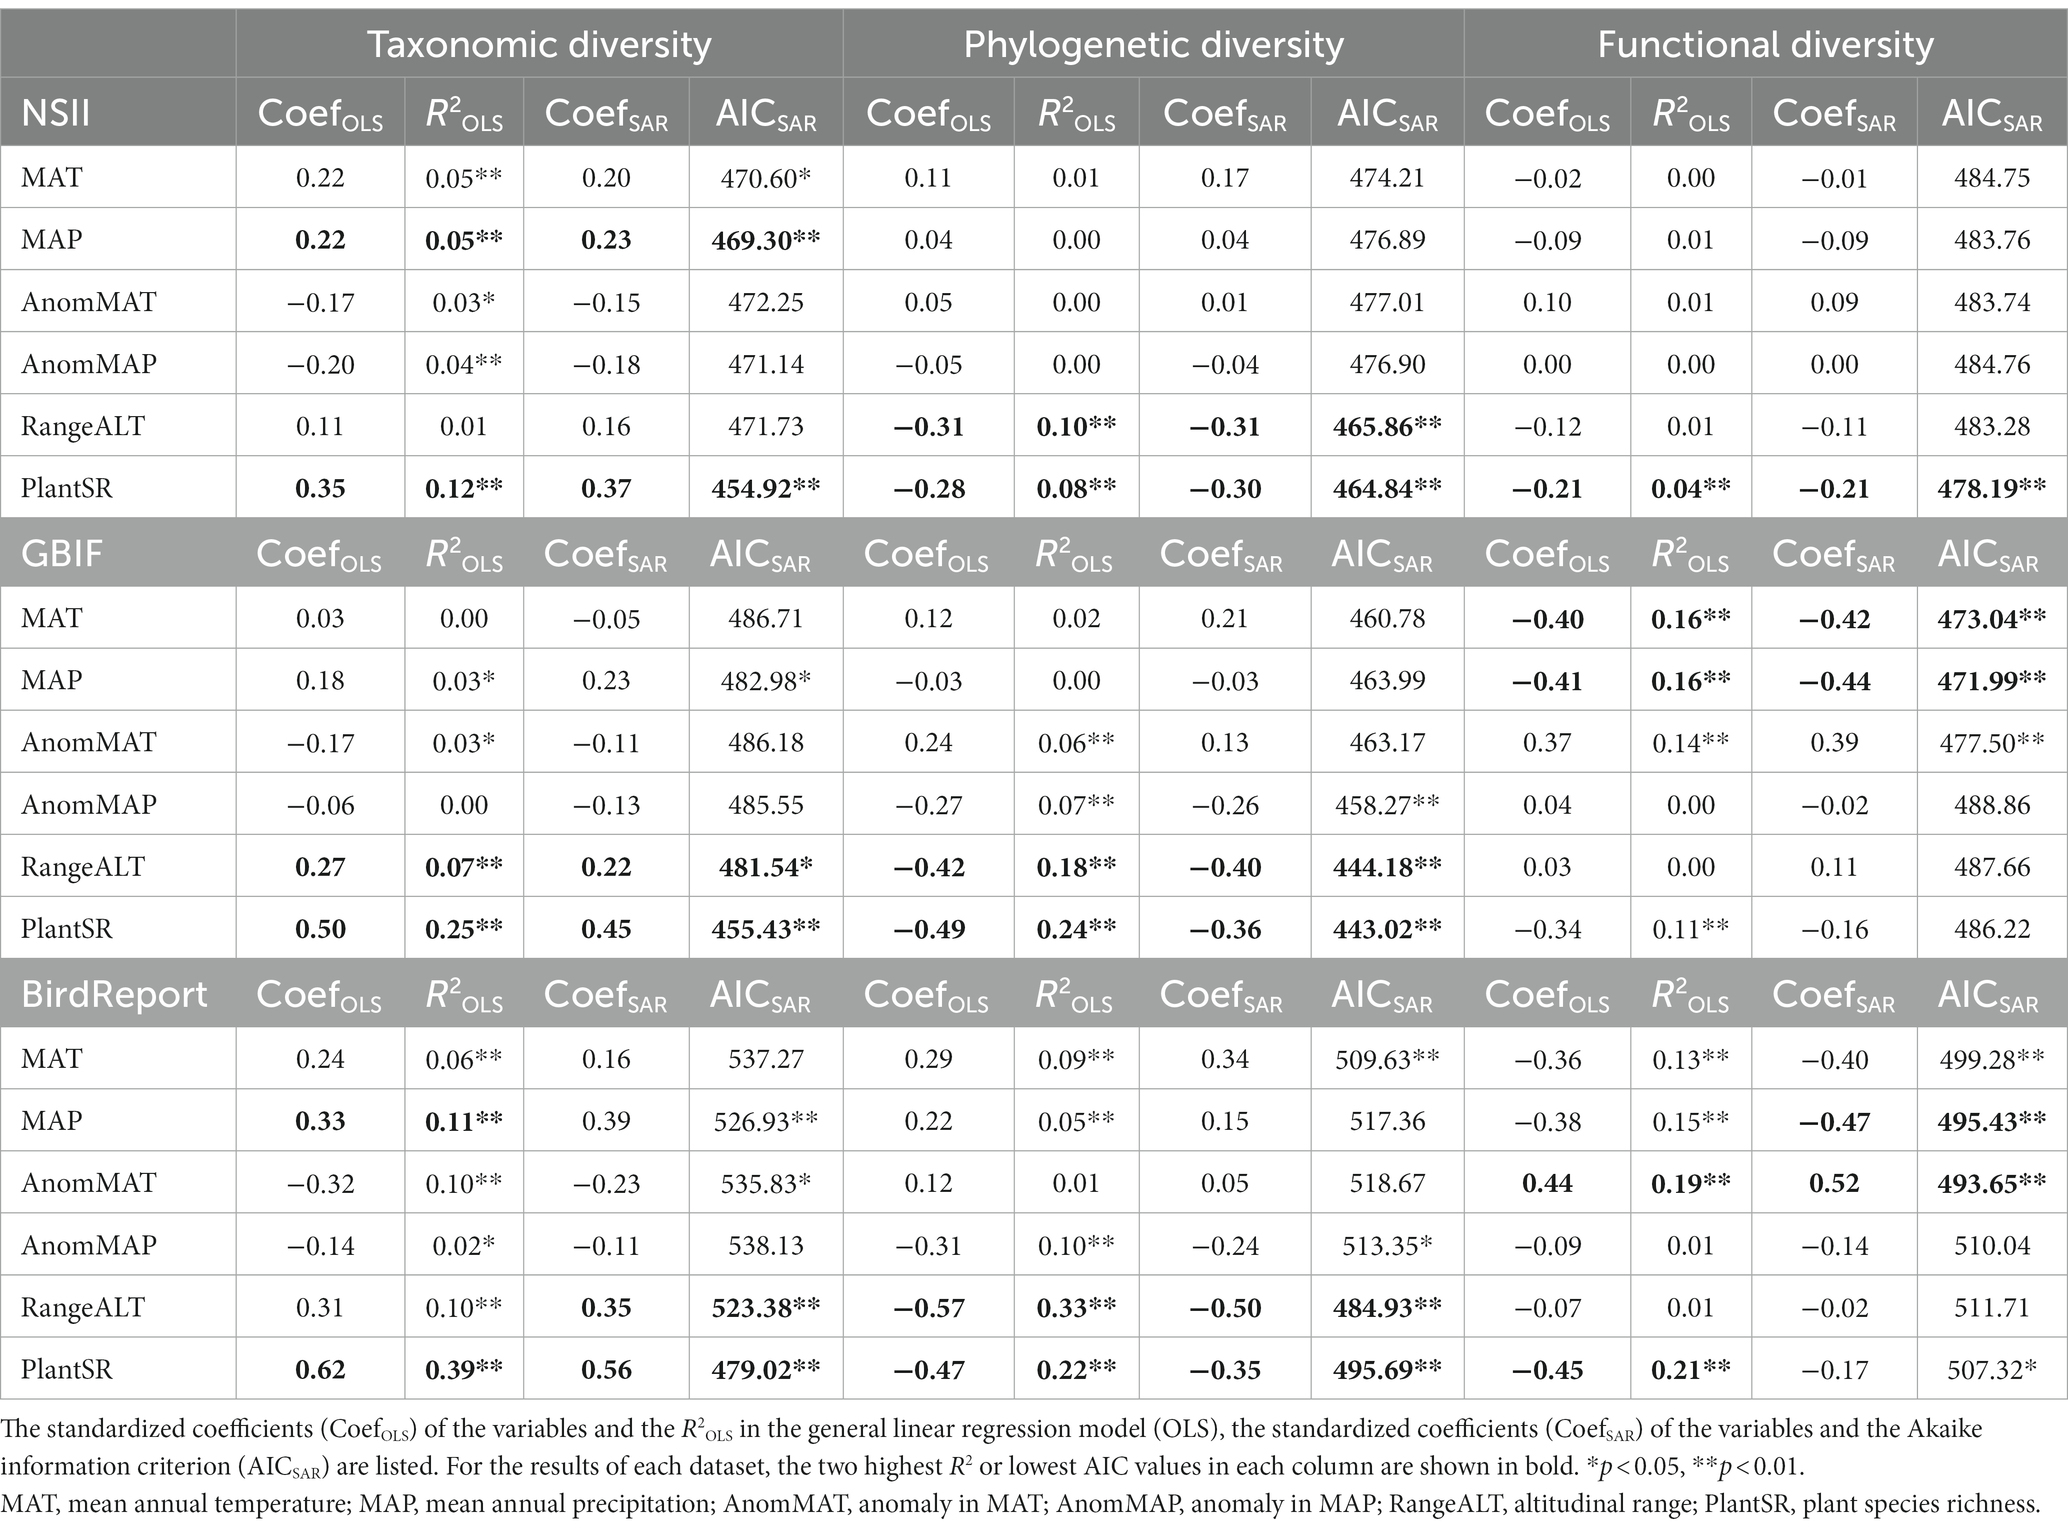
Table 3. Correlation coefficients between the diversity indices and environmental factors in each dataset in the observational dataset.
In addition, the correlations between species richness and functional diversity and each environmental factor was the worst in the NSII dataset among the three dataset branches; that is, the relationship between the diversity indices and environmental factors tended to be random, and there was no significant correlation (Table 3). In general, the results analyzed using the BirdReport dataset were the most similar to the “observational dataset,” the GBIF was ranked the second, and the NSII was the worst (Table 3).
The results showed that there was a positive correlation between bird richness and the similarity between the species lists obtained from the two data sources. Importantly, when the species richness was low, the avifauna dataset contributed more additional species to the combined species inventory and vice versa. The results of simple regressions indicated that the two species inventories compiled from different datasets did not “shape” different patterns of diversity. However, correlation of diversity with environmental drivers was stronger in the species inventory based on observational data than in that based on avifauna data. Moreover, the SMR analysis showed that models built with different datasets were including inconsistent environmental variables. In addition, both results of simple and multiple regression analysis indicated that it may be more reliable to use a combined species inventory to analyze the relationships between diversity indices and environmental factors. The completeness of the species inventory will indeed affect the inference of the correlations between taxonomic diversity, phylogenetic diversity, functional diversity, and environmental factors.
The relatively low level of taxonomic similarities between observational and avifauna dataset in many cities indicated the complementarity of species inventories coming from different data sources, which is crucial for producing complete list of species at the local (and smaller) scale and biodiversity management at multiple scales. Notably, the species inventory based on the avifauna dataset does not fully include that based on the observational dataset, indicating that the bird species list of each city obtained from either data source may not be a truly representative list. But still studies have shown that bird diversity patterns are clearer than those in other animal groups, both in China and globally (Lepczyk et al., 2017). Because there are relatively complete species lists at the global, national and even provincial levels (e.g., IOC World Bird List). However, it is increasingly difficult for administrative levels below the provincial level to obtain a complete species list. Currently, only a few administrative regions below the county level and limited taxa (e.g., plants and birds) can be fully investigated (Qian et al., 2018). Therefore, although various problems have been reported in observational data (e.g., uneven distribution patterns and multidimensional biases, Huang et al., 2020), the observational data will be an important data source regarding species distribution information, as shown in this study. Future revisions to the avifauna may consider including information obtained from the observational data. This method should be practicable both in China and globally.
Many studies on different biological groups have attempted to compare the species distribution patterns shown from observational data sources with randomness (including digital specimens, observation records, etc.) and standardized data sources (such as atlas, actual surveys, and literature records; Soroye et al., 2018; Alhajeri and Fourcade, 2019; Rotenberry and Balasubramaniam, 2020; Zhou et al., 2020). However, few studies have compared the relationship between diversity indices (taxonomic, phylogenetic and functional diversity) and environmental factors based on different data sources at the same time. For the first time, this study comprehensively compared the relationships between the diversity patterns based on observational data and avifauna data and environmental factors to explore whether species inventories obtained from different data sources lead to inconsistency in the drivers of the biodiversity patterns. The results showed that although the correlation coefficients between diversity indices and environmental factors analyzed based on species inventories from different data sources were inconsistent, the correlation relationships were consistent. That is, the relationships between the diversity indices and environmental factors were both significantly positively (or negatively) correlated. It can also be concluded that a higher plant richness and a more stable climate will lead to a more diversified bird community with observational data, which has been confirmed by using the avifauna dataset (Qian, 2010; Wang et al., 2020). Moreover, the result showed that the multiple regression models built using the combined species inventories of observational and avifauna dataset had the best performance (with highest adjusted R2 and lowest AIC), which emphasized the necessity of integrating data from different sources, especially data collected by different methodologies, to conducted biodiversity researches and effectively management. Complete data will make the analysis results and conclusions more reliable and closer to reality.
With the digitization of specimens in museums around the world and the development of citizen science, massive species distribution data based on observation records are providing services for various users (Telenius, 2011). An increasing number of studies on macroecology and biogeography have obtained species lists based on observational data sources from data portals such as the GBIF (de Carvalho et al., 2020; Wüest et al., 2020). However, the results showed that, at least for birds within the scope of China’s prefectural level, the correlations between biodiversity indices and environmental factors were similar or even stronger using the species inventory based on the observational dataset than the avifauna dataset. Besides, the environmental drivers of taxonomic and functional diversity patterns changed with the type of inventories used, that is, species inventories compiled from observational and avifauna datasets “shaped” different biodiversity patterns. These results revealed that data from different sources may yield different results, leading to completely different conclusions. It requires data producers to pay more attention to the filling of biodiversity data gaps, and the data users should be cautious about the results from incomplete data and avoid drawing erroneous conclusions.
However, whether similar conclusions can be obtained for other taxa, geographic resolutions, or regions remains to be further studied. Especially for groups other than birds and plants where the number of open data sources is relatively small, it is imperative to generate more data through data mobilization or enhanced sampling efforts.
How environmental factors shape the biodiversity pattern in different geographic areas is one of the important issues in macroecology (Pärtel et al., 2016). Accurate and credible biodiversity distribution data and environmental data are the basis for answering this question. At the research scale of interest, obtaining a sufficiently accurate and reliable species list is still an arduous scientific task that needs to be continuously carried out. The results of this study showed that although the correlations among the three biodiversity indices and environmental variables were similar or sometimes stronger using species inventories compiled from observational datasets than those from avifauna datasets, there were obvious differences in the reanalysis using each data source in the observational dataset.
Specifically, the results based on the NSII data showed the lowest correlation coefficient and R2, which were obviously caused by insufficient specimen data. Currently, the NSII has collected more than 16 million digital specimen records, but the number of bird specimens obtained in this study was less than 120,000 with an obvious data bias. However, birds are currently the group of vertebrates with the largest volume of digital specimen data. Moreover, compared with bird watching records, digital specimen data are more recognized by users in terms of data quality, traceability, and credibility (Boakes et al., 2010). Nevertheless, based on the results of this study, if the specimen dataset is the only data source used for biodiversity research, it may be necessary for researchers to analyze and interpret the results more carefully. When it is confirmed that the data used for analysis and research are biased, even if the mathematical model or method used in the analysis is good, it will be difficult to obtain objective and accurate results (García-Roselló et al., 2015).
Unlike previous studies, this study did not define the criteria for whether a species inventory is “complete.” Various methods have been developed to infer whether the species list is complete, such as using species accumulation curves to estimate the number of species (Yang et al., 2013), comparing lists with the approved species inventories (Qian et al., 2018), or introducing geometry, algorithms, or model knowledge for inference (Feria-Arroyo and Peterson, 2002). However, more commonly, there is not enough evidence (data) to support a conclusion (Yang et al., 2013), and it is difficult to obtain an authoritative species inventory for comparison (Qian et al., 2018). In this study, the species inventory based on the avifauna dataset was considered to be near complete and was practically applied in the studies of biodiversity patterns (Feng et al., 2020; Wang et al., 2020; Yang et al., 2021). However, after comparison with the species inventory based on observational data, it was found that there was room for improvement in the species inventory based on the avifauna dataset. For instance, the species inventories based on avifauna data in Meishan city and Baiyin city had only two and four species, respectively, while the species inventories based on observational data showed that these two cities had at least 311 species and 30 species of breeding birds, respectively.
Integrating all available data in biodiversity research is a common way to ensure the credibility of the results (Guedes et al., 2018), but this method does not fundamentally solve existing data gaps. The work for filling the data gaps will eventually fall on the cell data source (i.e., the original source of the data), not on the data aggregators or portals (Wetzel et al., 2018). Through comparative analyses, this study learned about the differences and deficiencies in the results of analyzing diversity–environment relationships based on species inventories using different data sources. Therefore, targeted improvement plans can be proposed for filling the gaps of various data sources. For example, this study found that prefecture-level cities with relatively “low” species richness should pay more attention to species that have been recorded in avifauna. In the future, bird observations and surveys should focus on the species that have already been documented but have not been further confirmed by recent observations. It can even be further confirmed whether these species originally thought to be locally distributed have disappeared locally or just have not been discovered and recorded (Huang et al., 2020). The compilation of avifauna data usually needs to be based on a large amount of reliable documentary evidence, which means that even the most recent avifauna data often lag behind in terms of documenting the species distribution. Many studies have shown the superior performance of observational records in monitoring real-time changes in species distribution, such as changes in species distribution due to climate change or habitat loss caused by human activities (Hu et al., 2020). Although there are still doubts regarding the credibility and traceability of the observation records used for the compilation of the fauna records, it is advisable to collect the species distribution information that exists in the observational records but not in the original fauna records when updating the fauna list to confirm whether a specific species should be included in the new edition of the fauna.
Whether data quality will affect the results of the research is a question worth discussing and is related to the success or failure of hypothesis verification (Costello et al., 2013). This research did not focus on discussing how environmental factors affected the formation of biodiversity patterns. Instead, it tried to compare the results based on different data sources to think about how to apply existing data in the future, fill the data gaps, and improve data quality.
(1) Currently, open-access biodiversity data are continuously increasing, but independent verification of research results using open-access datasets is still rare. This study indicates that although the current observational data have problems such as data biases and lack of credibility, the observational data can be considered as an independent data source to verify the analyses of the biodiversity patterns (Gaul et al., 2020).
(2) This study suggests that the observational data has a certain degree of credibility, at least for compiling the Chinese city-level bird inventory. But it is still doubtful whether the data can maintain a good effect at scales below the city level. Therefore, the future collection of species distribution data should focus on the distribution of birds at scales below the city level, study the change trends of species distribution ranges, and strengthen the collection of species distribution data in the temporal dimension. For example, the distribution of species can be continuously monitored using infrared cameras and other continuous monitoring technologies (Stephenson, 2020).
(3) As an important supplement to species distribution data, the accuracy and credibility of observational data must be strengthened. Wildlife surveys and observations involving the public require more professional skills and knowledge support. Practical methods include the participation of taxonomic experts in species identification and the full use of existing species identification techniques and applications, which could provide reliable evidence for the compilation of animal monographs, biodiversity research, and decision making.
The original contributions presented in the study are included in the article/Supplementary material, further inquiries can be directed to the corresponding authors.
XH, CL, LJ, and GF designed the experiment and wrote the paper. XH and CL carried out the experiment. All authors contributed to the article and approved the submitted version.
This work was supported by grants from the 14th Five-year Network Security and Informatization Plan of Chinese Academy of Sciences (CAS-WX2021PY-0202), the Strategic Priority Research Program of the Chinese Academy of Sciences (XDA19050202), the National Key R&D Program of China (2019YFA0607103), the National Natural Science Foundation of China (41861004), and the Central Government Guides Local Science and Technology Development Fund Projects (2022ZY0224).
We sincerely appreciate the data support from open-access online data portals, including the Global Biodiversity Information Facility (GBIF), the BirdReport, and the National Specimen Information Infrastructure (NSII).
The authors declare that the research was conducted in the absence of any commercial or financial relationships that could be construed as a potential conflict of interest.
All claims expressed in this article are solely those of the authors and do not necessarily represent those of their affiliated organizations, or those of the publisher, the editors and the reviewers. Any product that may be evaluated in this article, or claim that may be made by its manufacturer, is not guaranteed or endorsed by the publisher.
The Supplementary material for this article can be found online at: https://www.frontiersin.org/articles/10.3389/fevo.2023.1121422/full#supplementary-material
Alhajeri, B. H., and Fourcade, Y. (2019). High correlation between species-level environmental data estimates extracted from IUCN expert range maps and from GBIF occurrence data. J. Biogeogr. 46, 1329–1341. doi: 10.1111/jbi.13619
Baiser, B., Valle, D., Zelazny, Z., and Burleigh, J. G. (2018). Non-random patterns of invasion and extinction reduce phylogenetic diversity in island bird assemblages. Ecography 41, 361–374. doi: 10.1111/ecog.02738
Boakes, E. H., McGowan, P. J. K., Fuller, R. A., Ding, C. Q., Clark, N. E., O’Connor, K., et al. (2010). Distorted views of biodiversity: spatial and temporal bias in species occurrence data. PLoS Biol. 8:e1000385. doi: 10.1371/journal.pbio.1000385
Bouckaert, R., Heled, J., Kühnert, D., Vaughan, T., Wu, C. H., Xie, D., et al. (2014). BEAST 2: a software platform for Bayesian evolutionary analysis. PLoS Comput. Biol. 10:e1003537. doi: 10.1371/journal.pcbi.1003537
Costello, M. J., Michener, W. K., Gahegan, M., Zhang, Z. Q., and Bourne, P. E. (2013). Biodiversity data should be published, cited, and peer reviewed. Trends Ecol. Evol. 28, 454–461. doi: 10.1016/j.tree.2013.05.002
Currie, D. J., Mittelbach, G. G., Cornell, H. V., Field, R., Guégan, J. F., Hawkins, B. A., et al. (2004). Predictions and tests of climate-based hypotheses of broad-scale variation in taxonomic richness. Ecol. Lett. 7, 1121–1134. doi: 10.1111/j.1461-0248.2004.00671.x
Davis, M. L. E. S., Tenopir, C., Allard, S., and Frame, M. T. (2014). Facilitating access to biodiversity information: a survey of users’ needs and practices. Environ. Manag. 53, 690–701. doi: 10.1007/s00267-014-0229-7
de Carvalho, D. L., Silva, S. M., Sousa-Neves, T., Silva, D. P., and Santos, M. P. D. (2020). An updated documented inventory and new records of bird species for the Brazilian state of Maranhão. Ornithol. Res. 28, 77–85. doi: 10.1007/s43388-020-00013-2
Ding, T. S., Yuan, H. W., Geng, S., Koh, C. N., and Lee, P. F. (2006). Macro-scale bird species richness patterns of the east Asian mainland and islands: energy, area and isolation. J. Biogeogr. 33, 683–693. doi: 10.1111/j.1365-2699.2006.01419.x
Dong, F., Hung, C. M., and Yang, X. J. (2020). Secondary contact after allopatric divergence explains avian speciation and high species diversity in the Himalayan-Hengduan Mountains. Mol. Phylogenet. Evol. 143:106671. doi: 10.1016/j.ympev.2019.106671
Duan, H., Xia, S., Yu, X., Liu, Y., Teng, J., and Dou, Y. (2020). Using citizen science data to inform the relative sensitivity of waterbirds to natural versus human-dominated landscapes in China. Ecol. Evol. 10, 7233–7241. doi: 10.1002/ece3.6449
Fan, P. F., Yang, L., Liu, Y., and Lee, T. M. (2020). Build up conservation research capacity in China for biodiversity governance. Nat. Ecol. Evol. 4, 1162–1167. doi: 10.1038/s41559-020-1253-z
Feria-Arroyo, T. P., and Peterson, A. T. (2002). Prediction of bird community composition based on point-occurrence data and inferential algorithms: a valuable tool in biodiversity assessments. Divers. Distrib. 8, 49–56. doi: 10.1046/j.1472-4642.2002.00127.x
Feng, G., Huang, X., Mao, L., Wang, N., Yang, X., and Wang, Y. (2020). More endemic birds occur in regions with stable climate, more plant species and high altitudinal range in China. Avian Res. 11:17. doi: 10.1186/s40657-020-00203-y
Feng, G., Mao, L., Sandel, B., Swenson, N. G., and Svenning, J. C. (2016). High plant endemism in China is partially linked to reduced glacial-interglacial climate change. J. Biogeogr. 43, 145–154. doi: 10.1111/jbi.12613
Gao, W. (2006). Studies on BBirds and Their Ecology in Northeast China. (Beijing, China: Science Press)
García-Roselló, E., Guisande, C., Manjarrés-Hernández, A., González-Dacosta, J., Heine, J., Pelayo-Villamil, P., et al. (2015). Can we derive macroecological patterns from primary global biodiversity information facility data? Glob. Ecol. Biogeogr. 24, 335–347. doi: 10.1111/geb.12260
Gaul, W., Sadykova, D., Roark, E., White, H. J., León-Sánchez, L., Caplat, P., et al. (2020). What have biological records ever done for us? A systematic scoping review. Front. Biogeogr. 12:e48607. doi: 10.21425/F5FBG48607
GBIF (2018). GBIF occurrence download (Publication no. https://doi.org/10.15468/dl.pqhkzp). (Accessed January 10, 2018)
Guedes, T. B., Sawaya, R. J., Zizka, A., Laffan, S., Faurby, S., Pyron, R. A., et al. (2018). Patterns, biases and prospects in the distribution and diversity of Neotropical snakes. Glob. Ecol. Biogeogr. 27, 14–21. doi: 10.1111/geb.12679
Hasumi, H., and Emori, S. (2004). K-1 Coupled Model (MIROC) Description (K-1 Technical Report 1) (Tokyo, Japan: Center for Climate System Research, University of Tokyo)
Hawkins, B. A., Field, R., Cornell, H. V., Currie, D. J., Guégan, J. -F., Kaufman, D. M., et al. (2003). Energy, water, and broad-scale geographic patterns of species richness. Ecology 84, 3105–3117. doi: 10.1890/03-8006
Hijmans, R. J., Cameron, S. E., Parra, J. L., Jones, P. G., and Jarvis, A. (2005). Very high resolution interpolated climate surfaces for global land areas. Int. J. Climatol. 25, 1965–1978. doi: 10.1002/joc.1276
Hu, R., Gu, Y., Luo, M., Lu, Z., Wei, M., and Zhong, J. (2020). Shifts in bird ranges and conservation priorities in China under climate change. PLoS One 15:e0240225. doi: 10.1371/journal.pone.0240225
Hu, R. C., Wen, C., Gu, Y. Y., Wang, H., Gu, L., Shi, X. Y., et al. (2017). A bird’s view of new conservation hotspots in China. Biol. Conserv. 211, 47–55. doi: 10.1016/j.biocon.2017.03.033
Huang, X., Lin, C., and Ji, L. (2020). The persistent multi-dimensional biases of biodiversity digital accessible knowledge of birds in China. Biodivers. Conserv. 29, 3287–3311. doi: 10.1007/s10531-020-02024-3
Jetz, W., Thomas, G. H., Joy, J. B., Hartmann, K., and Mooers, A. O. (2012). The global diversity of birds in space and time. Nature 491, 444–448. doi: 10.1038/nature11631
Jetz, W., Thomas, G. H., Joy, J. B., Redding, D. W., Hartmann, K., and Mooers, A. O. (2014). Global distribution and conservation of evolutionary distinctness in birds. Curr. Biol. 24, 919–930. doi: 10.1016/j.cub.2014.03.011
Lepczyk, C. A., La Sorte, F. A., Aronson, M. F. J., Goddard, M. A., MacGregor-Fors, I., Nilon, C. H., et al. (2017). “Global patterns and drivers of urban bird diversity” in Ecology and Conservation of Birds in Urban Environments. eds. E. Murgui and M. Hedblom (Cham: Springer International Publishing), 13–33.
Long, A. M., Pierce, B. L., Anderson, A. D., Skow, K. L., Smith, A., and Lopez, R. R. (2019). Integrating citizen science and remotely sensed data to help inform time-sensitive policy decisions for species of conservation concern. Biol. Conserv. 237, 463–469. doi: 10.1016/j.biocon.2019.07.025
Lu, L. M., Mao, L. F., Yang, T., Ye, J. F., Liu, B., Li, H. L., et al. (2018). Evolutionary history of the angiosperm flora of China. Nature 554, 234–238. doi: 10.1038/nature25485
McPherson, J. M., and Jetz, W. (2007). Type and spatial structure of distribution data and the perceived determinants of geographical gradients in ecology: the species richness of African birds. Glob. Ecol. Biogeogr. 16, 657–667. doi: 10.1111/j.1466-8238.2007.00318.x
Mi, X., Feng, G., Hu, Y., Zhang, J., Chen, L., Corlett, R. T., et al. (2021). The global significance of biodiversity science in China: an overview. Natl. Sci. Rev. 8:nwab032. doi: 10.1093/nsr/nwab032
Oksanen, J., Blanchet, F. G., Kindt, R., Legendre, P., Minchin, P. R., O’Hara, R. B., et al. (2015). Vegan: Community ecology package. Available at: http://cran.r-project.org/web/packages/vegan
Otto-Bliesner, B. L., Brady, E. C., Clauzet, G., Tomas, R., Levis, S., and Kothavala, Z. (2006). Last glacial maximum and Holocene climate in CCSM3. J. Clim. 19, 2526–2544. doi: 10.1175/jcli3748.1
Pärtel, M., Bennett, J. A., and Zobel, M. (2016). Macroecology of biodiversity: disentangling local and regional effects. New Phytol. 211, 404–410. doi: 10.1111/nph.13943
Peterson, A. T., Kumar, R. S., Nair, M. V., and Talukdar, G. (2018). Digital accessible knowledge of the birds of India: characterizing gaps in time and space. Curr. Sci. 115, 35–42. doi: 10.18520/cs/v115/i1/35-42
Procheş, Ş., Wilson, J. R. U., and Cowling, R. M. (2006). How much evolutionary history in a 10 × 10 m plot? Proc. R. Soc. B-Biol. Sci. 273, 1143–1148. doi: 10.1098/rspb.2005.3427
Qian, H. (2010). Environment–richness relationships for mammals, birds, reptiles, and amphibians at global and regional scales. Ecol. Res. 25, 629–637. doi: 10.1007/s11284-010-0695-1
Qian, H., Deng, T., Beck, J., Sun, H., Xiao, C., Jin, Y., et al. (2018). Incomplete species lists derived from global and regional specimen-record databases affect macroecological analyses: a case study on the vascular plants of China. J. Biogeogr. 45, 2718–2729. doi: 10.1111/jbi.13462
Qu, Y., Song, G., Gao, B., Quan, Q., Ericson, P. G. P., and Lei, F. (2015). The influence of geological events on the endemism of east Asian birds studied through comparative phylogeography. J. Biogeogr. 42, 179–192. doi: 10.1111/jbi.12407
R Development Core Team. (2019). R: A language and environment for statistical computing. R Foundation for Statistical Computing. Available at: https://www.R-project.org/
Robinson, N., Regetz, J., and Guralnick, R. P. (2014). EarthEnv-DEM90: a nearly-global, void-free, multi-scale smoothed, 90m digital elevation model from fused ASTER and SRTM data. ISPRS J. Photogramm. Remote Sens. 87, 57–67. doi: 10.1016/j.isprsjprs.2013.11.002
Rotenberry, J. T., and Balasubramaniam, P. (2020). Connecting species’ geographical distributions to environmental variables: range maps versus observed points of occurrence. Ecography 43, 897–913. doi: 10.1111/ecog.04871
Sandel, B., Arge, L., Dalsgaard, B., Davies, R. G., Gaston, K. J., Sutherland, W. J., et al. (2011). The influence of late quaternary climate-change velocity on species endemism. Science 334, 660–664. doi: 10.1126/science.1210173
Shipley, J. R., Kelly, J. F., and Frick, W. F. (2018). Toward integrating citizen science and radar data for migrant bird conservation. Remote Sens. Ecol. Conserv. 4, 127–136. doi: 10.1002/rse2.62
Soroye, P., Ahmed, N., and Kerr, J. T. (2018). Opportunistic citizen science data transform understanding of species distributions, phenology, and diversity gradients for global change research. Glob. Chang. Biol. 24, 5281–5291. doi: 10.1111/gcb.14358
Sousa-Baena, M. S., Garcia, L. C., and Peterson, A. T. (2014). Completeness of digital accessible knowledge of the plants of Brazil and priorities for survey and inventory. Divers. Distrib. 20, 369–381. doi: 10.1111/ddi.12136
Stephenson, P. J. (2020). Technological advances in biodiversity monitoring: applicability, opportunities and challenges. Curr. Opin. Environ. Sustain. 45, 36–41. doi: 10.1016/j.cosust.2020.08.005
Svenning, J. C., Eiserhardt, W. L., Normand, S., Ordonez, A., and Sandel, B. (2015). The influence of paleoclimate on present-day patterns in biodiversity and ecosystems. Annu. Rev. Ecol. Evol. Syst. 46, 551–572. doi: 10.1146/annurev-ecolsys-112414-054314
Telenius, A. (2011). Biodiversity information goes public: GBIF at your service. Nord. J. Bot. 29, 378–381. doi: 10.1111/j.1756-1051.2011.01167.x
The Biodiversity Committee of Chinese Academy of Sciences (2020). Catalogue of Life China: 2020 Annual Checklist. (Beijing, China: The Biodiversity Committee of Chinese Academy of Sciences).
Vale, M. M., Tourinho, L., Lorini, M. L., Rajão, H., and Figueiredo, M. S. L. (2018). Endemic birds of the Atlantic Forest: traits, conservation status, and patterns of biodiversity. J. Field Ornithol. 89, 193–206. doi: 10.1111/jofo.12256
Wang, N., Mao, L., Yang, X., Si, X., Wang, Y., Eiserhardt, W. L., et al. (2020). High plant species richness and stable climate lead to richer but phylogenetically and functionally clustered avifaunas. J. Biogeogr. 47, 1945–1954. doi: 10.1111/jbi.13878
Wang, Y., Si, X., Bennett, P. M., Chen, C., Zeng, D., Zhao, Y., et al. (2018). Ecological correlates of extinction risk in Chinese birds. Ecography 41, 782–794. doi: 10.1111/ecog.03158
Wetzel, F. T., Bingham, H. C., Groom, Q., Haase, P., Kõljalg, U., Kuhlmann, M., et al. (2018). Unlocking biodiversity data: prioritization and filling the gaps in biodiversity observation data in Europe. Biol. Conserv. 221, 78–85. doi: 10.1016/j.biocon.2017.12.024
Wüest, R. O., Zimmermann, N. E., Zurell, D., Alexander, J. M., Fritz, S. A., Hof, C., et al. (2020). Macroecology in the age of big data – where to go from here? J. Biogeogr. 47, 1–12. doi: 10.1111/jbi.13633
Yang, X., Li, S., Hughes, A., and Feng, G. (2021). Threatened bird species are concentrated in regions with less historical human impacts. Biol. Conserv. 255:108978. doi: 10.1016/j.biocon.2021.108978
Yang, W. J., Ma, K. P., and Kreft, H. (2013). Geographical sampling bias in a large distributional database and its effects on species richness-environment models. J. Biogeogr. 40, 1415–1426. doi: 10.1111/jbi.12108
Yang, L., Wen, X., Han, L., Yang, X., Shi, W., and Wang, S. (1995). “The avifauna of Yunnan China” in Non-Passerines, vol. 1 (Kunming, China: Yunnan Science and Technology Press), 673. [in Chinese]
Yang, L., and Yang, X. (2004). The Avifauna of Yunnan China, Vol. 2: (Passeriformes. Kunming, China: Yunnan Science and Technology Press). 1056 [in Chinese]
Young, B. E., Dodge, N., Hunt, P. D., Ormes, M., Schlesinger, M. D., and Shaw, H. Y. (2019). Using citizen science data to support conservation in environmental regulatory contexts. Biol. Conserv. 237, 57–62. doi: 10.1016/j.biocon.2019.06.016
Zheng, G. M. (2017). A Checklist on the Classification and Distribution of the Birds of China. 3rd Edn. (Beijing, China: Science Press)
Keywords: species inventory, avifauna, observation, diversity index, biodiversity pattern, diversity–environment relationships
Citation: Huang X, Lin C, Ji L and Feng G (2023) Species inventories from different data sources “shaping” slightly different avifauna diversity patterns. Front. Ecol. Evol. 11:1121422. doi: 10.3389/fevo.2023.1121422
Edited by:
Francisco Guerrero, University of Jaén, SpainCopyright © 2023 Huang, Lin, Ji and Feng. This is an open-access article distributed under the terms of the Creative Commons Attribution License (CC BY). The use, distribution or reproduction in other forums is permitted, provided the original author(s) and the copyright owner(s) are credited and that the original publication in this journal is cited, in accordance with accepted academic practice. No use, distribution or reproduction is permitted which does not comply with these terms.
*Correspondence: Liqiang Ji, amlAaW96LmFjLmNu; Gang Feng, cWF1ZmVuZ2dhbmdAMTYzLmNvbQ==
†These authors have contributed equally to this work and share first authorship
Disclaimer: All claims expressed in this article are solely those of the authors and do not necessarily represent those of their affiliated organizations, or those of the publisher, the editors and the reviewers. Any product that may be evaluated in this article or claim that may be made by its manufacturer is not guaranteed or endorsed by the publisher.
Research integrity at Frontiers
Learn more about the work of our research integrity team to safeguard the quality of each article we publish.