 Yanming Guo1,2,3†
 Xiaojie Liu1†Xiaohuang Liu1,4
 Jiahong Zhang2*
 Haiyan Zhang1,3*
 Jiangwen Fan1
 Nawab Khan5Jiliang Ma6
- 1Key Laboratory of Natural Resource Coupling Process and Effects, Ministry of Natural Resources, Institute of Geographic Sciences and Natural Resources Research, Chinese Academy of Sciences, Beijing, China
- 2China Aero Geophysical Survey and Remote Sensing Center for Natural Resources, Beijing, China
- 3College of Resources and Environment, University of Chinese Academy of Sciences, Beijing, China
- 4Natural Resources Comprehensive Investigation Command Center, China Geological Survey, Beijing, China
- 5College of Management, Sichuan Agricultural University, Chengdu, China
- 6Institute of Agricultural Economics and Development, Chinese Academy of Agricultural Sciences, Beijing, China
Introduction: National parks, defined as the mainstay of the nature reserve system in China, pursue to achieve scientific protection and rational utilization of natural resources. However, eco-environmental and socioeconomic benefits are rarely considered together. Hereby, how to quantitatively express the relationship between humanity and nature in national parks needs further exploration. We selected the Three-River-Source National Park (TRSNP), China's largest national park by area and the world's highest altitude national park, as a representative case to construct an evaluation model for the degree of harmony between humanity and the nature of the national alpine ecological park.
Methods: Based on the field survey data, the meteorological data, the remote sensing data, and the socioeconomic data, the study used the model inversion and the spatial analysis methods to quantitatively evaluate the degree of harmony consisting of 12 indexes from a fresh perspective of a combination of the ecological environment and social economy. Considering the TRSNP establishment in 2016 as the time node, we assessed and compared the degree of harmony between humanity and nature during the dynamic baseline period (2011–2015) and the evaluation period (2016–2020).
Results: The results show that the degree of harmony between humanity and nature showed a gradual upward trend from the northwest to the southeast in the TRSNP. Compared with the dynamic baseline period, the eco-environmental and socioeconomic levels of the evaluation period were increased by 34.48 and 5.46%, respectively. Overall, the degree of harmony between humanity and nature visibly increased by 23.38%.
Discussion: This study has developed a novel comprehensive method for evaluating national parks at the regional scale for the win-win goal of both protection and development, and it provides a theoretical basis for effective planning and management policies for national parks.
1. Introduction
China is one of the nations with the highest levels of biodiversity (Gorenflo et al., 2012; Ma et al., 2017), with approximately 10% of higher plants (Ren et al., 2019) and 22% of terrestrial vertebrates (Xue and Zhang, 2019). With rapid economic and social developments, the natural ecosystem faces a conflict between the protection of natural resources and their development and utilization. Natural reserve systems that are the core carriers of ecological constructions in China can offer protection to maintain biodiversity, natural landscapes, and vital ecosystems (Juffe-Bignoli et al., 2014; Ren and Guo, 2021), while the traditional nature reserve model has been unable to meet the current developmental requirements (Rennie, 2006). Therefore, a new nature reserve system was established considering both ecological protection and rational utilization (Liu et al., 2021). As the mainstay of the nature reserve system in China, a national park is a specific land or marine area established and managed by the state with clearly defined boundaries and aimed mainly to protect the authenticity and integrity of significant natural ecosystems over a large area (General Office of the CPC and Central Committee, 2017). The establishment goals of national parks in China not only strengthen the protection of the authenticity and integrity of the natural ecosystem but also emphasize benefits to society, which coordinate the relationship between ecological environmental protection and the production and life of farmers and herdsmen. The ultimate purpose of national parks is to maintain the harmonious coexistence and sustainable development of humanity and nature, to build a nature reserve system with Chinese characteristics with national parks as its core, and to promote the development of a beautiful China [National Development and Reform Commission (NDRC), 2018; Xinhua News Agency, 2022]. International national parks are also focused on the relationship between nature conservation and local economic development (Zhu et al., 2022). For example, France, one of the first countries in the world to create national parks, during the construction of its national parks paid much attention to the synergistic development of cities and parks to build a sustainable national park development model (Yang, 2022). Significantly, China's national parks permit indigenous people to engage in production and operation activities during the park's construction and build a mechanism for joint construction and sharing (Zhao, 2019). Specifically, national parks are not only important ecological function areas but also production and living spaces for locals. Against the backdrop of building China into a great modern socialist nation in all respects, a set of national park construction ideas harmonizing the ecological, production, and living considerations are in demand. This requires narrowing the striking contrast between economic growth and environmental degradation (Ouyang et al., 2020) and achieving the harmonious coexistence of humanity and nature. Consequently, the scientific and exhaustive assessments of the changes in the harmony between humanity and nature brought about by the establishment of China's national parks are valuable for guiding the future construction and governance of national parks and facilitating the development of ecological civilization.
Since the United States set up Yellowstone National Park in 1872 as the world's first national park, more than 5,000 national parks have been established in more than 100 countries and regions (Zhang et al., 2022). Currently, the evaluation research on national parks often separates the eco-environmental and socioeconomic evaluations. The ecological aspects include the evaluation of ecosystem integrity and authenticity (Jiang et al., 2021; Zhao, 2021), ecological sensitivity (Yang et al., 2017; Meng et al., 2018), ecological health (Su, 2019), and ecosystem service value (Li et al., 2016; Zhang and Zhang, 2019), whereas the social aspects mainly include the evaluation of national park management efficiency (Rudnicki et al., 2005; Heiland et al., 2020), resident livelihood flexibility (Meng and Chen, 2019), and resident sustainable livelihoods (Shang and Cao, 2019; Yu et al., 2020). The evaluation research also includes an assessment of economic aspects such as suitability for research and study travel (Chen et al., 2020) and for recreational use (Xiao et al., 2019). In this type of research, the calculation methods of the weight of the indicator system are mainly divided into the subjective weighting method [Delphi method (Li and Cong, 2021); the analytic hierarchy process (AHP) (Tang et al., 2010); the expert scoring method (Yang and Zhu, 2016)]; and the objective weighting methods including the entropy weight method (EWM) (Zhou et al., 2021) and the gray clustering method (Lu and Li, 2018). In addition, the approaches used are the Rapid Assessment and Prioritization of Protected Area Management (Nchor and Ogogo, 2013) and the Enrichment Evaluation Combined with a Stochastic Multi-Criteria Acceptability Analysis approach and a preference-ranked organizational approach (PROMETHEE) (An et al., 2019). Although these evaluation methods are classic and have many practical bases, this kind of evaluation work needs further exploration.
The Three-River-Source region is a significant ecological security barrier and plateau biological germplasm resource bank, which is of high importance to China and even the world (Fan et al., 2011). Due to its vital ecological status, existing studies of effectiveness evaluations in this region focus on the ecological aspect without considering the balanced development of a fundamental social economy. For instance, the effectiveness evaluation of the ecological environmental protection and construction projects in the Three-River-Source region concluded that the ecological environment had partially improved and the deterioration had been contained initially (Shao et al., 2016). Other small-scale eco-environment assessments of the Three-River-Source National Park (TRSNP) mainly include a comparative analysis of the changes in grass yields and livestock pressure for the grassland ecosystems (Zhang et al., 2014), health status assessment of the wetland ecosystems (Jia et al., 2011), and ecological health levels within the ecological protection comprehensive experimental zone (Huang, 2017). As China's largest and world's highest-altitude national park, a pilot TRSNP was first established in 2016 and then officially set up the first batch of national parks in 2021 (Zhang et al., 2022). The evaluation research objects have gradually shifted to the scale of the TRSNP, but the quantitative evaluation research is still just focused on ecology. For example, Cao et al. (2019) explored the spatiotemporal differentiation characteristics of the ecological functions through GIS spatial analysis and other means; Su (2019) assessed the ecological health of the TRSNP utilizing the PSR model and AHP; Fu et al. (2021) established the indicator system for the evaluation of the eco-environmental protection effects of the TRSNP. The evaluation of the socioeconomic aspects and inclusive benefits of the TRSNP is still at the qualitative analysis level (Zhao et al., 2020; Zhao and Yang, 2021). In conclusion, the quantitative evaluation research of the TRSNP scale needs further exploration to improve the quality of the scale. Simultaneously, to meet the profound purpose of the harmonious coexistence of humanity and nature pursued by the construction of national parks in China, it is essential to express the relationship between the ecological environment and social economy. At the method level, due to the inconsistency between the simulation scale of the eco-environmental index and the statistical caliber of the socioeconomic index, the question of how to quantitatively express the relationship between ecological conservation and community development needs to be answered.
This study takes the TRSNP as a case study area to bridge the current research gaps. We intend to develop a quantitative method for evaluating the degree of harmony between humanity and nature in pilot or official national parks of China with a focus on the balance between ecological conservation and community development objectives. First, this study designs the degree of harmony between humanity and nature (DHHN) index based on the eco-environmental level (EEL) and the socioeconomic level (SEL). To realize this method, we broke through the limitations of administrative boundaries to integrate the socioeconomic data from the Statistical Yearbook with the eco-environmental data in the same spatial and temporal resolutions. Moreover, EWM and AHP were used to comprehensively calculate the index weight. Then, considering the TRSNP establishment in 2016 as the time node, we analyzed the changes in the spatiotemporal variation characteristics of EEL, SEL, and DHHN during the dynamic baseline period (2011–2015) and the evaluation period (2016–2020). Finally, we provide some recommendations for future layouts and designs of national parks to achieve both ecological protection and local development goals.
2. Materials and methods
2.1. Study area
The TRSNP is in the Southern Qinghai Province (32°23′–36°48′ N, 89°51′–99°15′ E) and in the hinterland of the Qinghai–Tibet Plateau (Figure 1). Its total area is 123,100 km2, involving the four counties, Qumalai, Zhiduo, Zaduo, and Maduo, and the Hoh Xil Nature Reserve, with a total of 12 towns and 53 administrative villages. The TRSNP is mainly characterized by mountain ranges and alpine canyons, including the Kunlun Mountains, the Bayan Har Mountains, and the Tanggula Mountains with an average elevation of more than 4,500 m and a maximum elevation of 6,726 m. Due to its high altitude and hinterland location, the TRSNP has a typical plateau continental climate with the annual average temperatures between −5.6 and 7.8°C and annual precipitation between 170 and 700 mm. Grassland, mainly including alpine meadows and alpine steppe, occupies 61.54% of the study area and is the dominant ecosystem type. In 2020, the average GDP of the TRSNP was 801.44 million yuan, with a total population of 168,000.
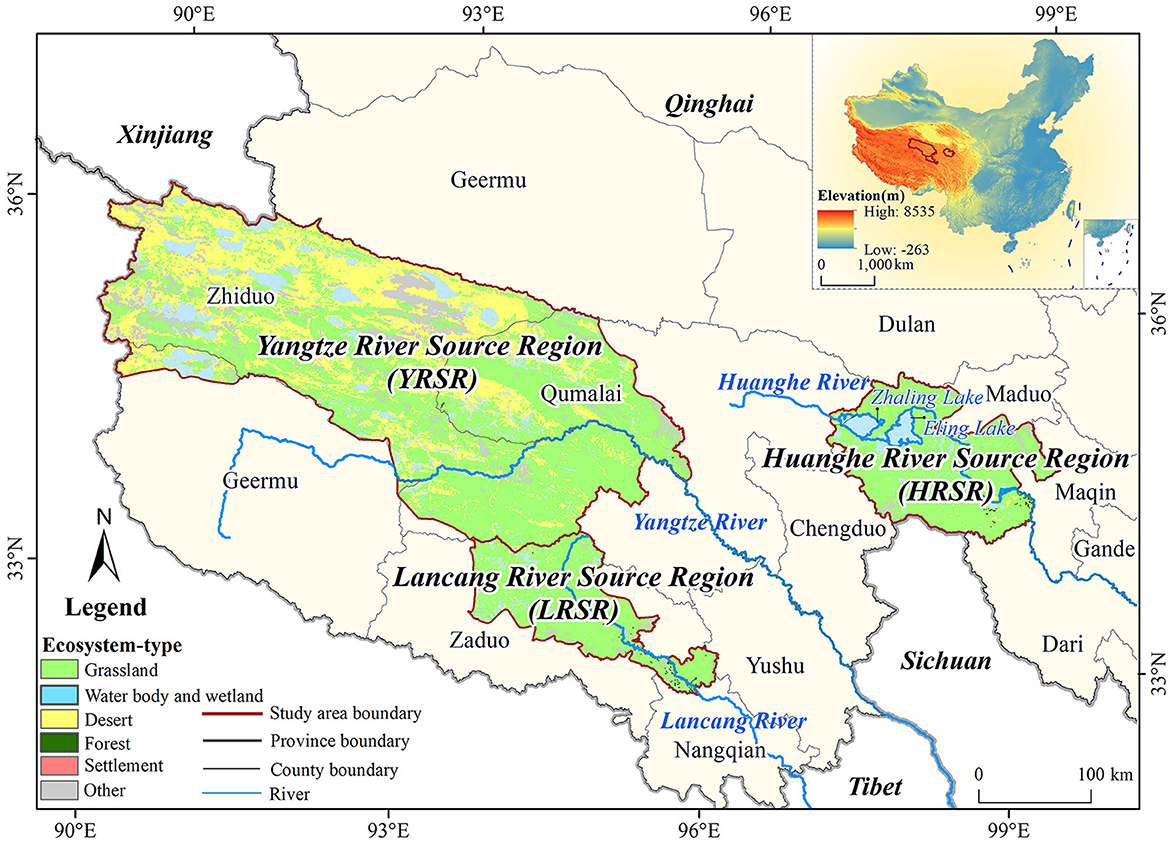
Figure 1. Overview of the Three-River-Source National Park (TRSNP).
The TRSNP is a vital repository of natural capital and ecosystem service flows for a substantial portion of Qinghai and China (Ouyang et al., 2019). There are several rivers, swamps, and lakes in the territory, of which 167 have an area of more than 1 km2 (Figure 1). It provides approximately 40 billion m3 of water annually downstream and is known as the “water tower” of East and Southeast Asia (Shao et al., 2016). The TRSNP is the source of the Yangtze, Huanghe, and Lancang rivers, correspondingly including three parks: the Yangtze River Source Region (YRSR), the Huanghe River Source Region (HRSR), and the Lancang River Source Region (LRSR). The TRSNP is also a global biodiversity hotspot and a repository for alpine biological germplasm, including 760 kinds of vascular plants and 270 kinds of wild vertebrates. Based on the goal of overall ecosystem protection and system restoration, the functional regionalization of the TRSNP is divided into core protection areas and general control areas.
2.2. Data source
In this study, the data used include basic geographic, meteorological, remote sensing, field survey data, and socioeconomic data (Table 1) from 2011 to 2020. Basic geographic data, including the Digital Elevation Model (DEM), the administrative division boundary, and the TRSNP boundary, were obtained from the relevant official management departments. The meteorological data were provided by 107 weather stations from the China Meteorological Science Data Sharing Service Network (http://cdc.cma.gov.cn/) and 167 weather stations from the local weather department. The remote sensing data were obtained from the MODIS and mainly include NDVI (Normalized Difference Vegetation Index) and NPP (Net primary productivity). The LUCC (Land Use and Land-Cover Change) data were from the 1:100,000 scale land use dynamic database established by Liu et al. (2014) from the late 1980s to 2020 and included six first-level types and 25 second-level types of forest land, grassland, cultivated land, industrial and mining land, residential land, urban and rural lands, unused land, and water bodies. Through field sampling and lab analysis, our research team obtained 475 1 m × 1 m quadrats at the peak of vegetation growth from mid-July 2010 to mid-August 2020. The population density data and the GDP (gross domestic product) density data were from the existing datasets downloaded from the Resource and Environmental Science Data and the Center of the Chinese Academy of Sciences (https://www.resdc.cn). Other socioeconomic data were from the Statistical Yearbooks of the provinces and counties and the Local Livestock House.

Table 1. Data collection for DHHN assessment.
2.3. Evaluation method for the degree of harmony between humanity and nature
2.3.1. Construction of an evaluation indicator system
Based on the borrowed experience and regional background features, we designed an indicator system for evaluating the degree of harmony between humanity and nature (DHHN) for the TRSNP that includes two aspects: the eco-environmental level (EEL) and the socioeconomic level (SEL). The EEL is to evaluate the core purpose of establishing the national parks system and the SEL is to evaluate the construction of an ecological environment. The ultimate purpose is to realize the harmonious coexistence of humanity and nature. Therefore, the constructions of the EEL and SEL indicators should always focus on protecting the authenticity and integrity of the TRSNP natural ecosystem and representing and reflecting the social and economic developments of the TRSNP as comprehensively as possible, respectively.
First, the subsequent indicator screening process should adhere to the following guidelines: (1) scientifically, referring to the experts' research and scholars in related fields combined with field research to screen the indicators systematically; (2) pertinence, screening indicators according to the purpose of the TRSNP construction and the regional characteristics; (3) accessibility, which requires a relatively mature means of acquiring the data required by the monitoring system for national parks in China (Jiao et al., 2022); (4) quantifiability, requiring each indicator to obtain quantitative results through scientific operations to ensure the practical significance of the evaluation system. According to the aforementioned principles, this study finally selected two categories, three levels, and twelve indexes involving the ecological environment and social economy to build a DHHN system for the pilot implementation of the TRSNP system (Table 2). Referring to the TRSNP-related government documents, this study considers the pilot establishment of the TRSNP in 2016 as an important time node and selects 5 years before and after and considers the dynamic baseline period as 2011–2015 and the evaluation period as 2016–2020.

Table 2. The DHHN index system of the Pilot Three-River-Source National Park System.
The EEL has three characteristics, namely ecosystem qualities, ecosystem services, and landscape pattern metrics. For ecosystem qualities, fractional vegetation cover (FVC) reflects the vegetation density, the size of the photosynthetic area, and the growth status of the vegetation community (Mu et al., 2012). The Net Primary Productivity (NPP) can represent the efficiency of plant fixation, conversion of photosynthesis products, and determining the available substances and energy (Zhu et al., 2007). For ecosystem services, water conservation, the core ecological service of the TRSNP, reflects the comprehensive function produced by the interaction of vegetation, water, and soil (Gong et al., 2017); soil retention reflects the ability of the ecosystems to reduce soil erosion (Hu et al., 2014); and wind erosion prevention is one of the most important ecosystem services in arid and semi-arid regions and reflects the ability of the region to retain soil and prevent dust storms (Gao et al., 2013). For landscape pattern metrics, habitat fragmentation has become the primary threat to biodiversity and Shannon's diversity index (SHDI) can represent the degree of habitat fragmentation at the landscape level. The greater the SHDI, the better the landscape fragmentation degree, the key reason for biodiversity loss (Ding et al., 2005).
Among the SEL indicators, population density is an important indicator of the population distribution of a region (Wu, 2011); medical service capacity enjoyed by the unit population reflects the patient acceptance ability of the medical institutions in a region, and the essential social development goals of the TRSNP are to build more high-quality and efficient medical service capacities (Xie et al., 2018). The population employed in the tertiary industry reflects the economic structure and the industrial development of the tertiary industry in a region (Liu, 2008), the gross domestic product (GDP) density is an important indicator of a region's economic situation and level of development (Liang and Xu, 2013), the savings deposit balance of the residents reflects the actual economic status and consumption capacity of the residents in a region (Zhu and Cheng, 2016), and the livestock density reflects the intensity of grassland grazing of the TRSNP animal husbandry production (Wu et al., 2021) and puts great pressure directly on the grassland ecosystem (Wei et al., 2020) in the TRSNP.
2.3.2. Data processing and standardization
2.3.2.1. Processing of the eco-environmental data
We primarily checked the meteorological data to control for quality and replace missing values with observations from nearby areas. Then, they were interpolated in space to 1 × 1 km grid data by the optimized thin-plate smooth spline function of the ANUSPLIN software with DEM. The meteorological spatial data after interpolation were regarded as the key intermediate parameters of water conservation, soil retention, and wind erosion prevention.
The FVC was calculated by the dimidiate pixel model based on the NDVI data after projection transformation, mosaicking, cropping, maximum value synthesis, S-G filtering, etc. After batch pretreatment, the NPP value was obtained by adding up to 23 periods of data over the whole year. The ecosystem services, i.e., water conservation, soil retention, and wind erosion prevention, were calculated using the precipitation storage method, the revised universal soil loss equation (RUSLE), and the revised wind erosion equation (RWEQ), respectively, which were shown in the Supplementary material (Figure 2). The ground sampling data were used to verify the FVC and NPP values in this study. Considering the spatial distribution of quadrats and the representativeness of grassland types, the quadrat data are strictly screened and standardized before modeling. The remaining quadrats may reflect the main grassland types and multiyear grass yields in the quadrat representative area. SHDI was used to calculate the LUCC data by the Fragstats software.
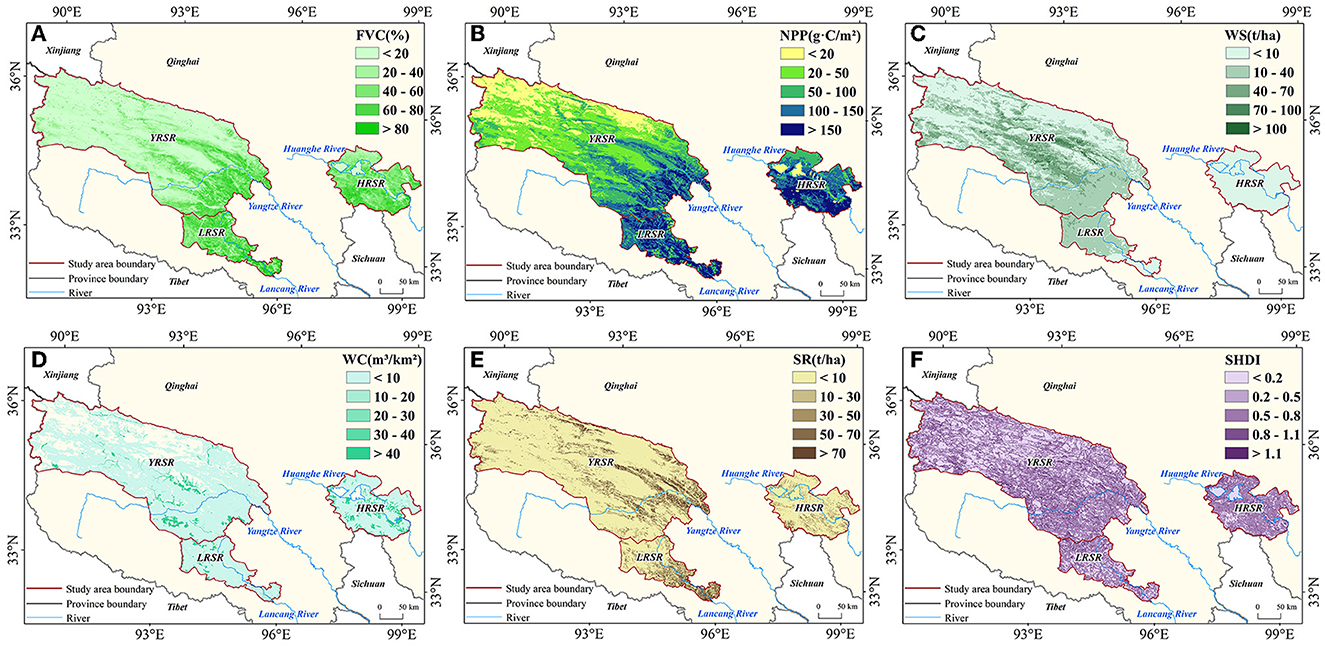
Figure 2. Spatial distribution of mean values of the ecological data from 2000 to 2020. (A) Fractional vegetation cover (FVC); (B) Net primary productivity (NPP); (C) Water conservation (WC); (D) Soil retention (SR); (E) Wind erosion prevention (WEP); and (F) Shannon's diversity index (SHDI).
2.3.2.2. Processing of the socioeconomic data
Some socioeconomic data at the county level, such as the livestock number and the number of beds in the medical and health institutions, are obtained from the Statistical Yearbook. While the function zone boundaries of the TRSNP do not coincide with the administrative division boundaries of the counties and townships, the statistical data also do not reflect the spatial differences to a certain extent and reduce the accuracy of the evaluation.
In this study, we selected the number of beds in the medical and health institutions to represent the medical service capacity. First, using network crawling, the bed counts of all the medical and health institutions of the four counties related to the TRSNP are obtained; however, the impact of the counties other than the four counties is not considered. Second, we queried the relevant information of each medical institution to get the establishment time and the corresponding medical institution in the medical institutions' classification management standard. Then, according to the National Medical and Health Service System Planning Outline, the medical coverage theory capacities of the medical and health institutions of different levels in the set buffer (50 km, 100 km, 150 km, 200 km, and 500 km) were defined (Table 3) and the theoretical capacities of the medical service institutions in the various regions of the TRSNP were obtained. Using the theoretical capacities of the medical service institutions in different regions, the bed counts of the medical and health institutions in the four counties from 2011 to 2020 can be rostered and then divided by the population density of the TRSNP to obtain the spatial distribution data on the actual medical service capacity (Figure 3). The technical process figure is shown in the Supplementary material. The medical service capacity is estimated using the following equations:
where NBMIij is the bed count of the medical and health institutions (pcs.) in the grid in row i and column j with the grid size 1 km × 1 km; NBMIcauis the statistical value of the bed count (pcs.) of the medical and health institutions in the county-level administrative regions where the grid unit is located; MSTAij is the theoretical medical service capacity (%) of the grid unit; MSTAcau is the theoretical total medical service capacity (%) of the county-level administrative unit that contains the grid unit; MSCij is the medical service capacity (pcs./person) of the grid in row i and column j; and POPij is the population of that grid unit (person).
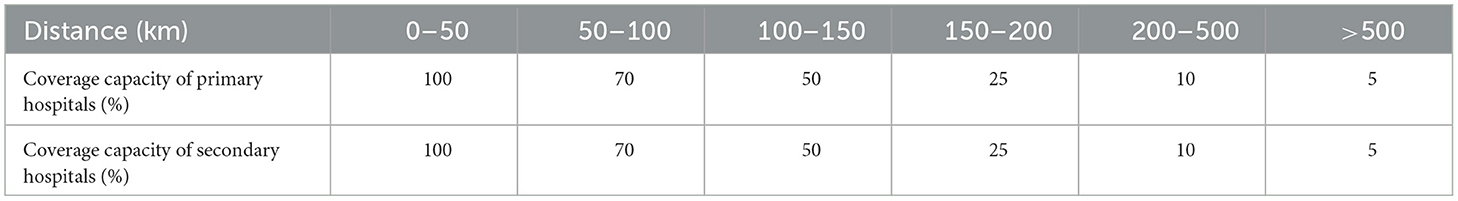
Table 3. Theoretical coverage of medical services in different medical and health institutions at different distances.
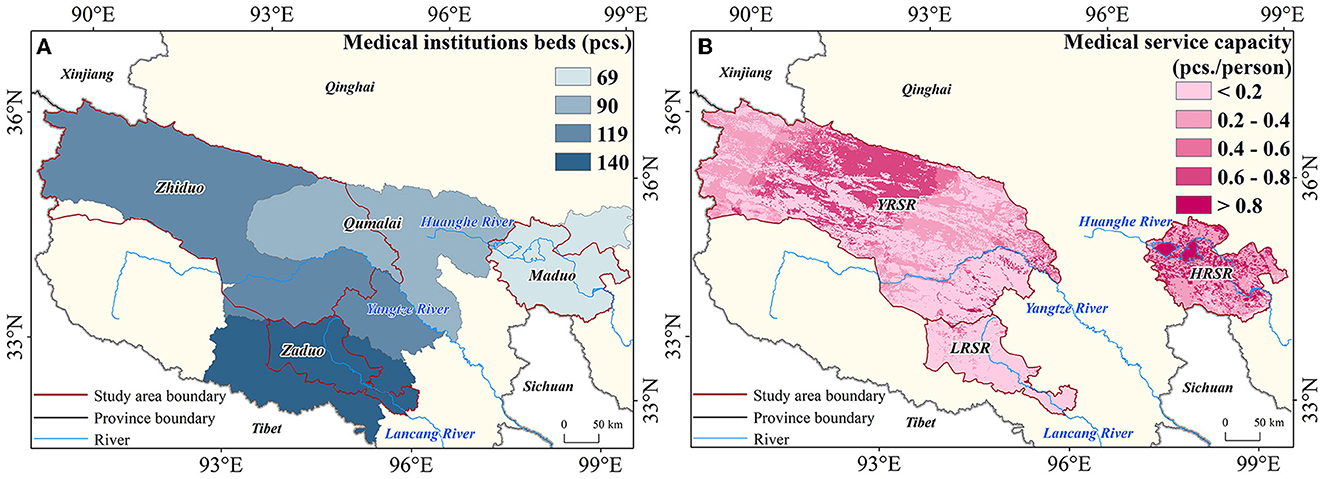
Figure 3. Comparison of the bed count of the medical and health institutions at the county level (A) and the 1 × 1 km level (B).
As the distribution of livestock quantity has a strong correlation with the altitude, settlements, water sources, and grassland conditions (Qiao et al., 2017), this study selected the distance from settlements, altitude, NPP, and distance from a water source as the main influencing factors of the spatial distribution of livestock. In addition, due to the complete prohibition of productive animal husbandry activities in the core conservation area and the implementation of a strict balance of grass and livestock in the general area [National Development and Reform Commission (NDRC), 2018], this study distributed the number of livestock after 2016 in the remaining area except for the core conservation area. First, the four influencing factors were rasterized on the grasslands and normalized by calculating the deviating Euclidean distance. At the same time, a hierarchical model is constructed and the weights of the seven influencing factors are obtained by expert scoring. By multiplying the normalized results of different factors with the corresponding weight, the livestock activity intensity scores of different grids can be obtained, and by combining them with the livestock quantities of the four counties from 2011 to 2020, the livestock quantity distribution of the TRSNP can be obtained (Figure 4). The technical process figure is shown in the Supplementary material. The calculation formula is as follows:
where LDij is the livestock number (SHU) of the grid in row i and column j with the grid size 1 × 1 km; LDcau is the statistical value of the livestock number (SHU) at the county level; LAIij is the livestock intensity of this grid; and LAIcau is the total livestock intensity at the county level in which that grid unit is located.
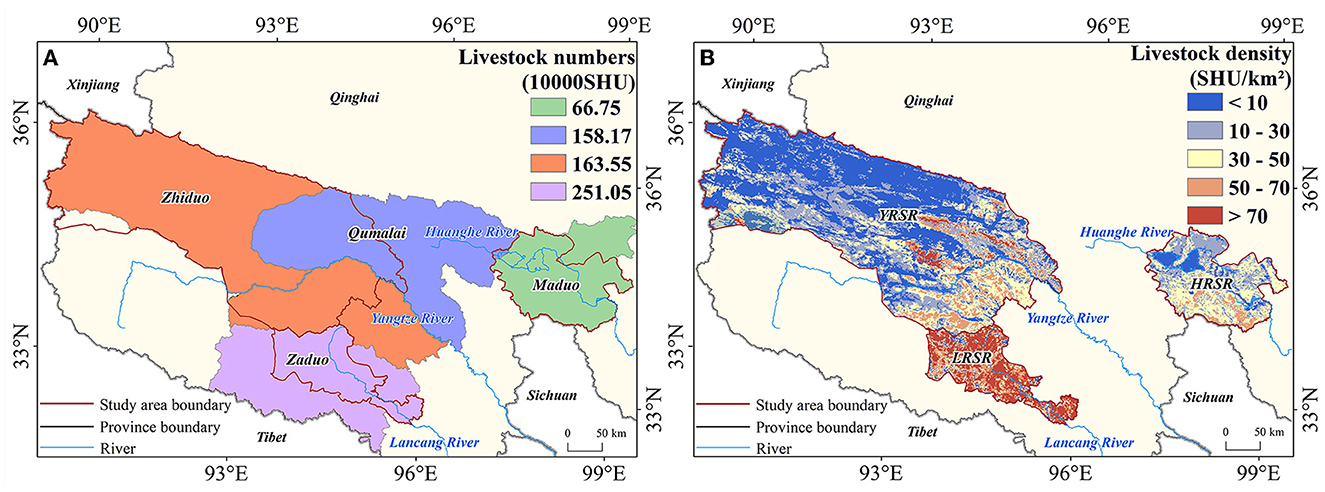
Figure 4. Comparison of the livestock number at the county scale (A) and the 1-km scale (B).
2.3.2.3. Data standardization
The DHHN assessment was performed both at the 1-km spatial resolution and the annual temporal resolution. All data involved in the evaluation system were unified at the temporal and spatial resolutions, the coordinate system, and the data format. Furthermore, there are dimensional differences between the various evaluation indicators of the DHHN. Each index value uses extreme difference analysis for the standardization of the treatment to 0–1. For positive indicators, the calculation formula is as follows:
For negative indicators, the calculation formula is as follows:
where Xi, j represents the standardized value of indicator i in year j; xi, j represents the actual value of indicator i in year j; and xi, min and xi, max represent the minimum and maximum values observed in all actual measurements of indicator i during 2011–2020.
2.3.3. Weight determination of the indices
Determination of index weight is important for final evaluation results and this study uses EWM and AHP to determine the weight of each indicator. The EWM is an objective weighing approach that quantifies the indicator's weight by calculating the indicator's information entropy (Ding et al., 2017). When the indicator information entropy is larger, it means that the system carries less information and corresponding indicator weight is smaller (Chen et al., 2009; Chen, 2019). While this approach can eliminate the influence of man-made subjective consciousness compared with the subjective weighting method, the disadvantage is due to the lack of horizontal comparison among the indicators. While the weight completely depends on the data samples with high accuracy requirements, AHP combines the qualitative and quantitative approaches. It constructs each influencing factor of the complex system a multilevel analysis structure model, analyzes and calculates the various levels, and then obtains the weights (Chang and Jiang, 2007). The advantage of this method is that the calculation is concise and clear and more attention should be paid to the essence of the research problem. It has fewer requirements for data but its disadvantages have strong subjectivity. Therefore, AHP and EWM are used together to provide each other the data and make the final weight calculation more scientific and reasonable.
For the EWM to calculate the proportion of the value of the indicator j of sample i:
For calculating the entropy of the indicator j:
For calculating the weight of the indicator j:
For the AHP, a judgment matrix is constructed by comparing the two indicators at the same level by expert scoring and then constructing the judgment matrix of the level:
where U is the judgment matrix; uij is the importance value of ui relative to uj; 1–9 and its reciprocals are the importance scales; and n is the number of indicators at this level.
Weight calculation by the eigenvector method is performed by calculating the eigenvector corresponding to the maximum characteristic root based on the judgment matrix and then normalizing it to obtain the weight vector. The calculation formula is as follows:
where W is the eigenvector; Uw is the judgment matrix with the eigenvector W; and αmax is the maximum characteristic root.
The consistency test is performed by checking whether the weight vector obtained passes the consistency test. First, the general consistency index of the judgment matrix is calculated using the following formula:
where CI is the general consistency index of the judgment matrix and n is the number of factors in the AHP structure.
Second, the average random consistency index RI corresponding to the number of factors was found (Table 4):

Table 4. RI values for the different number of factors.
Finally, the random consistency ratio (CR) of the judgment matrix was calculated using the formula
It is considered that the consistency of the judgment matrix U is acceptable when the calculated CR of the judgment matrix (U) is <0.1. Otherwise, it is necessary to make an appropriate adjustment to the judgment matrix (U) to make its consistency meet the requirements.
After calculating the weights of the evaluation indicator system using the EWM and AHP values, the final weights of the evaluation indicator system are determined by averaging the weights obtained from the two methods (Table 5).

Table 5. Weight corresponding to every indicator of the evaluation indicator system.
2.3.4. Model for the degree of harmony between humanity and nature
The connotation of the harmonious degree of humanity and nature (HDMN) model multiplies the weights of the indicator system by the standardized value of the corresponding indicators and then accumulates the corresponding EEL, SEL, and DHHN values to carry out subsequent comparison and analysis. The model can be mathematically expressed as follows:
where EWi is the weight of each indicator of the ecological environment; SWj is the weight of each indicator of social economy; Cwe is the weight of EEL; Cws is the weight of SEL; EIi is the result of the standardization of the eco-environmental indicators; and SIj is the result of the standardization of socioeconomic indicators.
3. Results
3.1. Spatiotemporal variation characteristics of eco-environmental level
In terms of spatial distribution, the EEL of the TRSNP in the baseline and evaluation periods showed a trend of gradual increase from the northwest to the southeast (Figures 5A, B). The EELs of the two periods were best in the LRSR, followed by the HRSR; the YRSR has the worst EEL. Among them, in the baseline period, the EEL of the LRSR was 0.61, while those of the HRSR and the YRSR were 0.52 and 0.28, respectively, and the EEL of the entire TRSNP was 0.47. During the evaluation period, the EELs of the LRSR, the HRSR, and the YRSR were 0.72, 0.64, and 0.35, respectively, and the EEL of the entire TRSNP was 0.63.
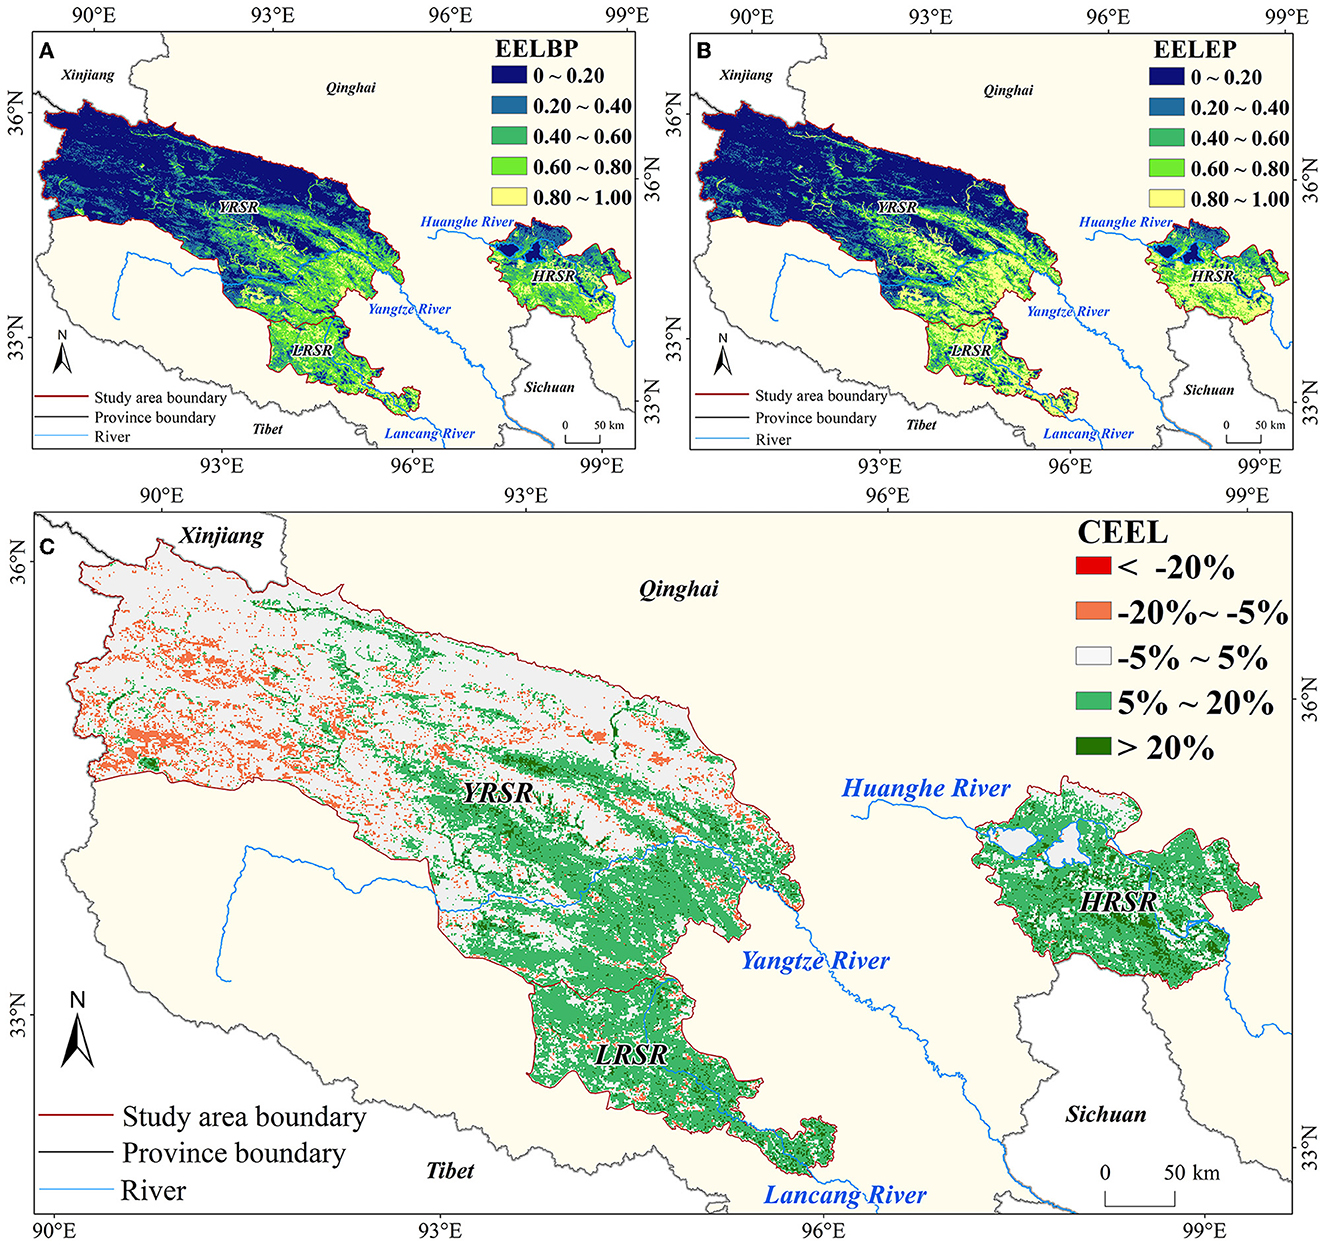
Figure 5. Distribution and change of the eco-environmental level (EEL) in the TRSNP. Eco-environmental level during the baseline period (EELBP) (A); Eco-environmental level during the evaluation period (EELEP) (B); Change in the eco-environmental level (CEEL) (C).
From the perception of time change, according to the statistical results, the study area where the EEL of the TRSNP increased accounted for 40.03% of the study area. Mainly, in the southeast, the EELs of 5−20% and 4.10% regions increased by 35.93% and >20%. The EEL of the remaining regions was unchanged. The largest area accounted for 53.34% change and the smallest area accounted for 6.63% In the northwest region of the TRSNP, −20 to −5% of the regions accounted for a 6.61% reduction. A reduction >-20% accounted for only 0.02% (Figure 5C). Among the three regions, the YRSR has more areas with reduced or unchanged EEL in the western region, while the areas with EEL increasing gradually increase eastward; most of the EEL of the LESR is increasing, and a few areas with a decrease are scattered among them. The HRSR showed that the EEL of the southern regions mostly increased and it remained unchanged or gradually increased along the northern regions (Figure 5C).
3.2. Spatiotemporal variation characteristics of the socioeconomic level
From the perspective of spatial distribution, the SEL of the TRSNP in the baseline and evaluation periods are similar to those of the EEL, showing a gradually increasing trend from the northwest to the southeast (Figures 6A, B). The difference is that the SEL can be seen to have strong county characteristics. In both periods, the LRSR in Zaduo had the best SEL, followed by the HRSR in Maduo, and the worst SEL was the YRSR in Zhiduo and Qumalai; however, the SEL of Qumalai was better than Zhiduo. In the baseline period, the SEL of the LRSR was 0.84, while the SEL of the HRSR and the YRSR were 0.48 and 0.26, respectively, and the SEL of the whole TRSNP was 0.53. During the evaluation period, the SEL of the LRSR, the HRSR, and the YRSR were 0.90, 0.43, and 0.33, respectively, and the SEL of the whole TRSNP was 0.56.
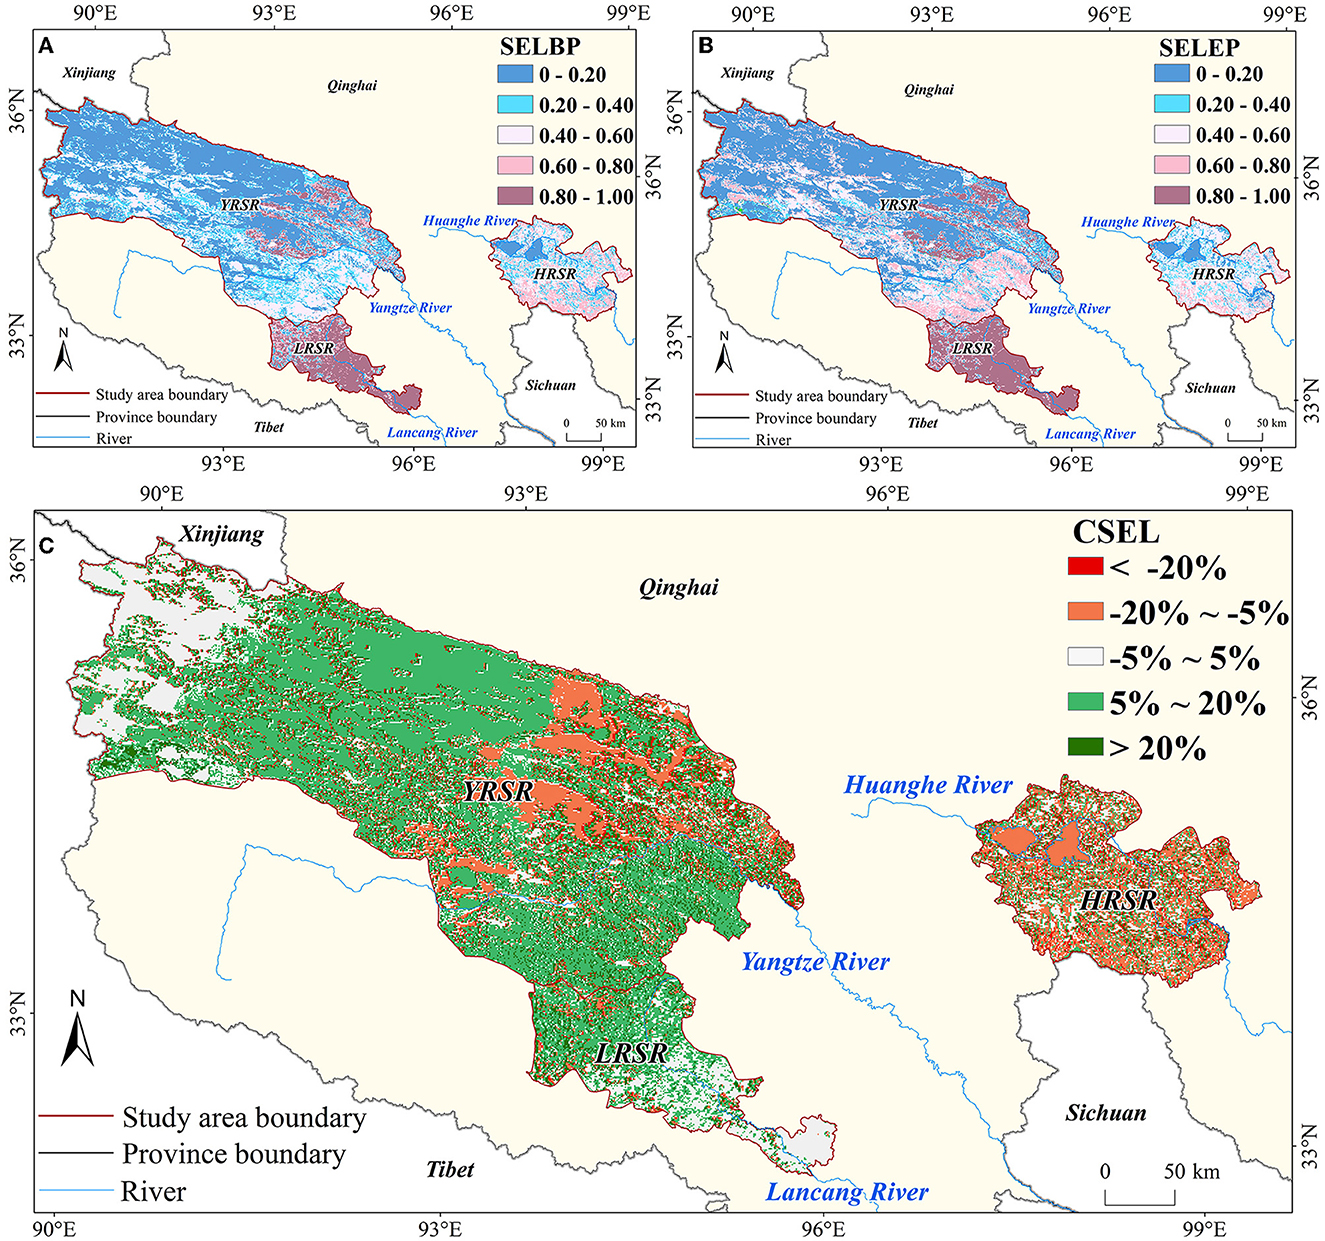
Figure 6. Distribution and change of the socioeconomic level (SEL) in the TRSNP. Socioeconomic level during the baseline period (SELBP) (A). Socioeconomic level during the evaluation period (SELEP) (B). Change in the socioeconomic level (CSEL) (C).
In terms of the time change, the SEL of 48.82% of the total study area increased which is mainly distributed in the Zhiduo county area of the YRSR, that of 35.59% increased by 5–20%, which is mainly distributed in the LRSR, and the SEL of 13.23% of the total study area increased by more than 20%. The unchanged area accounted for 28.47% of the TRSNP and 22.71% of the YSSR mainly distributed in the Qumalai County, and −20–5% of the areas of the HRSR decreased by 15.81% and that of −20% decreased by 6.90% (Figure 6C).
3.3. Quantitative assessment of the degree of harmony between humanity and nature
In terms of spatial distribution, the DHHN of the TRSNP during the baseline and evaluation periods show a gradual growth trend from the northwest to the southeast and from the north to the south (Figures 7A, B). Among the three regions, the one with the largest DHHN during the baseline and evaluation periods was the LRSR followed by the HRSR. The YRSR had the smallest DHHN. During the baseline period, the DHHN of the LRSR is 0.68 and those of the HRSR and the YRSR were 0.51 and 0.27, respectively. The DHHN of the TRSNP was 0.49. During the evaluation period, the DHHN of the LRSR was 0.84 and those of the HRSR and the YRSR were 0.63 and 0.33, respectively. The DHHN of the TRSNP was 0.60. Among the main ecosystems of the TRSNP, the grassland ecosystem had the largest DHHN during both periods (the baseline period: 0.52, the evaluation period: 0.66) followed by the water body and wetland ecosystems (the baseline period: 0.28, the evaluation period: 0.33). The desert ecosystem had the smallest DHHN (the baseline period: 0.16, the evaluation period: 0.18) (Figure 8A).
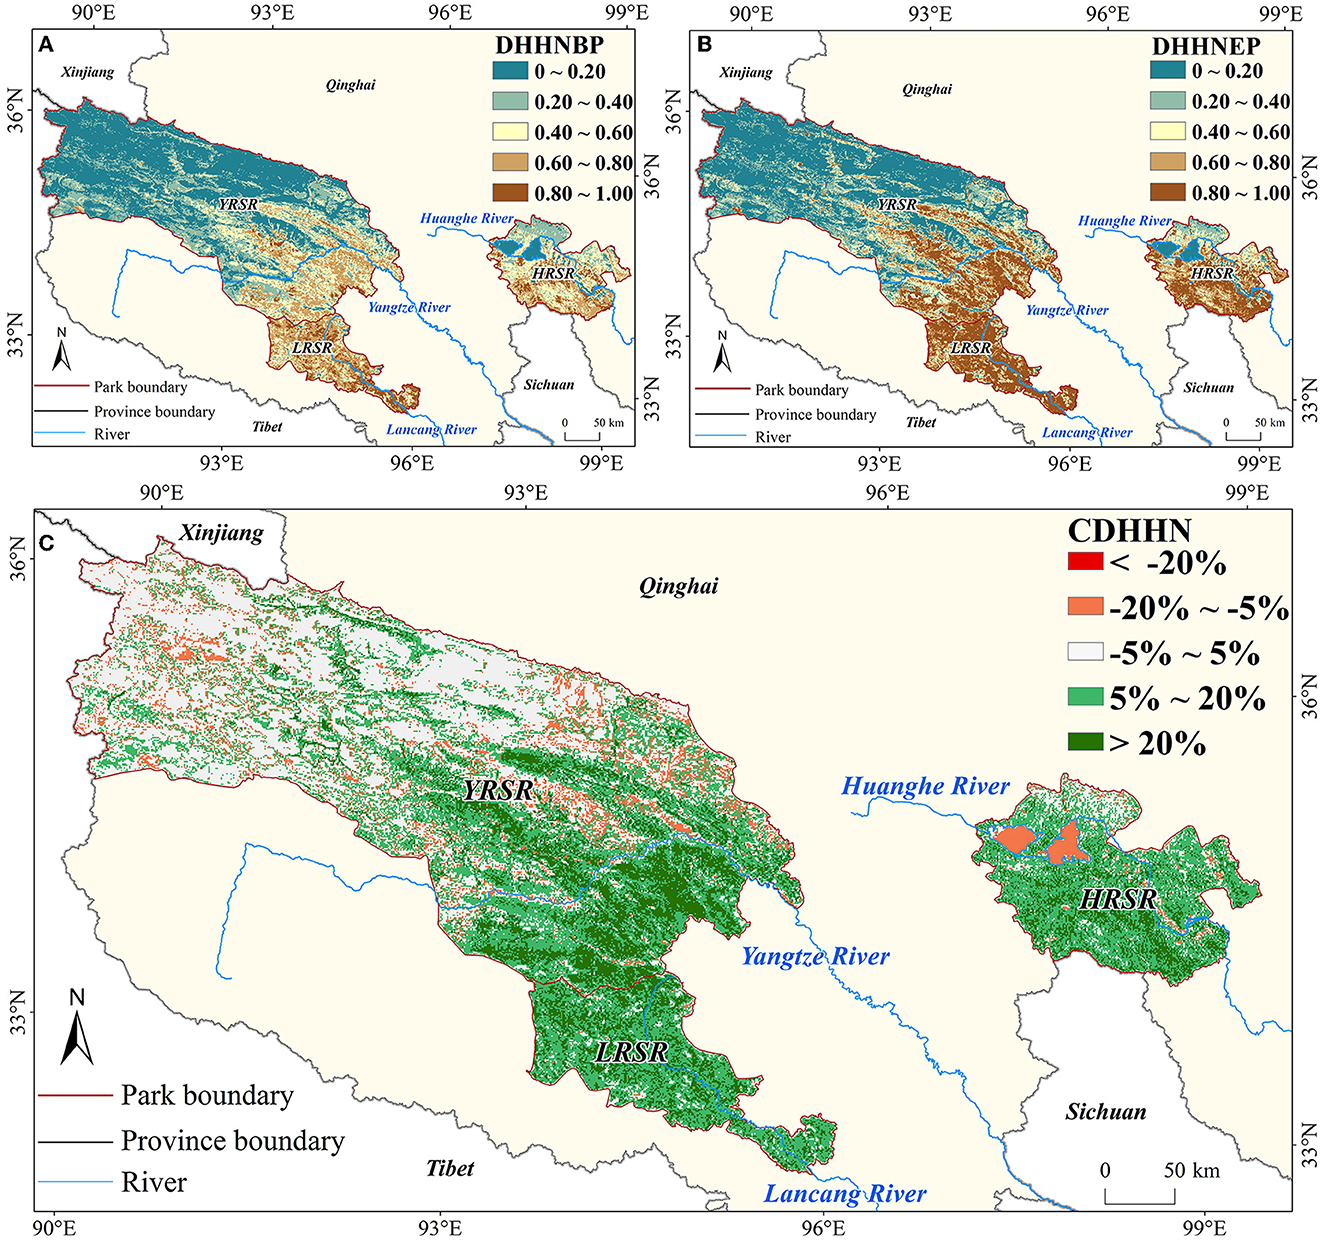
Figure 7. Distribution of the DHHN during (A) the baseline period (DHHNBP) and (B) the evaluation period (DHHNEP). Change in the above two time periods (CDHHN) of the TRSNP (C).
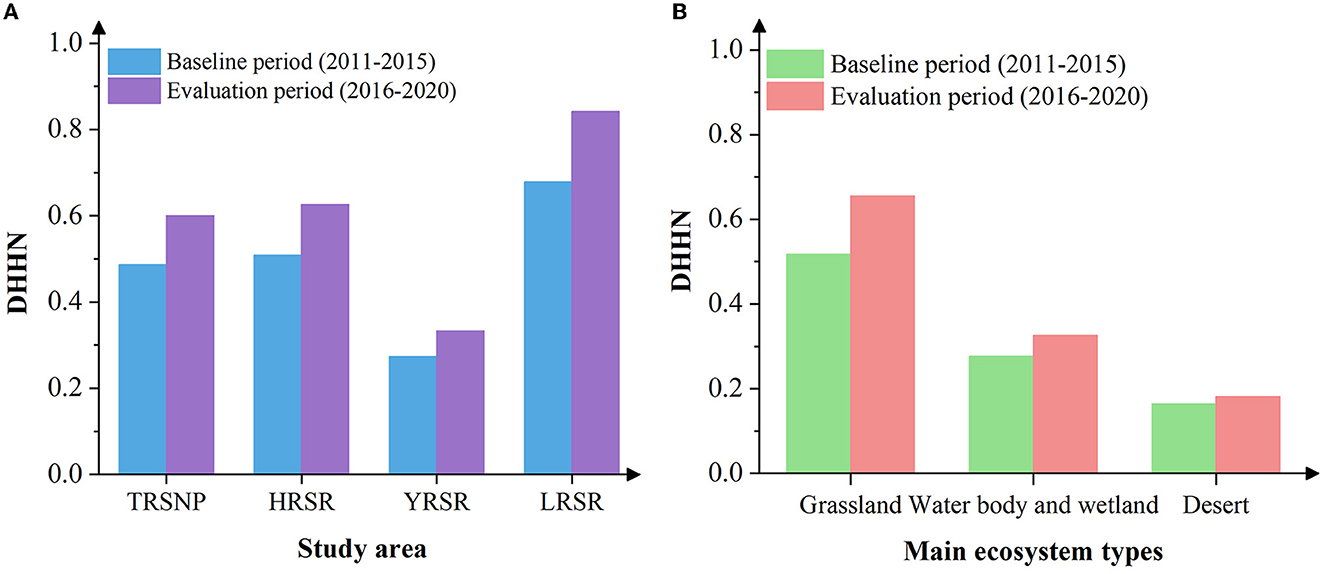
Figure 8. Comparison of the DHHN of different areas (A) and different ecosystem types (B).
From the perspective of the temporal variation, the DHHN of the whole TRSNP evaluation period increased by 23.38% compared with the baseline period. The areas where the DHHN had increased account for 53.87% of the TRSNP and are mainly distributed in the southeast of TRSNP. A total of 36.45% of the area underwent an increase in the range of 5–20% and 17.42% underwent an increase in the range of more than 20%. A total of 37.42% of the areas that have constant DHHN are mainly distributed in the northwest region. The 8.71%, 8.68%, and 0.03% of the areas with reduction are scattered in the northwest of the TRSNP, accounting for −20–5%, and by more than −20%. The growth rate of the DHHN of the YRSR is 21.93% which was mainly distributed in the southeast, while most areas in the northwest show a constant decreasing trend. Many areas that underwent a decrease in DHHN are located in Qumalai. The DHHN of almost the whole area of LRSR had increased and that during the evaluation period was increased by 24.05% compared with the baseline period. The DHHN of the HRSR is 23.26%, the area of comprehensive performance growth gradually decreases, and the areas undergoing constant decrease gradually increase from north to south, among which the DHHN of the Zhaling lake and the Eling Lake decrease significantly (Figure 7C). Among the three main ecosystem types, the grassland ecosystem with the best DHHN has the largest growth rate of 26.55%, the water body and wetland ecosystem types have a growth rate of 17.84%, and the desert ecosystem type with the worst comprehensive performance has the smallest growth rate of 10.84% (Figure 8B).
4. Discussion
4.1. Implications of the spatiotemporal variation characteristics of the EEL, SEL, and DHHN
The assessment of the implementation effectiveness of establishing national parks is often used as a basis for the management organization to make further decisions (Yuh et al., 2019). From the outcomes of the EEL, SEL, and DHHN, the aforementioned three evaluation indicators during the baseline and evaluation periods showed a gradually increasing trend. This shows that the quality of the eco-environment continues to recover and improve, but the socioeconomic and social situation also improves simultaneously. Long-term overgrazing leads to serious grassland degradation, resulting in a loss of biodiversity and ecosystem services (Xin, 2014; Zhang and Jin, 2021). Since 2000, China has undertaken a variety of ecological projects to restore overgrazed and degraded grasslands, maintain forests and wetlands, and restore watershed ecosystem services, i.e., the Letter on Please Consider Establishing the Qinghai Three-River-Source Nature Reserve as Soon as Possible, the Master Plan for the Ecological Protection and Construction of the Three-River-Source Nature Reserve in Qinghai, and the Overall Plan of the Qinghai Three-River-Source National Ecological Protection Comprehensive Experimental Zone. Although research shows that natural factors, such as climate warming have contributed to a certain extent to the improvement of various ecological indicators in the TRSNP, the contribution of humans to improving the harmony between humanity and nature is also crucial (Shao et al., 2016). The greater increase in the combined benefits of the indicators in the southeast region than in the northwest region of the park with more human intervention may also indicate a positive human role. The TRSNP innovatively implements the “one household, one post” ecological management and protection post system, covering all herders in the region. As of 2020, there were 16,621 herdsmen and 17,211 ecological management personnel in the region. The goal of the harmonious coexistence of humanity and nature has made new progress.
We analyzed the spatiotemporal variation characteristics of the EEL, SEL, and DHHN in the TRSNP. The aforementioned three evaluation indicators showed a consistent spatial distribution pattern from the northwest to the southeast in space. The areas with increases in the aforementioned three evaluation indicators were mainly concentrated in the southeast, while those with no change or a decrease were distributed in the northwest of TRSNP. Specifically, the aforementioned three evaluation indicators of the TRSNP are spatially manifested in areas with better social and economic developments and the baseline status and improvements in the ecological environment are also in a better state simultaneously. This is consistent with Liu et al. (2021) conclusion that the intensity of anthropogenic disturbance and the NDVI, NPP, and GPP of the Three-River-Source region all gradually increased from northwest to southeast. The reason for this result may be that the southwest monsoon of the Indian Ocean can travel northward along the Hengduanshan Mountain canyon up to the southeast of the TRSNP in the summer, making it a relatively humid area with better climatic conditions such as water and heat on the Qinghai–Tibet Plateau and an important distribution area in the alpine meadows. In addition, this region's altitude is lower than that of the northwest, and its ecological environment is in relatively good condition. It belongs to an area with a concentration of farmers and herdsmen. Therefore, the local government and residents pay more attention to improving the ecological environment and socioeconomic conditions. Consequently, a situation of simultaneous preference for the ecological environment, socioeconomic conditions, and improvement of the southeastern part of the TRSNP has been formed.
4.2. Suggestions for the sustainable development of national parks
The result comparisons of the EEL, SEL, and DHHN of the TRSNP during the baseline and evaluation periods show that the levels of the three aspects have increased by more than 20%. The TRSNP has initially completed the pilot task. However, it is worth noting that the absolute value of the three evaluation indicators is not high, especially as the difference between the YRSR and the other two regions is still large. Moreover, some eco-environmental and socioeconomic indicators fluctuate or even decrease. Regarding the eco-environmental indicators, windbreak and sand fixation in the TRSNP during the evaluation period decreased compared to that during the baseline period (Figure 9). Some studies (Cao et al., 2019) also showed that wind erosion prevention in the TRSNP decreased from 2000 to 2015, which may be attributed to the decrease in wind speed in the TRSNP and a decline in vegetation coverage in some areas. In addition, from the collected statistical data, the study found that the GDP growth rate and population growth rate in some years of the socioeconomic indicators also decreased, which may be due to the government's failure to properly coordinate the balanced relationship between the protection of the ecological environment and the socioeconomic development during the early stages of the TRSNP pilot system.
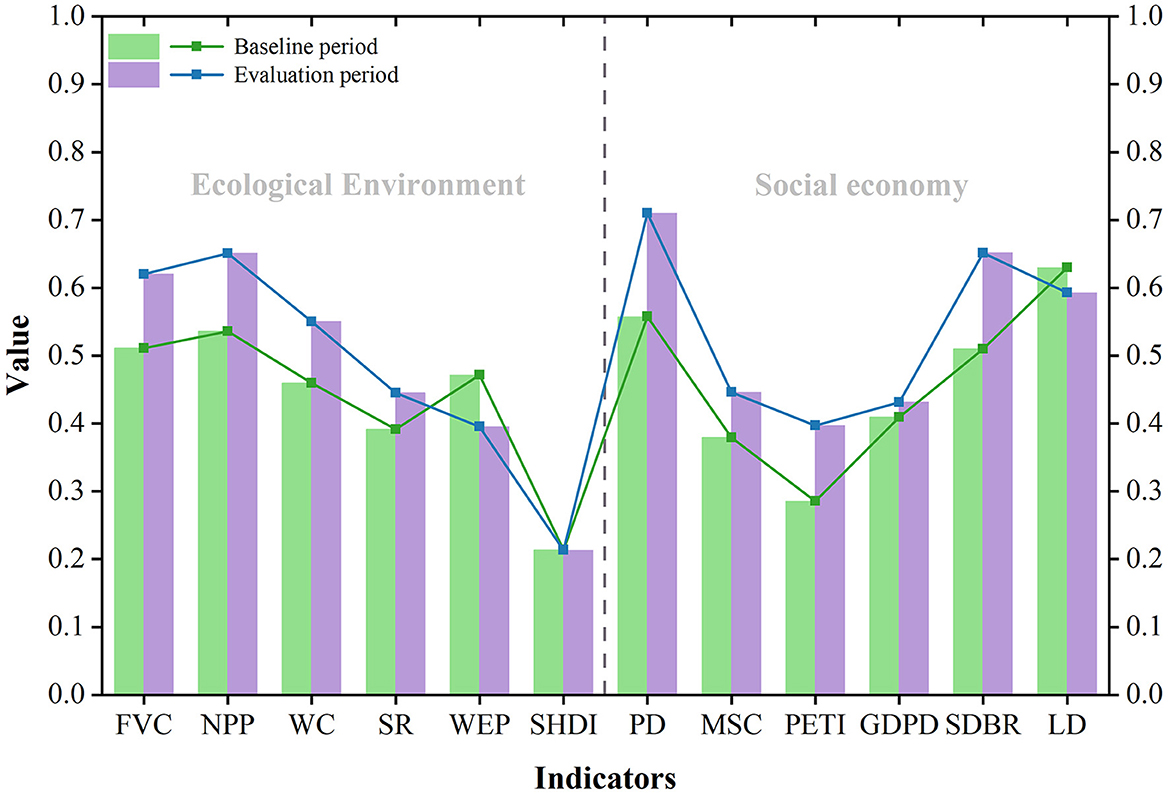
Figure 9. Changes of 12 indicators during the baseline and evaluation periods. Fractional vegetation cover (FVC), net primary productivity (NPP), water conservation (WC), soil retention (SR), wind erosion prevention (WEP), and Shannon's diversity index (SHDI) constitute the ecological environment level. The socioeconomic level includes population density (PD), medical service capacity (MSC), population employed in the tertiary industry (PETI), gross domestic product density (GDPD), savings deposit balance of residents (SDBR), and livestock density (LD).
Thus, it can be seen that the harmonious relationship between humanity and nature needs to be further optimized in this region. The win–win vision of protection and development still requires the joint efforts of all parties, the government, and the residents (Ouyang et al., 2021). Therefore, the construction of the TRSNP still needs continuous investment and persistence. In addition to focusing on the improvement and upgrading of the aforementioned reduced aspects, it is also necessary to take upgrading measures according to different regional developmental conditions. For example, in the YRSR, due to the low absolute EEL value, priority must be given to the protection and regional ecological environment development, especially in the northwest of the region, and appropriate ecological conservation and restoration measures must be taken to improve the region's ecology. In the LRSR, due to the good ecological environment and socioeconomic conditions, it is necessary to carry out pilot programs of innovative development models for national parks under the development requirements, explore new models of coordinated development of the ecological environment and social economy, and provide new ideas and demonstrations for the construction of other national parks. The EEL of the HRSR region was mainly improved, while the SEL decreased significantly. Therefore, it is necessary for this region to carry out industrial transformation and upgrade properly based on the premises of good ecological and environmental protection and fully utilize the TRSNP and its local characteristics, such as characteristic folk culture industries, traditional Chinese medicine, and the Tibetan medicine industry.
The advantages of the local eco-environment can also be optimized by developing the ecological experience industry and effectively improving the socioeconomic situation of the TRSNP and the wellbeing of the people. For the entire TRSNP, since one of the ultimate goals of national park construction is to promote the harmonious coexistence of man and nature, both the ecological protection and the socioeconomic development of TRSNP must be pursued. On the one hand, managers must continuously improve and innovate existing systems and mechanisms, including optimizing ecological management and protection post mechanisms, wildlife accident compensation mechanisms, and hierarchical management systems and mechanisms. Local governments should always take the construction of laws and regulations as the core and constantly explore new models of harmonious coexistence of humanity and nature. On the other hand, the development of TRSNP should be more integrated into the scientific and technological support system, create a “cloud” platform for data sharing, improve the “integration of heaven and earth” ecological environment monitoring and evaluation system and the data integration and sharing mechanism, promote information interaction, and lead regional development with science and technology.
4.3. Limitations and future perspectives
Previous evaluations often focused on the livelihood of ecological migrants, including a wide range of socioeconomic issues (Xin et al., 2016; Feng, 2017; Ma et al., 2021) or the alpine fragile ecological rating index system, in which the indicators measuring vegetation and climate fit with this study, and also include the indicators of population and livestock population (Yu and Lu, 2011). To achieve the goal of a comprehensive evaluation, this study not only selected the ecological index system that fits well with the index system for assessing the ecological effectiveness of the Three-River-Source ecological protection and construction project (Shao et al., 2016) but also considered the aspects of population, resources, environment, and economy (Cheng and Shen, 2000). In addition, the results of the study were more consistent compared to other relevant studies (Shao et al., 2016; Cao et al., 2019). However, considering the importance of biodiversity conservation in national parks, the evaluation index system constructed in this study is yet to include wild animals and plant species because of the limitations in data acquisition. Next, the boundary of the TRSNP does not coincide with the county administrative boundaries. Although this study successfully rostered the eco-environment and socioeconomic indicators to a scale of 1 × 1 km, indeterminacy may still remain. In addition, upon analyzing the results, the current study focuses on the macro-benefit analysis of the ecological environment and social economy and there are deficiencies in the spatial presentation and data analysis of the changes in the microindices.
Furthermore, due to the limitations of statistical data disclosure and access, this study currently selects the decade from 2011 to 2020 as the time series of the study, which is illustrative but may not be statistically significant. Meanwhile, ecological and social projects implemented before 2011 also have an impact on the degree of harmony between human and nature, and hence, the choice of 5 years as the reference period may affect the accuracy of the results. Subsequently, based on the more open and accurate data of the TRSNP, related research can build a more comprehensive index system with various aspects of the ecological environment and social economy and continuously improve the scientificity and accuracy of the evaluation of the construction effect of the TRSNP.
5. Conclusion
In this study, we examined the goals of balancing ecological conservation and human activity in national parks and propose a quantitative model to assess the degree of harmony between humanity and nature for the construction of national parks. Using the inversion model and the spatial analysis method, the pattern of the evolution characteristics of the DHHN from 2011 to 2020 were comparatively analyzed. The research shows that the DHHN showed a trend of gradual increase from the northwest to the southeast. Compared with the pilot baseline period (2011–2015), the DHHN of the TRSNP has been greatly improved during the evaluation period (2016–2020), especially in the southeast. It indicates that the pilot national park has initially achieved the goal of balancing protection and development. However, while the DHHN has improved, some indicators of the TRSNP also fluctuate or even decline. Consequently, it is necessary to propose suitable models for protection and development and focus on coordinating and balancing the contradiction between eco-environmental protection and socioeconomic development by following the specific conditions of each region. It is committed to achieving the sustained improvement of the ecological environment, the harmonious coexistence of humanity and nature, and the sustainable development of the TRSNP. This study better enriches the relevant evaluation research on the TRSNP system pilot and also provides a good reference value for the exploration and construction of a national park system in China. We are currently applying this methodology to the TRSNP and extending the time span of the study for quantitatively evaluating the effectiveness of establishing the national park system.
Data availability statement
The raw data supporting the conclusions of this article will be made available by the authors, without undue reservation.
Author contributions
YG: data curation, investigation, methodology, and writing—original draft. XiaojL: investigation, conceptualization, and supervision. XiaohL: resources and supervision. JZ: resources, supervision, and funding acquisition. HZ: resources, visualization, supervision, validation, and funding acquisition. JF: methodology and supervision. NK: review, editing, and analysis. JM: visualization and methodology. All authors contributed to the article and approved the submitted version.
Funding
This study was supported by the National Key Research and Development Program (2021YFD1300501), the Second Tibetan Plateau Scientific Expedition Program (2019QZKK0608), the Remote Sensing Mapping of the Geological Interpretation Base Map of the Lancang-Mekong River Region (300012000000212171), the Strategic Priority Research Program A of the Chinese Academy of Sciences (XDA20090200), and the National Natural Science Foundation of China (42007429).
Acknowledgments
We are very grateful to the experts who put forward suggestions for the measurement of indicator weight. We also would like to express our sincere thanks to reviewers for their valuable comments.
Conflict of interest
The authors declare that the research was conducted in the absence of any commercial or financial relationships that could be construed as a potential conflict of interest.
Publisher's note
All claims expressed in this article are solely those of the authors and do not necessarily represent those of their affiliated organizations, or those of the publisher, the editors and the reviewers. Any product that may be evaluated in this article, or claim that may be made by its manufacturer, is not guaranteed or endorsed by the publisher.
Supplementary material
The Supplementary Material for this article can be found online at: https://www.frontiersin.org/articles/10.3389/fevo.2023.1121189/full#supplementary-material
References
An, L. T., Markowski, J., Bartos, M., Rzenca, A., and Namiecinski, P. (2019). An evaluation of destination attractiveness for nature-based tourism: recommendations for the management of national parks in Vietnam. Nat. Conservat. 32, 51–80. doi: 10.3897/natureconservation.32.30753
Cao, W., Liu, L. L., Wu, D., and Huang, L. (2019). Spatial and temporal variations and the importance of hierarchy of ecosystem functions in the Three-river-source National Park. Acta Ecologica Sinica. 39, 1361–1374. doi: 10.5846/stxb201807311629
Chang, J. E., and Jiang, T. L. (2007). Research on the weight of coefficient through analytic hierarchy process. J. Wuhan Univ. Technol. Mater. Sci. Ed. 1, 153–156.
Chen, D. J., Zhong, L. S., and Xiao, L. L. (2020). Construction and empirical analysis of the suitability evaluation of study travel development in national park. Acta Ecologica Sinica. 40, 7222–7230. doi: 10.5846/stxb201904300887
Chen, M. X., Lu, D. D., and Zhang, H. (2009). Comprehensive evaluation and the driving factors of china's urbanization. Acta Geographica Sinica. 64, 387–398.
Chen, W. Y. (2019). Research on Comprehensive Performance Evaluation of Z Power Supply Branch of Jiangxi Power Grid. Jiangxi: East China University of Technology.
Cheng, S. K., and Shen, L. (2000). Approach to dynamic relationship between population resources environment and development of the Qinghai-Tibet Plateau. J. Natural Res. 15, 297–304.
Ding, L. Z., Xu, G. F., Lu, J. B., Zhang, D. S., and Huang, B. F. (2005). Landscape fragmentation and its effect on biodiversity. Forest Sci. Technol. 32, 45–49. doi: 10.3969/j.issn.1001-7380.2005.04.017
Ding, X., Chong, X., Bao, Z., Xue, Y., and Zhang, S. (2017). Fuzzy comprehensive assessment method based on the entropy weight method and its application in the water environmental safety evaluation of the Heshangshan drinking water source area, three gorges reservoir area, China. Water. 9, 329. doi: 10.3390/w9050329
Fan, J. W., Shao, Q. Q., Wang, J. B., Chen, Z. Q., and Zhong, H. P. (2011). An analysis of temporal-spatial dynamics of grazing pressure on grassland in three rivers headwater region. Chinese J. Plant Ecol. 33, 64–72.
Feng, W. H. (2017). Study on Ecological Migration in the Source Area of Three Rivers. Beijing, China: Party School of the CPC Central Committee.
Fu, M. D., Liu, W. W., Li, B. Y., Ren, Y. H., Li, S., Bai, X., et al. (2021). Construction and application of an evaluation index system for ecological and environmental protection effectiveness of national parks. Chin. J. Appl. Ecol. 40, 4109–4118. doi: 10.13292/j.1000-4890.202112.023
Gao, J. L., Hao, Y. G., Ding, G. D., Liu, F., Xin, Z. M., Xu, J., et al. (2013). Primary assessment on the wind-breaking and sand-fixing function of the vegetation and its value in Ulan Buh desert ecosystem. J. Arid Land. 27, 41–46. doi: 10.13448/j.cnki.jalre.2013.12.008
General Office of the CPC Central Committee (2017). General plan for establishing national park system. Available online at: http://www.gov.cn/gongbao/content/2017/content_5232358.htm (accessed September 26, 2017).
Gong, S. H., Xiao, Y., Zheng, H., Xiao, Y., and Ouyang, Z. Y. (2017). Spatial patterns of ecosystem water conservation in China and its impact factors analysis. Acta Ecologica Sinica. 37, 2455–2462. doi: 10.5846/stxb201512012406
Gorenflo, L. J., Suzanne, R., Mittermeier, R. A., and Walker-Painemilla, K. (2012). Co-occurrence of linguistic and biological diversity in biodiversity hotspots and high biodiversity wilderness areas. PNAS. 109, 8032–8037. doi: 10.1073/pnas.1117511109
Heiland, S., May, A., and Scherfose, V. (2020). Evaluation of the management effectiveness of german national parks—experiences, results, lessons learned and future prospects. Sustainability. 12, 7135. doi: 10.3390/su12177135
Hu, S., Cao, M. M., Liu, Q., Zhang, T. Q., Qiu, H. Y., Liu, W., et al. (2014). Comparative study on the soil conservation function of InVEST model under different perspectives. Geographical Res. 33, 2393–2406. doi: 10.11821/dlyj201412016
Huang, X. Y. (2017). Ecosystem Health Assessment and Ecological co-mpensation standards for the Comprehensive Test Areas of Sanjiangyuan National Natural Reserve. Qinghai: Qinghai Normal University.
Jia, H. C., Cao, C. X., Ma, G. R., Bao, D. M., Wu, X. B., Xu, M., et al. (2011). Assessment of wetland ecosystem health in the source region of yangtze, yellow and yalu Tsangpo Rivers of Qinghai Province. Wetland Sci. 9, 209−217. doi: 10.13248/j.cnki.wetlandsci.2011.03.001
Jiang, Y. F., Tian, J., Zhao, J. B., and Tang, X. P. (2021). The connotation and assessment framework of national park ecosystem integrity: a case study of the Amur Tiger and Leopard National Park. Biodivers. Sci. 29, 1279–1287. doi: 10.17520/biods.2021319
Jiao, W. J., Liu, X. Y., and He, S. Y. (2022). Establishing an ecological monitoring system for national parks in China: a theoretical framework. Ecol. Indic. 143, 109414. doi: 10.1016/j.ecolind.2022.109414
Juffe-Bignoli, D., Burgess, N. D., Bingham, H., Belle, E., Lima, M. D., Deguignet, M., et al. (2014). Protected Planet Report 2014: Tracking progress towards global targets for protected areas. Cambridge: UNEP-WCMC.
Li, C. L., and Cong, L. (2021). Research on the legislative dilemma and restrictive factors of national park law in China Based on Delphi method. Chin. Landscape Architect. 37, 104–108. doi: 10.19775/j.cla.2021.05.0104
Li, L., Lin, H. L., and Gao, Y. (2016). Emergy analysis of the value of grassland ecosystem services in the Three Rivers Source Region. Acta Pratacultu-rae Sinica. 25, 34–41. doi: 10.11686/cyxb2015387
Liang, Y. J., and Xu, Z. M. (2013). A case study in Ganzhou District, Zhan-gye municipality. J. Glaciol. Geocryol. 35, 249–254. doi: 10.7522/j.issn.1000-0240.2013.0030
Liu, D. P., Oouyang, Z. Y., Zhang, Y. J., Zou, H. F., Zhong, L. S., Xu, J. L., et al. (2021). Development of natural protected areas in China: opportunities and challenges. Nat. Protect. Areas. 1, 1–12.
Liu, J. Y., Kuang, W. H., and Zhang, Z. X. (2014). Spatiotemporal characteristics, patterns and causes of land use changes in China since the late 1980s. Acta Geographica Sinica. 69, 3–14. doi: 10.1007/s11442-014-1082-6
Liu, S. S. (2008). The Influence of Population Density on the Development Level of Tertiary Industry. Guangdong: Sun Yat-sen University,.
Lu, J. H., and Li, X. (2018). Comprehensive evaluation model of national park based on grey clustering. Forestry Econ. 40, 22–27. doi: 10.13843/j.cnki.lyjj.2018.05.004
Ma, K., Shen, X., Grumbine, R. E., and Corlett, R. (2017). China's biodiversity conservation research in progress. Biol. Conserv. 210, 1–2. doi: 10.1016/j.biocon.2017.05.029
Ma, T., Min, Q. W., Xu, K., and Sang, W. G. (2021). Resident willingness to pay for ecotourism resources and associated factors in Sanjiangyuan National Park, China. J. Res. Ecol. 12, 693–706. doi: 10.5814/j.issn.1674-764x.2021.05.012
Meng, P., Wang, L., and Zhao, Y. C. (2018). Ecological sensitivity in national park planning in the Beijing-Tianjin-Hebei region. Forest Res. Manag. 2, 98–124. doi: 10.13466/j.cnki.lyzygl.2018.02.016
Meng, Y., and Chen, W. K. (2019). Evaluation of National Park Residents' livelihood resilience in developing countries–a case study of the Giant Panda National Park, China. Basic Clin. Pharmacol. Toxicol. 125, 83–84.
Mu, S. J., Li, J. L., Chen, Y. Z., Gang, C. C., Zhou, W., and Ju, W. M. (2012). Spatial differences of variations of vegetation coverage in inner Mongolia during 2001-2010. Acta Geographica Sinica. 67, 1255–1268. doi: 10.11821/xb201209010
National Development Reform Commission (NDRC) (2018). Master plan of Three-River-Source National Park. Available online at: http://www.gov.cn/xinwen/2018-01/17/content_5257568.htm (accessed January 12, 2018).
Nchor, A., and Ogogo, A. (2013). Rapid assessment of protected area pressures and threats in nigeria national parks. Global J. Agricultural Sci. 11, 63–72. doi: 10.4314/gjass.v11i2.1
Ouyang, Z. Y., Song, C. S., Zheng, H., Polasky, S., Xiao, Y., Bateman, I. J., et al. (2020). Using gross ecosystem product (GEP) to value nature in decision making. Proc Natl Acad Sci USA. 117, 14593–14601. doi: 10.1073/pnas.1911439117
Ouyang, Z. Y., Xu, W. H., and Zang, Z. H. (2021). Suggestions on improving the management system of national parks. Biodivers Sci. 29, 272–274. doi: 10.17520/biods.2021083
Qiao, Y. X., Zhu, H. Z., Shao, X. M., and Zhong, H. P. (2017). Research on gridding of livestock spatial density based on multi-source information. Sci. China Technol. Sci. 49, 53–59.
Ren, H., and Guo, Z. (2021). Progress and prospect of biodiversity conservation in China. Ecol.Sci. 40, 247–252.
Ren, H., Qin, H., Ouyang, Z., Wen, X. Y., Jin, X. H., Liu, H., et al. (2019). Progress of implementation on the Global Strategy for Plant Conservation in (2011–2020) China. Biol. Conserv. 230, 169–178. doi: 10.1016/j.biocon.2018.12.030
Rennie, A. (2006). The importance of national parks to nation-building: support for the National Parks Act (2000) in the Scottish Parliament. Scottish Geograph. J. 122, 223–232. doi: 10.1080/00369220601100091
Rudnicki, A., Shivatzki, S., Beyer, L. A., Takada, Y., Raphael, Y., Bovo, R., et al. (2005). Assessment of National Park Management Effectiveness: A Case Study of Khao Yai National Park. Thailand: Proceedings of 43rd Kasetsart University Annual Conference. p. 449–460.
Shang, T. T., and Cao, Y. K. (2019). The evaluation and analysis on sustainable livelihoods of residents in Northeast Tiger and Leopard National Park. Forest. Econ. 41, 17–22. doi: 10.13843/j.cnki.lyjj.2019.10.003
Shao, Q. Q., Fan, J. W., Liu, J. Y., Huang, L., Cao, W., Xu, X. L., et al. (2016). Assessment on the effects of the first-stage ecological conservation and restoration project in Sanjiangyuan region. Acta Geographica Sinica. 71, 3–20. doi: 10.11821/dlxb201601001
Su, X. Y. (2019). Ecological Health Assessment of Sanjiangyuan National Park. Qinghai: Qinghai Normal University.
Tang, F. L., Zhang, J. C., Yang, Y. M., and Wang, M. J. (2010). Study on evaluation system of National Park. Ecol. Environ. Sci. 19, 2993–2999. doi: 10.16258/j.cnki.1674-5906.2010.12.026
Wei, W., Zhang, K., and Zhou, J. (2020). Review and prospect of human-land relationship in Three River Headwaters Region: based on the perspective of people, events, time and space. Adv. Earth Sci. 35, 26–37. doi: 10.11867/j.issn.1001-8166.2020.010
Wu, X., Liu, F. G., Liu, L. S., Liu, F., and Caixiang, C. M. (2021). Changes and spatial characteristics of livestock population in Tibetan Plateau. Ecol. Sci. 40, 38–47.
Wu, X. Y. (2011). The influences of population density on the developmental level of tertiary industry: an empirical analysis from China. J. Foshan Uni. 29, 37–40. doi: 10.3969/j.issn.1008-018X.2011.03.009
Xiao, L. L., Zhong, L. S., Yu, H., and Zhou, R. (2019). Assessment of recreational use suitability of Qianjiangyuan National Park Pilot under the zoning constraints. Acta Ecologica Sinica. 39, 1375–1384. doi: 10.5846/stxb201808241811
Xie, Y. Y., Zhou, N. X., Ma, H. H., and Ma, Z. F. (2018). Spatial distribution characteristics and influencing factors of health services in China. J. Cent. South Univ (Natural Sciences). 52, 713–722. doi: 10.19603/j.cnki.1000-1190.2018.05.019
Xin, R. P., Han, Z. Q., and Li, W. B. (2016). A study on the livelihoods of ecological migrant families at the source of three rivers: based on the field survey in Yushu, Qinghai. J. Gansu Univ. 01, 119–126.
Xin, Y. (2014). The degradation trend of natural grassland in Qinghai Province. Qinghai Pratacult. 23, 46–53.
Xinhua News Agency (2022). Report of The 20th National Congress of the Communist Party of China (CPC). Available online at: http://www.gov.cn/xinwen/2022-10/25/content_5721685.htm (accessed October 10, 2022).
Xue, D., and Zhang, Y. (2019). Achievement and outlook of biodiversity conservation in China. Environ. Protect. 47, 38–42.
Yang, C. Y. (2022). A study of international experience in national park construction: the case of French National Parks. City. 2022, 18–24.
Yang, Q. Z., Li, T. T., Wang, Z. X., Lin, L. Q., Peng, Q. Q., Lin, B. J., et al. (2017). Integrated assessment on ecological sensitivity for Shennongjia National Park. J. Hubei Uni. (Natural Science). 39, 455–461. doi: 10.3969/j.issn.1000-2375.2017.05.004
Yang, Z. J., and Zhu, Y. (2016). Study on the effectiveness evaluation and countermeasure of zoning management of Meili Snow Mountain National Park. Ecol. Econ. 32, 201–204. doi: 10.3969/j.issn.1671-4407.2016.10.043
Yu, B. H., and Lu, C. H. (2011). Assessment of ecological vulnerability on the Tibetan Plateau. Geograph. Res. 30, 2289–2295.
Yu, P., Zhang, J. H., Wang, Y. R., Wang, C., and Zhang, H. M. (2020). Can tourism development enhance livelihood capitals of rural households? Evidence from Huangshan National Park adjacent communities, China. Sci. Total Environ. 748, 141099. doi: 10.1016/j.scitotenv.2020.141099
Yuh, Y. G., Dongmo, Z. N., N'Goran, P. K., Ekodeck, H., Mengamenya, A., Kuehl, H., et al. (2019). Effects of land cover change on great apes distribution at the Lobéké National Park and its surrounding forest management units, South-East Cameroon. a 13 year time series analysis. Sci Rep. 9, 1445. doi: 10.1038/s41598-018-36225-2
Zhang, L. X., Fan, J. W., Shan, Q. Q., Tang, F. P., Zhang, H. Y., and Li, Y. Z. (2014). Changes in grassland yield and grazing pressure in the Three Rivers headwater region before and after the implementation of the eco-restoration project. Acta Prataculturae Sinica. 23, 116–123.
Zhang, M. S., Zhou, Y. Q., and Sheng, M. Y. (2022). Thoughts and suggestions on the establishment of nature reserve system withnational park as the main body. Ecol. Sci. 41, 237–247. doi: 10.14108/j.cnki.1008-8873.2022.06.028
Zhang, X., and Jin, X. (2021). Vegetation dynamics and responses to climate change and anthropogenic activities in the Three-River Headwaters Region, China. Ecol. Indic. 131, 108223. doi: 10.1016/j.ecolind.2021.108223
Zhang, Y., and Zhang, C. N. (2019). Evaluation of ecosystem cultural services in Qilian Mountain National Park, Qinghai Province. Environ. Protect. 47, 56–60. doi: 10.14026/j.cnki.0253-9705.2019.14.012
Zhao, X. J. (2019). Construction of China's National Park Management System. Social Scientist. 07, 70−74.
Zhao, X. Q. (2021). The five integrative management strategies of Sanjiangyuan National Park. Biodiversity Science. 29, 301–303. doi: 10.17520/biods.2021023
Zhao, X. Q., Chen, X. J., and Xian, Y. J. (2020). Dialogue: the value of Sanjiangyuan National Park. Man Biosphere. 1, 44–49. doi: 10.3969/j.issn.1009-1661.2020.04.010
Zhao, Z. C., and Yang, R. (2021). The concept of national park authenticity and integrity in China and its evaluation framework. Biodiver. Sci. 29, 1271–1278. doi: 10.17520/biods.2021287
Zhou, K., Liu, H. C., Fan, J., and Yu, H. (2021). Environmental stress intensity of human activities and its spatial effects in the Qinghai-Tibet Plateau national park cluster: a case study in Sanjiangyuan region. Acta Ecologica Sinica. 41, 268–279. doi: 10.5846/stxb202003310766
Zhu, H. G., Zhao, M. H., Chen, Y. R., and Zhang, Y. T. (2022). Community governance in national parks: international experience and enlightenment. World Forest. Res. 35, 1–6. doi: 10.13348/j.cnki.sjlyyj.2022.0072.y
Zhu, J. M., and Cheng, F. Y. (2016). Study on the determinants of chinese residents' savings deposit balance. Econ. Vision. 2, 58–67. doi: 10.3969/j.issn.1672-3309(s).2016.02.08
Keywords: harmony between humanity and nature, quantitative assessment, nature reserve, sustainable development, Three-River-Source National Park
Citation: Guo Y, Liu X, Liu X, Zhang J, Zhang H, Fan J, Khan N and Ma J (2023) Quantitative assessment of the degree of harmony between humanity and nature for national parks in China: A case study of the Three-River-Source National Park. Front. Ecol. Evol. 11:1121189. doi: 10.3389/fevo.2023.1121189
Received: 11 December 2022; Accepted: 06 February 2023;
Published: 02 March 2023.
Edited by:
Huadan Zheng, Jinan University, ChinaReviewed by:
Chong Jiang, Guangdong Provincial Academy of Chinese Medical Sciences, ChinaYongchun Zhou, Northeastern University, China
Copyright © 2023 Guo, Liu, Liu, Zhang, Zhang, Fan, Khan and Ma. This is an open-access article distributed under the terms of the Creative Commons Attribution License (CC BY). The use, distribution or reproduction in other forums is permitted, provided the original author(s) and the copyright owner(s) are credited and that the original publication in this journal is cited, in accordance with accepted academic practice. No use, distribution or reproduction is permitted which does not comply with these terms.
*Correspondence: Jiahong Zhang, emhhbmdqaWFob25nQG1haWwuY2dzLmdvdi5jbg==; Haiyan Zhang, emhhbmdoYWl5YW5AaWdzbnJyLmFjLmNu
†These authors have contributed equally to this work