
94% of researchers rate our articles as excellent or good
Learn more about the work of our research integrity team to safeguard the quality of each article we publish.
Find out more
ORIGINAL RESEARCH article
Front. Ecol. Evol. , 14 March 2023
Sec. Environmental Informatics and Remote Sensing
Volume 11 - 2023 | https://doi.org/10.3389/fevo.2023.1116484
This article is part of the Research Topic Remote Sensing Advances in Biodiversity and Ecosystem Functioning Research View all 12 articles
 Changwen Wei1†
 Kai Su1*†
 Xuebing Jiang2
 Yongfa You3Xiangbei Zhou1Zhu Yu4Zhongchao Chen5Zhihong Liao1Yiming Zhang1Luying Wang1
Research on synergies and trade-offs between ecosystem services (ES) contributes to a better understanding of the linkages between ecosystem functions. Relevant research mainly focuses on mountain areas, while research in arid areas is obviously insufficient. In this research, we use the northern sand-stabilization belt (NSB) as an example to explore how the synergies and trade-offs between different ES vary with the gradient of precipitation and fractional vegetation cover (FVC) over the period 2000-2020. Based on five simulated ecosystem services (habitat provision, sand-stabilization service, water conservation service, soil conservation service and carbon sequestration service), the Pearson correlation coefficient method was used to analyze the various characteristics of the trade-offs and synergies among the different ES pairs along the FVC and precipitation gradients. Results showed that: Synergies between most paired ES increased significantly with increasing precipitation and FVC. However, ES have different sensitivities to environmental change, FVC promotes bit more synergy of ES pairs than precipitation. The study also found that land use/land cover may be an important driving factor for trade-offs and synergies between paired ES. The findings demonstrate that increased precipitation and FVC promote synergy of ecosystem services in arid regions of China. In the future, it can be investigated whether anthropogenic increase in FVC in arid regions can significantly contribute to the synergy of ES. In the meantime, this study could improve our understanding of arid and semi-arid (or macro-regional) ecosystems and contribute to the development of ecosystem management and conservation measures in NSB.
Ecosystem services (ES) are the products, services, and environmental conditions that people derive from ecosystems and are essential to human well-being and survival (Costanza et al., 1997). However, long-term human over-cultivation and grazing have destroyed the self-regulating capacity of the ecological environment (Dumanski and Pieri, 2000). The first to bear the brunt are the arid and semi-arid areas, which are more sensitive to changes. Desertification in arid and semi-arid regions is a serious problem in China (Zhang, 2017). According to the results of the National Desert, Gobi and Sandy Land Survey and Desertification Research, the decertified land area in China in 2011 was 262.2 million km2, representing 27.4% of the land area, and nearly 400 million people were affected by desertification (Fu et al., 2017).
Ecosystem services in arid and semi-arid regions are as valuable as ecosystem services in other regions. Ouyang et al. (2016) evaluated several ES in China, such as windbreak and sand-stabilization service, habitat provision, soil conservation service, and carbon sequestration service and found that arid and semi-arid regions were high-value areas providing various services and the distribution of ecosystem services in arid areas has significant spatial heterogeneity. Although the amount of vegetation in arid and semi-arid regions is much less than that in other areas, the types of vegetation are rich and play an important role in regional ecosystems (Wang et al., 2020; Yixuan et al., 2022). Meanwhile, these ES can generate substantial potential economic benefits. The research results of Su et al. (2020) showed that the sand-stabilization amount of Ordos’s ecosystem was approximately 7.28 tons. The amount of dust-fall in the beneficiary area was reduced by 2.87 tons, and an investment of 4318.51 CNY in dust removal would be avoided. In addition, trade-off and synergy of multiple ecosystem services are also hot research topics at present, but the research mainly focuses on farmland, wetlands, oceans, cities, and other ecosystems. Especially ecosystems that can generate economic benefits, such as farmland and forests (Johns et al., 2014; Loomis and Paterson, 2014; Song and Deng, 2015; Malekmohammadi and Jahanishakib, 2017; Richards and Friess, 2017; Liao et al., 2022). Furthermore, our literature review found that few scholars, such as Fensholt et al. (2012) and Wen et al. (2019), have focused on the assessment of ecosystem services in arid and semi-arid regions, especially studies in megaregions.
However, previous studies have proven that ecosystems are vulnerable to precipitation and climate change, especially grasslands are highly sensitive to changes in precipitation (Knapp and Smith, 2001; Huxman et al., 2004; Heisler-White et al., 2008; Sloat et al., 2018; Gherardi and Sala, 2019). For example, Felton’s study in mesic grassland found that in dry years, increasing growing season precipitation variability reduced rain-use efficiency, thereby reducing ecosystem function by up to 42%, but this effect diminishes as the year gets wetter (Felton et al., 2020). The gradient effect of environmental impact (such as vegetation cover, precipitation, and temperature) has been widely studied in mountainous areas (Su et al., 2007; Deng et al., 2020; Liu et al., 2020). For example, findings of Yu et al. (2021) in the Qinling Mountains showed that net primary productivity, soil conservation, and habitat quality increased significantly with altitude and vegetation coverage gradients, but the effects on water yield and grain production weakened. Liu et al. (2019) found that the precipitation increased in Taihang mountains, the trade-offs between the soil conservation service and net primary production, the water yield and net primary production, habitat quality, and the soil conservation service, and water yield and habitat quality all decreased significantly. The arid and semi-arid regions span the north of China and have obvious horizontal spatial heterogeneity. In the lateral direction, there are horizontal differences in climate, upper soil, and vegetation distribution affected by precipitation, thus forming the horizontal spatial heterogeneity of land use and land cover (farmland, grassland, forest, etc.; Sun et al., 1998; Liu and Ren, 2012; Liu et al., 2014). The special geographical location makes arid and semi-arid regions have obvious gradient characteristics such as mountains, and this characteristic will have a certain impact on ecological processes and lead to changes in the regional ecosystem. The response mechanism of multiple mountain ecosystem services on environmental gradients is basically clear (Yang et al., 2018; Liu et al., 2019; Zhang et al., 2020; Zhou et al., 2021); however, the response of multiple ecosystem services on environmental gradients in arid and semi-arid regions is unclear and lacks in-depth research. An understanding of the impact of precipitation, vegetation cover, and other factors on ecosystem services would improve our knowledge of ecosystem services and develop effective ecological management measures in arid and semi-arid regions.
The northern sand-stabilization belt (NSB) is located mainly in northwest China, and as one of the ecological security barriers in China, the ecological environment in this area plays an important role in stabilizing the current ecological security pattern in northwest China and even the whole county (Su et al., 2020; Zhu et al., 2020; Wang J. et al., 2022). There are also many ecological projects in NSB, such as the Three-North Shelter Forest Program (Huang and Kong, 2016), the Grain for Green Project (Cao et al., 2009), and the Natural Forest Protection Project (Hu and Liu, 2006). These projects protect and improve the habitats of wild animals and play a positive role in water conservation and carbon sequestration (Li et al., 2015). Therefore, the study chooses five ES of sand-stabilization service, habitat provision, water conservation service, soil conservation service, and carbon sequestration service, which were selected as research objects.
Using meteorological, soil, remote sensing, and land use data, we aimed to quantify the ES in NSB, including soil conservation service, habitat provision, carbon sequestration service, water conservation service, and sand-stabilization service. Based on the image-by-image spatial correlation analysis method-Pearson product–moment correlation coefficient method, this study intends to address the following questions: (1) What are the synergies and trade-offs between different ES? (2) How does the synergy and trade-off between different ES change with the gradient of precipitation and FVC? (3) Which synergy or trade-off are more influenced by precipitation or FVC? Clarifying the trade-offs and synergy between ES on these environmental gradients can provide data and information to support scientific research and policy formulation in addressing climate change, implementing ecological and environmental protection, achieving sustainable development, and ensuring food security.
The NSB is a long and thin belt across northern China (Figure 1A), located in the transition zone between arid and semi-arid areas, divided into three sections from west to east, the Tarim Basin sand-stabilization belt (TB), the Hexi Corridor sand-stabilization belt (HC), and the Inner Mongolia sand-stabilization belt (IM). With a total area of 869,558.5 km2. The slope of the study area ranges from 0 to 55 degrees, with the larger slopes concentrated in the northern part of the TB, the HC, and the partial eastern part of the IM. The mean annual precipitation of around 300 mm, with a significant precipitation gradient (Zhang, 2017). The mean annual temperature ranges from −1.9 to 13.5°C. The average wind speed of sand-raising is about 6.5–8.0 m/s. The average wind speed of sand-raising is larger in the middle and smaller in the west and east. FVC increases gradually from west to east. The vegetation types are desert grassland, steppe, forest grassland, forest meadow grassland, scrub meadow, alpine meadow, coniferous forest, deciduous broadleaved forest, hyper-arid shrubs, semi-shrubs, small shrubs, and semi-trees. The distribution of precipitation is generally uneven and highly variable.
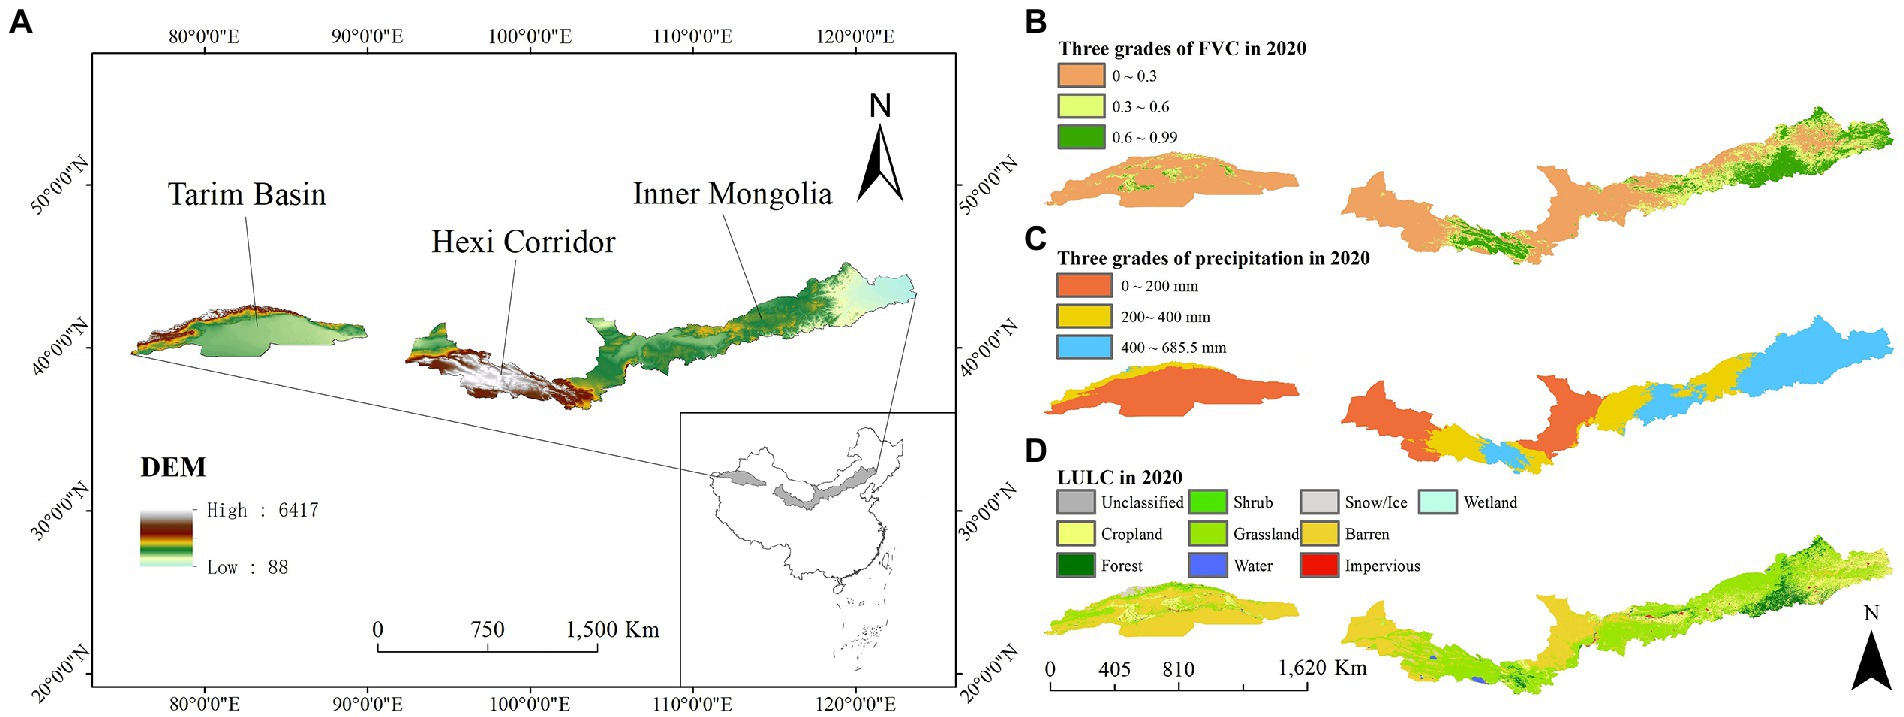
Figure 1. Location of the study area.
We refer to some conventions and classification standards to divide FVC and precipitation gradient. For example, the classification of FVC refers to the Standard for “Soil Erosion Classification and Grading Standards” (SL190-2007) by the Ministry of Water Resources of the People’s Republic of China in 2008. And combined with the actual situation of the study area, the FVC was divided into three classes: FVC<30% (low vegetation cover), 30% ≤ FVC < 60% (medium vegetation cover), FVC ≥ 60% (high vegetation cover; Gao et al., 2015; Figure 1B). According to the convention of annual precipitation division, above 800 mm is the humid zone, 800–400 mm belongs to the semi-humid zone, 400–200 mm belongs to the semi-arid zone, and below 200 mm belongs to the arid zone (Zhang et al., 2011; Gao et al., 2015). The maximum annual precipitation was 685.5 mm in 2020, and most of the study area belongs to the arid zone. For convenience of analysis, this study divides the grades according to the gradient of 0–200, 200–400, and 400 mm<, which accounted for 46.31, 22.76, and 30.93%, respectively, (Figure 1C). The main land use and land cover (LULC) of NSB are grassland and desert (Figure 1D). Demonstrating the spatial distribution pattern of LULC in the belt-shaped study area helps to describe the distribution of ES related to LULC.
Loess plateau science data center, National Earth System Science Data Sharing Infrastructure, National Science & Technology Infrastructure of China,1 including average annual precipitation and temperature (Peng et al., 2019), relative humidity, and hours of sunshine. DEM data with 90 m resolution came from the geospatial data cloud platform of the Computer Network Information Center of the Chinese Academy of Sciences.2 Land cover and FVC data were obtained from MODIS-based land use product extraction.3 The soil dataset is derived from the Harmony World Soil Database_China subset of the National Qinghai-Tibet Plateau/Third Pole Environmental Data Center, which includes soil texture, sandy soils, chalky soils, clays, and organic carbon. The above data came from different platforms, so this study resampled all the raster data to the same image size with Arcgis, and then computed the raster data in Python.
In this study, sand-stabilization service is represented by the sand stabilization amount, which is equal to the difference between the potential wind erosion amount and the actual wind erosion amount. This project uses the revised wind erosion equation (RWEQ) model (Fryrear et al., 2000) to estimate the sand-stabilization service in NSB. The calculation formula is shown below:
where, G is the amount of sand fixation, kg/m2; and are the potential amount of wind erosion and the actual amount of wind erosion, kg/m2; , are the maximum transport capacity of potential soil erosion and actual soil erosion, respectively, kg/m2; , are the critical field lengths for potential and actual soil erosion, respectively, m; x is the distance of maximum wind erosion occurrence in the downwind direction, m; WF for meteorological factors; EF is soil erodibility factor; as soil crust factor; K′ is the surface roughness factor; and COG is the vegetation cover factor.
Soil conservation service is represented by the soil retention amount, which is equal to the difference between the potential soil retention and the actual soil retention. The Universal Soil Loss Equation (USLE) is the most widely used remote sensing quantitative model of soil loss with good practicality and has been applied and practiced in large regional soil conservation studies in China. Therefore, USLE (Pandey et al., 2007) was selected to assess soil conservation services in NSB ecosystems for this project. The calculation formula is shown below:
where, for soil retention, ; and are the potential soil erosion and actual soil erosion, respectively, ; is the rainfall erosion force factor, ; K is the soil erodibility factor, ; LS and COG are topography factor and vegetation cover factor, respectively, and are dimensionless. The calculation process for the different factors is shown below:
where, R is the multi-year average annual rainfall erosion force, ; semimonthly k is the rainfall erosion force of the kth semimonthly, ; k for 24 and a half months of the year, i.e., k = 1,2,…,24; i is the year of the used rainfall information, i.e., i = 1,2,…,n; j is the number of days of erosive rainfall days in the kth half month of the i-th year, i.e., j = 1,2,…,m; is the j-th erosive daily rainfall in the k-th half month of year i(mm); is a parameter with = 0.3937 in the warm season and = 0.3101 in the cold season.
where, , , , and are the clay grain (<0.002 mm), powder grain (0.002–0.05 mm), sand grain (0.05–2 mm), and organic carbon, %, respectively.
where, L is the slope length factor; S is the slope factor; m is the slope length index, is the slope,°; and is the slope length, m.
The vegetation cover factor can have a positive effect on controlling soil erosion, between 0 and 1. The larger vegetation coverage factor (COG) value, the poorer the vegetation cover and the weaker the soil retaining effect; the smaller the COG value, the better the vegetation cover and the stronger the soil retaining effect. The magnitude of the vegetation cover factor depends on the combined effect of ecosystem type and vegetation cover, and should theoretically be obtained through experimental observation calculations. However, the existing assessment practice has basically formed two camps of considering only the ecosystem type and considering only the vegetation cover, and it is unscientific to ignore either the influence of vegetation cover or the influence of ecosystem type. Therefore, the vegetation cover factors were assigned according to the difference of ecosystem types and the level of vegetation cover by combining remote sensing parameter inversion and field positioning observation. As the ecosystem types involved in this project are grassland, forest and shrub, the values were assigned according to the different levels of vegetation cover, taking into account expert knowledge and previous research experience (Wang and Jiao, 1996; Zhang et al., 2017; Table 1).
where, c is the vegetation cover in fractional form.

Table 1. C values of different land cover types.
The water conservation service was calculated using the balance equation of water quantity (Zhang et al., 2001), which treats the water service as precipitation minus evapotranspiration and storm runoff. The calculation index includes annual precipitation, annual evapotranspiration, and annual stormwater production volume. The water balance equation is calculated as follows:
where, WR is the water-bearing capacity, mm; PET is the annual precipitation, mm; QF is the storm water runoff, mm. is the actual evapotranspiration, mm.
The calculation of the main indicator factors required for the calculation of the water conservation services is shown below:
Spatial distribution data pre-processing: using weather station data as the basis, the daily weather data are accumulated to the annual scale and then interpolated to the space using ArcGIS spatial interpolation method.
Here, the actual evapotranspiration is calculated using the Zhang model based on the Budyko hydrothermal equilibrium assumption, the main formula of which is shown below:
where, is actual evapotranspiration; P is rainfall; w is the water use coefficient for a particular land use type; PET is potential evapotranspiration, mm. The calculation equation is as follows:
where, SR is the monthly average total solar radiation of each month, ; DT is the monthly average temperature of each month, °C.
Stormwater runoff is calculated using precipitation multiplied by runoff coefficients, where the extent to which different land use types respond to precipitation varies.
where, P is rainfall, mm; 𝛼 is the surface runoff coefficient for different land use/cover types (Table 2).
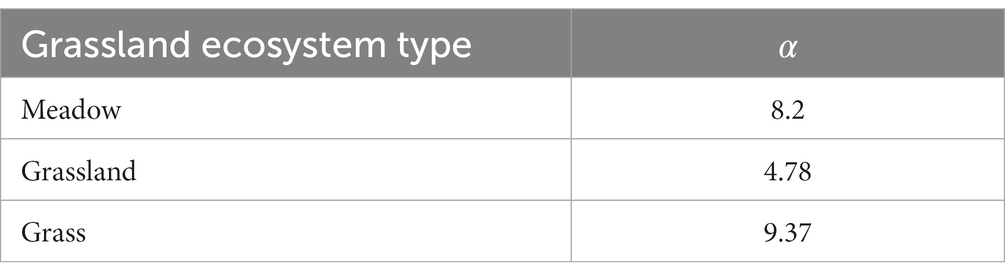
Table 2. Surface runoff coefficients for different grassland types.
Carbon sequestration service is calculated using aboveground biomass multiplied by the biomass-carbon conversion coefficient (Fang et al., 2001; Piao et al., 2009). The main calculation formula is as follows:
where 𝐶O𝑆 is the above-ground carbon stock of terrestrial ecosystems. i is the i-th type of ecosystem; j is the total number of ecosystem types; 𝐴𝐺𝐵𝑖 is the aboveground biomass of the ith ecosystem type; and 𝐶𝑖 is the biomass-carbon conversion coefficient for ecosystem type i.
Reflected by the biological habitat quality index, the regional biodiversity was evaluated in this project mainly in terms of regional habitat quality and habitat scarcity, which were obtained using the INVEST model calculation (Aneseyee et al., 2020; Wu et al., 2021). The calculation formula is as follows:
where, is the total stress level of raster x in LULC or habitat type j; is the weight of the stressor, indicating the relative destructive power of a given stressor on all habitats; is the reachability level of the raster x; is the sensitivity of habitat type j to stress factor r. If = 0, then is not a function of threat r; is the stress factor in raster y; is the stress effect of the stress factor r in raster x on raster y. The stress effect is divided into linear decay and exponential decay. is the linear distance between the raster x and y. is the maximum action distance of the threat r.
where is the scarcity of the raster x; is the number of grids of current land use and land cover j. is the number of LULC type j grids in the baseline landscape pattern. is a binary number, = 1 when the raster x is of LULC type j, otherwise is 0.
Synergies between two ES occur when an enhancement of one ES leads to an increase in another ES (Bennett et al., 2009). While, Trade-offs between two ES occur when one ES is promoted at the expense of the other (Rodriguez et al., 2006). In addition to trade-offs and synergies, there is also a neutral category, which means that an increase in one ES does not result in an increase or decrease in the other. A negative correlation coefficient for two ES that passes the significance test is considered a trade-off, while a positive correlation coefficient that passes the significance test is considered a synergy relationship (Jopke et al., 2015). NSB is composed of three sub-barriers. A certain ES has spatial heterogeneity in each sub-barrier, and this spatial distribution pattern may produce trade-offs and synergies in the whole area. Therefore, this paper used pixel-by-pixel (resampling to align the raster) spatial correlation analysis to calculate the correlation coefficients between ES pairs for five periods from 2000 to 2020 in the study area and conducts significance tests (Figure 2).
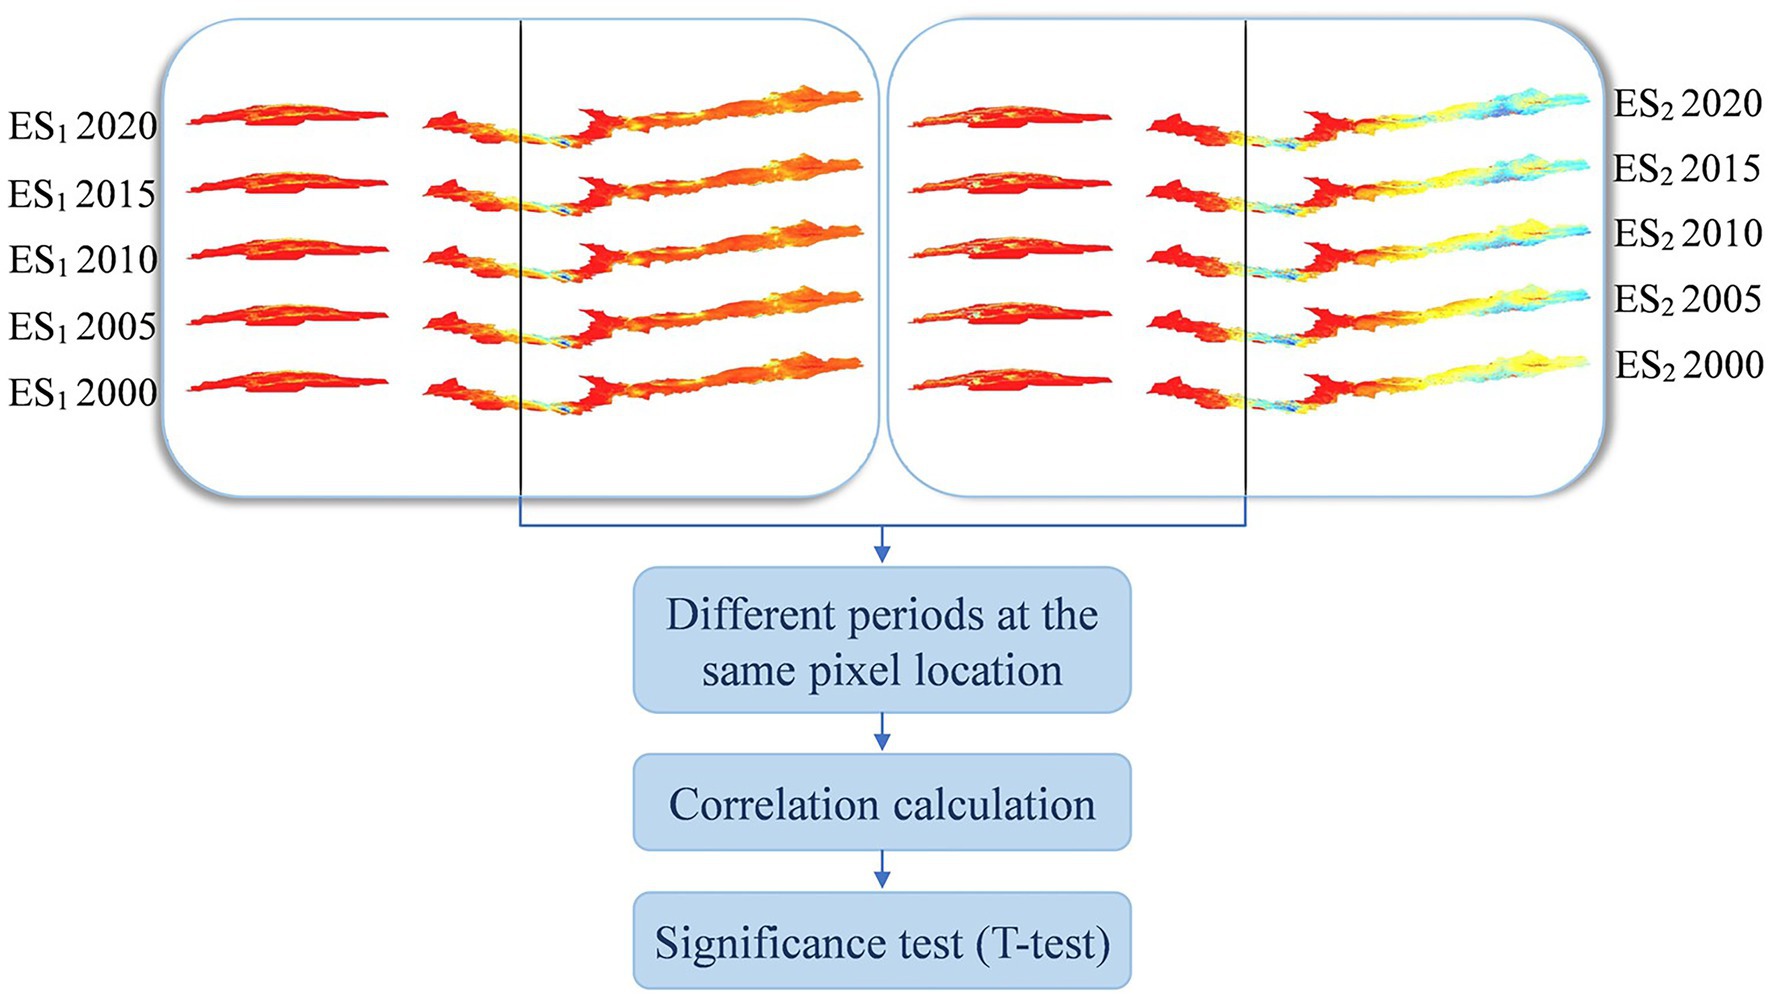
Figure 2. Technical processes of the correlation calculation.
Based on the pixel-by-pixel spatial correlation analysis is method-Pearson product–moment correlation coefficient method (Mukaka, 2012). The correlation coefficients between the two groups of ES were calculated separately, and the trade-offs and synergies between the ES were measured based on the positive and negative correlation coefficients and the absolute magnitude of the relationship. The formula is as follows:
where, R is the correlation coefficient, if R is positive, the relationship between two services is synergistic, and vice versa is a trade-off. If R is zero, there is no relationship, and a larger absolute value indicates a stronger correlation, i.e., a greater degree of synergy or trade-off. x and y are the two ES variables; i is the i-th year.
Significance of trade-offs and synergies between ES determined by t-test (Niu et al., 2022). The formula is as follows:
The significance of the interrelationships between ES was judged based on the null hypothesis test t-test of the correlation coefficient. When ∣T∣ < T0.05, 3, i.e., p > 0.05, the original hypothesis is valid and the correlation result is not significant. When T0.05, 3 ≤ ∣T∣<T0.01, 3, i.e., 0.01<p ≤ 0.05, rejection of the original hypothesis and more significant correlation results. When ∣T∣ ≥ T0.01, 3, i.e., p ≤ 0.01, the original hypothesis was rejected and the correlation result was highly significant.
Figure 3 shows the spatial distribution of ES. High values of soil conservation service are clustered in the southern part of IM, while low values of soil conservation service are mainly distributed in the west and the plains between HC and IM. Not only the forests and grasslands in eastern IM and eastern HC, but also parts of the cropland in TB show a high carbon sequestration supply. The lower carbon sequestration service supply is mainly found in the TB and desert areas at both ends of the HC. The high sand-stabilization service is distributed in the northern part of IM and the grassland between IM and HC, and the rest of the area had low sand-stabilization service values. The high habitat provision values are mainly distributed in the eastern part of HC where the elevation changes are dramatic, and low habitat provision is generally distributed in grassland and desert areas. The water conservation service in the study area is generally small, but the values of the water conservation service are high in lakes and high-altitude mountain areas.
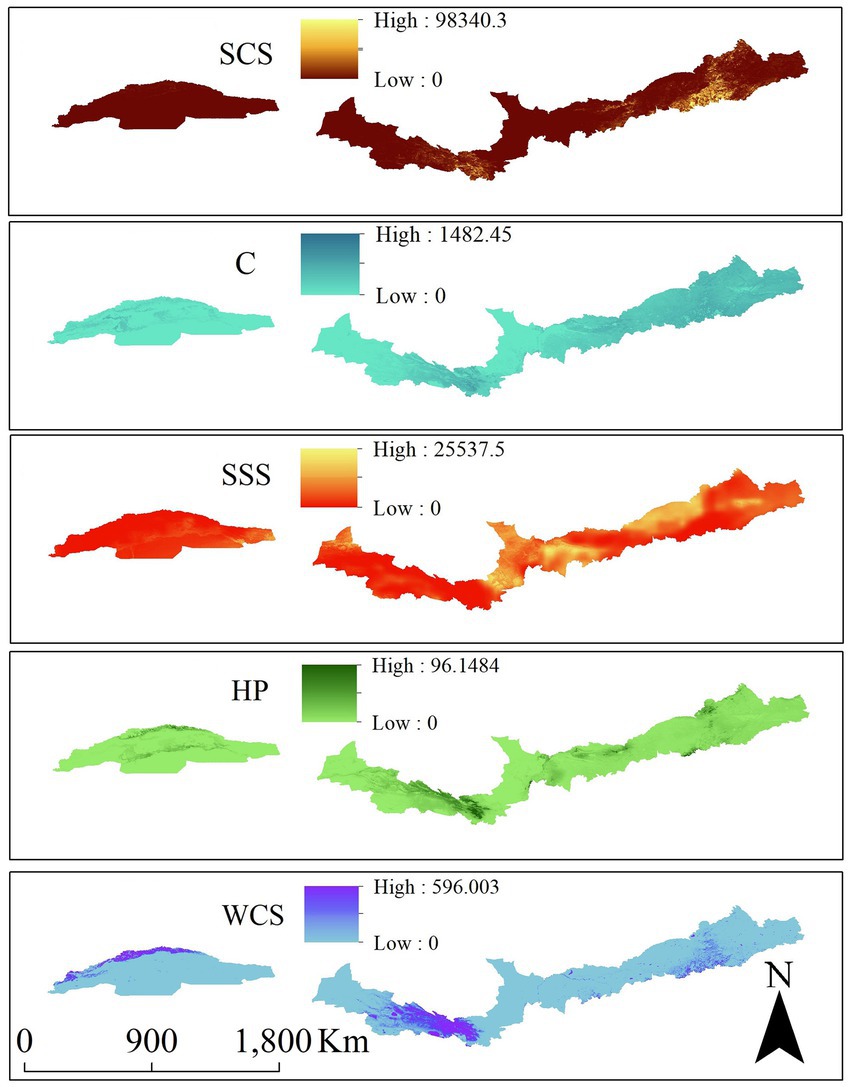
Figure 3. Spatial distribution of the carbon sequestration service (C, t/km2·a), sand-stabilization service (SSS, t/km2·a), water conservation service (WCS, t/km2·a), soil conservation service (SCS, t/km2·a), and habitat provision (HP, the value is scaled by a factor of 100) in the NSB.
The distribution of five ES in the study area is inhomogeneous, showing obvious differences in the precipitation gradient and the FVC gradient. We made statistics on the distribution of precipitation gradient, as shown in Figure 4. 33.80–78.10% of the total amount of the five ES are mainly distributed in areas with precipitation greater than 400 mm, followed by areas with precipitation of 200–400 mm. The areas with precipitation in the range of 0–200 mm are the least, accounting for 4.43–33.80% of the total amount of ES. It shows that ES increases with increased precipitation. Figure 5 shows the distribution of five ES across the FVC gradient, which is not obvious compared to the distribution characteristics of the precipitation gradient. The total distribution of habitat provision and carbon sequestration service in the three gradients is basically the same. The soil conservation service is mainly distributed in areas of FVC greater than 0.6. On the contrary, sand-stabilization service and water conservation service are mainly distributed in areas with FVC less than 0.3. From the perspective of ES per unit area, except soil conservation service and water conservation service, other ES increases with the increase of FVC. When the FVC range is 0.3–0.6, the soil conservation service and water conservation service per unit area reach the maximum.
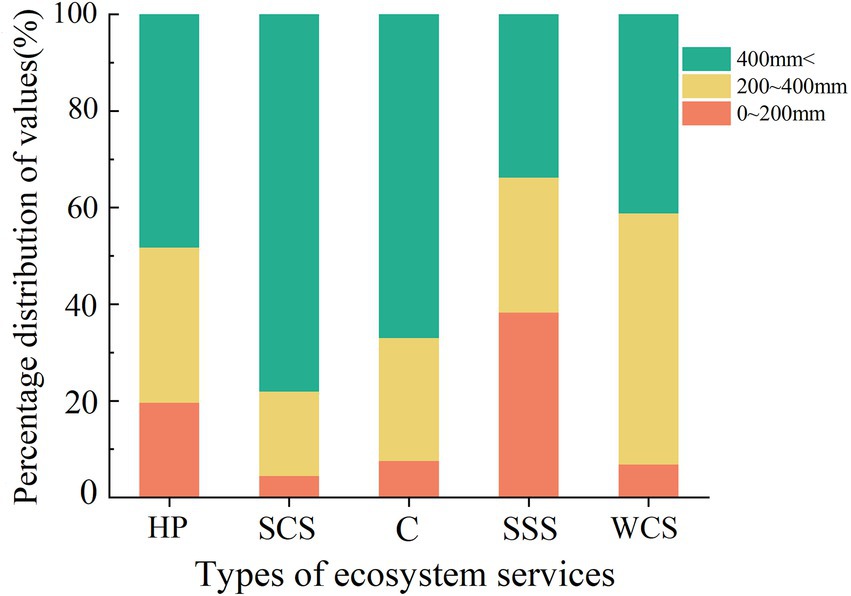
Figure 4. Spatial distribution pattern of the precipitation gradient.
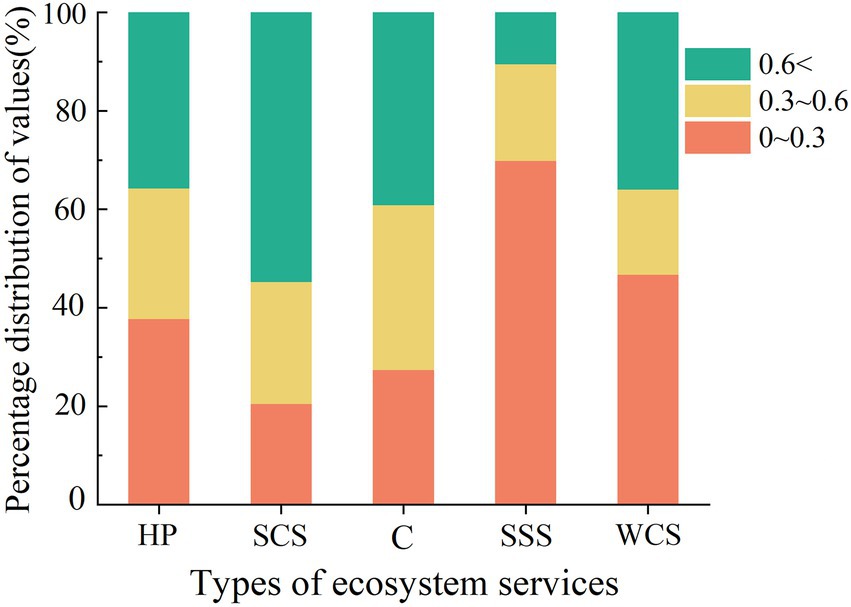
Figure 5. Spatial distribution pattern of fractional vegetation cover (FVC).
Figure 6 shows the areas where synergies and trade-offs occur between the five ecosystem services. As shown in Table 3. The synergy between sand-stabilization service and habitat provision accounts for 86.67% of the study area, and the significant synergy accounts for 49.08% of the study area. Synergy, especially significant synergy, is widely distributed in the study area, but the trade-off area only accounts for 2.73%. The significant synergy/trade-off between sand-stabilization service and soil conservation service is staggered in the east of IM, and the significant synergy area (13.54%) is larger than the significant trade-off area (3.91%). The area of trade-off between soil conservation service and habitat provision is the largest among the 10 relationships (34.52%), mainly distributed in HC and TB areas with weak trade-off relationship. The synergy between sand-stabilization service and carbon sequestration service accounts for 43.52% of the study area, and the remarkable synergy is clustered and distributed in the east of the study area. The distribution of habitat provision and carbon sequestration service is similar to that of sand-stabilization service and carbon sequestration service. The unconnected relationship with carbon sequestration service and soil conservation service (43.97%) is distributed in the southern part of TB, the western part of HC, the plain between HC and IM, and the land use type is desert. The significant synergy/trade-off relationship are staggered in the eastern part of the study area. The four relationships between sand-stabilization service and water conservation service, carbon sequestration service and water conservation service, soil conservation service and water conservation service, habitat provision, and water conservation service are the relationships between water conservation service and other four ES. Obviously, the relationships including water conservation service services, unrelated relationships all account for more than 75% of the study area. Apart from the forests and grasslands in the middle of HC, the forests and grasslands in the southeast of IM, and the forests and grasslands in the north of TB, unrelated relationships are widely distributed in grasslands and deserts in the study area.
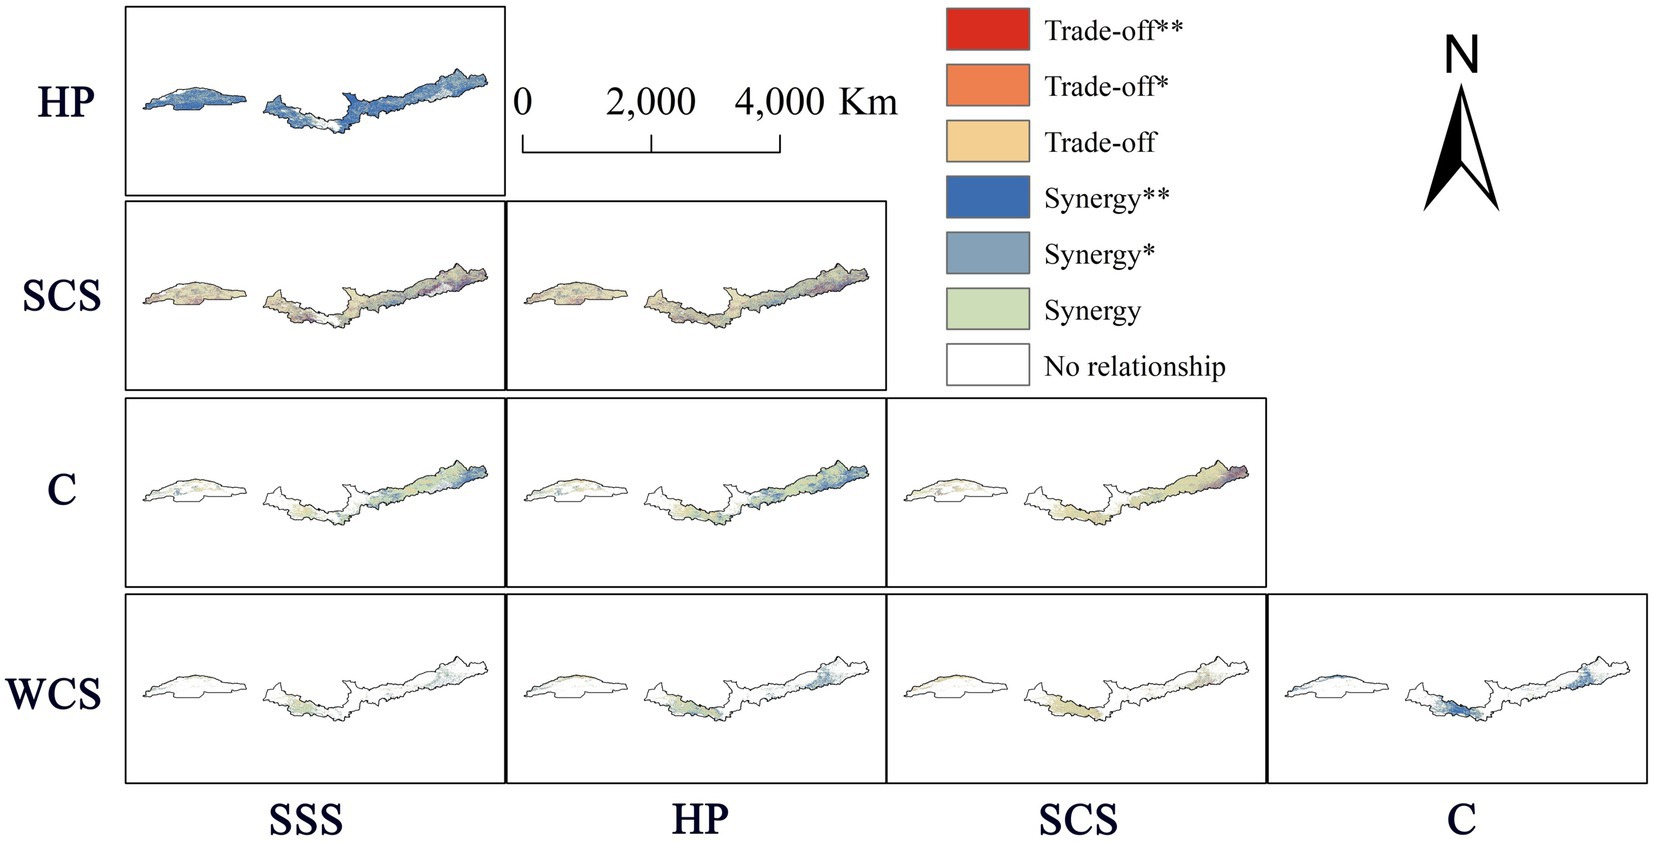
Figure 6. Trade-offs and synergistic salience of ecosystem services. *At a level of 0.05 (two-tailed), the correlation is significant; **At a level of 0.01 (two-tailed), the correlation is very significant.
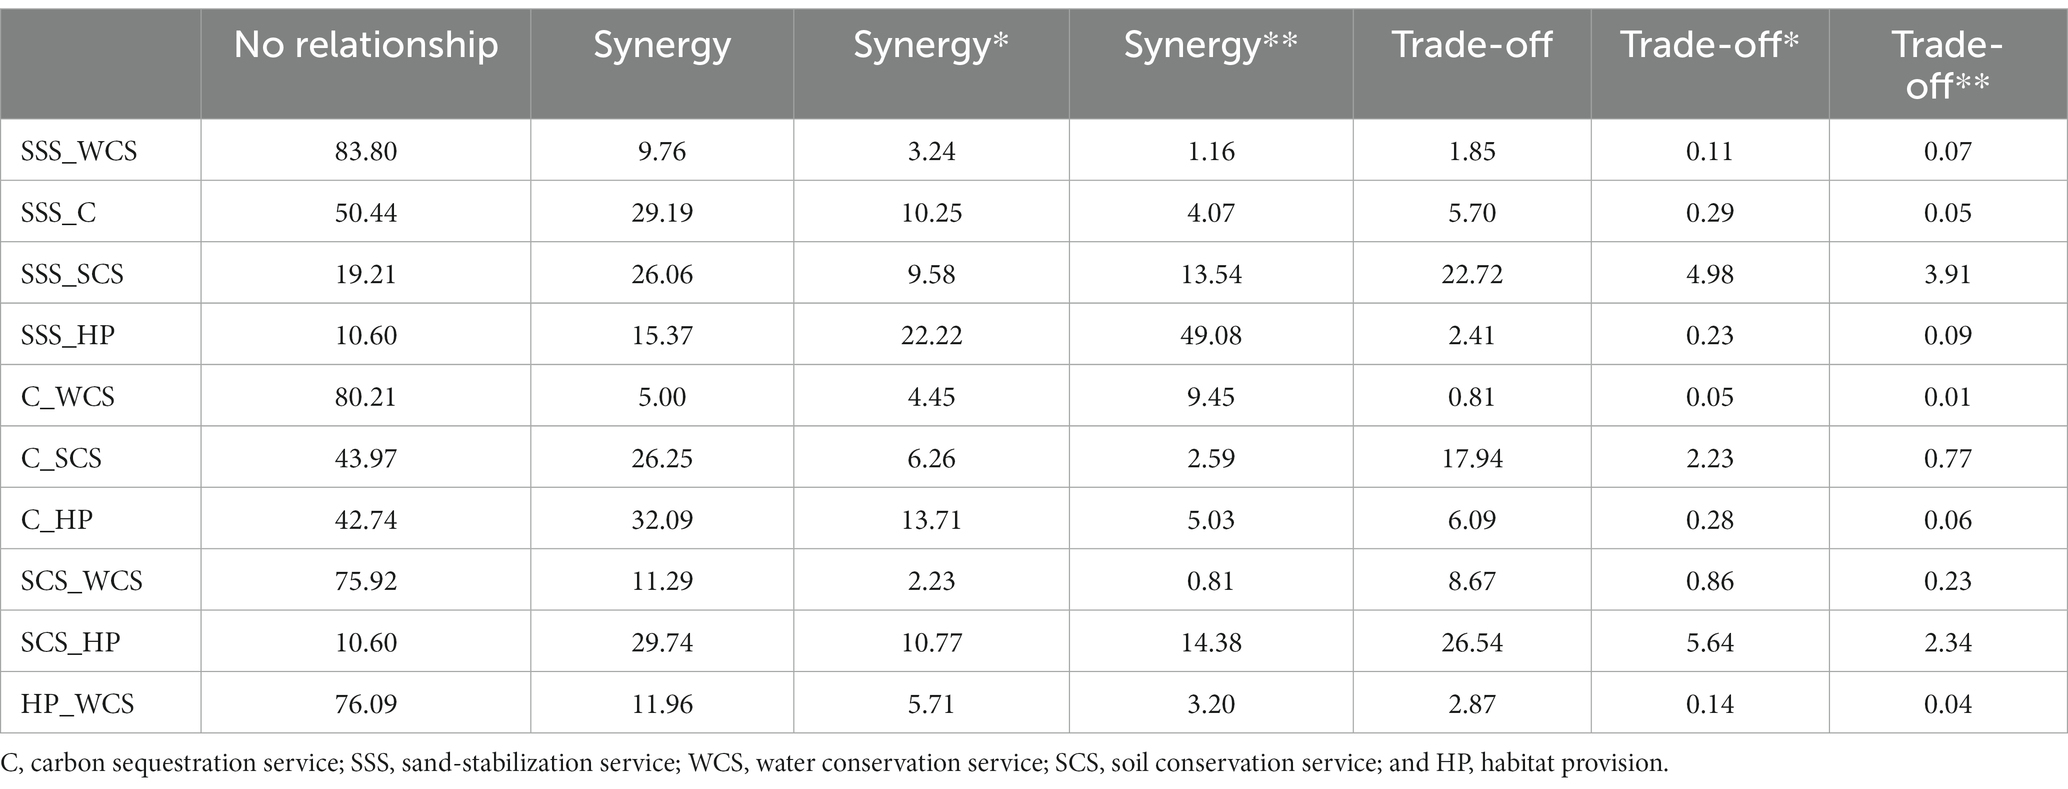
Table 3. Significance of trade-offs and synergies of ecosystem service (%).
Since the unrelated area accounts for most of the total study area, the relationship between the two ES is better captured in terms of the area ratio of synergies to trade-offs when exploring the trade-offs between ES. The ratio of synergy to trade-off between sand-stabilization service and habitat provision was 31.74: 1, and the area of significant synergy represented 49.08% of the total area of the study area. The ratio of synergy to trade-off between carbon sequestration service and water conservation service was 21.53: 1. The area of significant synergy accounted for 9.45% of the total area of the study area, while the area of significant trade-off accounted for only 0.01% of the total area of the study area. In terms of the area ratio of synergy to trade-off, the synergy area was greater than the trade-off area in all 10 ES pairs, with an average ratio of 8.85:1.
See Figures 7, 8. As precipitation increased, trade-offs and synergies between 10 paired ES increased, while their trade-offs decreased. Specifically, the synergies between soil conservation service and habitat provision, sand-stabilization service and habitat provision, and sand-stabilization service and soil conservation service all exceeded 80% of the study area. And their distribution pattern was consistent with the precipitation gradient. Trade-offs and synergies between pairs of ES, including water conservation service (habitat provision and water conservation service, soil conservation service and water conservation service, carbon sequestration service and water conservation service, and sand-stabilization service and water conservation service) were mainly distributed in the northern end of TB, central HC, and central and eastern IM, accounting for only 16.21–24.10% of the study area. However, note that the uncorrelated relationships between these paired ES were widely distributed throughout the study area. Nonetheless, the synergies still account for the vast majority in different precipitation gradients, and the synergies between paired ES also increase with the increase of precipitation. For sand-stabilization service and carbon sequestration service, carbon sequestration service and soil conservation service, and carbon sequestration service and habitat provision, the trade-offs and synergies between these ES pairs accounted for about 50–60% of the study area, and again, synergy effects dominate. Similarly, synergies accounted for the majority, which were mainly distributed in IM and scattered in TB and HC. Trade-offs and synergies did not exist in about 40–50% of the areas, which were mainly desert areas. Among the 10 paired ES, sand-stabilization service and water conservation service changed most obviously with the gradient of precipitation. In the annual precipitation range of 0–200 mm, the area ratio of trade-offs and synergies was 4.23, while in the annual precipitation range of 400 mm <, it reached 24.59. Compared with other paired ES, the synergies of sand-stabilization service and habitat provision accounted for the largest proportion of each gradient area, indicating that in arid and semi-arid regions, increasing biodiversity can promote more sand-stabilization service in ecosystems. In addition, the ES pairs containing soil conservation service had the smallest synergies than other paired ES, indicating that it was more difficult to play the synergy between ES pairs containing soil conservation service than other paired ES, but with the increase of precipitation, this gap will be reduced. Although less than 20% of the regions have trade-offs and synergies between carbon sequestration service and water conservation service, the ratio of synergy and trade-off is close to sand-stabilization service and habitat provision in each precipitation gradient. The study showed that the synergy between ES was greater in areas with more precipitation, and this ratio increased with increasing precipitation.
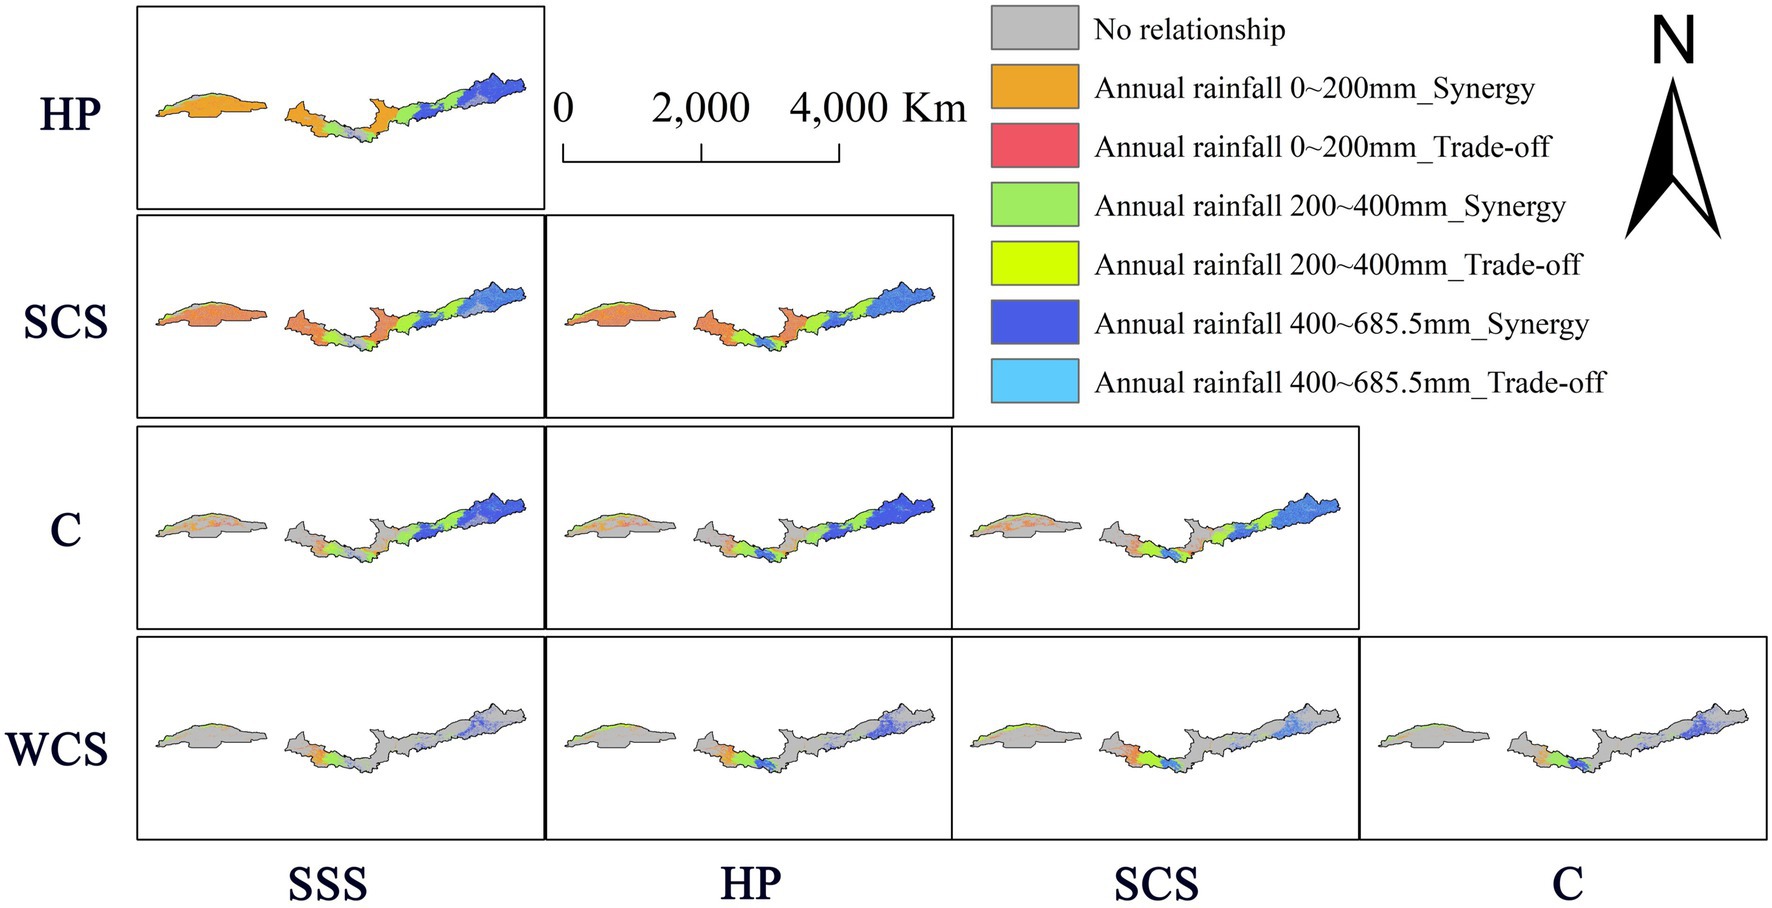
Figure 7. Ecosystem service synergies and trade-offs with precipitation gradients.
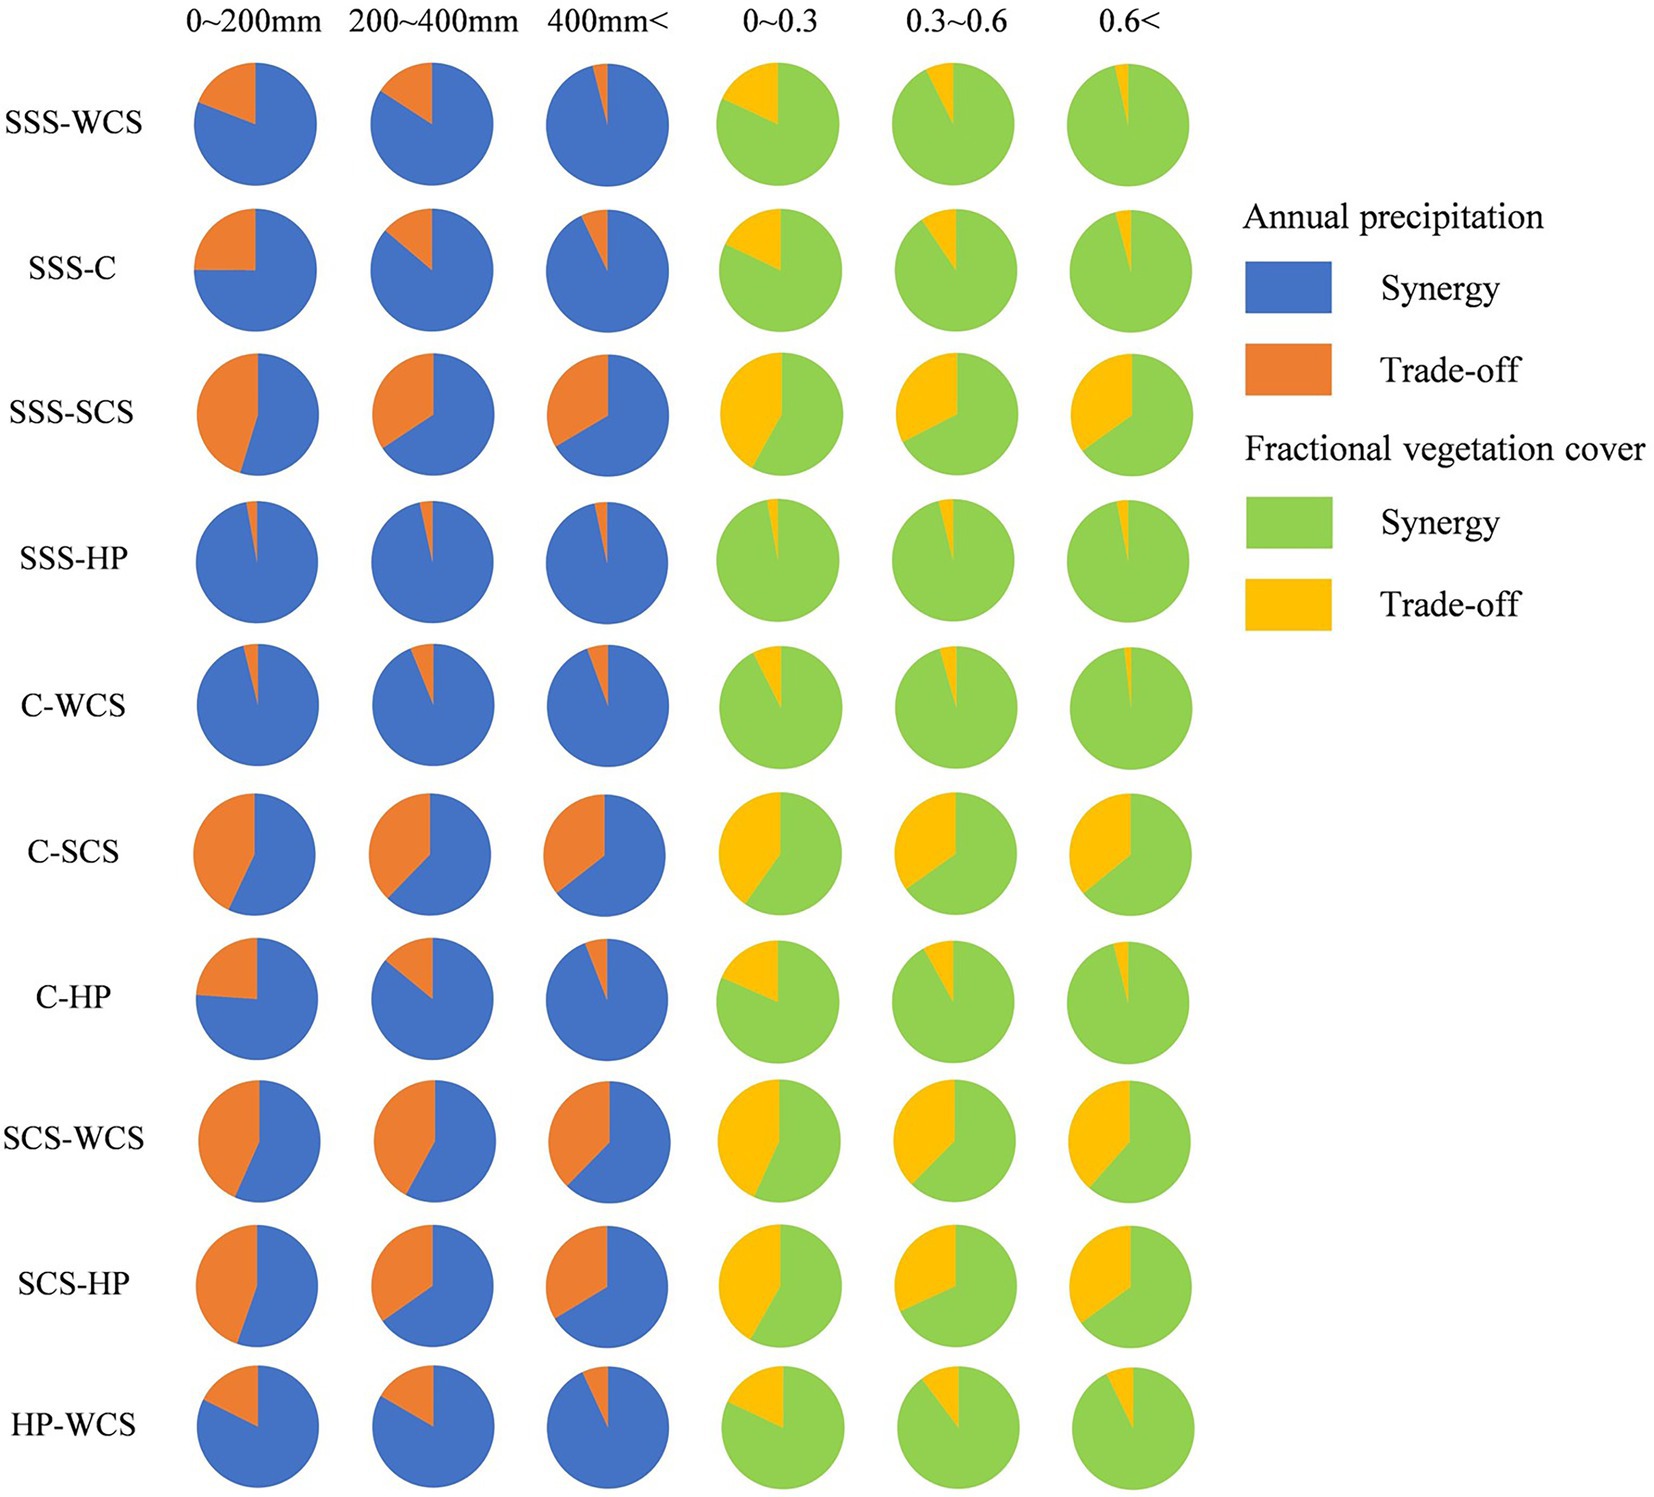
Figure 8. The ratio of synergies to trade-offs at different gradients. SSS-WCS indicates the relationship between sand-stabilization service and water conservation service.
We compared the trade-offs and synergies of ES along the FVC, See Figures 8, 9. Similarly to the change in trade-offs and synergies between paired ES with precipitation gradients, as the FVC increased, the synergies between other paired ES increased except sand-stabilization service and habitat provision. Furthermore, the distribution law of soil conservation service and habitat provision, sand-stabilization service and habitat provision, and sand-stabilization service and soil conservation service, as well as the various characteristics of the trade-offs and synergies with FVC of paired ES containing water conservation service and carbon sequestration service, respectively, were also similar to those between pairs of ES and precipitation gradient. Nonetheless, along the FVC, there were some different regularities in the trade-offs and synergies relationship between paired ES. Compared with other paired ES, the synergy of sand-stabilization service and habitat provision accounted for the largest proportion of each gradient area, indicating that in arid and semi-arid regions, increasing biodiversity can promote more sand-stabilization service in ecosystems. However, FVC had little effect on this synergy, and the synergy of sand-stabilization service and habitat provision did not increase with the increase of FVC. Although less than 20% of the regions had trade-off and synergy between carbon sequestration service and water conservation service, the ratio of synergy and trade-off is close to sand-stabilization service and habitat provision in each FVC gradient. It showed that in areas with low FVC, the synergy between ES was less, with the increase of FVC, its proportion was increasing. However, with the change of FVC, paired ES has a different trend. As FVC increases, the synergy of carbon sequestration service and water conservation service increases. This shows that increasing FVC in arid and semi-arid regions can first increase carbon sequestration, and in some regions can increase water conservation service through synergy effects.
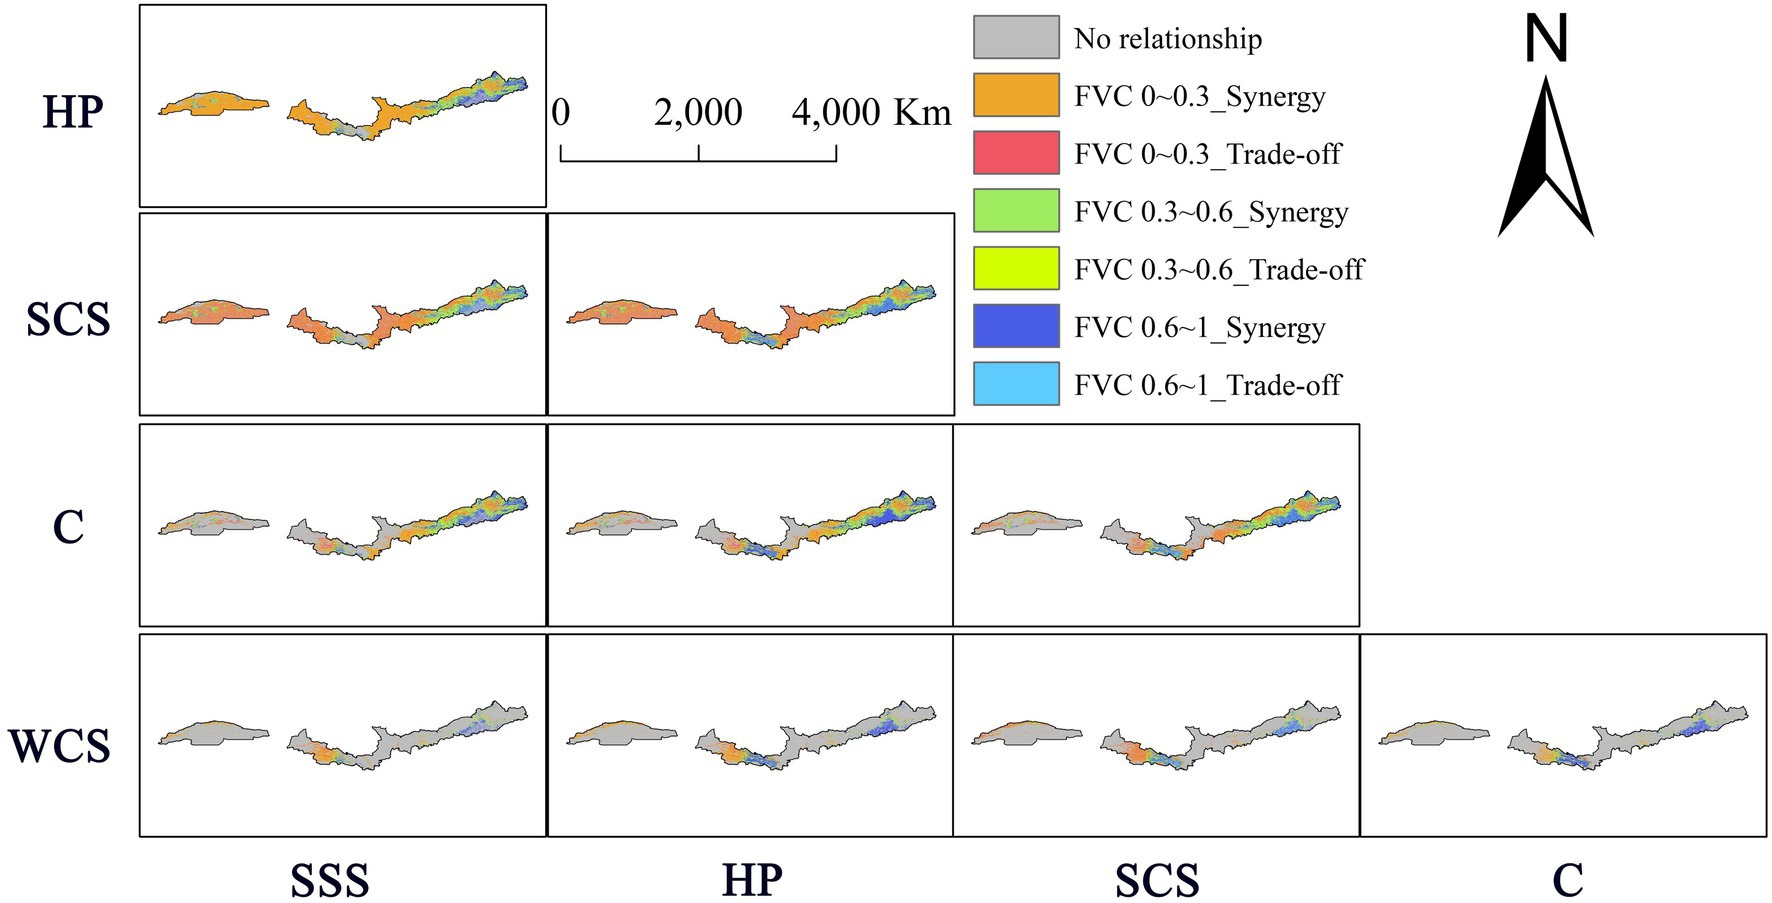
Figure 9. Ecosystem service synergies and trade-offs with changes in fractional vegetation cover gradients.
Previous studies suggest that land use/land cover affect trade-offs and synergies between paired ecosystems (Hasan et al., 2020; Liu et al., 2022). We also investigated the characteristics of the trade-offs and synergies of paired ES across different land uses and land covers (Figure 10). Among the eight land use/land cover, except that the trade-off values of sand-stabilization service and water conservation service and soil conservation service and water conservation service in the impervious is larger, paired ES has been synergy dominant in other land use types. However, the same paired ES differed among different land use types. Contrary to Shao et al. (2020), research that different spaces in the same LULC will have different effects on ES there are also differences in the performance of different ES in the same land use/land cover. The research of Vigl et al. (2017) also shows that land management types and biophysical conditions make the provision of ES unstable. In forests, grasslands, and barrens, sand-stabilization service and habitat provision have greater synergies than other paired ES. This finding has practical implications, suggesting that through anthropogenically increased vegetation cover (i.e., afforestation), similar benefits may be expected for other paired ES, while the synergy of sand-stabilization service and habitat provision may increase more in multiple paired ES. And this result also shows that with the emphasis on biodiversity, sand-stabilization service gains the most synergy from it. This is of great significance to protect wildlife and reduce soil wind erosion. In shrub areas, water conservation service and carbon sequestration service have greater synergy than other paired ES. In semi-arid and arid regions, these types of land use have better hydrothermal conditions, and increasing carbon sequestration service can promote the synergy growth of other ES. The finding is unexpected, but has practical implications, as low shrubs produce more ecological benefits than tall trees in semi-arid and arid regions. Adding low shrubs can first increase carbon sequestration service, and it is beneficial to reduce surface wind speed, reduce wind erosion, and can also increase habitat provision growth through synergy. However, it is more significant that in precipitation-limited arid and semi-arid regions, the transpiration and actual evapotranspiration of low shrubs are lower than those of tall trees (Zhang and Huang, 2013), and low shrubs can produce more water conservation service. Therefore, in arid and semi-arid regions, in an attempt to improve the ecological environment through artificially increased vegetation coverage, appropriate vegetation types should be selected according to the target (the type of ES expected to be improved). For example, in desert-dominated NSB, by improving the sand-stabilization service of the ecosystem to control desert expansion, the choice of planting trees and grasses may reap more benefits. In smaller areas, such as cities, adding shrubs may be more appropriate. Therefore, in order to make better use of the synergistic effect of paired ES and improve the ecological environment, the trade-off between trees/grass and shrubs is very important.
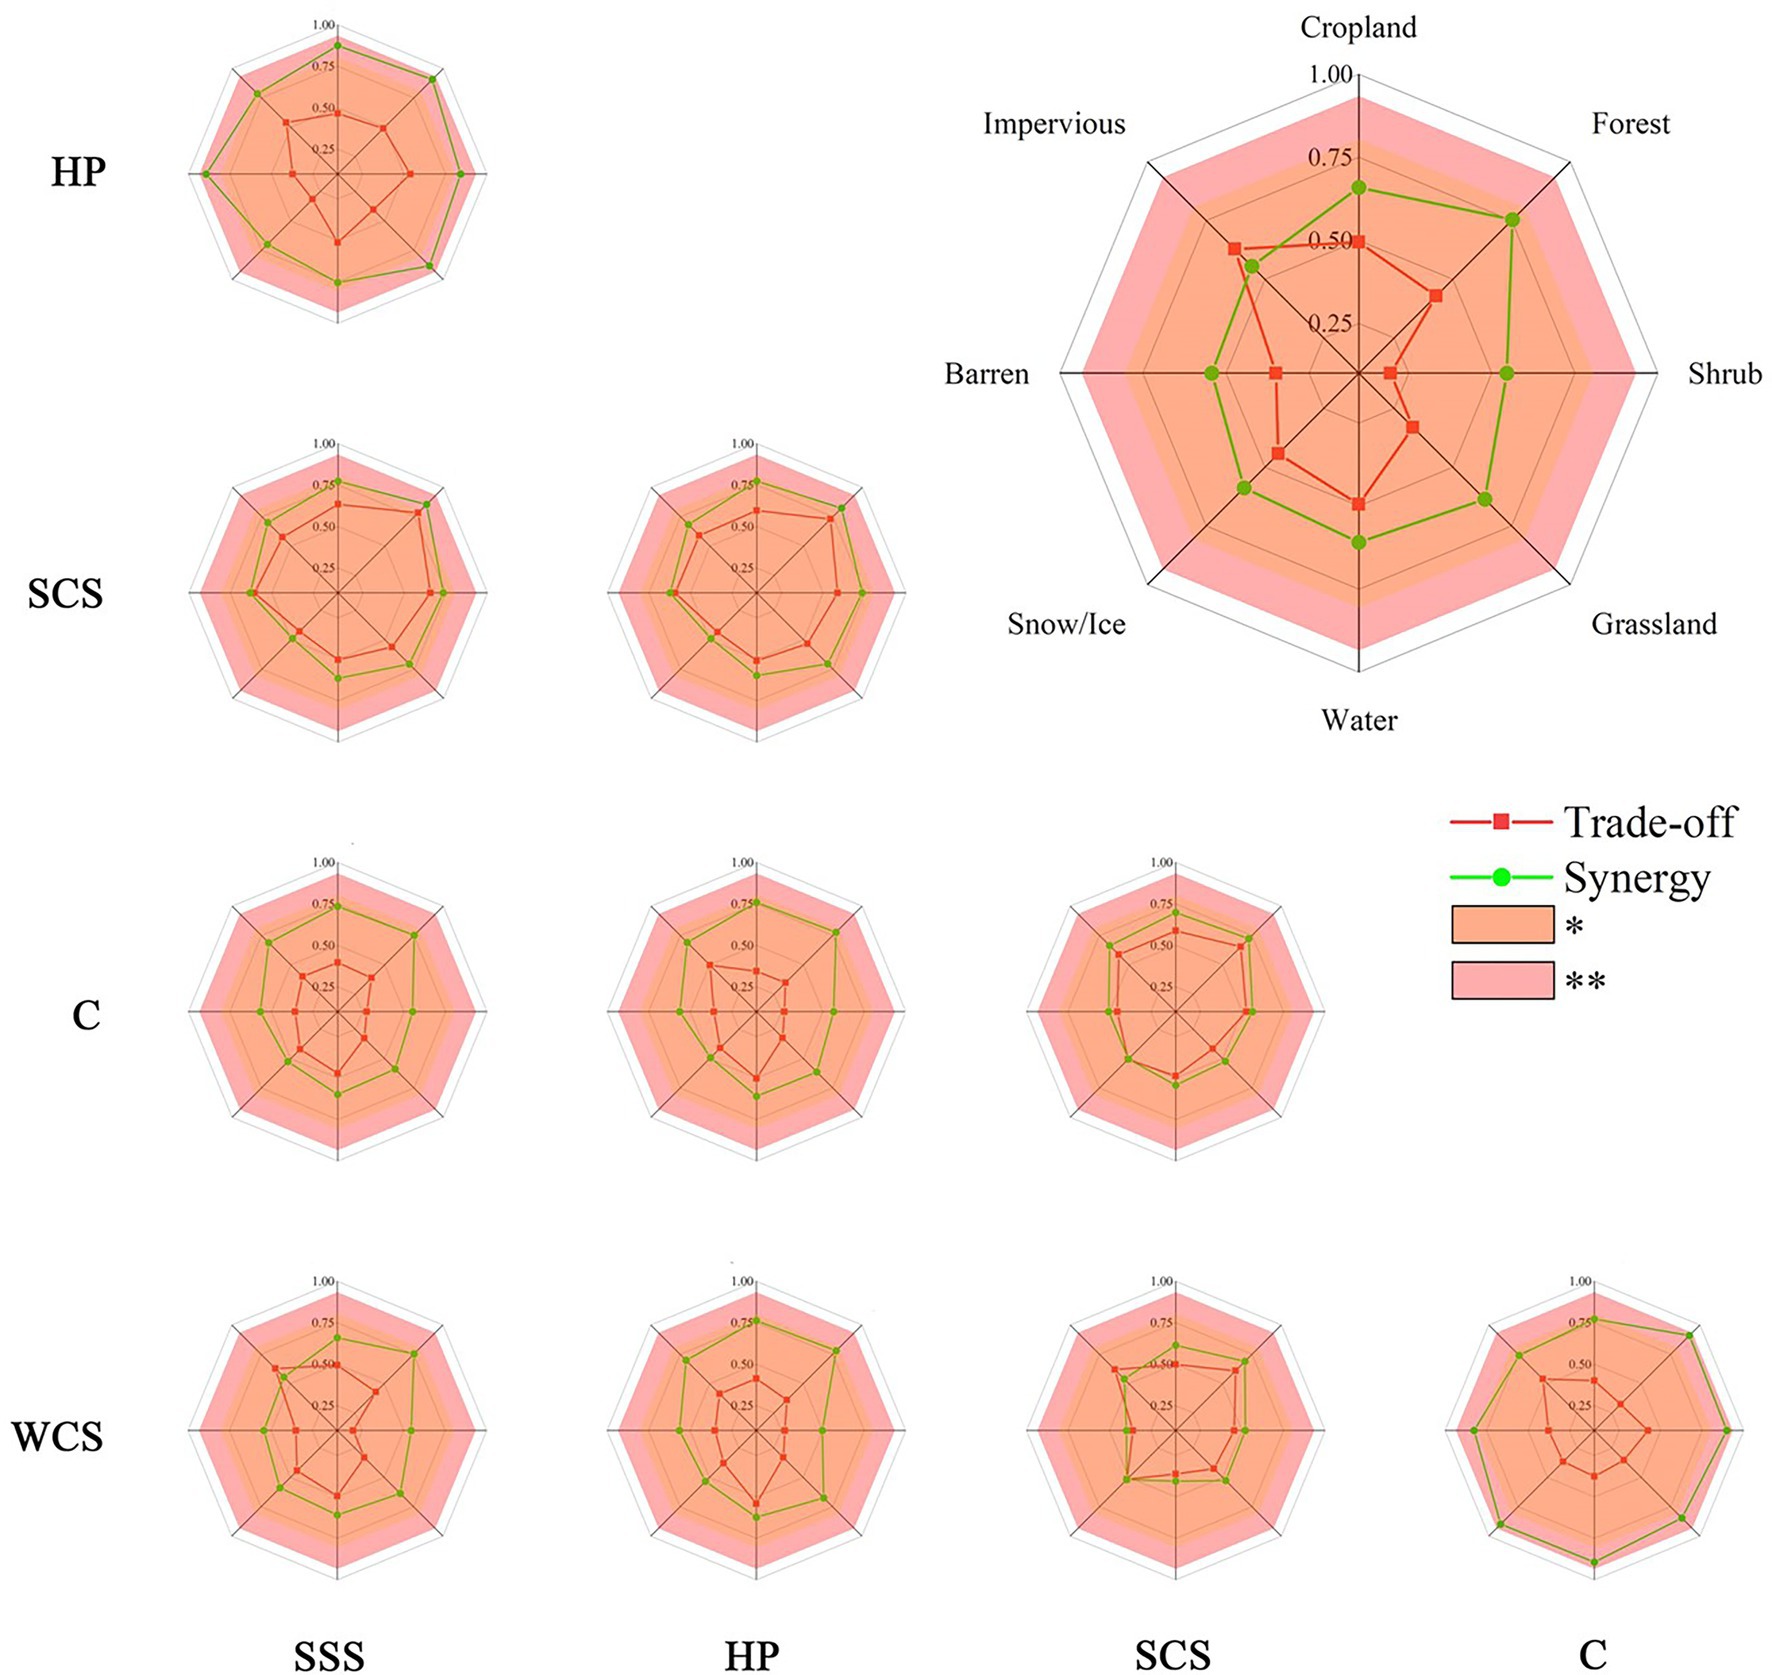
Figure 10. Synergies and trade-offs of ecosystem services in different land use/land cover. *At a level of 0.05 (two-tailed), the correlation is significant; **At a level of 0.01 (two-tailed), the correlation is very significant. The upper right corner is the legend. This result eliminates land use/land cover that are too small in area, and retains only eight land use/land cover.
Through the above analysis of LULC, increasing the greenness of land is the most effective way to increase the synergy relationship among ecosystem services. For managers, it is the most effective and scientific management measure to continuously promote desertification control and increase vegetation cover in the Northern Sand-stabilization Belt area.
From the precipitation distribution, 46.31% of the study area in 2020 has less than 200 mm of annual precipitation, which is an arid region. The precipitation distribution is similar to FVC, which gradually decreases from east to west. However, there are higher precipitation and FVC values in the middle of the HC. In TB region, precipitation increases with increasing altitude. Paired ES have different sensitivities to vegetation cover and precipitation due to differences in distribution patterns. Compared with precipitation, there are more pairwise synergistic changes in the effect of FVC. For example, among the 10 ES pairs, the synergy between sand-stabilization service and water conservation service, sand-stabilization service and carbon sequestration service, carbon sequestration service and water conservation service, carbon sequestration service and habitat provision increased significantly with increasing FVC. Because in arid and semi-arid regions, high evaporation and low precipitation are the norms (Yin et al., 2005). Vegetation can increase surface roughness and shade and reduce surface evaporation, wind erosion, and water erosion. Synergy of ES pairs that increase with precipitation is only sand-stabilization service and soil conservation service. The study by Zhang et al. (2022) shows the high contribution of climatic factors to vegetation recovery in northern China. Wang X. et al. (2022) showed that a 30% increase in precipitation in desert areas stimulated the growth of sophora alopecuroides, stipa breviflora, pennisetum centrasiaticum, and other species. Thus, increased precipitation indirectly contributes to the synergy of sand-stabilization service and soil conservation service through increase vegetation. Due to the high overlap between the distribution of precipitation and FVC, the other four ES pairs were not differently affected by precipitation and FVC.
There are some limitations to this study. Uncorrelated relationships between pairs of ES account for a large proportion, especially for ES pairs containing water conservation service. We analyze the reasons, and the study area is located in northwest China, dominated by deserts and grasslands. While most of the water conservation service values in these areas are 0. When exploring the trade-offs and synergies between water conservation service and other ES, the correlation coefficient will be 0, resulting in a large area of irrelevant relationships. When the value of a certain ES of a grid is zero in five periods, then the relationship between this ES and other ES is irrelevant. There is also a situation that when the value of a certain ES does not change for five periods, it will also get an irrelevant result with other ES calculations. In addition, the interpolation method and resolution of the underlying data are also important influencing factors. For example, the uncorrelated relationships of sand-stabilization service and soil conservation service, carbon sequestration service and soil conservation service, soil conservation service and water conservation service, and soil conservation service and habitat provision are distributed in the eastern part of the study area in a grid-like form. The reason for this phenomenon may be that the grid meteorological data obtained by spatial interpolation is used in estimating soil conservation service. As far as the research content is concerned, this study only evaluated 5 ES, and did not evaluate other important ES (such as crop production and climate control). The estimation model involves a limited number of factors, and the model itself has some inaccuracies. In future studies, in addition to further investigating and addressing these limitations, we will also explore the driving mechanism of ES trade-off and synergy and the model of the relationship between its sustainability, so as to better provide information for ecosystem management measures, so as to achieve the goal of harmonious development between man and nature.
This paper selected the northern sand-stabilization belt, which is located in northwest China, as the study area. The results of this study provide us with a new understanding of arid and semi-arid (or macro-regional) ecosystems and formulate more reasonable ecosystem management and protection measures in NSB.
In this study, we used multi-source data and multiple indicators to evaluate the changes of ES in the NSB, the results show that there was a clear heterogeneity in the distribution of ES, with soil conservation service mainly distributed in the eastern part of HC and the southeastern part of IM; the distribution of sand-stabilization service had a high overlap with areas where the land cover type was desert and grassland; carbon sequestration service distribution is closely related to FVC; habitat provision showed higher values in places with drastic elevation changes; the values of water conservation service were related to the distribution of lakes and snow-capped mountains.
However, this article mainly focused on assessing the trade-offs and synergies of five ESs, especially across the precipitation and vegetation cover fraction gradient. The trade-offs and synergies among multiple ES were widespread in NSB, but synergies account for a larger proportion. Changes in FVC and precipitation gradients could strongly enhance and weaken the trade-offs and synergies of some paired ES. The synergy between most paired ES increased significantly with increasing precipitation and FVC. However, pairwise ES have different sensitivities to FVC and precipitation, and there are more synergistic changes in paired ES for FVC effects than for the effects of precipitation. For example, the synergy and trade-off area ratio between sand-stabilization service and water conservation service in areas with less than 200 mm annual precipitation compared to those with more than 400 mm annual precipitation changed from 4.23 to 24.59, the synergy and trade-off area ratio changed from 4.53 to 27.46 for areas with FVC less than 0.3 compared to greater than 0.6. The study found that type of land use may be an important driving factor for trade-offs and synergies between paired ES. In arid and semi-arid areas, some measures such as planting trees and grass, are often taken to improve the ecological environment. To fully exploit the synergistic effect of paired ES, our research suggests that in improving the ecological environment through artificially increased vegetation coverage, appropriate vegetation types should be selected according to the target (the type of ES expected to be improved).
The raw data supporting the conclusions of this article will be made available by the authors, without undue reservation.
CW and KS: conceptualization, methodology, formal analysis, and writing-original draft preparation. CW: software. XZ, ZY, and ZC: validation. KS: resources, supervision, project administration, and funding acquisition. LW, CW, ZL, and YZ: data curation and visualization. KS, XJ, and YY: writing-review and editing. All authors contributed to the article and approved the submitted version.
This research is supported by the National Natural Science Foundation of Guangxi (2022GXNSFBA035570) and High-level Talents Project of Guangxi University (A3360051018).
Acknowledgement for the data support from “Loess plateau science data center, National Earth System Science Data Sharing Infrastructure, National Science & Technology Infrastructure of China (http://loess.geodata.cn).”
ZC is employed by Guizhou Linfa Survey and Design Co., Ltd.
The remaining authors declare that the research was conducted in the absence of any commercial or financial relationships that could be construed as a potential conflict of interest.
All claims expressed in this article are solely those of the authors and do not necessarily represent those of their affiliated organizations, or those of the publisher, the editors and the reviewers. Any product that may be evaluated in this article, or claim that may be made by its manufacturer, is not guaranteed or endorsed by the publisher.
Aneseyee, A. B., Noszczyk, T., Soromessa, T., and Elias, E. (2020). The InVEST habitat quality model associated with land use/cover changes: a qualitative case study of the Winike watershed in the Omo-Gibe Basin, Southwest Ethiopia. Remote Sens. 12. doi: 10.3390/rs12071103
Bennett, E. M., Peterson, G. D., and Gordon, L. J. (2009). Understanding relationships among multiple ecosystem services. Ecol. Lett. 12, 1394–1404. doi: 10.1111/j.1461-0248.2009.01387.x
Cao, S. X., Chen, L., and Yu, X. X. (2009). Impact of China's grain for green project on the landscape of vulnerable arid and semi-arid agricultural regions: a case study in northern Shaanxi Province. J. Appl. Ecol. 46, 536–543. doi: 10.1111/j.1365-2664.2008.01605.x
Costanza, R., Darge, R., Degroot, R., Farber, S., Grasso, M., Hannon, B., et al. (1997). The value of the world's ecosystem services and natural capital. Nature 387, 253–260. doi: 10.1038/387253a0
Deng, H., Dan, L., Wang, Q., Yang, X., and Yang, F. (2020). Simulations of the impact of climate and vegetation cover changes on carbon and water cycles of a Subalpine Basin in the mountain region of southwestern China. Climat. Environ. Res. 25, 19–31. doi: 10.3878/j.issn.1006-9585.2019.18068
Dumanski, J., and Pieri, C. (2000). Land quality indicators: research plan. Agric. Ecosyst. Environ. 81, 93–102. doi: 10.1016/s0167-8809(00)00183-3
Fang, J. Y., Chen, A. P., Peng, C. H., Zhao, S. Q., and Ci, L. (2001). Changes in forest biomass carbon storage in China between 1949 and 1998. Science 292, 2320–2322. doi: 10.1126/science.1058629
Felton, A. J., Slette, I. J., Smith, M. D., and Knapp, A. K. (2020). Precipitation amount and event size interact to reduce ecosystem functioning during dry years in a Mesic grassland. Glob. Chang. Biol. 26, 658–668. doi: 10.1111/gcb.14789
Fensholt, R., Langanke, T., Rasmussen, K., Reenberg, A., Prince, S. D., Tucker, C., et al. (2012). Greenness in semi-arid areas across the globe 1981-2007—an earth observing satellite based analysis of trends and drivers. Remote Sens. Environ. 121, 144–158. doi: 10.1016/j.rse.2012.01.017
Fryrear, D. W., Bilbro, J. D., Saleh, A., Schomberg, H., Stout, J. E., and Zobeck, T. M. (2000). RWEQ: improved wind erosion technology. J. Soil Water Conserv. 49, 485–505. doi: 10.1006/jare.2001.0807
Fu, B., Wang, X., and Feng, X. (2017). National Ecological Barrier Area Ecosystem Assessment. Beijing: Science Press
Gao, Y., Xie, Y., Qian, D., Zhang, L., and Gong, J. (2015). Dynamic variations of vegetation coverage and landscape pattern in Bailongjiang Basin of southern Gansu. Res. Soil Water Conserv. 22, 181–187. doi: 10.13869/j.cnki.rswc.2015.01.035
Gao, J., Yang, X., Dong, C., and Li, K. (2015). Precipitation resource changed characteristics in arid and humid regions in northern China with climate changes. Trans. Chin. Soc. Agric. Eng. 31, 99–110. doi: 10.11975/j.issn.1002-6819.2015.12.014
Gherardi, L. A., and Sala, O. E. (2019). Effect of interannual precipitation variability on dryland productivity: a global synthesis. Glob. Chang. Biol. 25, 269–276. doi: 10.1111/gcb.14480
Hasan, S. S., Zhen, L., Miah, M. G., Ahamed, T., and Samie, A. (2020). Impact of land use change on ecosystem services: a review. Environ. Dev. 34:100527. doi: 10.1016/j.envdev.2020.100527
Heisler-White, J. L., Knapp, A. K., and Kelly, E. F. (2008). Increasing precipitation event size increases aboveground net primary productivity in a semi-arid grassland. Oecologia 158, 129–140. doi: 10.1007/s00442-008-1116-9
Hu, H., and Liu, G. (2006). Carbon sequestration of China’s National Natural Forest Protection Project. Acta Ecol. Sin. 26, 291–296.
Huang, S. W., and Kong, J. M. (2016). Assessing land degradation dynamics and distinguishing human-induced changes from climate factors in the three-north shelter Forest region of China. ISPRS Int. J. Geo Inf. 5. doi: 10.3390/ijgi5090158
Huxman, T. E., Cable, J. M., Ignace, D. D., Eilts, J. A., English, N. B., Weltzin, J., et al. (2004). Response of net ecosystem gas exchange to a simulated precipitation pulse in a semi-arid grassland: the role of native versus non-native grasses and soil texture. Oecologia 141, 295–305. doi: 10.1007/s00442-003-1389-y
Johns, G., Lee, D. J., Leeworthy, V., Boyer, J., and Nuttle, W. (2014). Developing economic indices to assess the human dimensions of the South Florida coastal marine ecosystem services. Ecol. Indic. 44, 69–80. doi: 10.1016/j.ecolind.2014.04.014
Jopke, C., Kreyling, J., Maes, J., and Koellner, T. (2015). Interactions among ecosystem services across Europe: Bagplots and cumulative correlation coefficients reveal synergies, trade-offs, and regional patterns. Ecol. Indic. 49, 46–52. doi: 10.1016/j.ecolind.2014.09.037
Knapp, A. K., and Smith, M. D. (2001). Variation among biomes in temporal dynamics of aboveground primary production. Science 291, 481–484. doi: 10.1126/science.291.5503.481
Liao, Z. H., Su, K., Jiang, X. B., Zhou, X. B., Yu, Z., Chen, Z. C., et al. (2022). Ecosystem and Driving Force Evaluation of Northeast Forest Belt. Land 11. doi: 10.3390/land11081306
Li, G., Zhao, W., Zhao, Y., Fang, X., Gao, B., and Dai, L. (2015). Evaluation on the influence of natural forest protection program on forest ecosystem service function in changbai mountain. Acta Ecol. Sin. 35, 984–992. doi: 10.5846/stxb201304240799
Liu, M. X., Dong, X. B., Wang, X. C., Zhao, B. Y., Wei, H. J., Fan, W. G., et al. (2022). The trade-offs/synergies and their spatial-temporal characteristics between ecosystem services and human well-being linked to land-use change in the capital region of China. Landscape 11. doi: 10.3390/land11050749
Liu, X., Liu, C., Chen, L., Pei, S., and Qiao, Q. (2020). Gradient effects and ecological zoning of ecosystem services in transition zone of Beijing Bay. Trans. Chin. Soc. Agric. Eng. 36, 276–285. doi: 10.11975/j.issn.1002-6819.2020.12.033
Liu, X., and Ren, Z. (2012). Vegetation coverage change and its relationship with climate factors in Northwest China. Sci. Agric. Sin. 45, 1954–1963. doi: 10.3864/j.issn.0578-1752.2012.10.008
Liu, L., Wang, Z., Wang, Y., Zhang, Y., Shen, J., Qin, D., et al. (2019). Trade-off analyses of multiple mountain ecosystem services along elevation, vegetation cover and precipitation gradients: a case study in the Taihang Mountains. Ecol. Indic. 103, 94–104. doi: 10.1016/j.ecolind.2019.03.034
Liu, S., Yan, D., Shi, X., and Yuan, Z. (2014). Inter-annual variability of vegetation NDVI,accumulated temperature and precipitation and their correlations in China. Arid Land Geogr. 37, 480–489. doi: 10.13826/j.cnki.cn65-1103/x.2014.03.008
Loomis, D. K., and Paterson, S. K. (2014). Human dimensions indicators of coastal ecosystem services: a hierarchical perspective. Ecol. Indic. 44, 63–68. doi: 10.1016/j.ecolind.2013.12.022
Malekmohammadi, B., and Jahanishakib, F. (2017). Vulnerability assessment of wetland landscape ecosystem services using driver-pressure-state-impact-response (DPSIR) model. Ecol. Indic. 82, 293–303. doi: 10.1016/j.ecolind.2017.06.060
Mukaka, M. M. (2012). Statistics corner: a guide to appropriate use of correlation coefficient in medical research. Malawi Med. J. 24, 69–71.
Niu, L., Shao, Q., Ning, J., and Huang, H. (2022). Changing ecological conditions and ecosystem service trade-offs and synergies in the Western region. Acta Geograph. Sin. 77, 182–195. doi: 10.11821/dlxb202201013
Ouyang, Z., Zheng, H., Xiao, Y., Polasky, S., Liu, J., Xu, W., et al. (2016). Improvements in ecosystem services from investments in natural capital. Science 352, 1455–1459. doi: 10.1126/science.aaf2295
Pandey, A., Chowdary, V. M., and Mal, B. C. (2007). Identification of critical erosion prone areas in the small agricultural watershed using USLE, GIS and remote sensing. Water Resour. Manag. 21, 729–746. doi: 10.1007/s11269-006-9061-z
Peng, S. Z., Ding, Y. X., Liu, W. Z., and Li, Z. (2019). 1 km monthly temperature and precipitation dataset for China from 1901 to 2017. Earth Syst. Sci. Data 11, 1931–1946. doi: 10.5194/essd-11-1931-2019
Piao, S. L., Fang, J. Y., Ciais, P., Peylin, P., Huang, Y., Sitch, S., et al. (2009). The carbon balance of terrestrial ecosystems in China. Nature 458, 1009–1013. doi: 10.1038/nature07944
Richards, D. R., and Friess, D. A. (2017). Characterizing coastal ecosystem service trade-offs with future urban development in a Tropical City. Environ. Manag. 60, 961–973. doi: 10.1007/s00267-017-0924-2
Rodriguez, J. P., Beard, T. D., Bennett, E. M., Cumming, G. S., Cork, S. J., Agard, J., et al. (2006). Trade-offs across space, time, and ecosystem services. Ecol. Soc. 11. doi: 10.5751/ES-01667-110128
Shao, Y. J., Yuan, X. F., Ma, C. Q., Ma, R. F., and Ren, Z. X. (2020). Quantifying the spatial association between land use change and ecosystem services value: a case study in Xi'an, China. Sustain. For. 12. doi: 10.3390/su12114449
Sloat, L. L., Gerber, J. S., Samberg, L. H., Smith, W. K., Herrero, M., Ferreira, L. G., et al. (2018). Increasing importance of precipitation variability on global livestock grazing lands. Nature. Climate Change 8:214. doi: 10.1038/s41558-018-0081-5
Song, W., and Deng, X. Z. (2015). Effects of urbanization-induced cultivated land loss on ecosystem Services in the North China Plain. Energies 8, 5678–5693. doi: 10.3390/en8065678
Su, H., Shen, Y., Han, P., Li, J., and Lan, Y. (2007). Precipitation and its impact on water resources and ecological environment in Xinjiang region. J. Glaciol. Geocryol. 29, 343–350. doi: 10.3969/j.issn.1000-0240.2007.03.002
Su, K., Sun, X. T., Guo, H. Q., Long, Q. Q., Li, S., Mao, X. Q., et al. (2020). The establishment of a cross-regional differentiated ecological compensation scheme based on the benefit areas and benefit levels of sand-stabilization ecosystem service. J. Clean. Prod. 270:122490. doi: 10.1016/j.jclepro.2020.122490
Sun, H., Wang, C., Niu, Z., Bukhosor,, and Li, B. (1998). Analysis of the vegetation cover change and the relationship between NDVI and environmental factors by using NOAA time series data. J. Remote Sens. 2, 204–210.
Vigl, L. E., Tasser, E., Schirpke, U., and Tappeiner, U. (2017). Using land use/land cover trajectories to uncover ecosystem service patterns across the Alps. Reg. Environ. Chang. 17, 2237–2250. doi: 10.1007/s10113-017-1132-6
Wang, W., and Jiao, J. (1996). Qutantitative evaluation on factors influencing soil erosion in China. Bull. Soil Water Conserv. 16, 1–20.
Wang, J., Liu, C., and Zhang, S. (2022). Ecological security pattern of typical counties in northern sand prevention belts. Acta Ecol. Sin. 42, 3989–3997. doi: 10.5846/stxb202103280813
Wang, L., Ma, A., Zhang, H., Zhang, J., Dong, Q., and Fu, G. (2020). Effects of Long-Term Vegetation Restoration on Distribution of Deep Soil Moisture in Semi-arid Northwest of China. J. Soil Sci. Plant Nut. 20. doi: 10.1007/s42729-020-00280-4
Wang, X., Xu, Y., Li, C., Yu, H., and Huang, J. (2022). Plant biomass, species diversity, and influencing factors in a desert steppe of northwestern China under long-term changing precipitation. Chin. J. Plant Ecol., 1–12. doi: 10.17521/cjpe.2022.0211
Wen, X., Deng, X. Z., and Zhang, F. (2019). Scale effects of vegetation restoration on soil and water conservation in a semi-arid region in China: resources conservation and sustainable for management. Resour. Conserv. Recycl. 151:104474. doi: 10.1016/j.resconrec.2019.104474
Wu, L. L., Sun, C. G., and Fan, F. L. (2021). Estimating the characteristic spatiotemporal variation in habitat quality using the InVEST model: A case study from Guangdong-Hong Kong-Macao Greater Bay Area. Remote Sens. 13:1008. doi: 10.3390/rs13051008
Yang, S., Hu, S., and Qu, S. (2018). Terrain gradient effect of ecosystem service value in middle reach of Yangtze River. Chin. J. Appl. Ecol. 29, 976–986. doi: 10.13287/j.1001-9332.201803.016
Yin, Z., Zhu, Q., Bi, H., and Zhang, J. (2005). Research progress on water consumption characteristics of vegetation in loess plateau. Yellow River 27, 35–37.
Yixuan, Z., Yangjian, Z., Zhoutao, Z, Yaojie, L., Zhipeng, W., Nan, C., et al. (2022). Converted vegetation type regulates the vegetation greening effects on land surface albedo in arid regions of China. Agri. Forest Meteorol. 324. doi: 10.1016/j.agrformet.2022.109119
Yu, Y. Y., Li, J., Zhou, Z. X., Ma, X. P., and Zhang, X. F. (2021). Response of multiple mountain ecosystem services on environmental gradients: how to respond, and where should be priority conservation? J. Clean. Prod. 278:123264. doi: 10.1016/j.jclepro.2020.123264
Zhang, Z. (2017). Study on evaluation of service function change of windbreak and sand-fixing ecosystem in northern sand Prevention Belt. Chang’an University, Available at Cnki
Zhang, L., Dawes, W. R., and Walker, G. R. (2001). Response of mean annual evapotranspiration to vegetation changes at catchment scale. Water Resour. Res. 37, 701–708. doi: 10.1029/2000wr900325
Zhang, Y., and Huang, M. (2013). Evapotranspiration characteristics and their influencing factors for arbors and shrubs with different precipitation patterns in loess plateau. Bull. Soil Water Conserv. 33, 207–212. doi: 10.13961/j.cnki.stbctb.2013.06.058
Zhang, K., Lyu, Y., Fu, B., Yin, L., and Yu, D. (2020). The effects of vegetation coverage changes on ecosystem service and their threshold in the loess plateau. Acta Geograph. Sin. 75, 949–960. doi: 10.11821/dlxb202005005
Zhang, X., Shao, Q., Ning, J., Yang, X., Gong, G., and Liu, G. (2022). Effect of vegetation restoration on soil wind erosion and vegetation restoration potential in the three-north afforestation program. J. Geo-info. Sci. 24, 2153–2170. doi: 10.12082/dqxxkx.2022.220060
Zhang, Q., Zhang, L., Cui, X., and Zeng, J. (2011). Progresses and challenges in drought assessment and monitoring. Adv. Earth Science 26, 763–778.
Zhang, X., Zhao, W., and Liu, Y. (2017). Application of remote sensing Technology in Research of soil erosion: a review. Bull. Soil Water Conserv. 37, 228–238. doi: 10.13961/j.cnki.stbctb.2017.02.035
Zhou, H., Wang, Z., Wang, Z., and Bao, Y. (2021). Response of ecosystem service value of karst Mountainous City to terrain Gradient一A case study of downtown of Guiyang City. Res. Soil Water Conserv. 28, 337–347. doi: 10.13869/j.cnki.rswc.2021.06.027
Keywords: northern sand-stabilization belt, ecosystem services, FVC, precipitation, trade-offs and synergies
Citation: Wei C, Su K, Jiang X, You Y, Zhou X, Yu Z, Chen Z, Liao Z, Zhang Y and Wang L (2023) Increase in precipitation and fractional vegetation cover promote synergy of ecosystem services in China’s arid regions—Northern sand-stabilization belt. Front. Ecol. Evol. 11:1116484. doi: 10.3389/fevo.2023.1116484
Edited by:
Yanjie Xu, Finnish Museum of Natural History, FinlandReviewed by:
Wang Jiping, Chinese Academy of Forestry, ChinaCopyright © 2023 Wei, Su, Jiang, You, Zhou, Yu, Chen, Liao, Zhang and Wang. This is an open-access article distributed under the terms of the Creative Commons Attribution License (CC BY). The use, distribution or reproduction in other forums is permitted, provided the original author(s) and the copyright owner(s) are credited and that the original publication in this journal is cited, in accordance with accepted academic practice. No use, distribution or reproduction is permitted which does not comply with these terms.
*Correspondence: Kai Su, c3VrYWlfbHh5QGd4dS5lZHUuY24=
†These authors have contributed equally to this work
Disclaimer: All claims expressed in this article are solely those of the authors and do not necessarily represent those of their affiliated organizations, or those of the publisher, the editors and the reviewers. Any product that may be evaluated in this article or claim that may be made by its manufacturer is not guaranteed or endorsed by the publisher.
Research integrity at Frontiers
Learn more about the work of our research integrity team to safeguard the quality of each article we publish.