 Erika L. Headrick†
 Lisa M. Nigro†
 Lisa A. Waidner
 Melissa Ederington-Hagy†Arianna L. Simmering†
 Richard A. Snyder†
 Wade H. Jeffrey*
- Center for Environmental Diagnostics and Bioremediation, University of West Florida, Pensacola, FL, United States
The increased potential for contamination of seawater by crude oils requires studies of bacterial biodegradation potential, but little is known of the differential negative impacts of oils on bacterial growth. No two wells generate chemically identical oils; and importantly, solar exposure of crude oil may differentially affect the bacterial response. Elucidating the role that sunlight plays on the potential toxicity of spilled crude oils is imperative to understanding how oil spills might affect microbes in the tropical and subtropical waters of Florida. This study examined light exposure of six different crude oils, and subsequent microbial responses to altered oils. Marine bacterioplankton heterotrophic activities were measured via 3H-leucine incorporation after the addition of oils’ water accommodated fractions (WAFs) that were created under varied solar conditions. Inhibition of production increased with higher concentrations of WAFs, but dose-response trends varied among the oils. Increased solar exposure during WAF preparation generally led to more inhibition, but trends varied among oils. WAFs were also prepared under different parts of the solar spectrum. Solar-irradiated WAFs resulted in significant but variable acute toxicity vs. dark counterparts. Solar-induced toxicity was primarily a result of visible and not ultraviolet light exposure. Results indicate responses to oil spills are highly dependent on the source of the oil and solar conditions at the time and location of the spill. The data presented here demonstrate the importance of photochemical changes and oil source in modulating microbial activity and bioremediation potential.
1. Introduction
The accidental release of crude oil into marine environments by anthropogenic means often results in higher-than-background discharge rates and is not uncommon (Pampanin and Sydnes, 2013). While 914 persistent crude oil seeps have been identified in the Gulf of Mexico, the total background input of crude oil from these is estimated at 0.25 to 1 × 10⁴ m3 year–1 (MacDonald et al., 2015). In contrast, flow rates following the 2010 Deepwater Horizon (DWH) explosion were estimated at roughly 1 × 10⁴ m3 day–1 over 87 days for a total input of 7.95 × 10⁵ m3 before accounting for containment efforts (McNutt et al., 2012). The DWH explosion released crude oil into the northeast quadrant of the Gulf of Mexico (GOM), where only 7% of the total input from GOM natural seeps is expected (MacDonald et al., 2015).
Local assemblages of hydrocarbon-degrading microorganisms exist in Gulf of Mexico waters due to input of crude oil from natural seeps (Head et al., 2006; Peng et al., 2008; Pampanin and Sydnes, 2013; Prince and Atlas, 2018). It is widely known that crude oil is a complex mixture of hydrocarbons and there is variation between crude oils from different wells (Juyal et al., 2011; Pampanin and Sydnes, 2013; MacDonald et al., 2015). These differences may contribute to differences in responses by bacterioplankton.
Parameters affecting bacterial production when oil is present can also include specific capacities of bacterial taxa to degrade various hydrocarbon species (Head et al., 2006; Vergeynst et al., 2019; Bacosa et al., 2020a), microbial production of biosurfactants that facilitate bioavailability of petroleum molecules (Matvyeyeva et al., 2014), the relative abundance of nitrate-reducers among microbial community members (Melkonian et al., 2021), and the trophic state of the seawater upon oil introduction (Haule and Freda, 2021). Water temperature, nutrient availability, solar exposure, and oxygen affect microbial activity (Scofield et al., 2015; Hutchins and Fu, 2017; Cavicchioli et al., 2019; Robinson, 2019) altering the microbial degradation of crude oil components (Atlas and Hazen, 2011; Gregson et al., 2021).
Physical considerations include evaporation (Gjesteland et al., 2019), photodegradation (Guipeng et al., 2006; Saeed et al., 2013; Jing et al., 2014), or various means of solubilization, emulsification, or degradation of oil constituents (Riazi and Roomi, 2008; Gros et al., 2014; Boehm et al., 2016) upon introduction to seawater. Irradiance of the oil-seawater mixture can result in photo-transformation or photooxidation of the oil constituents (Nicodem et al., 2001; Snyder et al., 2021) and changes to the natural microbial community (Bacosa et al., 2015a). Typical surface water conditions seem to have little to no effect on photodegradation rates in the absence of an inoculum (Saeed et al., 2011), while solar irradiation does.
Biodegradation and/or physical degradation of oil constituents may differ with respect to the characteristics of the crude oils introduced to the aquatic environment. Lighter crude oils with higher American Petroleum Institute (API) gravity are typically degraded more efficiently (Prince, 1993; Sugiura et al., 1997; Hazen et al., 2016). The mixture of hydrocarbons within crude oils. Generally, N-alkanes are degraded most readily by diverse microbial consortia followed by slower degradation of more complex compounds (e.g., PAHs) by a more limited number of microbial species (Sugiura et al., 1997; Hazen et al., 2010; Atlas and Hazen, 2011; Dubinsky et al., 2013; Gutierrez et al., 2013; Kimes et al., 2014). Lower-ring-number PAHs are typically more bioavailable for more rapid biodegradation than higher-ring-number hydrocarbons (Peng et al., 2008; Bacosa et al., 2020b). Macondo well 252 oil from the DWH spill in the GOM (MC-252) and the surrogate oil (described by Pelz et al., 2011) supplied to researchers are oxidized at different rates in seawater mesocosms, but the reasons (biodegradation or photodegradation) for the relative differences in rates observed are not well known (Wozniak et al., 2019). MC-252 and the surrogate were found to oxidize differently in both photosynthetically active radiation (PAR) and full sun exposure (Vaughan et al., 2016).
Predictions of the microbial response to crude oil are further complicated by the potential influence of solar exposure to the oil in seawater. Considerations include both the relative intensity of the irradiance and the wavelengths of light reaching the oil molecules. While PAHs in crude oil with fewer aromatic rings are more easily degraded, alkylated PAHs with higher numbers of aromatic rings are photo-transformed at faster rates (Bacosa et al., 2015b). While MC-252 and surrogate oil water accommodated fractions (WAFs) had different photochemical responses to sunlight, the inhibition of microbial growth was similar for the two oils (Vaughan et al., 2016). Several studies have indicated that the microbial response following a spill may be dependent on the type of oil and its photo-reactivity (Santas et al., 1999; Saeed et al., 2011; Griffiths et al., 2014; Passow and Stout, 2020). Additionally, the effects of various wavelengths of light, including ultraviolet (UV) and photosynthetically active radiation (PAR) on the rates of physical-and/or biodegradation of oil constituents must be considered (Genuino et al., 2012) owing to the wavelength dependency of light attenuation in water when predicting in situ exposures.
The standard methods for producing crude oil WAFs were first detailed in Aurand and Coelho (2005) and call for the preparation of WAFs in the dark. These methods have been challenged and defended overtime and the importance of a standardized protocol for comparative research has been stressed (Coelho et al., 2013). However, WAFs produced in the dark vastly underrepresent crude oil dynamics and toxicity in the natural environment. Solar irradiation of crude oil compounds increases solubility in seawater (Lee, 2003; Benigni et al., 2017), which increases the bioavailability and potential toxicity of irradiated compounds relative to parent compounds (Dutta and Harayama, 2000; Maki et al., 2001; Griffiths et al., 2014; Bacosa et al., 2015b). In the DWH disaster, it is estimated that 50% of the crude oil volume reached the ocean surface (McNutt et al., 2012). Environmental conditions at the ocean surface are thus important to account for the potential impact of crude oil on biota, including the bacterioplankton responsible for degradation and transfer of organic matter to higher trophic levels.
Few studies have isolated the photochemical treatment of crude oils during WAF preparation from bacterial degradation (Yang et al., 2016; Cao and Tarr, 2017; Vergeynst et al., 2019; Snyder et al., 2021), and fewer have directly compared multiple crude oil sources (Viggor et al., 2013; Passow and Stout, 2020). To our knowledge, no studies have compared a wide spectrum of geochemically different crude oils exposed to a range of irradiance conditions and the subsequent effects on heterotrophic bacteria. Herein, we compared the acute effects on bacterioplankton growth of the water accommodated fractions (WAFs) produced from six different crude oils. In particular we focused on how the exposure to sunlight during WAF production altered the response to the individual oils. Our primary objective was to determine whether all crude oils produced a similar response as a function of the concentration of added WAF and how that response was dependent on the duration and part of the solar spectrum to which samples were exposed.
2. Materials and methods
2.1. Crude oils
A series of unique crude oils were made available by the National High Magnetic Field laboratory at Florida State University (FSU).1 The FSU-provided oils were observed alongside crude oils in our collection at the University of West Florida (UWF). In order to maximize replication within the study, only five FSU-provided oils and one UWF-provided oil were selected for further analysis on the basis of density, color, and preliminary assessments of bacterial inhibition (data not shown); the oils were selected to test the widest variety of responses available.
The FSU-provided oils were assigned a number for the duration of the project to conceal the location-identity of the oils until the project’s conclusion to avoid biases. The MC-252 surrogate crude oil was the UWF-provided oil (Table 1). Samples of each of the crude oils were sent to Midwest Laboratories (MWL)2 for measurement of API gravity (ASTM D 4052-15), and contents of carbon (MWL WC PROC 55), nitrogen (MWL WC PROC 55), hydrogen (MWL WC PROC 55), and sulfur (ASTM D 5453-19) each expressed as a percent of total mass. MWL WC PROC 55 is a proprietary method used by MWL that is based on method AOAC 993.13. Samples were loaded into an elemental analyzer to be burned in the presence of oxygen releasing gases which were identified, quantified, and reported as a percent of the total oil mass.
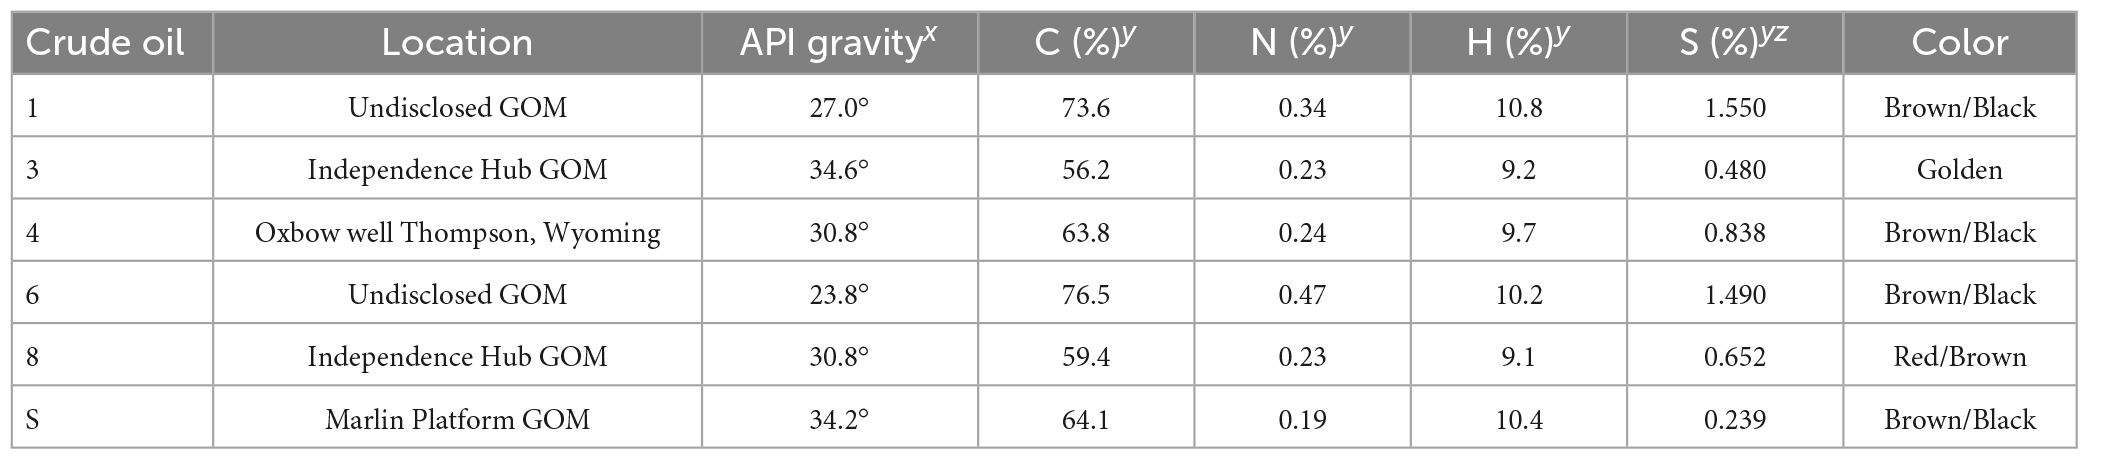
Table 1. Physical and chemical characteristics of crude oil samples, x: API gravity >31.1° denotes a light crude oil and API gravity 22.3–31.1° denotes a medium crude oil, y: % mass, z: crude oils with >0.5% sulfur content are considered sour, while <0.5% sulfur are considered sweet, GOM: samples collected in the Gulf of Mexico.
2.2. General WAF preparation
Crude oils were added to sterile seawater in a manner similar to the CROSERF protocol (Aurand and Coelho, 2005) in individual Teflon bottles at a concentration of 1% oil: water (v/v) to produce oil-in-water mixtures leading to WAFs. Aged (>3 years) seawater from the central Gulf of Mexico was used to produce WAFs to ensure there were no other labile organic carbon sources to which the bacteria might respond. The aged seawater was filtered through a 47 mm, 0.2 μm pore-size polycarbonate filter by gentle vacuum (<0.3 atm) and 25 mL was added to each 30 mL Teflon bottle (minimum 86% UV transmittance; Vaughan et al., 2016), leaving approximately 5 mL headspace. Seawater was pasteurized in the Teflon bottles at 70°C for a minimum of 2 h and cooled to room temperature before crude oil was added (1% v/v).
Three light regimes were used in WAF production. Oil-in-water mixtures were incubated in Teflon bottles that were (i) uncovered for full-sun exposure (FS), (ii) covered in aluminum foil (Dark), and (iii) covered in Court guard, a broadband cut-off filter (PAR). Court guard transmits photosynthetically active radiation (PAR; 95% of 400–800 nm wavelengths) and blocks ultraviolet radiation (0% of UV-B and 9% of UV-A transmittance) (Fischer et al., 2006; Vaughan et al., 2016). WAFs were incubated in covered and uncovered bottles in a water bath held constant at 20°C directly under natural sunlight. Solar irradiance was measured during exposures using a Biospherical Instruments (San Diego, CA, USA) GUV511 solar radiometer. Full irradiance data during WAF production are presented in Tables 2, 4. All bottles were shaken three times each day for 5 s. At the conclusion of the exposure period, bottles were returned to the lab to settle. The aqueous phases of each mixture containing the oil WAFs were removed, transferred into 20 mL glass scintillation vials maintaining separate WAF stocks, and stored at −20°C until experimental use.

Table 2. Daily light exposures during WAF formation.
2.3. Coastal seawater inocula
A fresh sample of coastal seawater was collected at sunrise via bucket-cast from the end of the Pensacola Beach Pier the day of each experiment (Supplementary Table 1). This location is approximately 0.3 km off the coastline (30°19′38″ N, 87° 8′31″ W). Microbes in these seawater samples served as the natural community inoculum in each experiment. Vertical salinity and temperature profiles were measured using a SonTek (San Diego, CA, USA) Castaway conductivity, temperature, and depth meter (CTD). In addition, samples were preserved with sulfuric acid for total Kjeldahl nitrogen (TKN), stored at 4°C, and later analyzed using EPA method 351.2 on a Lachat Quickchem FIA Model autoanalyzer. Sample seawater was also passed through a 25 mm GF/F filter and the filtrate was saved and preserved by freezing at −20°C for eventual analysis of dissolved nutrients. Dissolved inorganic phosphate (DIP) was analyzed as in Parsons et al. (1984), NH4+ as in Holmes et al. (1999), and NO3– + NO2– as in Schnetger and Lehners (2014). The sum of NH4+, NO3–, and NO2– is reported as dissolved inorganic nitrogen (DIN).
2.4. Bacterial production assays
Incorporation of labeled leucine, a proxy for secondary heterotrophic production, was measured by bulk radioactivity measurements of each sample after 4 h of dark incubation. 3H-Leucine (Perkin Elmer; specific activity 50.2 Ci mmol–1) was added to seawater samples to a final concentration of 10 nM. Samples were incubated in 5 mL (12 mm × 75 mm) polystyrene round-bottom (snap-cap) tubes at in situ temperature in the dark for 4 h in the presence of oil WAFs. Incorporation reactions were terminated by the addition of trichloroacetic acid (TCA) to a final concentration of 5% (v/v). Samples were transferred from snap-cap tubes into triplicate microcentrifuge tubes and processed by the method established by Kirchman et al. (1985) and amended by Smith and Azam (1992). Briefly, total biomass was precipitated by trichloroacetic acid (TCA) precipitates, and then TCA precipitates were collected by centrifugation, and pellets were washed again with 5% TCA and again with 70% ETOH. Final pellets were resuspended in liquid scintillation cocktail and incorporated leucine was measured using a Tri-Carb 2900TR Liquid Scintillation Analyzer (Perkin Elmer). The same technique was used to determine background or control bacterial production in the sample water from the Pensacola Beach Pier in the absence of WAFs.
2.5. Dose response
Water accommodated fractions were prepared in replicates of four under FS conditions for 8 days using oils 1, 3, 4, 6, 8, and the MC-252 surrogate (S). WAFs were added to snap-cap tubes at final concentrations of 0.5, 1, 2.5, 5, and 10% (v/v) with the seawater inoculum containing 3H-Leucine. Five replicate controls were prepared similarly by the addition of 2.5% (v/v) sterile seawater to the seawater inoculum and 3H-Leucine. Dose-response for each oil WAF was modeled by the natural log of 3H-Leucine incorporation vs. increasing concentration.
2.6. Duration of WAF solar exposure
Twenty replicates of FS-incubated WAFs were prepared for each oil mentioned before and four replicates were removed from solar exposure at time points of 24, 48, 96, 144, and 192 h (Table 4). At each time point, replicate WAFs were removed from each bottle, transferred to 20 mL scintillation vials, and stored at −20°C until all bottles were recovered from solar exposure. WAFs were added to snap cap tubes as before at a final concentration 2.5% (v/v) with the seawater inoculum and 3H-Leucine. Controls were prepared as before with sterile seawater (2.5% v/v). Inhibitory effects of increased WAF-preparation solar exposure time were modeled for each oil by the natural log of 3H-Leucine incorporation vs. increasing UV-exposure times under which the WAFs were prepared.
2.7. Spectral dependency
Water accommodated fractions were prepared in triplicate under FS, PAR, and Dark spectral conditions for 8 days and collected upon return to the lab. WAFs were added to snap cap tubes at final concentration 2.5% (v/v) with the seawater inoculum and 3H-Leucine. Three replicates of controls were prepared with sterile seawater (2.5% v/v). The bacterial production assay was performed, and the 3H-Lecuine incorporation rates were plotted as a percentage of the control.
2.8. WAF fluorescence
Fluorescence signals of FS and DARK WAFs were measured on a Turner Trilogy Fluorometer using the crude oil module (model # 7200-063; excitation: 365 nm, emission: 410–600 nm) as a proxy for total hydrocarbon quantification (Ziervogel et al., 2014). Replicates were pooled prior to measuring fluorescence. Background fluorescence from an un-amended seawater sample was subtracted from WAF fluorescence signals and reported in relative fluorescence units (RFU). This method of analysis was limited by the equipment available in the laboratory and was also performed before carbon contents of the oils were known. Fluorescence data was not used as a direct quantitation method, as additions of crude oil to seawater were on a per-volume basis (i.e., 1% v/v) rather than per-carbon basis. These data were used to differentiate the tendency of various oil constituents to move into the aqueous portion of the oil-in-water mixture during solar exposure. The aqueous fraction was collected as “WAF” and fluorescence was measured. Microbial inhibition corresponding to these WAFs was also measured in triplicate as previously described by3H-Leucine incorporation before the WAFs were pooled for measurements of fluorescence. The seawater used as the inoculum in this experiment was characterized as mentioned above in section “2.3. Coastal seawater inocula.”
2.9. Statistical analyses
Linear models were first constructed for microbial dose response to each oil with increasing WAF concentration as previously described. Slopes and respective error terms for each oil source were estimated in Rv1.3 (R Core Team, 2022). A two-way Analysis of Variance (ANOVA) where concentration and oil source were explanatory variables was performed and a significant interaction term was used to indicate overall heterogeneity of slopes. Post hoc pairwise comparisons of dose-response curves for each oil were performed using lstrends in R (Lenth, 2023) and P-values were adjusted by the Tukey’s method for comparing a family of seven estimates including a control with slope of zero. Additionally, simple effects of WAF oil source were investigated using a one-way ANOVA at each individual concentration.
Similarly, significant differences between oil sources were detected with a linear model estimating microbial response to WAFs prepared under increasing solar exposure time. In this case, time and oil source served as explanatory variables. Simple effects of WAF oil source were investigated using a one-way ANOVA at each individual time point.
Differences were detected (i) between oil sources within each of FS, PAR, and Dark groups, and (ii) between spectral exposures within each oil-source group using one-way ANOVA analyses. Following each ANOVA, pairwise comparisons were made by TukeyHSD. P-values reported were determined by the lower limit of each analysis in R and are reported exactly from the corresponding output in the Supplementary Data Spreadsheet. The lower limits for reporting p-values in each analysis are 2E-16 in an ANOVA, 0.0001 in lstrends and an adjusted p-value of zero in TukeyHSD.
Similarities in the elemental composition of the source oils, with respect to percent carbon, hydrogen, nitrogen, and sulfur, as well as API gravity are presented using a resemblance matrix and Bray-Curtis (B-C) similarity hierarchal clustering generated in PRIMER6. The variables included in the similarity clustering analysis included only those with continuous values (API gravity, carbon, hydrogen, nitrogen, and sulfur). As previously described for numerical values of sediment characteristics (Shin and Fong, 1999) and numerical values of water chemistry parameters (Balasubramaniam et al., 2015), we transformed numerical values of oil characteristics and used transformed values in the B-C analysis for this particular type of multivariate analysis. In order to standardize scales between measures of characteristics with continuous values, a min-max transformation was applied within each variable; this transformation standardizes all variables on a scale of 0 to 1 where 0 is the lowest value recorded within the variable and 1 is the highest. Without this transformation, variables on a higher scale contribute more to the clustering of compared oils than variables on a lower scale (i.e., API gravity vs. nitrogen content). The B-C similarity analysis did not include discrete values (color, sour vs. sweet, or location of oils). Those discrete variables are simply included in the dendrogram as follows (from the Figure 1 legend, circles vs. squares for sour and sweet; open and closed symbols, for light crude and medium crude; and location of oils as leaf label text). Additionally, Pearson correlation coefficient and significance were calculated for microbial inhibition vs. WAF fluorescence using R package ggpubr (Kassambara, 2020).
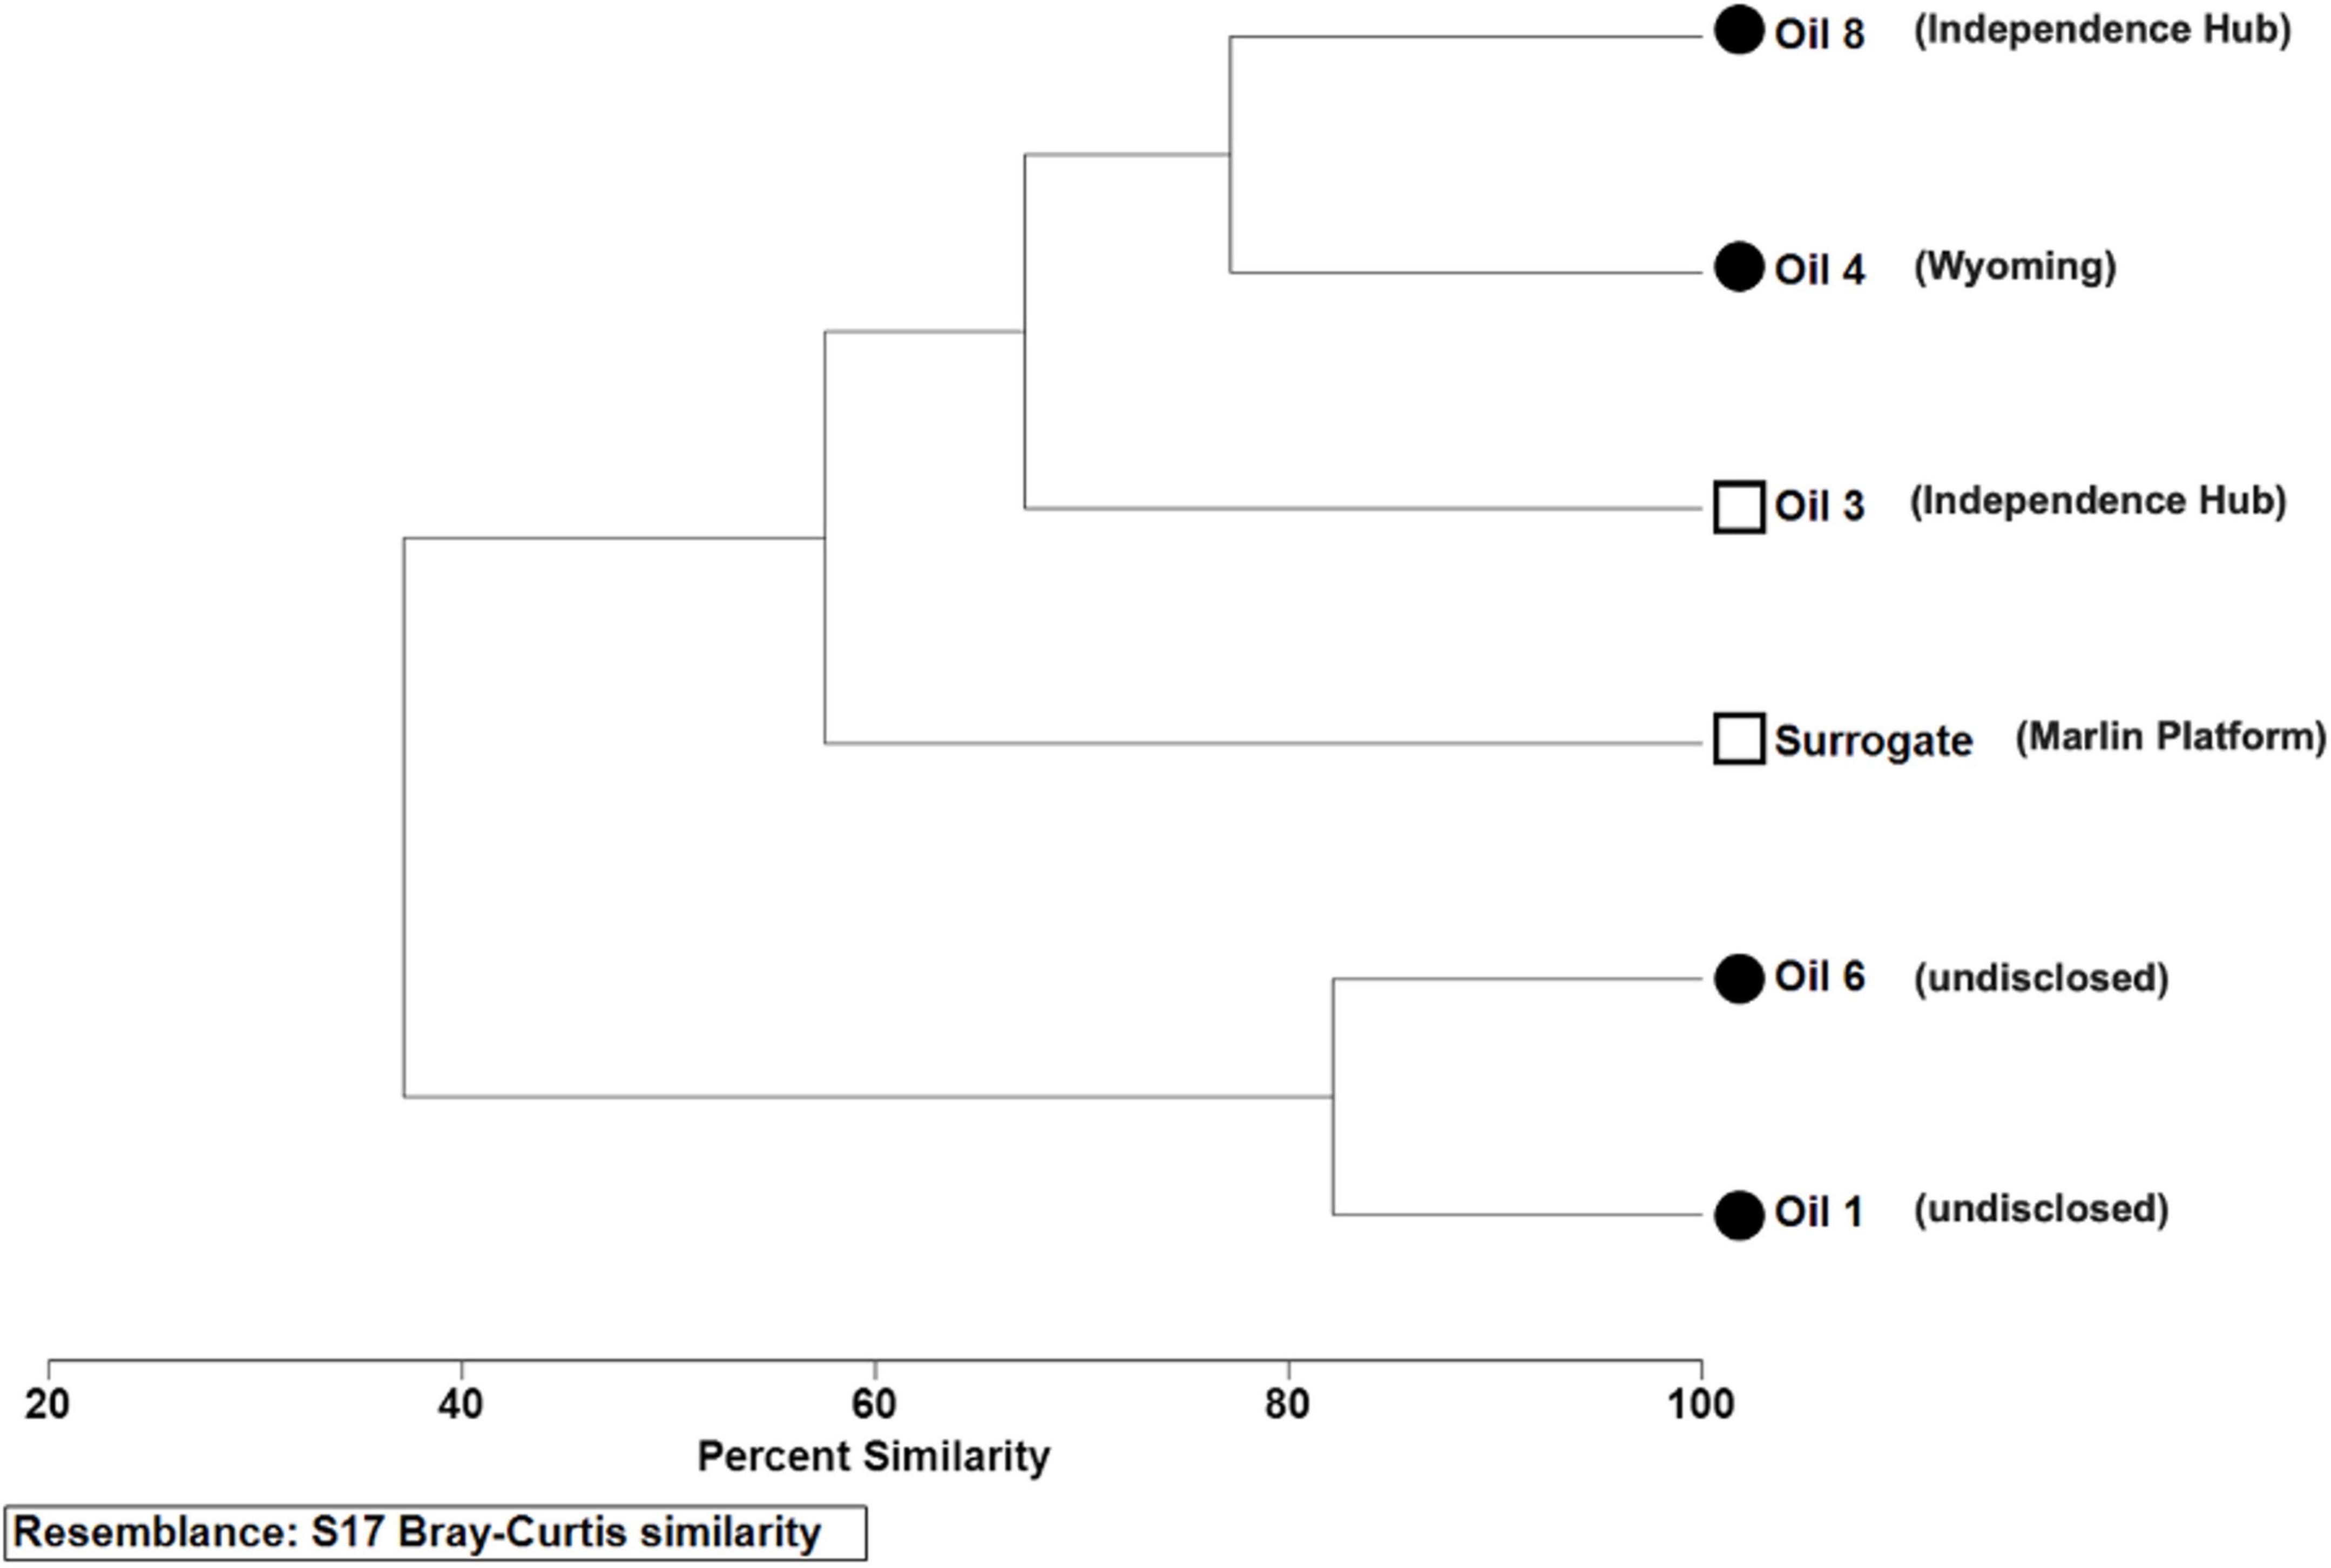
Figure 1. Bray-Curtis similarity dendrogram with clustering based on oil chemical characteristics with scales standardized by min-max transformation. Characteristics include physical and chemical characteristics of crude oil samples as outlined in Table 1, including sweetness, API gravity, and percent mass of C, N, H, and S. Sweetness ranges were defined as “sweet”, for oils with total sulfur <0.5%; “sour”, with total sulfur >0.5%. Circles, sour; Squares, sweet. Open symbols, light crude oils (API > 31.1); closed symbols, medium crude (API 22.3–31.1). Location of oils is indicated in parentheses, to the right of the oil name on the leaf.
3. Results
3.1. Crude oil characteristics
Crude oil samples were medium to light oils (Table 1) with API gravity that ranged 23.8–34.6°. Oils with API gravity >31.1° were considered light crude oils, while oils with API gravity 22.3–31.1° were considered medium crude oils. In total, two oils were light, four were medium, with Oils 6 and 3 being the heaviest and lightest, respectively. Percent carbon ranged 59.4–76.5%, where oil 8 was the lowest and oil 6 was the highest. Hydrogen content ranged 9.1–10.8%, where oil 8 was the lowest and oil 1 was the highest. Nitrogen content ranged 0.19–0.47% where the surrogate oil was the lowest and oil 6 was the highest. Oils 3 and the surrogate were considered sweet oils with total sulfur <0.5%, while oils 1, 4, 6, and 8 were considered sour with total sulfur >0.5%. Oils 1 and 6 had the highest sulfur content.
Oils 1 and 6 were both medium, sour crude oils that were the most similar, based on Bray-Curtis similarity analysis of chemical composition and API gravity (Figure 1). Oils 3, 4, 8, and the surrogate were in a clade separate from oils 1 and 6. The terrestrially derived oil 4 and oil 8 collected from Independence Hub were also both medium, sour crudes that were similar but clustered separately from the other two medium, sour crude oils. Oils 3 and the Surrogate were the only two light, sweet crude oils and were more similar to oils 4 and 8 than oils 1 and 6 on the basis of variables tested.
3.2. Coastal seawater inocula
Coastal seawater was characterized by temperature, salinity, Total Kjeldahl Nitrogen (TKN), Dissolved Inorganic Nitrogen (DIN), Dissolved Inorganic Phosphate (DIP) and control bacterial production prior to each experiment (Supplementary Table 1). The four experiments (using inocula collected between May 17 and June 19, 2017). were performed to determine dose-response, time course models, spectral dependence, and fluorescence correlation, the results of which are each described below (sections “3.4. Dose response,” “3.5. Duration of WAF solar exposure,” “3.6. Spectral dependency,” and “3.7. WAF fluorescence correlation,” respectively). Temperature was relatively consistent in collections for the four experiments performed, ranging from 22.8–24.2°C, while other factors varied slightly (Supplementary Table 1). The seawater collected for the dose response experiment had salinity 27, TKN 0.26 mg L–1, DIN 0.77 μM, DIP 0.02 μM, and control bacterial production of 104 pmol Leu L–1hr–1. The seawater collected for the time course experiment had salinity of 30, TKN 0.28 mg L–1, DIN 0.43 μM, DIP 0.02 μM, and the bacterial production rate was 208 pmol Leu L–1 hr–1. The inoculum for the spectral dependency experiment had salinity 31, TKN 0.42 mg L–1, DIN 0.97 μM, DIP below detection, and the bacterial production rate was 211 pmol Leu L–1 hr–1. The seawater collected for the fluorescence correlation determination had salinity 31, TKN 0.46, DIN 1.00, and DIP was below detection, with a bacterial production rate of 399 pmol Leu L–1 hr–1. Overall, water samples were oligotrophic.
3.3. Average solar irradiance
During WAF preparation for dose response experiments total solar ultraviolet radiation exposure at wavelengths 30, 320, 340, and 380 nm were 0.701, 5.043, 11.655, and 14.566 J cm–2, respectively, with photosynthetically active radiation (PAR) exposure of 37,926 μE cm–2. During WAF preparation for spectral dependency experiments total UV exposure at wavelengths 305, 320, 340, and 380 nm were 0.668, 4.484, 10.270, and 12.637 J cm–2, respectively, with PAR exposure of 31,935 μE cm–2. Daily average measurements at each wavelength and for PAR are in Table 2.
3.4. Dose response
Inhibition increased as WAF concentration in seawater increased for all oils assayed (Figure 2) and the linear relationship between increasing dose and inhibition was strong for all oils with R2 greater than 0.90 (Table 3). The inhibitory dose-response varied overall given significant heterogeneity of slopes (p < 0.001) between oils. Inhibition resulting from WAF made with oil 8 increased the least as concentration was increased, while inhibition resulting from WAF made with oil 4 and surrogate increased the most as concentration was increased. Slopes for each dose-response curve are in Table 3. All pairwise comparisons of dose-response slopes were significantly different (p < 0.01) except for oils 1 and 6 (p = 0.9977) and oil 4 and surrogate (p = 0.7198). At a concentration of 0.5% oils 3, 4, 8, and the surrogate demonstrated bacterial production rates significantly different than the control with p-values of 0.00016, < 0.0001, 0.01868, and < 0.0001, respectively, while oils 1 and 6 were not significantly different from the control with p-values of 0.8563 and 0.3552, respectively. At a concentration of 1% WAF to seawater all oils were significantly different from the control (p < 0.001). As concentration increased so did the detectability of significant differences in microbial inhibition resulting from each different oil. Complete homogenous subsets at each separate concentration are presented in the (Supplementary Table 2) and the (Headrick, 2019; Supplementary Data Spreadsheet).
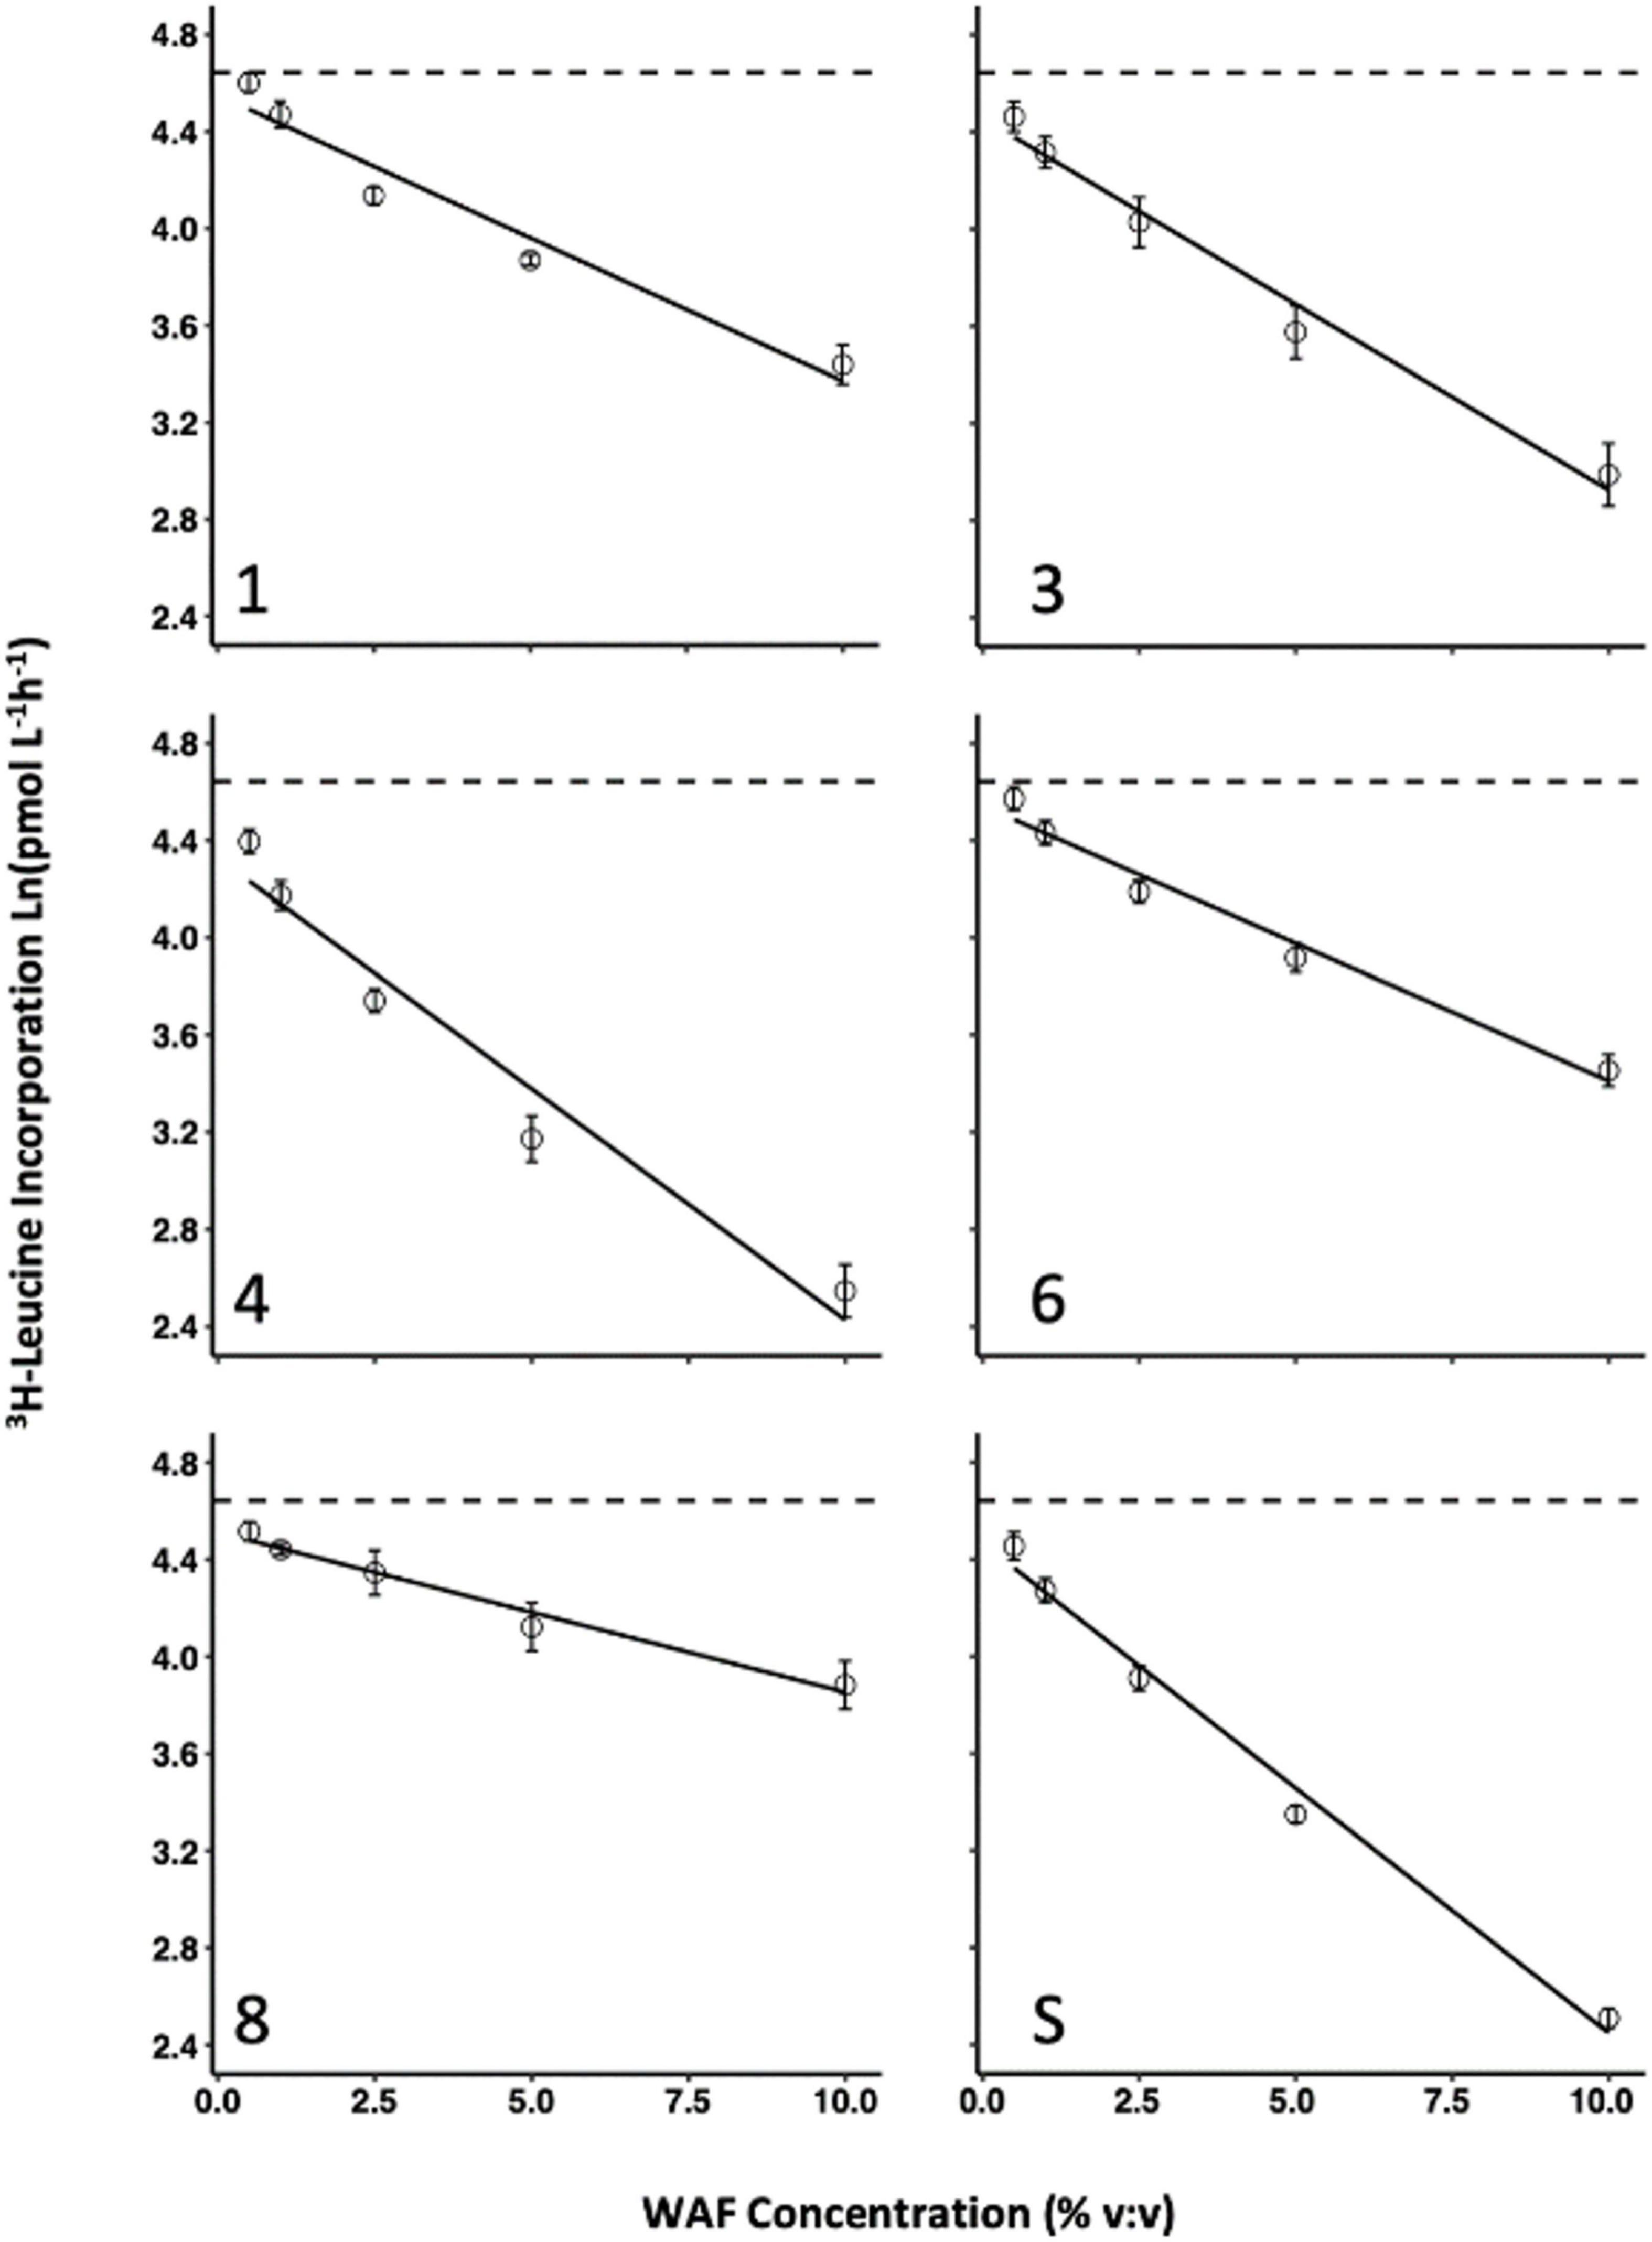
Figure 2. Bacterial production response to increasing WAF dose for all 6 oils. WAF dose response of bacterial production (3H-Leucine incorporation) for each of the 6 oils used in this study. Error bars represent the standard deviation of the mean of experimental replicates from the same WAF preparation.
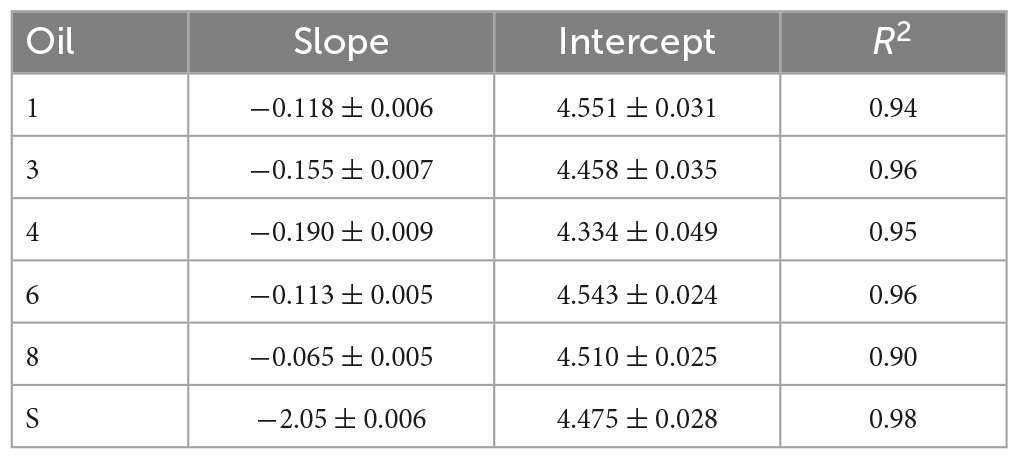
Table 3. Models for dose response of bacterial production inhibition.
3.5. Duration of WAF solar exposure
Cumulative solar exposure over each period (24–196 h) was calculated during WAF preparation (Table 4). WAFs were exposed to a daily average of 0.08 J cm–2 of UVB, 0.53 J cm–2 of UVA320 nm, 1.22 J cm–2 of UVA340 nm, 1.49 J cm–2 of UVA380 nm, and 3704 μE cm–2 PAR. UV-exposure after just 24 h at wavelengths 305, 320, 340 nm, and 380 nm were, respectively, 0.093, 0.657, 1.523, and 1.894 J cm–2, with PAR exposure of 4883 μE cm–2. After 196 h of solar irradiance, cumulative UV-exposure at wavelengths 305, 320, 340, and 380 nm were, respectively 0.621, 4.237, 9.742, and 11.908, with PAR exposure of 29,630 μE cm–2. Data for remaining time points are in Table 4.
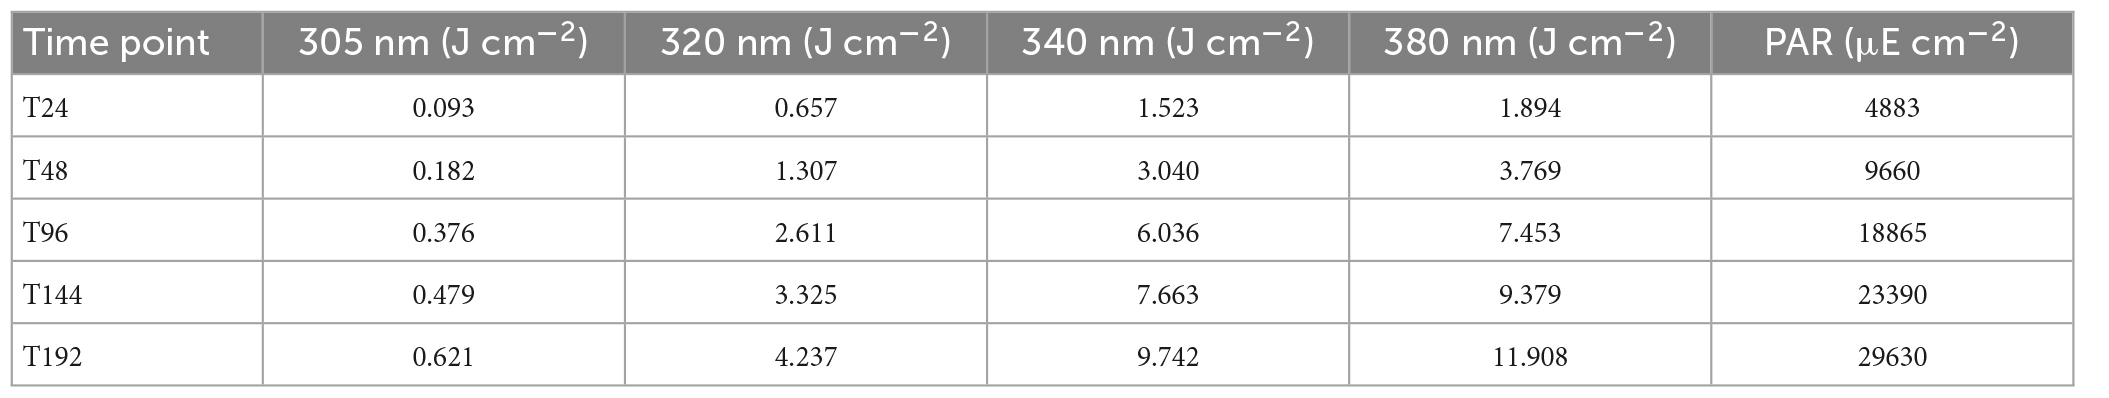
Table 4. Cumulative solar exposure for each WAF preparation time point in the duration of WAF solar exposure experiment.
The rate by which increased WAF solar exposure affected inhibition varied overall (Figure 3) given by significant heterogeneity of slopes (p < 0.0001). WAFs, except those made with oils 3 and 8, generally were inhibitory to bacterial growth when prepared under higher amounts of solar exposure. Slopes for all WAF treatments were significantly (p < 0.0001) different from a control with a slope of zero, except for Oils 3 (p = 0.5267) and 8 (p = 0.5654). All pair-wise comparisons of slopes were significantly different (p < 0.05) except for oils 1 and 6 (p = 0.9803), and oil 4 and the surrogate (p = 0.116). Oil 4 was represented by the strongest negative correlation of decreasing bacterial production due to increasing WAF solar exposure time.
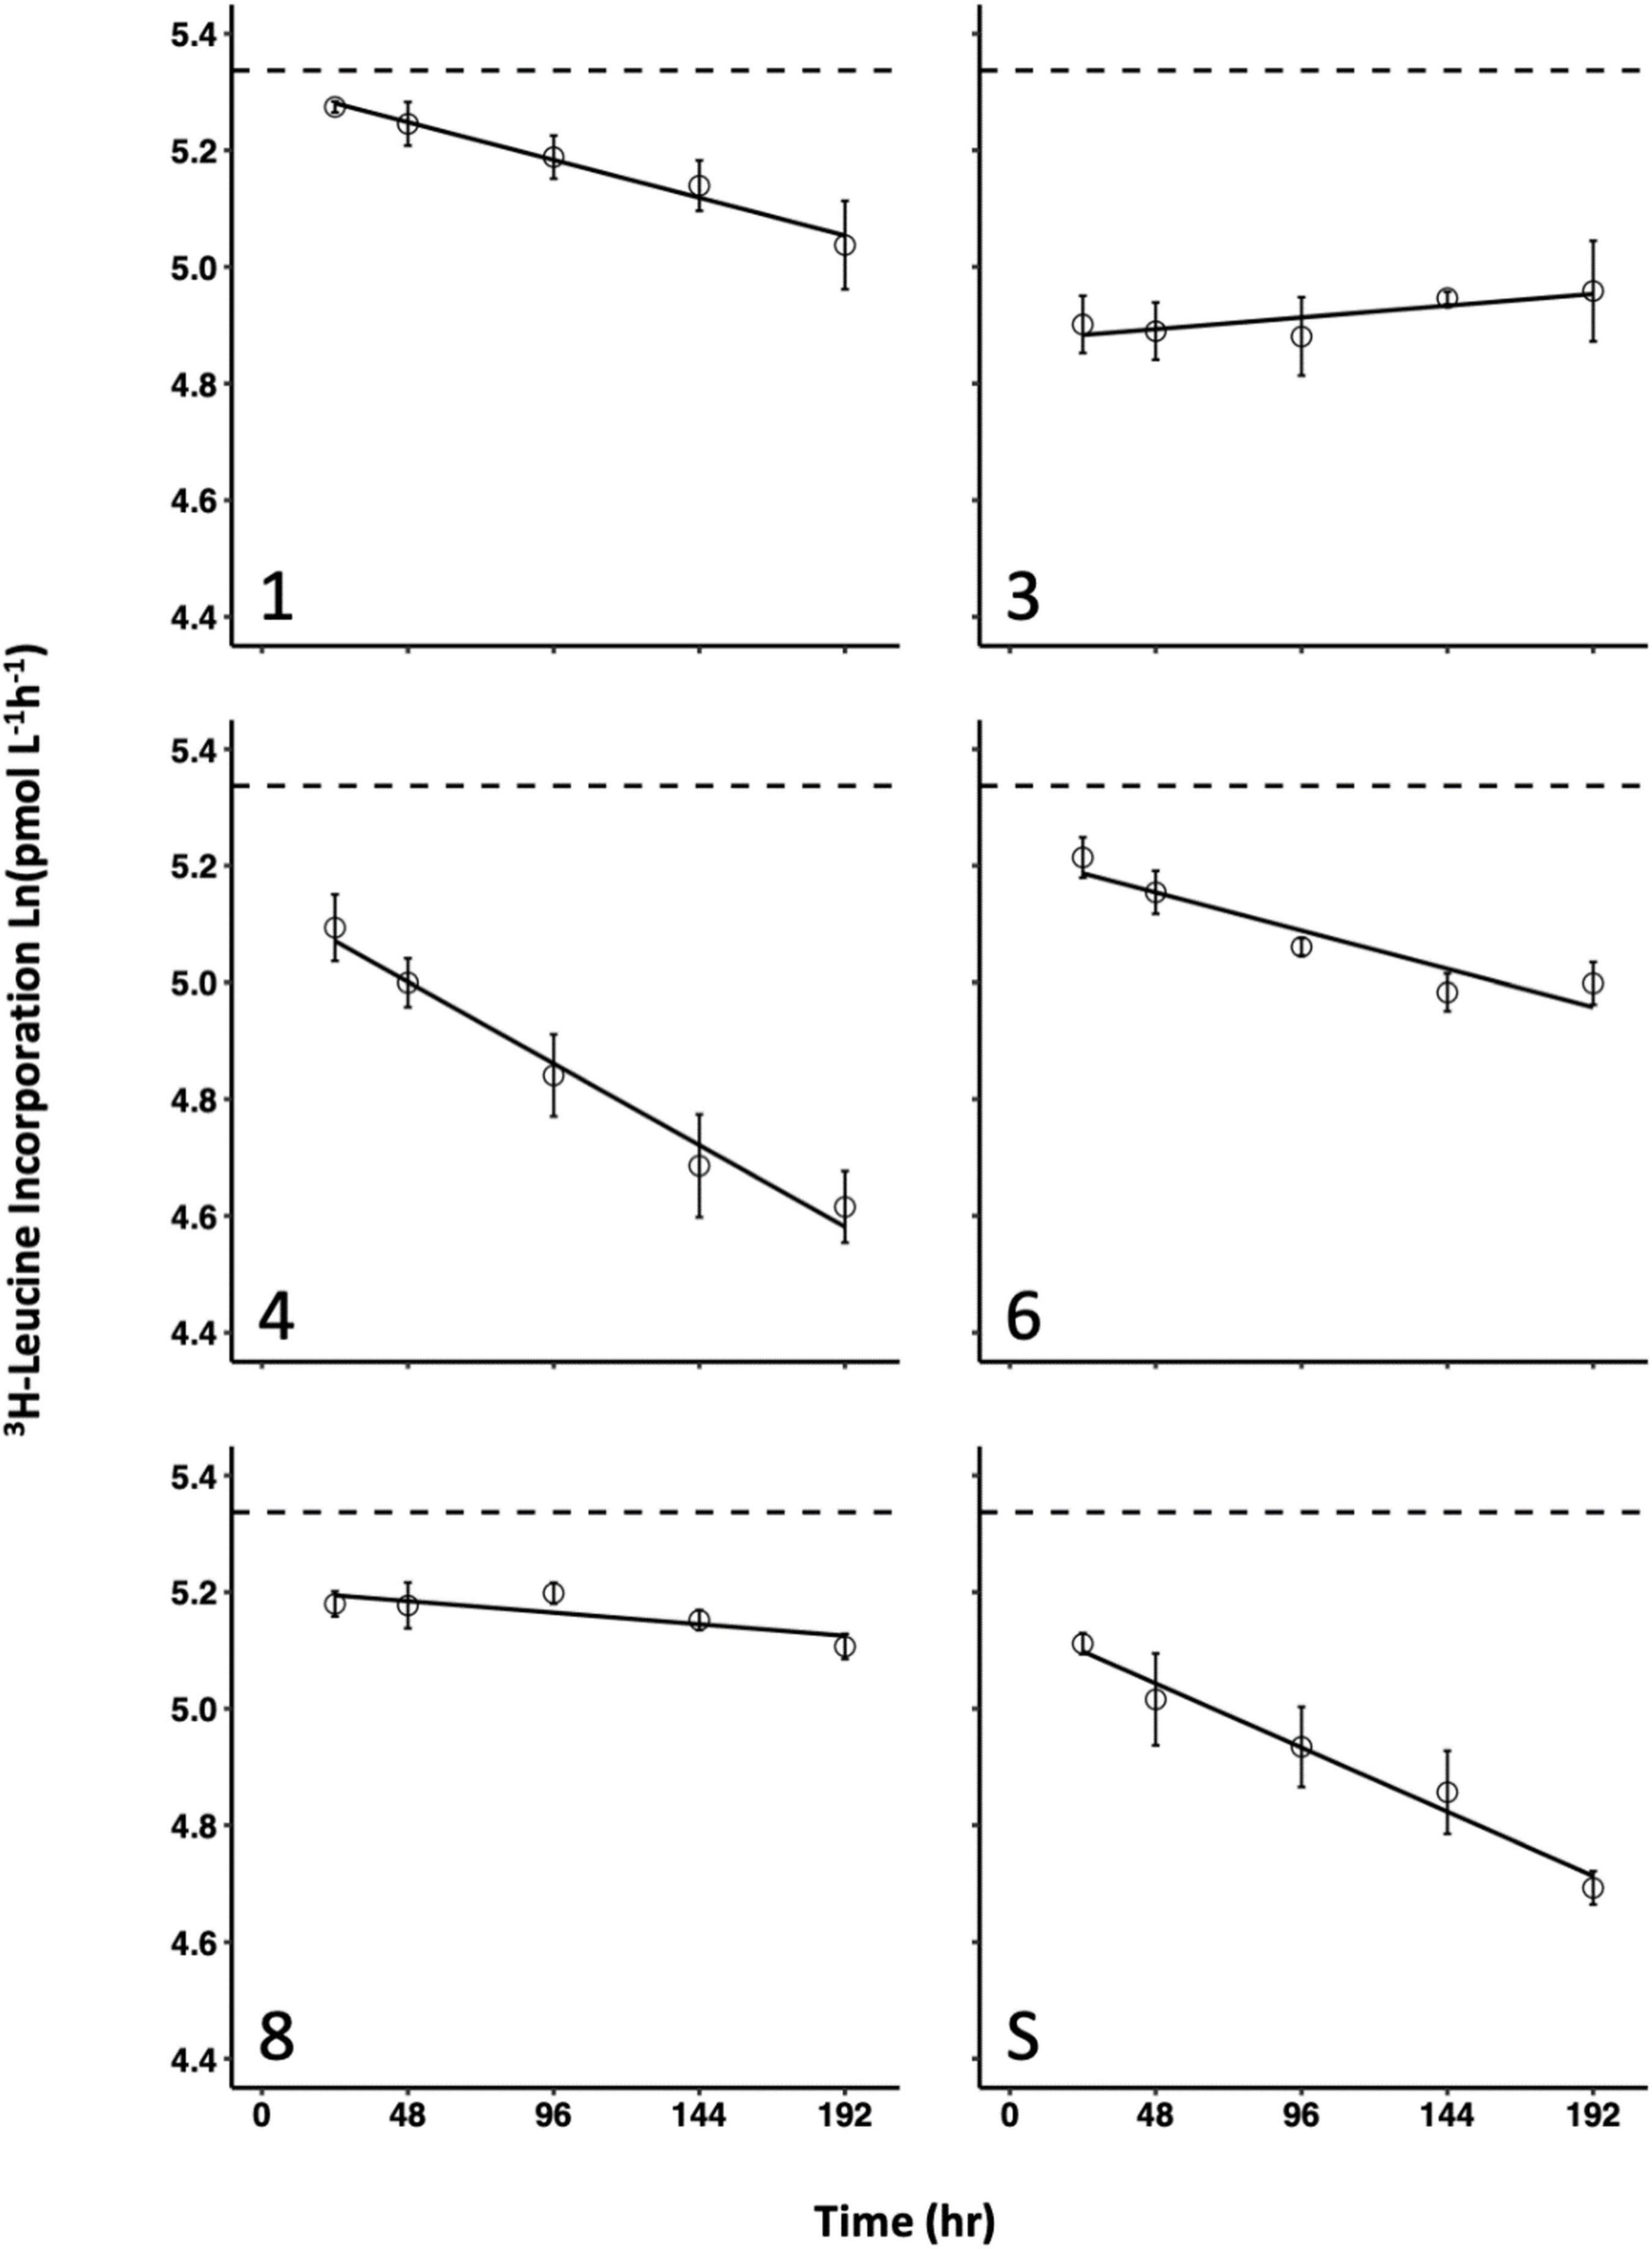
Figure 3. Response of bacterial production (3H-Leucine incorporation) with various solar exposure times for each of the 6 oils used in this study. Error bars represent the standard deviation of the mean of experimental replicates from the same WAF preparation.
Beyond linear models, three distinct patterns between bacterial production and time of WAF solar exposure were observed. Oils 3 and 8 were effectively inhibitory after 24 h and did not change thereafter, oil 1 and the surrogate continuously increased in inhibition as WAF solar exposure time increased, and oils 4 and 6 were represented by higher inhibition at each time point up to 144 h but were relatively unchanged between the time points of 144 h and 192 h.
All oil WAFs solar-exposed for 24 h, resulted in significant inhibition relative to the control (p < 0.01) except for oil 1 (p = 1.00). While inhibition was greater resulting from oil 1 WAF solar-exposed for 48 h, there was still no significant difference between oil 1 and the control (p = 0.09). All oil WAFs solar-exposed for 96 h, including oil 1, resulted in significant inhibition relative to the control (p < 0.0001). After the first 24 h, oil 3 was the most inhibitory, however, at the end of the week-long exposure, oils number 4 and the surrogates, which were statistically indistinguishable at the final time point (p = 0.6677), were the most inhibitory WAF treatments. Complete homogenous subsets at each separate time point are presented in the (Supplementary Table 3), and in the (Headrick, 2019; Supplementary Data Spreadsheet).
3.6. Spectral dependency
Water accommodated fractions prepared in the dark resulted in little to no inhibition while WAFs prepared in Full Sun or in PAR inhibited bacterial production (Figure 4). Counter to the standard pattern, FS WAF from oil 8 was not any more inhibitory than its dark counterpart. WAFs prepared in the dark were found not significantly different from the control, except for oil 8 (p = 0.024). However, Oil 8 WAF prepared in the dark was not significantly different from dark WAFs of oils 1, 3, 4, and 6.
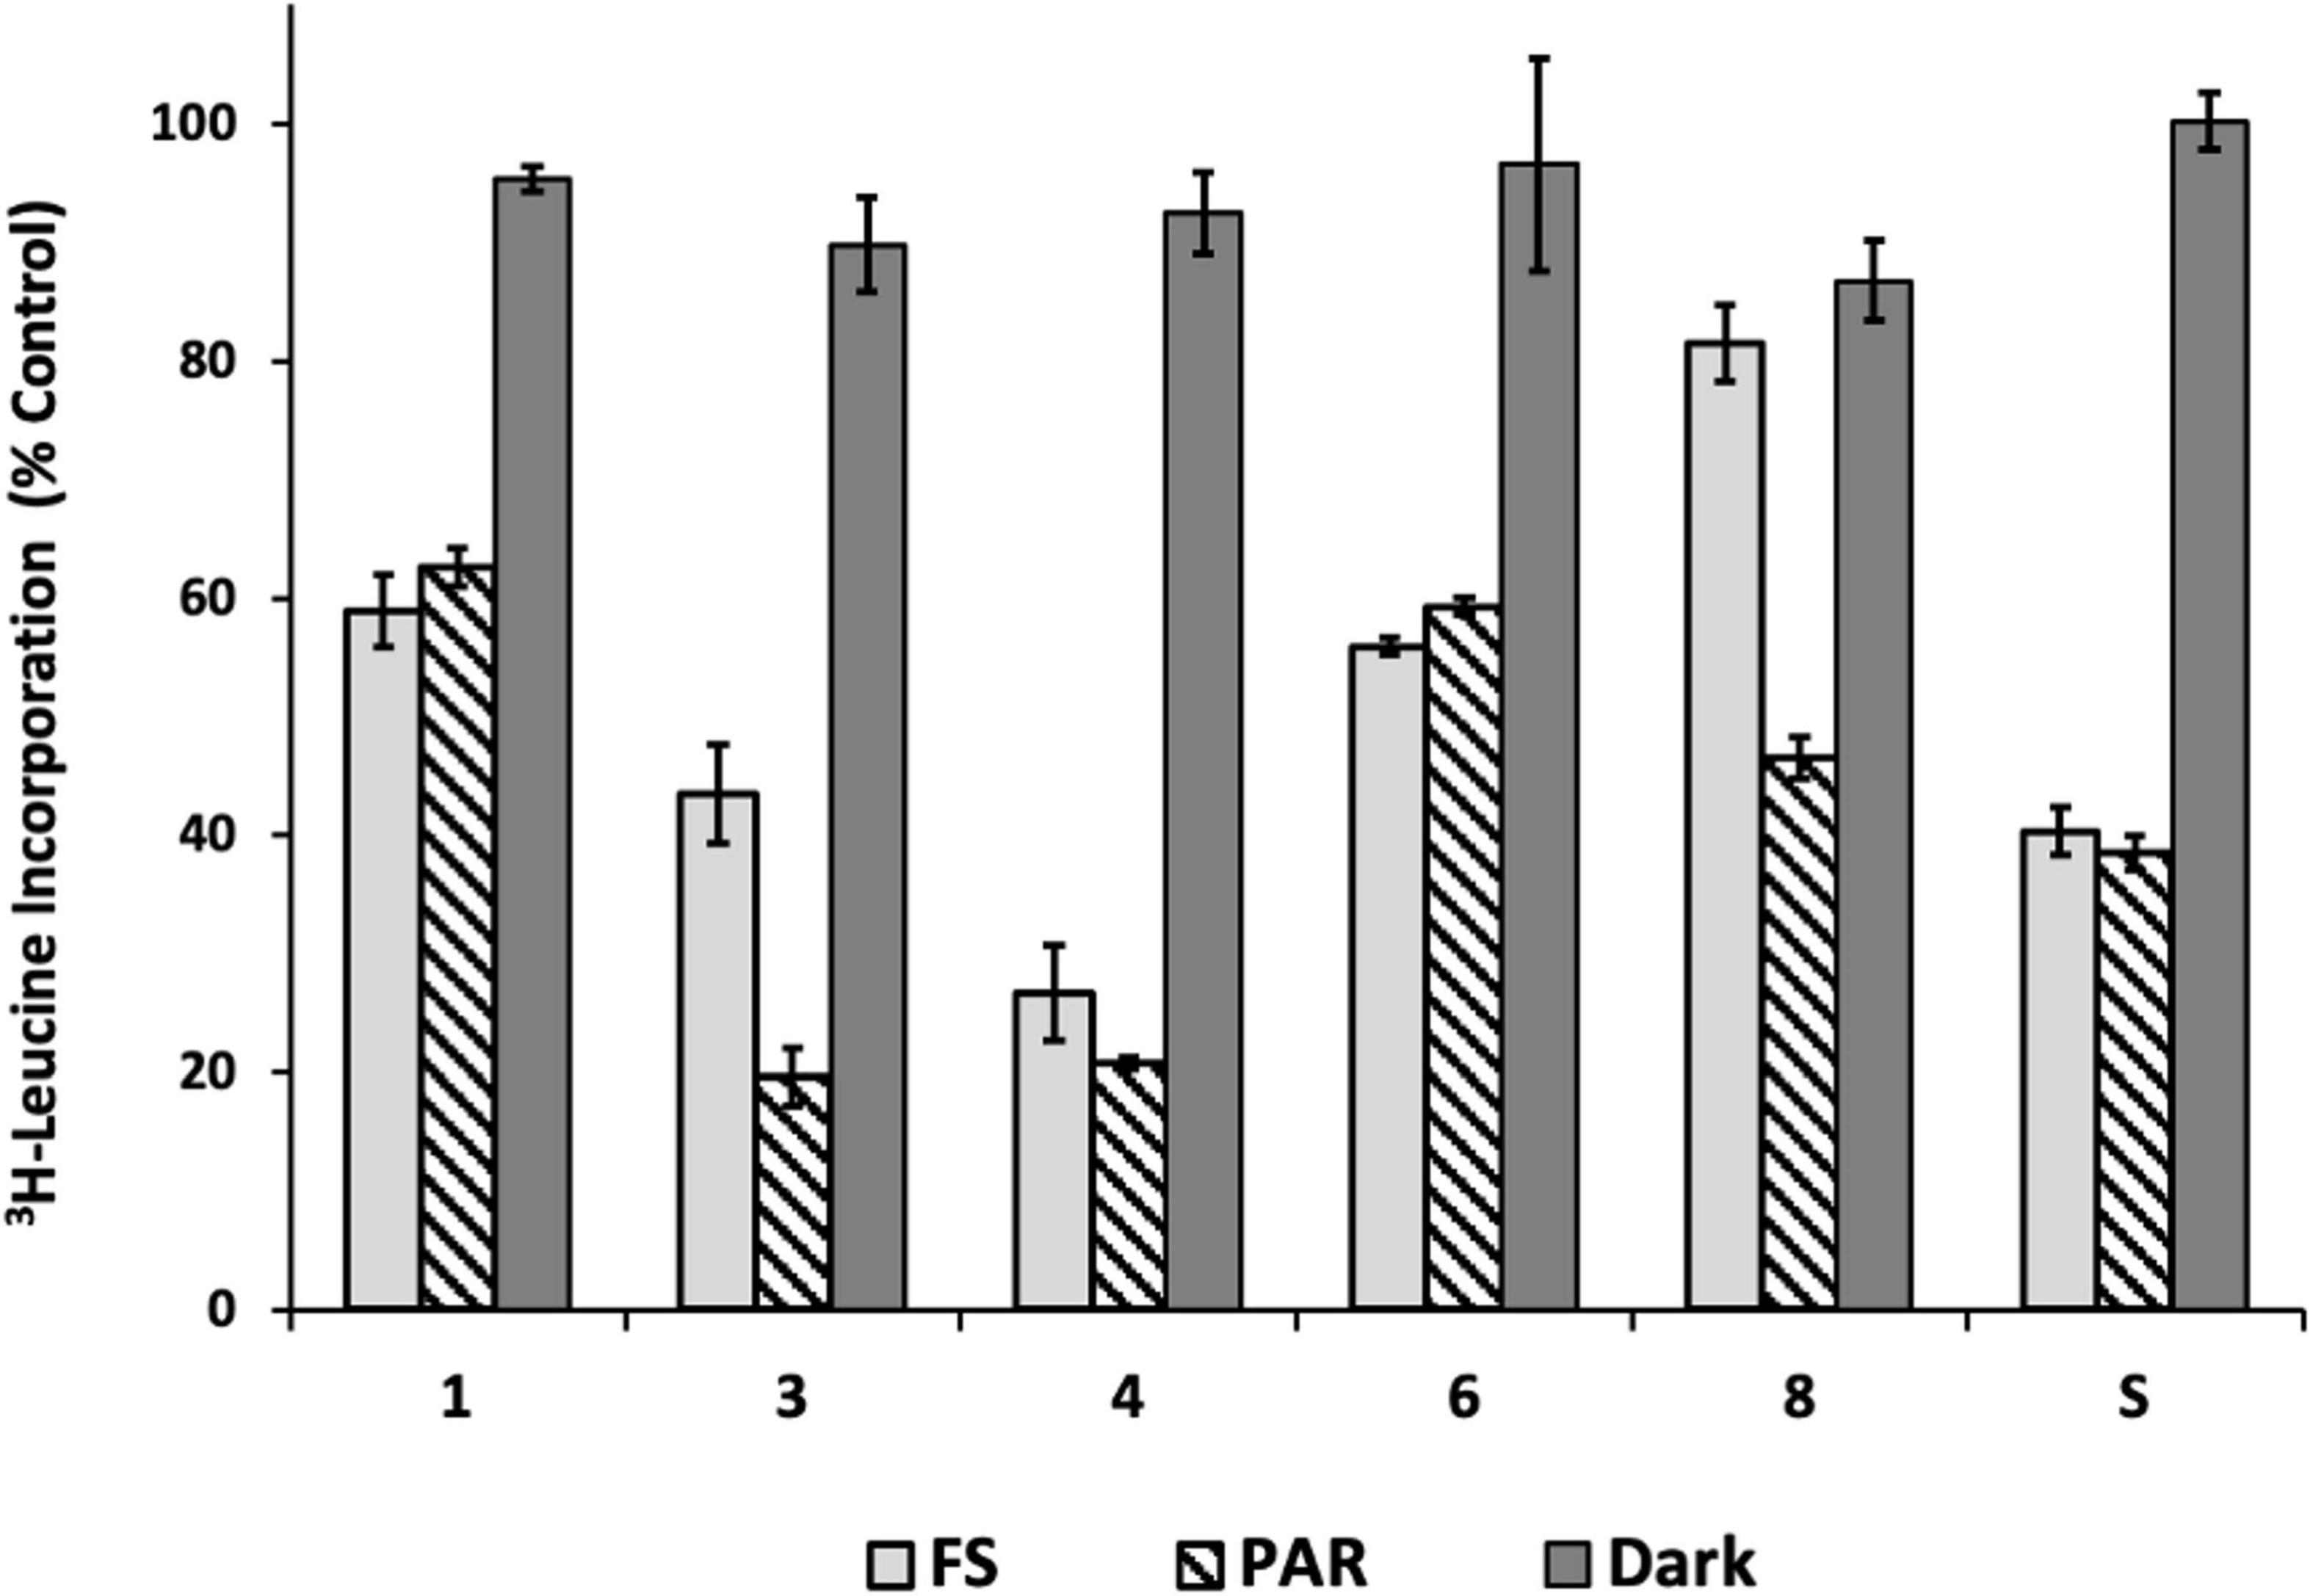
Figure 4. Inhibition of bacterial production (3H-Leucine incorporation) as a result of light exposure during WAF preparation. Significance levels of pairwise comparisons (WAF made in FS treatment vs. WAF made in dark, and PAR treatment vs. dark WAF) are indicated (p level indicators here). Inhibition of bacterial production (3H-Leucine incorporation) is expressed as a percent of the control. P-values for multiple comparisons within and between oils are in the [Headrick (2019); Supplementary Data Spreadsheet].
For most oils, inhibitions resulting from PAR and FS exposure were similar. Oils 3 and 8 WAFs were far more inhibitory after PAR exposure than FS. WAFs prepared in FS for all oils were different overall, with few that elicited similar inhibition. Oils 1 and 6 in FS were similar (p = 0.878), and oils 3 and Surrogate were also similar (p = 0.824). WAFs prepared in PAR for all oils were also different overall, with two exceptions. Again, oils 1 and 6 in PAR were similar (p = 0.159), and oils 3 and 4 were also similar (p = 0.946). PAR WAFs from oils 3 and 4 were the most inhibitory treatments overall. Additional comparisons are in the (Supplementary Tables 4, 5) and the (Headrick, 2019; Supplementary Data Spreadsheet).
3.7. WAF fluorescence correlation
Water accommodated fractions fluorescence was higher in FS WAFs vs. Dark counterparts for all oils investigated (Figure 5A). Fluorescence was highest in FS WAF from oil 4, followed by FS WAF from the surrogate oil. WAF fluorescence was lowest in all Dark WAFs. The highest fluorescence in Dark WAFs was from oil 8, followed closely by oil 3. Overall, acute bacterial production inhibition was positively correlated with higher WAF fluorescence (r = 0.856, p = 0.000774, n = 11; Figure 5B). FS WAFs assessed separately appeared to be positively correlated with bacterial production inhibition but this relationship was not significant (r = 0.583, p = 0.2247, n = 6). Similarly, Dark WAFs assessed separately appeared to be positively correlated with bacterial production inhibition, but this relationship was not significant (r = 0.415, p = 0.4874, n = 5).
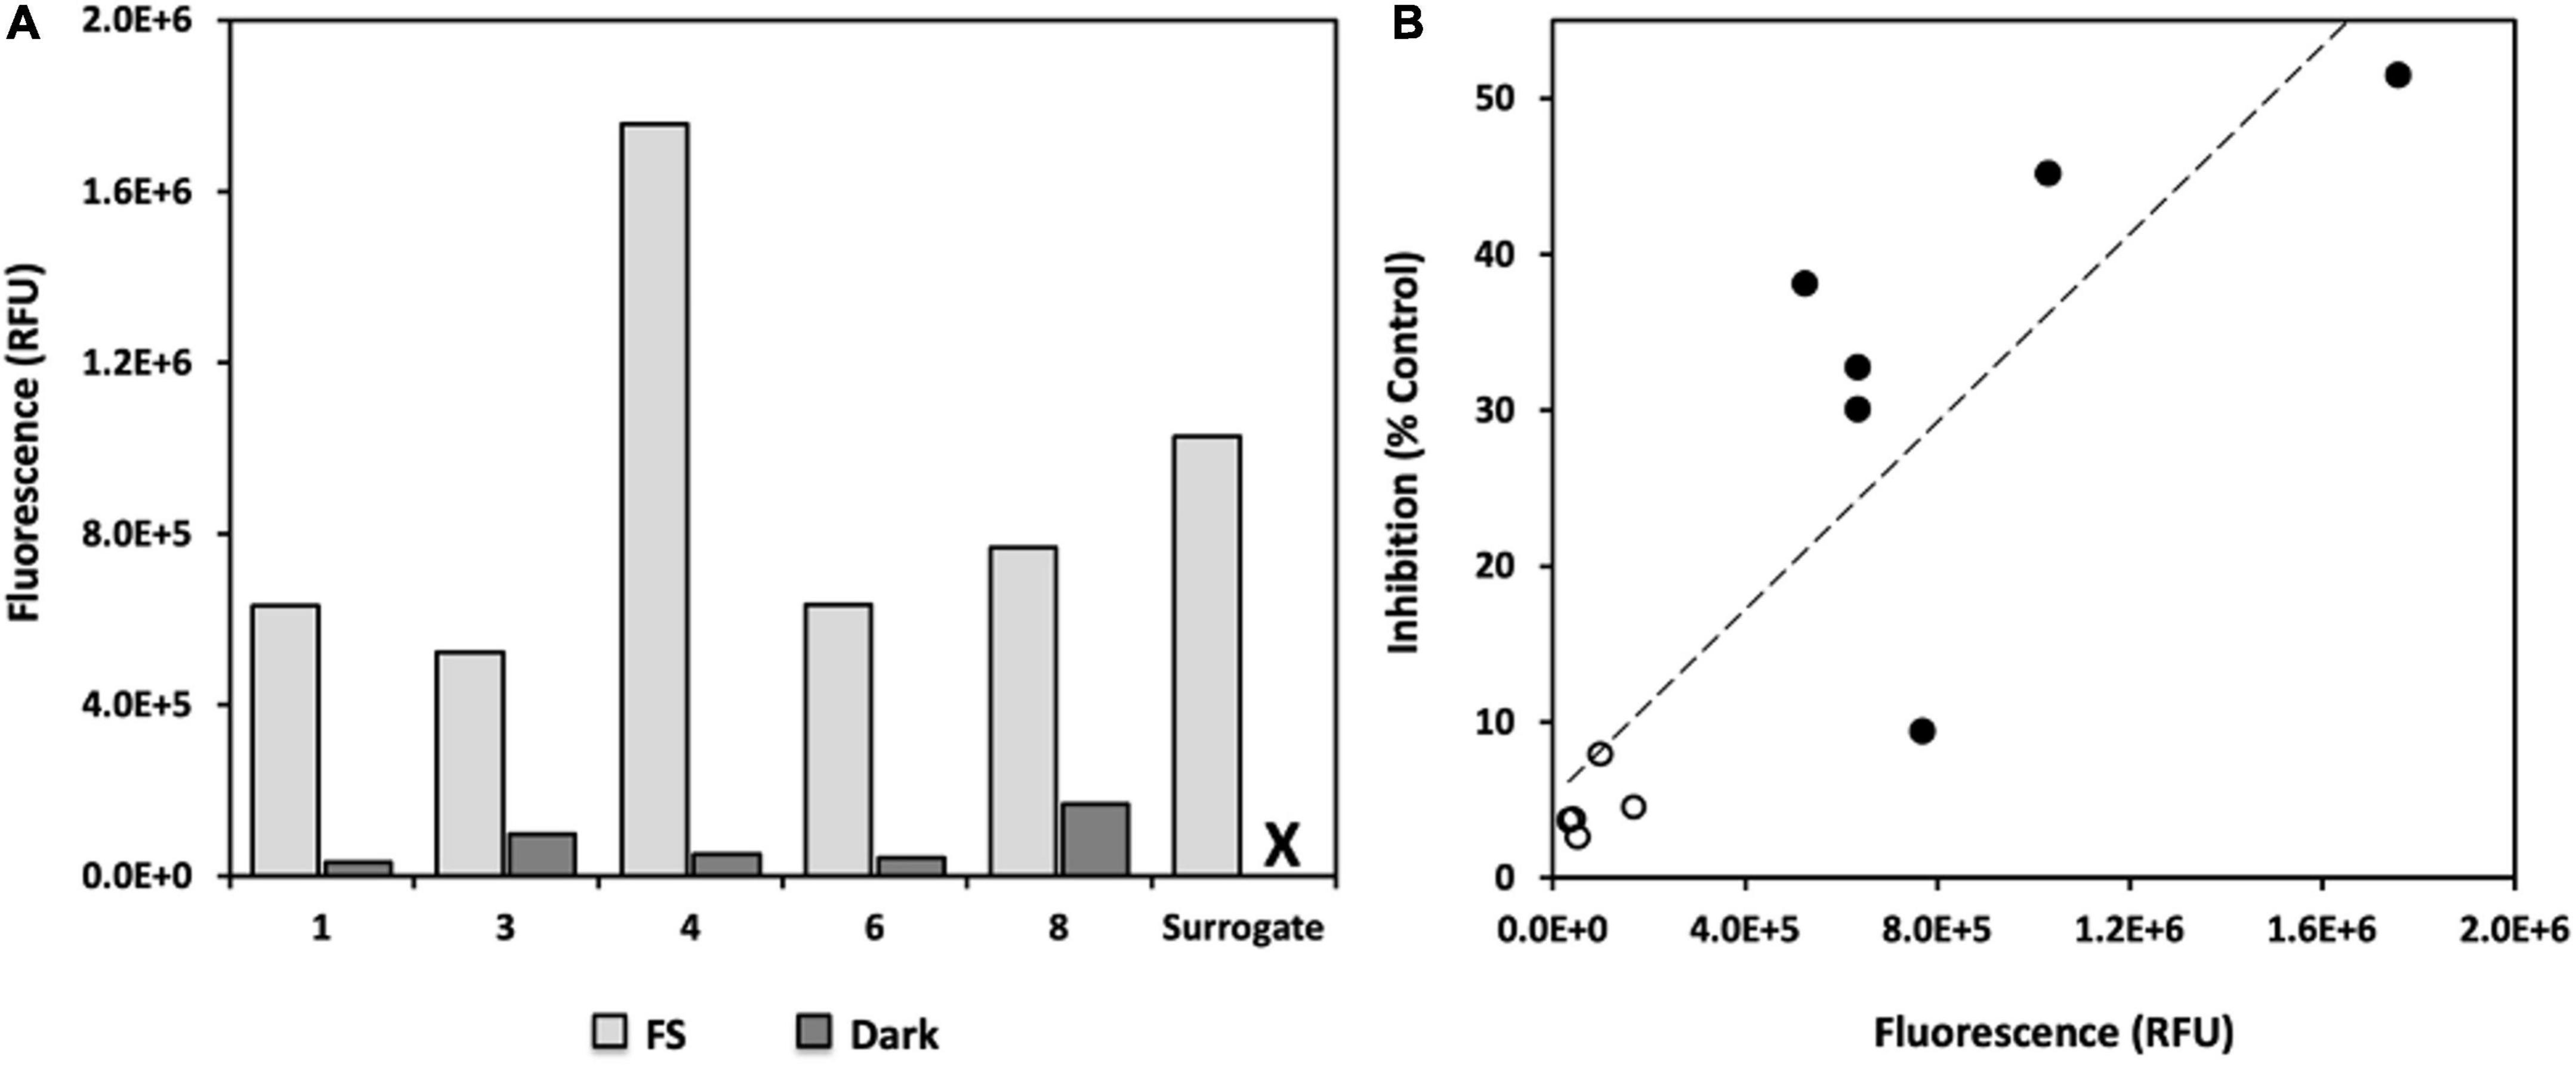
Figure 5. Fluorescence of WAFs after exposure of 8 days of sunlight (or dark incubation for 8 days). (A) FS (light gray) and dark (dark gray) WAF fluorescence (ex. 365 nm, emiss., 410–600 nm) measured for each pooled WAF preparation and reported as relative fluorescence units (RFU) after subtracting the background fluorescence of the sterile seawater used to prepare WAFs; X = no fluorescence data for surrogate WAF prepared in the dark as sample was lost prior to analysis. (B) Correlation of bacterial production inhibition with WAF fluorescence. Inhibition of bacterial production (3H-Leucine incorporation) is expressed as a percent of the control; open circles, Dark WAFs; closed circles, FS WAFs.
4. Discussion
Inhibition of bacterioplankton activity due to the introduction of different crude oil WAFs was variable, dependent on the oil source, amount of oil to which the organisms were exposed, and the amount and part of the solar spectrum to which the WAFs were exposed. There was no uniform or consistent response. Inhibition of bacterial production was strongly affected by increasing the dose of crude oil FS WAFs for all oil sources tested. Higher doses of WAFs from oil 4 and the surrogate had the strongest effect on inhibition while higher doses of WAF from oil 8 affected inhibition the least. We found that the lowest concentration at which all crude oil sources resulted in significant inhibition relative to a control was with 1% FS WAF per sample, where the WAF was prepared with 1% oil in seawater. At a concentration <1%, some oils (# 1 and # 6) may not result in significant inhibition. At higher concentrations, FS WAFs from the six different oils were statistically more different than at lower concentration. We found some pairwise similarities among oils, with regard to oil characteristics with continuous values (API gravity, carbon, hydrogen, nitrogen, and sulfur) (Figure 1). Overall, however, the main consideration of effect of WAF concentration on inhibition of bacterial production suggests that each oil has a distinct inhibitory effect (Figures 3, 4). For instance, all pair-wise comparisons of slopes were significantly different except for oils 1 and 6 and oil 4 and the surrogate. These data in total are supported by similar previous work. In a monoculture growth study, higher concentrations of single crude oil components were found to increasingly inhibit bacterial growth (Ma et al., 2015). Exposure of the culture to increasing concentrations of larger, more complex crude oil compounds resulted in greater inhibition or death when compared to increasing concentrations of less complex crude oil compounds (Ma et al., 2015). Increasing concentration of crude oils overall has also been shown to decrease biodegradation rates, however, this is largely dependent on the chemical makeup of the oil (Balasubramaniam et al., 2015). Higher concentrations of n-Alkanes decreased the biodegradation rate, while higher concentrations of PAHs increased biodegradation rate; yet, again, this is still dependent on the PAHs in the mixture (Balasubramaniam et al., 2015). With the newly reported data in our study on acute bacterial production differences between source oils, it is reasonable to conclude that microbial responses to higher concentrations of crude oil WAFs would greatly depend on the type of oil and the chemical composition of the oil. Further, we hypothesized that as crude oil components are photodegraded, the compounds available in seawater would change, leading to additional differences in microbial response as our results confirm. Complete chemical analyses were beyond the scope of the project and further hindered by the very limited supply of some of the oils.
Inhibition of bacterial production in seawater was shown to be positively correlated with greater solar exposure of MC252 and MC252-surrogate WAFs and both oils resulted in similar amounts of inhibition (Vaughan et al., 2016). Our study has sought to measure the acute direct effect of increasingly irradiated crude oils from varied sources on bacterial production. We found that WAFs exposed to greater doses of solar exposure inhibited bacterial production more, though not at the same rate for all oils tested. This may be attributed to varied concentrations of different PAH species present in the different oils which may respond differently to solar exposure, more so than the n-alkanes in the parent oils (Bacosa et al., 2015b; Balasubramaniam et al., 2015). Increased depletion of PAH concentrations in seawater amended with MC252 crude oil has been linked to higher doses of solar exposure in a sterile mixture (Bacosa et al., 2015b). However, increased solar exposure was shown to have little effect on n-alkanes in a sterile mixture, while a seawater inoculum amended with MC252 crude oil demonstrated that biodegradation was the prominent factor in the depletion of n-alkanes (Bacosa et al., 2015b). The effect of increasing solar exposure is dependent on the source of the oil, and presumably the chemical composition. Consequently, the response to all oils is not the same and complicates the ability to make broad predictions about how spills might affect the environment.
Photodegradation of crude oils has been attributed to ultraviolet (UV) exposure (as reviewed in Lee, 2003), but the use of broad-band cutoff filters has shown the importance of PAR on WAFs (Vaughan et al., 2016; this study). The inhibitory response to most WAFs prepared in FS was indistinguishable from inhibitory responses to WAFs prepared under PAR-only conditions. In contrast, WAFs from oils 3 and 8 were more inhibitory under PAR-only conditions, but the additional UV-radiation in full sun exposure resulted in a reduction of toxicity. This was unexpected and was confirmed by a second trial with similar results (data not shown). Oils 3 and 8 were recovered near Independence Hub, a well in the Gulf of Mexico that contains a compound known as perylene which makes these oils blue in color (Juyal et al., 2011). Perylene is a 5-ring organic PAH that is recognized in industry as a photoredox catalyst when exposed to visible light (He et al., 2018; Gao et al., 2019), which may explain the greater inhibition seen from oils 3 and 8 under PAR-only conditions relative to the FS and dark counterparts. We hypothesize that UV-exposure may affect perylene in a way that quenches photocatalytic properties, however, further investigation is needed. Future analysis on the chemistry of FS WAFs created from these two oils that result in less inhibition as compared to PAR counterparts is necessary to better understand the relationship between hydrocarbons and solar irradiation, and subsequent effects on bacterioplankton.
In addition to varied effects on acute inhibition, WAFs from different oil sources under different solar regimes varied in fluorescence as a result of photochemical changes during WAF production. Fluorescence and inhibition were positively and strongly correlated overall (r = 0.856, p = 0.000774). Fluorescence was used as a proxy for hydrocarbon concentrations dissolved in seawater WAFs (Sørstrøm, 1985; Genders, 1988). Our solar-exposed WAFs had higher fluorescence than dark counterparts (excitation: 365 nm, emission: 410–600 nm, as per Ziervogel et al., 2014). Our WAFs mimicked natural conditions under which oil and water mix during a spill. WAFs were prepared during solar exposure and were consistently mixed with 1% (v/v) crude oil over the course of 8 days. We subsequently separated the aqueous fraction from the remaining oil layer and measured the fluorescence of the aqueous fraction. Our WAFs were also prepared in sterile seawater, removing any effects of biodegradation on oil components. Our data shows that increased solar exposure during contact of oil and seawater may create fluorescent oil components more miscible with the aqueous fraction.
PAHs are largely responsible for the fluorescence of oil (Owen et al., 1995; Groner et al., 2001; Hou et al., 2019) and are also responsible for most of the toxicity of petroleum (Jiang et al., 2010). Smaller PAHs tend to be more toxic because of bioavailability (miscibility), but toxicity is not always correlated to the number of aromatic rings (Yan et al., 2004; Jajoo et al., 2014). Crude oil PAHs are known to be more toxic when irradiated (Yan et al., 2004; Fu et al., 2012), and can cause cellular DNA damage (Toyooka and Ibuki, 2007). Without knowing PAH concentrations in dark vs. sunlight exposed WAF, we are unable to define what component is leading to greater acute toxicity in our samples, but we do know that the fluorescence of the WAF is strongly and positively correlated with increased inhibition and that PAHs are usually responsible for higher fluorescence in oil treated seawater.
Previous studies suggest that increased solar exposure results in lower fluorescence (Ehrhardt et al., 1992; King et al., 2014; Snyder et al., 2021) although results could be a function of differences in experimental design. For instance, solar-exposure of samples ranged from a simulated 12 days (Ehrhardt et al., 1992; King et al., 2014) up to 67 days (Snyder et al., 2021) and the UV-exposure rate also varied (King et al., 2014). Two of the previous studies were conducted using sterile seawater (King et al., 2014; Snyder et al., 2021), while used non-sterile seawater filtered only to remove large particles (Ehrhardt et al., 1992). Most importantly, the sunlight-exposed fraction and measurements reported varied between studies, whereby some measured changes in fluorescence of solar-exposed WAFs in the absence of oil (Ehrhardt et al., 1992; Snyder et al., 2021), and another measured the fluorescent compounds in the oil fraction extracted from a solar-exposed oil-in-water mixture (King et al., 2014). These studies seem to point toward an expected decrease in fluorescence due to solar exposure, although Snyder et al. (2021) reported results similar to ours. When solar exposure occurs during WAF formation and seawater is constantly in contact with an oil slick, water soluble compounds continue to move from the oil slick into the WAF, confirmed by both increased fluorescence and increased dissolved organic carbon measurements. The duration of solar exposure recorded to yield maximum water-soluble oil compounds is recorded as 96 h of simulated solar exposure (Snyder et al., 2021). Since our WAFs were solar-exposed during WAF-formation, our results indicated that natural sunlight facilitates the dispersal of fluorescent oil constituents from the oil fraction to the WAF relative to the dark control, likely due to chemical alterations of PAHs that affect hydrophobicity (Yan et al., 2004). Additionally, dispersed oil in WAFs is more bioavailable (Ziervogel et al., 2014) which corresponds to the higher acute (4 h) inhibition observed in FS WAFs vs. dark counterparts.
Water accommodated fractions from different crude oils produced under solar irradiance are prone to differences in photochemical change due to the complexity of crude oil sources, even when oils are geochemically similar (Ray et al., 2014; Vaughan et al., 2016; Benigni et al., 2017). Among the six oils, FS WAF of oil 4 consistently resulted in the highest level of inhibition. The only oil examined that was not recovered from the GOM was Oil 4 and its distinct origin may be responsible for its elevated effect on inhibition of GOM microbes. This implies that greater microbial inhibition may result from a tanker oil spill in which oil from a non-local source is introduced to indigenous microbial communities. Oil 4 is light crude that also resulted in high WAF fluorescence suggesting a high solubility of hydrocarbon constituents and higher toxicity to the microbial inoculum. Oils 1 and 6 were determined to similarly affect bacterial production across all aspects of our study and were also chemically similar medium to heavy sour crude oils (Figure 1). On the other hand, oils 4 and 8 were chemically similar with regard to the parameters measured (Figure 1), however, elicited very different microbial responses in all parts of this study. Future studies investigating more chemical components of irradiated crude oil WAFs are necessary to fully understand what photochemical changes are affecting bacterial production.
Future investigations should also consider modifying the standard CROSERF WAF preparation methods. In doing so, we can better investigate the dynamic interactions between microorganisms, crude oil, and the natural environment. The current method for WAF production is to mix 1% oil in water and incubate in the dark with moderate mixing for up to 24 h (Aurand and Coelho, 2005). However, the results of this current study demonstrate the diverse response of bacterioplankton to oil WAFs which is largely dependent on exposure to natural sunlight. Irradiated WAFs were consistently represented by greater amounts of acute inhibition of bacterioplankton while WAFs prepared in darkness had minimal effects on microbial inhibition. Since oil spills from tankers occur under direct sunlight and oil well blowouts usually have some portion of oil that reaches the ocean surface, it is important to take this discrepancy between light and dark exposed WAFs into consideration experimentally and ecologically. The vast difference between irradiated and non-irradiated WAFs validates the need for restructuring the standard CROSERF WAF preparation protocol to include a solar exposure component.
We have observed increased inhibition of bacterial production by Surrogate oil WAFs after as little as 2 h solar exposures (data not shown). If a solar component is added to the CROSERF protocol, we recommend that crude oil WAFs be exposed to sunlight for 96 h. By this time, six very different crude oil sources used to generate WAFs all resulted in significant inhibition relative to the control. Previously, WAF composition was documented to change within the first 115 h of exposure to sunlight by photooxidation and irradiance-induced solubilization of hydrocarbon components (Benigni et al., 2017). PAHs are significantly photooxidized after 48 h of exposure (Krylov et al., 1997). In this study, the data demonstrate that in some cases, solar exposure of WAFs results in maximum inhibition within a much shorter time period than previously described as two FS-exposed WAFs (oils 3 and 8) were observed to result in maximum inhibition relative to a control when prepared in only 24 h of natural sunlight. However, the other four WAFs from this study increased in inhibition with increased solar exposure.
In summary, our results indicate that not all oil spills are created equally as different oil spills will elicit different responses. We observed that the response of the bacterioplankton community is dependent on the source oil, the concentration of oil to which the microbes are exposed, and how much and which part of the solar spectrum the oils are exposed. Evidence also suggests the geographic source of the oil as well as seasonal timing of a spill may play important roles. Solar exposure has been shown to be a significant factor in determining how oils will affect microbial communities as the amount of incident solar radiation is a function of seasonality, latitude, water column depth, and water. It is, therefore, important to examine the effects of spills under in situ conditions using the same oil as was spilled. These variations demonstrate the complexity of making broad predictions about the effects of oil spills on marine microbes.
Data availability statement
The raw data supporting the conclusions of this article will be made available by the authors, without undue reservation.
Author contributions
EH and WJ: conceptualization and project administration. EH, ME-H, and WJ: methodology. LW and WJ: validation and supervision. EH: formal analysis, data curation, writing—original draft preparation, and visualization. EH, LN, ME-H, AS, and WJ: investigation. WJ: resources. EH, LW, RS, and WJ: writing—review and editing. EH, RS, and WJ: funding acquisition. All authors read and agreed to the published version of the manuscript.
Funding
This research was made possible by a grant from BP/The Gulf of Mexico Research Initiative to the C-IMAGE II and C-IMAGE III consortia to WJ and RS, and by funding from the University of West Florida Hal Marcus College of Science and Engineering (HMCSE Graduate Student Research Grant) to EH.
Acknowledgments
We acknowledge the National High Magnetic Laboratory at Florida State University for providing five of the oils used in this study. We also acknowledge Sarah Zarn for her hands-on assistance in preparing the WAFs.
Conflict of interest
The authors declare that the research was conducted in the absence of any commercial or financial relationships that could be construed as a potential conflict of interest.
Publisher’s note
All claims expressed in this article are solely those of the authors and do not necessarily represent those of their affiliated organizations, or those of the publisher, the editors and the reviewers. Any product that may be evaluated in this article, or claim that may be made by its manufacturer, is not guaranteed or endorsed by the publisher.
Supplementary material
The Supplementary Material for this article can be found online at: https://www.frontiersin.org/articles/10.3389/fevo.2023.1113899/full#supplementary-material
Footnotes
References
Atlas, R. M., and Hazen, T. C. (2011). Oil biodegradation and bioremediation: A tale of the two worst spills in U.S. History Environ. Sci. Technol. 45, 6709–6715.
Aurand, D., and Coelho, G. (eds) (2005). Cooperative aquatic toxicity testing of dispersed oil and the “Chemical response to oil spills: Ecological effects research forum (CROSERF), Technical Report 07-03. Lusby, MD: Ecosystem Management & Associates, Inc.
Bacosa, H. P., Liu, Z., and Erdner, D. L. (2015a). Natural sunlight shapes crude oil-degrading bacterial communities in Northern Gulf of Mexico Surface Waters. Front. Microbiol. 6:1325. doi: 10.3389/fmicb.2015.01325
Bacosa, H. P., Erdner, D. L., and Liu, Z. (2015b). Differentiating the roles of photooxidation and biodegradation in the weathering of light louisiana sweet crude oil in surface water from the Deepwater Horizon site. Mar. Pollut. Bull. 95, 265–272. doi: 10.1016/j.marpolbul.2015.04.005
Bacosa, H. P., Steichen, J., Kamalanathan, M., Windham, R., Lubguban, A., Labonté, J. M., et al. (2020a). Polycyclic aromatic hydrocarbons (PAHs) and putative PAH-degrading bacteria in Galveston Bay, TX (USA), following Hurricane Harvey (2017). Environ. Sci. Pollut. Res. Int. 27, 34987–34999. doi: 10.1007/s11356-020-09754-5
Bacosa, H. P., Kamalanathan, M., Cullen, J., Shi, D., Xu, C., Schwehr, K. A., et al. (2020b). Marine Snow aggregates are enriched in polycyclic aromatic hydrocarbons (PAHs) in Oil contaminated waters: Insights from a Mesocosm study. J. Mar. Sci. Eng. 8:781. doi: 10.3390/jmse8100781
Bacosa, H. P., Kang, A., Lu, K., and Liu, Z. (2021). Initial oil concentration affects hydrocarbon biodegradation rates and bacterial community composition in seawater. Mar. Pollut. Bull. 162:111867.
Balasubramaniam, A. M., Hall, R. I., Wolfe, B. B., Sweetman, J. N., and Wang, X. (2015). Source water inputs and catchment characteristics regulate limnological conditions of shallow subarctic lakes (Old Crow Flats, Yukon, Canada). Can. J. Fish. Aquat. Sci. 72, 1058–1072. doi: 10.1139/cjfas-2014-0340
Benigni, P., Sandoval, K., Thompson, C. J., Ridgeway, M. E., Park, M. A., Gardinali, P., et al. (2017). Analysis of photoirradiated water accommodated fractions of crude oils using tandem TIMS and FT-ICR MS. Environ. Sci. Technol. 51, 5978–5988. doi: 10.1021/acs.est.7b00508
Boehm, P. D., Murray, K. J., and Cook, L. L. (2016). Distribution and attenuation of polycyclic aromatic hydrocarbons in Gulf of Mexico seawater from the Deepwater Horizon oil accident. Environ. Sci. Technol. 50, 584–592. doi: 10.1021/acs.est.5b03616
Cao, X., and Tarr, M. A. (2017). Aldehyde and Ketone Photoproducts from Solar-Irradiated Crude Oil-Seawater Systems Determined by Electrospray Ionization-Tandem Mass Spectrometry. Environ. Sci. Technol. 51, 11858–11866. doi: 10.1021/acs.est.7b01991
Cavicchioli, R., Ripple, W. J., Timmis, K. N., Azam, F., Bakken, L. R., Baylis, M., et al. (2019). Scientists’ warning to humanity: Microorganisms and climate change. Nat. Rev. Microbiol. 17, 569–586. doi: 10.1038/s41579-019-0222-5
Coelho, G., Clark, J., and Aurand, D. (2013). Toxicity testing of dispersed oil requires adherence to standardized protocols to assess potential real world effects. Environ. Pollut. 1987, 185–188. doi: 10.1016/j.envpol.2013.02.004
Dubinsky, E. A., Conrad, M. E., Chakraborty, R., Bill, M., Borglin, S. E., Hollibaugh, J. T., et al. (2013). Succession of hydrocarbon-degrading bacteria in the aftermath of the Deepwater Horizon oil spill in the Gulf of Mexico. Environ. Sci. Technol. 47, 10860–10867. doi: 10.1021/es401676y
Dutta, T. K., and Harayama, S. (2000). Fate of crude oil by the combination of photooxidation and biodegradation. Environ. Sci. Technol. 34, 1500–1505. doi: 10.1016/j.scitotenv.2019.07.374
Ehrhardt, M. G., Burns, K. A., and Bicego, M. C. (1992). Sunlight-induced compositional alterations in the seawater-soluble fraction of a crude oil. Mar. Chem. 37, 53–64. doi: 10.1016/0304-4203(92)90056-G
Fischer, J. M., Nicolai, J. L., Williamson, C. E., Persaud, A. D., and Lockwood, R. S. (2006). Effects of ultraviolet radiation on diel vertical migration of crustacean zooplankton: An in situ mesocosm experiment. Hydrobiologia 563, 217–224. doi: 10.1007/s10750-005-0007-x
Fu, P. P., Xia, Q., Sun, X., and Yu, H. (2012). Phototoxicity and environmental transformation of polycyclic aromatic hydrocarbons (PAHs)-light-induced reactive oxygen species, lipid peroxidation, and DNA damage. J. Environ. Sci. Health C. Environ. Carcinog. Ecotoxicol. Rev. 30, 1–41. doi: 10.1080/10590501.2012.653887
Gao, Y., Xu, H., Zhang, S., Zhang, Y., Tang, C., and Fan, W. (2019). Visible-light photocatalytic aerobic oxidation of sulfides to sulfoxides with a perylene diimide photocatalyst. Org. Biomol. Chem. 7, 7144–7149. doi: 10.1039/c9ob00945k
Genders, S. (1988). In-situ detection and tracking of oil in the water column. Oil Chem. Pollut. 4, 113–126. doi: 10.1016/S0269-8579(88)80015-7
Genuino, H. C., Horvath, D. T., King’ondu, C. K., Hoag, G. E., Collins, J. B., and Suib, S. L. (2012). Effects of visible and UV light on the characteristics and properties of crude oil-in-water (O/W) emulsions. Photochem. Photobiol. Sci. 11, 692–702. doi: 10.1039/c2pp05275j
Gjesteland, I., Hollund, B. E., Kirkeleit, J., Daling, P. S., Sørheim, K. R., and Bråtveit, M. (2019). Determinants of airborne benzene evaporating from fresh crude oils released into seawater. Mar. Pollut. Bull. 140, 395–402. doi: 10.1016/j.marpolbul.2018.12.045
Gregson, B. H., McKew, B. A., Holland, R. D., Nedwed, T. J., Prince, R. C., and McGenity, T. J. (2021). Marine oil snow, a microbial perspective. Front. Mar. Sci. 8:619484. doi: 10.3389/fmars.2021.619484
Griffiths, M. T., Da Campo, R., O’Connor, P. B., and Barrow, M. P. (2014). Throwing light on petroleum: Simulated exposure of crude oil to sunlight and characterization using atmospheric pressure photoionization fourier transform ion cyclotron resonance mass spectrometry. Anal. Chem. 86, 527–534. doi: 10.1021/ac4025335
Groner, M., Muroski, A. R., and Myrick, M. L. (2001). Identification of major water-soluble fluorescent components of some petrochemicals. Mar. Pollut. Bull. 42, 935–941. doi: 10.1016/s0025-326x(01)00052-2
Gros, J., Nabi, D., Würz, B., Wick, L. Y., Brussaard, C. P. D., Huisman, J., et al. (2014). First day of an oil spill on the open sea: Early mass transfers of hydrocarbons to air and water. Environ. Sci. Technol. 48, 9400–9411. doi: 10.1021/es502437e
Guipeng, Y., Li, Z., Xiaojing, S., and Weiwen, J. (2006). Photochemical degradation of crude oil in seawater. Chin. J. Oceanol. Limnol. 24, 264–269.
Gutierrez, T., Singleton, D. R., Berry, D., Yang, T., Aitken, M. D., and Teske, A. (2013). Hydrocarbon-degrading bacteria enriched by the Deepwater Horizon oil spill identified by cultivation and DNA-SIP. ISME J. 7, 2091–2104. doi: 10.1038/ismej.2013.98
Haule, K., and Freda, W. (2021). Remote sensing of dispersed oil pollution in the ocean—The role of chlorophyll concentration. Sensors 21:3387. doi: 10.3390/s21103387
Hazen, T. C., Dubinsky, E. A., DeSantis, T. Z., Andersen, G. L., Piceno, Y. M., Singh, N., et al. (2010). Deep-Sea oil plume enriches indigenous oil-degrading bacteria. Science 330, 204–208. doi: 10.1126/science.1195979
Hazen, T. C., Prince, R. C., and Mahmoudi, N. (2016). Marine oil biodegradation. Environ. Sci. Technol. 50, 2121–2129. doi: 10.1021/acs.est.5b03333
He, B., Lu, M., Yang, C., Liu, Y., Liang, E., and Wang, G. (2018). Perylene as a visible light photoredox catalyst for photoinduced electron transfer-reversible addition-fragmentation chain transfer (PET-RAFT) polymerization of MMA. J. Macromol. Sci. 55, 583–587. doi: 10.1080/10601325.2018.1476825
Head, I. M., Jones, D. M., and Röling, W. F. M. (2006). Marine microorganisms make a meal of oil. Nat. Rev. Microbiol. 4, 173–182. doi: 10.1038/nrmicro1348
Headrick (2019). Comparison of microbial responses to different crude oils with various photoreactivities. ProQuest Dissertations Publishing.
Holmes, R. M., Aminot, A., Kérouel, R., Hooker, B. A., and Peterson, B. J. (1999). A simple and precise method for measuring ammonium in marine and freshwater ecosystems. Can. J. Fish. Aquat. Sci. 56, 1801–1808.
Hou, Y., Li, Y., Liu, Y., Li, G., and Zhang, Z. (2019). Effects of polycyclic aromatic hydrocarbons on the UV-induced fluorescence spectra of crude oil films on the sea surface. Mar. Pollut. Bull. 146, 977–984. doi: 10.1016/j.marpolbul.2019.07.058
Hutchins, D. A., and Fu, F. (2017). Microorganisms and ocean global change. Nat. Microbiol. 2, 1–11.
Jajoo, A., Mekala, N. R., Tomar, R. S., Grieco, M., Tikkanen, M., and Aro, E.-M. (2014). Inhibitory effects of polycyclic aromatic hydrocarbons (PAHs) on photosynthetic performance are not related to their aromaticity. J. Photochem. Photobiol. B 137, 151–155.
Jiang, Z., Huang, Y., Xu, X., Liao, Y., Shou, L., Liu, J., et al. (2010). Advance in the toxic effects of petroleum water accommodated fraction on marine plankton. Acta Ecol. Sin. 30, 8–15.
Jing, L., Chen, B., Zhang, B., Zheng, J., and Liu, B. (2014). Naphthalene degradation in seawater by UV irradiation: The effects of fluence rate, salinity, temperature and initial concentration. Mar. Pollut. Bull. 81, 149–156.
Juyal, P., McKenna, A. M., Yen, A., Rodgers, R. P., Reddy, C. M., Nelson, R. K., et al. (2011). Analysis and identification of biomarkers and origin of color in a bright blue crude oil. Energy Fuels 25, 172–182.
Kimes, N. E., Callaghan, A. V., Suflita, J. M., and Morris, P. J. (2014). Microbial transformation of the Deepwater Horizon oil spill—past, present, and future perspectives. Front. Microbiol. 5:603. doi: 10.3389/fmicb.2014.00603
King, S. M., Leaf, P. A., Olson, A. C., Ray, P. Z., and Tarr, M. A. (2014). Photolytic and photocatalytic degradation of surface oil from the Deepwater Horizon spill. Chemosphere 95, 415–422. doi: 10.1016/j.chemosphere.2013.09.060
Kirchman, D., K’nees, E. L., and Hodson, R. (1985). Leucine incorporation and its potential as a measure of protein synthesis by bacteria in natural aquatic systems. Appl. Environ. Microbiol. 49, 599–607. doi: 10.1128/aem.49.3.599-607.1985
Krylov, S. N., Huang, X., Zeiler, L. F., Dixon, D. G., and Greenberg, B. M. (1997). Mechanistic quantitative structure-activity relationship model for the photoinduced toxicity of polycyclic aromatic hydrocarbons: I. Physical Model based on chemical kinetics in a two compartment system. Environ. Toxicol. Chem. 16, 2283–2295.
Lee, R. F. (2003). Photo-oxidation and photo-toxicity of crude and refined oils. Spill Sci. Technol. Bull. 8, 157–162.
Lenth, R. V. (2023). emmeans: Estimated marginal means, aka least-squares means. R package version 1.8.5. Available online at: https://CRAN.R-project.org/package=emmeans (accessed February 20, 2023).
Ma, Y.-L., Lu, W., Wan, L.-L., and Luo, N. (2015). Elucidation of fluoranthene degradative characteristics in a newly isolated achromobacter xylosoxidans DN002. Appl. Biochem. Biotechnol 175, 1294–1305. doi: 10.1007/s12010-014-1347-7
MacDonald, I. R., Garcia-Pineda, O., Beet, A., Asl, S. D., Feng, L., Graettinger, G., et al. (2015). Natural and unnatural oil slicks in the Gulf of Mexico. J. Geophys. Res. Oceans 120, 8364–8380. doi: 10.1002/2015JC011062
Maki, H., Sasaki, T., and Harayama, S. (2001). Photo-oxidation of biodegraded crude oil and toxicity of the photo-oxidized products. Chemosphere 44, 1145–1151. doi: 10.1016/s0045-6535(00)00292-7
Matvyeyeva, O. L., Vasylchenko, O. A., and Aliieva, O. R. (2014). Microbial biosurfactants role in oil products biodegradation. Int. J. Environ. Bioremediat. Biodegrad. 2, 69–74.
McNutt, M. K., Camilli, R., Crone, T. J., Guthrie, G. D., Hsieh, P. A., Ryerson, T. B., et al. (2012). Review of flow rate estimates of the Deepwater Horizon oil spill. Proc. Natl. Acad. Sci. U.S.A. 109, 20260–20267. doi: 10.1073/pnas.1112139108
Melkonian, C., Fillinger, L., Atashgahi, S., da Rocha, U. N., Kuiper, E., Olivier, B., et al. (2021). High biodiversity in a benzene-degrading nitrate-reducing culture is sustained by a few primary consumers. Commun. Biol. 4, 1–12.
Nicodem, D. E., Guedes, C. L. B., Conceição, M., Fernandes, Z., Severino, D., Correa, R. J., et al. (2001). Photochemistry of petroleum. Prog. React. Kinet. Mech. 26, 219–238.
Owen, C. J., Axler, R. P., Nordman, D. R., Schubauer-Berigan, M., Lodge, K. B., and Schubauer-Berigan, J. P. (1995). Screening for PAHs by fluorescence spectroscopy: A comparison of calibrations. Chemosphere 31, 3345–3356.
Pampanin, D. M., and Sydnes, M. O. (2013). Polycyclic aromatic hydrocarbons a constituent of petroleum: Presence and influence in the aquatic environment. London: IntechOpen. doi: 10.5772/48176
Parsons, T. R., Maita, Y., and Lalli, C. M. (1984). A manual of chemical and biological methods for seawater analysis. Oxford: Pergamon Press.
Passow, U., and Stout, S. A. (2020). Character and sedimentation of “lingering” Macondo oil to the deep-sea after the Deepwater Horizon oil spill. Mar. Chem. 218:103733.
Pelz, O., Brown, J., Huddleston, M., Rand, G., Gardinali, P., Stubblefield, W., et al. (2011). “Selection of a surrogate MC252 oil as a reference material for future aquatic toxicity tests and other studies, poster,” in Proceedings of the society of environmental toxicology and chemistry meeting, (Boston, MA: SETAC).
Peng, R.-H., Xiong, A.-S., Xue, Y., Fu, X.-Y., Gao, F., Zhao, W., et al. (2008). Microbial biodegradation of polyaromatic hydrocarbons. FEMS Microbiol. Rev. 32, 927–955.
Prince, R. C. (1993). Petroleum spill bioremediation in marine environments. Crit. Rev. Microbiol. 19, 217–242.
Prince, R. C., and Atlas, R. M. (2018). “Bioremediation of marine oil spills,” in Consequences of microbial interactions with hydrocarbons, oils, and lipids: Biodegradation and bioremediation, ed. R. Steffan (Cham: Springer International Publishing), 1–25.
R Core Team (2022). R: A language and environment for statistical computing. R Foundation for Statistical Computing. Vienna: .R Core Team.
Ray, P. Z., Chen, H., Podgorski, D. C., McKenna, A. M., and Tarr, M. A. (2014). Sunlight creates oxygenated species in water-soluble fractions of Deepwater Horizon oil. J. Haz. Mat. 280, 636–643. doi: 10.1016/j.jhazmat.2014.08.059
Riazi, M. R., and Roomi, Y. A. (2008). A model to predict rate of dissolution of toxic compounds into seawater from an oil spill. Int. J. Toxicol. 27, 379–386. doi: 10.1080/10915810802503578
Robinson, C. (2019). Microbial respiration, the engine of ocean deoxygenation. Front. Mar. Sci. 5:533. doi: 10.3389/fmars.2018.00533
Saeed, T., Ali, L. N., Al-Bloushi, A., Al-Hashash, H., Al-Bahloul, M., Al-Khabbaz, A., et al. (2011). Effect of environmental factors on photodegradation of polycyclic aromatic hydrocarbons (PAHs) in the water-soluble fraction of Kuwait crude oil in seawater. Mar. Environ. Res. 72, 143–150.
Saeed, T., Ali, L. N., Al-Bloushi, A., Al-Hashash, H., Al-Bahloul, M., Al-Khabbaz, A., et al. (2013). Photodegradation of volatile organic compounds in the water-soluble fraction of Kuwait crude oil in seawater: Effect of environmental factors. Water. Air. Soil Pollut. 224:1584.
Santas, R., Häder, D.-P., and Santas, P. (1999). Is crude oil bioremediation affected by changes in ambient ultraviolet radiation? Mar. Pollut. Bull. 38, 1022–1025.
Schnetger, B., and Lehners, C. (2014). Determination of nitrate plus nitrite in small volume marine water samples using vanadium (III) chloride as a reduction agent. Mar. Chem. 160, 91–98.
Scofield, V., Jacques, S. M. S., Guimarães, J. R. D., and Farjalla, V. F. (2015). Potential changes in bacterial metabolism associated with increased water temperature and nutrient inputs in tropical humic lagoons. Front. Microbiol. 6:310. doi: 10.3389/fmicb.2015.00310
Shin, P. K. S., and Fong, K. Y. S. (1999). Multiple discriminant analysis of marine sediment data. Mar. Poll. Bull. 39, 285–294.
Smith, D. C., and Azam, F. (1992). A simple, economical method for measuring bacterial protein synthesis rates in seawater using 3H-leucine. Mar. Microb. Food Webs 6, 107–114.
Snyder, K., Mladenov, N., Richardot, W., Dodder, N., Nour, A., Campbell, C., et al. (2021). Persistence and photochemical transformation of water soluble constituents from industrial crude oil and natural seep oil in seawater. Mar. Pollut. Bull. 165:112049. doi: 10.1016/j.marpolbul.2021.112049
Sørstrøm, S. E. (1985). A note on in-situ fluorescence for detection of oil in water. Oil Petrochem. Pollut. 2, 125–132.
Sugiura, K., Ishihara, M., Shimauchi, T., and Harayama, S. (1997). Physicochemical properties and biodegradability of crude oil. Environ. Sci. Technol. 31, 45–51.
Toyooka, T., and Ibuki, Y. (2007). DNA damage induced by coexposure to PAHs and light. Pharmacology 23, 256–263.
Vaughan, P. P., Wilson, T., Kamerman, R., Hagy, M. E., McKenna, A., Chen, H., et al. (2016). Photochemical changes in water accommodated fractions of MC252 and surrogate oil created during solar exposure as determined by FT-ICR MS. Mar. Pollut. Bull. 104, 262–268. doi: 10.1016/j.marpolbul.2016.01.012
Vergeynst, L., Christensen, J. H., Kjeldsen, K. U., Meire, L., Boone, W., Malmquist, L. M. V., et al. (2019). In situ biodegradation, photooxidation and dissolution of petroleum compounds in Arctic seawater and sea ice. Water Res. 148, 459–468. doi: 10.1016/j.watres.2018.10.066
Viggor, S., Juhanson, J., Jõesaar, M., Mitt, M., Truu, J., Vedler, E., et al. (2013). Dynamic changes in the structure of microbial communities in Baltic Sea coastal seawater microcosms modified by crude oil, shale oil or diesel fuel. Microbiol. Res. 168, 415–427.
Wozniak, A. S., Prem, P. M., Obeid, W., Waggoner, D. C., Quigg, A., Xu, C., et al. (2019). Rapid degradation of oil in mesocosm simulations of Marine oil snow events. Environ. Sci. Technol. 53, 3441–3450. doi: 10.1021/acs.est.8b06532
Yan, J., Wang, L., Fu, P. P., and Yu, H. (2004). Photomutagenicity of 16 polycyclic aromatic hydrocarbons from the US EPA priority pollutant list. Mutat. Res. 557, 99–108. doi: 10.1016/j.mrgentox.2003.10.004
Yang, T., Nigro, L. M., Gutierrez, T. D., D’Ambrosio, L., Joye, S. B., Highsmith, R., et al. (2016). Pulsed blooms and persistent oil-degrading bacterial populations in the water column during and after the Deepwater Horizon blowout. Deep-Sea Res. II: Top. Stud. Oceanogr. 129, 282–291. doi: 10.1016/j.dsr2.2014.01.014
Keywords: oil spill, bacterioplankton, photoreactivity, photooxidation, crude oil, Gulf of Mexico, solar exposure
Citation: Headrick EL, Nigro LM, Waidner LA, Ederington-Hagy M, Simmering AL, Snyder RA and Jeffrey WH (2023) Acute inhibition of bacterial growth in coastal seawater amended with crude oils with varied photoreactivities. Front. Ecol. Evol. 11:1113899. doi: 10.3389/fevo.2023.1113899
Received: 01 December 2022; Accepted: 15 March 2023;
Published: 06 April 2023.
Edited by:
Marcus W. Beck, Tampa Bay Estuary Program, United StatesReviewed by:
Andrew Decker Steen, The University of Tennessee, Knoxville, United StatesWilliam Ross Hunter, Queen’s University Belfast, United Kingdom
Copyright © 2023 Headrick, Nigro, Waidner, Ederington-Hagy, Simmering, Snyder and Jeffrey. This is an open-access article distributed under the terms of the Creative Commons Attribution License (CC BY). The use, distribution or reproduction in other forums is permitted, provided the original author(s) and the copyright owner(s) are credited and that the original publication in this journal is cited, in accordance with accepted academic practice. No use, distribution or reproduction is permitted which does not comply with these terms.
*Correspondence: Wade H. Jeffrey, d2plZmZyZXlAdXdmLmVkdQ==
†Present Address: Erika L. Headrick, Bionano Genomics, Inc., San Diego, CA, United States Lisa M. Nigro, Institute for Systems Genomics, University of Connecticut, Storrs, CT, United States Melissa Ederington-Hagy, Department of Earth and Environment, Boston University, Boston, MA, United States Arianna L. Simmering, Q2 Solutions, Marietta, GA, United States Richard A. Snyder, Virginia Institute of Marine Science Eastern Shore Laboratory, Wachapreague, VA, United States