
94% of researchers rate our articles as excellent or good
Learn more about the work of our research integrity team to safeguard the quality of each article we publish.
Find out more
ORIGINAL RESEARCH article
Front. Ecol. Evol., 20 February 2023
Sec. Conservation and Restoration Ecology
Volume 11 - 2023 | https://doi.org/10.3389/fevo.2023.1112284
This article is part of the Research TopicWomen in Conservation and Restoration Ecology 2022View all 12 articles
 Danika van Proosdij1*
 Jennie Graham2†Ben Lemieux1Tony Bowron2Emma Poirier1Jocelyn Kickbush2Kirsten Ellis2
 Jeremy Lundholm1†
Introduction: Tidal wetland restoration in the Bay of Fundy involves restoring tidal hydrology to sites with tidal restrictions. Most have focused on salt marsh sites close to the mouth of estuaries, but there are also many tidally restricted wetlands closer to the freshwater end of tidal rivers. Recovery of salt marsh vegetation has been rapid in past projects, but little is known about sediment and vegetation dynamics post restoration in tidal brackish or freshwater environments.
Methods: We implemented tidal wetland restoration projects on two tidal rivers near the inland limit of saltwater. Hydrological restoration involved breaching (St. Croix) or realigning agricultural dykes (Belcher Street). We monitored hydrology, sediment accretion and vegetation at replicated plots on restoration sites and nearby reference tidal marshes; and conducted habitat mapping and elevation surveys using drones.
Results: After re-establishing tidal flow, sediment accretion was very rapid, leading to a deep layer of new sediments. Plant colonization at both sites resulted in a high diversity of halophytes in the first 2 years post restoration, but the St. Croix site transitioned to freshwater wetland species dominating by the fifth year post- restoration. The Belcher St. site has a mix of freshwater and brackish wetland species after the fourth-year post-restoration.
Discussion: High suspended sediment concentrations at both sites suggest that each site was positioned closed to the estuarine turbidity maximum within its river. Tidal wetland restoration at the head of estuaries may benefit from the large ecological disturbance associated with rapid sediment accretion, providing a productive substrate with little competition from prior vegetation. However ultimate vegetation patterns may take longer to develop as elevation gains alter tidal flooding frequency. Low salinities suggest that the physical disturbance of sediment burying prior vegetation is the main mechanism creating a clean slate for plant recolonization, rather than mortality of terrestrial vegetation due to salt water. The majority of elevation change was due to allochthonous sediment deposition, with belowground processes playing a minor role. The wetlands restored showed substantial net elevation gains in the first years following tidal hydrological restoration, but long-term monitoring is required to track their overall resilience in the face of sea level rise.
Tidal wetlands play a crucial role in protecting coastlines from erosion as well as providing valuable habitat for many species. In the Bay of Fundy region, it is estimated that 357 ~ 395 km2 of salt marsh existed before extensive dyking by European settlers in the 17th century, leaving just 52 ~ 65 km2 salt marsh today (Thomas, 1983; Gordon and Cranford, 1994). In recent years, there has been considerable effort in eastern Canada to restore these dykelands back to tidal wetlands via tidal wetland restoration. This type of restoration prioritizes reestablishing tidal hydrology via breaching or realigning existing dykes. The reintroduction of tidal water to dykeland systems results in a sudden die-off of the pre-existing freshwater dominant vegetation (Bowron et al., 2011), but will also carry seeds or rhizomes of halophytic species from nearby existing salt marshes, therefore vegetation recovery generally begins with halophytic colonization (van Proosdij et al., 2010; Rabinowitz et al., 2022). While most tidal wetland restoration projects in the Bay of Fundy focus on salt marshes occurring along tidal rivers and are relatively close to the Bay (Bowron et al., 2012), there are also significant occurrences of brackish/freshwater tidal wetlands located upstream which provide unmet opportunities for restoration.
Tidal freshwater wetlands (TFW) feature tidal hydrology but are located in the upper extent of estuaries where coastal saline water meets freshwater flow resulting in lower salinities than salt marshes (Odum et al., 1984). TFW typically do not have salinities high enough to cause the death of terrestrial or freshwater wetland vegetation, but vegetation dynamics are largely unknown in the context of ecological restoration of these systems located in northeastern North America. Restoration efforts in tidal brackish or fresh systems elsewhere in North America often involve sediment augmentation using dredged or otherwise externally sourced material (Baldwin and Hammerschlag, 2019). In the Upper Bay of Fundy suspended sediment concentrations in tidal rivers can be high (>500 mg∙L−1; van Proosdij et al., 2006), but it is not clear if sediment supply will be adequate to restore marsh platform elevations. Dyked former wetlands are often low in elevation due to subsidence and lack of sediment addition (Byers and Chmura, 2007). However, after restoration this situation can lead to high rates of sediment accumulation–if tidal sediment supply is adequate–since lower elevations flood more frequently (Wollenberg et al., 2018). Tidal rivers are characterized by a salt wedge at the upper extent of saltwater penetration upstream. A turbidity maximum is often observed at the tip of the salt wedge, causing higher suspended sediment concentrations compared with regions up or downstream (Burchard and Baumert, 1998). While the phenomenon occurs worldwide, tidal rivers in relatively long estuaries and those with higher tidal ranges tend to have the highest maximum suspended sediment concentrations (Uncles et al., 2002). The ability for a restoring tidal wetland to accumulate sediment to keep pace with sea level rise is crucial for development of wetland vegetation (van Proosdij et al., 2006; Goodwin and Mudd, 2019). Therefore the ecomorphology in these systems is likely to be controlled primarily by proximity of the site to the estuarine turbidity maximum (Darke and Megonigal, 2003).
The reality of sea level rise and increased storm intensity has resulted in an upsurge in interest in tidal wetland restoration in eastern Canada, but current efforts are limited by a lack of examples that cover the full range of tidal conditions, including brackish and fresh tidal wetlands in the upper extreme of estuaries. This study presents a quantitative account of two TFW restoration projects located in the Upper Bay of Fundy with the goal of comparing the early trajectory of hydrological and ecomorphological changes post-restoration. A standardized monitoring program widely adopted in the region was used to quantify changes in hydrology, sediment dynamics, vegetation changes, and fish habitat use (Neckles et al., 2002; van Proosdij et al., 2010; Bowron et al., 2011).
The Bay of Fundy is a large hyper-tidal embayment located mostly within Canadian Atlantic provinces at the northeastern end of the Gulf of Maine. Semi-diurnal tides in the upper portions of the Bay of Fundy reach an excess of 16 m on larger spring tides (Desplanque and Mossman, 2004; van Proosdij et al., 2006). Most Bay of Fundy watersheds are drained by large tidal rivers that discharge into the main tidal basin within intertidal zones completely exposed at low tide. A large tidal prism combined with high suspended sediment concentration contributes to high sedimentation rates recorded within the region (Chmura et al., 2001; Daborn et al., 2003; van Proosdij et al., 2006).
The St. Croix River High Salt Marsh and Tidal Floodplain Wetland Restoration Project (SC) is located within the upper reaches of the Avon Estuary in Nova Scotia (Figure 1A). The site consists of a fallow dykeland tract adjacent to the Highway 101/St. Croix River that had not been flooded since the 1950s. The restoration site has an area of 10.03 ha and, prior to restoration, lay at a mean elevation1 of 6.19 m, with the fringe (foreshore) marsh at a mean elevation of 6.58 m (Bowron et al., 2015; Table 1). Prior to restoration, the site was mainly pastureland (cattle) dominated by a variety of grasses, Rosa virginiana, and Juncus effusus (wet areas). Salinity in the St. Croix River adjacent to the study site ranged from 0.0 to 15.1 ppt and suspended sediment concentrations in the river water ranged on average from 40,296 (± 76,567) mg∙L−1 (incoming tide average) to 32,157 (± 63,736) mg∙L−1 (outgoing tide average) which was considered very high (Bowron et al., 2010).
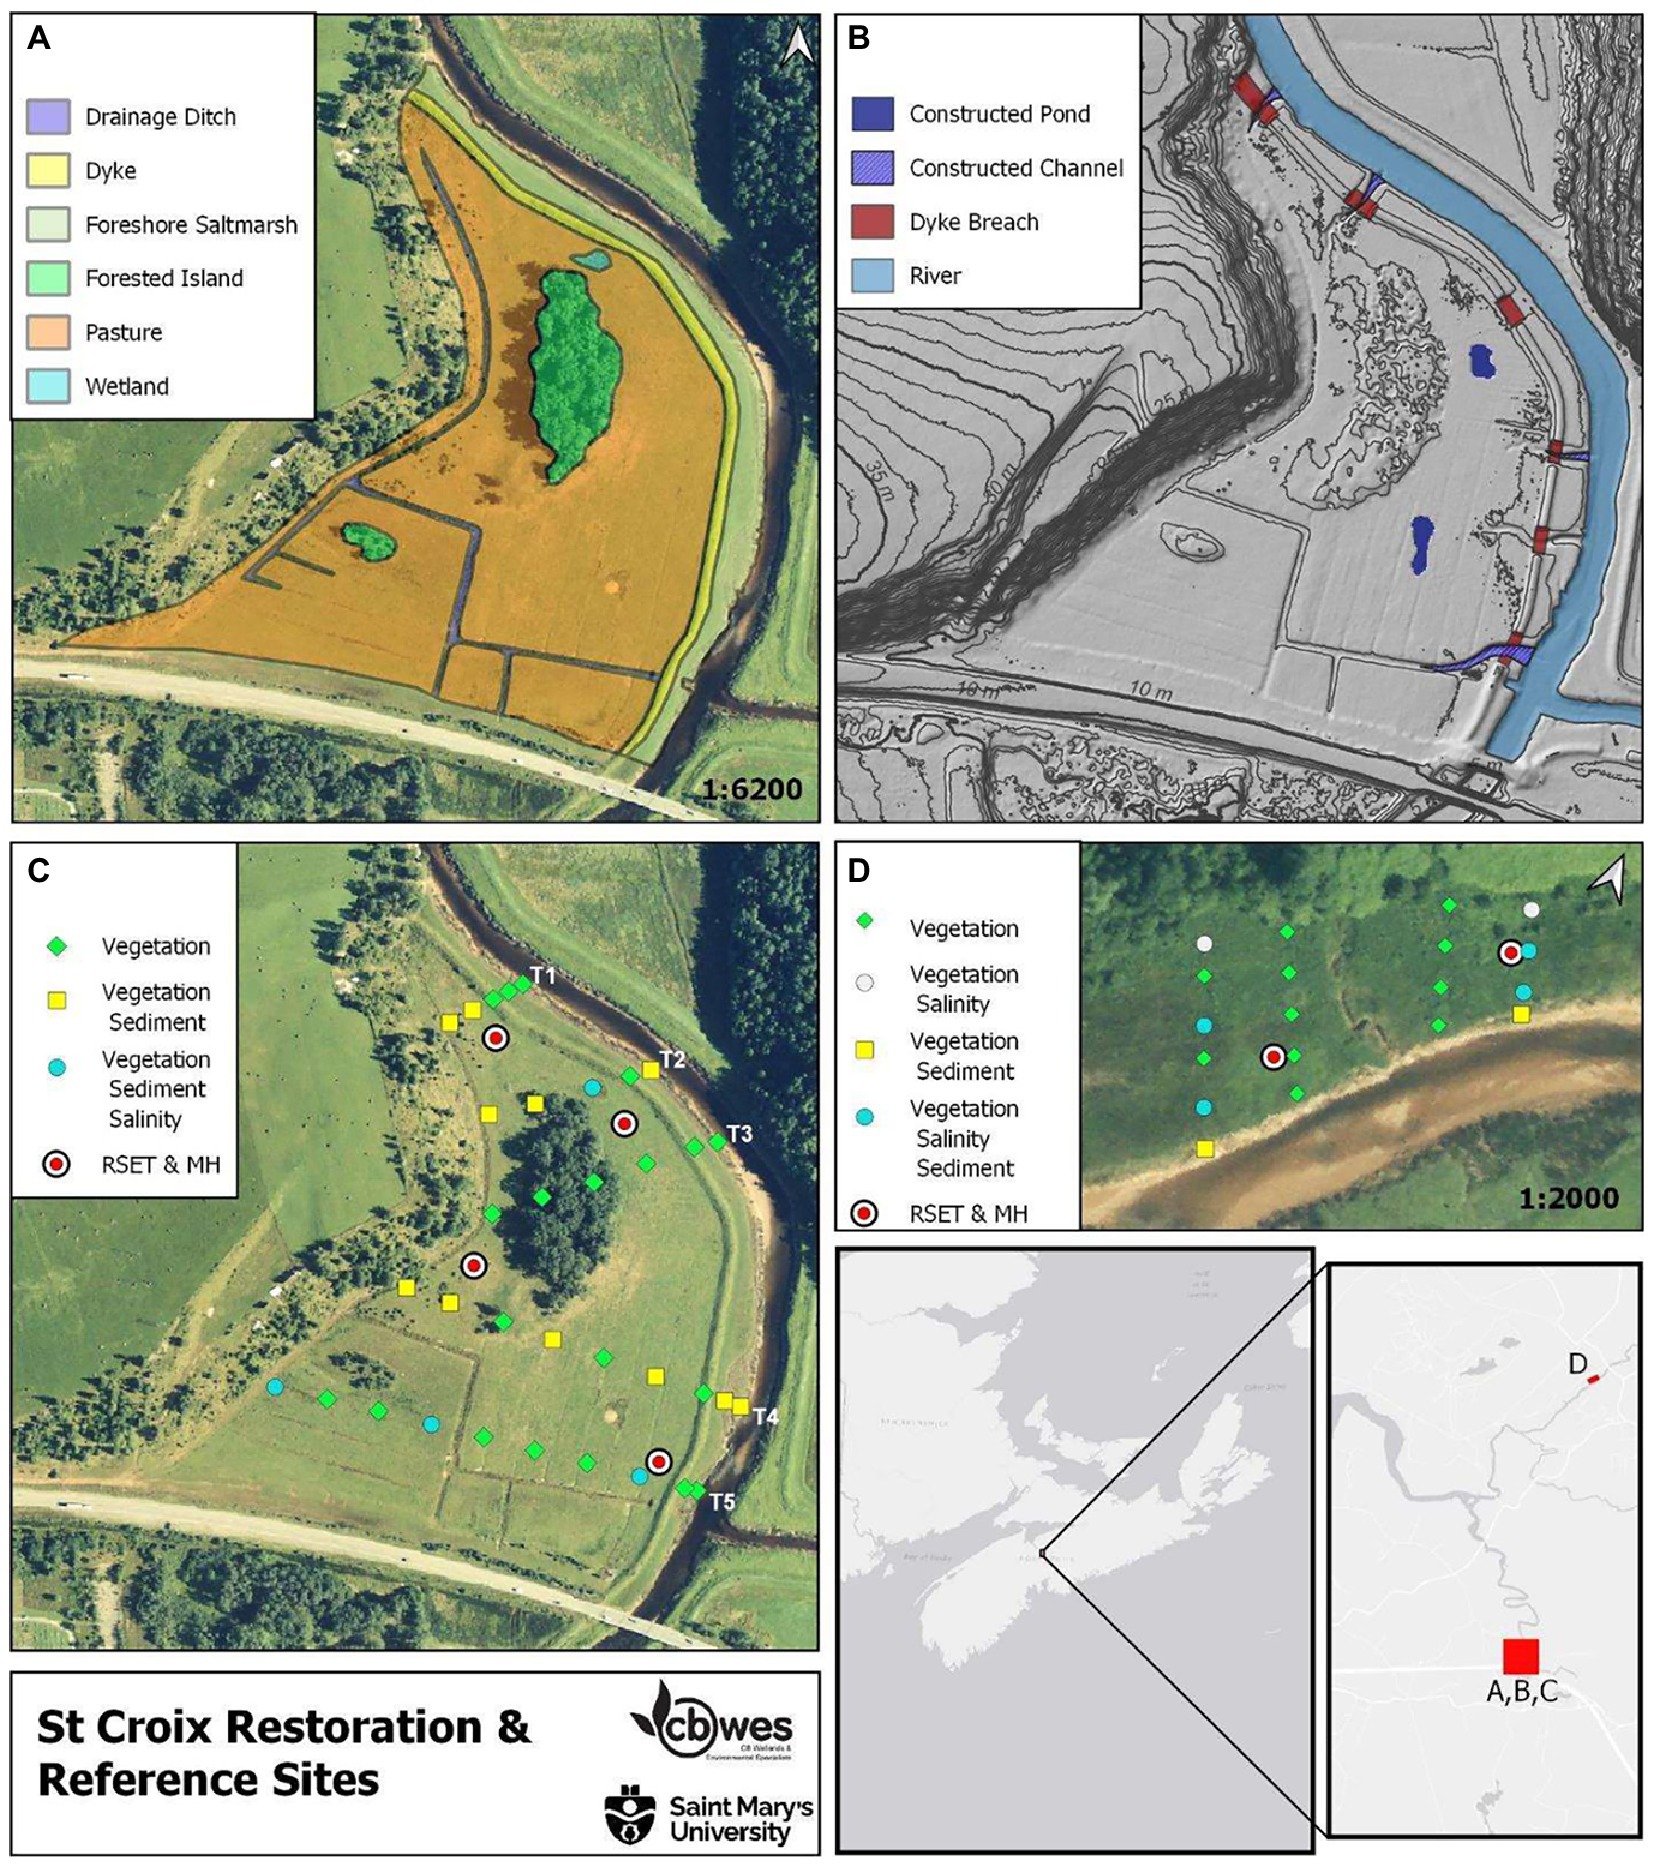
Figure 1. St. Croix site (A) Pre-restoration habitat map; (B) Restoration plan; (C) Sampling locations; (D) Reference site.
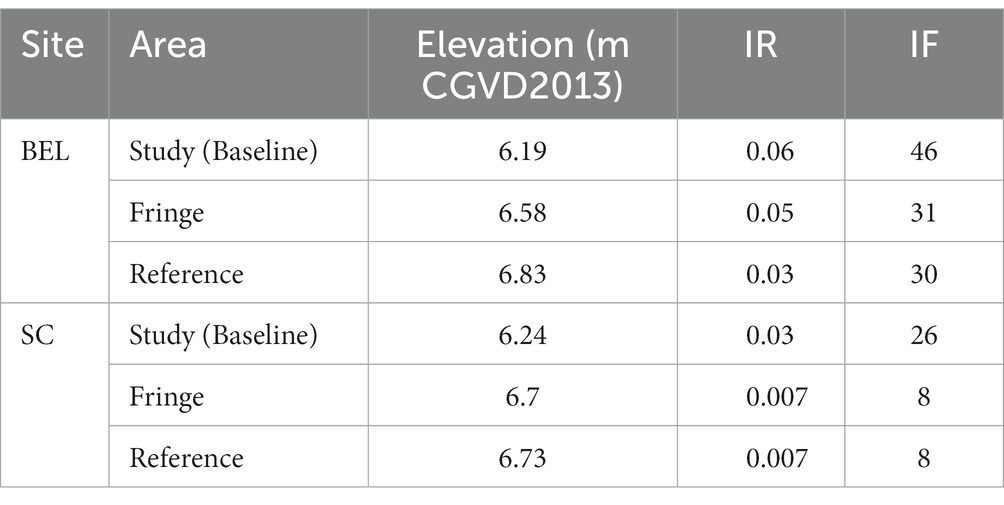
Table 1. Mean elevation, IR, and IF for BEL and SC for baseline conditions (pre-restoration).
Prior to restoration, SC contained a network of agricultural drainage ditches leading to one main aboiteau (Figure 1B), and two areas of higher elevation (islands) within the site but were not subject to any measurements (and remained post-restoration); these islands are covered by pasture grasses, shrubs, and trees. Cattle had access to the site up to the time of construction in 2009. A 0.46 ha section of marsh with a mean elevation of 6.83 m along the north branch of the St. Croix (Herbert River) was identified as a suitable reference site for this project (Figure 1D). This site exhibited similar hydrological and sedimentological conditions as those present at the restoration site and is one of the few remaining undyked sections along the tidal component of the St. Croix River system that was also readily accessible for study. The SC reference site is characterized by brackish and freshwater marsh species (Juncus balticus, Calystegia sepium, Sporobolus michauxianus, Galium palustre, Agrostis stolonifera) as well as areas of pasture weeds (Centaurea nigrum, Cirsium arvense, Filipendula ulmaria, Equisetum and Solidago spp.).
The restoration project was designed to re-establish the tidal creek networks, re-connect the wetlands to the adjacent watercourse, redirect runoff flow, create two ponds, and overall create a productive floodplain wetland complex with fish passage and favorable bird habitat. Construction and dyke breaching took place in summer 2009. A total of 6 breaches were made, two ponds were excavated to a depth of 0.5 m. multiple tidal channels were excavated and an aboiteau was buried. Channels were constructed with an approximately 2 m wide bottom, a zero degree slope for 80% of the distance from the river edge grading up to meet the marsh surface over the remaining 20%. Channel sides had a 3:1 slope (Bowron et al., 2009).
The Belcher Street Marsh (NS091; BEL) is located on the north side of the Jijikwtuk (Cornwallis) River, downstream (East) from the town of Kentville (Figure 2A). The site was a mix of active (forage and crop) and fallow (impounded freshwater wetland) agricultural lands prior to restoration (Figure 2A). Being part of the Bay of Fundy’s Minas Basin, the Jijikwtuk River is a significant tidal river with the head of tide extending a short distance upstream from the project site. Salinities measured approximately 2 km upstream of BEL at Kentville range from 14.9 to 30.7 ppt (Brylinsky, 2014; Hatt et al., 2017). Suspended sediment concentrations in the river adjacent to the site are high, ranging from a maximum in June 2019 of 15,644 mg∙L−1 to a minimum of 80 mg∙L−1. The dykes along the Jijikwtuk River are positioned close to the bank of the main river channel, resulting in a long sinuous dyke system which is costly and labor-intensive to maintain in the face of climate change, and was highly susceptible to (and experiencing) erosion at multiple locations.
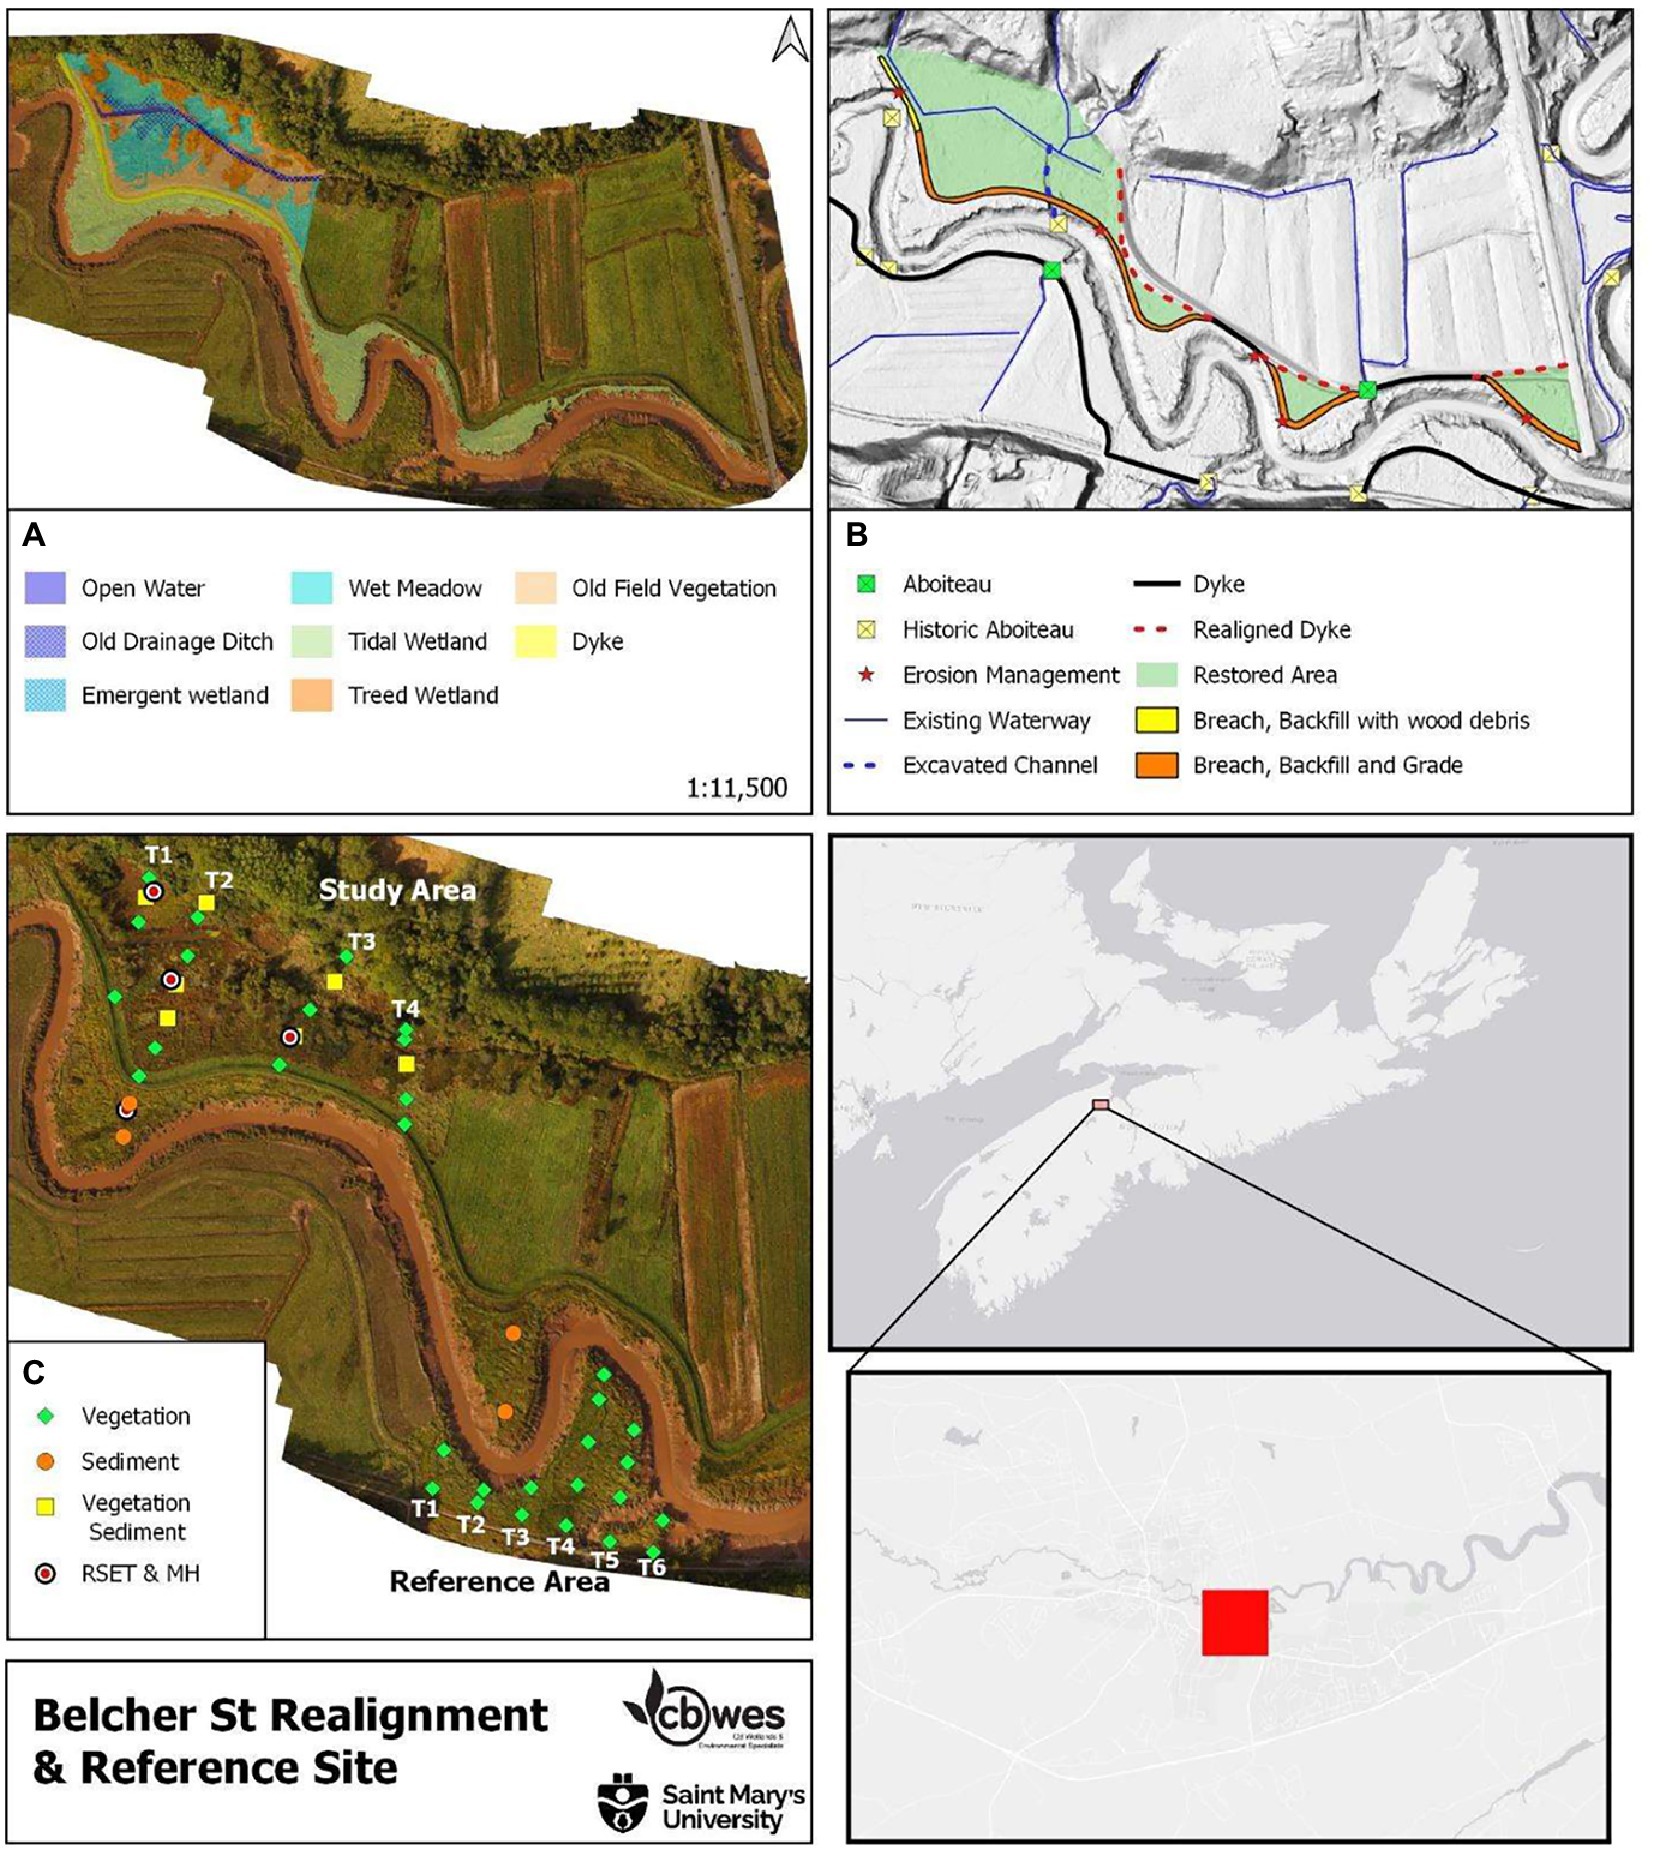
Figure 2. Belcher Street site (A) Pre-restoration habitat map; (B) Restoration plan; (C) Sampling locations.
The main dyke was 1.34 km in length and protected 22.6 ha of agricultural land (80% active, 20% fallow) with a mean elevation of 6.24 m (Table 1). The site had one single barrel 24″ diameter aboiteau, which was originally constructed in 1956 and last upgraded in 1997. The primary drainage ditch, particularly along the upland edge and in the fallow (western) portion of the site, has not been actively maintained and had become overgrown with floating mats of vegetation. While the dyke and active fields were dominated by agricultural grasses and crops, the fallow portion had degenerated into impounded freshwater wetland. Areas of higher elevations had largely been colonized by water tolerant trees and shrubs and old-field species.
The BEL reference site is across the river from the restoration site (Figure 2C). It contains approximately 1.5 ha of unrestricted tidal wetland with a mean elevation of 6.73 m. Because it is located near the head of tide, the site does not entirely follow the typical zonation pattern, hydrology and species composition expected of a salt marsh, but rather that of transitional tidal wetland between salt marsh and tidal fresh. The reference site has a well-defined low and high marsh, with low marsh dominated by Sporobolus alterniflorus limited to the river edges and high marsh dominated by brackish marsh species such as Elymus repens, Solidago sempervirens and Sporobolus michauxianus.
To reduce dyke length and address erosion concerns the dyke at BEL was straightened, eliminating sinuous sections of dyke which followed the riverbank, and realigned at its western end near the boundary of the utilized agricultural lands in June 2018 (Figure 2B). In addition, a drainage channel was created to allow tidal flooding and freshwater discharge across the width of the site and the old dyke was leveled to the foreshore elevation along all sections of realigned (newly constructed) dyke.
Variables describing hydrology, topography, sediment and vegetation were sampled following regional guidelines (Neckles et al., 2002; Bowron et al., 2011, 2012). Most variables were sampled Year 1 ~ 2 pre-restoration, one, two, three and four (BEL) or five (SC) years after restoration (Table 2). Pre-restoration conditions were sampled in 2007 and 2008 at SC and 2017 at BEL.
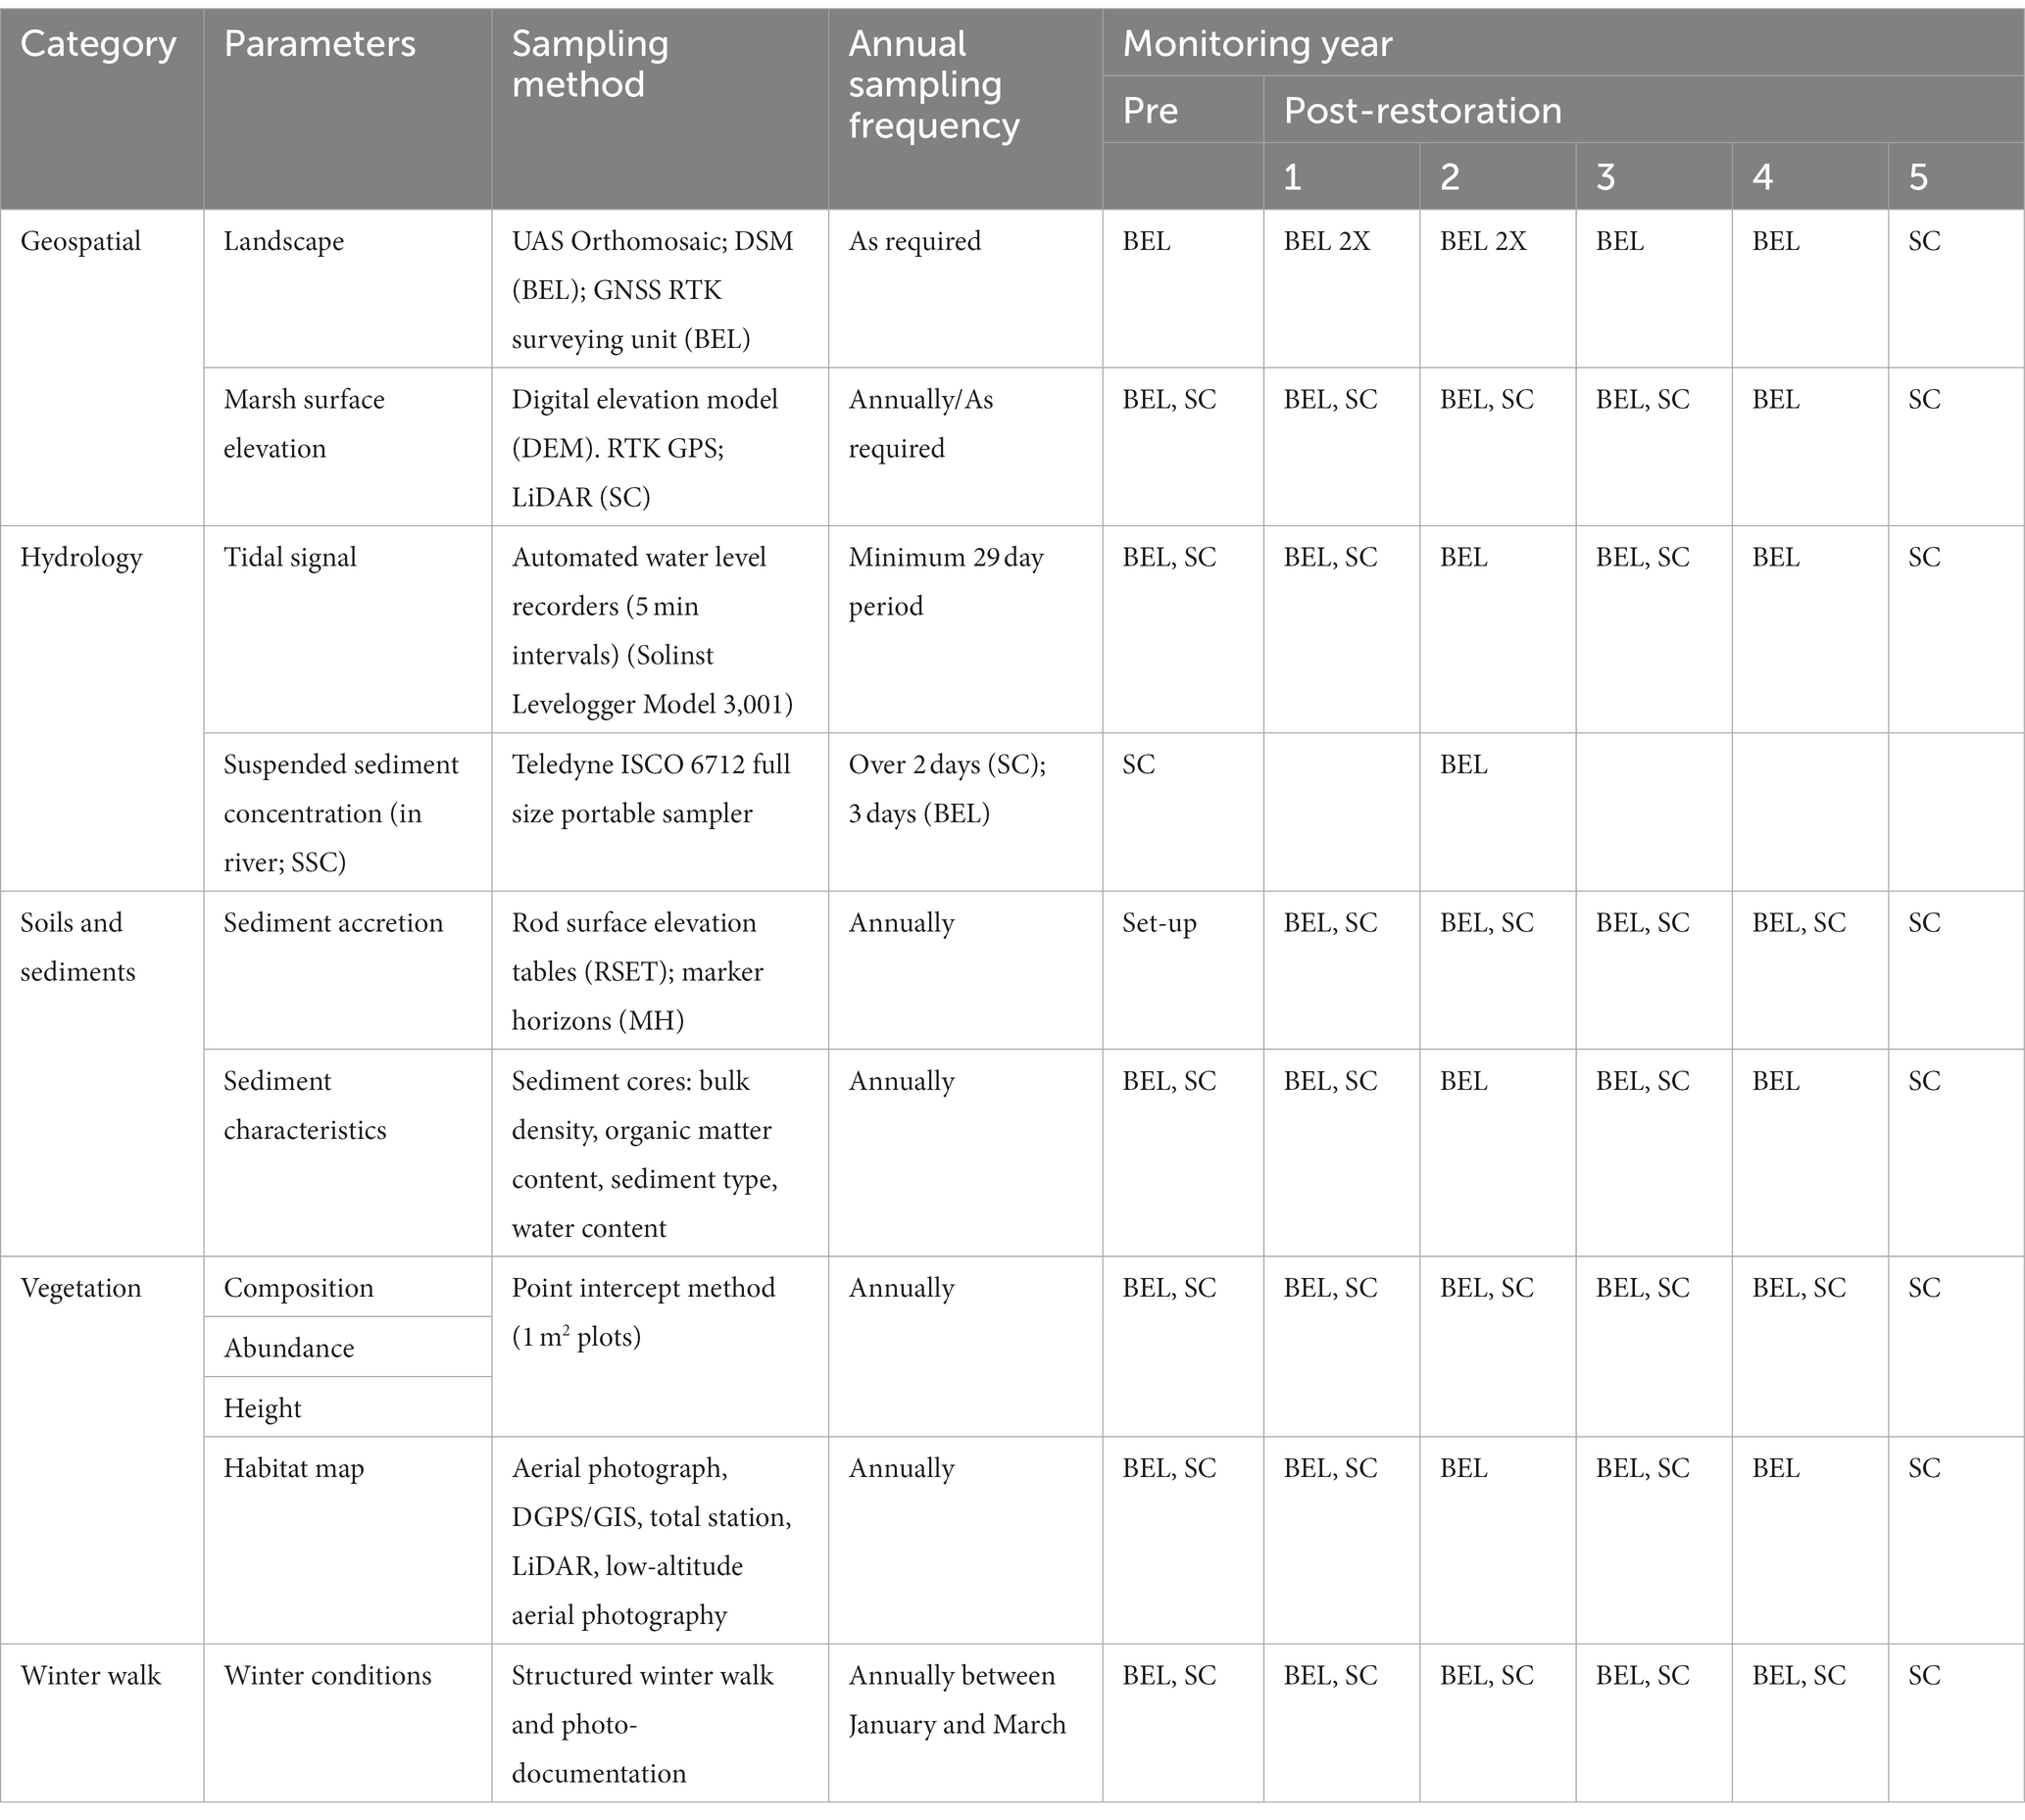
Table 2. Environmental sampling: Variables, including core and additional ecological indicators, methodologies, and frequency (sites: BEL: Belcher street; pre-restoration: 2017; post-restoration: year 1: 2010; year 5: 2014; SC: pre-restoration: 2007, 2008; post-restoration: year 1: 2018; year 4: 2021).
Sampling was conducted using a series of permanent transects and sampling stations that were established in a non-biased, systematic sampling design as part of the baseline monitoring activities in 2007–8 (SC) and 2017 (BEL; Bowron et al., 2015, 2017). At SC, a permanent benchmark was installed and used to establish the first Line (transect; Figure 1C). Each sequential Line was then set using the location of the one previous. The five transects were permanently marked by a pair of wooden stakes (labeled as front stake and back stake) installed at the upland end of the transect; 35 sampling stations were established along 5 transects–25 stations were located at equal intervals on the landward side of the dyke (T1 20m; T2 ~ 5 40 m), and an additional 2 stations per transect located on the seaward side of the dyke in the high and low marsh. Four transects and 19 sampling stations were established at the SC reference site, with transects spaced 20 m apart with a 20 m buffer applied to the tidal creek bisecting the site, and stations placed 10 m apart (Figure 1D).
At BEL, four transects were established, 50 m apart (as measured along the upland edge of the north-west side), running roughly perpendicular to the Jijikwtuk River and marked along the upland edge with semi-permanent bamboo stakes (Figure 2C). Data collection was conducted at 21 sampling stations established at equal intervals (20 m) along each transect. Six transects with 17 sampling stations were established at the reference site. A Leica Geosystems G14 dual-frequency GNSS receiver was employed to relocate the transects and sampling stations. These stations are resampled each year as indicated in the monitoring schedule (Table 2).
Digital Elevation and Surface Models (DEM, DSM), orthophotography and ground surveys were carried out at each site. These are essential for characterizing morphological, surface cover and elevation changes.
For the SC restoration and reference sites a LiDAR DEM was used in the baseline analysis. The LiDAR was flown in April 2007, processed by the Applied Geomatics Research Group (Nova Scotia Community College, Centre of Geographic Sciences; (Bowron et al., 2008). In 2010, 2012 and 2014, the SC DEM was updated using ArcGIS’s Topo to DEM tool with surveyed elevation points (Trimble G8 GNSS RTK) and contour data extracted from the LiDAR surface (major contours only) as inputs (Supplementary Appendix 1). Detailed elevation surveys of the SC and reference site marsh surfaces were completed annually.
By 2018, improved performance of and access to drone technology resulted in increased collection of geospatial data at BEL, particularly DSM and orthophotography. While baseline analysis relied on ground survey data and a LiDAR DEM provided by NSDA and flown in 2007 by AGRG, DSM collected in 2018 and 2019 contained large areas of bare ground. In 2020 LiDAR data was again collected by the province of Nova Scotia and was used for Year 4 analysis. Elevation surveys were conducted on multiple dates using a Leica Viva GS14 dual-frequency GNSS smart antenna2 with nRTK positioning corrections (SmartNet NS; Supplementary Appendix 1). All elevations are reported relative to the Canadian Geodetic Vertical Datum of 2013 (CGVD2013; Natural Resources Canada, 2020).
For both SC and BEL Orthophotography was collected on multiple occasions. Several platforms were used including traditional plane-based imagery collection, remotely operated, tethered balloon and suspended camera system, quadcopter Remotely Piloted Aircraft Systems (RPAS) and fixed wing RPAS. Prior to conducting the RPAS flight, a Ground Control Point (GCP) network was designed to ensure optimal georeferencing results in the Structure-from-Motion (SfM) workflow for production of DSMs using the most up to date recommendations found in the scientific literature (James and Robson, 2014; Tonkin and Midgely, 2016; Raczynski, 2017).
At both sites automated water level loggers were deployed annually in still wells to record water levels and temperature at 5 minute intervals. Additional loggers were deployed in the upland to provide barometric compensation. At SC Solinist Leveloggers (Model 3,001) were deployed in 3 locations: the St Croix River, the primary tidal channel (old aboiteau channel), and at the reference site. At BEL, HOBO automated water level recorders (Model U20T) were deployed 400 m downstream of the restoration site and within the primary tidal channel. The positions of each of the units was surveyed using GPS RTK and water depth converted to geodetic elevation (m CGVD2013; Supplementary Appendix 2). Water levels were graphed in Microsoft Excel with precipitation records obtained from the nearby climate stations (ECCC, 2022).
Hydrology was assessed using critical water elevations calculated from the loggers in conjunction with hypsometric curves and flood maps generated from DEMs previously described. Hypsometric curves show area flooded at a tide height, describing the way in which the marsh is expected to flood as the tide rises. Hydroperiod statistics such as inundation ratio (IR: time inundated during recording period) and inundation frequency (IF: number of tides resulting in flooding during recording period) were calculated using the tidal signal recorded from the level loggers and surveyed station elevations.
Rod Surface Elevation Tables (RSET) and Marker Horizons (MH) (mm resolution) were used in combination to explain processes behind marsh elevation increases or decreases (i.e., sedimentation, subsidence; Neckles et al., 2002; Lynch et al., 2015). Marker Horizons provide a measure of sediment accretion (deposition) above a layer of white feldspar clay. A cryocorer using liquid nitrogen was used to extract a frozen ‘bullet’ of sediment. Sediment accretion since the first introduction of tidal waters was determined by measuring the distance from the surface to the feldspar layer. Net accretion between years was determined by subtracting the current year’s measurement from the previous.
RSETs and MHs were installed at SC (four stations) and SC reference (two stations) in 2007 (Figure 1A). Three RSET and MH stations were installed at BEL in June 2018. A reference RSET and associated MH were installed at the existing fringe marsh to capture the reference condition (Figure 2A). All RSETs and MHs were sampled yearly (Table 2).
Sediment cores were collected at both sites and corresponding reference sites at the vegetation sampling stations. All cores were processed for bulk density, water and organic matter content and grain size. The samples were placed in a freezer and kept frozen until processing. The sediment cores were thawed before being extruded from their containers. The samples were photographed and split open to determine the color (Munsell Color, 1994), texture and composition of the core for a qualitative description. To determine bulk density and water content, soil samples were thawed and removed from the syringes, dried and weighed. Organic matter content was then determined using loss-on-ignition after 4 h at 550°C. Organic carbon density was derived using the equations in Craft et al. (1991). To determine particle size distribution, sediment cores were analyzed using a Coulter Multisizer 3tm which is based on electrical resistance and is more accurate for the analysis of fine sediments (McCave et al., 2006). The two aperture tubes that were used were the 200 μm tube and the 30 μm tube. The grain size distributions were analyzed using the GRADISTAT program and size classes determined using a modified Udden-Wentworth scale (Blott and Pye, 2001). Floc fraction, the proportion of deposited sediment deposited in flocculated form, was determined using the inverse floc model (Curran et al., 2004).
Vegetation sampling locations were surveyed using permanent 1 m2 plots positioned at intervals along each transect. Each 1 m2 plot (quadrat) used was offset 1 m to the left of the transect (facing main tidal channel) and oriented toward the upland end of the transect. The quadrat was divided into a grid of 25 squares (20 cm × 20 cm) and the resulting 25 intercept points were used as sampling points. All plant species present in the quadrat were recorded and then a wooden dowel (3 mm in diameter) was held vertical to the first sampling point and lowered through the vegetation to the ground below. Any species that touched the rod were recorded and this was repeated for all 25 intercept points. Other categories, such as water, bare ground, rock or debris, were also recorded if hit by the dowel. Plant species richness, halophytic species richness and cover, and unvegetated area were compared among sites. Percent cover was estimated as the number of pins contacted by leaves/stems/flowers of that species out of a total of 25 pins. The species encountered at these sites that were classified as halophytes are: Atriplex spp., Bolboschoenus maritimus, Juncus gerardii, Solidago sempervirens, Sporobolus alterniflorus, Sporobolus michauxianus, Spergularia salina, and Suaeda spp. Change in vegetation cover and halophytic plant cover were estimated for each plot by subtracting Year 4 post-restoration values from Year 1 post-restoration values; ordinary least squares regression was carried out to determine whether the net change in elevation at each vegetation plot could predict vegetation cover change or halophytic cover change.
Habitat maps document vegetation community structure and other important habitat features at the landscape scale (e.g., channels, culverts, beaver dams). Habitat maps were developed for all sites by using vegetation analysis results to first identify larger community types (i.e., high marsh, low marsh, bog, etc.). Subsequently, plot-level data (training points) were used to manually digitize surface cover classes from available imagery. Where available, ancillary data such as DSM, image segmentations for bare ground areas, and site photos were used to aid in image interpretation (these products varied by both site and year). At SC habitat maps were generated pre-restoration (2007) from provincially available aerial photography and in Years 1, 2, 3, and 5 (2010 ~ 2014) from low-altitude imagery described previously. Baseline habitat maps at BEL were created as part of the pre-restoration surveys (2017) and updated in subsequent years (1 ~ 4).
Overall, both sites experienced massive deposition of sediments in Year 1, burying pre-existing vegetation and soils (Figures 3, 4). At SC, the influence of the restored tidal flow was immediately evident by the retention of water in the constructed ponds at SC (Figure 4), large deposits of sediment leading to patches devoid of vegetation, and the re-activation of the hybrid tidal creek networks. At BEL, full hydrological restoration in Year 1 post restoration was indicated by equivalent tidal signal in the river and in the main drainage channel on the restoration site. Both sites experienced consolidation of sediments and rapid recolonization of vegetation in Year 2. Subsequent years showed continued but lower rates of accretion and elevation gain accompanied by almost complete coverage by vegetation.
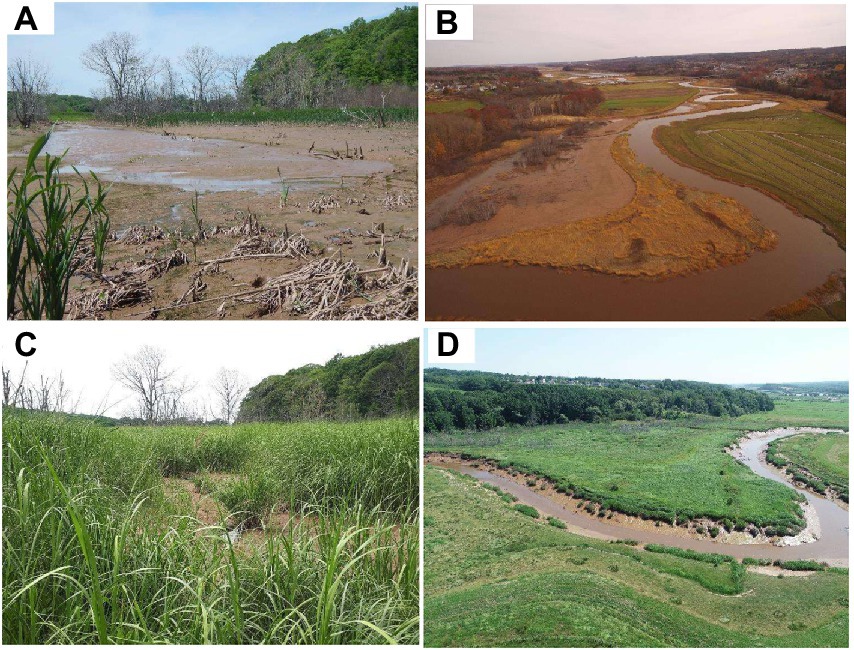
Figure 3. Belcher St. site (A) 2018 (Year 1 post); (B) 2018 (Year 1 post) aerial view after dyke realignment; (C) 2021 (Year 4 post); (D) 2021 (Year 4) aerial view.
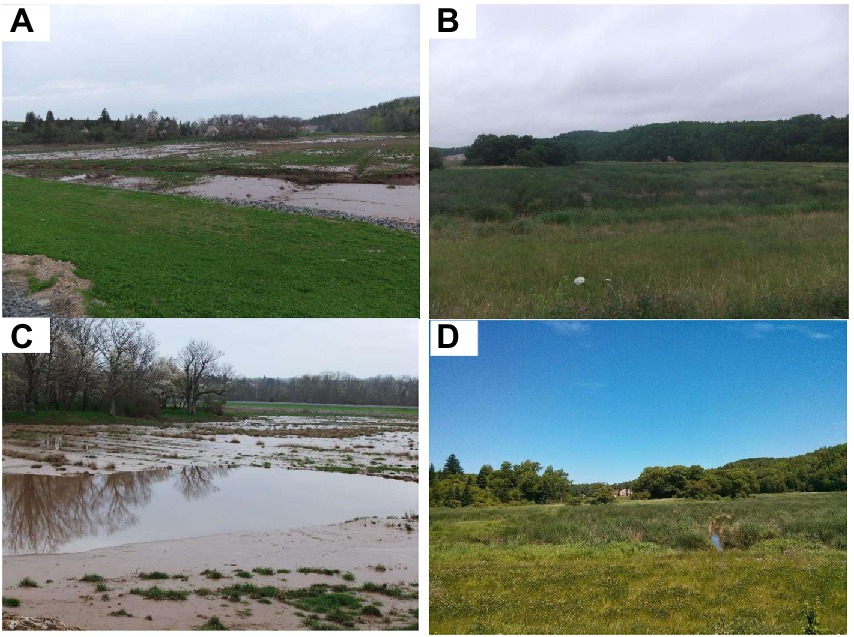
Figure 4. St. Croix restoration site (A) marsh landscape Year 1 (2010); (B) marsh landscape Year 3 (2012) post; (C) constructed pond Year 1 post (2010); (D) constructed pond Year 5 (2014) post facing north.
Both sites fell within a similar tidal range, with the mean recorded high tide, maximum recorded high tide, and the historic High-Water Line (HWL3) slightly higher at SC than at BEL. HWL was 7.8 m at SC and 7.4 m at BEL, with recorded mean high tide at SC 6.1 m and 5.6 m at BEL. The lowest recorded high tides were 4.1 m (SC) and 4 m (BEL). However, lower mean elevations and slightly greater subsidence at SC prior to restoration (Baseline) resulted in higher IR and IF than were observed at BEL (Table 1).
Hypsometric curves for pre-and post-restoration conditions at both sites are shown in Figure 5. Prior to restoration, overbank flooding began at SC at approximately 5.5 m, a half meter below the mean recorded high tide, and flooded gradually to the upland edge (Figure 5A). Following restoration, overbank flooding begins at mean recorded high tide, but flood pattern remains the same. At the reference site, the presence of a tidal channel bisecting the site results in some early flooding, with the majority of the site flooding at ~6.8 m. At BEL, overbank flooding begins above the recorded mean high tide (5.6 m) both pre and post restoration (Figure 5B). Following restoration, the pattern of flooding became more similar to the reference site, with the site flooding more quickly and at higher elevations. When both tidal range and area flooded were converted to percent to allow direct comparisons, the similarity in flood patterns at all sites and greater subsidence of the SC site are evident.
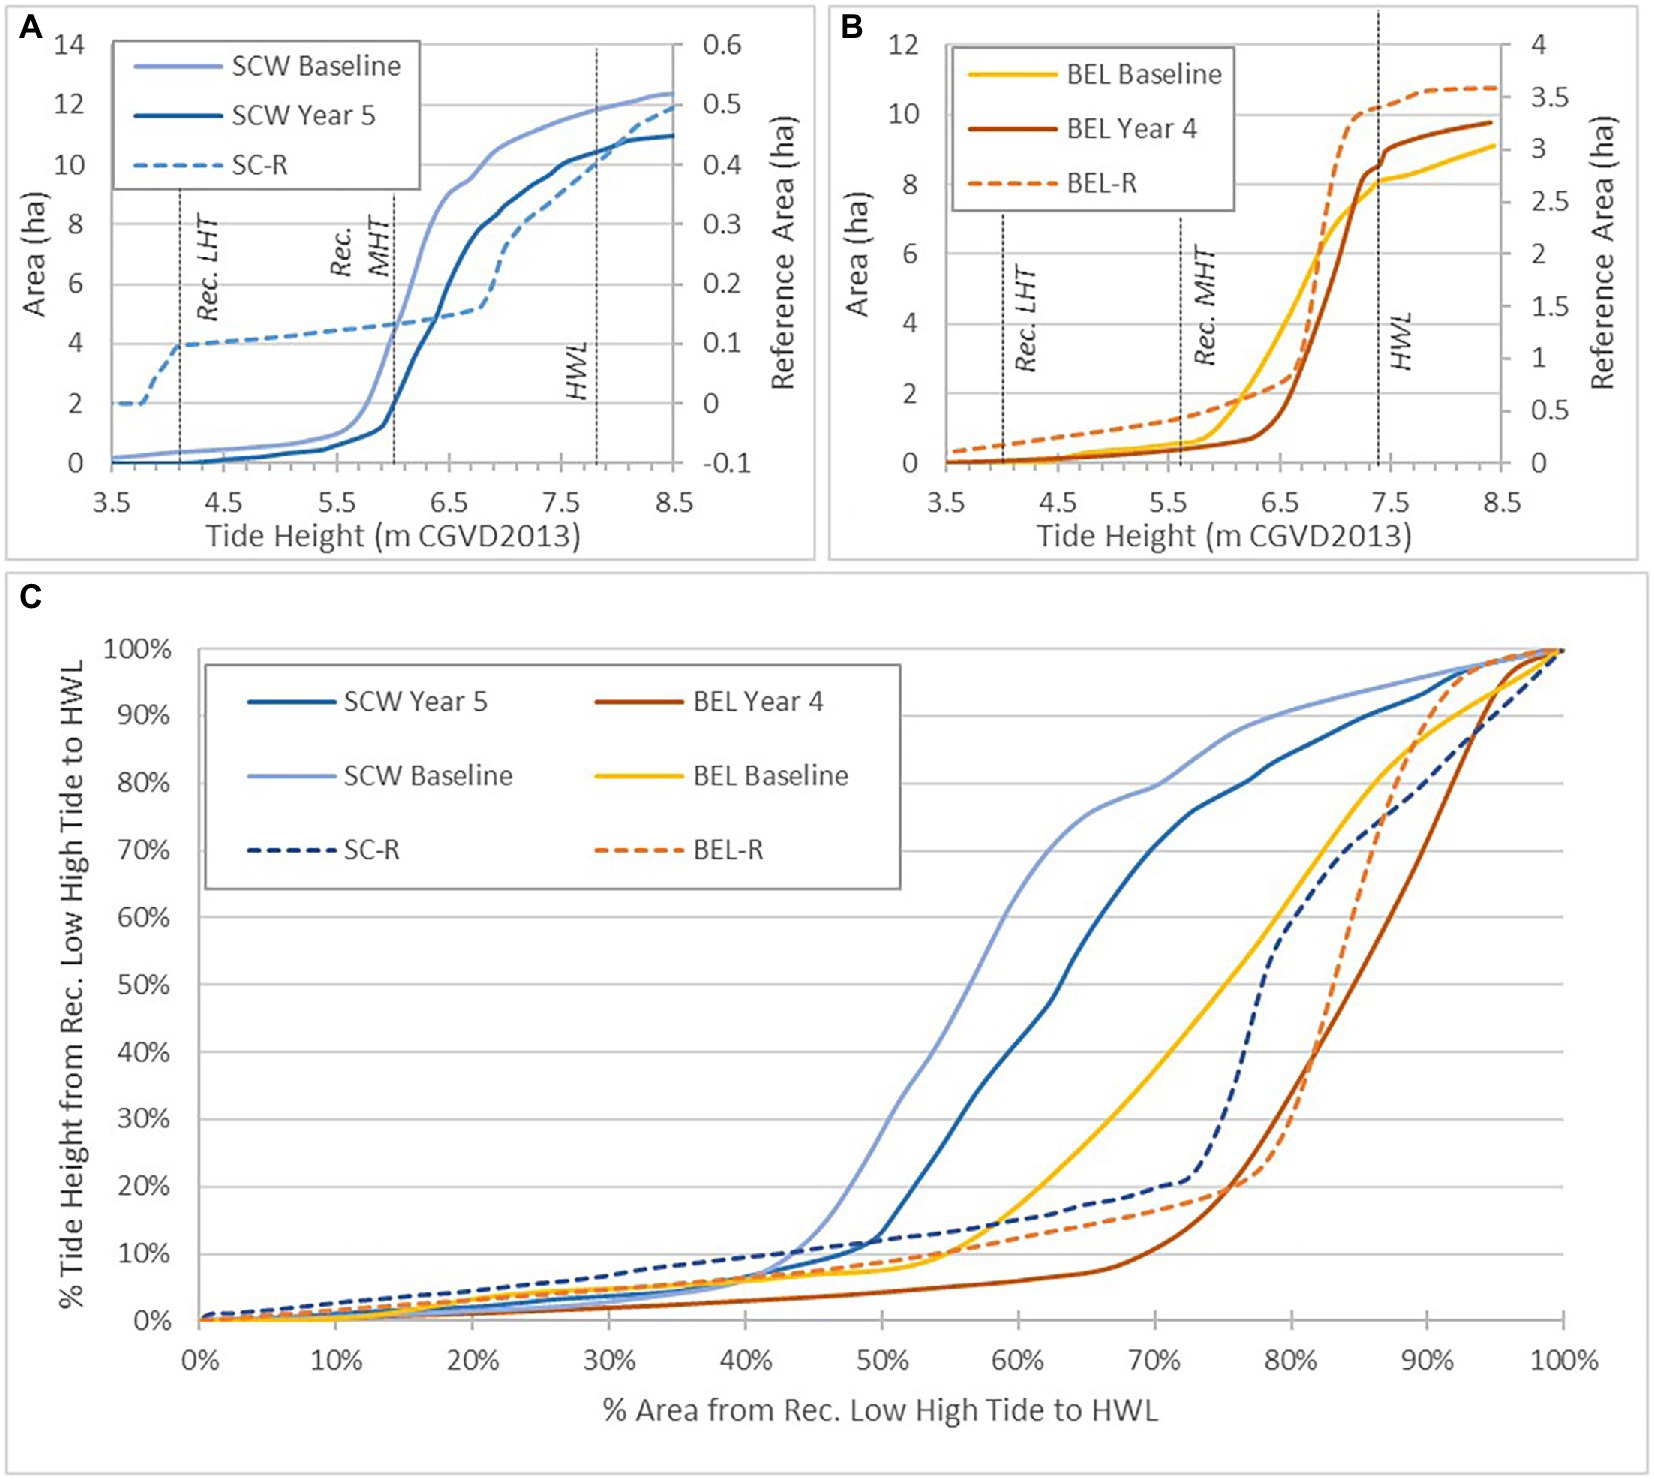
Figure 5. (A) SC hypsometric curves at reference site, pre, post restoration. (B) BEL hypsometric curves at reference site, pre, post restoration. (C) Area flooded (%) between recorded low high tide and HWL for SC and BEL.
Both sites showed elevation gains of 8 ~ 18 cm at the RSET locations in the first year following hydrological restoration (Figure 6A), many times that at each respective reference site. Elevation changes at BEL were inconsistent among stations in Year 2 with two stations and the reference station showing a net decline in elevation. At SC in Year 2 elevations grew less than in Year 1 but were still all positive. Year 3 elevation changes were positive at BEL (7 ~ 10 cm) and SC (1 ~ 7 cm). Net gain in elevation over the first 3 years post restoration at BEL ranged from 22.9 cm to 33.0 cm compared with only 0.2 cm at the reference site. Net elevation gain at SC over the first 3 years ranged from 16.0 cm to 32.4 cm compared with 0.3 cm at the reference site. SC elevation changes remained positive in Years 4 ~ 5 (Figure 6A), with total additional gains from 1.8 cm to 16.0 cm, compared with −0.7 cm change at the reference site. At SC, RSET stations closest to creeks and lowest elevations had the most elevation gain (SC SET-1, −2) overall.
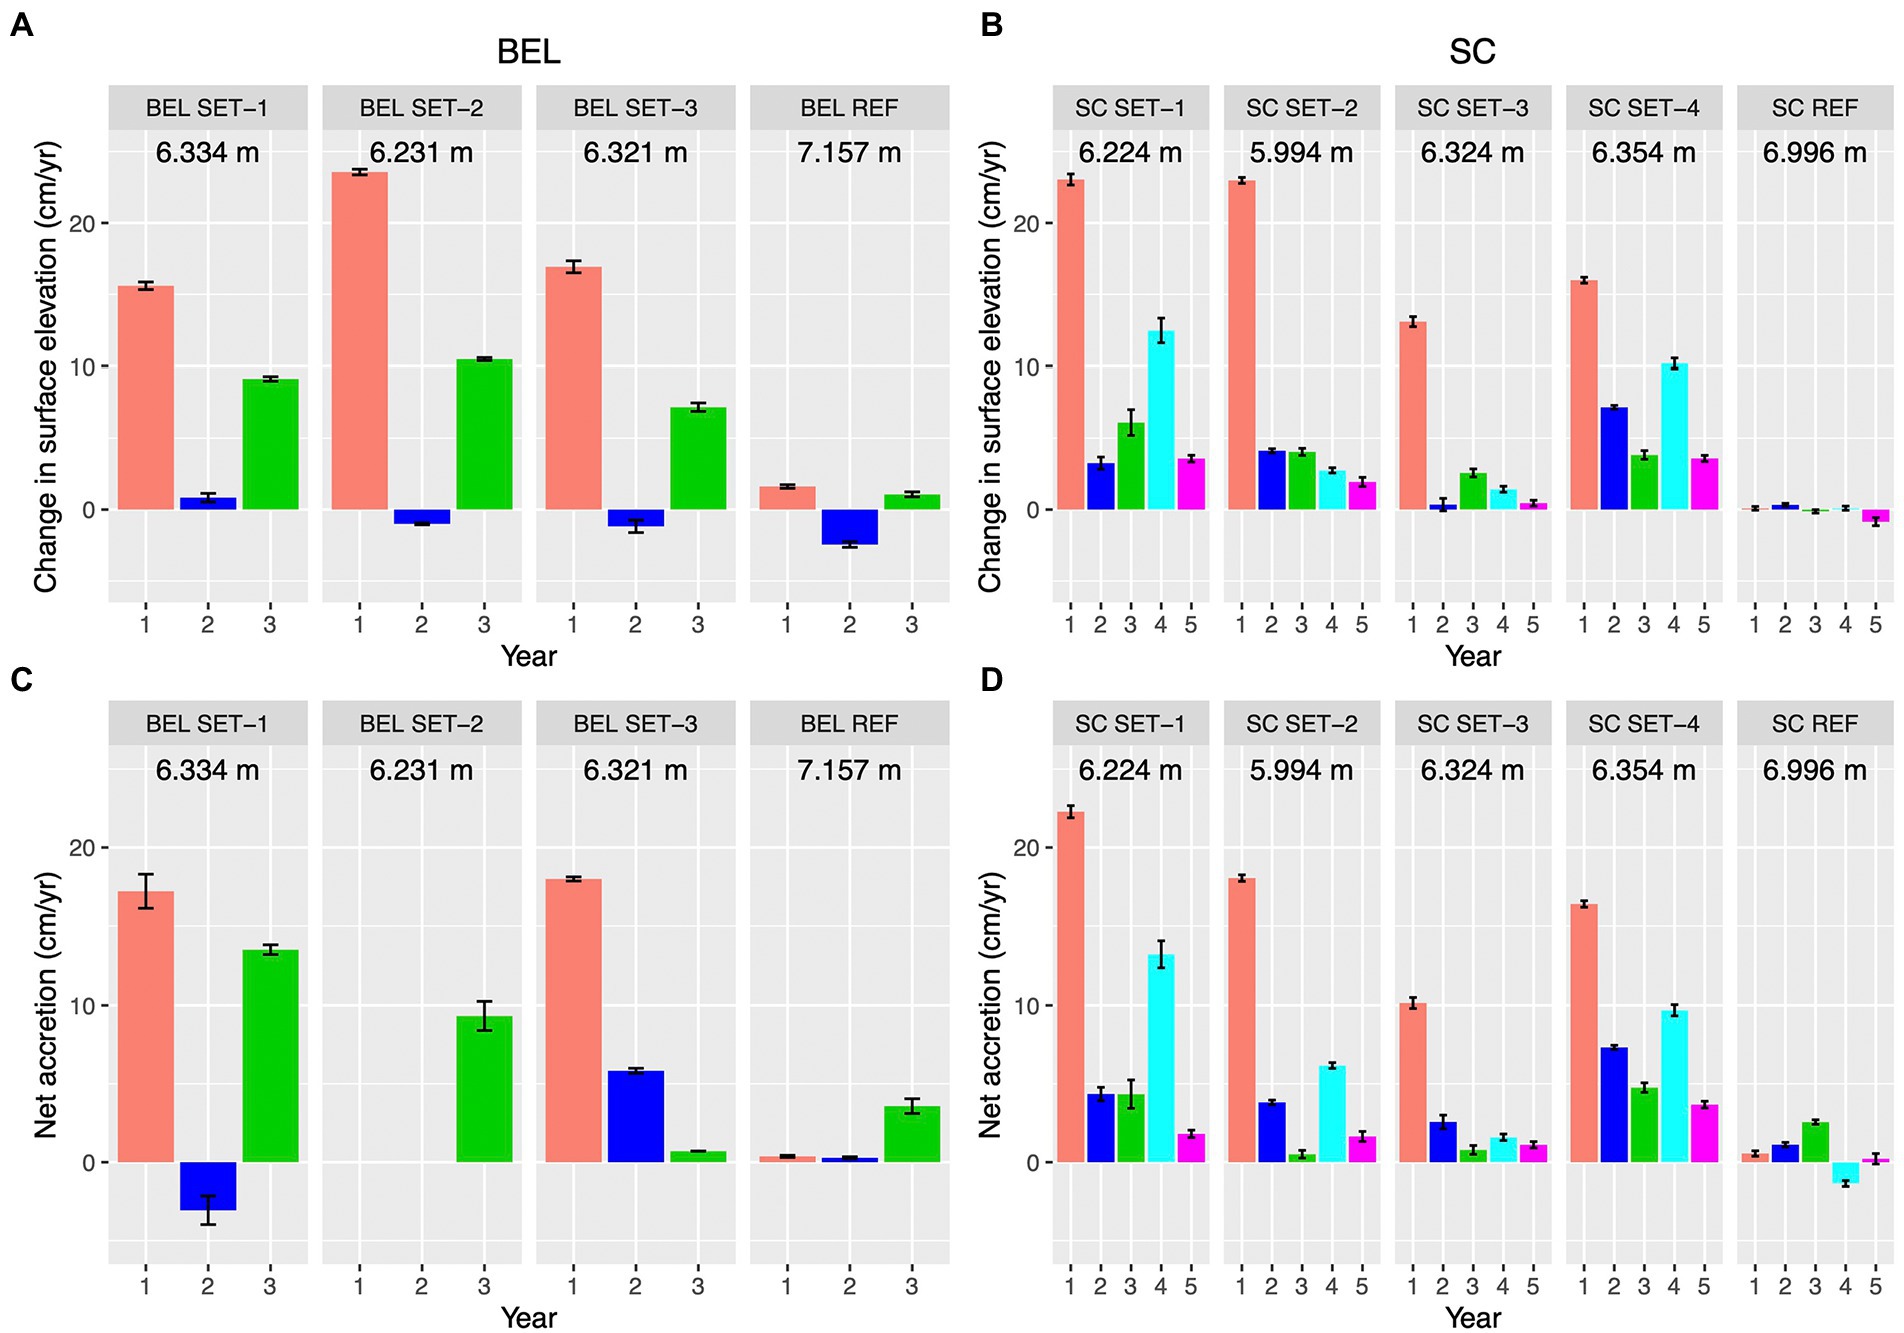
Figure 6. Surface elevation and sediment changes at BEL and SC restoration sites; error bars are standard errors; (A,B) Changes in surface elevation from RSET stations (Years post hydrological restoration); REF indicates reference site stations. Means are calculated across all pins on each station; (C,D) Accretion measured at RSET stations using marker horizons. Means calculated from three marker horizons per RSET location, REF indicates reference site stations.
Accretion was net positive for all stations that could be measured in the first year, and much greater than at each respective reference site (Figure 6). At BEL SET-02 in Year 2, the depth of accreted sediments exceeded the depth of the sampling containers, so this station was not sampled in that year. In Year 2, the two stations that could be measured had a negative value at SET-1, but a positive value at SET-3. Net accretion at BEL over the 3 years ranged from 9.3 cm to 27.6 cm while the BEL reference site showed only 4.2 cm of accreted sediments; at SC, patterns were similar with 13.7 cm to 33.0 cm compared with 7.3 cm at the reference site. Overall, high accretion and elevation gains in the first year were followed by lower gains in subsequent years.
Sediment bulk density increased consistently over time at BEL, from an average of 0.5 g∙cm−3 pre-restoration to almost equivalent to the reference site average by Year 4 (Figure 7A). Sediment water content at BEL declined post restoration but stayed relatively consistent across years 2 to 4 and was slightly higher than the average reference site value. At SC, bulk density increased in Year 1 post-restoration but declined to pre-restoration levels in Years 3 and 5. SC bulk density values were consistently higher than the restoration site average throughout the study period. Sediment water content at SC showed no consistent pattern over the study period but was lower than the reference site average throughout the study (Figure 7B).
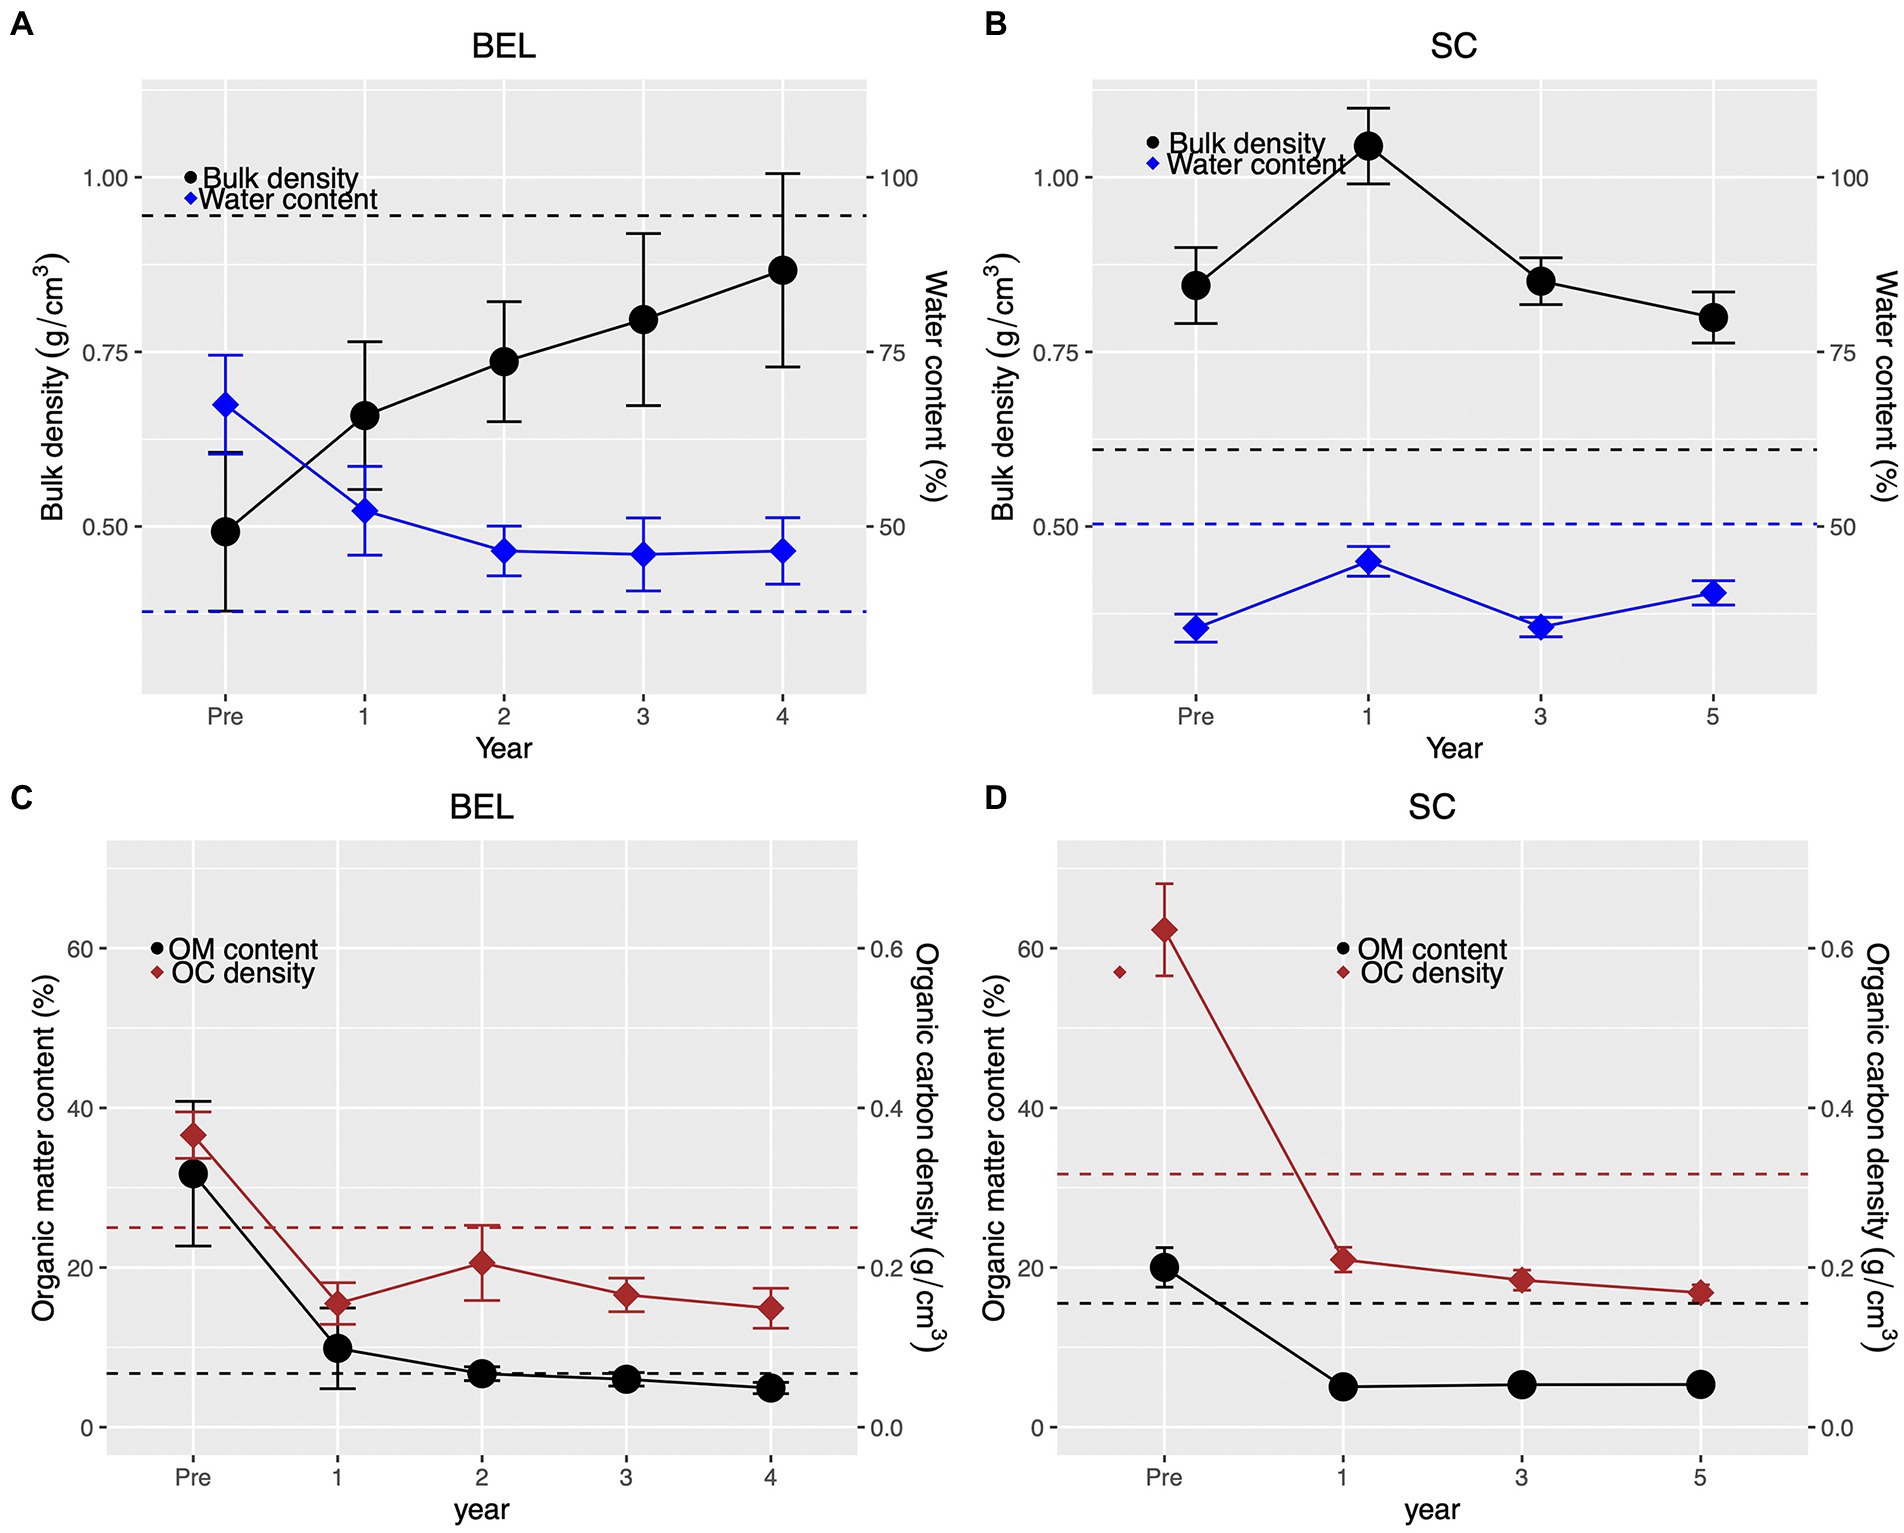
Figure 7. (A,B) Sediment core bulk density and water content at BEL and SC restoration sites. Dotted horizontal lines represent the average value for cores taken at the respective reference sites. (C,D) Sediment core organic matter content and organic carbon density changes at BEL and SC restoration sites. Dotted horizontal lines represent the average value for cores taken at the respective reference sites; error bars are standard errors.
Sediment organic matter content and organic carbon density declined abruptly in the first year post-restoration at both sites (Figures 7C,D) but then remained relatively constant to the end of the study period. At both sites final sediment organic carbon density remained lower than corresponding reference site values.
Post restoration, particle grain size ranged from 8.43 μm to 18.05 μm at SC. These values fall into the medium silt range which is consistent with the expected grain size of suspended sediment in the area (Bowron et al., 2012). In Year 5, deposited sediments were finer, ranging from 5.23 to 9.49 μm (fine -med silt). This range was more similar to lower end of the range of particle sizes recorded at BEL post restoration (3.9 μm: very fine silt to 20.9 μm: medium silt). The largest grain sizes were recorded immediately adjacent to the tidal channel. All samples were poorly sorted over all years. BEL generally had a greater proportion of sediment deposited in flocculated form (0.7 ~ 0.8 on average) than SC (0.5 ~ 0.7). SC tended to have greater variability in floc fraction both within and between years (Figure 8).
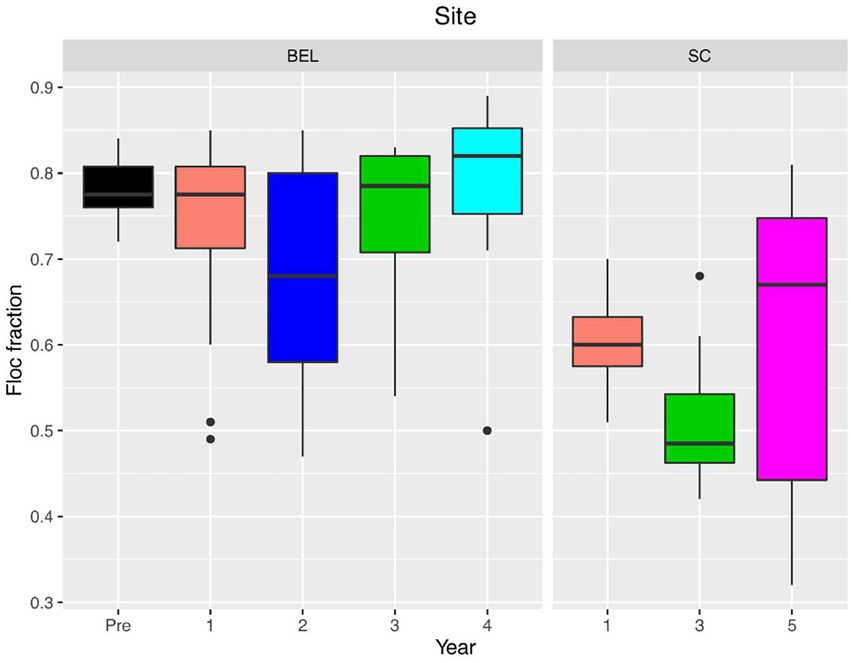
Figure 8. Floc fraction for sediment samples over time at BEL and SC restoration sites.
Prior to restoration, both sites contained a mixture of wet pasture and fresh to brackish wetland patches (Supplementary Appendix 3; Figures 1, 2). In Year 1 at both sites there were substantial areas where pre-existing vegetation had been covered by a thick layer of sediment. Vegetated patches in Year one at SC were mainly dominated by sedge and rush communities, and a meadow with sparse cover of brackish tolerant plants, including Alopecurus spp., Agrostis stolonifera and Elymus repens (Figure 9; Supplementary Appendix 3). Both Alopecurus species increased post-restoration but declined to low abundance by year 5 (Supplementary Appendix 3). From Years 2–5 at SC, vegetation cover increased rapidly (96% cover by Year 3). By Year 5, the main cover at SC was patches of cattail marsh (mainly Typha latifolia) and tall, brackish meadow species (mainly Sporobolus michauxianus; Figure 9). SC also shares dominant species such as Sporobolus michauxianus with the reference site (Supplementary Appendix 3). However freshwater marsh species like Typha spp. were much more dominant at the restoration site (approximately 25% cover across all monitoring plots).
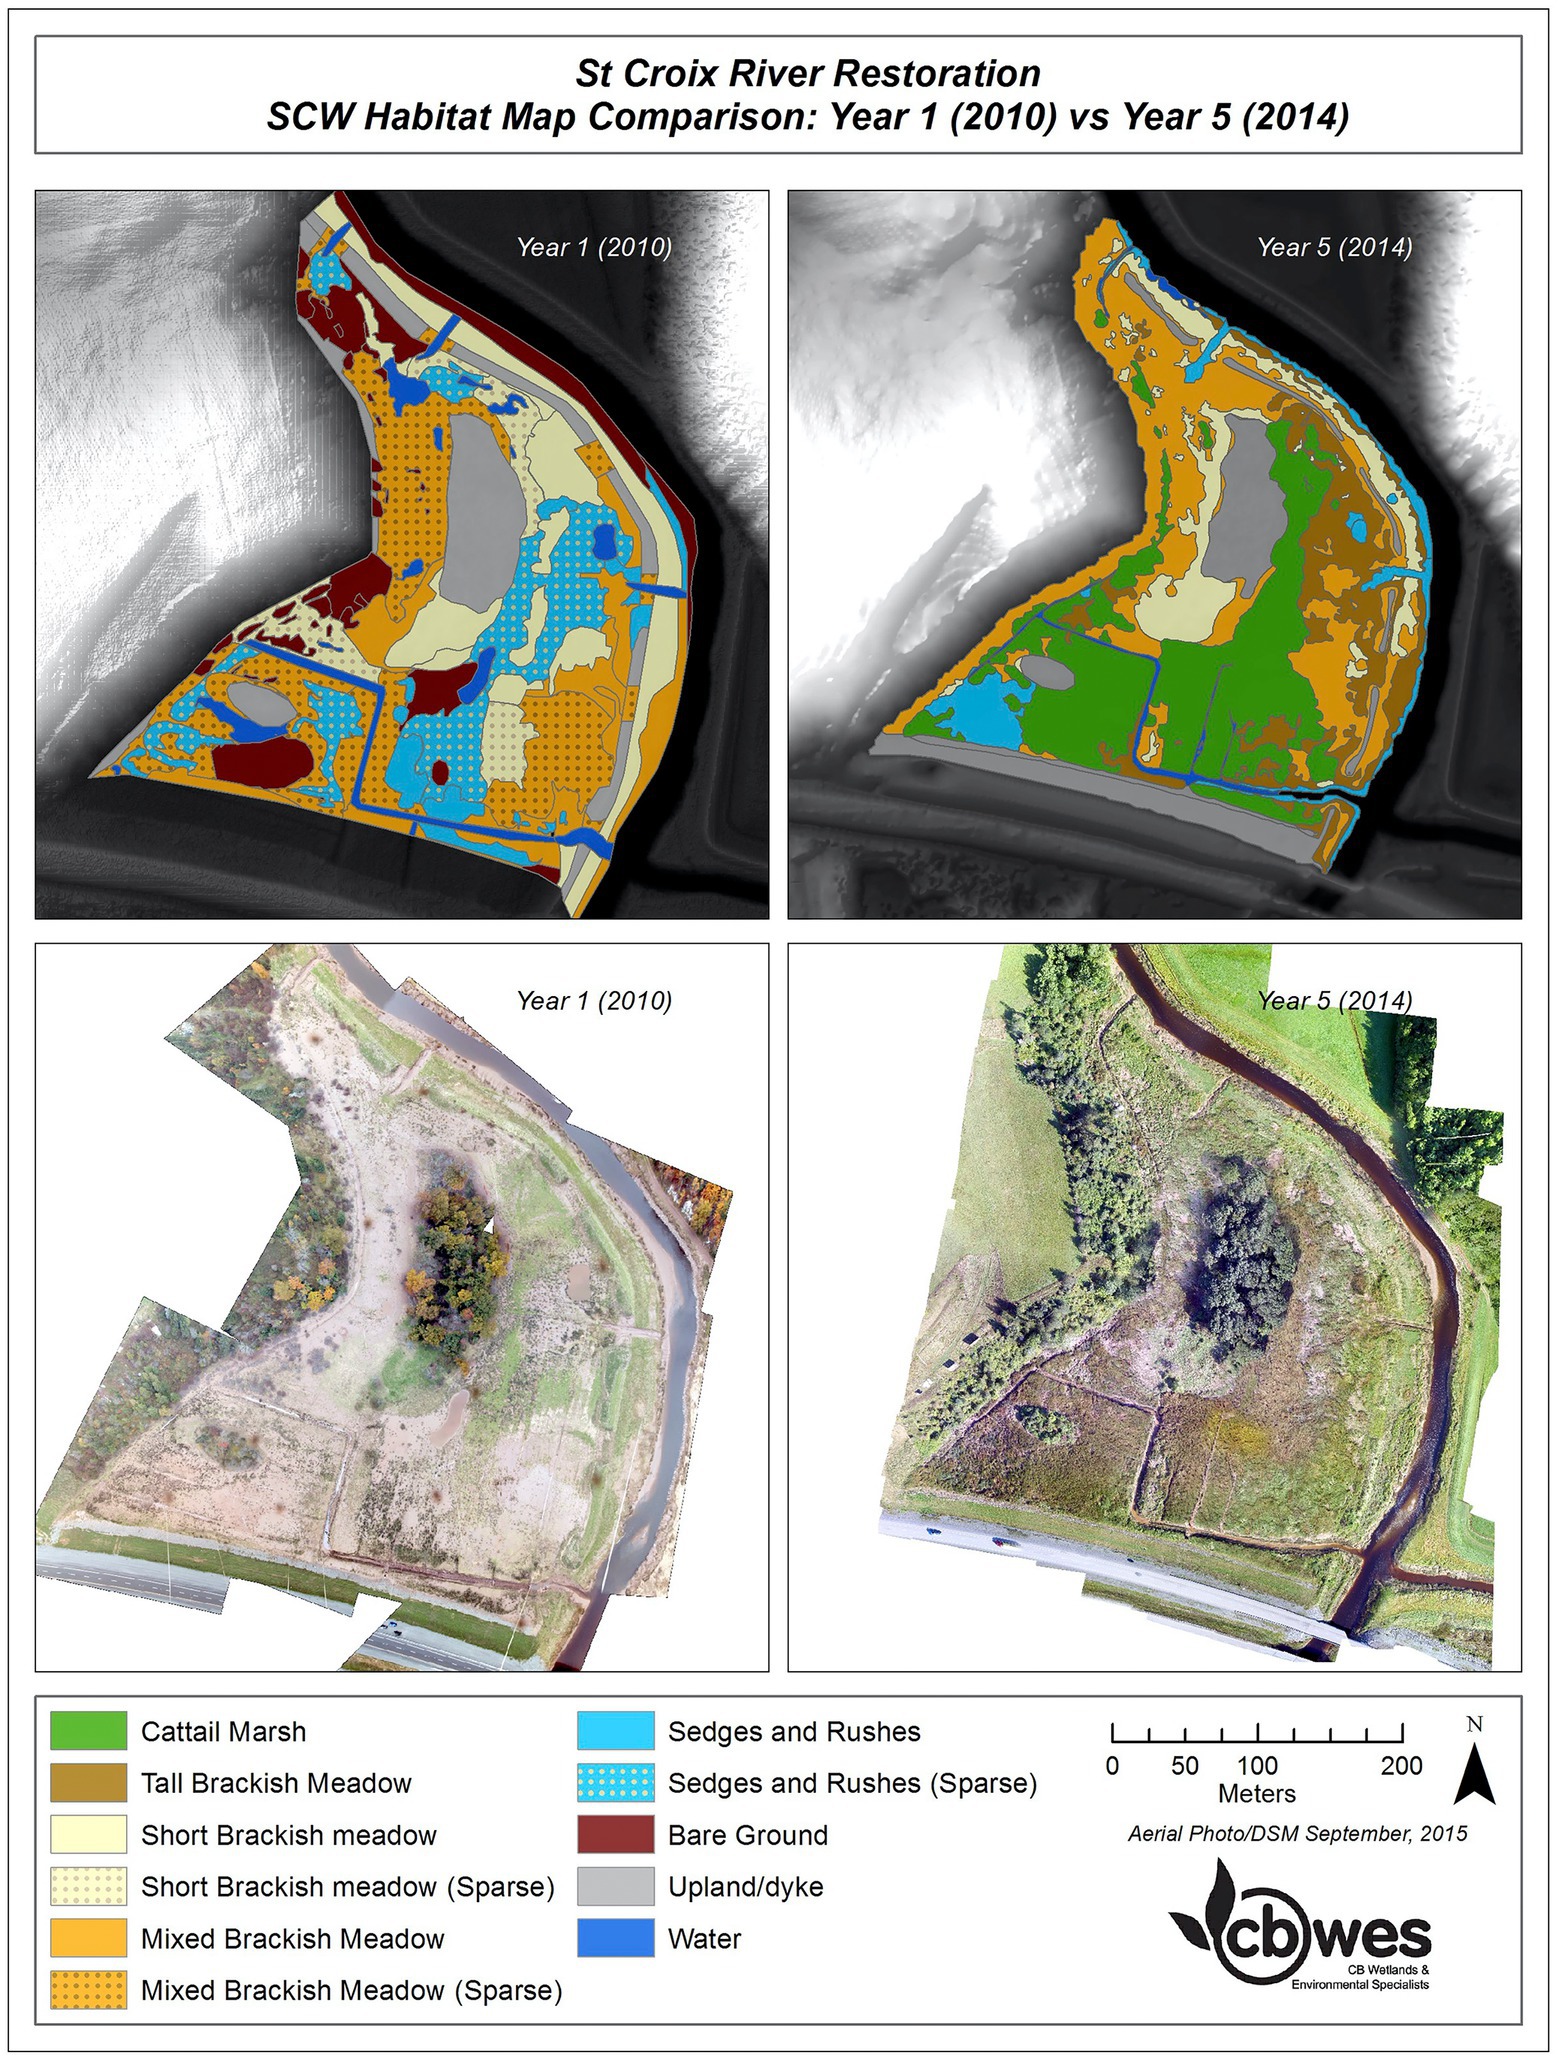
Figure 9. Habitat comparison at SC restoration site between Year 1 and Year 5 post restoration.
At BEL, patches of foreshore salt marsh comprised the main vegetation on the site in Year 1 (Figure 10). These patches had expanded from the pre-construction remnant fringe. S. alterniflorus and S. michauxianus were the dominant species in these areas, but the patches occurred mainly outside the monitoring plots in Year 1 (Supplementary Appendix 3). These species continued to expand on BEL such that they were dominant by Year 4 (Supplementary Appendix 3; Figure 10). There was also extensive colonization of bare ground by annual halophytic colonizers such as Atriplex spp. which occupied approximately 38% of the site by Year 2 and declined in Years 3–4 (Figure 10; Supplementary Appendix 3). Overall, vegetation at BEL has changed substantially since dyke re-alignment with a decline in wet meadow or pasture species and an increase in halophytes such as S. michauxianus, Atriplex spp. and Solidago sempervirens (Supplementary Appendix 3). There is now much closer overlap with the reference site vegetation (Supplementary Appendix 3). BEL also had some Typha spp. but it only covered an average of 4.8% of the monitoring plots, representing a decline from the pre-restoration condition.
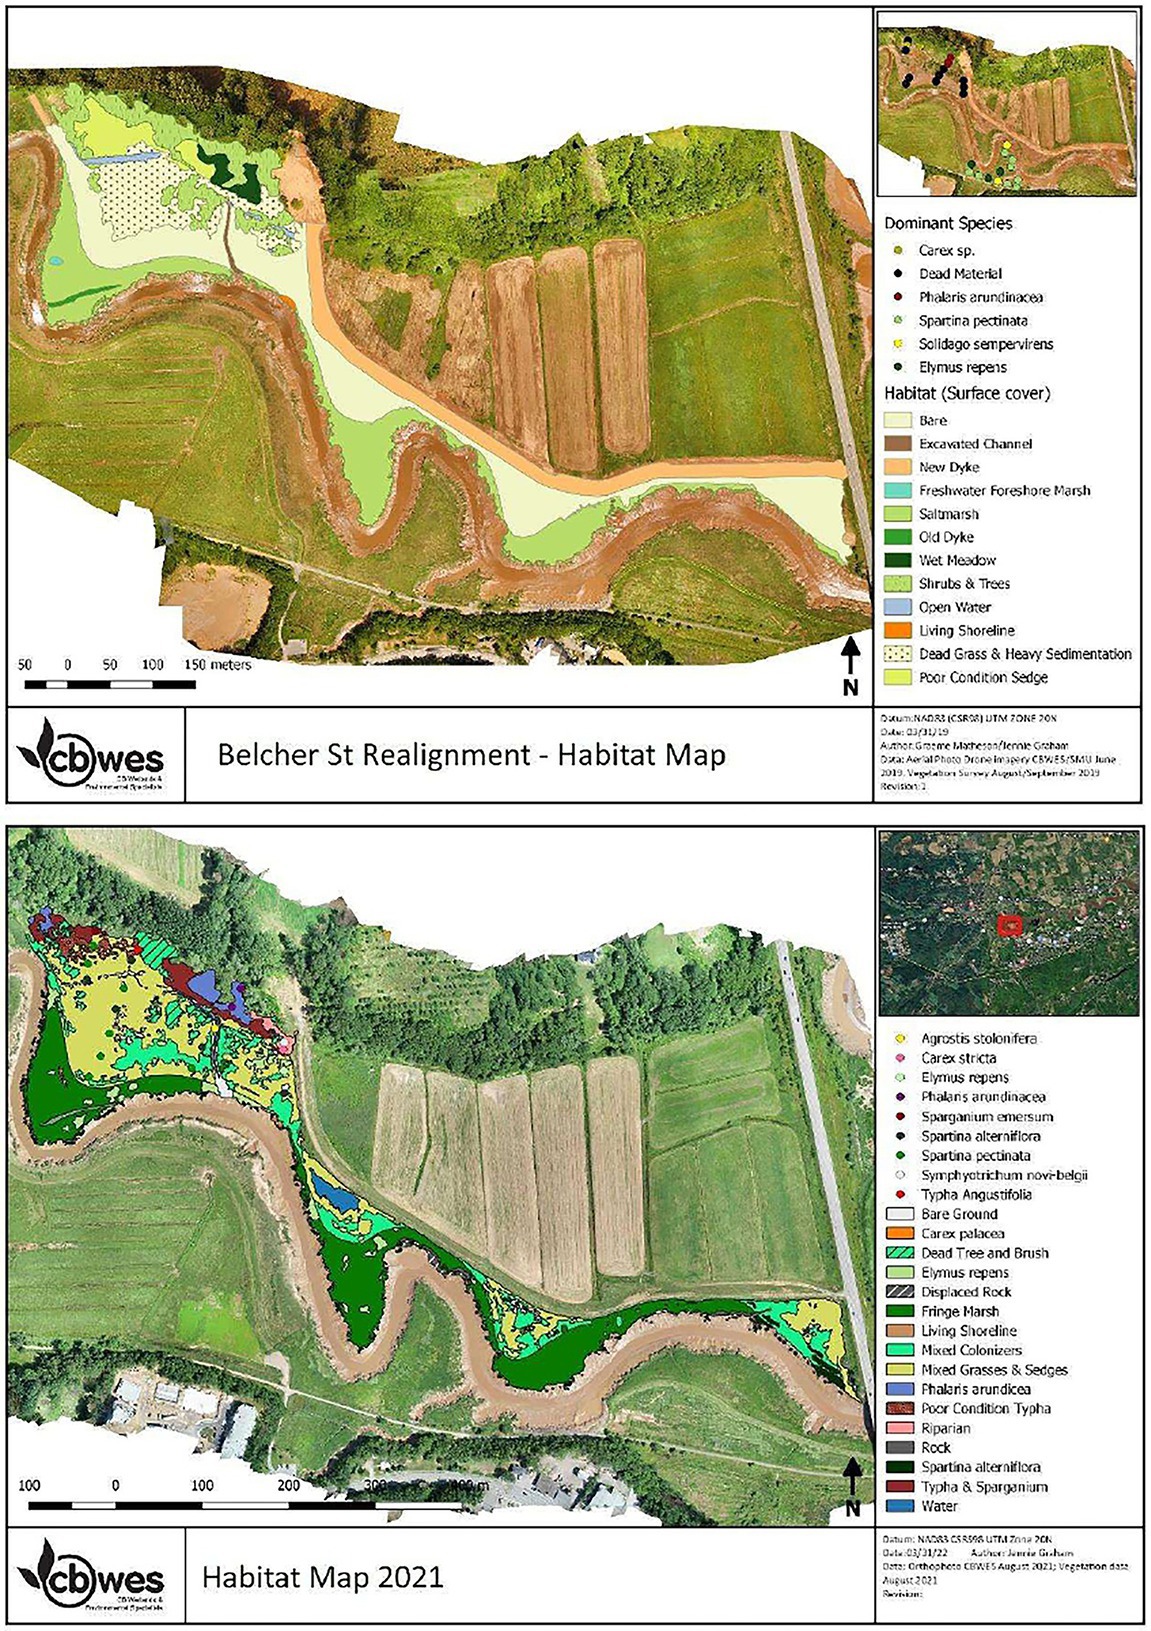
Figure 10. Habitat comparison at BEL restoration site: (A) Year 1 and (B) Year 4 post restoration.
By the end of the study period the dominant halophytes at SC by coverage were: S. michauxianus (24%), Carex paleacea (8%), S. alterniflorus (6%) and Atriplex spp. (2.5%). At the SC reference site the dominant species were: S. michauxianus 28 and 5.6% C. paleacea (Supplementary Appendix 3). In contrast, dominant halophytes at BEL by the end of the study period were: S. michauxianus (39%), S. alterniflorus (32%), Atriplex spp. (14%), Bolboschoenus maritimus (~9%), Solidago sempervirens (3%) and 1.5% C. paleacea. The BEL reference site has S. michauxianus (48%), Solidago sempervirens (16.5%), Atriplex spp. (16%), and S. alterniflorus (5.6%) as abundant halophytes (Supplementary Appendix 3).
Average plot plant species richness was similar at both sites pre-restoration (Figure 11A). At BEL richness dropped substantially in the first year post-restoration before returning to levels equivalent to pre-restoration and the reference site by Year 2. SC richness showed no such decline but peaked in Year 2. At SC by year 5 richness averaged five species per plot compared with over seven at the reference site (Figure 11A). Halophytic species richness was zero at SC pre-restoration, increasing to an average of one by year two, approximately double that at the reference site (Figure 11B). At BEL, there were some halophytes present on the site, and richness dropped in the first year post restoration. In Year two, there was a large increase in halophytic richness at BEL, and the site reached equivalence to the reference site by year three. Colonization of halophytes at SC began in Year 1 post but exceeded richness at the reference site by year two (Figure 11B). Halophytic species cover increased, following a similar pattern at both sites. At BEL equivalence with the reference site was achieved by Year three (~88% cover), and SC reached equivalency (~30% cover) by Year two (Figure 11C). Unvegetated areas at both sites increased dramatically in the first year post restoration followed by rapid recovery of vegetation (Figure 11D). Both the change and vegetation cover and the change in halophytic plant cover were weakly positively correlated with the net change in elevation at vegetation plots (Supplementary Appendix 6). This indicates that plots that gained more elevation post-restoration also had higher increases in coverage by any plants and halophytic species in particular.
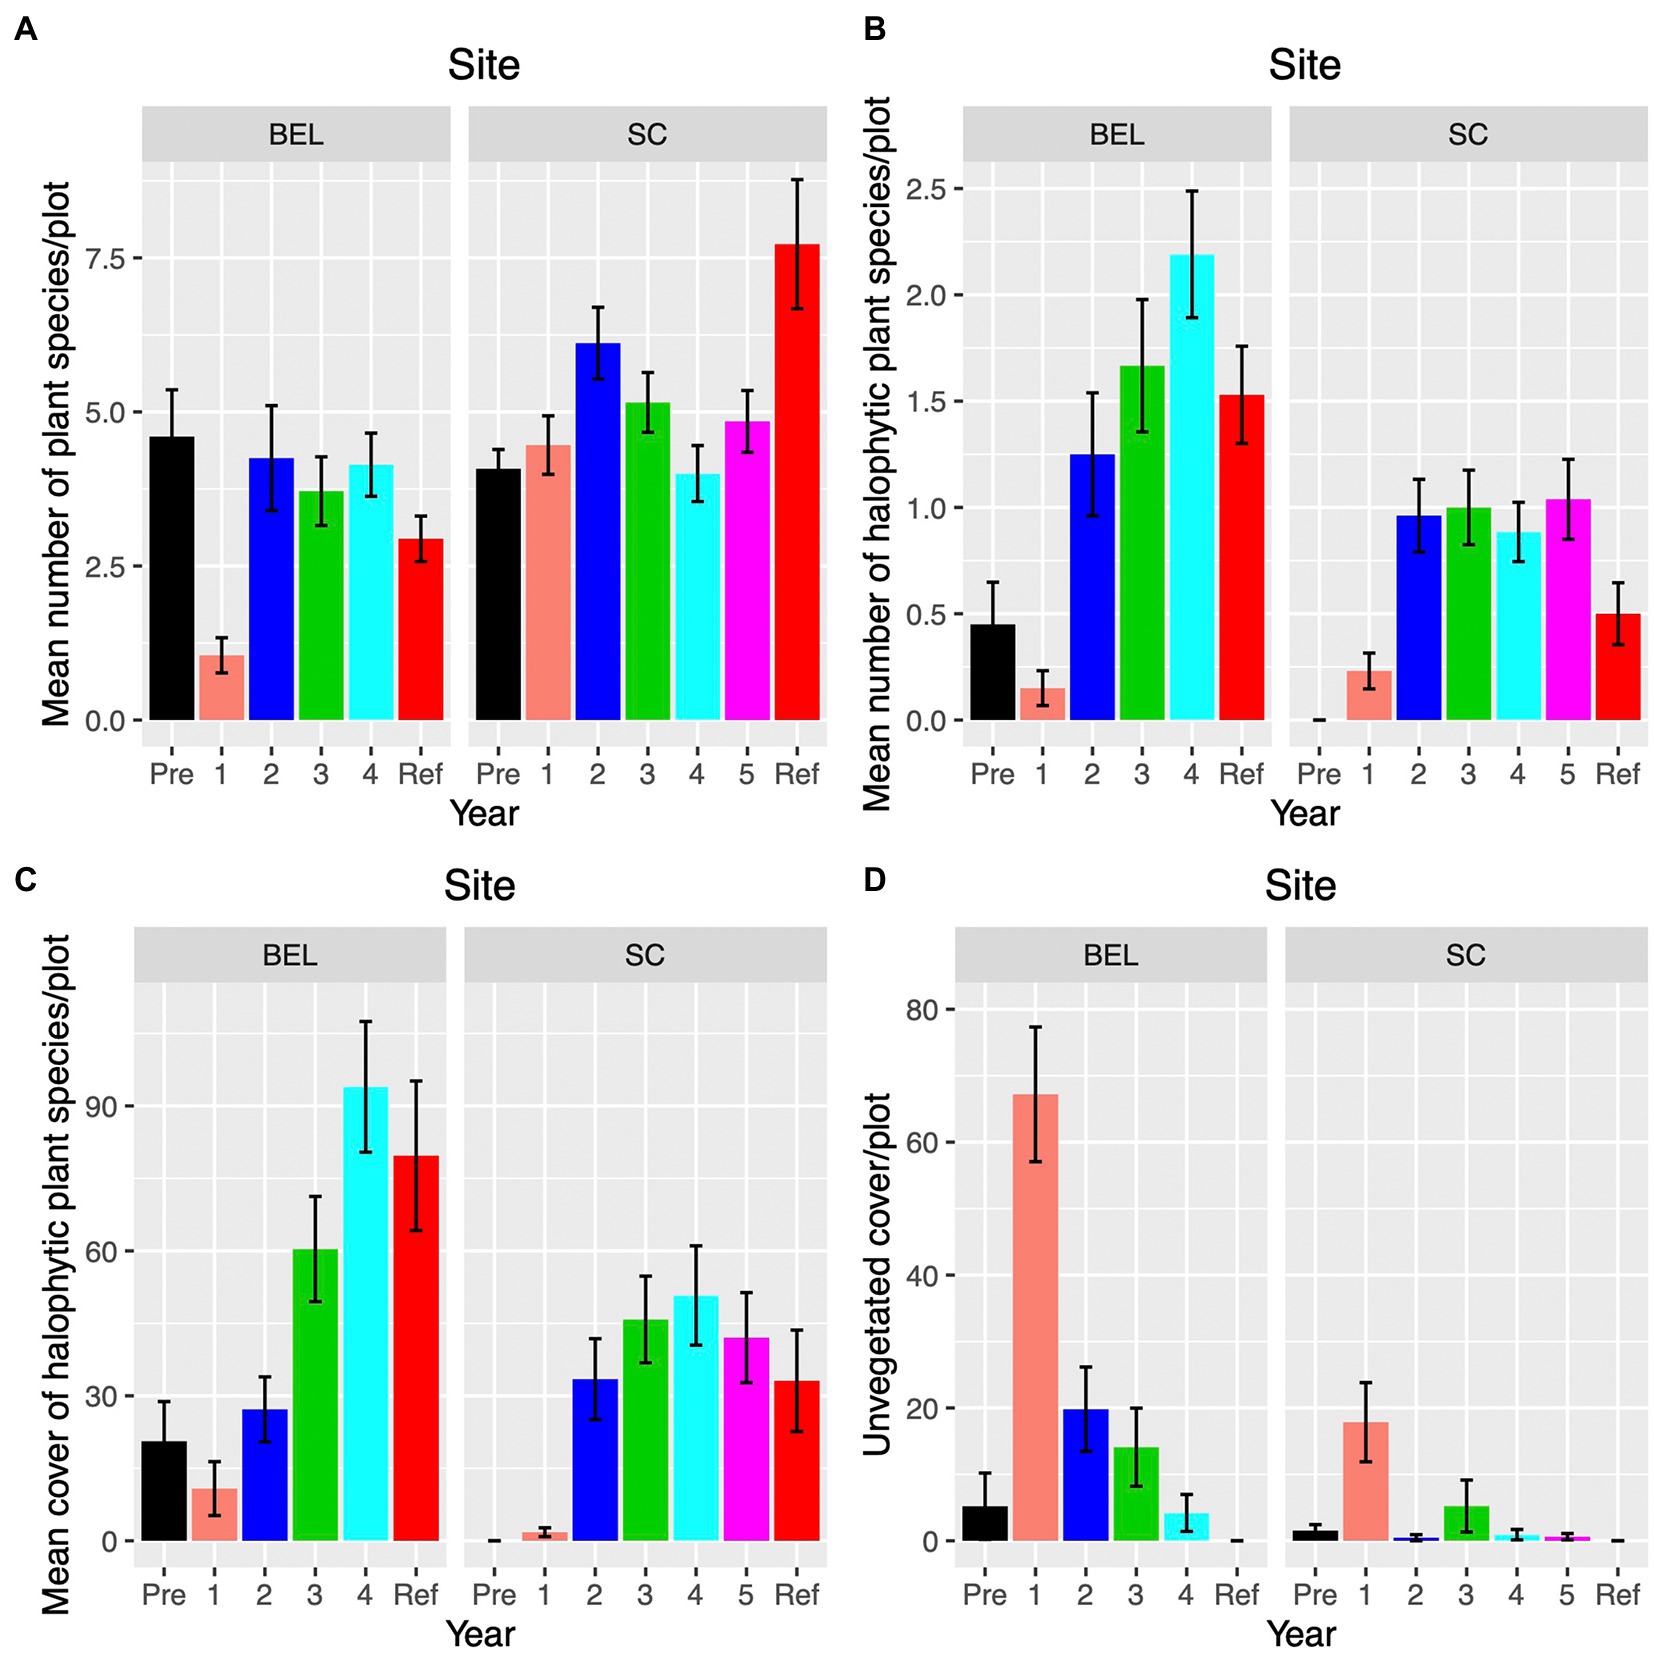
Figure 11. Vegetation plot (1m2) changes over time at BEL and SC restoration sites. “Ref” indicates the reference site corresponding to each restoration site; (A) Average plant species richness. (B) Average halophytic species richness; (C) Average halophytic species cover; (D) Average unvegetated cover.
Both BEL and SC showed rapid change following the restoration of tidal hydrology. Rapid accretion of sediments buried the original surface and appears to have killed off most of the original vegetation over large areas of both sites. Net elevation changes reflect both aboveground processes of erosion and accretion as well as belowground processes of biomass growth and consolidation/dewatering. In these sites, the large amount of sediment deposited in the first few years drove marsh elevation increases, despite evidence of some losses due to consolidation and dewatering of sediments in Year 2. In contrast, elevation changes were very small at the corresponding reference sites suggesting that later in the restoration trajectory belowground and aboveground processes may reach more of an equilibrium.
The rapid accretion of sediments and elevation gains following tidal restoration at BEL and SC contrast with some other sites in the region. Two other tidal marsh restorations completed at Walton and Cheverie Creeks, both within the Bay of Fundy, show much smaller vertical accretion and elevation gains in the first 2–3 years following tidal restoration (van Proosdij et al., 2010; Bowron et al., 2011). Both sites are much closer to the open bay and thus have less freshwater influence and correspondingly higher water salinities. Vegetation recovery was rapid in both Walton and Cheverie restoration, but this is likely due to mortality of pre-existing freshwater and upland vegetation due to exposure to salt water (van Proosdij et al., 2010; Bowron et al., 2011). In contrast, at BEL and SC the main driver of rapid vegetation change was burial of pre-existing vegetation by large amounts of deposited sediments. Plots at BEL and SC that gained more elevation also gained proportionally more coverage of all plant species and halophytic plant species. Plant species at Walton and Cheverie restoration sites also reflect greater saltwater influence with much higher abundance of low marsh plant species adapted to salinity and long inundation periods (e.g., S. alterniflorus; van Proosdij et al., 2010; Bowron et al., 2011).
Suspended sediment concentrations in the tidal waters at Walton and Cheverie are high and characteristic of the Upper Bay of Fundy, and similar to those at BEL and SC (van Proosdij et al., 2010; Bowron et al., 2011). The differences in accretion and elevation gain between BEL/SC sites and other restoration sites are likely due to the position of BEL and SC relatively far inland within their respective estuaries. Both BEL and SC are likely to be close to the location of the estuarine turbidity maxima in their tidal rivers. The interaction between the upper extent of tidal salt water and freshwater flow is associated with an increase in turbulent flow that can re-suspend sediments from the riverbed leading to high turbidities (Jay and Musiak, 1994; Burchard and Baumert, 1998). The flocculation of particles can increase deposition of sediment and may increase where salt and fresh waters meet (Manning et al., 2010). The high suspended sediment concentrations and high floc fractions likely led to extremely high deposition at SC and BEL during the first years following the restoration of tidal hydrology.
While the rapid accretion of sediments was important in driving vegetation dynamics at SC and BEL, both sites showed evidence of reductions in elevation gains toward the end of the study periods. This occurred as the marsh platforms became less frequently inundated, although overall totals suggest that both sites are keeping pace with the approximate 0.44 cm∙yr.−1 sea level rise measured at the Saint John NB tide gage (CHS station 65). Mean annual sea level data points were calculated as annual means from daily water levels downloaded from the Marine Environmental Data Section of Fisheries and Oceans.4 Long-term monitoring will be required to determine the sustainability of these sites in the face of sea level rise.
Restoration of tidal hydrology at two sites following dyke realignment at Aulac, New Brunswick show rapid accretion in the early years but different vegetation trajectories than at SC or BEL (Boone et al., 2017; Wollenberg et al., 2018; Virgin et al., 2020). The restoration sites at Aulac were also dyked for approximately the same amount of time as SC and BEL, and are exposed to tidal waters with high suspended sediment concentrations (~200 to 1,400 mg∙L−1; Bowron et al., 2021). The Aulac sites differ from BEL and SC in that they are situated directly on the open bay, not within the floodplain of a tidal rivers (Virgin et al., 2020). The restoration trajectory at Aulac is characterized by high sediment deposition in the first year followed by consolidation and stabilization in years 2 ~ 5 post-restoration (Virgin et al., 2020). This matches well with the observations at SC and BEL over the same time frames where initial high deposition is followed by a period of low elevation gains as dewatering or other consolidation processes temper the initial elevation gains. The Aulac restoration sites were also lower in elevation than their corresponding reference sites (Virgin et al., 2020). This was also the case at SC and BEL (e.g., Figures 6A,B). Vegetation changes at Aulac included large areas of open, bare mud in Year 1 but followed by patchy revegetation in Years 2 ~ 5. The Aulac site took longer to dewater due to drainage issues possibly created by borrow pits in close proximity to the restoration site. In addition, the initial site elevations relative to the tidal frame were initially too low to support halophytic vegetation establishment (Millard et al., 2013). High sediment deposition rates paired with rapid dewatering and sheltered conditions inland on tidal estuaries seem to have led to rapid revegetation at BEL and SC. Plant communities at Aulac came to be dominated by S. alterniflorus rather than S. michauxianus or Typha spp. due to the position of the site immediately adjacent to the ocean, reflecting polyhaline conditions.
Organic matter content and carbon density decreased after hydrological restoration at both SC and BEL. This represents a switch from more organic soils in the pre-restoration condition to the dominance of minerogenic allochthonous sediments that have a lower overall carbon density than the soils they are replacing. Despite lower carbon density, the high bulk density of the deposited sediments still probably results in a net gain of organic carbon on the sites. We calculated a rough estimate of the amount of carbon added to the system through sediment accretion by multiplying the average vertical accretion rate for each RSET station by the average organic carbon density recorded from sediment cores during the same years, and then converting to a weight of carbon per unit area (Supplementary Appendix 5). The amount of carbon input strongly tracks sediment accretion rates, so the pattern at these sites indicates rapid accumulation of carbon in the sediments early in the restoration process. Equivalence with the reference site is reached after 4–5 years, at least in the case of SC where we have a full 5 years of data (Figure 12). The initial values of carbon inputs (~1,500–3,700 gC/m2/yr) are comparable values found at other sites in the Bay of Fundy and these show similar declines after the first year (Wollenberg et al., 2018). The restoration site studied by Wollenberg et al. (2018) differed from ours in that it was much lower (closer to open bay) in the estuary compared to our sites and has much less influence of freshwater. These results suggest that tidal wetlands can trap substantial amounts of carbon early in restoration projects if there is heavy deposition of sediments from the tidal waters. The actual amount of carbon sequestered in newly restored salt marshes cannot be estimated with our available data as this would require additional information on belowground productivity and net flux of greenhouse gasses to produce a proper carbon account.
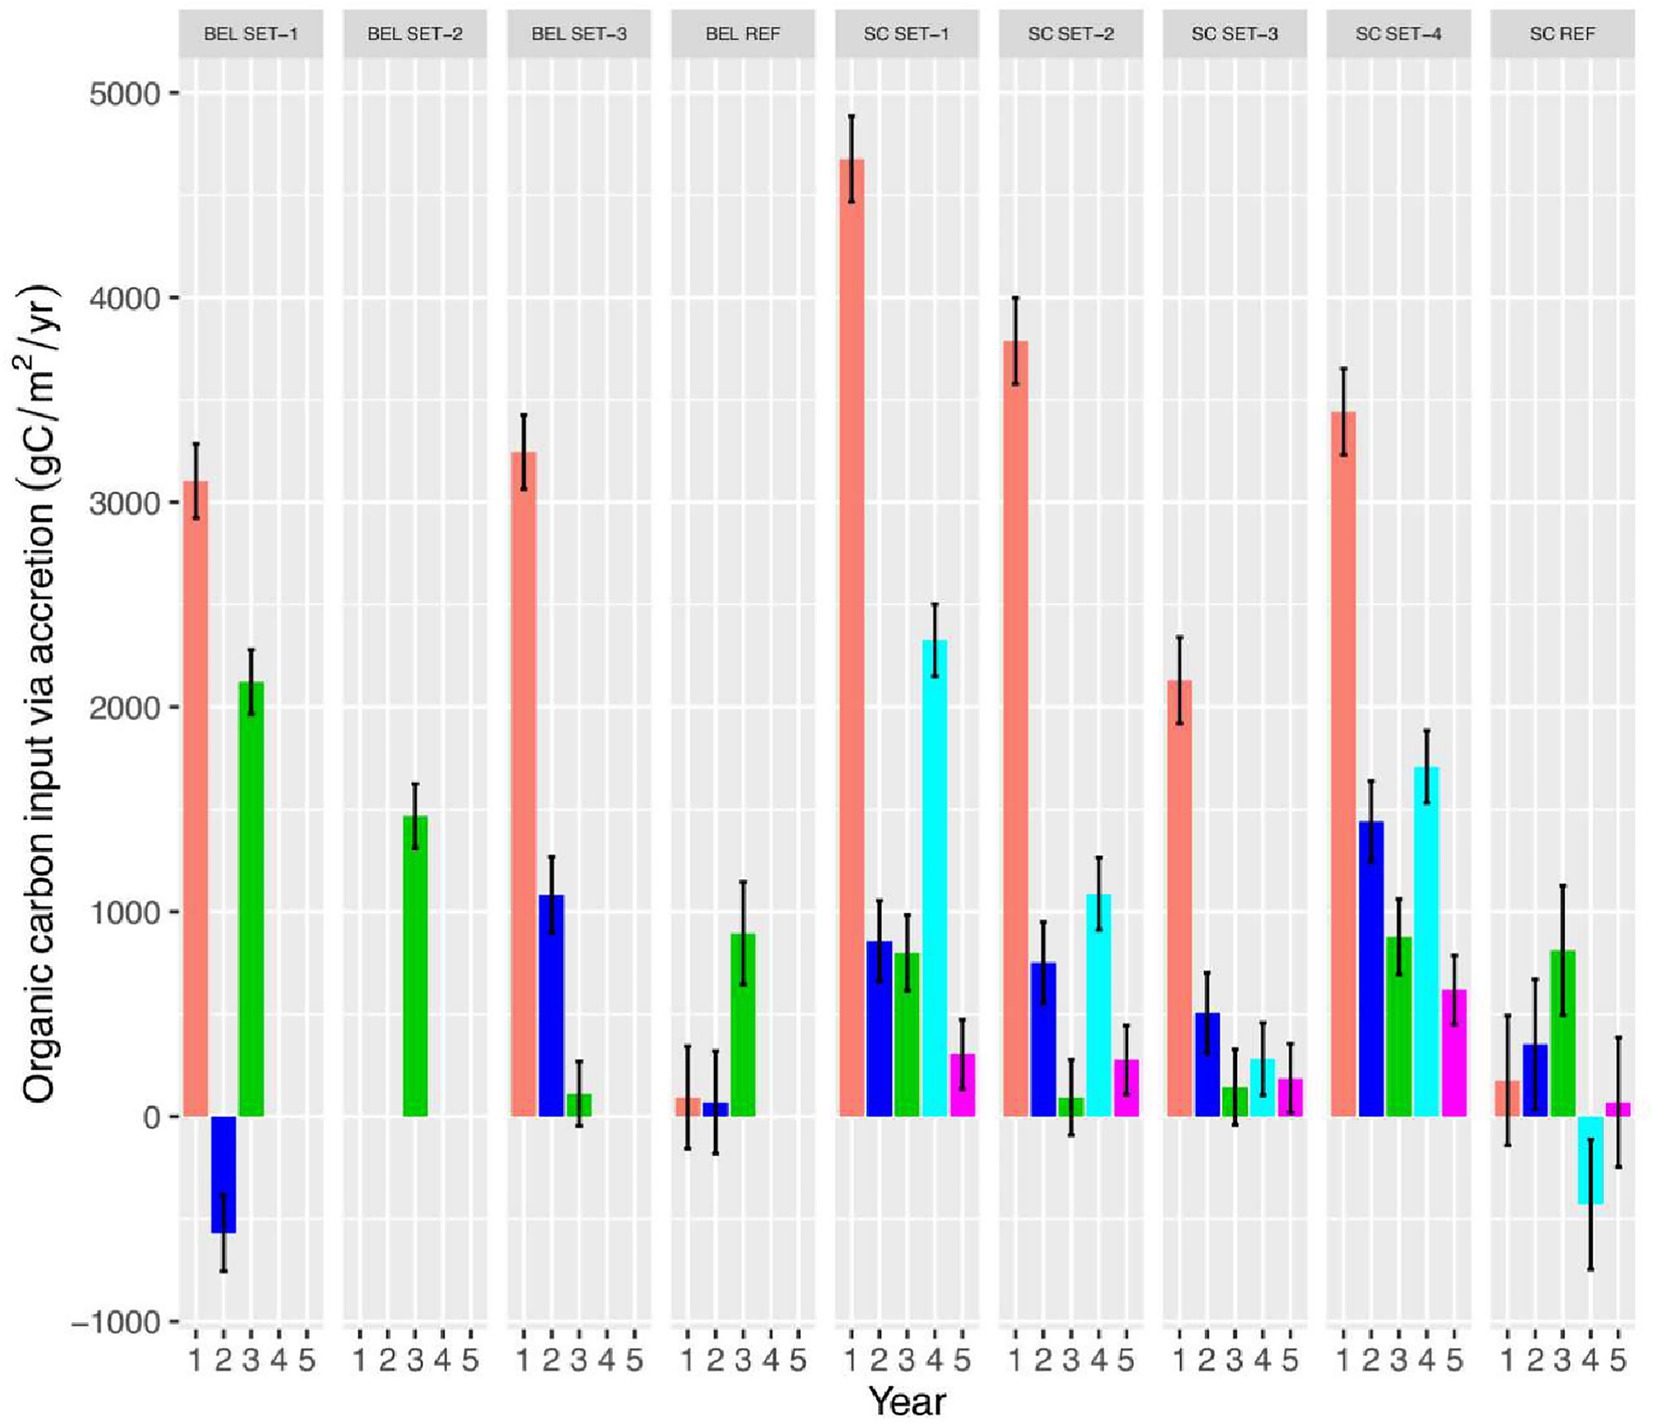
Figure 12. Estimated organic carbon input via sediment accretion over time at BEL and SC restoration sites.
Rapid recovery of vegetation is a hallmark of tidal restoration projects in the Bay of Fundy (Bowron et al., 2012). Vegetation has a major influence of the stability of marsh surfaces and shapes ecomorphodynamics by reducing flow velocities and trapping sediments (Ashall et al., 2016). Rapid development of wetland vegetation occurred at both sites, likely because the accreted sediments created a ‘clean slate’ for colonization largely unaffected by previous soils and plants. Short ruderal species were common at both sites early post-restoration but tended to be displaced later by taller, more competitive species such as S. michauxianus and Typha spp. Tidal marsh restoration in sites close to an estuarine turbidity maximum may be expected to share a similar trajectory to BEL and SC provided that there is adequate sediment supply in the water.
While both BEL and SC showed similar overall trajectories post-restoration, vegetation composition differences were evident by Years 4 ~ 5. BEL restoration site is dominated by Sporobolus spp., typical of a brackish marsh (Odum et al., 1984) whereas SC is dominated by Typha spp., characteristic of freshwater tidal marsh vegetation (Tanner et al., 2002). This pattern likely indicates a greater saltwater influence at BEL compared with SC. Site visits in 2022 to SC indicate that the site is still overwhelmingly Typha dominated over 10 years post-restoration. Reference site vegetation conditions are consistent with the restoration site differences as well. Halophyte coverage at BEL reference site is approximately 80% compared with 30% at the SC reference site. Species richness is consistent as well, with the higher values at SC reference associated with more freshwater and upland floras (Odum et al., 1984).
It should be pointed out that neither reference site is a perfect match for its corresponding restoration site. The SC reference site is less frequently inundated than the restoration site, leading to more of an upland component in its vegetation. The BEL reference site has lower habitat diversity than the restoration site (e.g., no patches of Typha) but largely overlaps in terms of overall plant species composition. While tidal freshwater marshes share many species with non-tidal fresh marshes, there is very little understanding of the extent and compositions of tidal freshwater marshes in the region. Surveying and establishment of more potential reference sites in tidal brackish and fresh conditions are necessary to further understand the dynamics of vegetation recovery.
Site changes following restoration of tidal hydrology at both BEL and SC are characterized by the following trajectory: massive deposition of sediments in Year 1, burying pre-existing vegetation and soils, dewatering and consolidation of sediments and rapid vegetation spread in Year 2, continued but lower rates of accretion and elevation gain in Years 3–5 accompanied by almost complete coverage by vegetation. Final vegetation composition differs among the sites according to the amount of freshwater reaching the site, including through upland drainage. The proximity of the restoration sites to the estuarine turbidity maxima led to an abundance of flocculated particles which in turn promoted high sediment deposition rates. This helped create a clean slate of substrate for vegetation colonization and a rapid transition from early colonizing species to dominant highly competitive fresh or brackish marsh plants. Restoration of tidal wetland vegetation in similar contexts globally may yield similar trajectories.
The original contributions presented in the study are included in the article/Supplementary material, further inquiries can be directed to the corresponding author.
DP: conceptualization, supervision of graduate students and field technicians, analysis writing, and editing. JG: analysis, writing, editing, and preparation of figures. BL: analysis and MSc thesis. TB: editing. EP: analysis. JK: writing and editing. JL: analysis, writing, editing, and preparation of figures. All authors contributed to the article and approved the submitted version.
Funding (cash & in-kind) for this project has been provided by: Fisheries and Ocean’s Canada’s Coastal Restoration Fund, the Nova Scotia Department of Agriculture; Nova Scotia Department of Transportation and Infrastructure Renewal, Nova Scotia Department of Economic and Rural Development and Tourism (Student Employment Programs), Natural Sciences and Engineering Research Council of Canada (NSERC), Employment and Social Development Canada.
We thank Nancy Neatt, Samantha Lewis, Emily Baker, Kailey Nichols, Kayla Williams, Makadunyiswe Ngulube, Greg Baker, Wesley Weatherbee, and Jensen Brown for their help on the project. This work would not have been possible without the support of NS Department of Agriculture, Land Protection Section, and in particular Kevin Bekkers, Carl Esau, Chris Ross, Graeme Matheson, and aboiteau superintendents (David Smith, Gary Gilbert, Craig Bauchman, and Darrell Hingley).
Authors JG, TB, JK, and KE were employed by the company CB Wetlands and Environmental Specialists.
The remaining authors declare that the research was conducted in the absence of any commercial or financial relationships that could be construed as a potential conflict of interest.
All claims expressed in this article are solely those of the authors and do not necessarily represent those of their affiliated organizations, or those of the publisher, the editors and the reviewers. Any product that may be evaluated in this article, or claim that may be made by its manufacturer, is not guaranteed or endorsed by the publisher.
The Supplementary material for this article can be found online at: https://www.frontiersin.org/articles/10.3389/fevo.2023.1112284/full#supplementary-material
1. ^Mean elevations calculated from surveyed vegetation stations relative to the Canadian Geodetic Vertical Datum of 2013.
2. ^ https://leica-geosystems.com/products/gnss-systems/smart-antennas/leica-viva-gs14
3. ^HWL determined by Nova Scotia Department of Agriculture’s Digital Marshlands Atlas.
4. ^ https://www.meds-sdmm.dfo-mpo.gc.ca/isdm-gdsi/twl-mne/inventory-inventaire/index-eng.htm
Ashall, L. M., Mulligan, R. P., van Proosdij, D., and Poirier, E. (2016). Application and validation of a three dimensional hydrodynamic model of a macrotidal salt marsh. Coast. Eng. 114, 35–46. doi: 10.1016/j.coastaleng.2016.04.005
Baldwin, A. H., and Hammerschlag, R. S. (2019). “Evaluating restored tidal freshwater wetlands,” in Coastal wetlands–an integrated ecosystem approach. 2nd Edn eds. G. M. E. Perillo, E. Wolanski, D. R. Cahoon, and C. S. Hopkinson. (Amsterdam: Elsevier), 889–915.
Blott, S. J., and Pye, K. (2001). GRADISTAT: a grain size distribution and statistics package for the analysis of unconsolidated sediments. Earth Surf. Proc. Land. 26, 1237–1248. doi: 10.1002/esp.261
Boone, L. K., Ollerhead, J., Barbeau, M. A., Beck, A. D., Sanderson, B. G., and Mclellan, N. R. (2017). “Returning the tide to dikelands in a macrotidal and ice-influenced environ- ment: challenges and lessons learned,” in Coastal Wetlands: Alteration and Remediation. eds. C. W. Finkl and C. Makowski (Cham, Switzerland: Springer International Publishing), 705–749.
Bowron, T. M., Graham, J., Kickbush, J., Ellis, K., Lewis, S., Poirier, E., et al. (2021). Post-Restoration Monitoring (Year 2) of the Converse Salt Marsh Restoration (NS044)–2020-21 Technical Report. Prepared for Department of Fisheries and Oceans and Nova Scotia Department of Agriculture. Halifax Nova Scotia: Publication No. 65.
Bowron, T., Graham, J., and van Proosdij, D.. (2017). Managed Realignment and Floodplain Restoration of tract 5 of the belcher St. Marsh (NS091): Preliminary Recommendations. Report Prepared for Nova Scotia Department of Agriculture. Halifax, NS: CBWES Inc. and Saint Mary’s University.
Bowron, T. M., Neatt, N. C., Graham, J. M., Lundholm, J., and van Proosdij, D. (2008). Pre–Construction Monitoring (Baseline) of the St. Croix River High Salt Marsh and Floodplain Wetland Restoration Project. Report Prepared for Nova Scotia Department of Transportation and Infrastructure Renewal. Halifax, NS: CBWES Inc. Publication No. 10.
Bowron, T. M., Neatt, N. C., Graham, J. M., Lundholm, J., and van Proosdij, D. (2009). Pre–Construction Monitoring (Baseline) of the St. Croix River High Salt Marsh and Floodplain Wetland Restoration Project 2: Southeast Quadrant and Additional Study Site Monitoring. Halifax, NS: CBWES Inc. Publication No. 15.
Bowron, T. M., Neatt, N. C., Graham, J. M., Lundholm, J., and van Proosdij, D. (2010). Restoration and Monitoring Report for the St. Croix River High Salt Marsh and Floodplain Wetland Restoration Project. Report Prepared for Nova Scotia Department of Transportation and Infrastructure Renewal. Halifax, NS: CBWES Inc. Publication No. 20.
Bowron, T., Neatt, N., Graham, J., van Proosdij, D., Lundholm, J., and Lemieux, B. (2015). Post-construction Monitoring (year 5) for the St. Croix River High Salt Marsh and Floodplain Wetland Restoration Project. Report Prepared for Nova Scotia Department of Transportation and Infrastructure Renewal. Halifax, NS: CBWES Inc. Publication No. 41.
Bowron, T., Neatt, N., van Proosdij, D., Lundholm, J., and Graham, J. (2011). Macro-tidal salt marsh ecosystem response to culvert expansion. Restor. Ecol. 19, 307–322. doi: 10.1111/j.1526-100X.2009.00602.x
Bowron, T., Neatt, N., van Proosdij, D., Lundholm, J., and Graham, J. (2012). “Salt marsh tidal restoration in Canada's maritime provinces” in Tidal Marsh Restoration: A Synthesis of Science and Management. eds. C. T. Roman and D. M. Burdick (Washington: Island Press), 191–209.
Brylinsky, M. (2014). Baseline Water Quality Survey of the Annapolis, Cornwallis and Habitant River Watersheds. Report prepared for Nova Scotia Department of Environment. Wolfville, NS: Acadia University.
Burchard, H., and Baumert, H. (1998). The formation of estuarine turbidity maxima due to density effects in the salt wedge. A hydrodynamic process study. J. Phys. Oceanogr. 28, 309–321. doi: 10.1175/1520-0485(1998)028<0309:TFOETM>2.0.CO;2
Byers, S. E., and Chmura, G. L. (2007). Salt marsh vegetation recovery on the bay of Fundy. Estuar. Coast. 30, 869–877. doi: 10.1007/BF02841340
Chmura, G. L., Coffey, A., and Crago, R. (2001). Variation in surface sediment deposition on salt marshes in the bay of Fundy. J. Coastal Res. 17, 221–227.
Craft, C. B., Seneca, E. D., and Broome, S. W. (1991). Loss on ignition and kjeldahl digestion forestimating organic carbon and total nitrogen in estuarine marsh soils: calibration with dry combustion. Estuaries 14, 175–179. doi: 10.2307/1351691
Curran, K. J., Hill, P. S., Schnell, T. M., Milligan, T. G., and Piper, D. J. W. (2004). Inferring the mass fraction of floc- deposited mud: application to fine-grained turbidites. Sedimentology 51, 927–944. doi: 10.1111/j.1365-3091.2004.00647.x
Daborn, G. R., Brylinsky, M., and van Proosdij, D. (2003). Ecological Studies of the Windsor Causeway and Pesaquid Lake, 2002. Report for Nova Scotia Department of Transportation and Public Works, Contract, 2, 00026.
Darke, A. K., and Megonigal, J. P. (2003). Control of sediment deposition rates in two mid-Atlantic Coast tidal freshwater wetlands. Estuar. Coast. Shelf Sci. 57, 255–268. doi: 10.1016/S0272-7714(02)00353-0
Desplanque, C., and Mossman, D. (2004). Tides and their seminal impact on the geology, geography, history, and socio-economics of the bay of Fundy, eastern Canada. Atl. Geol. 40, 1–130. doi: 10.4138/729
ECCC. (2022). Historical Climate Data. Canada: Environment and Climate Change Canada. Available at: https://climate.weather.gc.ca/historical_data/search_historic_data_e.html (Accessed August 1, 2022).
Goodwin, G. C. H., and Mudd, S. M. (2019). High platform elevations highlight the role of storms and spring tides in salt marsh evolution. Front. Environ. Sci. 7:62. doi: 10.3389/fenvs.2019.00062
Gordon, D. C., and Cranford, P. J. (1994). “Export of organic matter from macrotidal salt marshes in the upper bay of Fundy, Canada,” in Global Wetlands: Old World and New. ed. W. J. Mitsch (Amsterdam: Elsevier), 257–264.
Hatt, E., and Lloye, N.-M.., Vibert, B., and Young, A.. (2017). Final Report Summer 2017, Jijuktu'kwejk Watershed Alliance. Available at: https://jijuktukwejkwatershedalliance.wordpress.com/ (Accessed September 30, 2022).
James, M. R., and Robson, S. (2014). Mitigating systematic error in Topographic models derived from UAV and ground‐based image networks. Earth Surf Proc. Land 39, 1413–1420.
Jay, D. A., and Musiak, J. D. (1994). Particle trapping in estuarine tidal flows. J. Geophys. Res. 99, 20445–20461. doi: 10.1029/94JC00971
Lynch, J. C., Hensel, P., and Cahoon, D. R. (2015). The Surface Elevation Table and Marker Horizon Technique: A Protocol for Monitoring Wetland Elevation Dynamics. Fort Collins, Colorado: Natural Resource Report NPS/NCBN/NRR—2015/1078. National Park Service.
Manning, A. J., Langston, W. J., and Jonas, P. J. C. (2010). A review of sediment dynamics in the Severn estuary: influence of flocculation. Mar. Pollut. Bull. 61, 37–51. doi: 10.1016/j.marpolbul.2009.12.012
McCave, I. N., Hall, I. R., and Bianchi, G. G. (2006). Laser vs settling velocity differences in silt grain size measurements: estimation of palaeocurrent vigour. Sedimentology 53, 919–928. doi: 10.1111/j.1365-3091.2006.00783.x
Millard, K., Redden, A. M., Webster, T., and Stewart, H. (2013). Use of GIS and high resolution LiDAR in salt marsh restoration site suitability assessments in the upper bay of Fundy, Canada. Wetl. Ecol. Manag. 1, 243–262. doi: 10.1007/s11273-013-9303-9
Natural Resources Canada. (2020). Height Reference System Modernization. Version 2.0. https://www.nrcan.gc.ca/sites/nrcan/files/files/pdf/Height_reference_system_modernization_(EN).pdf (Accessed January 21, 2023).
Neckles, H. A., Dionne, M., Burdick, D. M., Roman, C. T., Buchsbaum, R., and Hutchins, E. (2002). A monitoring protocol to assess tidal restoration of salt marshes on local and regional scales. Restor. Ecol. 10, 556–563. doi: 10.1046/j.1526-100X.2002.02033.x
Odum, W. E., Smith, T. J. III, Hoover, J. K., and McIvor, C. C. (1984). The Ecology of Tidal Freshwater Marshes of the United States East Coast: A Community Profile (No. 83/17). US Fish and Wildlife Service.
Rabinowitz, T. R., Greene, L., Glogowski, A. D., Bowron, T., van Proosdij, D., and Lundholm, J. T. (2022). Hitchhiking halophytes in wrack and sediment-laden ice blocks contribute to tidal marsh development in the Upper Bay of Fundy. Wetl. Ecol. Manag. 30, 375–388. doi: 10.1007/s11273-022-09867-3
Raczynski, R. J. (2017). Accuracy analysis of products obtained from UAV-borne photogrammetry influenced by various flight parameters. Master thesis. Norwegian University of science and Technology, Trondheim.
Tanner, C. D., Cordell, J. R., Rubey, J., and Tear, L. M. (2002). Restoration of freshwater intertidal habitat functions at Spencer Island, Everett, Washington. Restor. Ecol. 10, 564–576. doi: 10.1046/j.1526-100X.2002.t01-1-02034.x
Thomas, M. L. H. (1983). “Salt marsh systems” in Marine and Coastal Systems of the Quoddy Region, New Brunswick. ed. M. L. H. Thomas (Canada: Canadian Special Publication of Fisheries and Aquatic Sciences No. 64, Fisheries and Oceans Canada), 107–118.
Tonkin, T. N., and Midgley, N. G. (2016). Ground-control networks for image based surface Deconstruction: An investigation of optimum survey designs using UAV derived imagery and structure-from-motion photogrammetry. Remote Sens 8:786.
Uncles, R. J., Stephens, J. A., and Smith, R. E. (2002). The dependence of estuarine turbidity on tidal intrusion length, tidal range and residence time. Cont. Shelf Res. 22, 1835–1856. doi: 10.1016/S0278-4343(02)00041-9
van Proosdij, D., Davidson-Arnott, R. G. D., and Ollerhead, J. (2006). Controls on the spatial patterns of sediment deposition across a macro tidal salt marsh over single tidal cycles. Estuar. Coast. Shelf Sci. 69, 64–86. doi: 10.1016/j.ecss.2006.04.022
Van Proosdij, D., Lundholm, J., Neatt, N., Bowron, T., and Graham, J. (2010). Ecological re-engineering of a freshwater impoundment for salt marsh restoration in a hypertidal system. Ecol. Eng. 36, 1314–1332. doi: 10.1016/j.ecoleng.2010.06.008
Virgin, S. D., Beck, A. D., Boone, L. K., Dykstra, A. K., Ollerhead, J., Barbeau, M. A., et al. (2020). A managed realignment in the upper bay of Fundy: community dynamics during salt marsh restoration over 8 years in a megatidal, ice-influenced environment. Ecol. Eng. 149:105713. doi: 10.1016/j.ecoleng.2020.105713
Keywords: sediment accretion, sea level rise, blue carbon, dyke realignment, disturbance, wetland restoration, tidal freshwater wetland
Citation: van Proosdij D, Graham J, Lemieux B, Bowron T, Poirier E, Kickbush J, Ellis K and Lundholm J (2023) High sedimentation rates lead to rapid vegetation recovery in tidal brackish wetland restoration. Front. Ecol. Evol. 11:1112284. doi: 10.3389/fevo.2023.1112284
Edited by:
Isabel Marques, University of Lisbon, PortugalReviewed by:
John W. Day, Louisiana State University of Alexandria, United StatesCopyright © 2023 van Proosdij, Graham, Lemieux, Bowron, Poirier, Kickbush, Ellis and Lundholm. This is an open-access article distributed under the terms of the Creative Commons Attribution License (CC BY). The use, distribution or reproduction in other forums is permitted, provided the original author(s) and the copyright owner(s) are credited and that the original publication in this journal is cited, in accordance with accepted academic practice. No use, distribution or reproduction is permitted which does not comply with these terms.
*Correspondence: Danika van Proosdij, ✉ ZHZhbnByb29Ac211LmNh
†These authors have contributed equally to this work and share senior authorship
Disclaimer: All claims expressed in this article are solely those of the authors and do not necessarily represent those of their affiliated organizations, or those of the publisher, the editors and the reviewers. Any product that may be evaluated in this article or claim that may be made by its manufacturer is not guaranteed or endorsed by the publisher.
Research integrity at Frontiers
Learn more about the work of our research integrity team to safeguard the quality of each article we publish.