
94% of researchers rate our articles as excellent or good
Learn more about the work of our research integrity team to safeguard the quality of each article we publish.
Find out more
ORIGINAL RESEARCH article
Front. Ecol. Evol. , 25 January 2023
Sec. Chemical Ecology
Volume 11 - 2023 | https://doi.org/10.3389/fevo.2023.1107463
This article is part of the Research Topic Microbial Volatiles and Communication View all 6 articles
 Tobias Haertl1†
 Diana Owsienko1†
 Leo Schwinn2
 Cathrin Hirsch3,4
 Bjoern M. Eskofier2
 Roland Lang3
 Stefan Wirtz4
 Helene M. Loos1,5*
Unravelling the interplay between a human’s microbiome and physiology is a relevant task for understanding the principles underlying human health and disease. With regard to human chemical communication, it is of interest to elucidate the role of the microbiome in shaping or generating volatiles emitted from the human body. In this study, we characterized the microbiome and volatile organic compounds (VOCs) sampled from the neck and axilla of ten participants (five male, five female) on two sampling days, by applying different methodological approaches. Volatiles emitted from the respective skin site were collected for 20 min using textile sampling material and analyzed on two analytical columns with varying polarity of the stationary phase. Microbiome samples were analyzed by a culture approach coupled with MALDI-TOF-MS analysis and a 16S ribosomal RNA gene (16S RNA) sequencing approach. Statistical and advanced data analysis methods revealed that classification of body sites was possible by using VOC and microbiome data sets. Higher classification accuracy was achieved by combination of both data pools. Cutibacterium, Staphylococcus, Micrococcus, Streptococcus, Lawsonella, Anaerococcus, and Corynebacterium species were found to contribute to classification of the body sites by the microbiome. Alkanes, esters, ethers, ketones, aldehydes and cyclic structures were used by the classifier when VOC data were considered. The interdisciplinary methodological platform developed here will enable further investigations of skin microbiome and skin VOCs alterations in physiological and pathological conditions.
Whereas usage of chemical information has since long been acknowledged as a vital element in animal behavior, humans were until recently thought to only minorly rely on their chemosensory systems (Roberts et al., 2020). This notion is currently being revised by a constantly growing body of evidence demonstrating the function of human chemical signals in social contexts (Lubke and Pause, 2015; Pause, 2017). Examples are the communication of emotions (de Groot et al., 2012), developmental state (Ferdenzi et al., 2010; Schaal et al., 2020; Schafer et al., 2020), or health state (Olsson et al., 2014) via body odors. In all these cases, chemical information emitted from the so-called sender is transmitted to the so-called receiver, and consequently, the receiver shows adaptive behavior – for example, anxiety signals from axillary sweat have been shown to reduce trust and risk behavior in women (Meister and Pause, 2021). Body odorants and volatiles are additionally in the focus of current research due to their usefulness in medical and forensic applications, e.g., with regard to diagnostics or identification of individuals (Beauchamp, 2011; Cuzuel et al., 2018; Sinclair et al., 2021). Accordingly, several attempts have been made to elucidate the chemical composition of emissions and odors emanating from different sites of the human body, and compounds detected in the human volatilome have been compiled recently (Amann et al., 2014; Drabinska et al., 2021). The volatilome thereby describes the entity of volatiles found in the surroundings of an organism, including volatiles derived from endogenous metabolism and from exogenous sources. To sample volatiles from the human body, different techniques have been used, ranging from online mass spectrometry (Hartungen et al., 2004) over usage of dedicated adsorbent materials (Cuzuel et al., 2018; Uebi et al., 2019) to sampling with textiles (Preti et al., 1987; Haze et al., 2001). Despite progress in human chemical communication and volatilome research, however, the principles of the molecular encoding of information are still unknown for the majority of the suspected cases of social chemical communication so far. The composition of volatiles emitted by the human body and by bodily fluids depends on an individual’s anatomy, physiology, and genetics (Martin et al., 2010), and on behavioral and environmental factors such as nutrition, use of cosmetics, hygienic habits or atmospheric conditions (Havlicek and Lenochova, 2006; Havlíček et al., 2017; Beko et al., 2020). Some of these influencing factors, like an individual’s skin care routine and dietary habits, directly determine emission profiles of skin (e.g., usage of deodorants or intake of garlic), but additionally also influence the composition of the human microbiome (Fierer et al., 2008) and thus affect the quality of the human volatilome via the microbiome as a mediator (Costello et al., 2009; Song et al., 2013). To determine such more complex relationships, it is necessary to characterize both the volatilome and the microbiome of the respective individuals, as done for instance with regard to axillary and vaginal odors (Yeoman et al., 2013; McMillan et al., 2015; Troccaz et al., 2015). Axillary odors are well understood from a chemical point of view (James et al., 2013; Starkenmann, 2017) and the role of axillary chemosignals in social communication has been demonstrated in several studies (Olsson et al., 2014; Pause, 2017; Smeets et al., 2020). In contrast, volatiles and odorants emitted from the neck have with few exceptions only recently been suggested to be implicated in human chemical communication (Ferdenzi et al., 2020). In the present study, we characterize volatile organic compounds (VOCs) and the microbiome from the axilla and the neck, because both sites are discussed as source of chemical information in daily interactions between persons. On a long term, it is thus of interest to understand the influence of individual factors as mentioned above on skin microbiome and volatilome at these sites, and their interrelationship. With the here reported explorative investigations, we aimed, on the one hand, (i) to comparatively characterize the general composition of the volatiles and the microbiome present at these body sites, (ii) to determine whether individuum- or gender-specific signatures exist in the VOC and microbiome data, and (iii) to evaluate whether hints towards a microbiome-driven VOC composition exist. On the other hand, we aimed to evaluate several methodological aspects related to the sampling and the analysis of skin volatiles and the skin microbiome. These included (i) the effect of a standardized washing procedure, (ii) the usage of two different analytical columns for one-dimensional gas chromatography–mass spectrometry (GC–MS) analyses, and (iii) the usage of two different methods for determination of the skin microbiome (culture vs. 16S sequencing). To reach these goals, ten persons (five women, five men) were asked to participate in two sessions. During each session, microbiome and volatiles were sampled from the neck’s and the axilla’s skin surface. Statistical analysis was restricted to a selection of the most abundant bacteria and VOCs to avoid the multiple comparisons problem, with the exception of a classification approach where all items of the data set were used. Due to the explorative nature of our study, which included a limited number of participants, a focus was placed on only the most prominent differences between the individual groups in order to reduce the likelihood of false positives. Furthermore, our experiments indicated that both the ten most abundant bacteria and VOCs accounted for more than 99% of the total respective abundances. Insights into the influence of the different methodological choices on the quality of the data were obtained and recommendations for future research are derived therefrom. It was possible to classify with the different data sets the respective body site (axilla and neck) and the sampling round.
Ten volunteers (5 males, 5 females; age range: 20–30 years, M ± SD: 24 ± 3 years) were recruited for two sampling rounds (see 2.3 for more detailed information). All participants were healthy, non-smokers, had no chronic diseases, did not intake medication or drugs and were neither pregnant nor breastfeeding. Ethical approval was granted by the Ethics Committee of the Friedrich-Alexander-Universität Erlangen-Nürnberg (171_19B). The study took place in Erlangen and was conducted according to the Declaration of Helsinki for medical research involving human participants. The participants were informed about the aim and the procedure of the study in oral and written form and provided written consent to participate in the study.
The participants followed a hygienic and dietary protocol prior to the study. Spicy food, onions, garlic, leek and similar vegetables, asparagus, cabbage and alcohol, as well as perfume, perfumed cosmetics, and deodorants were not allowed within 48 h before the study. All textiles in direct contact with the axilla or the neck, e.g., clothes, bed linen, towels, should be washed with perfume-free detergent. Participants were provided with perfume-free products (“Balea MED Shampoo UltraSensitive,” “Balea MED Duschgel UltraSensitive,” “Denkmit Vollwaschmittel UltraSensitive”; purchased from dm-drogerie markt GmbH & Co. KG, Karlsruhe, Germany). Visiting a swimming bath or other public places with a potentially high odour background, e.g., bars or clubs, should be avoided within 48 h before the study. The participants further had to refrain from sports and close body contact on the day of the study. A log about their diet, sports, and hygiene was provided by the participants and a questionnaire was filled out to register general living conditions/demographic data and habits. Antiperspirant should not be used 10 days before the study.
1-Tetradecanol (purity: 99%) was bought from Acros Organics, part of Thermo Fisher Scientific (Geel, Belgium). 1-Dodecanol (98%), nonanal (95%), n-alkanes (C6 – C34) and tetradecanoic acid (98%) were bought from Fluka, part of Sigma-Aldrich (Steinheim, Germany). 2,4-Di-tert-butyl phenol (99%), dioctyl ether (99%), dipropylene glycol methyl ether (mixture of isomers), 2-ethylhexanol (99%), geranyl acetone (>97%), isopropyl laurate (n.a.), isopropyl myristate (98%), isopropyl palmitate (≥90%), methanol (≥99.8%), squalene (≥98%), 2-ethylhexyl salicylate (99%) and erucylamide (>85%) were bought from Sigma Aldrich (Steinheim, Germany). Dichloromethane (DCM) and anhydrous sodium sulfate were purchased from VWR Chemicals (Darmstadt, Germany). For further information regarding CAS number and IUPAC nomenclature of reference compounds used for identification of volatiles, see Supplementary Table S1.
Each participant took part in two sessions. All samplings were done from the skin’s surface. In the first session, the influence of washing was investigated by performing the sampling procedure of the skin microbiome and the VOCs before and after the participants washed the respective body site (axilla and neck) with disposable washcloths soaked in water (“ebelin Einmal-Waschlappen,” dm-drogerie markt GmbH & Co. KG, Karlsruhe, Germany). The order of experimental steps was: (1) sampling of microbiome, (2) sampling of VOCs, (3) washing the skin surface area, (4) sampling of VOCs, (5) sampling of microbiome. In the second session, which was conducted on average 5.8 ± 1.5 months after the first session, the sampling procedure of the skin microbiome followed by the sampling of VOCs was conducted only once. No washing step was done in the second session.
Two swabs were used per body site (axilla and neck). In a first step, Mastaswabs MD 508 (Mast Diagnostica GmbH, Reinfeld, Germany) were used, which had been moistened with autoclaved water. To standardize the size of the sampled skin area, 2 × 2 cm foil templates (PrintLine Overheadfolie, Vleveka B.V., Deurne, Netherlands) were placed on the respective skin area. There, the swab was moved up and down in rotary movements and constant, light pressure for 30 s, and then transferred to the transport tubes (Mastaswabs, see above). The samples were kept at 2–8°C for transport. In a second step, DNA was sampled using FloqSwabs (Copan Diagnostics, Murrieta, United States) moistened in sterile water, which were rubbed on the participant’s skin for 30 s using the foil template and subsequently stored at −20°C in Pathogen Lysis tubes (Qiagen, Hilden, Germany). Microbiome was sampled from the axilla of the dominant arm and from the neck, and as far as possible, sampling was done on the same skin surface areas for both swabs by using similar positions of the foil template for both samplings.
Mastaswabs were streaked onto agar plates under sterile conditions in a biosafety cabinet (Thermo Scientific, Schwerte, Germany) within 2 h after sampling. For each sample, one Columbia blood agar plate (4% Tryptone Soja Agar, 6% defibrinated sheep blood, in Aqua dem.; reagents from Oxoid GmbH, Wesel, Germany) and one blood agar plate containing Vitamin K (VK plates; 4% Tryptone Soja Agar, 5% defibrinated sheep blood, 1% Vitamin-K solution, in Aqua dem.; reagents from Oxoid GmbH, Wesel, Germany) were inoculated by streaking the swab over the entire surface of both agar plates. To provide optimal conditions for the growth of anaerobes, VK plates were pre-incubated under anaerobic conditions for at least 4 h before use. Columbia agar plates were incubated at 37°C in a 5% CO2 atmosphere, anaerobic culture of VK plates was carried out in pots (Merck KGaA, Darmstadt, Germany) at 37°C. After 48 h of incubation, the number of bacterial colonies was counted on both plates.
To identify bacterial species, representative colonies were picked using a toothpick, spotted onto a stainless-steel target plate and overlaid with 1 μl of HCCA matrix (10 mg/ml α-cyano-4-hydroxycinnamic acid in 50% acetonitrile/2.5% trifluoroacetic acid). After drying at ambient temperature, identification was performed by Matrix-Assisted Laser Desorption/Ionization Time-of-flight (MALDI-TOF) mass spectrometry on the basis of 240 cumulated spectra using a Microflex LT™ (Bruker Daltonik GmbH, Germany). Spectra of bacterial proteins were compared to the MBT Compass Library (RUO, Revision F, 2019) database (Bruker Daltonik GmbH, Germany) that contained 8,468 reference spectra from 2,969 species (2,716 bacteria, 210 yeasts, 43 filamentous fungi). Matching database entries were ranked according to their similarity scores, with scores >2.0 indicating reliable identification. Scores between 1.8 and 2.0 were accepted for identification if the matching database entries belonged to the same species.
Genomic DNA was isolated from the FloqSwabs using the QIAamp UCP DNA Micro Kit according to the manufacturer’s protocol (Qiagen GmbH, Hilden, Germany) and quantified with the Qubit 2.0 dsDNA HS assay kit (Invitrogen, Schwerte, Germany). The V4 regions (515F-806R) of the bacterial 16S rRNA genes were amplified using the NEBNext Q5 Hot Start Hifi PCR Master Mix (New England Biolabs, Frankfurt am Main, Germany) using protocols established in the Earth Microbiome - Protocols and Standards (2022) project (Prot16S)1. Amplified fragments were purified with AMPure XP Beads (Beckmann Coulter GmbH, Krefeld, Germany), pooled in equimolar ratios and analyzed by 2 × 250 paired-end sequencing on an Illumina MiSeq device (Illumina Inc., San Diego, United States). Raw fastq files were then imported and analyzed in QIIME2 v2021.2 (Bolyen et al., 2019) with Dada2 (Callahan et al., 2016) as the method for quality control, dereplication and sub-operating taxonomic unit/amplicon sequence variant (sOTU/ASV) table generation. The SILVA (Quast et al., 2013) small subunit database release 138 was used at a 99% similarity cutoff for taxonomic classification.
Gazin® gauze pads (5 × 5 cm, 8 ply, 17 threads) were obtained from Lohmann & Rauscher International GmbH & Co. KG (Rengsdorf, Germany). A pre-treatment of such test fabrics is necessary to improve the quality of analytical measurements with gas chromatography–mass spectrometry (GC–MS). Based on preliminary experiments a methanol pre-treatment was selected for the Gazin® gauze pads. The pads were placed into a beaker, 30 ml of methanol were added and stirred at room temperature for 10 min. Afterwards, the solvent was decanted and the procedure was repeated twice. The pads were finally dried at ambient temperature and stored in air-tight amber glass bottles until use.
The sampling of the VOCs was conducted in the axilla of the dominant arm and on the neck of each participant. In each case, a Gazin® gauze pad was fixed with medical tape (Hansaplast®, Beiersdorf AG, Hamburg, Germany). The participants should relax for 20 min avoiding any stressful activities or sports. Then, the pads were taken off and stored in an amber glass at −80°C for a maximum of 30 days until work up. The foil template used for microbiome sampling was not used for restricting the sampled skin surface area during the sampling of volatiles.
The Gazin® gauze pad was stirred at room temperature for 30 min with 50 ml of DCM to extract the volatile compounds. Afterwards solvent assisted flavour evaporation [SAFE; (Engel et al., 1999)] was performed at 55°C. The distillate was dried over anhydrous sodium sulphate and finally concentrated to a total volume of 100 μl at 50°C by means of Vigreux distillation and micro distillation as described by Bemelmans (1979). For comparison purposes, an unused Gazin® gauze pad was processed according to the same work-up procedure as the body odour samples. The distillate was then stored at −80°C for a maximum of 7 days until further analysis.
Gas chromatographic separation was performed using an Agilent 7,890 A GC (Agilent, Santa Clara, CA, United States) equipped with the following capillary columns: DB-FFAP or DB-5 (30 m × 0.25 mm, film thickness of 0.25 μm, J&W Scientific, Agilent Technology, Santa Clara, CA, United States). Helium was used as a carrier gas at a flow rate of 1.0 ml/min in the constant flow mode. The distillates were injected in cold-on-column mode at 40°C using a multipurpose autosampler MPS2 (Gerstel GmbH & Co.KG, Mülheim an der Ruhr, Germany), with an injection volume of 1 μl. The following temperature program was used: (i) 2 min at 40°C, heating up to 240°C with a ramp of 8°C/min, holding 240°C for 10 min for the FFAP-column and (ii) 2 min at 40°C, heating up to 300°C with a ramp of 8°C/min, holding 300°C for 5 min for the DB-5 column. Mass spectrometric data was recorded in scan mode (40–400 m/z) with an ionization energy of 70 eV using an Agilent 5,975\u00B0C MSD (quadrupole; Agilent Technology, Santa Clara, CA, United States). The retention index (RI-value) for each compound was calculated as previously described by Kováts using C6-C30 n-alkanes (Kováts, 1958).
To avoid inappropriate statistical inferences made from compositional data, we transformed data from the ASV tables with the centered log-ratios (CLR) transform (Aitchison, 1982), as done in prior work (McMillan et al., 2015). The CLR transform was chosen instead of the additive log transformation (alr), due to a lack of a pre-specified reference taxon. Zero values in the ASV table were handled by using a multiplicative replacement algorithm (Martín-Fernández, 2003). The resulting matrix was used for further analysis, where is the number of samples and is the number of different ASVs in . In all further experiments, alpha and beta diversity values were calculated according to Shannon and Bray-Curtis, respectively (Shannon, 1948; Bray and Curtis, 1957). As consists of compositional data, significance analysis was performed using the differential abundance test analysis of compositions of microbiomes (ANCOM; Mandal et al., 2015). In those cases, no p-values are reported.
The culture data can be summarized by the matrix , where is the number of samples and is the number of different bacteria that were identified. Each value in this matrix represents the total number of bacteria of a specific genus or species that were found for the respective sample. In contrast to the ASV tables, absolute values of bacteria counts can be taken into account between different samples for the cultural data. We applied no normalization to the cultural data to preserve quantitative differences in bacteria count between samples. In all further experiments, alpha and beta diversity values were calculated according to Shannon and Bray-Curtis, respectively.
GC–MS data were filtered with the Savitzky–Golay filter (Savitzky and Golay, 1964) to remove high-frequency artifacts (Lommen, 2009). Subsequently, baseline artifacts were removed based on mathematical morphology using the tophat filter (Angulo and Serra, 2003). Resulting signals were deconvoluted using the approach proposed by Biller and Biemann (1974) and aligned with reference alkane runs. The extracted peaks were additionally aligned between all the different samples from each participant according to their retention index and mass spectrum similarity with a dynamic programming approach (Robinson et al., 2007). Hyperparameters where chosen according to the original paper. Singular peaks that were found in only one sample and for which no similar peaks were found in all other samples were discarded from further analysis. The whole pipeline was implemented in Python using the PyMS library (O'Callaghan et al., 2012). The result is a matrix where denotes the number of samples and the number of peaks. Each row in describes the extracted peaks of a GC–MS sample and each cell in the columns either contains a peak or no peak. Each peak in turn consists of masses with associated intensities. Volatiles were initially tentatively identified by comparison to the NIST 14 standard reference database (National Institute of Standards and Technology, Gaithersburg, United States) and were subsequently confirmed with authentic standards if available. Volatiles that could not be confirmed with an authentic standard but were tentatively identified with the NIST 14 database are marked with a (*) symbol throughout the manuscript. Additionally, volatiles were only considered if the match factor was above 700. All volatiles that were likely to be contaminants (e.g., siloxanes, phthalates) were not considered in further analysis. Substances detected in blank samples were not subtracted from the samples’ data prior to statistical analysis. For statistical analysis and machine learning methods we calculated features from . Specifically, we computed the peak area for every peak in and normalized the peak areas in each row by the sum over all the peak areas in the respective row (referred to as normalized peak areas in the rest of the manuscript). We omitted this normalization when comparing total peak areas of GC–MS runs between individual participants. In Supplementary Figure S1 an exemplified chromatogram of a DB-5 neck measurement is shown.
Statistical analysis was carried out in Python using the Pingouin package (Vallat, 2018). Plots were created using the seaborn library (Waskom, 2021). Significant differences were assessed using Wilcoxon-signed-ranked test and corrected for multiple comparisons using Benjamini Hochberg false discovery rate. For the compositional sequencing data, a differential abundance test using ANCOM was performed (Mandal et al., 2015). Normal transformation of the data was performed to allow parametric statistical testing but was unsuccessful. Only the ten most abundant bacteria as well as volatiles associated with the highest peak area on average were considered for further statistical analysis. This was done due to the multiple comparisons problem, which occurs when one considers a set of statistical inferences simultaneously and that can lead to erroneous statistics (Miller, 1981).
Washing the sampling site as a means to standardize the donation of body odorants and volatiles was used in several studies (Curran et al., 2007; Hara et al., 2015; Hierl et al., 2021). Here, we evaluated the influence of washing the respective skin site with a moistened disposable washcloth (without detergent) individually for the body sites armpit and neck, considering the microbiome and VOCs. Sampling of the microbiome and the VOCs was carried out once before, and once after washing the respective body site, during the first sampling round. Statistical comparison was restricted to the ten most abundant bacteria and VOCs. This was done to avoid reporting falsely significant results which would result from multiple comparisons. Given the exploratory nature and small sample size of our study, we have deliberately chosen to focus on the most prominent differences between the groups in order to minimize the likelihood of obtaining a false positive result.
The individual results for each participant are shown in Figure 1. For armpit samples a significant difference between the total abundance of all bacteria from samples obtained before vs. after washing was observed (p < 0.01, Common-Language Effect Size (CLES) = 0.67; Figure 1A). Neck samples showed no significant difference in total bacteria abundance between the washing conditions (data not shown). To avoid excessive multiple testing and correction for it, only the ten most abundant bacterial taxa in both neck and axilla samples were considered for further statistical analysis. No significant difference for any of the ten most abundant individual bacterial taxa was found (data not shown).
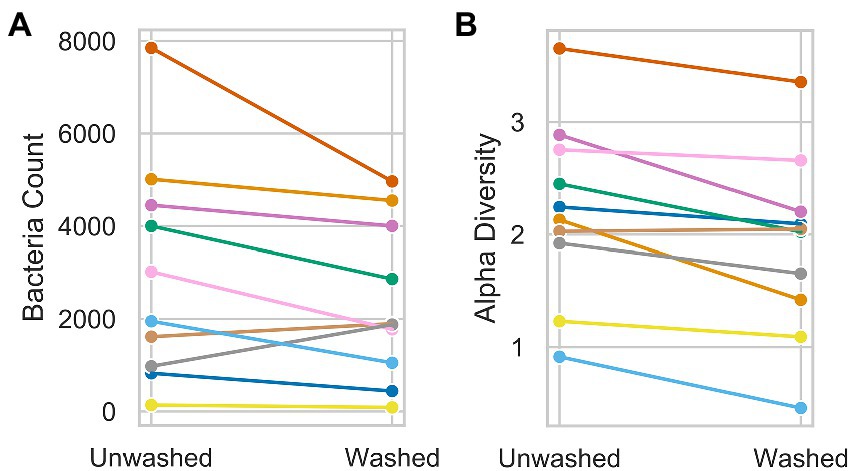
Figure 1. Illustration of the difference before and after washing for total bacteria counts of axillary samples of the cultural data (A) and the Shannon alpha diversity of neck samples of the ASV data (B). Each dot represents the bacteria count (A) or the alpha diversity (B) of one participant.
We observed a significantly lower alpha diversity of the ASVs after washing for neck samples (p < 0.01, CLES = 0.64; Figure 1B) and no significant difference for the armpit samples (data not shown). The centered-log ratio transformed values of the ASV abundances before and after washing showed no significant differences for the ten ASVs that showed the highest relative abundance over all samples (data not shown).
Only the ten peaks with the highest normalized peak area over all participants were considered for statistical analysis due to the multiple comparisons problem. We did not find any significant differences between the normalized peak areas of the ten peaks before and after washing, irrespective of the column type used during GC (FFAP or DB-5). As the differences in alpha diversity were not substantial and differences in the absolute bacteria count should not be relevant for the experiments, all further experiments were conducted on samples obtained without washing the respective skin site before sampling.
An overview of the relative abundances of the overall ten most abundant bacterial taxa (at the genus level) and volatiles detected in both the armpit and neck samples of individual participants is given in Figures 2, 3.
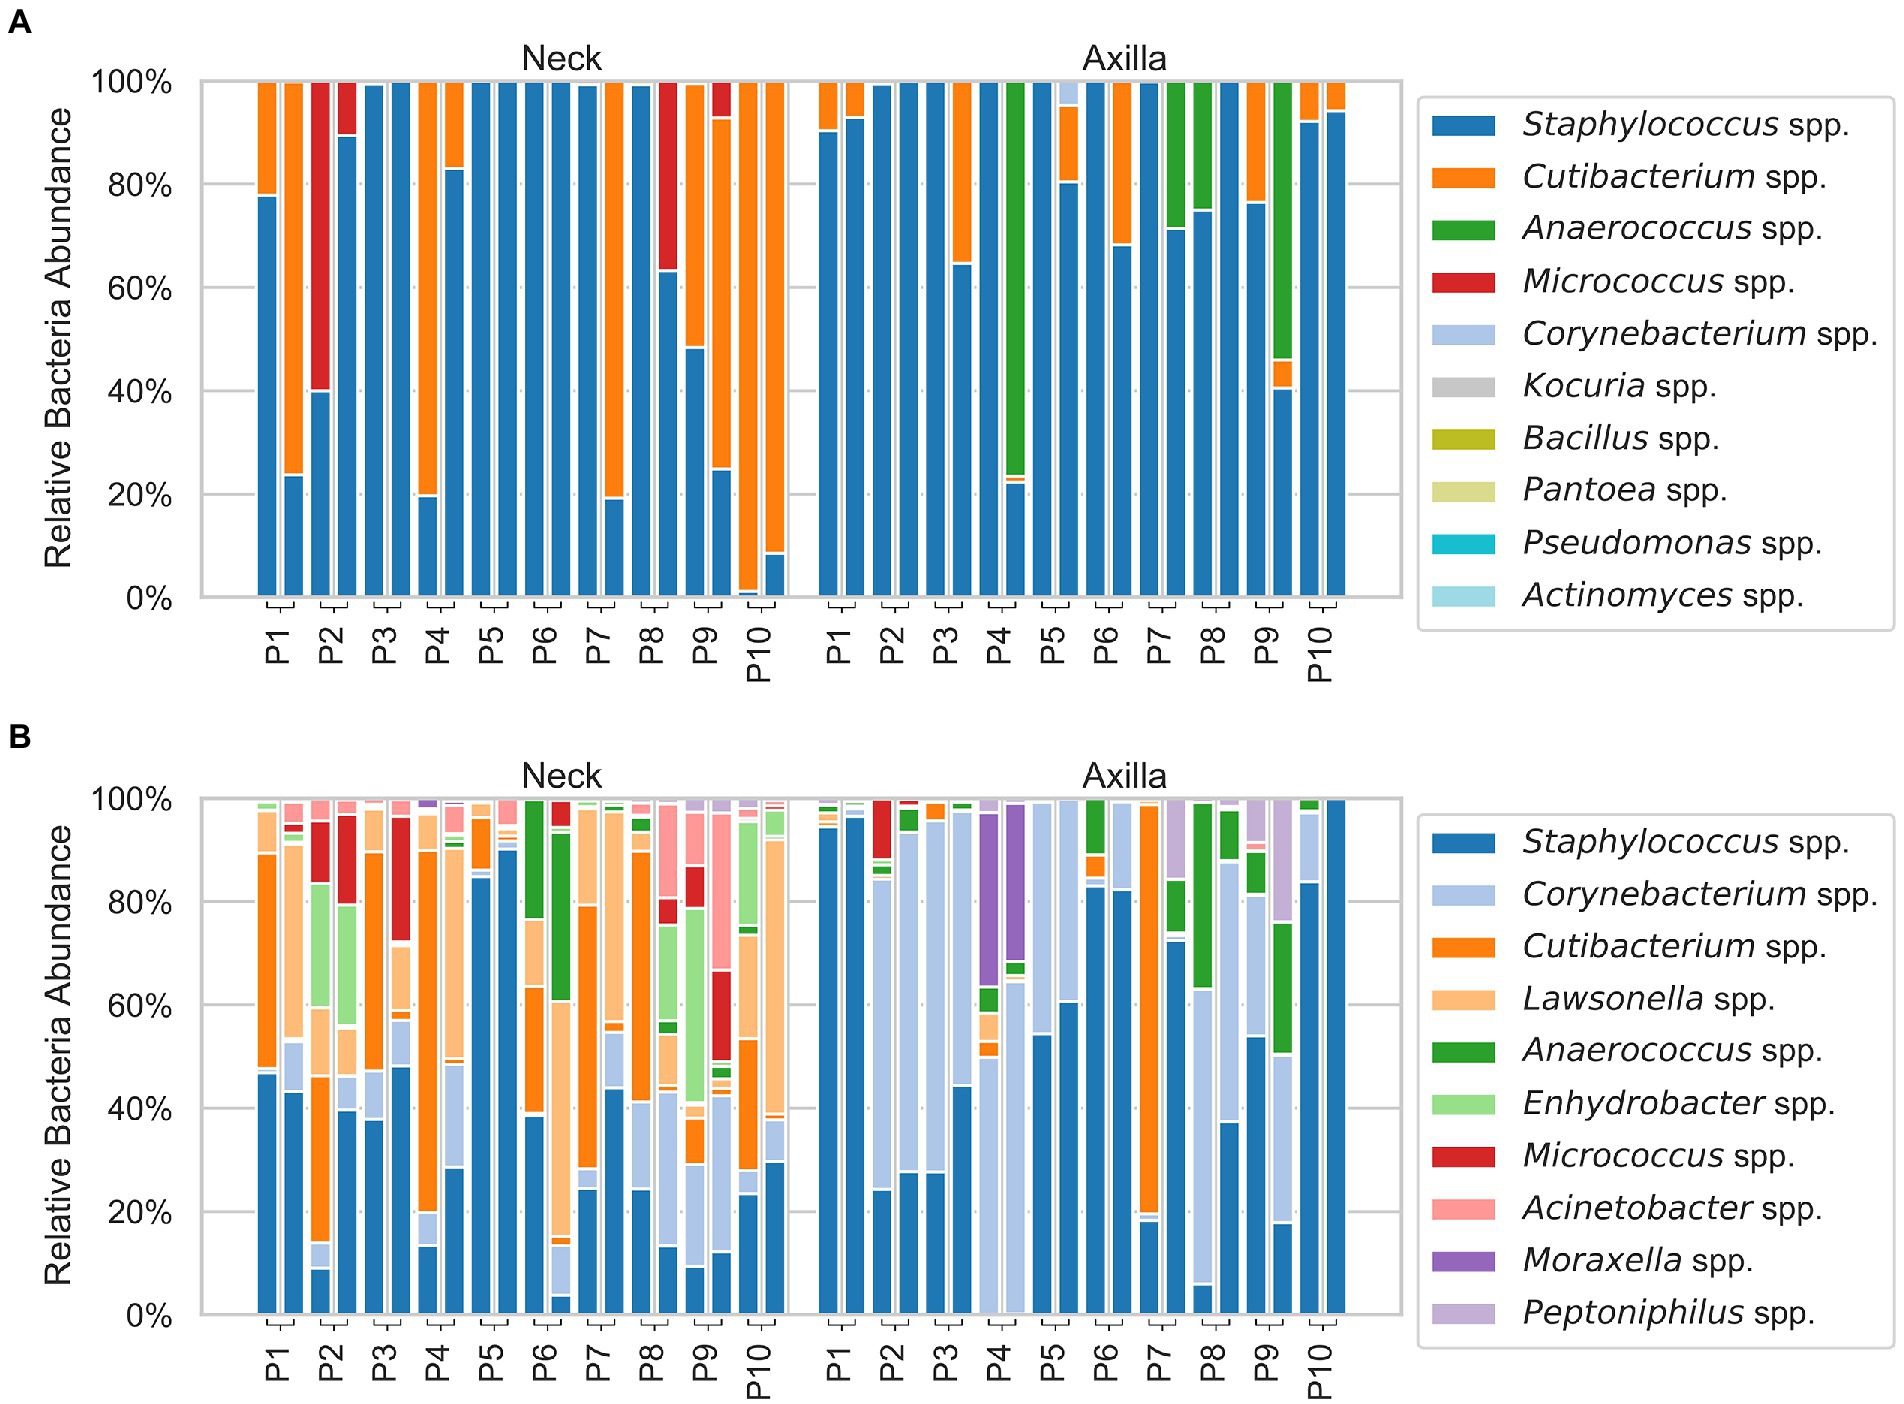
Figure 2. Stacked bar plots of the analyzed microbiome with the cultural (A) and DNA approach (B), showing the relative abundances of the ten most abundant bacteria in the neck (left) and armpit (right) samples. The difference of sampling day 1 and 2 is represented by the two stacked bar plots connected to each participant. Note that only the ten most abundant bacteria are shown and the relative/normalized abundance on the y-axis is given with respect to those ten only (i.e., 100% abundance refers to the top ten and not to all bacteria found for the respective participant). In the cultural approach, abundance of several genera was so low that they are not visible in the bar plot.
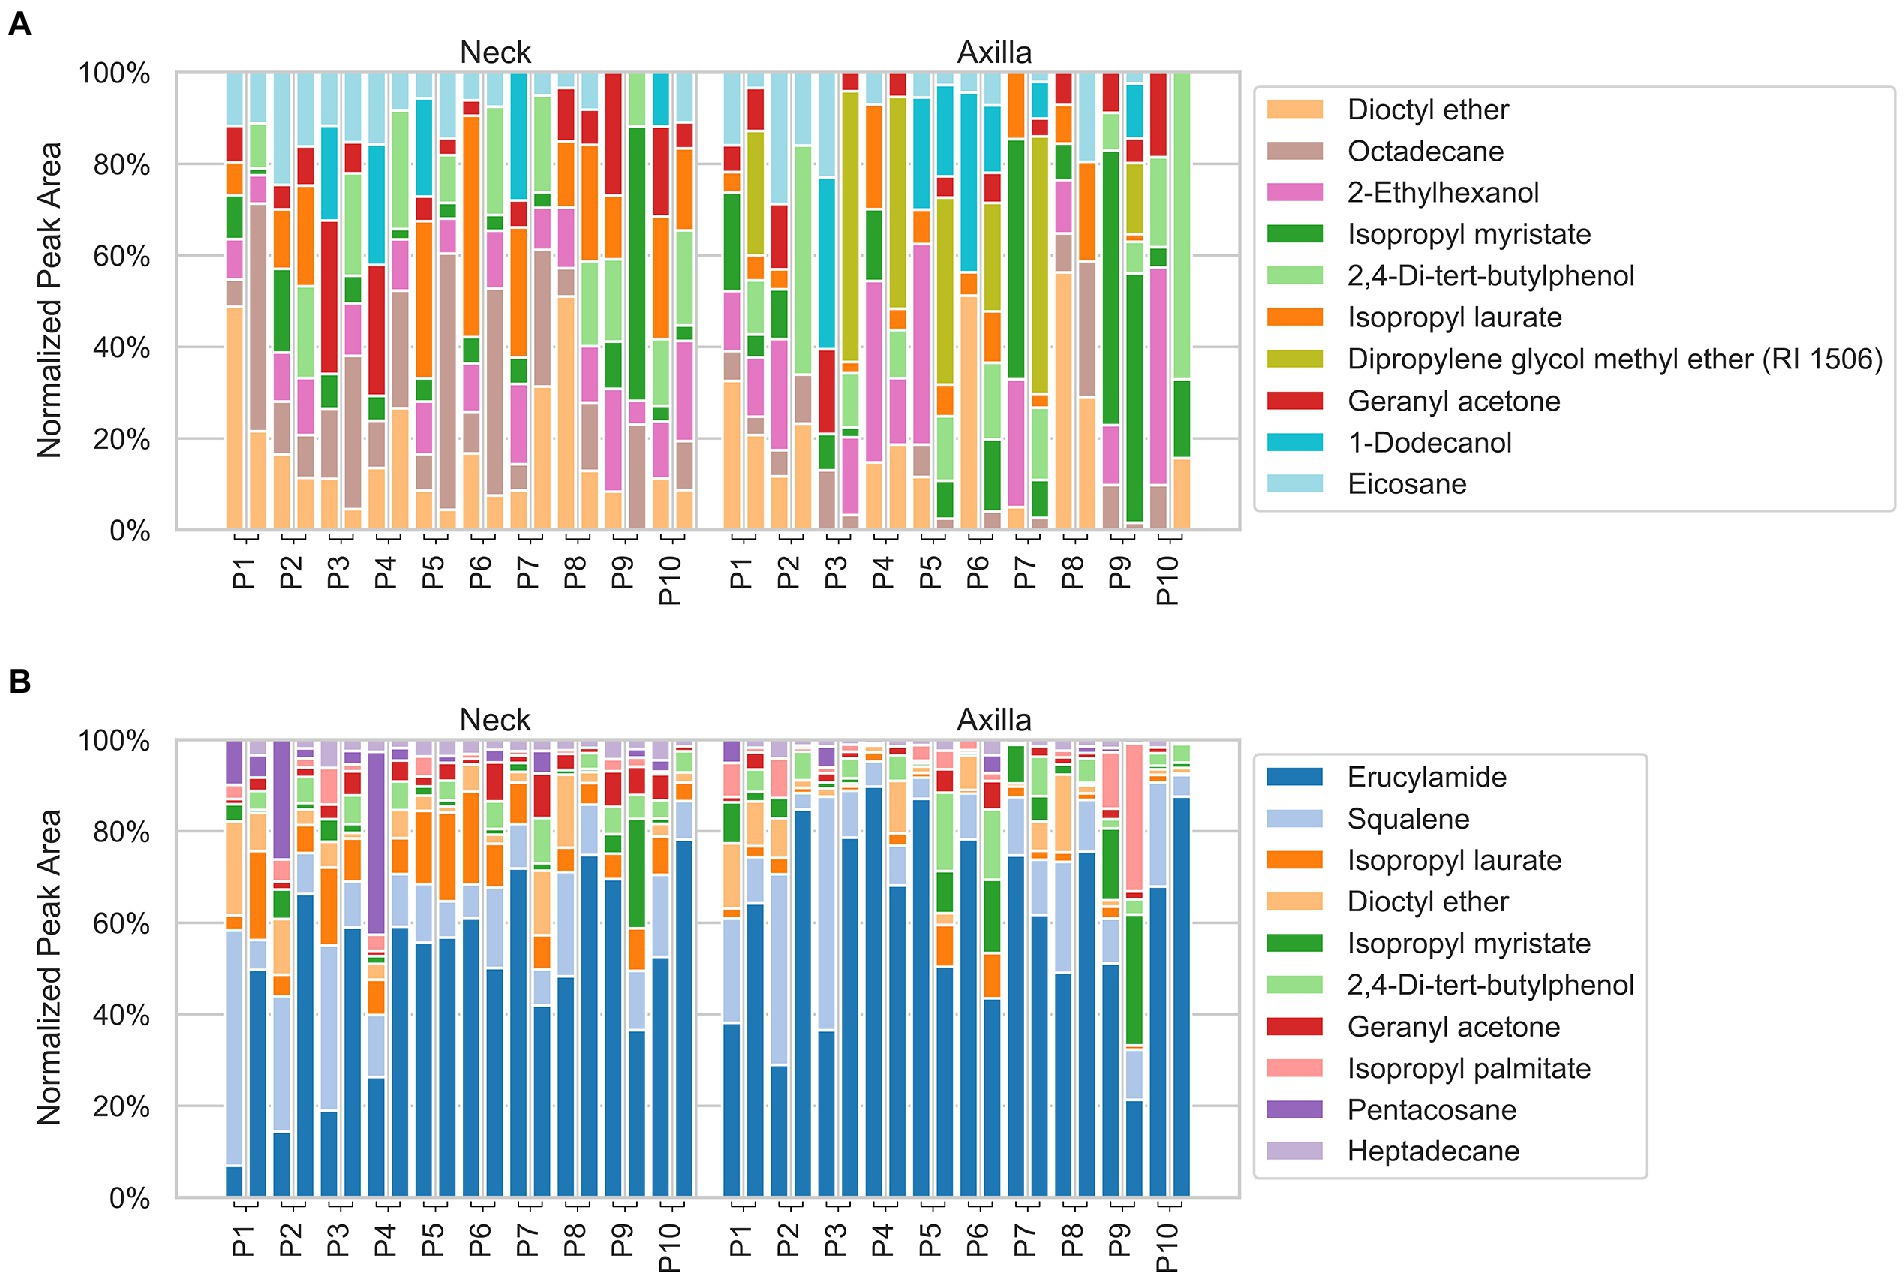
Figure 3. Stacked bar plots of volatiles detected by using a FFAP (A) and DB-5 (B) analytical column, showing the normalized relative peak area of the ten most abundant volatiles in the neck (left) and axilla (right) samples. The difference of sampling day 1 and 2 is represented by the two stacked bar plots connected to each participant. Note that only the ten most abundant volatiles are shown and the relative/normalized abundance on the y-axis is given with respect to those ten only (i.e., 100% abundance refers to the top ten and not to all volatiles found for the respective participant).
The bacterial composition of both the axillary and neck samples was dominated by the Gram-positive genera Staphylococcus and Cutibacterium. We analyzed alpha diversity, beta diversity and bacteria count. We did not observe any significant differences between the body sites for alpha and beta diversity. However, the total bacteria count was significantly higher for axillary samples compared to neck samples (p < 0.01, CLES = 0.96; as shown in Supplementary Figure S2A). The ten most abundant bacteria at the species level across all samples were considered for further statistical analysis (we show bacteria on the genus level in Supplementary Figures S3A,B) to enable the comparison to the DNA data. We observed a significantly higher abundance of Staphylococcus epidermidis (p < 0.05), Staphylococcus hominis (p < 0.05), and Cutibacterium avidum (p < 0.05) in axillary samples than in neck samples and significantly more Cutibacterium acnes (p < 0.05) in neck samples compared to axillary samples (Figure 4A).
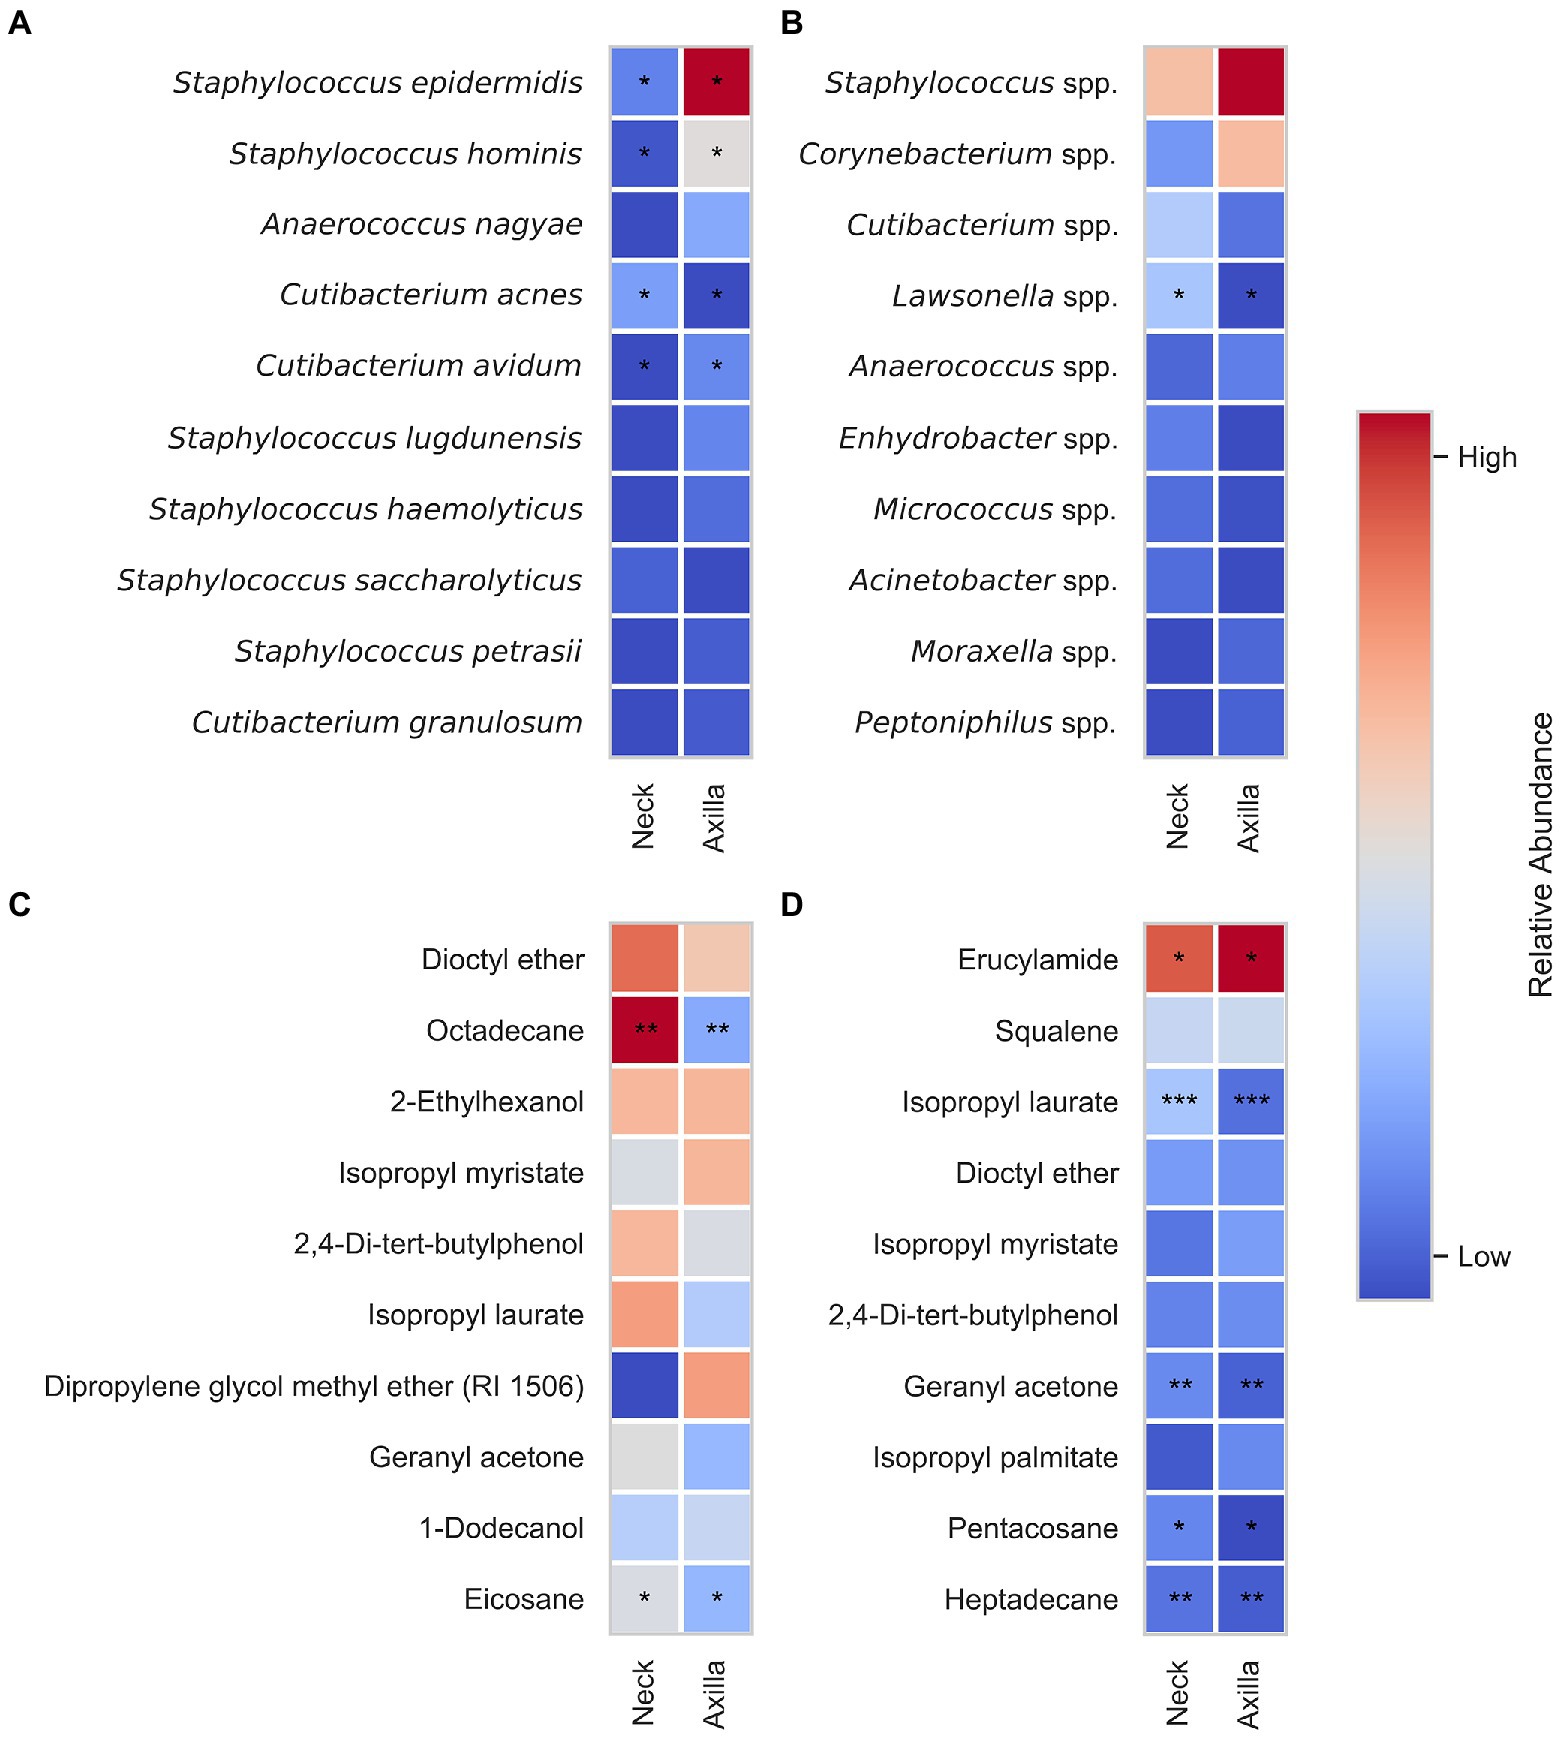
Figure 4. Relative bacteria abundance for culture data (A) and DNA data (B) as well as normalized peak areas from FFAP (C) and DB-5 (D) samples of armpit and neck. In total 40 samples were compared (10 armpit and 10 neck samples from each sampling round). The value in each cell is determined by the relative abundance of the respective bacteria, DNA data, or normalized peak areas averaged over all the subjects. Significant differences are highlighted with asterisk(s) (*) in the same column where *** denotes p < 0.001, ** denotes p < 0.01, and * denotes p < 0.05. For ASV data (B) significant differences calculated with differential abundance test using analysis of compositions of microbiomes (ANCOM) (Mandal et al., 2015) are shown with an asterisk (*).
The axillary samples were dominated by Staphylococci and Corynebacteria, whereas the neck samples were more diverse, with Staphylococci and Cutibacteria being the most abundant genera. We analyzed alpha diversity, beta-diversity, and relative abundance of ASVs. The alpha diversity of neck samples was significantly higher compared with armpit samples (p < 0.05, CLES = 0.77; see Supplementary Figure S2). The ten most abundant genera over all samples were considered for further statistical analysis. Neck samples showed a significantly higher abundance of Lawsonella (p < 0.05) than axillary samples (Figure 4B).
The compounds with the highest normalized peak areas in axillary and neck samples, respectively, are shown in Supplementary Figures S3C–F. The peaks occurring in both axillary and neck samples with the highest normalized peak areas and their relative areas in individual participants are shown in Figure 3.
Among neck samples, the ten highest, normalized peak areas on overall average were, on both columns, related to dioctyl ether, isopropyl laurate, isopropyl myristate, 2,4-di-tert-butylphenol and geranyl acetone. For the FFAP column, 2-ethylhexanol, hexadecane, heptadecane, eicosane and 1-dodecanol were additionally amongst the ten molecules with the highest normalized area, whereas for the DB-5 column this was the case for erucylamide, squalene, tetracosane, pentacosane and heptacosane.
The highest normalized peak areas in the axilla samples were related to dioctyl ether, isopropyl laurate, isopropyl myristate and 2,4-di-tert-butylphenol on both columns. On the FFAP column three different isomers of dipropylene glycol methyl ether (RI FFAP: 1456, 1,467 and 1,506), 1-dodecanol, 1-tetradecanol and 2-ethylhexanol were furthermore among the ten peaks with the highest normalized areas, whereas on the DB-5 column erucylamide, squalene, isopropyl palmitate, myristic acid, farnesyl acetaldehyde* and 2-ethylhexyl salicylate additionally occurred with high normalized peak areas.
The analysis of an unused Gazin® gauze pad showed that several of these compounds were also present there. Evaluating the results on the FFAP-column, 2-ethylhexanol and geranyl acetone were part of the volatiles found, whereas for the DB-5 column this was the case for erucylamide, dioctyl ether, isopropyl laurate, isopropyl myristate, 2,4-di-tert-butylphenol and heptadecane. We nonetheless statistically compared the normalized peak areas of individual volatiles associated with the ten peaks with the highest normalized peak area on the whole dataset. For the FFAP column, octadecane (p < 0.01) and eicosane (p < 0.05) showed significantly higher normalized peak areas in neck samples than in axilla samples. For the DB-5 column isopropyl laurate (p < 0.001), geranyl acetone (p < 0.01), pentacosane (p < 0.05), heptadecane (p < 0.01) showed significantly higher normalized peak areas in neck samples compared with axilla samples whereas the normalized peak area of erucylamide (p < 0.05) was significantly higher in axilla samples. The differences in normalized peak areas between armpit and neck samples are shown in Figures 4C,D.
We performed a distance correlation analysis to find general associations between the microbiome and VOCs. The distance correlation test is a non-parametric approach and thus makes no distributional assumptions about the data and can be used to detect non-linear dependencies between high-dimensional variables. We found significant correlations between the relative bacteria abundance of the sequencing data and the normalized peak areas of all peaks from the FFAP column (p < 0.01, r = 0.83).
We further analyzed multi-omic interaction in the data on the level of individual bacterial taxa and volatiles in Figure 5. Here, we use the mmvec (microbe-metabolite vectors) method proposed to analyze microbiome-metabolome interactions by calculating co-occurrence probabilities between individual bacterial taxa and volatiles, which has been shown to outperform statistical methods for multi-omic analysis (Morton et al., 2019). Further details about the approach are given in the supplementary additional information S1. We applied the mmvec method without prior normalization since preprocessing is already included into the mmvec pipeline. Data from armpit and neck samples were combined to increase the total amount of data and explore potential general relationships independent of the sampling site. Additionally, we restricted our analysis to volatiles that occurred in at least 50% of all samples. This resulted in a total of 16 different volatiles on the DB-5 that fulfilled the condition, whereas on the FFAP column only 2 volatiles fulfilled the condition. Among these, ten compounds (tetradecane, hexadecane, heptadecane, octadecane, dioctyl ether, isopropyl laurate, isopropyl myristate, erucylamide, 2,4-di-tert-butylphenol and 13-epimanool*) were also detected in the blank samples (unused Gazin® gauze pads) measured on the DB-5 column. No overlaps with the blank, measured on FFAP-column, were found. Further, we considered only those bacteria, where a considerable co-occurrence with any of the 16 volatiles on the DB-5 column or the 2 volatiles on the FFAP column could be found, respectively. This amounted to the six most abundant bacteria for the ASV data and the three most abundant bacteria for the cultural data (these make up for over 90 and 99% of the total relative abundance, respectively).
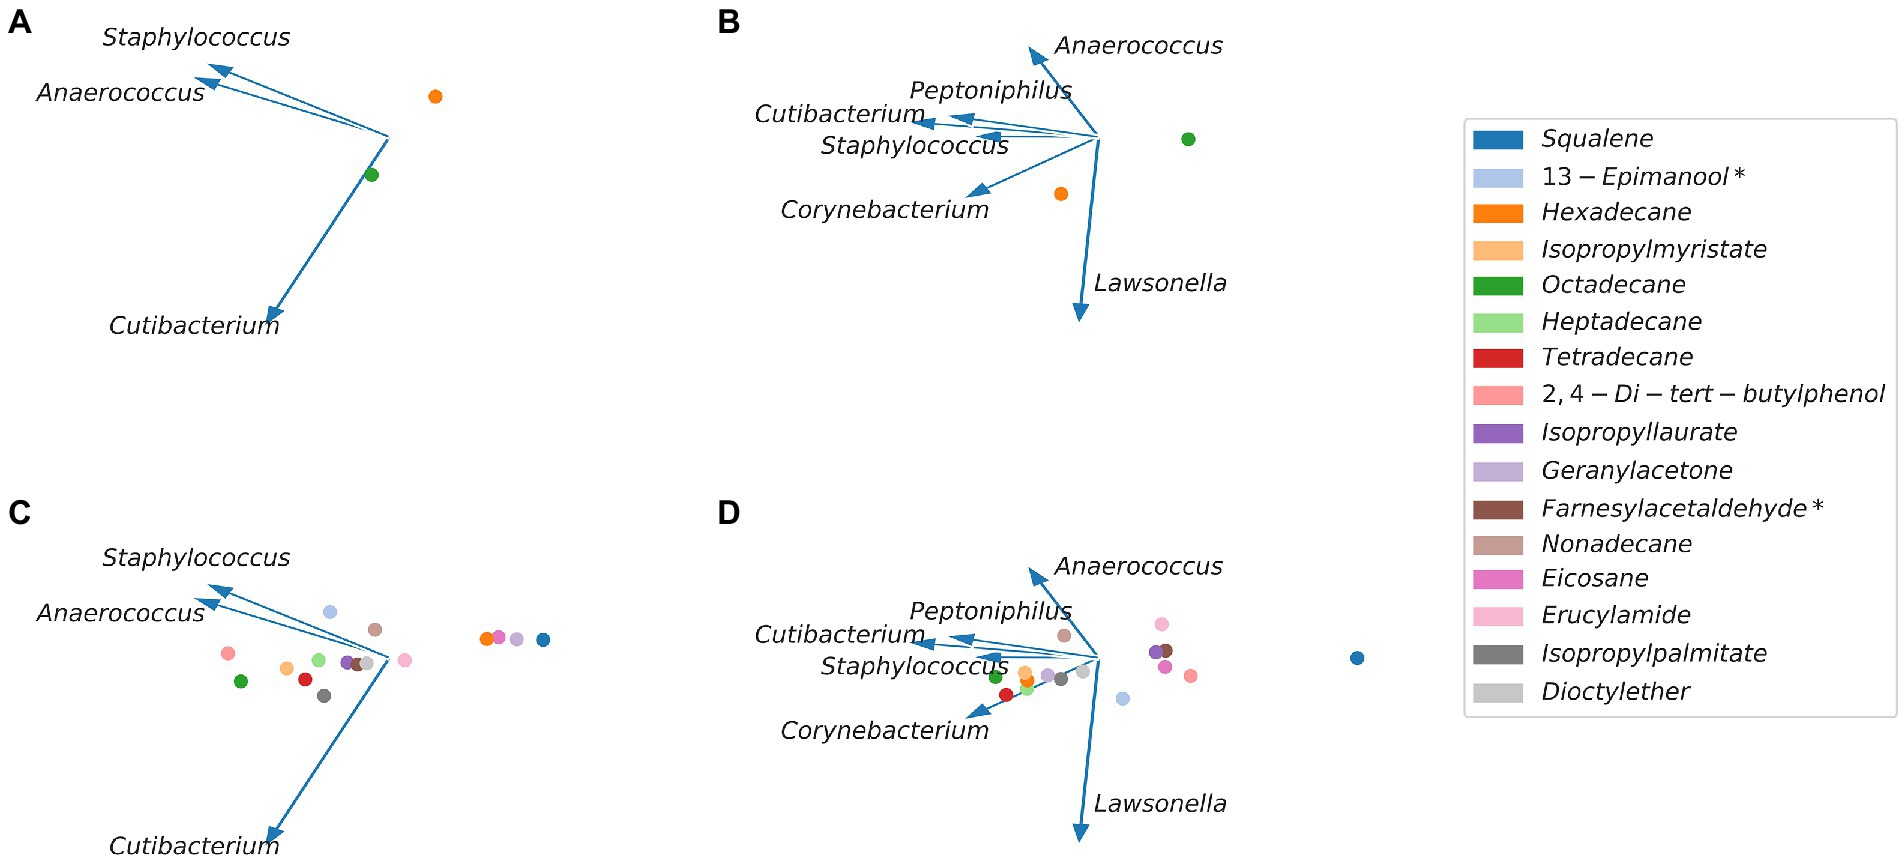
Figure 5. Microbe-metabolite vectors (mmvec) embedding of bacteria identified with the cultural approach and volatiles identified on the FFAP column (A) and DB-5 column (C) and mmvec embedding of bacteria identified with the sequencing approach and volatiles identified on the FFAP column (B) and on the DB-5 column (D). The bacteria are visualized by blue arrows and volatiles by colored dots. Bacteria that often occur together show a small angle between their respective arrows (e.g., Staphylococcus and Anaerococcus). Volatiles that show a high co-occurrence exhibit a low Euclidean distance to each other (e.g., tetradecane and octadecane). Arrows pointing toward the same direction as volatiles indicate microbe-volatile co-occurrences.
We found a high co-occurrence between Staphylococci and Anaerococci. For the DB-5 column, we found no co-occurrence for the volatiles hexadecane, eicosane, geranyl acetone, squalene and erucylamide. The strongest interaction with Staphylococci had 13-epimanool*. 2,4-di-tert-butylphenol, dioctyl ether, isopropyl laurate, isopropyl myristate, isopropyl palmitate, tetradecane, heptadecane, octadecane and farnesyl acetaldehyde* showed a moderate interaction with Cutibacteria and Anaerococcus. For the FFAP column, we found no co-occurrence for hexadecane and a moderate co-occurrence for octadecane and Cutibacteria.
We found a high co-occurrence between Staphylococci and Cutibacteria and Peptoniphilia and no considerable co-occurrences for Anaerococcus, Corynebacterium and Lawsonella. For the DB5 column, we found no co-occurrences for squalene, 2,4-di-tert-butylphenol, eicosane, farnesyl acetaldehyde*, erucylamide and isopropyl laurate. We found co-occurrences between Corynebacterium, Staphylococcus and tetradecane, hexadecane, heptadecane, octadecane, dioctyl ether, isopropyl myristate, isopropyl palmitate and geranyl acetone. We further found a co-occurrence between nonadecane and Anaerococcus and Peptoniphilus as well as a moderate co-occurrence between 13-epimanool* and Lawsonella. For the FFAP column, we found no co-occurrence for octadecane and moderate co-occurrence for hexadecane and Corynebacteria and Lawsonella.
We evaluated whether different metadata categories can be classified using the individual data sources. We considered gender, subject identity, and body sites as metadata categories. We trained a random forest classifier on the first sampling round and evaluated the performance on the second sampling. We chose this setup as it most closely represents real-world classification conditions where data is continuously collected and classified. The setup of the training procedure is explained in detail in Supplementary additional information S2.
Moreover, we explored if it is possible to classify whether a sample is from sampling round one or two. Therefore, we evaluated the accuracy for identifying the different samplings with a leave-one-out cross-validation on all 40 subjects and averaged the results. More detail is given in Supplementary additional information S3.
For the data sources we used the culture data , the DNA data , and the GC–MS data . Here we used all the features (i.e., all the volatiles and bacteria) from every data source. For the GC–MS data we considered both the FFAP and DB-5 column and either used the relative normalized peak areas or the peak areas directly. Furthermore, we explored if combining the individual data sources improves the classification accuracy. Therefore, we trained a logistic regression on the classification decisions of the individual models on the first sampling round to combine the data sources. The results are summarized in Table 1.
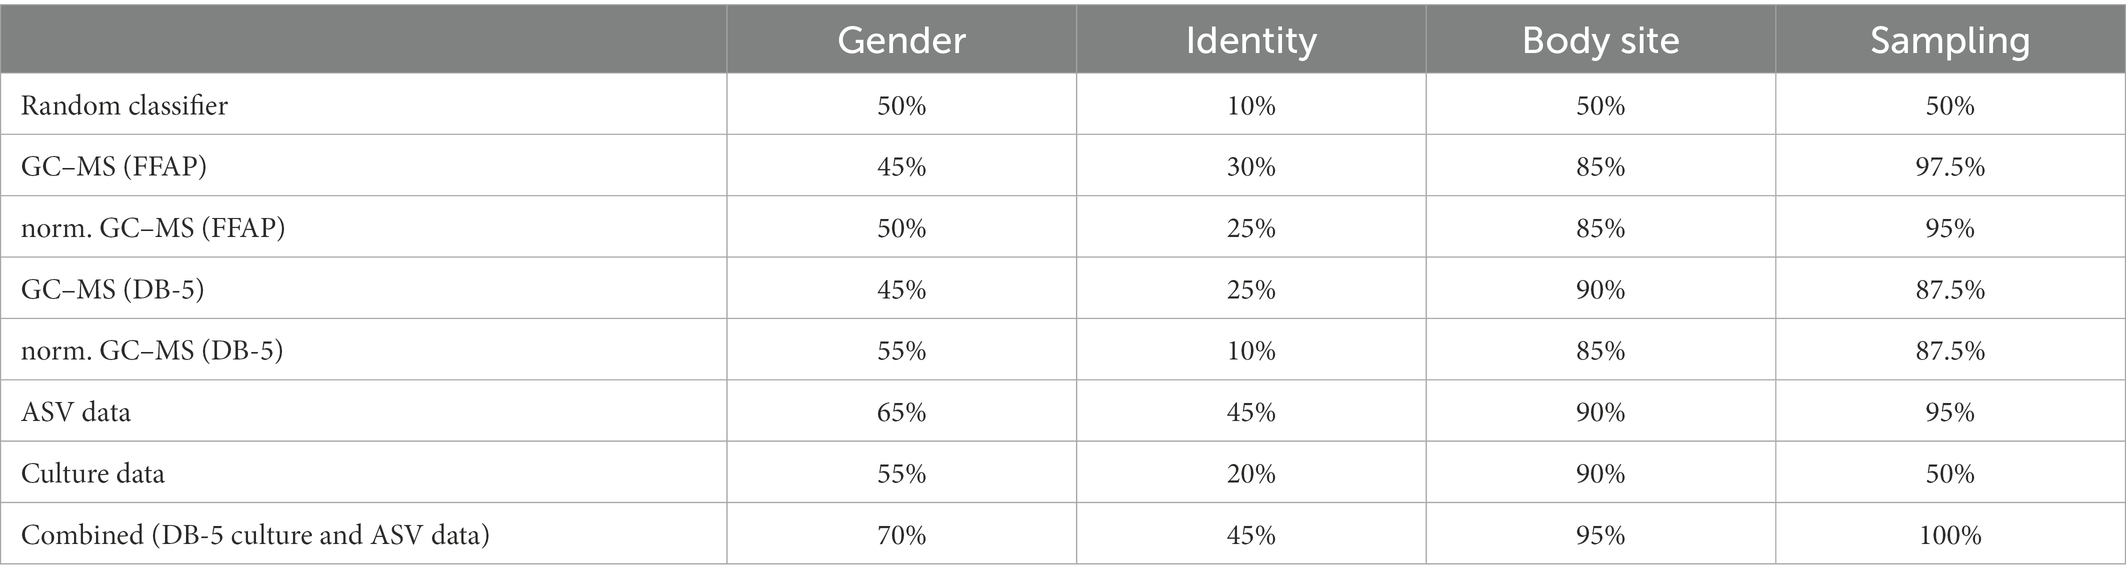
Table 1. Classification accuracy for different meta data and data sources in %. Results are from a random forest classifier trained on the first sampling and evaluated on the second sampling. To evaluate the accuracy for identifying the different samplings a leave-one-out cross-validation was performed on all 40 subjects (right-most column). The results from a random classifier are shown for context.
Samples of the first and second sampling round could be classified with 90% accuracy with models trained on the GC–MS or DNA data. This confirms that the collected data between the two samplings differ for these data, but not the cultural data (see Supplementary additional information S4 and Supplementary Figure S4). Nevertheless, discrimination of the different metadata categories was considerably better than random guessing for all categories. This suggests that while there are systematic differences between the two sampling rounds, the main differences in relation to body sites, gender, and identity remain in both sampling rounds. For all metadata categories the model trained on the DNA data achieved the highest accuracy. For the GC–MS data, the highest accuracy was achieved with the DB-5 column and no normalization. Combining the different data sources improved the accuracy for all meta data categories except for participant identity, where it remained the same. Figure 6 shows the average feature importance to differentiate between body sites of the random forest models for the individual data sources based on Shapley Additive exPlanations (SHAP) values (Lundberg et al., 2020). In contrast to a statistical analysis, SHAP values are a game theoretic explanation approach to show non-linear relations in the data that can be used to differentiate the different body sites. Additionally, features (e.g., volatiles, bacteria, or ASVs) that are not among the ten most abundant are considered in this analysis. A summary of the findings is given in the following (features are ordered according to their SHAP value with decreasing relevance from top to bottom).
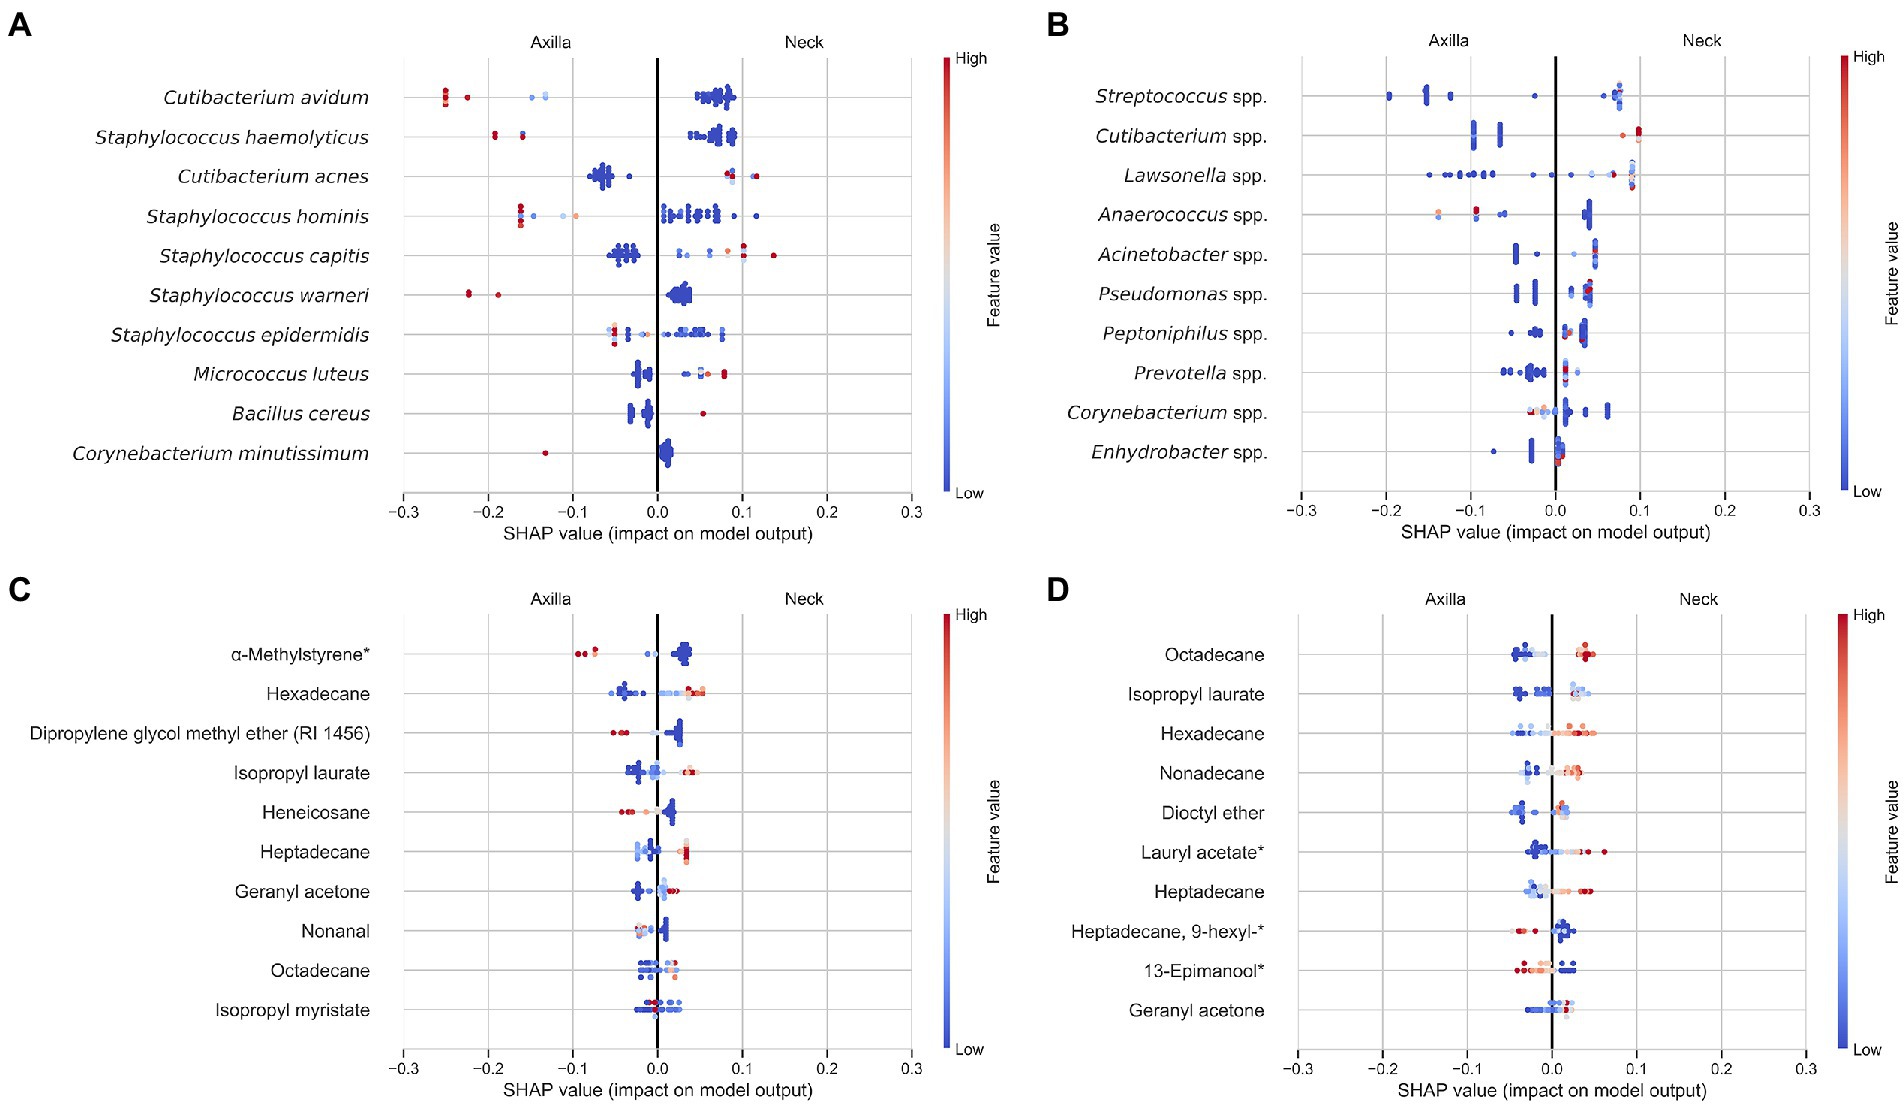
Figure 6. Feature importance of the individual data sources [culture data (A), ASV data (B), GC–MS FFAP (C) and DB-5 (D)] of a random forest classifier to differentiate between axilla and neck samples. GC–MS data was not normalized with the total peak area, as this resulted in a higher accuracy for the classifier trained on DB-5 data. The abundance of the features is color coded where low abundance is shown with blue colors and high abundance with red colors. Features that indicate armpit samples are in the left half of the plot while features that indicate neck samples are on the right. Example: High abundance of octadecane in (D) is indicative of neck samples (considerable number of red dots), whereas low abundance is indicative of axilla samples (considerable number of blue dots). The individual features are shown on the y-axis. Every point in the plot is the abundance value of a feature from a single participant.
The analysis showed that high abundances of Cutibacterium avidum, Staphylococcus haemolyticus, and Staphylococcus hominis were most important to identify axilla samples. In contrast, high abundances of Cutibacterium acnes, Staphylococcus capitis, and Micrococcus luteus indicated neck samples.
Here, the three most important bacteria to separate neck and axilla samples were Streptococcus, Cutibacterium, and Lawsonella. All were substantially more abundant in neck than in armpit samples. However, high abundance of Anaerococcus and Corynebacterium were indicative for axilla samples.
High peak areas of isopropyl laurate, hexadecane, heptadecane, and octadecane were pointing to neck samples. In contrast, high abundances of α-methylstyrene*, dipropylene glycol methyl ether (RI 1456), and heneicosane were indicatory for armpit samples. Note that from the features shown in Figure 6C, α-methylstyrene*, geranyl acetone as well as nonanal were also detected in the blank measurements obtained with unused Gazin® gauze pads.
High peak areas of hexadecane, octadecane, isopropyl laurate and nonadecane were suggestive for neck samples, whereas high abundances of 9-hexylheptadecane* and 13-epimanool* indicated axilla samples. Note that from the features shown in Figure 6D, hexadecane, heptadecane, octadecane, dioctyl ether, isopropyl laurate as well as 13-epimanool* were also part of the volatiles found on the blank Gazin® gauze pads.
Additionally, we projected the individual data sources into a two-dimensional manifold with the PCoA algorithm. Supplementary Figure S5 shows how the samples cluster according to the body sites for the DNA, cultural data, and GC–MS.
To assess if the measured bacteria are similar using a cultural or sequencing approach, we compared the relative abundance of bacteria counts of the ASV tables and culture data on a genus level. We did not compare species level abundances as the used sequencing method only gives reliable matches on the genus level. In Figure 7 all bacteria found with both the cultural and sequencing approach are ranked according to their relative abundance for armpit and neck samples individually. For both data sources and axilla as well as neck samples the most abundant bacteria observed were Staphylococci. For armpit samples (Figure 7A), Staphylococci (rank 1) and Micrococci (rank 5) were ranked equally for both data sources. The relative ranking of all other bacteria differed at least two ranks except for the Anaerococcus, Cutibacterium and Pantoea. For neck samples (Figure 7B), the ranking between the cultural and sequencing approach was more similar. Here Staphylococci (rank 1) and Cutibacteria (rank 2) were ranked equally. Furthermore, Micrococcus, Kocuria, Pseudomonas, Pantoea, Actinomyces, and Dermabacter differed only by one rank.
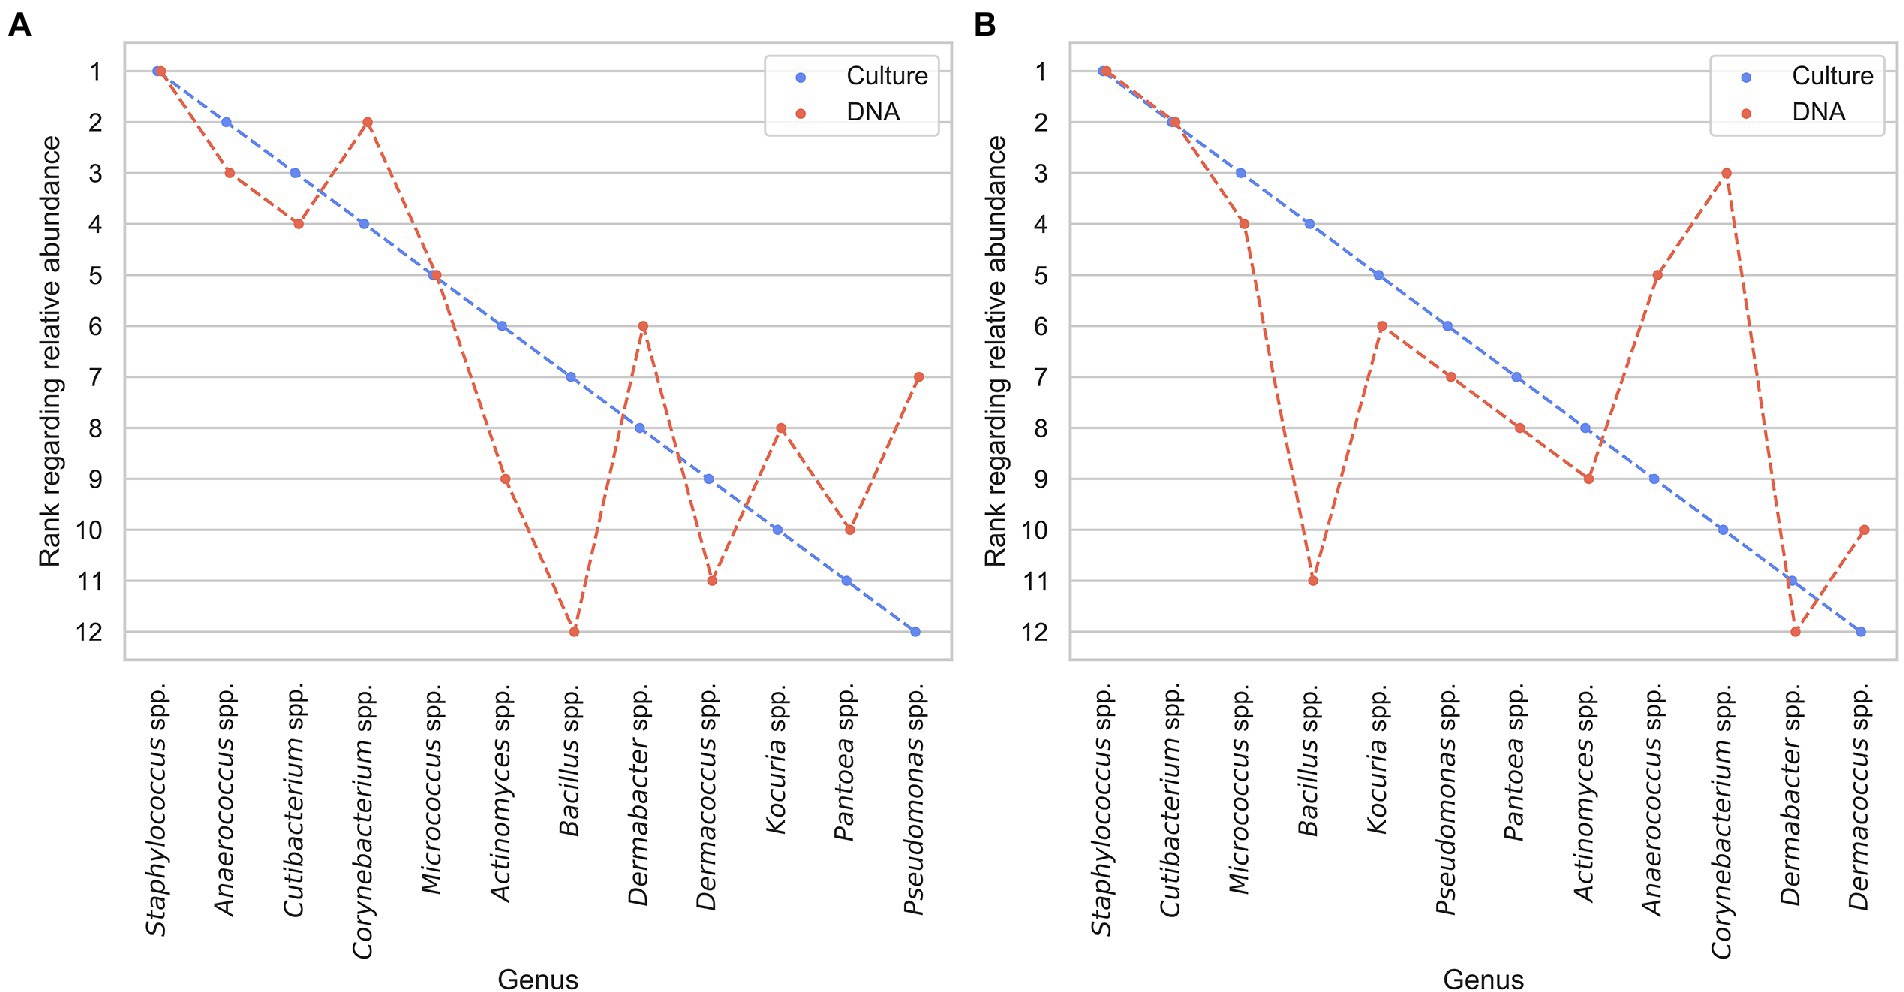
Figure 7. Comparison of relative ranking between the bacterial genera in culture and DNA data (highest abundant bacterium denoted as rank 1 and lowest as rank 12) for armpit (A) and neck (B) samples.
In this study, we investigated whether samples from different body sites, namely axilla and neck, can be distinguished by training a linear and nonlinear classifier using VOC and microbiome data. By including in total 40 samples of VOCs and microbiome obtained from the neck and axilla of 10 participants within two study rounds, we successfully achieved a classification of these two different body parts with an accuracy rate up to 90%.
The analysis of the skin microbiome revealed mainly bacteria of a normal, healthy skin flora, such as Staphylococci, Corynebacteria or Cutibacteria, in agreement with previous work (Grice and Segre, 2011; Byrd et al., 2018; Lam et al., 2018). Not surprisingly, we found significantly higher absolute bacterial colony counts in the axilla than the neck. This could be due to, amongst others, the high density of apocrine sweat and sebaceous glands in the axilla which leads to a good medium for microorganisms (Leyden et al., 1981; Grice et al., 2008). Moreover, we observed that the identification of bacteria at the genus level, as done in the sequencing approach, was in some cases not sufficient to draw a clear conclusion about the body site, since high abundances of the same genus level (e.g., Staphylococci) occurred both in the axilla and in the neck. Only the analysis at species level (cultural approach) allowed a precise conclusion about the respective body site. For example, a high abundance of Cutibacterium avidum was characteristic for axillary samples and Cutibacterium acnes for samples of the neck.
Sampling skin volatiles from the two different body sites using Gazin® gauze pads in combination with solvent extraction allowed the detection of various volatile compounds, among which the most abundant peak areas were obtained for esters (isopropyl laurate, isopropyl myristate, isopropyl palmitate, 2-ethylhexyl salicylate), ethers (dioctyl ether, isomers of dipropylene glycol methyl ether), phenols (2,4-di-tert-butylphenol), alcohols (2-ethylhexanol, 1-dodecanol, 1-tetradecanol), ketones (geranyl acetone), aldehydes (farnesyl acetaldehyde*, nonanal), a triterpene (squalene), amides (erucylamide), fatty acids (myristic acid) and alkanes/hydrocarbons (C16-C27). Most of these compounds have been detected in previous studies on human skin emanations (Bortz et al., 1989; Zeng et al., 1991, 1996; Haze et al., 2001; Curran et al., 2005; Penn et al., 2007; Gallagher et al., 2008; Vaglio et al., 2009; Brown et al., 2013; Martin et al., 2014; Rathinamoorthy and Thilagavathi, 2016; Duffy et al., 2018; Tavares et al., 2019; Vautz et al., 2020). Some of the identified volatiles are known as naturally occurring VOCs, such as squalene and its degradation products geranyl acetone and farnesyl acetaldehyde. Squalene, as one of the main components in human sebum (Greene et al., 1970; Picardo et al., 2009) is affected by oxidative degradation due to the ozone concentration in ambient air. Thereby different stages of degradation occur: geranyl acetone is one of the most prominent ozonolysis products whereas farnesyl acetaldehyde (C17-trienal) is a major precursor (Wisthaler and Weschler, 2010). In our study, we observed significantly higher peak areas for geranyl acetone in neck samples, whereas farnesyl acetaldehyde belonged to the most abundant peaks in axilla samples. This observation may be explained by a higher exposition of the neck towards ozone in ambient air, whereas the axilla is covered with clothes most of the time. At this point, it should be mentioned that farnesyl acetaldehyde has not been reported in axillary samples, yet. As an authentic standard was not commercially available, in the next steps the identification has to be confirmed with a synthesized standard.
Besides, several of the identified compounds might be placed in the category of artificial contaminations since they are used as cosmetic ingredients, e.g., in soaps, shampoos, detergent or crèmes (see also Supplementary Table S1). However, some ingredients that are used to moisture the skin may be adopted from naturally occurring components on the skin – in these cases it is difficult to evaluate where the compounds stem from. As the use of skin care products differs for body parts as axilla and neck, different (amounts of) residues can be expected on different skin areas. For example, in axillary samples, erucylamide had a significantly higher peak area and dipropylene glycol methyl ether was important to identify the body part inter alia. These substances are opacifying and viscosity controlling and are used for perfuming and as solvents in cosmetics as defined in the European Commission Database for Information on Cosmetic Substances and Ingredients (2022) (CosIng).2 Isopropyl laurate and alkanes in the range of C16–C25 had a significantly higher abundance in neck samples and were used by the random forest classifier to identify neck as the body part, respectively. According to CosIng these compounds are used for skin conditioning and as emollient. Further, 2-ethylhexanol, detected in axillary as well as neck samples, is used as a perfuming agent and dioctyl ether is also used as a cosmetic ingredient according to CosIng1. Thus, several of these substances should be considered as exogenous compounds of the human volatilome. Regarding alkanes, investigations of Bortz et al. (1989) indicate that alkanes in human surface lipids are environmental contaminants. Intake of substances via the food may also lead to excretion of exogenous compounds via the skin. For instance, 2,4-di-tert-butylphenol is known as a compound migrating from food contact materials and therefore has been included in the first Total Diet Study in Germany (BfR-MEAL-Study) to assess possible risks related to food intake (Kolbaum et al., 2022). In human urine, 2,4-di-tert-butylphenol has been reported (Liu and Mabury, 2019), and excretion via human skin may also be conceivable. To sum up, our results suggest that the here used method to sample skin volatiles led to the detection of various exogenous contaminants from different origins as part of the human volatilome. In this respect, it must also be noted that several of the mentioned compounds were also detected in the blank measurements. Thus, it cannot be ruled out that part of the substances reported here are originating from Gazin® gauze pads themselves, either due to insufficient extraction during the pre-treatment or due to further adsorption of compounds from the environment after extraction. Puzzlingly, however, compounds that were found within the blank measurement were not present in all body odor samples. In additional experiments performed after the two sampling rounds, it was found that reproducible results were obtained for blank measurements with unused Gazin® gauze pads when they were measured directly after workup. The comparison with the previously obtained results from unused Gazin® gauze pads, however, showed that substances which had originally been detected in the blanks, such as 2-ethylhexanol and geranyl acetone, were not present in the newly prepared blanks. In contrast some substances such as isopropyl myristate, 2,4-di-tert-butylphenol and eicosane, which did not appear in the blank during the first work-up, were detected on the FFAP column. A similar result was obtained for the DB-5 measurements. Substances such as dioctyl ether, isopropyl laurate and 2,4-di-tert-butylphenol could no longer be detected in the second work-up of unused Gazin® gauze pads. These discrepancies could arise from different storage duration or a variation in the batch of the gauze pads. To further resolve this issue, a quantitative analysis of the respective compounds should be performed and more than one blank should be analyzed to assess potential quantitative variation of the respective compounds in blank samples. In addition, the gauze pads should be covered during sampling to prevent adsorption of volatiles from the room air, and a room air blank should be measured in parallel. For future studies, it is recommended to evaluate whether better suited methods for sampling of volatiles from skin can be used.
To evaluate the potential modulating role of the microbiome on volatile profiles of body sites, it is essential to identify relationships between the two. Indeed, the influence of the skin microbiome on body odours and emissions is a commonly known fact (Fredrich et al., 2013; Kusano et al., 2013; Byrd et al., 2018; Jaiswal et al., 2021). Especially the ongoing development of next generation culture independent DNA sequencing techniques opens up an enormous amount of data regarding taxonomic composition of the human skin microbiome. The combination of microbiome data with VOC data and their joint evaluation is a complex task. In this study, we used a statistical approach which was recently proposed by Morton et al. (2019) to investigate in an explorative way potential correlations between the microbiome and VOC data obtained in this study. Four different data sets (DNA data, culture data, GC–MS data on FFAP and DB-5) were used for this analysis and four mmvec analyses were conducted, combining the different data sets with each other. Theoretically, the results should depict a similar pattern in terms of co-occurrences for volatiles and bacteria. However, this was only partly the case, whereas the majority of co-occurences were significant only in one of the four analyses, which is most probably related to the different types of methods used, and the method of feature selection. The insights gained from the mmvec analysis within this study could not be connected to co-occurrences of bacteria and volatiles in literature. Several limitations of the present study prevent us from interpreting the obtained results further. The microbiome data used in the mmvec approach was at genus classification level. Since the metabolism of two species of the same genus can differ, it could lead to false assumptions for the co-occurrences of bacteria and volatiles. Further limitations relate to the low number of participants, lack of an internal standard, the partly ambiguous origin of the identified volatiles (see above), and combined analysis of different body sites. In order to overcome the limitations in a follow up study it would be advisable to increase the number of samples, put the focus on a single sampling site, use internal standard(s) for quantitative determination of volatiles, identify bacteria on a species level and use advanced analytical techniques like two-dimensional gas chromatography.
In this study, we were furthermore interested in assessing the impact of different methodological approaches. One aspect here was to test whether washing the sampling site as a way of standardizing probes leads to different results compared to sampling an unwashed skin area. Different standardization procedures have been used so far before sampling of skin emanates. Body parts were washed with water or additionally with soap just before sampling (Brown et al., 2013; Mochalski et al., 2014; Grabowska-Polanowska et al., 2017; Duffy et al., 2018). Our sampling procedure included wiping the body region with a moist disposable towel, so only water was used. This procedure had no effect on the ten most abundant VOCs. Regarding the culture data, washing had an influence on the absolute bacterial colony counts of the axilla, but not of the neck. In other studies using different washing regimes, a reduction but sometimes also an adulteration of bacterial taxa was found (Fierer et al., 2008; Steglińska et al., 2019). Future studies are needed to further elucidate the impact of different washing procedures, e.g., with or without soap, on the quality of microbiome and VOC samples.
A second methodological aspect addressed here was the choice of the analytical column used for GC. In general, comprehensive two-dimensional gas chromatography can be considered state of the art in the field of volatilomics (Pani, 2006; Winnike et al., 2015). Nonetheless, such instruments may not always be available. Using a suited column in one-dimensional systems is then even more important. In the present study, we therefore aimed at evaluating the influence of the selection of the analytical column on the obtained results. Considering the ten peaks with the highest peak areas, partly divergent results were obtained with the two columns. Whereas some substances were in the top ten on both columns, like isopropyl myristate, isopropyl laurate, dioctyl ether, 2,4-di-tert-butylphenol and geranyl acetone (in neck samples), the remaining substances differed. On the FFAP column especially ethers and alcohols were present in the top ten, whereas on the DB-5 column next to the highly abundant erucylamid and squalene, n-alkanes or long-chain isopropyl esters dominated. The results from the random forest classifier used in this study showed that in general the classification worked better for the data obtained from the DB-5 measurements in comparison to the FFAP data. For future one-dimensional GC–MS analyses, one may also consider using more than one column type. Suited data analysis methods could be established to use the additional degree of information (e.g., retention indices) for facilitated automated substance identification.
The third methodological aspect considered in this study was the type of microbiological analysis used. When comparing the results obtained with the cultural and the DNA sequencing approach, it was noticeable that Staphylococcus spp. and Cutibacterium spp. predominated in the evaluation of the culture data, whereas Staphylococcus spp. and Corynebacterium spp. in particular were predominantly found in the DNA data. A possible explanation is that Corynebacteria grow less well in culture and were therefore underestimated by this method. Byrd et al. indeed reported that cultivation of Staphylococci is easier than that of Corynebacteria (Byrd et al., 2018). On the other hand, the significantly lower occurrence of Cutibacteria in the DNA samples could be due to the primers used in sequencing. Especially the use of primers to sequence the V4 regions, which is common when working with the MiSeq platform, often leads to problems in the identification of Cutibacteria (Meisel et al., 2016; Castelino et al., 2017). For this reason, the culture-dependent approach has an advantage here. In line with this notion, Namdari et al. (2020) addressed poor identification of Cutibacterium acnes in shoulder surgery using next generation sequencing (NGS) compared to classical culturing (Namdari et al., 2020). On the other hand, Lawsonella were found by DNA analysis to be more abundant in the neck than the axilla samples, but not detected by culture, which can be explained by the absence of database entries and the unreliable growth in culture (Goldenberger et al., 2019). Such well-known differences in the methodological approaches should be considered when planning further studies aiming to characterize individual skin microbiomes. In the future, host DNA removal, e.g., by using benzonase (Amar et al., 2021), in combination with shallow shotgun sequencing has the potential to be a highly relevant alternative to Illumina-based characterizations of skin microbiomes. However, at the moment in many cases low microbial biomass from skin samples, together with high host DNA “contamination” and high costs, are the main reasons preventing the more frequent use of shotgun sequencing (Ranjan et al., 2016; Knight et al., 2018).
Finally, the choice of data analysis methods has played a central role when conducting this study. We analyzed the composition of volatiles and the microbiome for different body sites, subjects, genders, and sampling procedures. The resulting amount of data that can be compared, combined with the relatively small number of study participants make valid statistical analysis on a feature level problematic (i.e., significant correlations between individual bacteria and volatiles; Miller, 1981). Previous studies overcome this problem through a pre-selection of features, thereby reducing the number of comparisons (Trivedi et al., 2019; Huang et al., 2021). We followed this approach and limited feature-level statistical comparisons to the ten most abundant volatiles and bacteria from the different samplings. Therefore, part of our analyses only informed about this selection of volatiles and bacteria. Nevertheless, we chose this approach because we expected the relationship between signal and noise to be most stable for the most common features, and thus the most consistent correlations will be found. Further, possible co-occurrences between features (i.e., VOC and microbiome interactions) are also most probable for features that occur often in the data. Alternatively, features can also be selected using supervised models and bootstrapping (Trivedi et al., 2019). Here, a large number of supervised models is trained, whereby each model uses only a random subset of the total features. Afterwards, the performance of each model is assessed. This results in a population of the statistic of interest (e.g., classification accuracy) from which feature importance scores and non-parametric confidence intervals can be calculated for each individual feature. Lastly, the most important features can be considered for further statistical processing. However, this approach can lead to a selection of highly discriminative features that are only present in a small subset of the participants and does not consider later analysis on co-occurrences between data sources. We will explore the combination of bootstrapping and abundance-based feature selection in future work.
In conclusion, this study adds evidence on the composition of microbiome and VOC samples obtained from the neck and the armpit. It demonstrates that samples from these two body sites can be differentiated and confirms and extends the range of bacteria and volatiles known to be indicative for these body sites. While for the microbiome, the genus level information was not enough to classify different body parts, the species level information was sufficient to classify between axilla (e.g., Staphylococcus epidermis and Cutibacterium avidum) and neck (e.g., Cutibacterium acnes). Important features for the differentiation of body parts were next to erucylamide and dipropylene glycol methyl ether (axilla) also octadecane, geranyl acetone and eicosane (neck). Future studies with a higher number of participants, microbiome analysis on a species level, and more advanced VOC sampling and GC techniques are necessary to further advance our understanding of potential interrelationships between microbiome and volatilome at these body sites, and the underlying mechanisms related to individual characteristics, and cosmetic and dietary habits.
The datasets presented in this article are not readily available because of participant privacy. Requests to access the datasets should be directed to HL (aGVsZW5lLmxvb3NAZmF1LmRl).
The studies involving human participants were reviewed and approved by Ethical committee of the Friedrich-Alexander-Universität Erlangen-Nürnberg (FAU). The patients/participants provided their written informed consent to participate in this study.
TH, DO, LS, CH, BE, RL, SW, and HL conceptualization and methodology. LS software and visualization. TH, DO, CH, and LS formal analysis and investigation. TH, DO, and CH resources. TH, DO, CH, and SW data curation. TH, DO, LS, CH, and HL writing—original draft preparation. TH, HL, RL, SW, and BE writing—review and editing. HL, SW, RL, and BE supervision and project administration. HL funding acquisition. All authors contributed to the article and approved the submitted version.
This research was funded by the Emerging Fields Initiative of Friedrich-Alexander-Universität Erlangen-Nürnberg (FAU).
We thank all participants for contributing to the study.
The authors declare that the research was conducted in the absence of any commercial or financial relationships that could be construed as a potential conflict of interest.
All claims expressed in this article are solely those of the authors and do not necessarily represent those of their affiliated organizations, or those of the publisher, the editors and the reviewers. Any product that may be evaluated in this article, or claim that may be made by its manufacturer, is not guaranteed or endorsed by the publisher.
The Supplementary material for this article can be found online at: https://www.frontiersin.org/articles/10.3389/fevo.2023.1107463/full#supplementary-material
Aitchison, J. (1982). The statistical analysis of compositional data. J. Roy. Stat. Soc. Ser. B. (Stat. Method.) 44, 139–160. doi: 10.1111/j.2517-6161.1982.tb01195.x
Amann, A., Costello Bde, L., Miekisch, W., Schubert, J., Buszewski, B., Pleil, J., et al. (2014). The human volatilome: volatile organic compounds (VOCs) in exhaled breath, skin emanations, urine, feces and saliva. J. Breath Res. 8:034001. doi: 10.1088/1752-7155/8/3/034001
Amar, Y., Lagkouvardos, I., Silva, R. L., Ishola, O. A., Foesel, B. U., Kublik, S., et al. (2021). Pre-digest of unprotected DNA by Benzonase improves the representation of living skin bacteria and efficiently depletes host DNA. Microbiome 9:123. doi: 10.1186/s40168-021-01067-0
Angulo, J., and Serra, J. (2003). Automatic analysis of DNA microarray images using mathematical morphology. Bioinform. 19, 553–562. doi: 10.1093/bioinformatics/btg057
Beauchamp, J. (2011). Inhaled today, not gone tomorrow: pharmacokinetics and environmental exposure of volatiles in exhaled breath. J. Breath Res. 5:037103. doi: 10.1088/1752-7155/5/3/037103
Beko, G., Wargocki, P., Wang, N., Li, M., Weschler, C. J., Morrison, G., et al. (2020). The indoor chemical human emissions and reactivity (ICHEAR) project: overview of experimental methodology and preliminary results. Indoor Air 30, 1213–1228. doi: 10.1111/ina.12687
Bemelmans, J. M. H. (1979). Review of Isolation and Concentration Techniques, in Progress in Flavour Research. London: Applied Science Pub.
Biller, J. E., and Biemann, K. (1974). Reconstructed mass spectra, a novel approach for the utilization of gas chromatograph—mass spectrometer data. Anal. Lett. 7, 515–528. doi: 10.1080/00032717408058783
Bolyen, E., Rideout, J. R., Dillon, M. R., Bokulich, N. A., Abnet, C. C., Al-Ghalith, G. A., et al. (2019). Reproducible, interactive, scalable and extensible microbiome data science using QIIME 2. Nat. Biotechnol. 37, 852–857. doi: 10.1038/s41587-019-0209-9
Bortz, J. T., Wertz, P. W., and Downing, D. T. (1989). The origin of alkanes found in human skin surface lipids. J. Invest. Dermatol. 93, 723–727. doi: 10.1111/1523-1747.ep12284393
Bray, J. R., and Curtis, J. T. (1957). An ordination of the upland Forest communities of southern Wisconsin. Ecol. Monogr. 27, 325–349. doi: 10.2307/1942268
Brown, J. S., Prada, P. A., Curran, A. M., and Furton, K. G. (2013). Applicability of emanating volatile organic compounds from various forensic specimens for individual differentiation. Forensic Sci. Int. 226, 173–182. doi: 10.1016/j.forsciint.2013.01.008
Byrd, A. L., Belkaid, Y., and Segre, J. A. (2018). The human skin microbiome. Nat. Rev. Microbiol. 16, 143–155. doi: 10.1038/nrmicro.2017.157
Callahan, B. J., McMurdie, P. J., Rosen, M. J., Han, A. W., Johnson, A. J., and Holmes, S. P. (2016). DADA2: high-resolution sample inference from Illumina amplicon data. Nat. Methods 13, 581–583. doi: 10.1038/nmeth.3869
Castelino, M., Eyre, S., Moat, J., Fox, G., Martin, P., Ho, P., et al. (2017). Optimisation of methods for bacterial skin microbiome investigation: primer selection and comparison of the 454 versus MiSeq platform. BMC Microbiol. 17:23. doi: 10.1186/s12866-017-0927-4
Costello, E. K., Lauber, C. L., Hamady, M., Fierer, N., Gordon, J. I., and Knight, R. (2009). Bacterial community variation in human body habitats across space and time. Science 326, 1694–1697. doi: 10.1126/science.1177486
Curran, A. M., Rabin, S. I., Prada, P. A., and Furton, K. G. (2005). Comparison of the volatile organic compounds present in human odor using Spme-GC/MS. J. Chem. Ecol. 31, 1607–1619. doi: 10.1007/s10886-005-5801-4
Curran, A. M., Ramirez, C. F., Schoon, A. A., and Furton, K. G. (2007). The frequency of occurrence and discriminatory power of compounds found in human scent across a population determined by SPME-GC/MS. J. Chromatogr. B 846, 86–97. doi: 10.1016/j.jchromb.2006.08.039
Cuzuel, V., Leconte, R., Cognon, G., Thiebaut, D., Vial, J., Sauleau, C., et al. (2018). Human odor and forensics: towards Bayesian suspect identification using GCxGC-MS characterization of hand odor. J. Chromatogr. B 1092, 379–385. doi: 10.1016/j.jchromb.2018.06.018
de Groot, J. H., Smeets, M. A., Kaldewaij, A., Duijndam, M. J., and Semin, G. R. (2012). Chemosignals communicate human emotions. Psychol. Sci. 23, 1417–1424. doi: 10.1177/0956797612445317
Drabinska, N., Flynn, C., Ratcliffe, N., Belluomo, I., Myridakis, A., Gould, O., et al. (2021). A literature survey of all volatiles from healthy human breath and bodily fluids: the human volatilome. J. Breath Res. 15:034001. doi: 10.1088/1752-7163/abf1d0
Duffy, E., Albero, G., and Morrin, A. (2018). Headspace solid-phase microextraction gas chromatography-mass spectrometry analysis of scent profiles from human skin. Cosmetics 5:62. doi: 10.3390/cosmetics5040062
Earth Microbiome - Protocols and Standards. (2022) Available at: https://earthmicrobiome.org/protocols-and-standards/16s/ (Accessed January 25, 2022).
Engel, W., Bahr, W., and Schieberle, P. (1999). Solvent assisted flavour evaporation – a new and versatile technique for the careful and direct isolation of aroma compounds from complex food matrices. Eur. Food Res. Technol. 209, 237–241. doi: 10.1007/s002170050486
European Commission Database for Information on Cosmetic Substances and Ingredients. (2022). Available at: https://ec.europa.eu/growth/tools-databases/cosing/ (Accessed January 20, 2022).
Ferdenzi, C., Richard Ortegon, S., Delplanque, S., Baldovini, N., and Bensafi, M. (2020). Interdisciplinary challenges for elucidating human olfactory attractiveness. Philos. Trans. R. Soc. Lond. Ser. B Biol. Sci. 375:20190268. doi: 10.1098/rstb.2019.0268
Ferdenzi, C., Schaal, B., and Roberts, S. C. (2010). Family scents: developmental changes in the perception of kin body odor? J. Chem. Ecol. 36, 847–854. doi: 10.1007/s10886-010-9827-x
Fierer, N., Hamady, M., Lauber, C. L., and Knight, R. (2008). The influence of sex, handedness, and washing on the diversity of hand surface bacteria. Proc. Natl. Acad. Sci. U. S. A. 105, 17994–17999. doi: 10.1073/pnas.0807920105
Fredrich, E., Barzantny, H., Brune, I., and Tauch, A. (2013). Daily battle against body odor: towards the activity of the axillary microbiota. Trends Microbiol. 21, 305–312. doi: 10.1016/j.tim.2013.03.002
Gallagher, M., Wysocki, C. J., Leyden, J. J., Spielman, A. I., Sun, X., and Preti, G. (2008). Analyses of volatile organic compounds from human skin. Br. J. Dermatol. 159, 780–791. doi: 10.1111/j.1365-2133.2008.08748.x
Goldenberger, D., Naegele, M., Steffens, D., Eichenberger, R., Egli, A., and Seth-Smith, H. M. B. (2019). Emerging anaerobic and partially acid-fast Lawsonella clevelandensis: extended characterization by antimicrobial susceptibility testing and whole genome sequencing. Clin. Microbiol. Infect. 25, 1447–1448. doi: 10.1016/j.cmi.2019.07.008
Grabowska-Polanowska, B., Miarka, P., Skowron, M., Sułowicz, J., Wojtyna, K., Moskal, K., et al. (2017). Development of sampling method and chromatographic analysis of volatile organic compounds emitted from human skin. Bioanalysis 9, 1465–1475. doi: 10.4155/bio-2017-0128
Greene, R. S., Downing, D. T., Pochi, P. E., and Strauss, J. S. (1970). Anatomical variation in the amount and composition of human skin surface lipid. J. Invest. Dermatol. 54, 240–247. doi: 10.1111/1523-1747.ep12280318
Grice, E. A., Kong, H. H., Renaud, G., Young, A. C., Bouffard, G. G., Blakesley, R. W., et al. (2008). A diversity profile of the human skin microbiota. Genome Res. 18, 1043–1050. doi: 10.1101/gr.075549.107
Grice, E. A., and Segre, J. A. (2011). The skin microbiome. Nat. Rev. Microbiol. 9, 244–253. doi: 10.1038/nrmicro2537
Hara, T., Kyuka, A., and Shimizu, H. (2015). Butane-2,3-dione: the key contributor to axillary and foot odor associated with an acidic note. Chem. Biodivers. 12, 248–258. doi: 10.1002/cbdv.201400272
Hartungen, E., Wisthaler, A., Mikoviny, T., Jaksch, D., Boscaini, E., Dunphy, P. J., et al. (2004). Proton-transfere-reaction mass spectrometry (PTR-MS) of carboxylic acids: determination of Henry's law constants and axillary odour investigations. Int. J. Mass Spectrom. 239, 243–248. doi: 10.1016/j.ijms.2004.09.009
Havlíček, J., Fialová, J., and Roberts, S. C. (2017). “Individual variation in body odor” in Springer Handbook of Odor ed. A. Buettner (Cham: Springer).
Havlicek, J., and Lenochova, P. (2006). The effect of meat consumption on body odor attractiveness. Chem. Senses 31, 747–752. doi: 10.1093/chemse/bjl017
Haze, S., Gozu, Y., Nakamura, S., Kohno, Y., Sawano, K., Ohta, H., et al. (2001). 2-Nonenal newly found in human body odor tends to increase with aging. J. Invest. Dermatol. 116, 520–524. doi: 10.1046/j.0022-202x.2001.01287.x
Hierl, K., Croy, I., and Schäfer, L. (2021). Body odours sampled at different body sites in infants and mothers—a comparison of olfactory perception. Brain Sci. 11:820. doi: 10.3390/brainsci11060820
Huang, W., Sun, D., Chen, L., and An, Y. (2021). Integrative analysis of the microbiome and metabolome in understanding the causes of sugarcane bitterness. Sci. Rep. 11:6024. doi: 10.1038/s41598-021-85433-w
Jaiswal, S. K., Agarwal, S. M., Thodum, P., and Sharma, V. K. (2021). SkinBug: an artificial intelligence approach to predict human skin microbiome-mediated metabolism of biotics and xenobiotics. iScience 24:101925. doi: 10.1016/j.isci.2020.101925
James, A. G., Austin, C. J., Cox, D. S., Taylor, D., and Calvert, R. (2013). Microbiological and biochemical origins of human axillary odour. FEMS Microbiol. Ecol. 83, 527–540. doi: 10.1111/1574-6941.12054
Knight, R., Vrbanac, A., Taylor, B. C., Aksenov, A., Callewaert, C., Debelius, J., et al. (2018). Best practices for analysing microbiomes. Nat. Rev. Microbiol. 16, 410–422. doi: 10.1038/s41579-018-0029-9
Kolbaum, A. E., Jaeger, A., Ptok, S., Sarvan, I., Greiner, M., and Lindtner, O. (2022). Collection of occurrence data in foods – the value of the BfR MEAL study in addition to the national monitoring for dietary exposure assessment. Food Chem. X 13, 100240–100210. doi: 10.1016/j.fochx.2022.100240
Kováts, E. (1958). Gas-chromatographische charakterisierung organischer verbindungen. Teil 1: retentionsindices aliphatischer halogenide, alkohole, aldehyde und ketone. Helv. Chim. Acta 41, 1915–1932. doi: 10.1002/hlca.19580410703
Kusano, M., Mendez, E., and Furton, K. G. (2013). Comparison of the volatile organic compounds from different biological specimens for profiling potential*: VOC COMPARISONS FOR PROFILING POTENTIAL. J. Forensic Sci. 58, 29–39. doi: 10.1111/j.1556-4029.2012.02215.x
Lam, T. H., Verzotto, D., Brahma, P., Ng, A. H. Q., Hu, P., Schnell, D., et al. (2018). Understanding the microbial basis of body odor in pre-pubescent children and teenagers. Microbiome 6:213. doi: 10.1186/s40168-018-0588-z
Leyden, J. J., McGinley, K. J., Hölzle, E., Labows, J. N., and Kligman, A. M. (1981). The microbiology of the human axilla and its relationship to axillary odor. J. Invest. Dermatol. 77, 413–416. doi: 10.1111/1523-1747.ep12494624
Liu, R., and Mabury, S. A. (2019). Unexpectedly high concentrations of 2,4-di-tert-butylphenol in human urine. Environ. Pollut. 252, 1423–1428. doi: 10.1016/j.envpol.2019.06.077
Lommen, A. (2009). MetAlign: Interface-driven, versatile metabolomics tool for hyphenated full-scan mass spectrometry data Preprocessing. Anal. Chem. 81, 3079–3086. doi: 10.1021/ac900036d
Lubke, K. T., and Pause, B. M. (2015). Always follow your nose: the functional significance of social chemosignals in human reproduction and survival. Horm. Behav. 68, 134–144. doi: 10.1016/j.yhbeh.2014.10.001
Lundberg, S. M., Erion, G., Chen, H., DeGrave, A., Prutkin, J. M., Nair, B., et al. (2020). From local explanations to global understanding with explainable AI for trees. Nat. Mach, Intell. 2, 56–67. doi: 10.1038/s42256-019-0138-9
Mandal, S., Van Treuren, W., White, R. A., Eggesbø, M., Knight, R., and Peddada, S. D. (2015). Analysis of composition of microbiomes: a novel method for studying microbial composition. Microb. Ecol. Health Dis. 26, 1–7. doi: 10.3402/mehd.v26.27663
Martin, H. J., Reynolds, J. C., Riazanskaia, S., and Thomas, C. L. P. (2014). High throughput volatile fatty acid skin metabolite profiling by thermal desorption secondary electrospray ionisation mass spectrometry. Analyst 139, 4279–4286. doi: 10.1039/C4AN00134F
Martin, A., Saathoff, M., Kuhn, F., Max, H., Terstegen, L., and Natsch, A. (2010). A functional ABCC11 allele is essential in the biochemical formation of human axillary odor. J. Invest. Dermatol. 130, 529–540. doi: 10.1038/jid.2009.254
Martín-Fernández, J. A. (2003). Dealing with zeros and missing values in compositional data sets using nonparametric imputation. Math. Geol. 35, 253–278. doi: 10.1023/A:1023866030544
McMillan, A., Rulisa, S., Sumarah, M., Macklaim, J. M., Renaud, J., Bisanz, J. E., et al. (2015). A multi-platform metabolomics approach identifies highly specific biomarkers of bacterial diversity in the vagina of pregnant and non-pregnant women. Sci. Rep. 5:14174. doi: 10.1038/srep14174
Meisel, J. S., Hannigan, G. D., Tyldsley, A. S., SanMiguel, A. J., Hodkinson, B. P., Zheng, Q., et al. (2016). Skin microbiome surveys are strongly influenced by experimental design. J. Invest. Dermatol. 136, 947–956. doi: 10.1016/j.jid.2016.01.016
Meister, L., and Pause, B. M. (2021). It's trust or risk? Chemosensory anxiety signals affect bargaining in women. Biol. Psychol. 162:108114. doi: 10.1016/j.biopsycho.2021.108114
Mochalski, P., King, J., Unterkofler, K., Hinterhuber, H., and Amann, A. (2014). Emission rates of selected volatile organic compounds from skin of healthy volunteers. J. Chromatogr. B 959, 62–70. doi: 10.1016/j.jchromb.2014.04.006
Morton, J. T., Aksenov, A. A., Nothias, L. F., Foulds, J. R., Quinn, R. A., Badri, M. H., et al. (2019). Learning representations of microbe–metabolite interactions. Nat. Methods 16, 1306–1314. doi: 10.1038/s41592-019-0616-3
Namdari, S., Nicholson, T., Abboud, J., Lazarus, M., Ramsey, M. L., Williams, G., et al. (2020). Cutibacterium acnes is less commonly identified by next-generation sequencing than culture in primary shoulder surgery. Shoulder Elbow 12, 170–177. doi: 10.1177/1758573219842160
O'Callaghan, S., De Souza, D. P., Isaac, A., Wang, Q., Hodkinson, L., Olshansky, M., et al. (2012). PyMS: a python toolkit for processing of gas chromatography-mass spectrometry (GC-MS) data. Application and comparative study of selected tools. BMC Bioinform. 13:115. doi: 10.1186/1471-2105-13-115
Olsson, M. J., Lundstrom, J. N., Kimball, B. A., Gordon, A. R., Karshikoff, B., Hosseini, N., et al. (2014). The scent of disease: human body odor contains an early chemosensory cue of sickness. Psychol. Sci. 25, 817–823. doi: 10.1177/0956797613515681
Pani, O. (2006). Comprehensive two-dimensional gas chromatography (GC×GC) in environmental analysis and monitoring. Anal. Bioanal. Chem. 386, 1013–1023. doi: 10.1007/s00216-006-0568-1
Pause, B. M. (2017). “Human chemosensory communication” in Springer Handbook of Odor ed. A. Buettner (Cham: Springer).
Penn, D. J., Oberzaucher, E., Grammer, K., Fischer, G., Soini, H. A., Wiesler, D., et al. (2007). Individual and gender fingerprints in human body odour. J. R. Soc. Interface 4, 331–340. doi: 10.1098/rsif.2006.0182
Picardo, M., Ottaviani, M., Camera, E., and Mastrofrancesco, A. (2009). Sebaceous gland lipids. Dermato Endocrinol. 1, 68–71. doi: 10.4161/derm.1.2.8472
Preti, G., Cutler, W. B., Christensen, C. M., Lawley, H., Huggins, G. R., and Garcia, C.-R. (1987). Human axillary extracts: analysis of compounds from samples which influence menstrual timing. J. Chem. Ecol. 13, 717–731. doi: 10.1007/BF01020154
Quast, C., Pruesse, E., Yilmaz, P., Gerken, J., Schweer, T., Yarza, P., et al. (2013). The SILVA ribosomal RNA gene database project: improved data processing and web-based tools. Nucleic Acids Res. 41, D590–D596. doi: 10.1093/nar/gks1219
Ranjan, R., Rani, A., Metwally, A., McGee, H. S., and Perkins, D. L. (2016). Analysis of the microbiome: advantages of whole genome shotgun versus 16S amplicon sequencing. Biochem. Biophys. Res. Commun. 469, 967–977. doi: 10.1016/j.bbrc.2015.12.083
Rathinamoorthy, R., and Thilagavathi, G. (2016). GC-MS analysis of worn textile for odour formation. Fibers Polym. 17, 917–924. doi: 10.1007/s12221-016-5891-3
Roberts, S. C., Havlicek, J., and Schaal, B. (2020). Human olfactory communication: current challenges and future prospects. Philos. Trans. R. Soc. Lond. Ser. B Biol. Sci. 375:20190258. doi: 10.1098/rstb.2019.0258
Robinson, M. D., De Souza, D. P., Keen, W., Saunders, E. C., McConville, M. J., Speed, T. P., et al. (2007). A dynamic programming approach for the alignment of signal peaks in multiple gas chromatography-mass spectrometry experiments. BMC Bioinform. 8:419. doi: 10.1186/1471-2105-8-419
Savitzky, A., and Golay, M. J. E. (1964). Smoothing and differentiation of data by simplified least squares procedures. Anal. Chem. 36, 1627–1639. doi: 10.1021/ac60214a047
Schaal, B., Saxton, T. K., Loos, H., Soussignan, R., and Durand, K. (2020). Olfaction scaffolds the developing human from neonate to adolescent and beyond. Philos. Trans. R. Soc. Lond. Ser. B Biol. Sci. 375:20190261. doi: 10.1098/rstb.2019.0261
Schafer, L., Sorokowska, A., Weidner, K., and Croy, I. (2020). Children's body Odors: hints to the development status. Front. Psychol. 11:320. doi: 10.3389/fpsyg.2020.00320
Shannon, C. E. (1948). A mathematical theory of communication. Bell Syst. Tech. J. 27, 379–423. doi: 10.1002/j.1538-7305.1948.tb01338.x
Sinclair, E., Walton-Doyle, C., Sarkar, D., Hollywood, K. A., Milne, J., Lim, S. H., et al. (2021). Validating differential volatilome profiles in Parkinson's disease. ACS Cent. Sci. 7, 300–306. doi: 10.1021/acscentsci.0c01028
Smeets, M. A. M., Rosing, E. A. E., Jacobs, D. M., van Velzen, E., Koek, J. H., Blonk, C., et al. (2020). Chemical fingerprints of emotional body odor. Meta 10:84. doi: 10.3390/metabo10030084
Song, S. J., Lauber, C., Costello, E. K., Lozupone, C. A., Humphrey, G., Berg-Lyons, D., et al. (2013). Cohabiting family members share microbiota with one another and with their dogs. elife 2:e00458. doi: 10.7554/eLife.00458
Starkenmann, C. (2017). “Analysis and chemistry of human odors” in Springer Handbook of Odor ed. A. Buettner (Cham: Springer)
Steglińska, A., Jachowicz, A., Szulc, J., Adamiak, J., Otlewska, A., Pielech-Przybylska, K., et al. (2019). Factors influencing microbiological biodiversity of human foot skin. Int. J. Env. Res. Public Health 16:3503. doi: 10.3390/ijerph16183503
Tavares, D. S., Mesquita, P. R. R., Salgado, V. R., Rodrigues, F. D. M., Miranda, J. C., Barral-Netto, M., et al. (2019). Determination and profiling of human skin Odors using hair samples. Molecules 24:2964. doi: 10.3390/molecules24162964
Trivedi, D. K., Sinclair, E., Xu, Y., Sarkar, D., Walton-Doyle, C., Liscio, C., et al. (2019). Discovery of volatile biomarkers of Parkinson’s disease from sebum. ACS Cent. Sci. 5, 599–606. doi: 10.1021/acscentsci.8b00879
Troccaz, M., Gaïa, N., Beccucci, S., Schrenzel, J., Cayeux, I., Starkenmann, C., et al. (2015). Mapping axillary microbiota responsible for body odours using a culture-independent approach. Microbiome 3:3. doi: 10.1186/s40168-014-0064-3
Uebi, T., Hariyama, T., Suzuki, K., Kanayama, N., Nagata, Y., Ayabe-Kanamura, S., et al. (2019). Sampling, identification and sensory evaluation of odors of a newborn baby’s head and amniotic fluid. Sci. Rep. 9:12759. doi: 10.1038/s41598-019-49137-6
Vaglio, S., Minicozzi, P., Bonometti, E., Mello, G., and Chiarelli, B. (2009). Volatile signals during pregnancy: a possible chemical basis for mother–infant recognition. J. Chem. Ecol. 35, 131–139. doi: 10.1007/s10886-008-9573-5
Vallat, R. (2018). Pingouin: statistics in python. J. Open Source Soft. 3:1026. doi: 10.21105/joss.01026
Vautz, W., Seifert, L., Mohammadi, M., Klinkenberg, I. A. G., and Liedtke, S. (2020). Detection of axillary perspiration metabolites using ion mobility spectrometry coupled to rapid gas chromatography. Anal. Bioanal. Chem. 412, 223–232. doi: 10.1007/s00216-019-02262-7
Waskom, M. (2021). seaborn: statistical data visualization. J. Open Source Soft. 6:3021. doi: 10.21105/joss.03021
Winnike, J. H., Wei, X., Knagge, K. J., Colman, S. D., Gregory, S. G., and Zhang, X. (2015). Comparison of GC-MS and GC×GC-MS in the analysis of human serum samples for biomarker discovery. J. Proteome Res. 14, 1810–1817. doi: 10.1021/pr5011923
Wisthaler, A., and Weschler, C. J. (2010). Reactions of ozone with human skin lipids: sources of carbonyls, dicarbonyls, and hydroxycarbonyls in indoor air. Proc. Natl. Acad. Sci. U. S. A. 107, 6568–6575. doi: 10.1073/pnas.0904498106
Yeoman, C. J., Thomas, S. M., Miller, M. E. B., Ulanov, A. V., Torralba, M., Lucas, S., et al. (2013). A multi-omic systems-based approach reveals metabolic markers of bacterial vaginosis and insight into the disease. PLoS One 8:e56111. doi: 10.1371/journal.pone.0056111
Zeng, X.-N., Leyden, J. J., Lawley, H. J., Sawano, K., Nohara, I., and Preti, G. (1991). Analysis of characteristic odors from human male axillae. J. Chem. Ecol. 17, 1469–1492. doi: 10.1007/BF00983777
Keywords: body odor, multi-omic analyses, chemical communication, neck, axilla, gas chromatography–mass spectrometry
Citation: Haertl T, Owsienko D, Schwinn L, Hirsch C, Eskofier BM, Lang R, Wirtz S and Loos HM (2023) Exploring the interrelationship between the skin microbiome and skin volatiles: A pilot study. Front. Ecol. Evol. 11:1107463. doi: 10.3389/fevo.2023.1107463
Edited by:
Niels Verhulst, University of Zurich, SwitzerlandReviewed by:
Alicia Showering, University of London, United KingdomCopyright © 2023 Haertl, Owsienko, Schwinn, Hirsch, Eskofier, Lang, Wirtz and Loos. This is an open-access article distributed under the terms of the Creative Commons Attribution License (CC BY). The use, distribution or reproduction in other forums is permitted, provided the original author(s) and the copyright owner(s) are credited and that the original publication in this journal is cited, in accordance with accepted academic practice. No use, distribution or reproduction is permitted which does not comply with these terms.
*Correspondence: Helene M. Loos, ✉ aGVsZW5lLmxvb3NAZmF1LmRl
†These authors have contributed equally to this work and share first authorship
Disclaimer: All claims expressed in this article are solely those of the authors and do not necessarily represent those of their affiliated organizations, or those of the publisher, the editors and the reviewers. Any product that may be evaluated in this article or claim that may be made by its manufacturer is not guaranteed or endorsed by the publisher.
Research integrity at Frontiers
Learn more about the work of our research integrity team to safeguard the quality of each article we publish.