- 1College of Forestry and Landscape Architecture, South China Agricultural University, Guangzhou, Guangdong, China
- 2School of Ecology and Nature Conservation, Beijing Forestry University, Beijing, China
Forests in urban areas provide great healthcare benefits to citizens, but it is less well known whether this benefit is related to different geographical spaces. We selected exurban forest, suburban forest, downtown forest, and urban control in Guangzhou, China to analyze the change characteristics of negative air ion concentration (NAIC), air oxygen content (AOC), and human comfort index (HCI). Based on Criteria Importance Through Intercriteria Correlation (CRITIC) method, the urban forest comprehensive healthcare index (UFCHI) was established. Finally, the evaluation criteria for UFCHI were identified by cluster analysis. The results demonstrated that (1) The NAIC in exurban forest (2,713 ± 1,573 ions/cm3) and suburban forest (2,147 ± 923 ions/cm3) was evidently better than downtown forest (1,130 ± 255 ions/cm3) and urban control (531 ± 162 ions/cm3). (2) The AOC was in the order of exurban forest (21.17 ± 0.38%) > suburban forest (21.13 ± 0.30%) > downtown forest (21.10 ± 0.16%) > urban control (20.98 ± 0.12%). (3) The HCI in urban control (5.56 ± 2.32) and downtown forest (5.15 ± 1.80) is higher than suburban forest (4.02 ± 1.53) and exurban forest (3.71 ± 1.48). (4) The UFCHI in exurban forest (1.000), suburban forest (0.790), and downtown forest (0.378) were beneficial to human health to some extent, while urban control (0.000) was at Level IV, having no healthcare benefit. Except in winter, the UFCHI in exurban forest and suburban forest were all at Level II and above; while downtown forest and urban control were all at Level III and below at all seasons. Overall, urban forests in the exurbs and suburbs have better healthcare benefits than those in the downtowns. Furthermore, it is recommended that urban residents visit exurban and suburban forests for forest therapy in spring, summer, and autumn.
1. Background
The coronavirus disease 2019 (COVID-19) outbreak and spread has taken a toll on human physical and mental health. Adequate studies have manifested that the public may experience mild to severe symptoms of depression, anxiety, fear, confusion, emotional exhaustion, and even post-traumatic stress in the context of the COVID-19 pandemic (Jovarauskaite et al., 2021; Xia et al., 2022). When more risk information of the COVID-19 is released, it makes the citizens more concerned about health, triggering national reflection and awareness on lifestyle and health management, and thus enhancing the willingness of forest therapy tourism (Chae et al., 2021; Cheng and Yin, 2022). Humans have a natural sense of closeness to the forest, and it is thought to be the best place to release stress and relieve fatigue by the medical community (Zhang and Ye, 2022). Forests play a crucial role in sustaining human health and well-being, providing a pleasant climate, fresh air, clean water, and a tranquil environment, among others. Forest therapy has been defined as maintaining and promoting the health of participants by exposing them to the natural environment and utilizing the various healthcare factors therein (Zhang and Ye, 2022). Furthermore, abundant studies have scientifically proven that forest therapy has a positive effect on human physiology and psychology, such as reducing pulse rate and blood pressure, improving the immune system activity, even ameliorating negative emotion, depression and so on (Chae et al., 2021; Kim and Shin, 2021; Zhang and Ye, 2022). There is no doubt that while the COVID-19 pandemic continues, people with low immunity, especially sub-healthy people and the elderly, will be in high demand to upgrade their resistance and immunity, as well as to desire a good ecological environment. As a result, short-term, rational and regular forest therapy activities, or even just exposure to forests will be first choice of the public, and forest therapy will become an inevitable trend of future consumption. In line with this trend, research on forest healthcare factors and the comprehensive evaluation of forest healthcare benefits should be given more attention. So as to find out the suitable site conditions (forest area, stands, surroundings, distance from city center, etc.) and the best time for forest therapy.
Negative air ion concentration is one of the most essential indicators of air quality. Negative air ions plays a paramount role in dust absorption, air quality amelioration, and environmental and human health improvement (Yan et al., 2015; Jiang et al., 2018). As for human health, sufficient studies have reported that favorable effects of negative air ions on the respiratory (Alexander et al., 2013), improving sleep quality (Liu R. et al., 2017) and mood states (Pino and La Ragione, 2013), as well as treating chronic depression (Dauphinais et al., 2012; Bowers et al., 2018). Air oxygen content is also an imperative indicator of the healthcare benefits of forest environment. Oxygen inhalation can boost the body’s metabolism to alleviate symptoms, treat diseases and promote healing (Hong, 2015). The pleasant forest microclimates contribute to human health, which is an invaluable resource for forest therapy tourism. Forest microclimates refer to the human body’s perception of the forest environment’s temperature, relative humidity, wind speed, and other factors, which is frequently measured by human comfort index (Zhu et al., 2021a,b).
The vast majority of investigation on urban forest healthcare benefits has focused on the evaluation and analysis of individual healthcare factors such as negative air ions (Li et al., 2021; Shi et al., 2021), phytoncide (Antonelli et al., 2020; Woo and Lee, 2020), human comfort (Jeong et al., 2016; Rahman et al., 2020) and so on. Only a few scholars, such as Han et al. (2012), Zhao et al. (2019), Wen (2020), Yang et al. (2022), and the team of Cheng Wang (Gu, 2013; Wang et al., 2018), have comprehensively considered the forest healthcare benefits of several indicators such as negative air ion concentration, air oxygen content, human comfort index, airborne particulate matter concentration, airborne bacteria content, noise level, and phytoncide relative content, providing a vital theoretical basis for the study of comprehensive healthcare benefits of forest communities. However, their research chiefly focused on different stands in the same location, and there was a lack of in-depth exploration on comprehensive healthcare benefits of urban forest in different geographical spaces. Moreover, most scholars used subjective experience, Delphi method in combination with the Analytic Hierarchy Process, synthetical index method, or fuzzy comprehensive evaluation method to construct the evaluation models, having strong subjectivity and arbitrariness in determining index weights. Zhang (2014) selected three types of urban forest: country forest, forest park, and community green space, along with an urban center as control group in Hangzhou, and analyzed the change characteristics of four indicators: outdoor comfort index, carbon dioxide concentration, negative air ion concentration and noise, including the correlation of each indicator. His findings provided a crucial theoretical foundation for the study of individual healthcare factors in different geographical locations, but without a comprehensive assessment of their healthcare factors. Additionally, his study only took the proximity to the urban center into consideration and ignored the impact of forest area and surrounding environment on the forest healthcare benefits.
Since the above methods were subjective and random, we innovatively introduced the CRITIC method to objectively determine the weight of indicators and to comprehensively evaluate the forest healthcare benefits from the exurban-suburban-downtown gradients. The existing literature indicated that the entropy method and the CRITIC method were widely applied in the objective weighting of criteria (Krishnan et al., 2021; Sharkasi and Rezakhah, 2022). However, the CRITIC method was found to have additional merit as it takes into account both the contrast intensity and the conflicting relationships held by each decision criterion, which was more objective than the entropy method. Therefore, in this study, three urban forest types and an urban control were selected in different geographical spaces in terms of the distance from city center, forest area, and surrounding environment. Through long-term simultaneous monitoring of negative air ion concentration, air oxygen content, and human comfort index, the CRITIC method was used to determine the objective weights of each index and form the UFCHI in different geographical spaces. Finally, a comprehensive evaluation of healthcare benefits of urban forest from the exurban-suburban-downtown gradients was presented. It is of great theoretical and practical significance for this study, which brings more innovative ideas for building a comprehensive evaluation method for forest healthcare benefits, coupled with imparting theoretical support for site selection and construction of forest therapy bases in Guangdong Province and even the whole country. Meanwhile, it provides a basis for citizens to choose the best season and destination for forest therapy tourism. The scientific problems of this study are: (1) Does the distance from city center, forest area, and surrounding environment have an impact on the comprehensive healthcare benefits of urban forests?, (2) Are the forest healthcare benefits consistent across seasons?, and (3) What seasons are suitable for forest therapy?
2. Materials and methods
2.1. Study area
The study area selection for urban forests in different geographical spaces is principally based on three considerations: the distance from city center, forest area, and surrounding environment. Consequently, urban forest types in different geographical spaces are mainly classified as exurban forest, suburban forest, and downtown forest, while an urban control is set.
2.1.1. Exurban forest
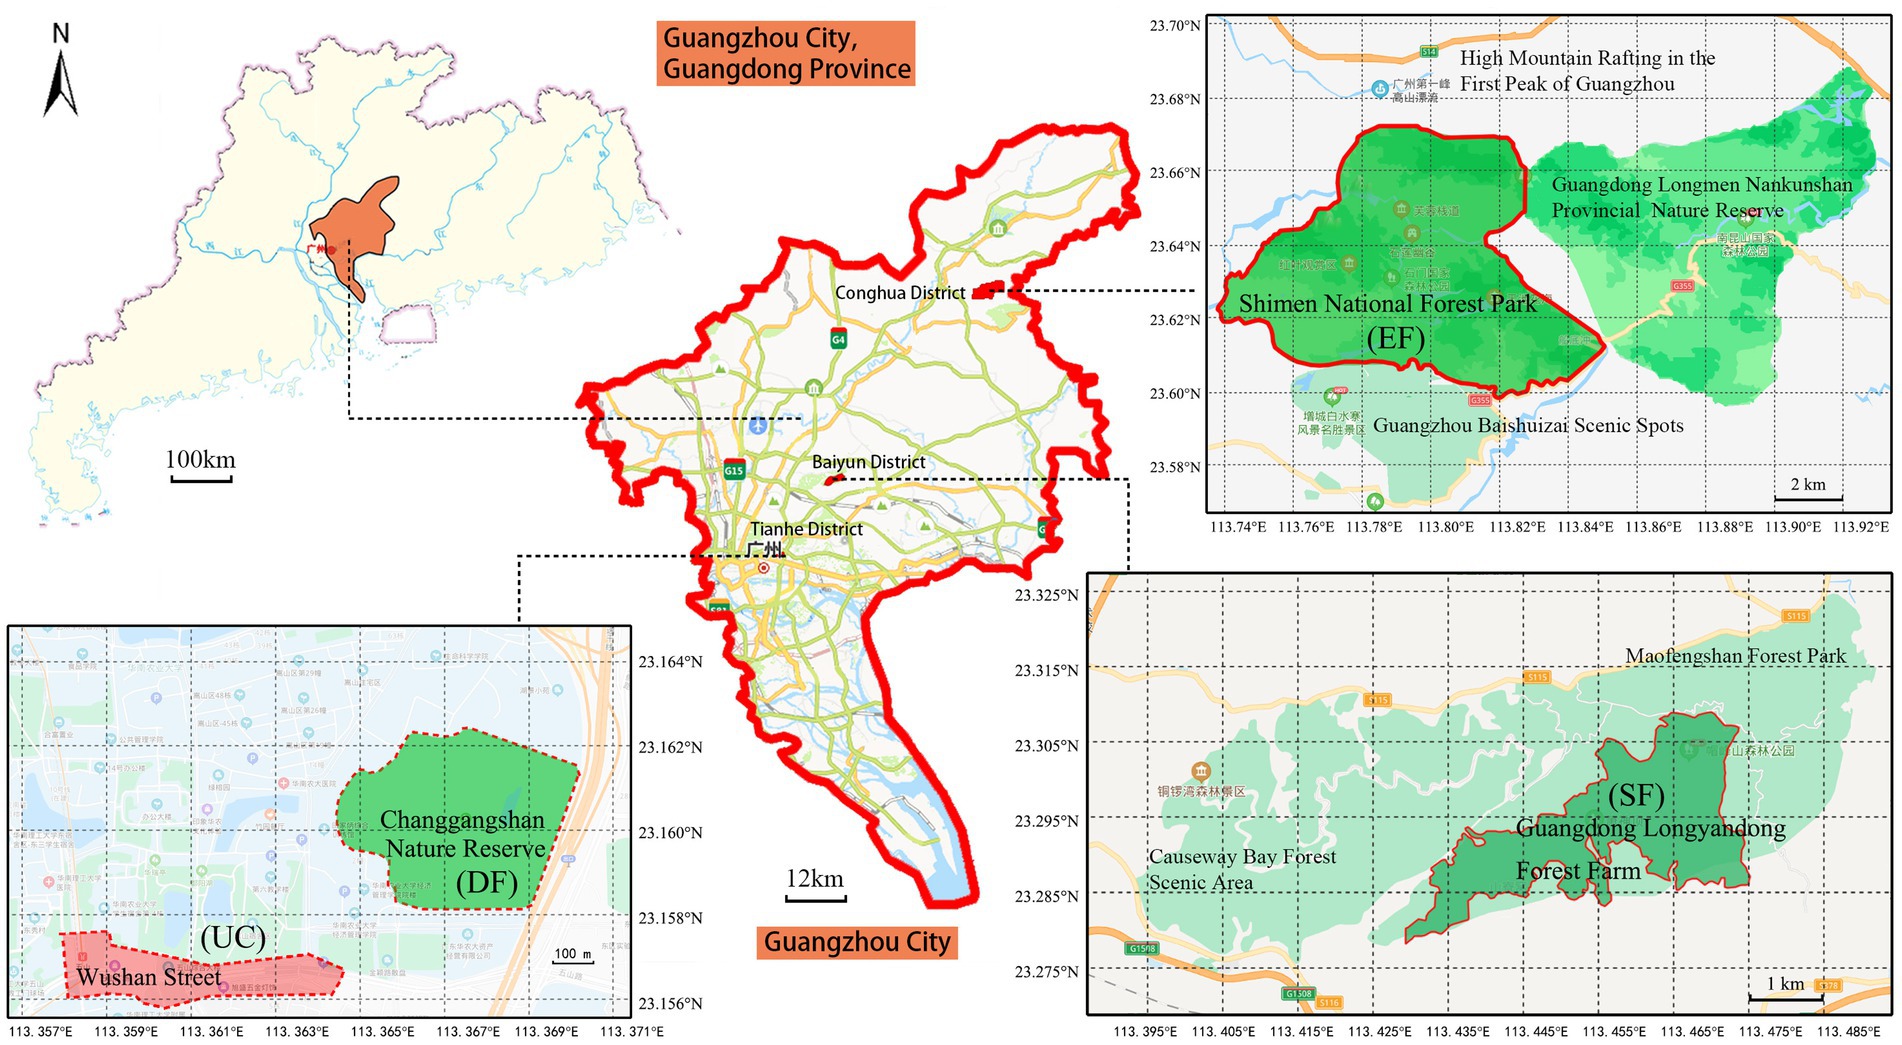
Shimen National Forest Park (23°36′50″N–23°39′20″N, 113°46′16″E–113°49′17″E) is located in the northeast of Conghua District, 95 km away from Guangzhou central city (Wushan Street), which is selected as the study area of exurban forest. It is close to Guangdong Longmen Nankunshan Provincial Nature Reserve and Guangzhou Baishuizai Scenic Spots, and the adjacent forest area is concentrated and contiguous, as shown in Figure 1. Shimen National Forest Park has a total area of 2,636 hm2 with 98.91% forest coverage, and a forest area of 2,607 hm2 with an altitude ranging from 270 m to 1,210 m. It pertains to the south subtropical monsoon climate, with average temperature between 19.5°C and 21.4°C, and an annual average rainfall of about 1,800 mm (Zhu et al., 2021a,b).
2.1.2. Suburban forest
Guangdong Longyandong Forest Farm (23°16′41″N–23°18′31″N, 113°25′44″E–113°28′30″E), situated in the northeast suburb of Baiyun District, Guangzhou City, is 34 km away from Guangzhou central city, as the study area of suburban forest. It is adjacent to Maofengshan Forest Park and Causeway Bay Forest Scenic Area, surrounded by forest environments, as shown in Figure 1. Guangdong Longyandong Forest Farm covers an area of 524 hm2, with a forest coverage of 94.56%, a forest area of 495 hm2, and an altitude of 101–536 m. It has a subtropical maritime monsoon climate with an average rainfall of 1,694 mm and an average temperature of 21°C (Hong et al., 2020).
2.1.3. Downtown forest
Changgangshan Nature Reserve (23°09′29″N–23°09′44″N, 113°21′53″E–113°22′12″E), as the study area of downtown forest, is seated in the campus of South China Agricultural University in Tianhe District, Guangzhou City, Guangdong Province, seeing Figure 1. The total area is about 15 hm2,with 89.47% forest coverage, and the forest area is about 13 hm2, with an altitude of 40–50 m. The shape of Changgangshan Nature Reserve is quadrangular, with one side adjacent to the South China Expressway, and the other three sides surrounded by the campus buildings of South China Agricultural University, forming a small-scale isolated urban forest. It belongs to the subtropical monsoon maritime climate, with an average annual temperature of about 22.6°C and the annual precipitation of about 2,050 mm (Tong and Xiao, 2014).
2.1.4. Urban control
Wushan Street (23°09′22″N–23°09′26″N, 113°21′29″E–113°21′53″E), as the study area of urban control, is located near Wushan Station of Metro Line 3 in Tianhe District, Guangzhou City, Guangdong Province. The street area is long and narrow, with a study area of about 5–6 hm2 and an altitude of about 40 m, as shown in Figure 1. It is surrounded by a commercial area with dense buildings, heavy pedestrian and vehicular traffic, and no vegetation other than trees along the roadside.
2.2. Plot settings
To eliminate the influence of stand factor differences on the experimental results, the stands in this study were all mature plantations with stand ages of 30 years and above, and canopy density between 0.7 and 0.8. Of these, the exurban forest picked Phyllostachys edulis forest and Cunninghamia lanceolata forest, for a total of seven sampling points in Shimen National Forest Park; Castanopsis hystrix forest and Schima superba forest were selected in suburban forest, amounting to six sampling points in Guangdong Longyandong Forest Farm; the downtown forest optioned mixed broadleaf-conifer forest, sum to three sampling points in Changgangshan Nature Reserve. Meanwhile, three sampling points were taken in Wushan Street as urban control for urban circumstances comparative experiment.
2.3. Methods
2.3.1. Observation methods
From September 2019 to January 2020 and from May to August 2020, the field data was measured from the 20th to 30th of each month, where the downtown forest and urban control were experimented commonly on the 20th, 21st, and 22nd; suburban forest was tested primarily on the 23rd, 24th, and 25th; and exurban forest was investigated ordinarily on the 27th, 28th, and 29th. The weather conditions during the sampling period were similar, either sunny or cloudy. Test times were appropriately adjusted for unexpected weather conditions. Three indicators of negative air ion concentration, air oxygen content, and forest microclimates were measured in three urban forest environments and an urban control. The negative air ion concentration was measured at a sampling height of 1.5 m above the ground using a COM-3200PRO II negative air ions monitor produced in Japan. This was repeated 3 times for a total of 12 data. The air oxygen content was measured by a TD6000-SH-O2 oxygen content tester manufactured in China, which was repeated 3 times. Kestrel 5500 hand-held meteorological instrument fabricated in the United States was used to measure forest microclimates, including temperature (T), relative humidity (RH), and wind speed (V), which were each repeated 3 times at a sampling height of 2 m (Zhu et al., 2021a,b).
2.3.2. Specific evaluation methods
2.3.2.1. Negative air ion concentration
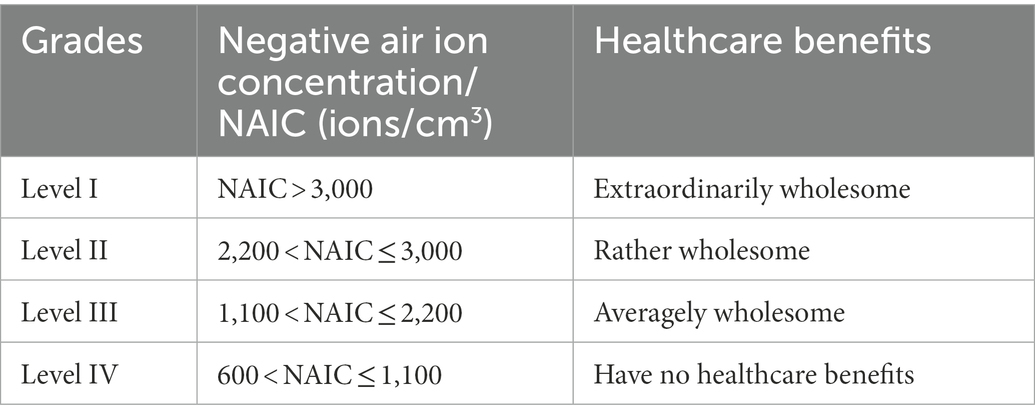
Zhang et al. (2006) collected the data of negative air ions in North China, Northwest China, East China, and South China, and evaluated the healthcare degree of NAIC in forest parks by fuzzy mathematics, which was divided into four grades, as can be seen from Table 1. In accordance with the suitable range of membership degree, the minimum NAIC in forest environment was set at 600 ions/cm3, which was equivalent to that in urban parks and higher than that in residential regions (200–400 ions/cm3).
2.3.2.2. Air oxygen content
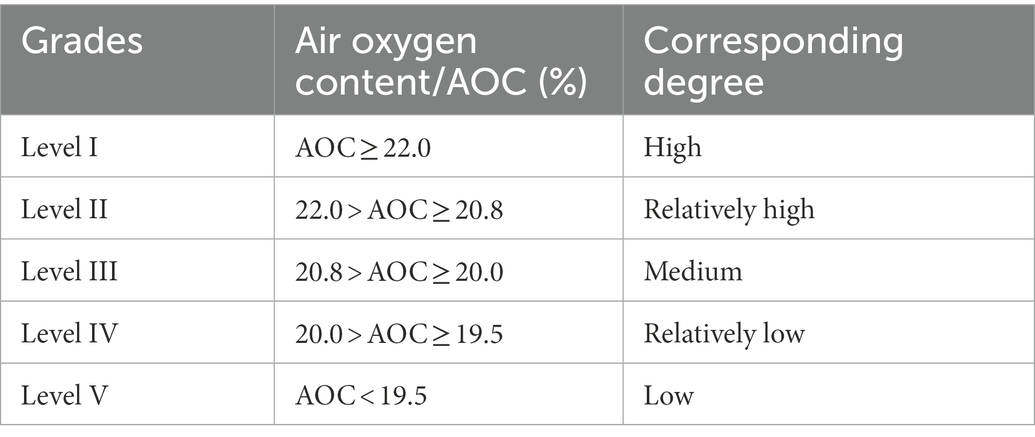
The oxygen enrichment index proposed by Han et al. (2012) was used to appraise the degree of AOC. The higher the AOC, the higher the oxygen enrichment. The evaluation criteria for AOC was as listed in Table 2. Intending to eliminate the influence of altitude on AOC, the measured value was corrected based on the fact that the AOC decreased by 0.16% every 100 m above sea level (Zhao et al., 2012). The correction formula is as shown:
Where C denotes corrected value (%), M indicates measured value (%), A represents altitude (m).
2.3.2.3. Human comfort index
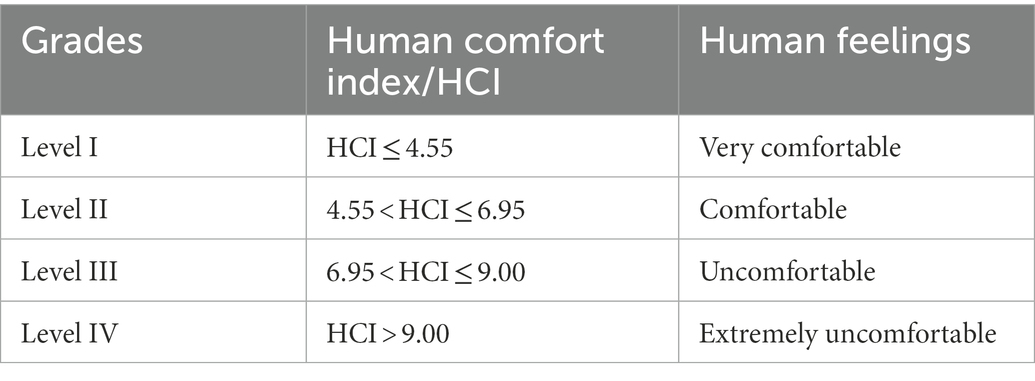
Lu et al. (1984) exploited the relevant data of environmental hygiene methods to comprehensively take account of the impact of temperature, relative humidity and wind speed on HCI, and the evaluation criteria for HCI was given. The lower the HCI value, the higher the comfort level, seeing Table 3. The formula for calculating HCI is as displayed:
In which, HCI stands for human comfort index, T means temperature (°C), RH denotes relative humidity (%), and V implies wind speed (m/s).
2.3.3. Determination of objective weight of each indicator by CRITIC method
The CRITIC method proposed by Diakoulaki et al. (1995) and it is primarily adapted to ascertain the objective weights of criteria, based on the contrast intensity and conflicting relationships of the decision criteria. The CRITIC method uses standard deviation and Pearson correlation to measure the contrast intensity and conflicting relationships of each criterion, respectively (Krishnan et al., 2021). The main steps of this trick can be described as demonstrated:
1. Normalization of each indicator
The above three indicators are classified as positive or negative, depending on the impact of each indicator on environmental quality. Positive indicators signify that the greater the value, the better the healthcare benefits, such as NAIC. In keeping with medical measurements, when the AOC is 20.9%, it is normal; when it is more than 23.5%, it appertains to an oxygen-enriched environment, which is conducive to relieve brain fatigue and ameliorate body function (Hong, 2015). In this study, the AOC in different geographical spaces is below 23.5%, so the AOC can be considered as a positive indicator. The negative indicators reveal that the greater the value, the worse the healthcare benefits. The negative indicator in this study is HCI. In order to bring it into a unified evaluation system for comparison, the range normalization method is adopted for standardization, which is calculated as follows:
where is the normalized score of alternative i with respect to indicator j, is the actual score of alternative i with respect to indicator j, is the maximum score of indicator j, and is the minimum score of indicator j.
2. Calculate the standard deviation of each indicator
where is the mean score of indicator j and n is the total number of alternatives, is the standard deviation of indicator j.
3. Calculate the correlation coefficient of every pair of indicators
where is the correlation coefficient between indicator j and other indicator, is the correlation coefficient between indicator i and j.
4. Compute the information content of each indicator
where denotes the information content of indicator j.
5. Determine the objective weight of each indicator
where reveals the objective weight of indicator j.
2.3.4. Establishing urban forest comprehensive healthcare index in different geographical spaces
The objective weight of each healthcare index was determined by CRITIC method mentioned above (Table 4), thus, the formula of urban forest comprehensive healthcare index (UFCHI for short) in different geographical spaces is shown:
In which, is the normalized value of i-th negative air ion concentration, is the normalized value of i-th air oxygen content. is the normalized value of i-th human comfort index.
2.3.5. Evaluation criteria for UFCHI
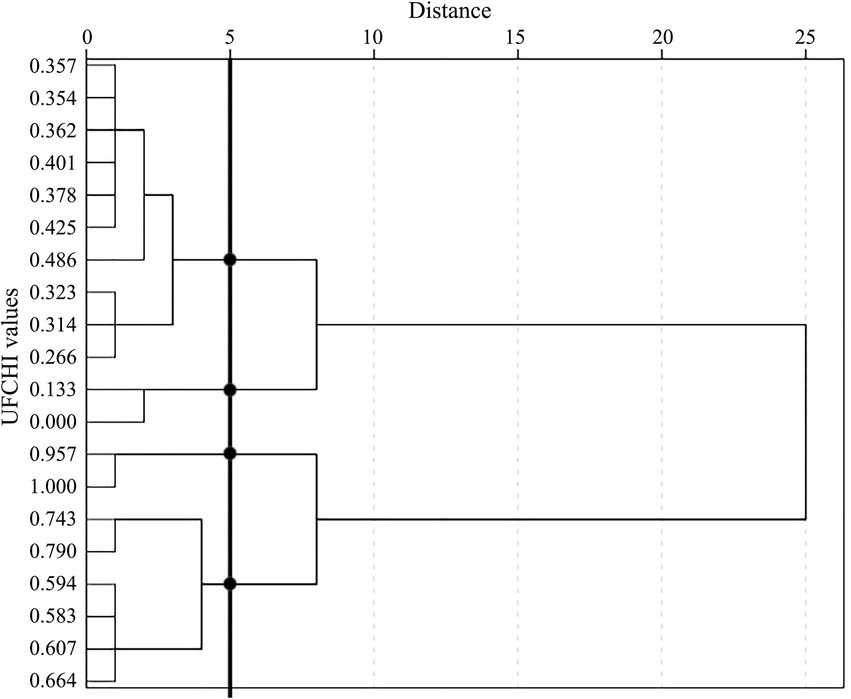
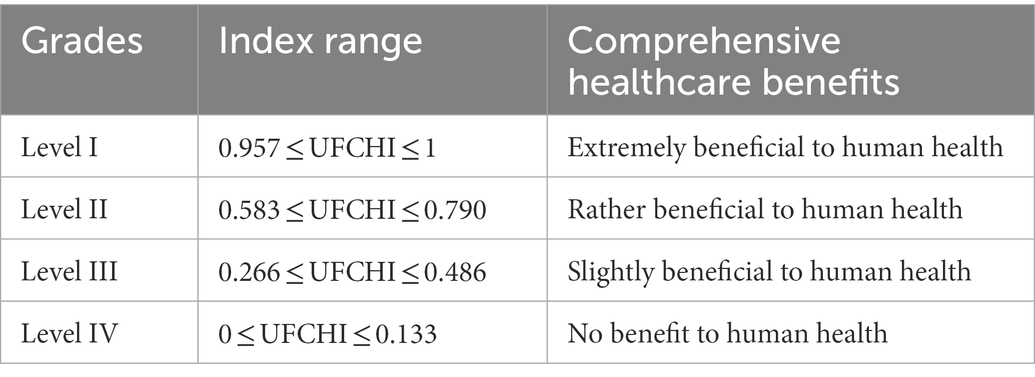
In SPSS22.0, the UFCHI values were systematically clustered using Ward’s method and the squared Euclidean distance, and the UFCHI was divided into four classes based on the results of the cluster analysis, see Figure 2. The integrated healthcare benefits expressed in terms of different numerical intervals were explained in Table 5.
2.3.6. Data processing and analysis
SPSS22.0 was implemented for variance analysis, multiple comparison, CRITIC calculation, and cluster analysis; Origin 2022 was executed to draw the diagram.
3. Results
3.1. Characteristics of NAIC of urban forests in different geographical spaces
It can be seen from Figure 3 that the annual average (±SD) of NAIC of urban forests in different geographical spaces showed extremely significant differences (p = 0.000 < 0.01). The NAIC was as follows: exurban forest (2,713 ± 1,573 ions/cm3) > suburban forest (2,147 ± 923 ions/cm3) > downtown forest (1,130 ± 255 ions/cm3) > urban control (531 ± 162 ions/cm3). As mentioned by the evaluation criteria for NAIC (Table 1), the exurban forest was at Level I with extraordinarily wholesome healthcare benefits; the suburban forest was at Level II with rather wholesome healthcare benefits; the downtown forest was at Level III with averagely wholesome healthcare benefits; while urban control was at Level IV, having no healthcare benefits.
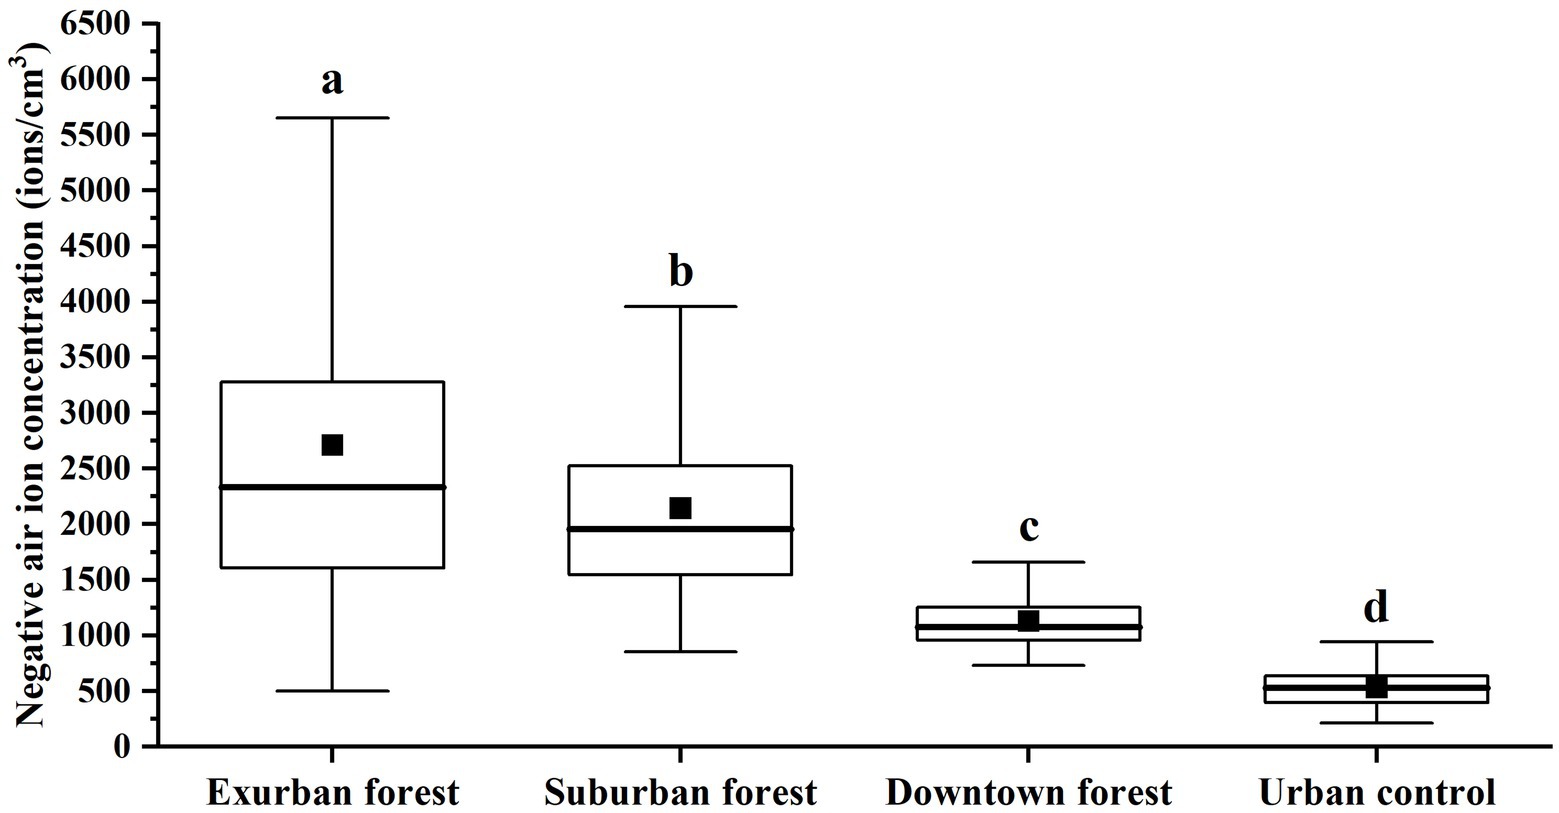
Figure 3. Comparison of annual average of NAIC of urban forests in different geographical spaces. The different lowercase letters indicate significant difference of urban forest in different geographical spaces (p < 0.05).
The mean value of NAIC in exurban forest was: summer (3,688 ± 2,079 ions/cm3) > spring (2,566 ± 913 ions/cm3) > autumn (2,195 ± 989 ions/cm3) > winter (2,099 ± 762 ions/cm3), suburban forest was: summer (2,852 ± 964 ions/cm3) > spring (2,057 ± 620 ions/cm3) > autumn (1,695 ± 490 ions/cm3) > winter (1,480 ± 473 ions/cm3), downtown forest was: autumn (1,298 ± 336 ions/cm3) > winter (1,162 ± 218 ions/cm3) > spring (1,115 ± 122 ions/cm3) > summer (1,009 ± 159 ions/cm3), and urban control was: autumn (646 ± 185 ions/cm3) > winter (606 ± 108 ions/cm3) > spring (513 ± 104 ions/cm3) > summer (428 ± 106 ions/cm3). In general, the seasonal variations of NAIC in exurban forest and suburban forest were summer > spring > autumn > winter, while those in downtown forest and urban control were autumn > winter > spring > summer, as illustrated in Figure 4.
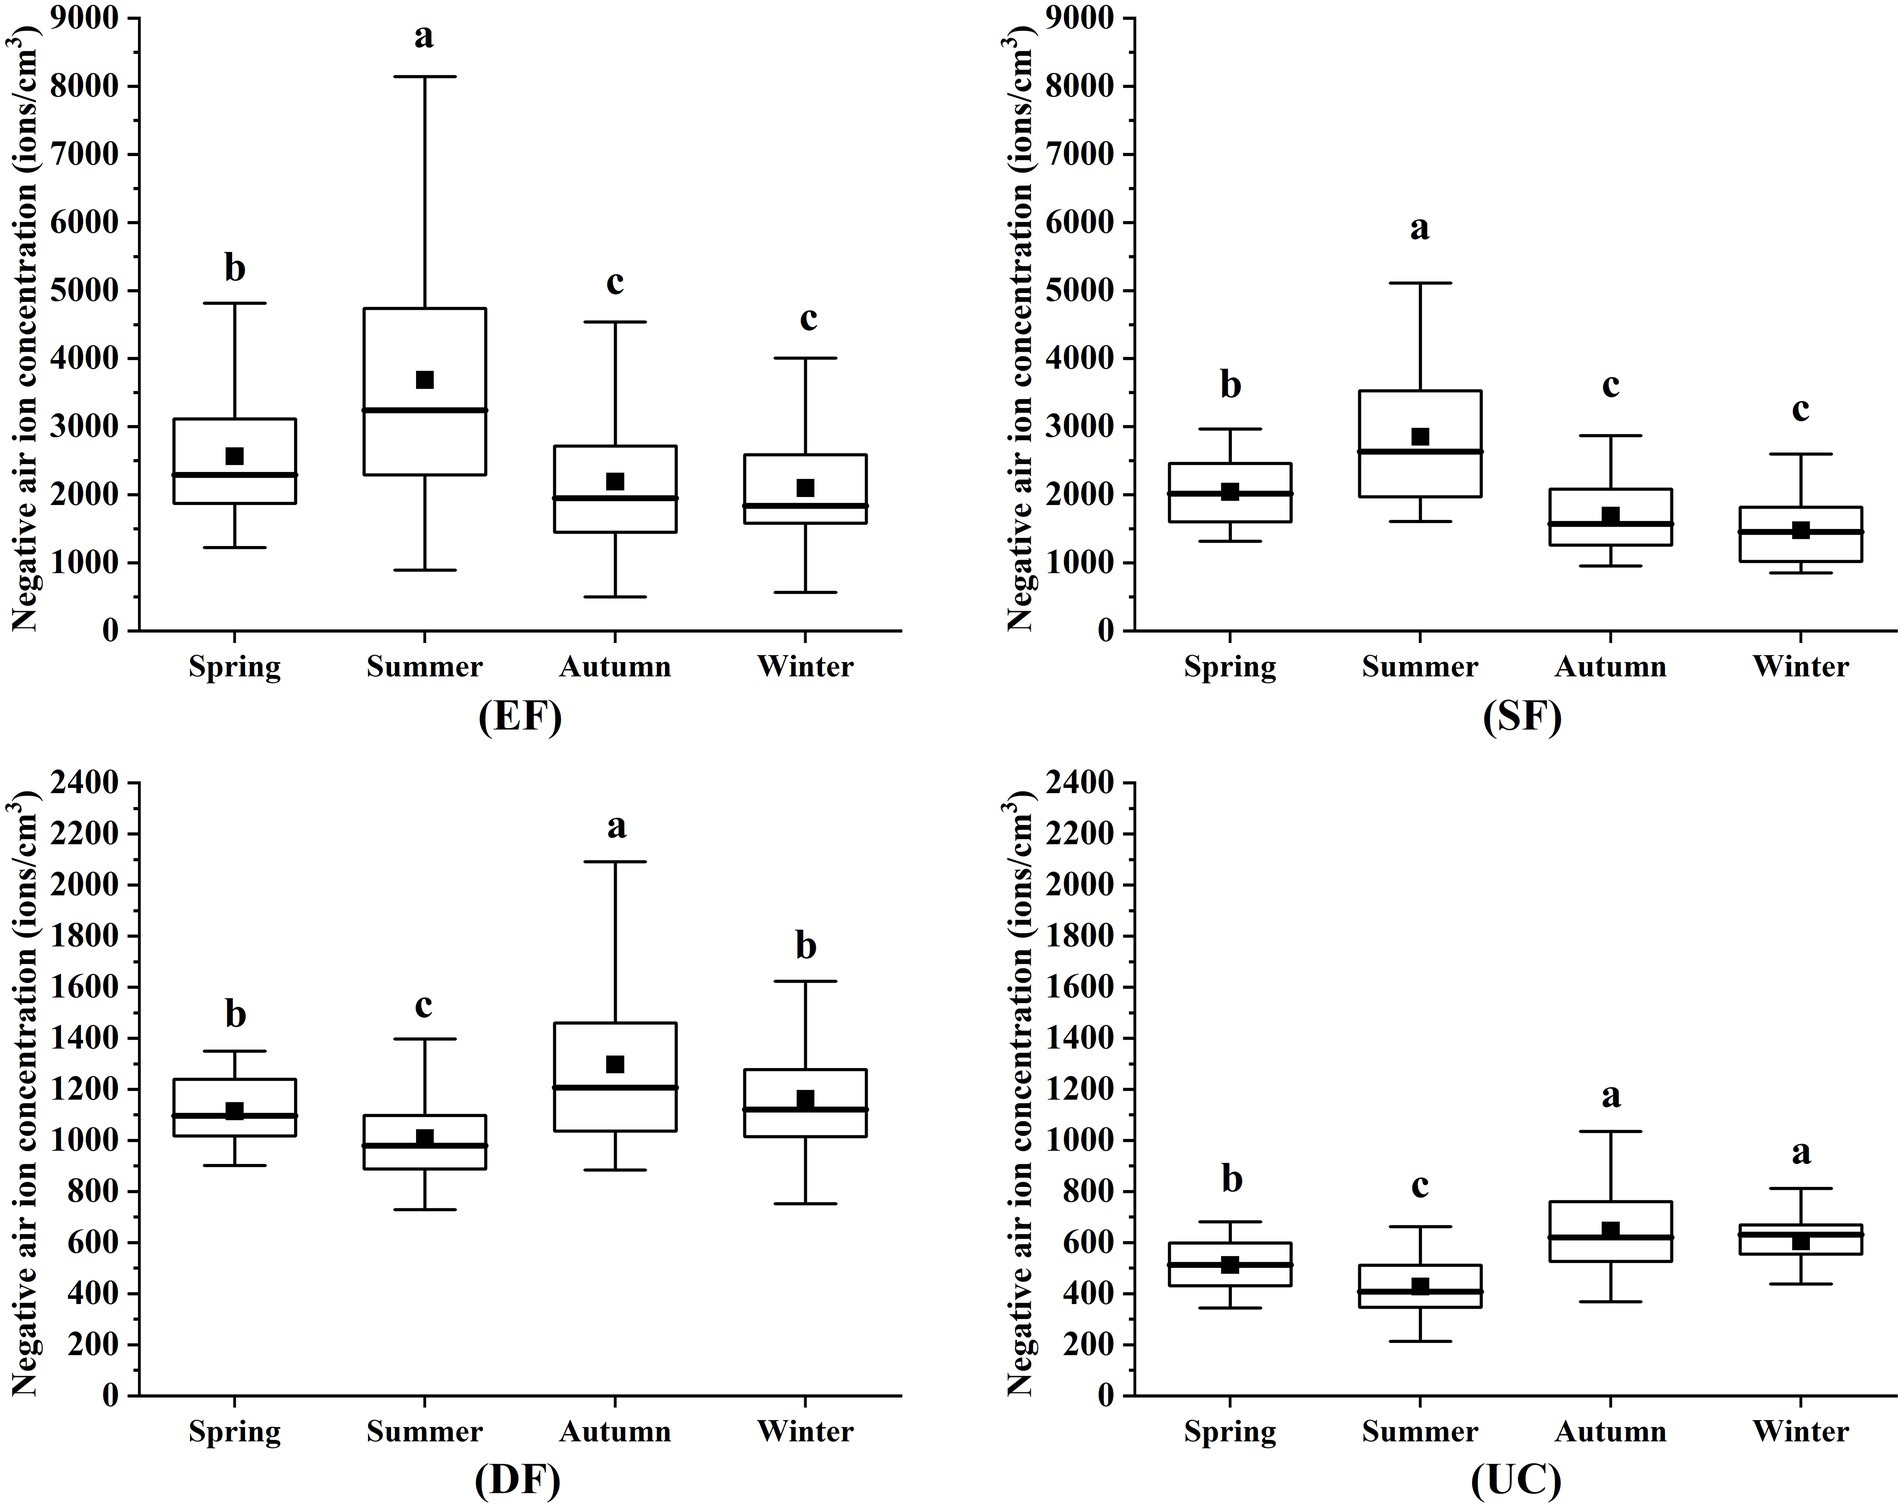
Figure 4. Seasonal variations of NAIC of urban forests in different geographical spaces. EF, Exurban forest; SF, Suburban forest; DF, Downtown forest; UC, Urban control. The different lowercase letters indicate significant difference of each geographical space in different seasons (p < 0.05).
3.2. Characteristics of AOC of urban forests in different geographical spaces
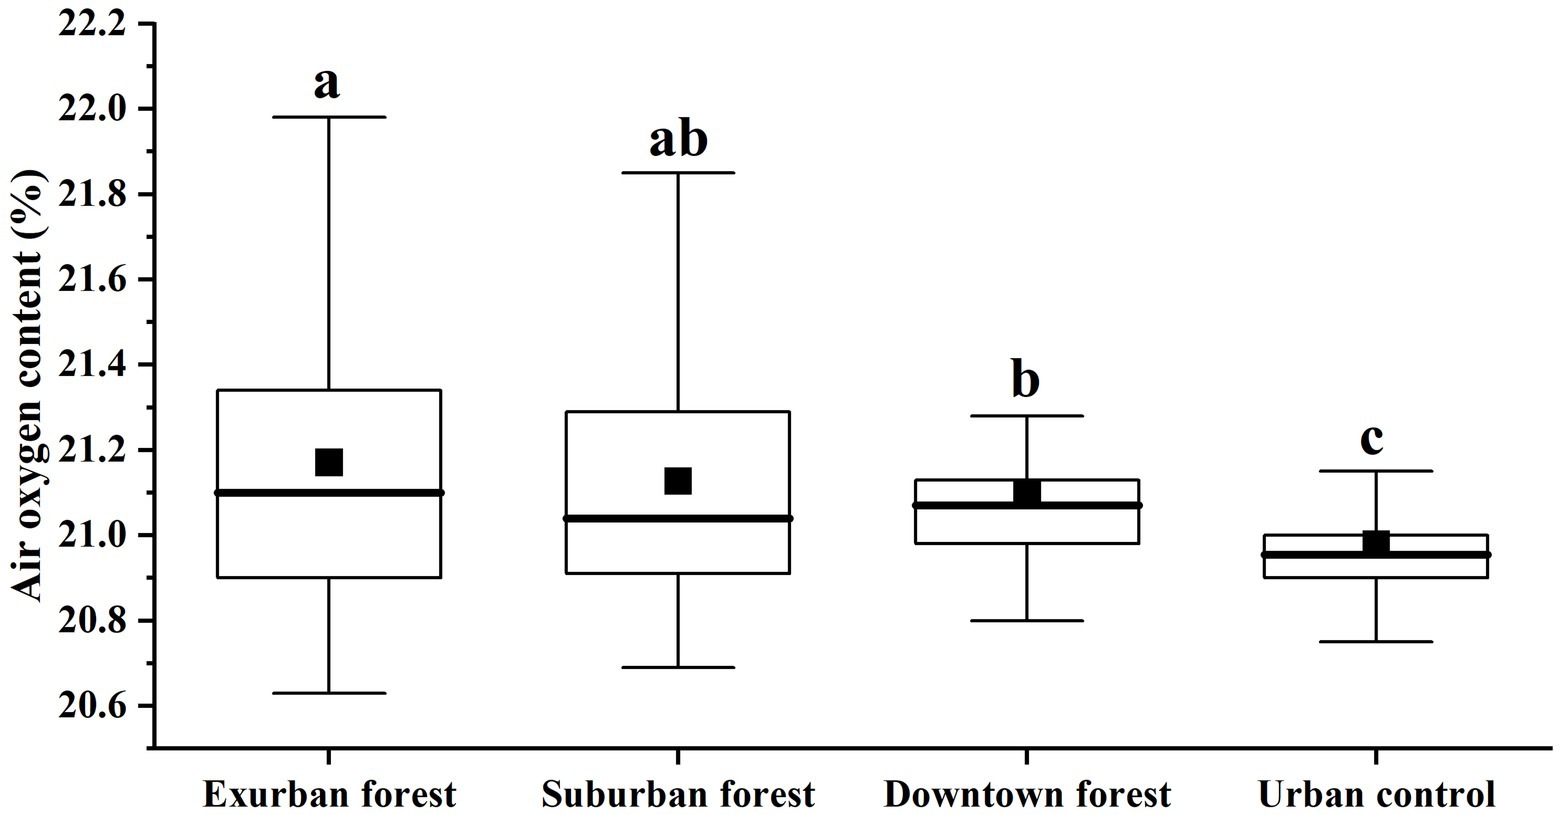
The AOC was corrected on the basis of Eq. 1. Based on variance analysis, the AOC of urban forests in different geographical spaces demonstrated exceedingly significant differences (p = 0.000 < 0.01), see Figure 5. The annual average of AOC was in the order of exurban forest (21.17 ± 0.38%) > suburban forest (21.13 ± 0.30%) > downtown forest (21.10 ± 0.16%) > urban control (20.98 ± 0.12%). As reported by the evaluation criteria for AOC (Table 2), three urban forests and an urban control were all at Level II relatively high degree, and the AOC in forest environment was markedly higher than that in urban environment.
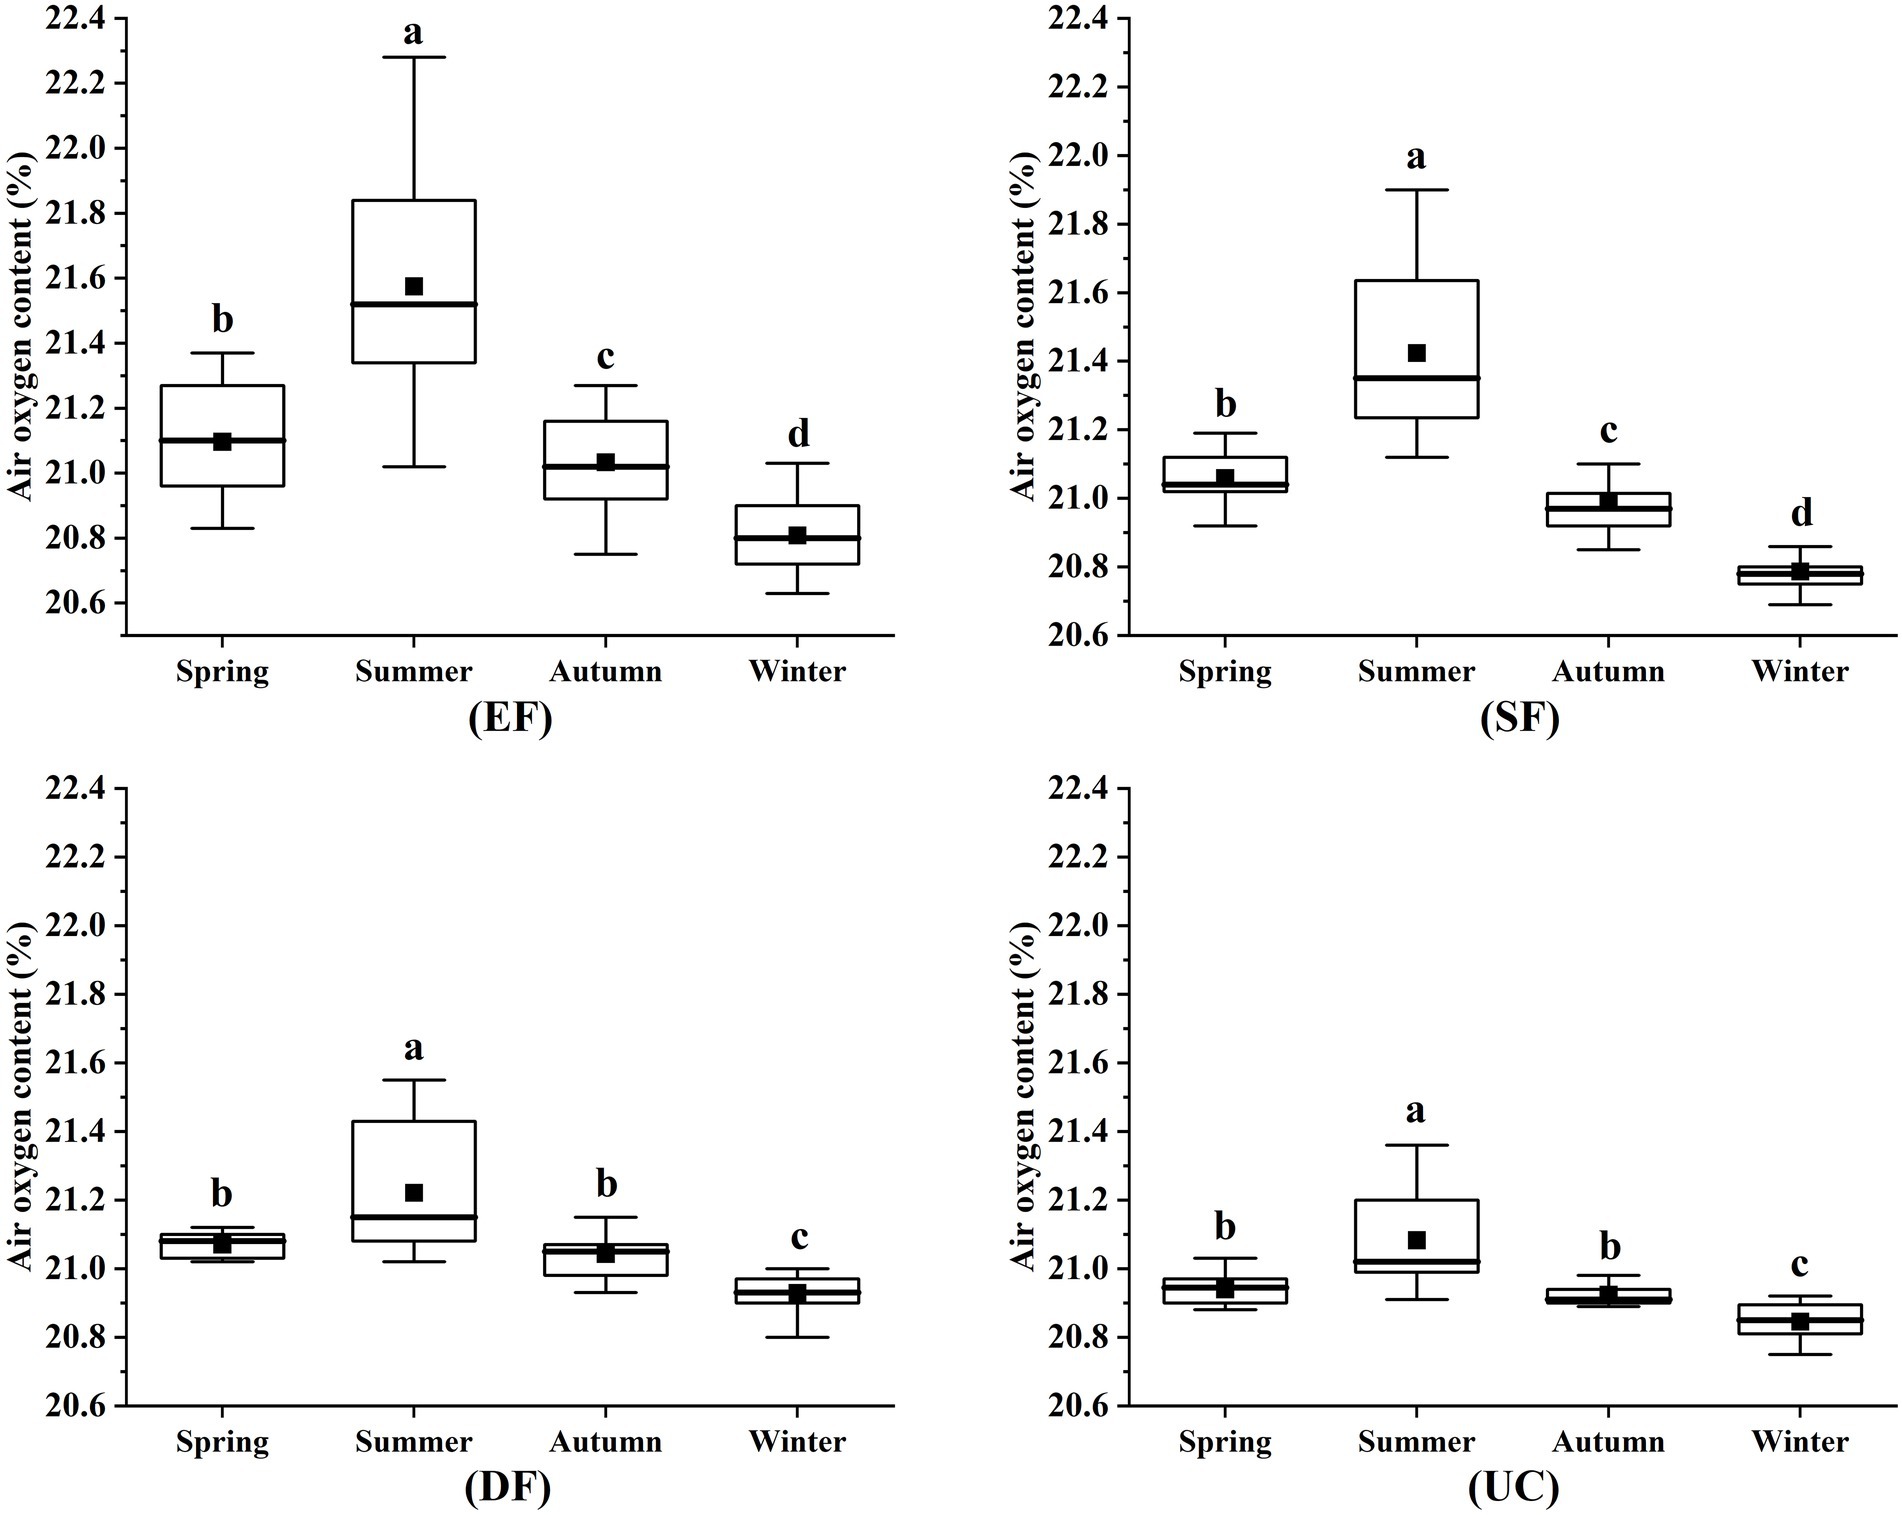
The AOC in exurban forest was: summer (21.57 ± 0.34%) > spring (21.10 ± 0.17%) > autumn (21.03 ± 0.14%) > winter (20.81 ± 0.10%), suburban forest was: summer (21.42 ± 0.24%) > spring (21.06 ± 0.63%) > autumn (20.99 ± 0.12%) > winter (20.79 ± 0.52%), downtown forest was: summer (21.22 ± 0.17%) > spring (21.07 ± 0.31%) > autumn (21.04 ± 0.56%) > winter (20.93 ± 0.46%), and urban control was: summer (21.08 ± 0.12%) > spring (20.94 ± 0.37%) > autumn (20.92 ± 0.27%) > winter (20.85 ± 0.46%). It can also be distinctly seen that the seasonal variations of AOC in different geographical spaces revealed a consistent change rule, namely, summer > spring > autumn > winter, as shown in Figure 6.
3.3. Characteristics of forest microclimate and HCI of urban forests In different geographical spaces
It can be seen from Figures 7, 8 that the annual average of temperature in different geographical spaces was: urban control (28.76 ± 6.54°C) > downtown forest (27.51 ± 6.21°C) > suburban forest (24.20 ± 5.12°C) > exurban forest (23.41 ± 4.41°C), and their seasonal variations were summer > spring > autumn > winter. The annual average of relative humidity in different geographical spaces was: exurban forest (79.72 ± 12.03%) > suburban forest (77.06 ± 11.26%) > downtown forest (72.42 ± 11.99%) > urban control (64.51 ± 12.82%). The relative humidity in different geographical spaces reached the maximum in spring and the minimum in autumn, and the seasonal variations of exurban forest and suburban forest were spring > summer > winter > autumn, while downtown forest and urban control were spring > winter > summer > autumn. The annual average of wind speed in different geographical spaces was as follows: suburban forest (2.05 ± 1.64 m/s) > urban control (1.22 ± 0.66 m/s) > exurban forest (0.93 ± 0.77 m/s) > downtown forest (0.83 ± 0.72 m/s). Meanwhile, there was no apparently consistent seasonal change rule of wind speed in different geographical spaces.

Figure 7. Comparison of annual average of forest microclimate and HCI of urban forests in different geographical spaces.
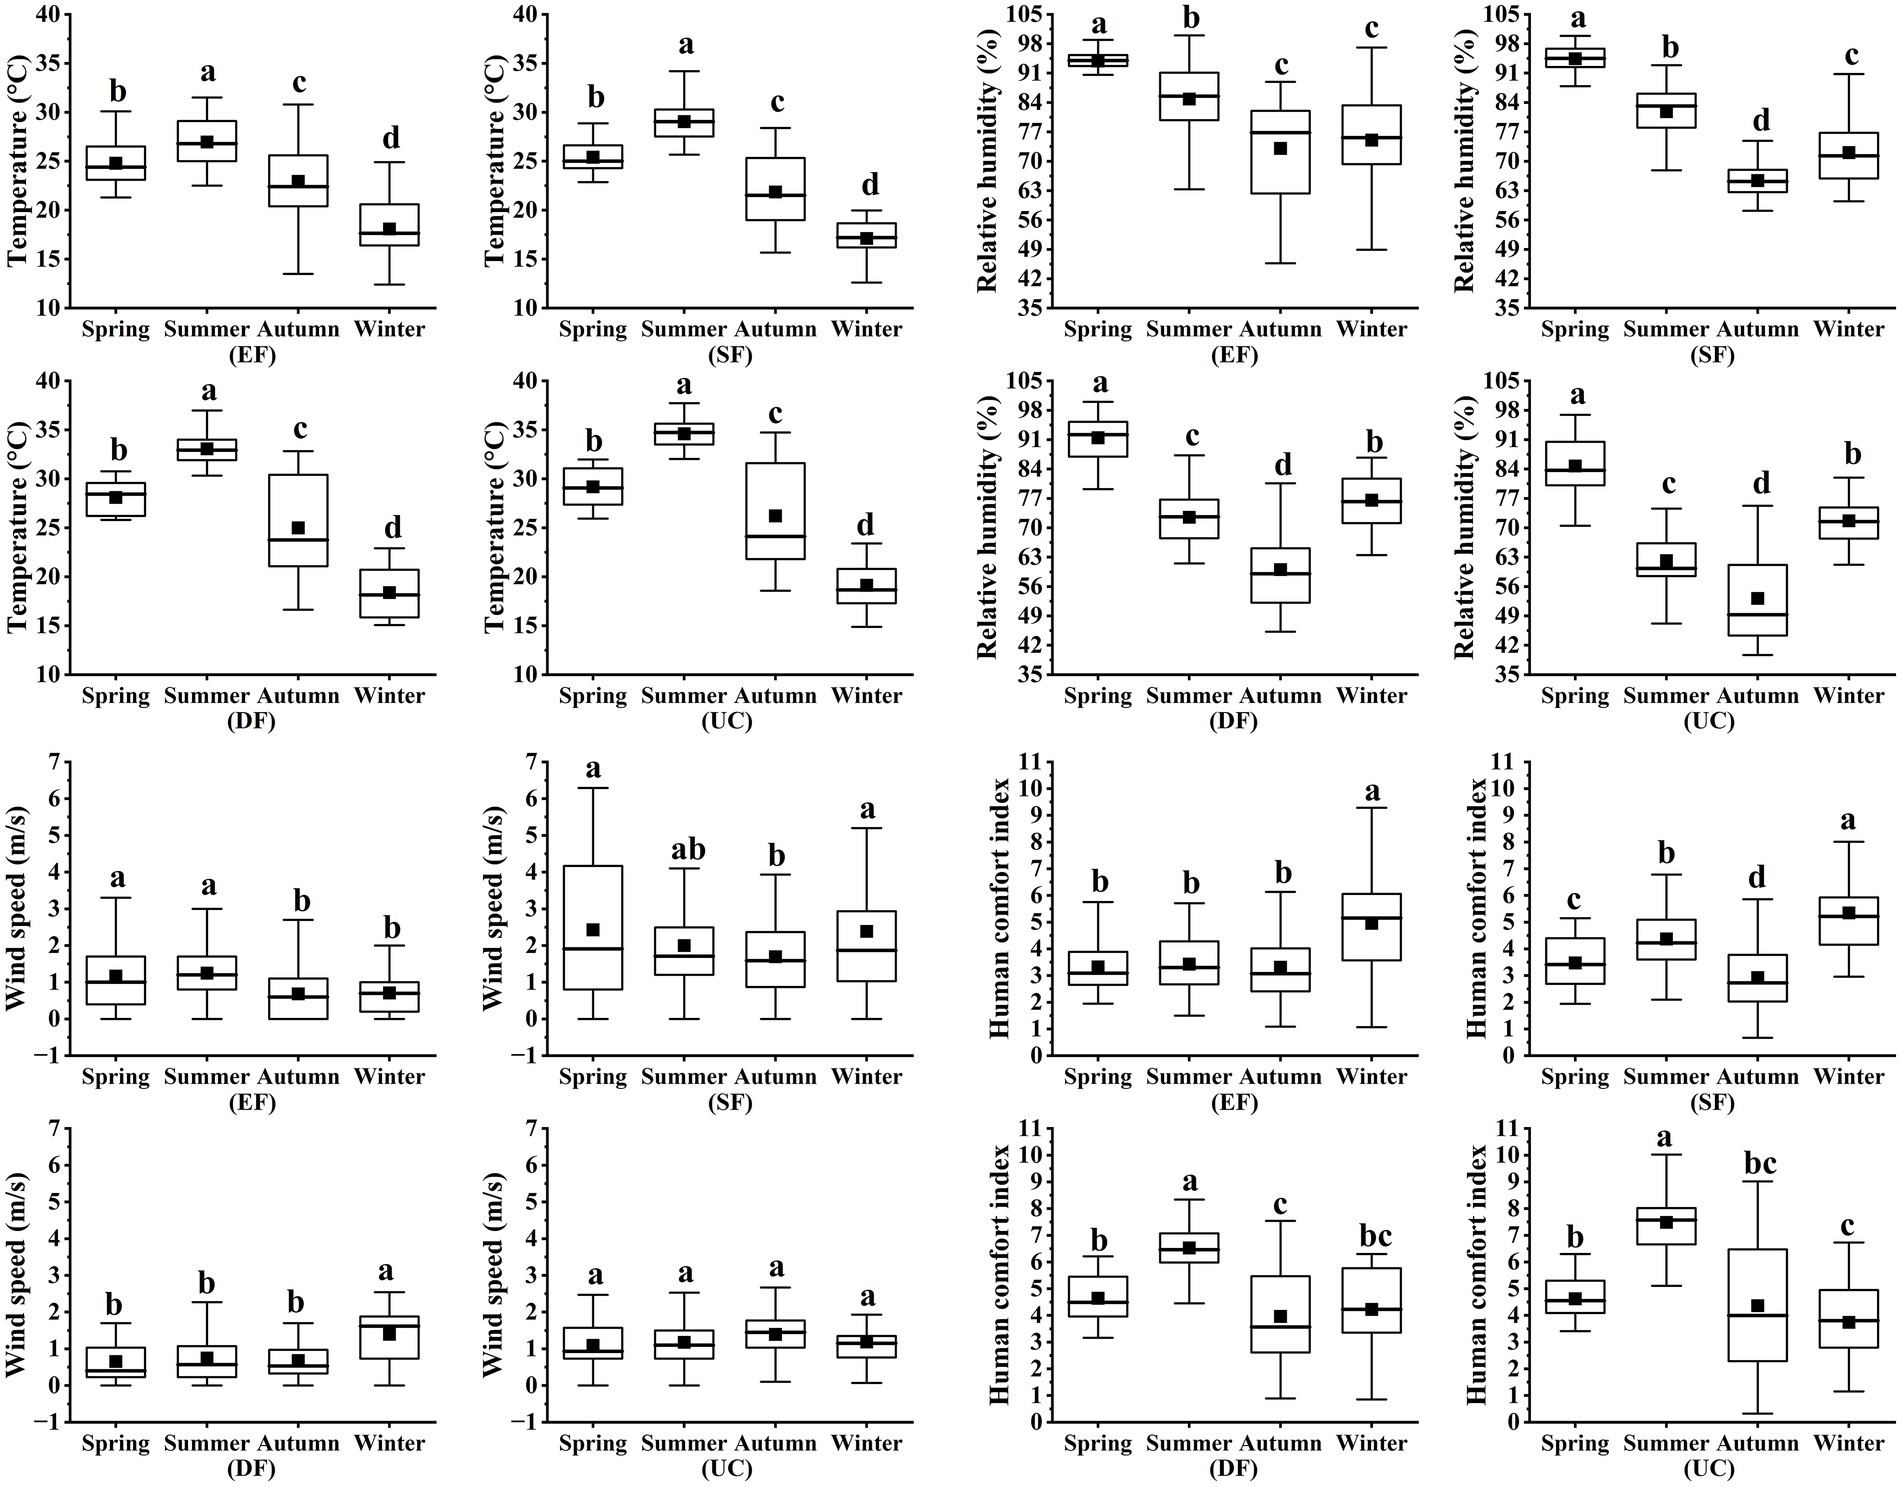
Figure 8. Seasonal variations of forest microclimate and HCI of urban forests in different geographical spaces.
The HCI of urban forests in different geographical spaces was calculated by Eq. 2 mentioned above and assessed in conformity with the evaluation criteria for HCI (Table 3). Through variance analysis, the HCI indicated transparently significant difference (p = 0.000 < 0.01). The annual average of HCI in different geographical spaces was as follows: urban control (5.56 ± 2.32) > downtown forest (5.15 ± 1.80) > suburban forest (4.02 ± 1.53) > exurban forest (3.71 ± 1.48). HCI in exurban forest and suburban forest were at Level I very comfortable degree, while downtown forest and urban control were at Level II, with a comfortable feeling. The seasonal variations of HCI in exurban forest and suburban forest were: autumn > spring > summer > winter. Except winter was at Level II, the other three seasons were all at Level I. However, seasonal variation of HCI in downtown forest was autumn > winter > spring > summer, and in urban control was: winter > autumn > spring > summer. Moreover, HCI of downtown forest and urban control in autumn and winter were at Level I, while in spring and summer were at Level II. Overall, the HCI of urban forest environments in different geographical spaces were all the best in autumn. Among them, the exurban forest and suburban forest were the worst in winter, while downtown forest and urban control were the worst in summer, followed by spring.
3.4. Evaluation of UFCHI in different geographical spaces
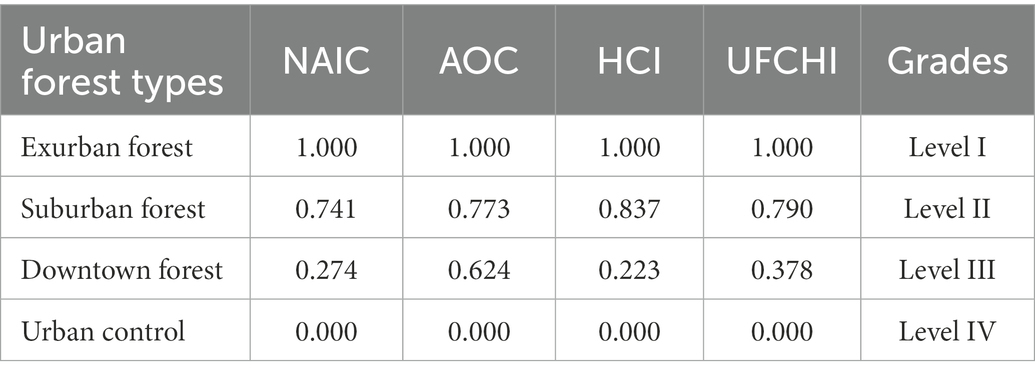
As claimed by the above-mentioned Eqs. 3, 4, the normalized values of three healthcare indicators were obtained. Meanwhile, in accordance with Eq. 9 and Table 5, the annual UFCHI in different geographical spaces were calculated and evaluated (Table 6). The UFCHI in different geographical spaces was as shown: exurban forest (1.000) > suburban forest (0.790) > downtown forest (0.378) > urban control (0.000). On the basis of the evaluation criteria for UFCHI (Table 5), the exurban forest was at Level I and extremely beneficial to human health; the suburban forest was at Level II, which was rather beneficial to human health; the downtown forest was at Level III, which was slightly beneficial to human health; while urban control was at Level IV, having no benefit to human health. This reported that forest environments in exurbs and suburbs having stronger healthcare benefits were more conducive to human health and more suitable for forest therapy activities than those in central city. Compared with forest environments, the healthcare benefits of urban control were weaker, which was not good for human health.
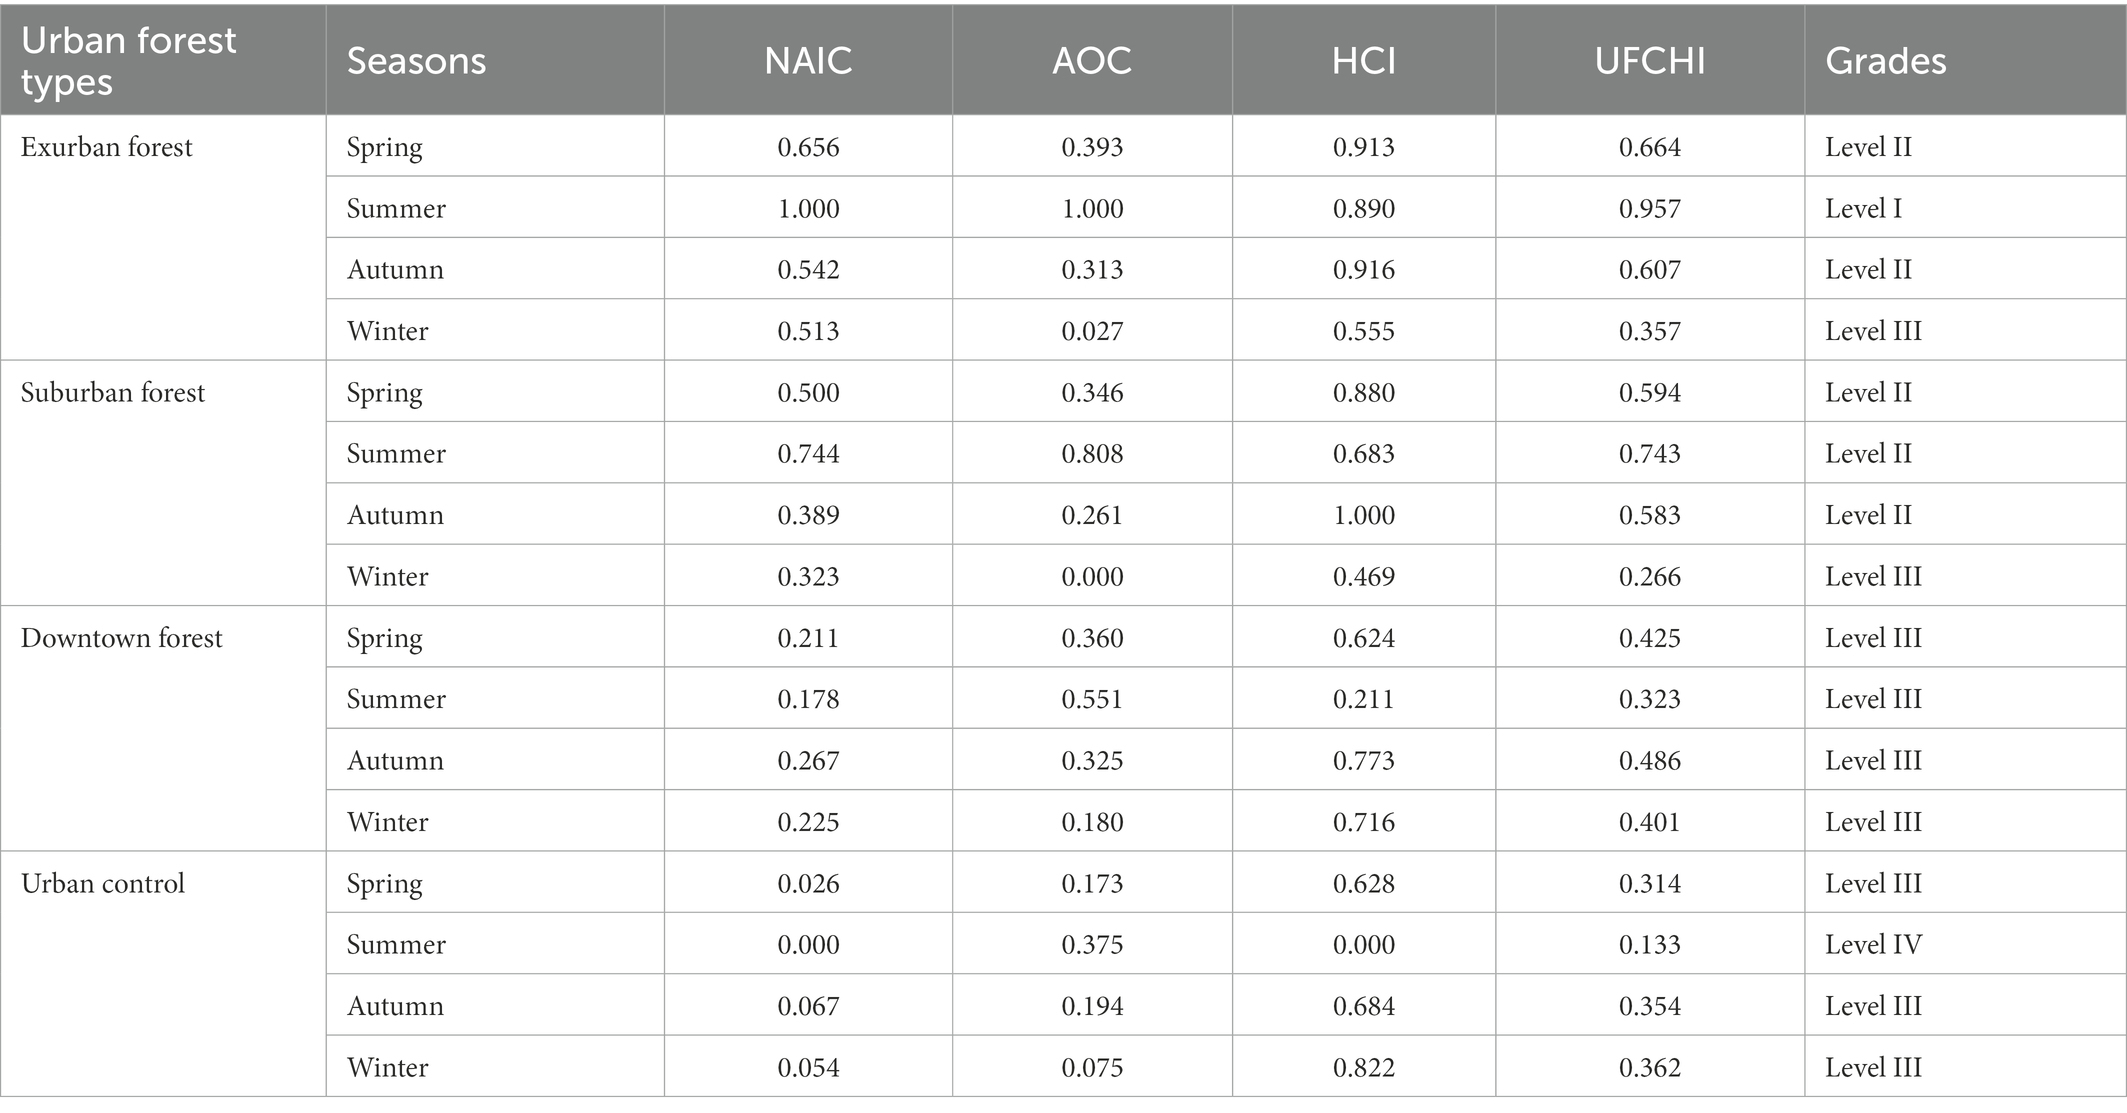
The UFCHI in different seasons were given, as shown in Table 7. Except in winter, the UFCHI of exurban forest and suburban forest were all at Level II and above in other seasons; especially in summer, the exurban forest was at Level I, having the superlative healthcare benefits. However, the UFCHI of downtown forest and urban control were all at Level III and below at all seasons. What’s more, in summer, urban control was at Level IV, with no healthcare benefits. It advised that spring, summer, and autumn were extraordinarily suitable for people to conduct forest therapy activities in exurban forest and suburban forest.
4. Discussion
4.1. Effects of different geographical spaces on urban forest comprehensive healthcare benefits
There were significant differences in comprehensive healthcare benefits of urban forests in different geographical spaces, where exurban forest > suburban forest > downtown forest, and the healthcare benefits of three urban forest environments were all exceptionally better than those of urban control. Combining with the distance from city center, forest area, and surrounding environment of study area, we can conclude that forest environment that was away from the city center and had a concentrated and continuous forest area reaching a certain scale got superior integrated healthcare benefits. The forest area in exurbs and suburbs was large and concentrated, which was negligibly affected by the external environment (Clay et al., 2018). Furthermore, human activity was higher in the city than in the suburbs and exurbs, which steepened from rural areas toward the urban center (Meng et al., 2015). Environmental changed along a city-suburb-exurb gradient in response to urbanization, such as dense buildings, concentrated road networks, and frequent human activities, produced a gradient of forest area fragmentation (Wu et al., 2013). It was intuitive that the forest area of downtown forest was narrow and encompassed by crowded premises, forming an isolated urban forest which was more affected by the surrounding environment, which would tend to have a passive effect on healthcare benefits. The downtown forest was convenient for daily walks and exercise for the surrounding residents, but its healthcare benefits were limited. If denizens aspire to reap preferable healthcare benefits from forest setting, it is best to stay in forest environments in exurbs and suburbs to recuperate their bodies and minds. Consequently, it is advisable for forest therapy sites to be located in or adjacent to concentrated and contiguous forests, and to have a certain scale of concentrated areas that can develop an evident forest microclimate.
This finding is particularly informative. Most of the current urban parks are also isolated downtown forests, and whether their comprehensive healthcare benefits are similar requires more and deeper exploration in the future. We speculate that the area of isolated downtown forests is too small to achieve forest healthcare benefits. Future research could set up different forest area gradients for in-depth analysis and verification, so as to give scientific support for the rationality of forest therapy base site selection.
4.2. Effects of different geographical spaces on forest healthcare factors
4.2.1. Negative air ion concentration
The NAIC of three urban forests were distinctly higher than urban control, which was in line with the research conclusions of most scholars: NAIC in forest areas were immensely greater than that in forestless areas (Feng et al., 2015). A possible explanation for this might be that in the forest environment, radioactive elements escaping from rocks and soil, photoelectric effects on plant branches and leaves, and volatile aromatic substances released by trees can ionize the air in the forest (Zeng et al., 2006). And the dust removal effect of forests can boost NAIC, along with extending their lifetimes. Nevertheless, the urban environment had less vegetation, dense population and heavy traffic. Previous studies have unfolded that human activity had a prominent impact on NAIC, and NAIC was negatively correlated with the flow of population and vehicles (Yuan et al., 2014; Feng et al., 2015). The dense population would consume a great deal of O2 and generate a large amount of CO2, and NAIC was passively linked with oxygen consumption (Pu et al., 1993). Simultaneously, CO2 absorbed negative ions to form heavy ion deposition, leading to a further decline in NAIC. More importantly, automobile exhaust would build up the concentration of suspended particulate matter and CO2 in near-surface air, which enormously diminished the NAIC and shortened their existence.
The average annual of NAIC in exurban forest was about 1.2 times and 2.4 times than that in suburban forest and downtown forest, respectively. The forest area and forest coverage of exurban forest and suburban forest were large and contiguous, barely influenced by the outside, and had a stable ecosystem. It was detected that NAIC was better at high forest coverage than at low forest coverage (Cui et al., 2020). In addition, exurban forest was rich in plant species, complex in community structure, large in leaf area index (LAI) of community, and relatively high in canopy density. Earlier research suggested that the higher the complexity of community structure, the greater the NAIC (Gao and Zhang, 2018), and NAIC had a positive correlation with LAI of community (Liu et al., 2011). Additionally, there was a positive correlation between NAIC and canopy density, and NAIC tended to heighten with the escalation of vegetation canopy density (Du et al., 2018; Zheng et al., 2021).
Seasonal variations of NAIC in exurban forest and suburban forest were summer > spring > autumn > winter, while downtown forest and urban control were autumn > winter > spring > summer. The reason for the difference may be closely related to the temperature. The downtown forest was small-scale and surrounded by dense buildings, developing an isolated urban forest. In hot, muggy summer, the downtown forest had no noticeable cooling and humidifying effect, and the high temperature inside the forest lessened the stomatal conductance and photosynthetic rate of plants. Former studies have discovered that NAIC was positively correlated with stomatal conductance and photosynthetic rate (Zhao et al., 2018). Stomata was the channels for the release of negative air ions produced by plants, and the larger the stomata, the higher the NAIC (Zhang et al., 2016); the higher the photosynthetic rate, the greater the ability of plants to release oxygen, and the higher the NAIC. At the same time, the high-temperature urban environment given rise to the dispersion of pollutants (Zhang et al., 2022), and pollutants adsorbed loads of negative air ions in the process of diffusion, resulting in a lower rate of negative air ions production than consumption. Therefore, the NAIC in downtown forest and urban control were broadly lower in summer than in other seasons, which was also coherent with the seasonal variation of NAIC in Hangzhou (Qi et al., 2011) and Shenzhen (Wang et al., 2020).
4.2.2. Air oxygen content
The AOC in different geographical spaces was conspicuously different, exurban forest > suburban forest > downtown forest > urban control, and the variation of AOC in exurban forest and suburban forest were larger. It may be due to the fact that exurban forest and suburban forest were far away from the city center, having lower concentrations of air pollutants. And their forest areas were larger and concentrated, with a larger unit biomass and LAI, so the ability to release oxygen through photosynthesis was notably better than those of downtown forest and urban control. In addition, the variation of AOC was closely related to the growth and development cycle of forest communities (Wen, 2020), varying with the change of plants into the peak growing season or dormant state.
It has been established that AOC was most affected by temperature (Gu, 2013; Wang et al., 2014; Wen, 2020). The seasonal variations of AOC in different geographical spaces were summer > spring > autumn > winter, which was the same as the temperature. This illustrated that, under the impact of temperature, there was an outstanding rise in oxygen release in spring and summer, due to intense physiological activity during the peak period of plant growth. On the contrary, after entering autumn and winter, the physiological activity of plants gradually decayed and slowly entered a dormant period, which considerably reduced the oxygen release. Hence, the seasonal variations of AOC in different geographical spaces were higher in summer and spring than in autumn and winter, which was identified with the findings of Wen (2020).
4.2.3. Human comfort index
The HCI of exurban forest and suburban forest was at Level I very comfortable degree, which were one level higher than that of downtown forest and urban control. This reflected that the HCI in forest environments was superior to that in urban environments, which matched the conclusion of most scholars (Gu et al., 2019; Rahman et al., 2020; Teshnehdel et al., 2020): the function of regulating microclimate played by forest environments was strikingly better than that of non-forest area. This may have a lot to do with their altitude, mountain topography, forest area, forest coverage, surrounding environment, and their location away from urban centers. As can be seen from the study area introduction and Figure 1, the forest areas of exurban forest and suburban forest were concentrated and contiguous on a large scale with high forest coverage. Moreover, they had higher elevations, more diverse and complex terrain, and were adjacent to other forest parks, nature reserves or scenic spots. In contrast, the downtown forest had lower altitudes, less pronounced terrain variations, and smaller forest areas. Meanwhile, it was surrounded by dense buildings or the South China Expressway, and more susceptible to the effects of urban microclimates. Numerous studies have manifested that HCI was affected by altitude, vegetation cover, and terrain shading effects; HCI was positively related to altitude (Wen, 2020), and the mountainous terrain shading effect and higher vegetation cover were conducive to the HCI (Yao et al., 2019). Thus, the HCI in exurban forest and suburban forest was better than that in downtown forest and urban control. Furthermore, some scholars have claimed that HCI was positively correlated with NAIC and canopy density (Du et al., 2018). Exurban forest and suburban forest had high NAIC and canopy density, which have achieved remarkable cooling and damping effect and improved HCI. However, the lack of vegetation in urban environment resulted in large variations in temperature and humidity, and its HCI was poor.
The HCI of forest environments in different geographical spaces were all the best in autumn. In contrast, HCI was worst in winter in exurban forest and suburban forest, and in summer in downtown forest and urban control. Precedent studies have shown that all microclimate factors had a certain impact on HCI, with air temperature having the greatest impact, followed by relative humidity and wind speed (Liu C. et al., 2017; Huang et al., 2020). Forest environments can tremendously drop air temperature and rise relative humidity (Yan et al., 2012), and its ability of regulating local microclimate was relatively strong. Thus, exurban forest and suburban forest had the effect of reducing heat and improving comfort during the hot summer months, while in winter, forest environments were colder than urban environments and their HCI was poor. This was matched with the findings of Zhang (2014) that urban forest in regulating human comfort was the worst in winter. Nevertheless, temperature, relative humidity, and wind speed were all at very comfortable level in fall, so the HCI in urban forest environment in autumn was the best. It was perceived that urbanization contributed to the increase of maximum temperature in summer and minimum temperature in winter in urban areas with 57.8% and 46.1%, respectively. The HCI in urban areas moved in the direction of hot and uncomfortable in summer and warmer and more comfortable in winter (Huang et al., 2020). At the same time, downtown forest was more susceptible to urban microclimate and their ability to regulate microclimates was limited. Therefore, the downtown forest and urban control had better HCI in winter than in summer.
4.3. Limitations and future research
Admittedly, there were several limitations to this study. First, the forest healthcare factors in this study were limited to three indicators: negative air ion concentration, air oxygen content, and human comfort index. To sufficiently reflect the forest healthcare benefits, further studies can supplement the synchronous monitoring experiments of airborne bacteria content, air particulate matter concentration, phytoncide relative content, and other metrics. Second, this study primarily focused on the internal environment of urban forests. In the process of data collection, the impact of traffic exhaust and other pollutants on negative air ion concentration, air oxygen content, and human comfort index were ignored. It is true that the external environment of urban forests takes some effects on its internal environment. Future research is needed to consider how to quantify or avoid these effects. Third, the study area selection of this study was on the basis of three considerations: the distance from city center, forest area, and surrounding environment. But which of these three factors has a greater impact on the urban forest comprehensive healthcare index? It is a pity that this study did not carry out comparative experimental research on this issue. In future studies, we could set up the approximate forest area to explore the influence of the distance from city center on forest healthcare benefits; or select similar geographical locations (e.g., exurbs or suburbs) with diverse forest area gradients to discuss whether the area proportion of urban forests react greater on the UFCHI? As for the effect of surrounding environment on forest healthcare benefits, the experiment can be designed to be conducted in urban forests in suburbs or downtown which forest area is analogical, but the surroundings (such as contiguous forest environment, adjacent to a large area of water, dense buildings and population, and adjoining industrial areas) are distinguishing. Notwithstanding these limitations, this may be the first study to attempt to validate the differences in exurban-suburban-downtown gradients for urban forest comprehensive healthcare benefits using the CRITIC method.
5. Conclusion
Our results demonstrated that forests in exurbs and suburbs can make a substantial contribution to healthcare benefits than downtown forest. Although downtown forest has some healthcare benefits for daily exercise and recreation, it is inadequate for forest therapy. When choosing the site for forest therapy bases, three pivotal factors including the distance from city center, forest area, and surrounding environment should be highly valued, and priority should be given to concentrated contiguous exurban forest with a certain scale, followed by suburban forest. Furthermore, our findings identified that spring, summer, and autumn were excellent for forest therapy in both exurban forest and suburban forest.
Data availability statement
The raw data supporting the conclusions of this article will be made available by the authors, without undue reservation.
Author contributions
SZ, JL, and GC conceived the study. SZ, SH, FH, YS, and YG finished field investigation and laboratory experiments. SZ processed the data and analyzed the results. SZ, QQ, and QH contributed to the manuscript writing and editing. All authors contributed to the article and approved the submitted version.
Funding
The research was supported by the Guangdong Provincial Forestry Science and Technology Innovation Project (grant number: 2018KJCX012).
Acknowledgments
The authors would like to thank the administrative staff of Shimen National Forest Park and Guangdong Longyandong Forest Farm for their support. We would also like to thank reviewers for helpful comments and suggestions on this paper.
Conflict of interest
The authors declare that the research was conducted in the absence of any commercial or financial relationships that could be construed as a potential conflict of interest.
Publisher’s note
All claims expressed in this article are solely those of the authors and do not necessarily represent those of their affiliated organizations, or those of the publisher, the editors and the reviewers. Any product that may be evaluated in this article, or claim that may be made by its manufacturer, is not guaranteed or endorsed by the publisher.
Abbreviations
NAIC, Negative air ion concentration; AOC, Air oxygen content; HCI, Human comfort index; T, Temperature; RH, Relative humidity; V, Wind speed; LAI, Leaf area index; UFCHI, Urban forest comprehensive healthcare index; EF, Exurban forest; SF, Suburban forest; DF, Downtown forest; UC, Urban control; CRITIC, Criteria Importance Through Intercriteria Correlation.
References
Alexander, D. D., Bailey, W. H., Perez, V., Mitchell, M. E., and Su, S. (2013). Air ions and respiratory function outcomes: a comprehensive review. J. Negat. Results Biomed. 12:14. doi: 10.1186/1477-5751-12-14
Antonelli, M., Donelli, D., Barbieri, G., Valussi, M., Maggini, V., and Firenzuoli, F. (2020). Forest volatile organic compounds and their effects on human health: a state-of-the-art review. Int. J. Environ. Res. Public Health 17:6506. doi: 10.3390/ijerph17186506
Bowers, B., Flory, R., Ametepe, J., Staley, L., Patrick, A., and Carrington, H. (2018). Controlled trial evaluation of exposure duration to negative air ions for the treatment of seasonal affective disorder. Psychiatry Res. 259, 7–14. doi: 10.1016/j.psychres.2017.08.040
Chae, Y., Lee, S., Jo, Y., Kang, S., Park, S., and Kang, H. (2021). The effects of forest therapy on immune function. Int. J. Environ. Res. Public Health 18:8440. doi: 10.3390/ijerph18168440
Cheng, Y., and Yin, J. (2022). Has COVID-19 increased the intention to undertake health tourism? Examination using a conditional process mode. Tour. Trib. 37, 119–132. doi: 10.19765/j.cnki.1002-5006.2021.00.020, [in Chinese]
Clay, N., Yurco, K., Agrawal, A., and Persha, L. (2018). Ecosystem services in a transitional forest landscape: shifting trajectories in Southeast Michigan, USA. Soc. Nat. Resour. 31, 457–472. doi: 10.1080/08941920.2017.1413692
Cui, Y., Zhao, Y. X., Zhang, N., Zhang, D. Y., and Yang, J. N. (2020). An inversion model for estimating the negative air ion concentration using MODIS images of the Daxing’anling region. PLoS One 15:e242554:e0242554. doi: 10.1371/journal.pone.0242554
Dauphinais, D. R., Rosenthal, J. Z., Terman, M., DiFebo, H. M., Tuggle, C., and Rosenthal, N. E. (2012). Controlled trial of safety and efficacy of bright light therapy vs. negative air ions in patients with bipolar depression. Psychiatry Res. 196, 57–61. doi: 10.1016/j.psychres.2012.01.015
Diakoulaki, D., Mavrotas, G., and Papayannakis, L. (1995). Determining objective weights in multiple criteria problems: the critic method. Comput. Oper. Res. 22, 763–770. doi: 10.1016/0305-0548(94)00059-H
Du, W. G., Wang, C., Wang, Q., Bao, H. G., He, R., Xu, C., et al. (2018). Evaluation of summer environmental effects of the main vegetation types in Beijing Fragrant Hills Park. Sci. Silvae Sin. 54, 155–164. doi: 10.11707/j.1001-7488.20180418, [in Chinese]
Feng, P. F., Yu, X. W., and Zhang, X. (2015). Variations in negative air ion concentrations associated with different vegetation types and influencing factors in Beijing. Ecol. Environ. Sci. 24, 818–824. doi: 10.16258/j.cnki.1674-5906.2015.05.015, [in Chinese]
Gao, X., and Zhang, D. Y. (2018). Spatial distribution characteristics of negative air ions in the Sanjiang plain and its concentration relationship with climatic factors. North Hortic. 23, 115–123. doi: 10.11937/bfyy.20174035 [in Chinese]
Gu, L. (2013). Ecological health effects of three recreational forests in Hui Mountain of Wuxi City, Jiangsu Province, Southern China Beijing, China: Chinese Academy of Forestry.
Gu, L., Wang, C., Wang, Y. Y., Wang, X. L., Sun, Z. K., Wang, Q., et al. (2019). Patterns of temporal variation of microclimate and extent of human comfort in the recreation forests in Huishan National Forest Park. Sci. Silvae Sin. 55, 150–159. doi: 10.11707/j.1001-7488.20190618, [in Chinese]
Han, M. C., Liang, Y. L., Ye, B., and Yu, S. F. (2012). Research on composite evaluation index of urban forest health effects of Beigong National Forest Park. Guangdong Agr. Sci. 39, 185–188. [in Chinese]. doi: 10.16768/j.issn.1004-874x.2012.24.062
Hong, H. Y. (2015). Research progress of medical oxygen. World Latest Med. Inf. 15, 55–57. doi: 10.3969/j.issn.1671-3141.2015.88.021, [in Chinese]
Hong, W., Liao, Y. J., Chen, F. Q., Li, S. Y., Zhang, G. R., Wei, X. Y., et al. (2020). Study on plant composition of Castanopsis hystrix plantation forest in Longyandong Forest farm of Guangdong Province. For. Env. Sci. 36, 63–70. [in Chinese]
Huang, H. L., Ding, Y. Y., Tu, X. P., Zhao, C. Y., and Yao, R. S. (2020). Impact of urbanization on extreme temperature and human comfort degree in Ningbo City. J. Arid Meteorol. 38, 396–403. doi: 10.11755/j.issn.1006-7639(2020)-03-0396, [in Chinese]
Jeong, M., Park, S., and Song, G. (2016). Comparison of human thermal responses between the urban forest area and the central building district in Seoul, Korea. Urban For. Urban Green. 15, 133–148. doi: 10.1016/j.ufug.2015.12.005
Jiang, S., Ma, A., and Ramachandran, S. (2018). Negative air ions and their effects on human health and air quality improvement. Int. J. Mol. Sci. 19:2966. doi: 10.3390/ijms19102966
Jovarauskaite, L., Dumarkaite, A., Truskauskaite-Kuneviciene, I., Jovaisiene, I., Andersson, G., and Kazlauskas, E. (2021). Internet-based stress recovery intervention FOREST for healthcare staff amid COVID-19 pandemic: study protocol for a randomized controlled trial. Trials 22:559. doi: 10.1186/s13063-021-05512-1
Kim, J. G., and Shin, W. S. (2021). Forest therapy alone or with a guide: is there a difference between self-guided forest therapy and guided forest therapy programs? Int. J. Environ. Res. Public Health 18:6957. doi: 10.3390/ijerph18136957
Krishnan, A. R., Kasim, M. M., Hamid, R., and Ghazali, M. F. (2021). A modified critic method to estimate the objective weights of decision criteria. Symmetry 13:973. doi: 10.3390/sym13060973
Li, C. S., Xie, Z. Y., Chen, B., Kuang, K. J., Xu, D. W., Liu, J. F., et al. (2021). Different time scale distribution of negative air ions concentrations in mount Wuyi National Park. Int. J. Environ. Res. Public Health 18:5037. doi: 10.3390/ijerph18095037
Liu, R., Lian, Z., Lan, L., Qian, X., Chen, K., Hou, K., et al. (2017). Effects of negative oxygen ions on sleep quality. Proc. Eng. 205, 2980–2986. doi: 10.1016/j.proeng.2017.10.219
Liu, X., Wu, L., Zhang, H., and Wang, X. (2011). Study on the concentration of negative air ions and the influential factors in different urban plant communities. J. Fudan Uni. (Nat. Sci.) 50, 206–212. doi: 10.15943/j.cnki.fdxb-jns.2011.02.019, [in Chinese]
Liu, C., Xu, N., Song, J. D., and Hu, S. C. (2017). Research on visitors' thermal sensation and space choices in an urban forest park. Acta Ecol. Sin. 37, 3561–3569. doi: 10.5846/stxb201611252416, [in Chinese]
Lu, D. H., Cui, S., and Li, C. H. (1984). The Influence of Beijing Urban Greening and Summer Microclimatic Conditions on Human Fitness. Agricultural Meteorology Research Association of CAA, Chinese Society of Forestry. Proceedings of Forestry and Meteorology. Beijing: Meteorological Press. [in Chinese]
Meng, X. F., Zhang, Z. W., Li, Z., Wu, X. J., and Wang, Y. J. (2015). Effects of city–suburb–exurb landscape context and distance to the edge on plant diversity of forests in Wuhan, China. Plant Biosyst. 149, 903–913. doi: 10.1080/11263504.2014.906510
Pino, O., and La Ragione, F. (2013). There's something in the air: empirical evidence for the effects of negative air ions (NAI) on psychophysiological state and performance. Res. Psychol. Behav. Sci. 1, 48–53. doi: 10.12691/rpbs-1-4-1
Pu, W. X., Jiang, G. F., Huang, M. L., Liang, H., and Qin, Y. Q. (1993). An approach on using concentration of air negative ion and oxygen consumption as environmental monitoring index for evaluation of indoor air quality. J. Env. Health 6, 262–264. doi: 10.16241/j.cnki.1001-5914.1993.06.014, [in Chinese]
Qi, B., Du, R. G., and Shao, B. J. (2011). Characteristics of anion variation in Hangzhou. Meteorol. Disaster Reduct. Res. 34, 68–71. [in Chinese]
Rahman, M. A., Hartmann, C., Moser-Reischl, A., von Strachwitz, M. F., Paeth, H., Pretzsch, H., et al. (2020). Tree cooling effects and human thermal comfort under contrasting species and sites. Agric. For. Meteorol. 287:107947. doi: 10.1016/j.agrformet.2020.107947
Sharkasi, N., and Rezakhah, S. (2022). A modified critic with a reference point based on fuzzy logic and hamming distance. Knowl.-Based Syst. 255:109768. doi: 10.1016/j.knosys.2022.109768
Shi, G. Y., Zhou, Y., Sang, Y. Q., Huang, H., Zhang, J. S., Meng, P., et al. (2021). Modeling the response of negative air ions to environmental factors using multiple linear regression and random forest. Ecol. Inform. 66:101464. doi: 10.1016/j.ecoinf.2021.101464
Teshnehdel, S., Akbari, H., Di Giuseppe, E., and Brown, R. D. (2020). Effect of tree cover and tree species on microclimate and pedestrian comfort in a residential district in Iran. Build. Environ. 178:106899. doi: 10.1016/j.buildenv.2020.106899
Tong, F. C., and Xiao, Y. H. (2014). Community structure of soil nematodes in Changgangshan natural Reserve of Guangzhou. Sci. Silvae Sin. 50, 111–120. doi: 10.11707/j.1001-7488.20140216, [in Chinese]
Wang, Y. F., Ni, Z. B., Wu, D., Fan, C., Lu, J. Q., and Xia, B. C. (2020). Factors influencing the concentration of negative air ions during the year in forests and urban green spaces of the Dapeng peninsula in Shenzhen. China. J. Forestry Res. 31, 2537–2547. doi: 10.1007/s11676-019-01047-z
Wang, Q., Wang, C., and Dong, J. W. (2018). Ecological health care functions of Phyllostachys pubescens forest based on health factors and open field test. J. Northwest For. Uni. 33, 269–277. doi: 10.3969/j.issn.1001-7461.2018.05.43, [in Chinese]
Wang, Y. Y., Wang, C., Dong, J. W., Wang, Q., Lin, S. Y., Fu, W. C., et al. (2014). Diurnal oxygen concentration changes in mixed evergreen broad-leaved forest at Qishan, Fuzhou. J. Chin. Urban For. 12, 6–9. [in Chinese]
Wen, Y. (2020). Research on Spatio-Temporal Dynamics of Forest Convalescence Factors and Convalescent Functions in Northern Jiangxi Province Nanchang, Jiangxi, China: Jiangxi Agricultural University [in Chinese].
Woo, J., and Lee, C. J. (2020). Sleep-enhancing effects of phytoncide via behavioral, electrophysiological, and molecular modeling approaches. Exp Neurobiol. 29, 120–129. doi: 10.5607/en20013
Wu, X., Zhang, Z., Meng, X., Li, Z., and Wang, Y. (2013). Dynamics of diversity, distribution patterns and interspecific associations of understory herbs in the city-suburb-exurb context of Wuhan city, China. Arch. Biol. Sci. 65, 1619–1628. doi: 10.2298/ABS1304619W
Xia, L., Lian, Q., Yang, H., and Wu, D. (2022). The adaption of the Chinese version of the COVID stress scales as a screening instrument of stress: psychometric properties during the COVID-19 pandemic. Front. Public Health 10:962304. doi: 10.3389/fpubh.2022.962304
Yan, H., Wang, X., and Dong, L. (2012). Microclimatic characteristics and human comfort conditions of tree communities in northern China during summer. J. Beijing For. Uni. 34, 57–63. doi: 10.13332/j.1000-1522.2012.05.021, [in Chinese]
Yan, X., Wang, H., Hou, Z., Wang, S., Zhang, D., Xu, Q., et al. (2015). Spatial analysis of the ecological effects of negative air ions in urban vegetated areas: a case study in Maiji. China. Urban For. Urban Green. 14, 636–645. doi: 10.1016/j.ufug.2015.06.010
Yang, C., Wang, Y. R., Tang, Z. Y., Wang, Q., Duan, M. J., and Qi, L. H. (2022). Ecological health care effects of scenic recreational forests with different community structures; a case study of Beijing Xishan National Forest Park. Acta Ecol. Sin. 42, 1–15. doi: 10.5846/stxb202109302752 [in Chinese]
Yao, Z. H., Yao, Y. Q., Wang, C. H., Fan, F., and Shi, G. P. (2019). Temporal and spatial characteristics of somatosensory temperature in summer holiday in Anhui Province during 1987-2016. J. Arid Meteorol. 37, 454–459. doi: 10.11755/j.issn.1006-7639(2019)-03-0454, [in Chinese]
Yuan, X. Y., Sun, Y. X., Tian, Y., Yang, T. T., and Lei, J. (2014). Experimental research of air negative oxygen ion and their affecting factors in different ecological functional areas of Beijing. Env. Sci. Tech. 37, 97–102. doi: 10.3969/j.issn.1003-6504.2014.06.018, [in Chinese]
Zeng, S. C., Su, Z. Y., and Chen, B. G. (2006). Review on forest negative air ions in China. J. Nanjing For. Uni. (Nat. Sci. Ed.) 30, 107–111. [in Chinese]
Zhang, Z. Y. (2014). Monitoring Dynamic Changes of Ecological Health Functions of Typical Urban Forests in Hangzhou Beijing, China: Beijing Forestry University.
Zhang, Q. S., He, Y. M., Zhao, J. M., and Li, S. H. (2006). Grading assessment of aero anion concentration the microclimate of forest park. J. Northwest For. Uni. 21, 48–49. [in Chinese]
Zhang, J., Rong, Y., Yin, Q., Zhang, P., Zhao, L., and Chen, C. (2022). Spatiotemporal variation and influencing factors of tsp and anions in coastal atmosphere of Zhanjiang city, China. Int. J. Environ. Res. Public Health 19:2030. doi: 10.3390/ijerph19042030
Zhang, Z. Y., and Ye, B. (2022). Forest therapy in Germany, Japan, and China: proposal, development status, and future prospects. Forests 13:1289. doi: 10.3390/f13081289
Zhang, W. C., Zheng, J. M., Ding, X. L., Peng, D. H., Wu, R. Y., Deng, C. Y., et al. (2016). Correlation between the negative air ions released by 3 species in Cactaceae and the releasing passage. Chin. J. Trop. Crops. 37, 1298–1305. doi: 10.3969/j.issn.1000-2561.2016.07.010, [in Chinese]
Zhao, J. J., Li, Y. M., Tian, H. L., Liu, Y. S., and Xiang, S. M. (2012). Analysis of oxygen content in forest environment in Qiannan Guizhou Province. Shandong For. Sci. Tech. 42, 24–26. [in Chinese]
Zhao, Q., Qian, W. H., Tang, H. H., and Yang, Q. (2019). Study on seasonal changes of health care function of typical forest stands in Yunyong Forest Park. J. Cent. South Uni. For. Tech. 39, 132–140. doi: 10.14067/j.cnki.1673-923x.2019.11.019, [in Chinese]
Zhao, Y. N., Shi, C. C., Xu, D. F., Kang, X. L., Liu, X. Y., and Zhao, T. N. (2018). Variations in negative air ion concentrations associated with different vegetation types and influencing factors in Chongli District. For. Res. 31, 127–135. doi: 10.13275/j.cnki.lykxyj.2018.03.017, [in Chinese]
Zheng, S. Y., Zhang, L. S., Guo, X. M., Huang, Z. J., and Xiao, Y. H. (2021). Spatial and temporal variations of negative oxygen ions in the air and environmental influencing factors in forest environment with different canopy densities: a case study of Maofeng Mountain in Guangzhou. Eco. Env. Sci. 30, 2204–2212. doi: 10.16258/j.cnki.1674-5906.2021.11.011, [in Chinese]
Zhu, S. X., He, S. Y., Hu, F. F., He, Q., Su, Y., and Li, J. Y. (2021a). Comprehensive evaluation of healthcare functions among different stands in Shimen National Forest Park of southern China in summer. J. Beijing For. Univ. 43, 60–74. doi: 10.12171/j.1000-1522.20200343, [in Chinese]
Keywords: urban forest, forest healthcare benefits, negative air ion concentration, air oxygen content, human comfort index, different geographical spaces
Citation: Zhu S, He S, Hu F, Guo Y, Su Y, Cui G, Li J, Qiu Q and He Q (2023) Exurban and suburban forests have superior healthcare benefits beyond downtown forests. Front. Ecol. Evol. 11:1105213. doi: 10.3389/fevo.2023.1105213
Edited by:
Bao-Jie He, Chongqing University, ChinaReviewed by:
Xiaowei Li, Xi'an University of Architecture and Technology, ChinaYang Liu, Zhongnan Hospital, Wuhan University, China
Copyright © 2023 Zhu, He, Hu, Guo, Su, Cui, Li, Qiu and He. This is an open-access article distributed under the terms of the Creative Commons Attribution License (CC BY). The use, distribution or reproduction in other forums is permitted, provided the original author(s) and the copyright owner(s) are credited and that the original publication in this journal is cited, in accordance with accepted academic practice. No use, distribution or reproduction is permitted which does not comply with these terms.
*Correspondence: Quan Qiu, ✉ cXFpdUBzY2F1LmVkdS5jbg==; Qian He, ✉ aGVxaWFuQHNjYXUuZWR1LmNu
 Shuxin Zhu
 Shuangyu He1
 Quan Qiu
 Qian He