 Yu Tao
 Lei Tian
 Chun Wang1,2*
94% of researchers rate our articles as excellent or good
Learn more about the work of our research integrity team to safeguard the quality of each article we publish.
Find out more
ORIGINAL RESEARCH article
Front. Ecol. Evol., 14 February 2023
Sec. Population, Community, and Ecosystem Dynamics
Volume 11 - 2023 | https://doi.org/10.3389/fevo.2023.1102015
This article is part of the Research TopicThe Effects of Climate Change and Anthropogenic Activities on Patterns, Structures and Functions of Terrestrial EcosystemsView all 18 articles
Land use and land cover (LULC) change is a pattern of alteration of the Earth’s land surface cover by human society and have a significant impact on the terrestrial carbon cycle. Optimizing the distribution of LULC is critical for the redistribution of land resources, the management of carbon storage in terrestrial ecosystems, and global climate change. We integrated the patch-generating land use simulation (PLUS) model and integrated valuation of ecosystem services and trade-offs (InVEST) model to simulate and assess future LULC and ecosystem carbon storage in the Nanjing metropolitan circle in 2030 under four scenarios: natural development (ND), economic development (ED), ecological protection (EP), and collaborative development (CD). The results showed that (1) LULC and carbon storage distribution were spatially heterogenous in the Nanjing metropolitan circle for the different scenarios, with elevation, nighttime lights, and population being the main driving factors of LULC changes; (2) the Nanjing metropolitan circle will experience a carbon increase of 0.50 Tg by 2030 under the EP scenario and losses of 1.74, 3.56, and 0.48 Tg under the ND, ED, and CD scenarios, respectively; and (3) the CD scenario is the most suitable for the development of the Nanjing metropolitan circle because it balances ED and EP. Overall, this study reveals the effects of different development scenarios on LULC and ecosystem carbon storage, and can provide a reference for policymakers and stakeholders to determine the development patterns of metropolitan areas under a dual carbon target orientation.
Human society interacts with the natural environment through land use and land cover (LULC) change (Sleeter et al., 2017; Homer et al., 2020; Yee et al., 2021; Zhai et al., 2021; Lal et al., 2022). Scientific planning for LULC is essential for the achievement of global sustainable development goals, as it has a significant impact on global climate change, food security, biodiversity conservation, and carbon sources and sinks (Lambin and Meyfroidt, 2011; Arneth et al., 2014; Popp et al., 2014; Powers and Jetz, 2019). LULC and its dynamics are key scientific issues in the study of human carbon emissions in the current dual-carbon context (Tang et al., 2021; Bukoski et al., 2022; Wang et al., 2022) and global climate change (Winkler et al., 2021; Meyfroidt et al., 2022; Tian et al., 2022b). Indeed, global climate change is already an indisputable fact (Wilfried, 2007; Gauthier et al., 2014; Lawal et al., 2019; Tian and Fu, 2020) and atmospheric concentrations of greenhouse gases (GHG; e.g., CO2 and CH4) directly influence the global average temperature (Solomon et al., 2009; Cramer et al., 2018; Tian et al., 2022a). Some research suggests that in order to prevent warming by more than 1.5°C, GHG emissions need to be reduced by 7.6% per year from 2019 to 2030 (Huppmann et al., 2018; Rogelj et al., 2018; United Nations Environment Programme, 2019). This will require joint efforts from governments worldwide. Over the past few decades, most of the world’s major cities have expanded, with more than 50% of the population already living in cities, and by 2050, the urban population is expected to reach 66% (Ayanlade, 2016). However, as urbanization continues to accelerate, the driving force of economic development (ED) has gradually shifted from agriculture to industry and services and the increasing level of urbanization has led to dramatic changes in LULC, which significantly impacts terrestrial ecosystem functions and directly affects the carbon storage of terrestrial ecosystems (Feddema et al., 2005; Newbold et al., 2015; Li et al., 2019). Carbon storage in terrestrial ecosystems is widely recognized as an indicator of ecosystem services and plays a key role in the global carbon cycle (Lu et al., 2013; Wang et al., 2022). Reducing carbon emissions from land use and sequestering CO2 from the atmosphere into terrestrial ecosystems is one of the most economical and environmentally friendly ways to mitigate global climate change (Molotoks et al., 2018; Dybala et al., 2019). For example, increasing the area of forest ecosystems through afforestation could contribute to increasing carbon storage in terrestrial ecosystems (Tian et al., 2022b).
Previous studies indicated that LULC changes are affected by climate change and human activity (Sleeter et al., 2017; Homer et al., 2020; Lal et al., 2021; Yee et al., 2021; Zhai et al., 2021). In recent decades, the conflict between humans and land has intensified and human activities have significantly affected changes in LULC, causing problems for ecosystems, climate, and biodiversity (Foley et al., 2005; Thonfeld et al., 2020; Lee, 2021). Since the implementation of the reform and opening-up policy, the urbanization process in China has accelerated significantly (Li et al., 2018), with a dramatic increase in the urbanization rate from 17.92 to 59.58% (Zhu et al., 2020). Liu et al. (2020) mapped the global annual urban dynamics from 1985–2015 using Landsat data, and the results showed urbanization accelerated in developing countries (for example, China, India, Saudi Arabia and a few urban clusters in Africa) but decelerated in developed countries (for example, United States, Canada, Japan and European countries). For example, in the Shanghai area of China, the average growth rate of urban lands is 49.5 km2 yr.−1, By contrast, in the Chicago area, one of the most urbanized regions in the United States, the mean increase in urban area during 1985–2015 is 21.3 km2 yr.−1. Furthermore, many Chinese cities are exhibiting an accelerated pace of urbanization due to the dependence of financial revenues on real estate and land transactions (Huang et al., 2017). Rapid ED and intensive land development have decreased the carbon storage in terrestrial ecosystems and destroyed local ecological environments, which further contributes to climate warming (Zhu et al., 2021; Tian et al., 2022b). Therefore, there is a need for anthropogenic planning of LULC development patterns to coordinate ED and ecological conservation, which is essential for optimizing future regional urban planning and maintaining ecosystem carbon balance (Liao et al., 2022; Sun et al., 2022; Tian et al., 2022b).
In the process of urbanization, cities develop to a mature stage and will form urban agglomerations, which is a new geographical unit (Schoenberger and Walker, 2017). It is a spatially compact, economically connected, and ultimately highly co-located and integrated group of cities formed by a well-developed transportation and communication infrastructure network. The Nanjing metropolitan circle, the first inter-provincial metropolitan area planned and built in China, its goal is to form an economic zone with Nanjing as the center and to develop and strengthen the zone as a whole; that is, to take one city as the leader to drive the development of surrounding cities and towns. The Nanjing metropolitan circle plays an important role in the construction of the “One Belt and Road,” the integrated development of the Yangtze River Delta, the development of the Yangtze River Economic Belt, and other major strategies. With the continuous strengthening of policy guidance for the synergistic development of urban agglomerations, an optimal layout of urban agglomeration land use that reflects the national strategic intent and scientific, sustainable, and equitable development is urgently required. Therefore, integrated planning of the urban development pattern of the Nanjing metropolitan circle is necessary to optimize the future urban structure, protect local ecological environment, and maintain regional carbon balance.
Several models have been developed for land use simulation, such as the cellular automata (CA)-Markov model (Wu H. et al., 2019; Zhao et al., 2019), Logistic-CA-Markov model (Guan et al., 2019), Artificial Neural Network-CA model (Yang et al., 2016; Xu et al., 2019), Mixed-cell CA model (Liang et al., 2021a), CLUS-S model (Luo et al., 2010; Jiang et al., 2017), and FLUS model (Liu et al., 2017; Liang et al., 2018). Yet, in spite of some successful applications of the above models in land use simulation, the inability to effectively identify the factors affecting LULC and the inability to simulate land use units in a dynamic spatio-temporal manner, which clearly limits the application of LULC simulation under multi-factor-driven conditions (Wang et al., 2022). The patch-generating land use simulation (PLUS) model developed by Liang et al. (2021b) is a future land use simulation model used to improve the understanding of the driving factors of LULC change and has a higher simulation accuracy than other CA models. The model is capable of performing future land use change simulation by deciphering the deep relationships between sites and resolving land use change strategies, thereby improving land use simulation accuracy (Liang et al., 2021b). For example, Zhai et al. (2021) predicted the land distribution pattern in Wuhan, China, in 2029 using the PLUS model based on the spatiotemporal pattern of LULC changes during the urbanization process in the city from 2000 to 2019. Zhang et al. (2022) integrated the PLUS model with multiple linear regression and Markov chain models to predict the landscape patterns in the Fujian Delta region by 2050. Furthermore, studies have combined the PLUS model and integrated valuation of ecosystem services and trade-offs (InVEST) model to assess carbon storage changes in terrestrial ecosystems caused by changes in LULC (Wang et al., 2022; Tian et al., 2022b). Current urban land use layout optimization strategies can consider urban agglomerations as a whole or each city as an isolated individual. Denoting the regional synergistic development of urban agglomerations, establishing optimization objectives applicable to the urban agglomeration scale, and carrying out urban agglomeration land use layout optimization remains a major challenge in land use research. Therefore, it is important to explore the land use distribution patterns of future cities under different scenarios and their impacts on carbon storage to find the optimal solution for planning scenarios of metropolitan areas under the dual carbon target (i.e., carbon peaking and carbon neutrality) and to provide a leading and demonstration role for other metropolitan areas in China.
Here, we set four future development scenarios for the Nanjing metropolitan circle and integrated the PLUS and InVEST models to dynamically simulate land use distribution patterns under different scenarios and assess the changes in carbon storage due to changes in LULC. Specifically, we aimed to (1) simulate the spatial distribution of LULC in the Nanjing metropolitan circle for a temporal range of 2020–2030 using the PLUS model; (2) assess the dynamics of carbon storage under different development scenarios; and (3) explore the optimal scenario of future urban development in the Nanjing metropolitan circle. Overall, this work is important for optimizing the land use development pattern of the Nanjing metropolitan circle, providing guidance to government departments and decision makers in urban planning, facilitating the formulation of reasonable policies, and for the rational use and synergistic development of land resources in urban agglomerations.
The Nanjing metropolitan circle, an economic zone centered around Nanjing, in eastern China, covers a core area of the urban zone along the middle and lower reaches of the Yangtze River. It spans over the Jiangsu and Anhui provinces and is the first planned cross-provincial metropolitan circle in China. The Nanjing metropolitan circle ranges from 29°57’N–34°05’N and 117°09′ E–119°58′E and includes 33 municipal districts, 11 county-level cities, and 16 counties, with a total area of 66,000 km2 (Figure 1). The Nanjing metropolitan circle connects the north, south, east, and west of China, with a special geographical location and various city types. It is an important conduction area for the Yangtze River Delta to drive the development of the central and western regions and has an important position in the national Yangtze River Economic Belt development strategy. In 2021, the Nanjing metropolitan circle had a resident population of 3,582.47 million and a regional gross domestic product (GDP) of 4.6 trillion RMB. It contains 0.7% of the country’s land area and 2.5% of the resident population and generates 4.1% of China’s GDP (National Bureau of Statistics, 2021).
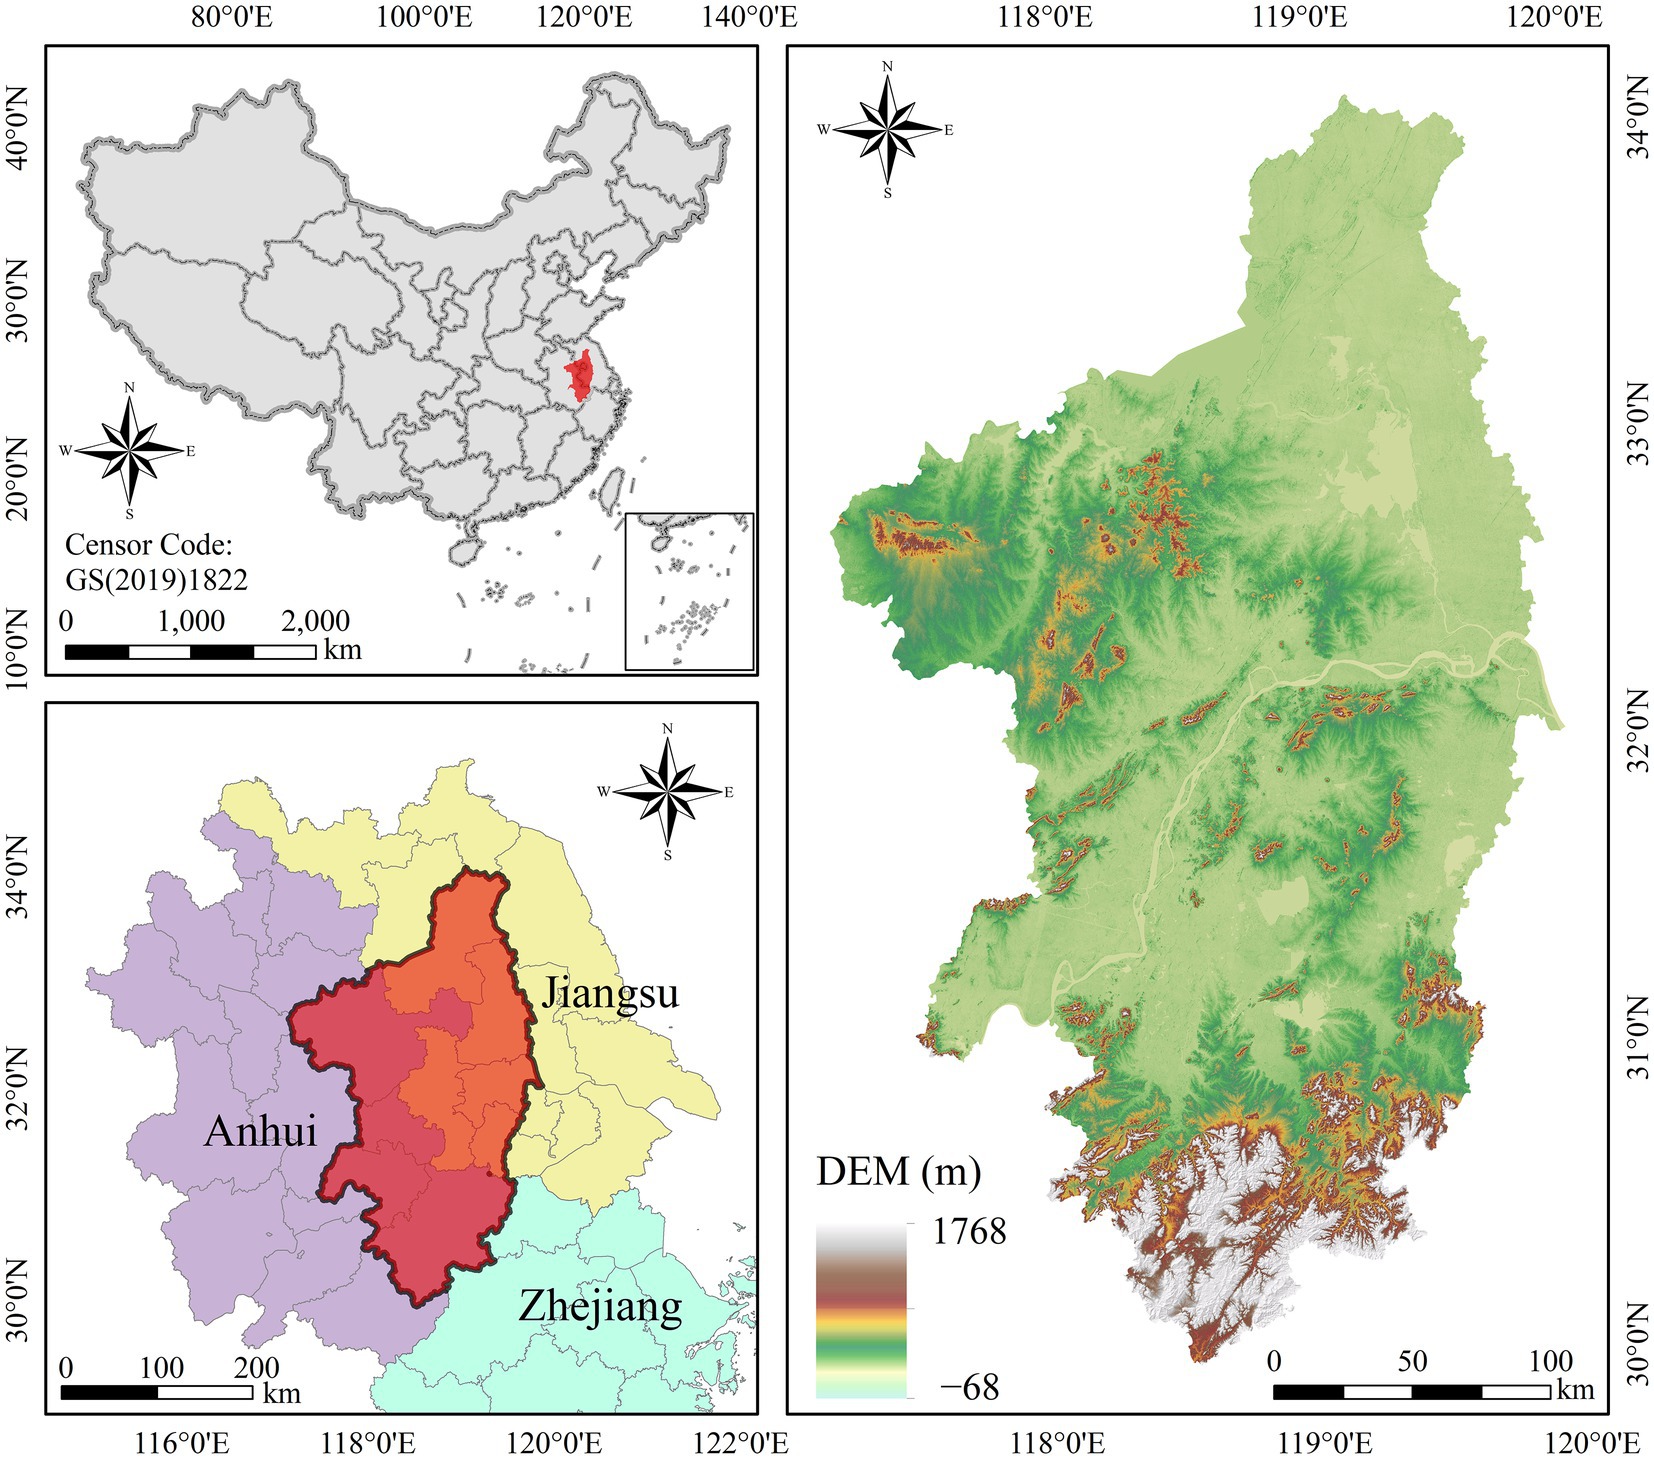
Figure 1. Location of Nanjing metropolitan circle with a digital elevation model (DEM).
The Nanjing metropolitan circle has a humid northern subtropical climate with four distinct seasons and abundant rainfall. The average annual rainfall days per year is 117, with an average annual precipitation and temperature of approximately 912 mm and 16.18°C, respectively. The topography of the Nanjing metropolitan circle is high in the south and low in the north and most cities in the region have flat terrain. The southern area has a high forest coverage rate with rich forestry resources. Moreover, the region has many river systems with large lakes and rivers, such as Hongze and Gaoyou Lakes and the Yangtze and Huai Rivers, and a large area of water and wetlands.
The data used in this study include LULC data and its driving factors (i.e., socioeconomic data and natural environmental data), as shown in Table 1. Specifically, the LULC data for the Nanjing metropolitan circle for 2000, 2010, and 2020 were obtained from the GLOBELAND30 dataset produced by the National Geomatics Center of China. Based on the actual land use types in the study area, the LULC data (with a spatial resolution of 30 m) were reclassified into six categories: cropland, forest, grassland, water, artificial surface, and other (Figure 2). The socioeconomic data included population density, GDP, nighttime lights, government, residents, train station locations, and various levels of road vector data.
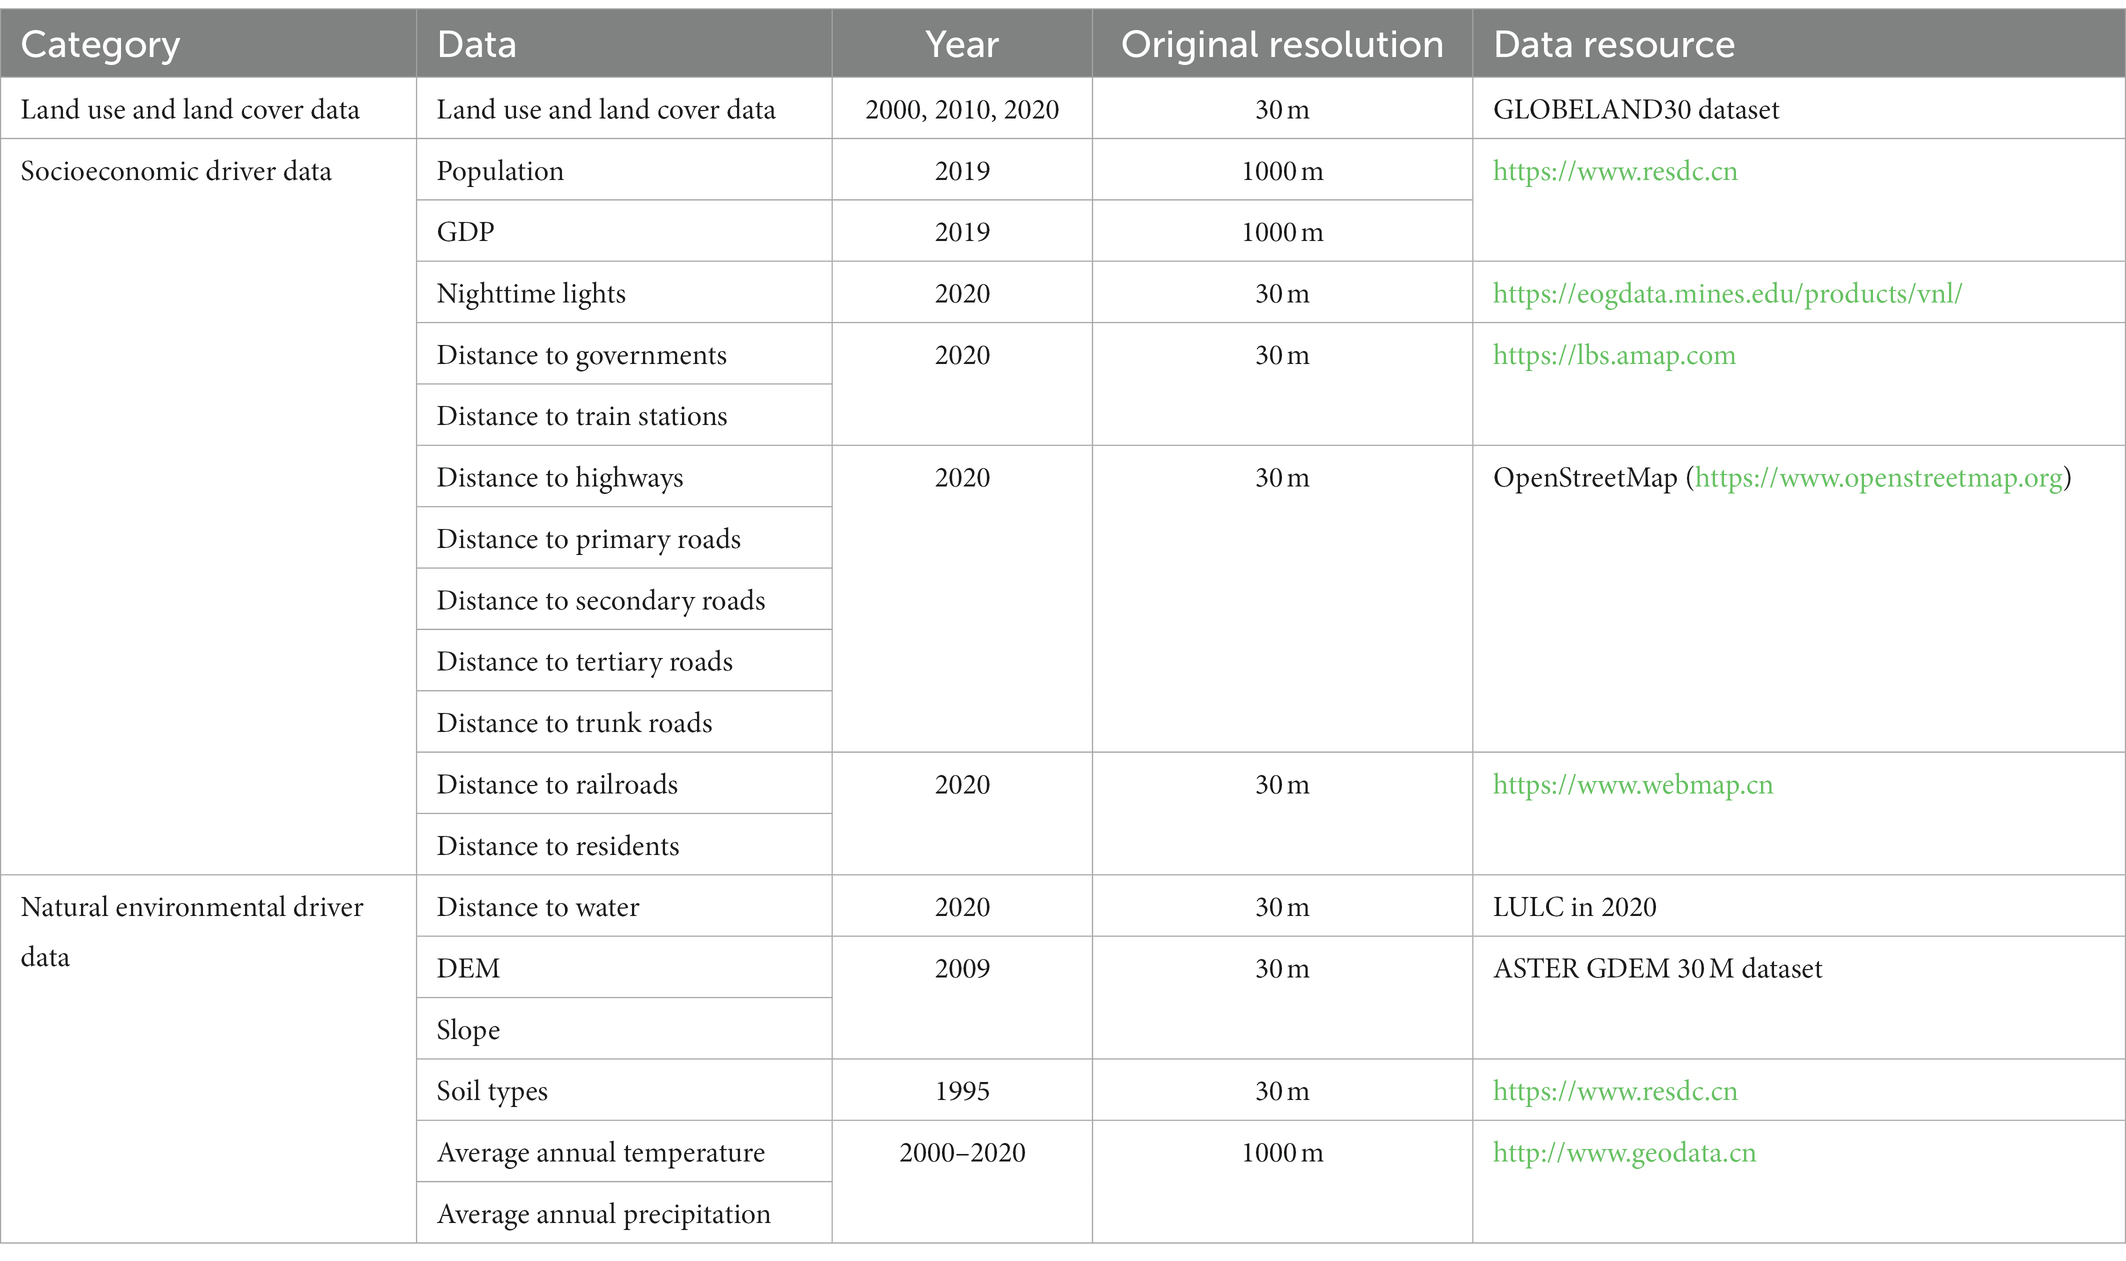
Table 1. Spatial driving factors of the land use change in this study.
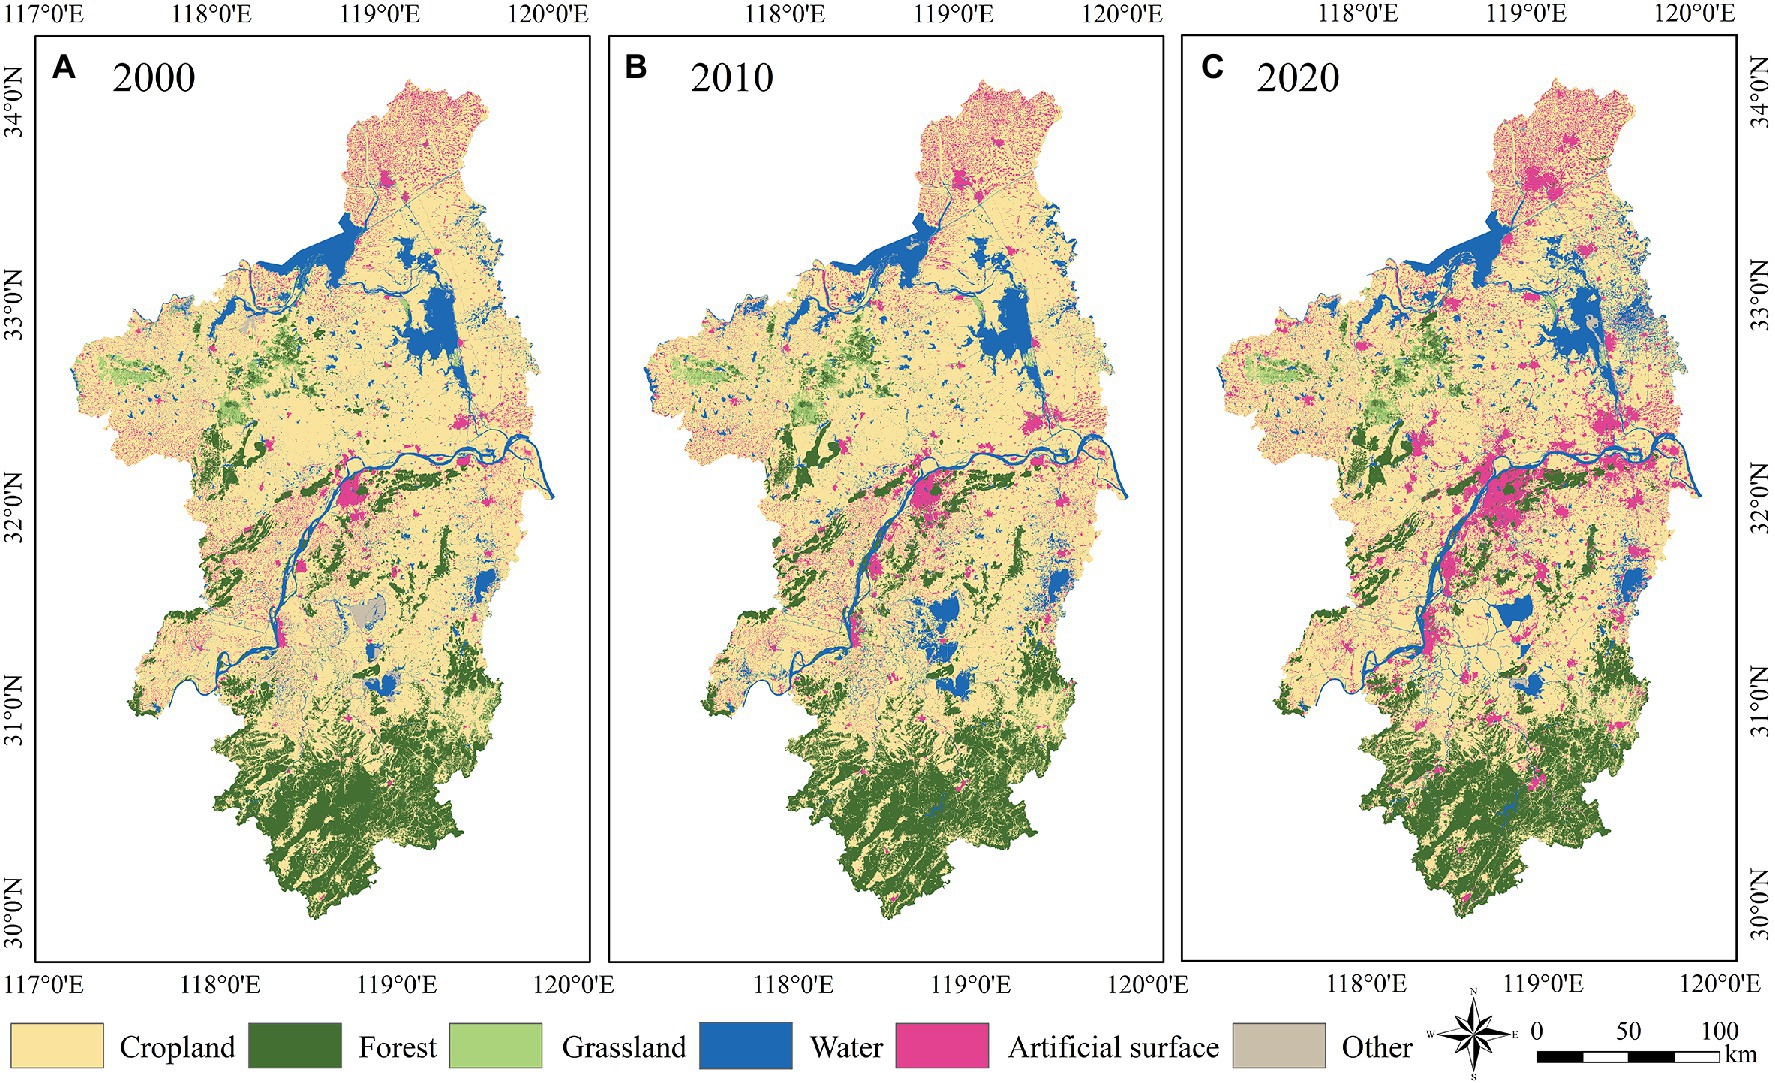
Figure 2. Historic LULC data in (A) 2000, (B) 2010, and (C) 2020 for the Nanjing metropolitan circle.
The natural environment data included temperature, precipitation, soil type, digital elevation model (DEM), and slope data, with the slope data being obtained by DEM processing. All the above driving factor data has been processed to 30 m spatial resolution after a series of preprocessing steps as requirement of PLUS Model (Liang et al., 2021b). These preprocessing steps included projection transformation, Euclidean distance generation, resampling, and cropping. The temporal range of the data was kept as close as possible to that of the LULC data in 2020; however, owing to data acquisition limitations, data from similar years were used for some factors (Long et al., 2013).
Historical LULC change trends and Markov chain methods have been used to estimate future land use demand (Munsi et al., 2012; Nor et al., 2017; Li et al., 2021). Specifically, land use dynamics changes and land use conversion matrices were used to adjust the conversion probabilities in Markov chains to estimate land use demand for different scenarios. In order to effectively evaluate the potential effects of future LULC changes on regional carbon storage, four LULC change scenarios were developed for the Nanjing metropolitan circle from 2020 to 2030 (Wang et al., 2018; Zhai et al., 2021; Zhang and Gu, 2022): natural development (ND), ED, ecological protection (EP), and collaborative development (CD) scenario. The four scenarios were set as follows:
On the basis of the historical change trends of each land use type from 2000 to 2020, this scenario makes a linear prediction of land use patterns in the Nanjing metropolitan circle in 2030. This scenario implies that each land use type’s demand only evolves linearly in accordance with its historical evolutionary trajectory and is unaffected by other external causes (conversion probability matrix for the period 2000–2020), making it an ideal state land use development scenario.
As the core engine of ED in the Yangtze River Economic Belt, the Nanjing metropolitan circle is one of the most economically dynamic international urban agglomerations. The ED scenario simulates a land use structure that prioritizes ED, with the goal of maximizing economic benefits by availing all land use types. Under this scenario, the conversion probability of cropland, forest, grassland, and other land, except water, to artificial surfaces increases by 30% and the conversion probability of artificial surfaces to any other land type decreases by 40%. This scenario helps to scientifically grasp the risk of land use conflicts in the fast-growing Nanjing metropolitan circle, and reveals the potential menace of the “GDP-only” development model to social stability and environmental carrying capacity.
The dense population and rapidly developing economy in the Nanjing metropolitan circle have caused considerable real or potential harm to the local ecological environment. To promote further optimization and enhancement of the Nanjing metropolitan circle, it is necessary to place EP in a prominent position. The conversion of cropland, forest and grassland with ecological functions to Artificial surface was strictly controlled by referring to the Ecological restoration planning of land space in Anhui Province (2021–2035) and the Draft of master plan of land and space of Nanjing Municipality (2021–2035). The EP scenario ensures that land types providing ecological services, such as forests, grasslands, and water bodies, are conserved and prioritized for development by setting ecological priority development strategies. Under this scenario, the expansion of urban areas is restricted and water is not transferred to other land uses; therefore, the conversion probability of forests, grasslands, and artificial surfaces decreases by 35%, the conversion probability of cropland to forests and grasslands increases by 25 and 20%, respectively, and the conversion probability of grassland to forest increases by 15%. This scenario is an important reference for mitigating land-use conflicts, promoting the delineation of ecological red lines, establishing a nature reserves mainly as national parks, and implementing the national main function zone system.
ED and EP are not opposites and can promote each other and develop together. With according to the Territorial Spatial Planning of Anhui Province (2021–2035) (Draft for comments) and the Draft of master plan of land and space of Nanjing Municipality (2021–2035). The CD scenario takes into consideration high-quality ED while balancing good economic and ecological benefits of regional synergistic development. This scenario constructs a harmonious human-land relationship in the Nanjing metropolitan circle by harmonizing ED and EP. The transition probability of forest and grassland to artificial surfaces was reduced by 40%, the transition probability of cropland to artificial surfaces was reduced by 50%, the transition probability of cropland to other land was reduced by 20%, and the transition probability of other land to grassland and forest land increased by 50%. This scenario is important for coordinating economic and ecological benefits, promoting the development of the Nanjing metropolitan circle in harmonious economic and ecological conditions, and promoting high quality development of homeland space.
The PLUS model was used to simulate the distribution pattern of LULC in Nanjing metropolitan circle in 2030 under different scenarios, which consists of two main components: (1) land expansion analysis strategy (LEAS) model for obtaining the development probabilities of various land use types; (2) CA model based on the multi-type random patch seeds (CARS) model for spatio-temporal dynamics simulation of land patches (Liang et al., 2021b). The LEAS module first extracts the fraction of expansion of each land type between the two periods of LULC change and samples it together with the responding driving factors, and uses the random forest (RF) algorithm to obtain the contribution of the driving factors and the development potential of each land category. Subsequently, the CARS model incorporates stochastic seeding and a threshold decreasing mechanism for land use simulation under the constraint of development probability. Previous studies confirmed that the PLUS model can mine the potential linkages between various driving factors and geographic units to develop future land use change patterns with higher accuracy and more realistic landscape patterns (Zhai et al., 2021; Wang et al., 2022; Tian et al., 2022b).
In this study, 18 driving factors (Figure 3) were collected to facilitate LULC simulations, as described in Section 2.2. First, the 2020 LULC data were simulated based on the 2000 and 2010 LULC data (Figure 2) to assess the model accuracy. Moreover, the PLUS model based on the RF algorithm was used to assess the contribution of each driving factor to future land use patterns, which aids in understanding the effect of the driving factors on future land use changes.
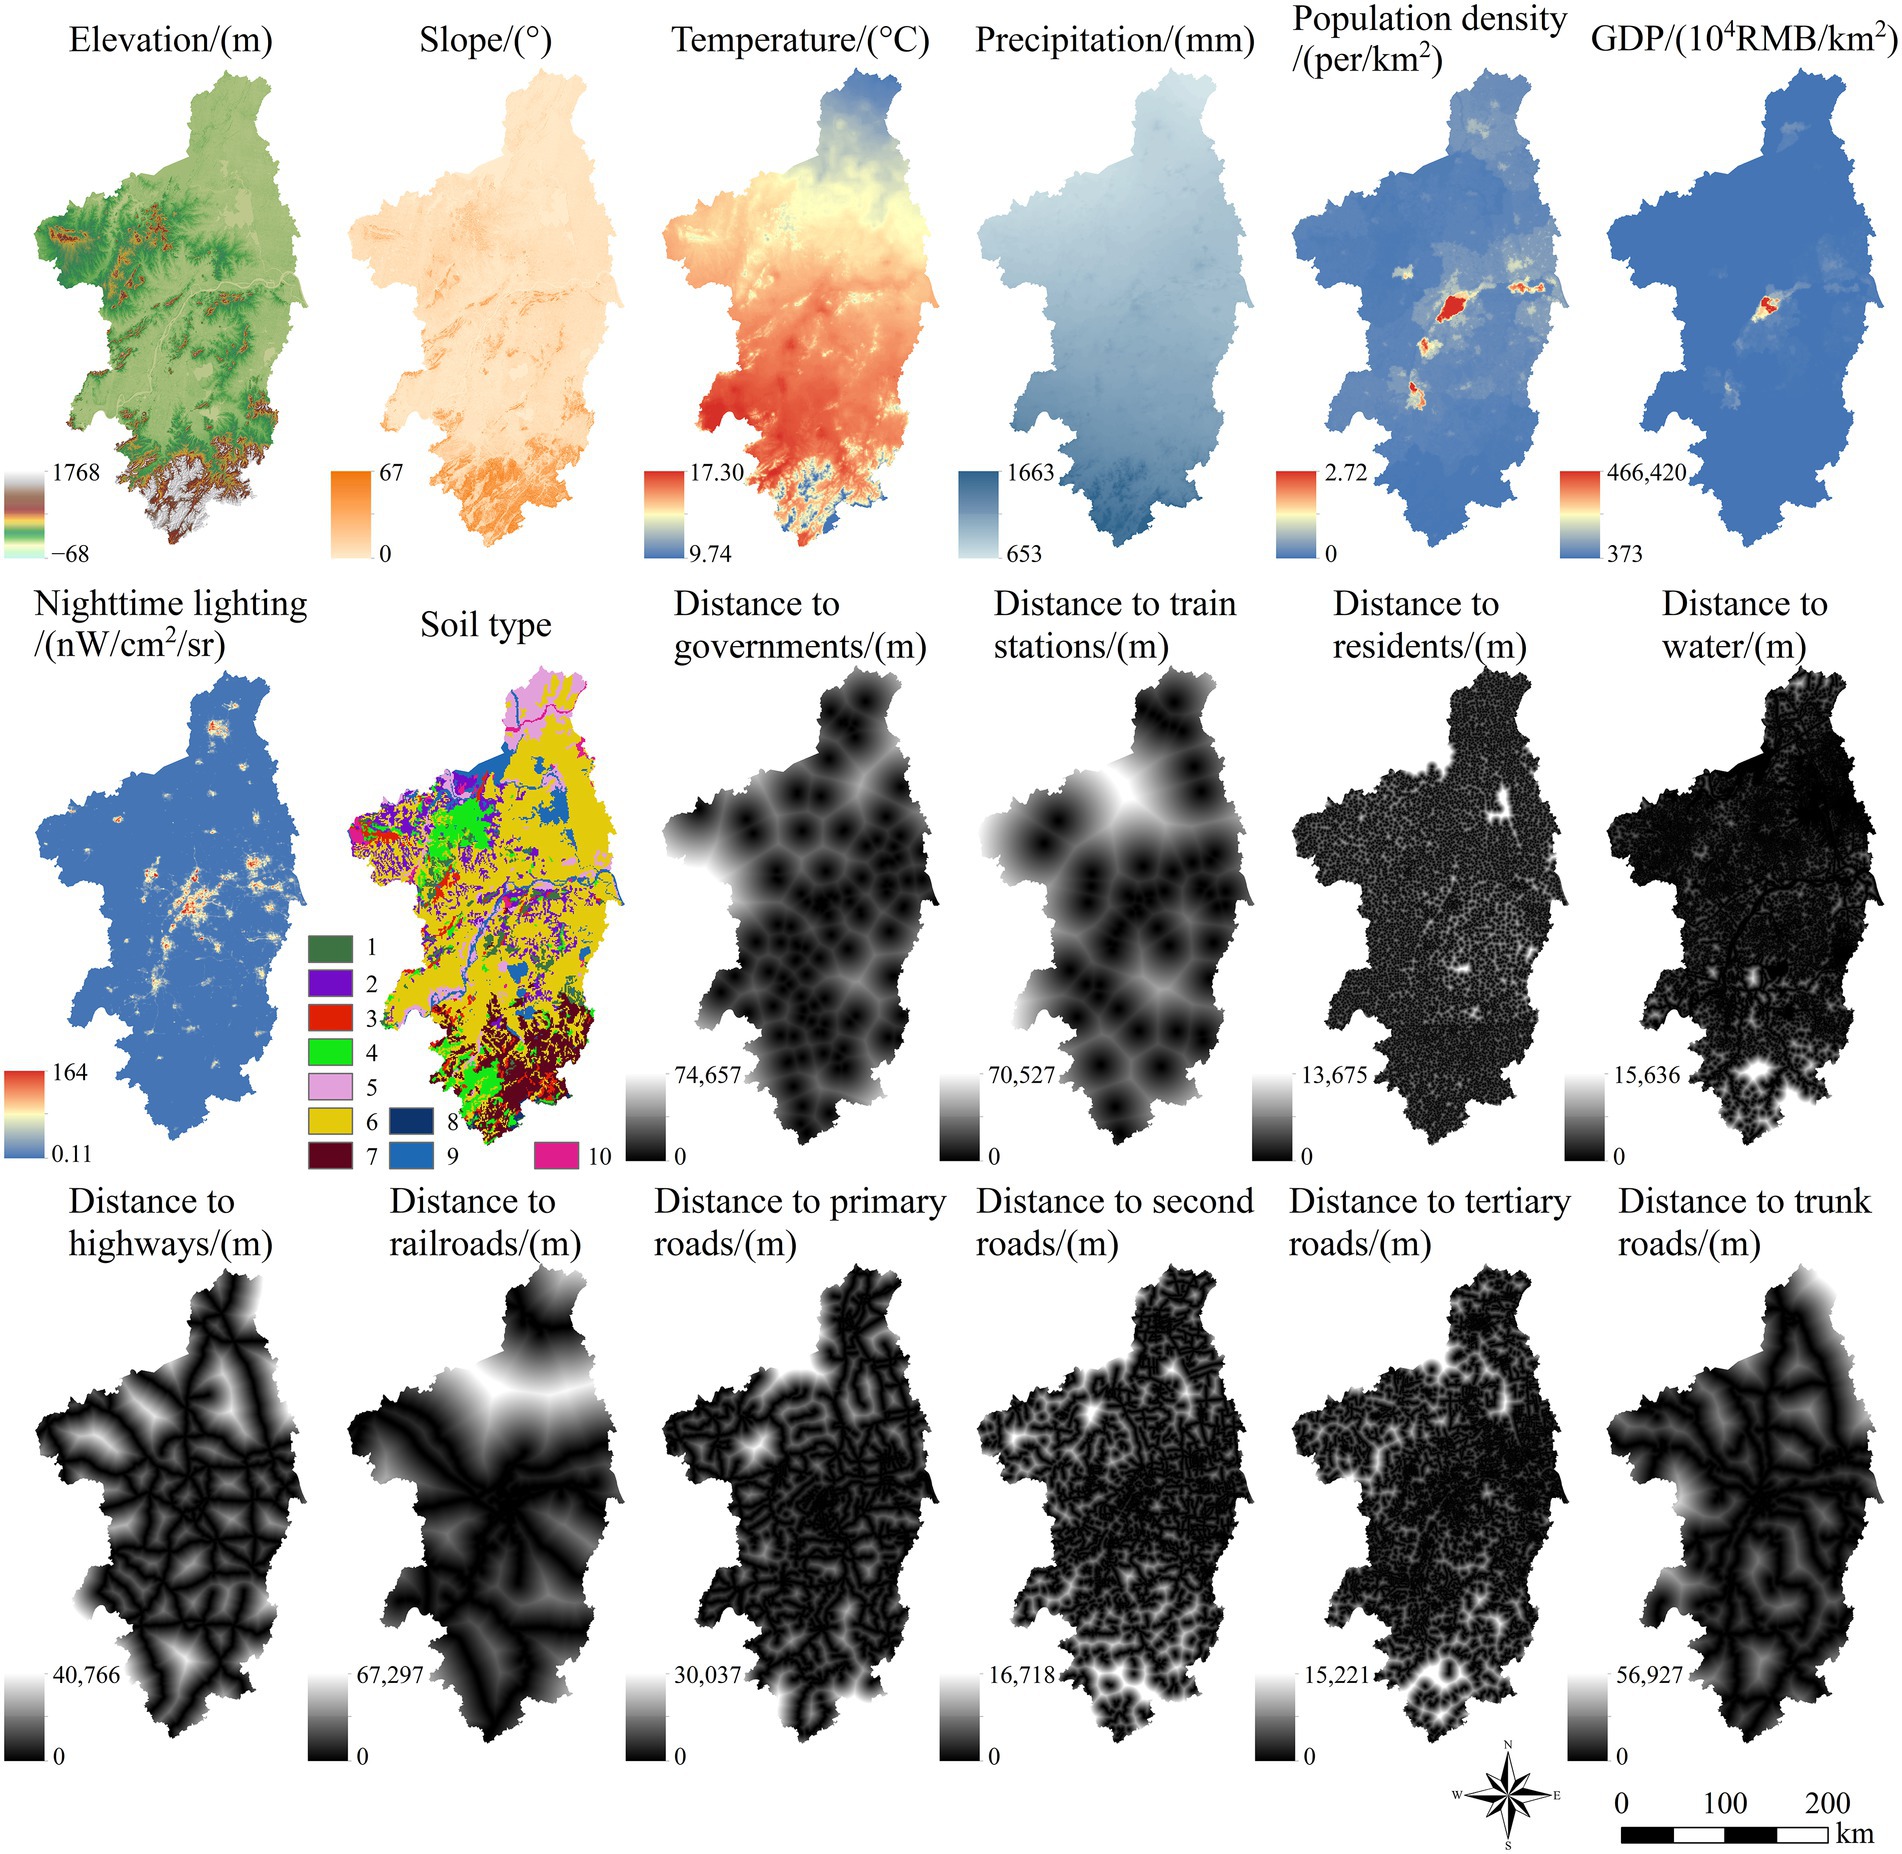
Figure 3. The 18 driving factors affecting LULC. Note: The legend of soil type represents, 1: yellow-brown soils; 2: yellow-cinnamon soils; 3: limestone soils; 4: chisley soils; 5: fluvo-aquic soils; 6: paddy soils; 7: red earths; 8: yellow earths; 9: water; and 10: others.
The InVEST model estimates terrestrial ecosystem carbon storage by the carbon density of each land use type and the corresponding area (Sharp et al., 2020). We set the carbon densities of the LULC ecosystem using values from previous studies, as shown in Table 2 (Wang et al., 2011; Xu et al., 2014; Fang et al., 2021). Furthermore, the economic value of sequestering one ton of carbon is assumed to be 57.50 RMB (from the carbon market trading price in China on September 30, 2022), with the annual rate of change in carbon prices and the market discount rate of 0 and 3%, respectively (Babbar et al., 2021). Specifically, we combined the PLUS model with the InVEST model to explore the effects of land use change on the carbon storage of the Nanjing metropolitan circle from 2020 to 2030 under the different scenarios. The general research framework included (1) simulation of LULC data based on the PLUS model and (2) assessment of ecosystem carbon storage changes due to LULC changes using the InVEST model (Figure 4).
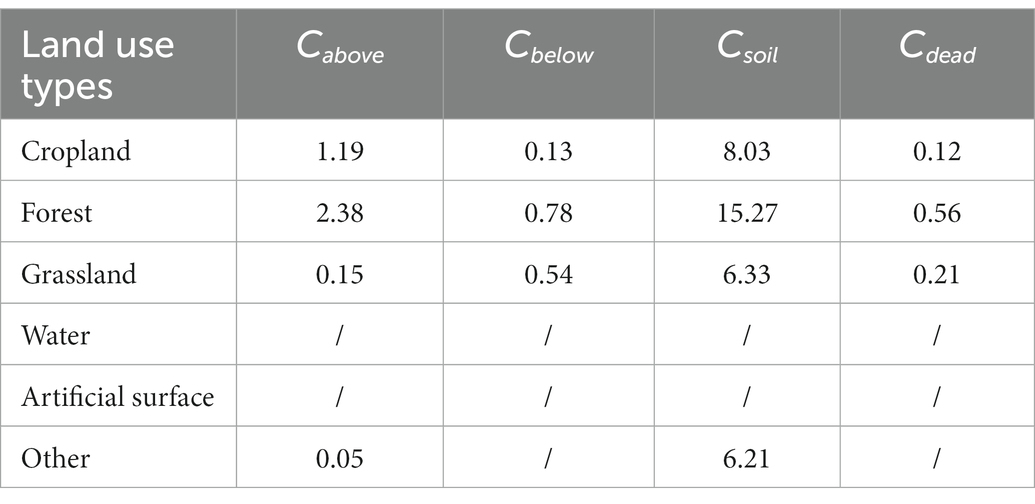
Table 2. Carbon density for each LULC (kg/m2).
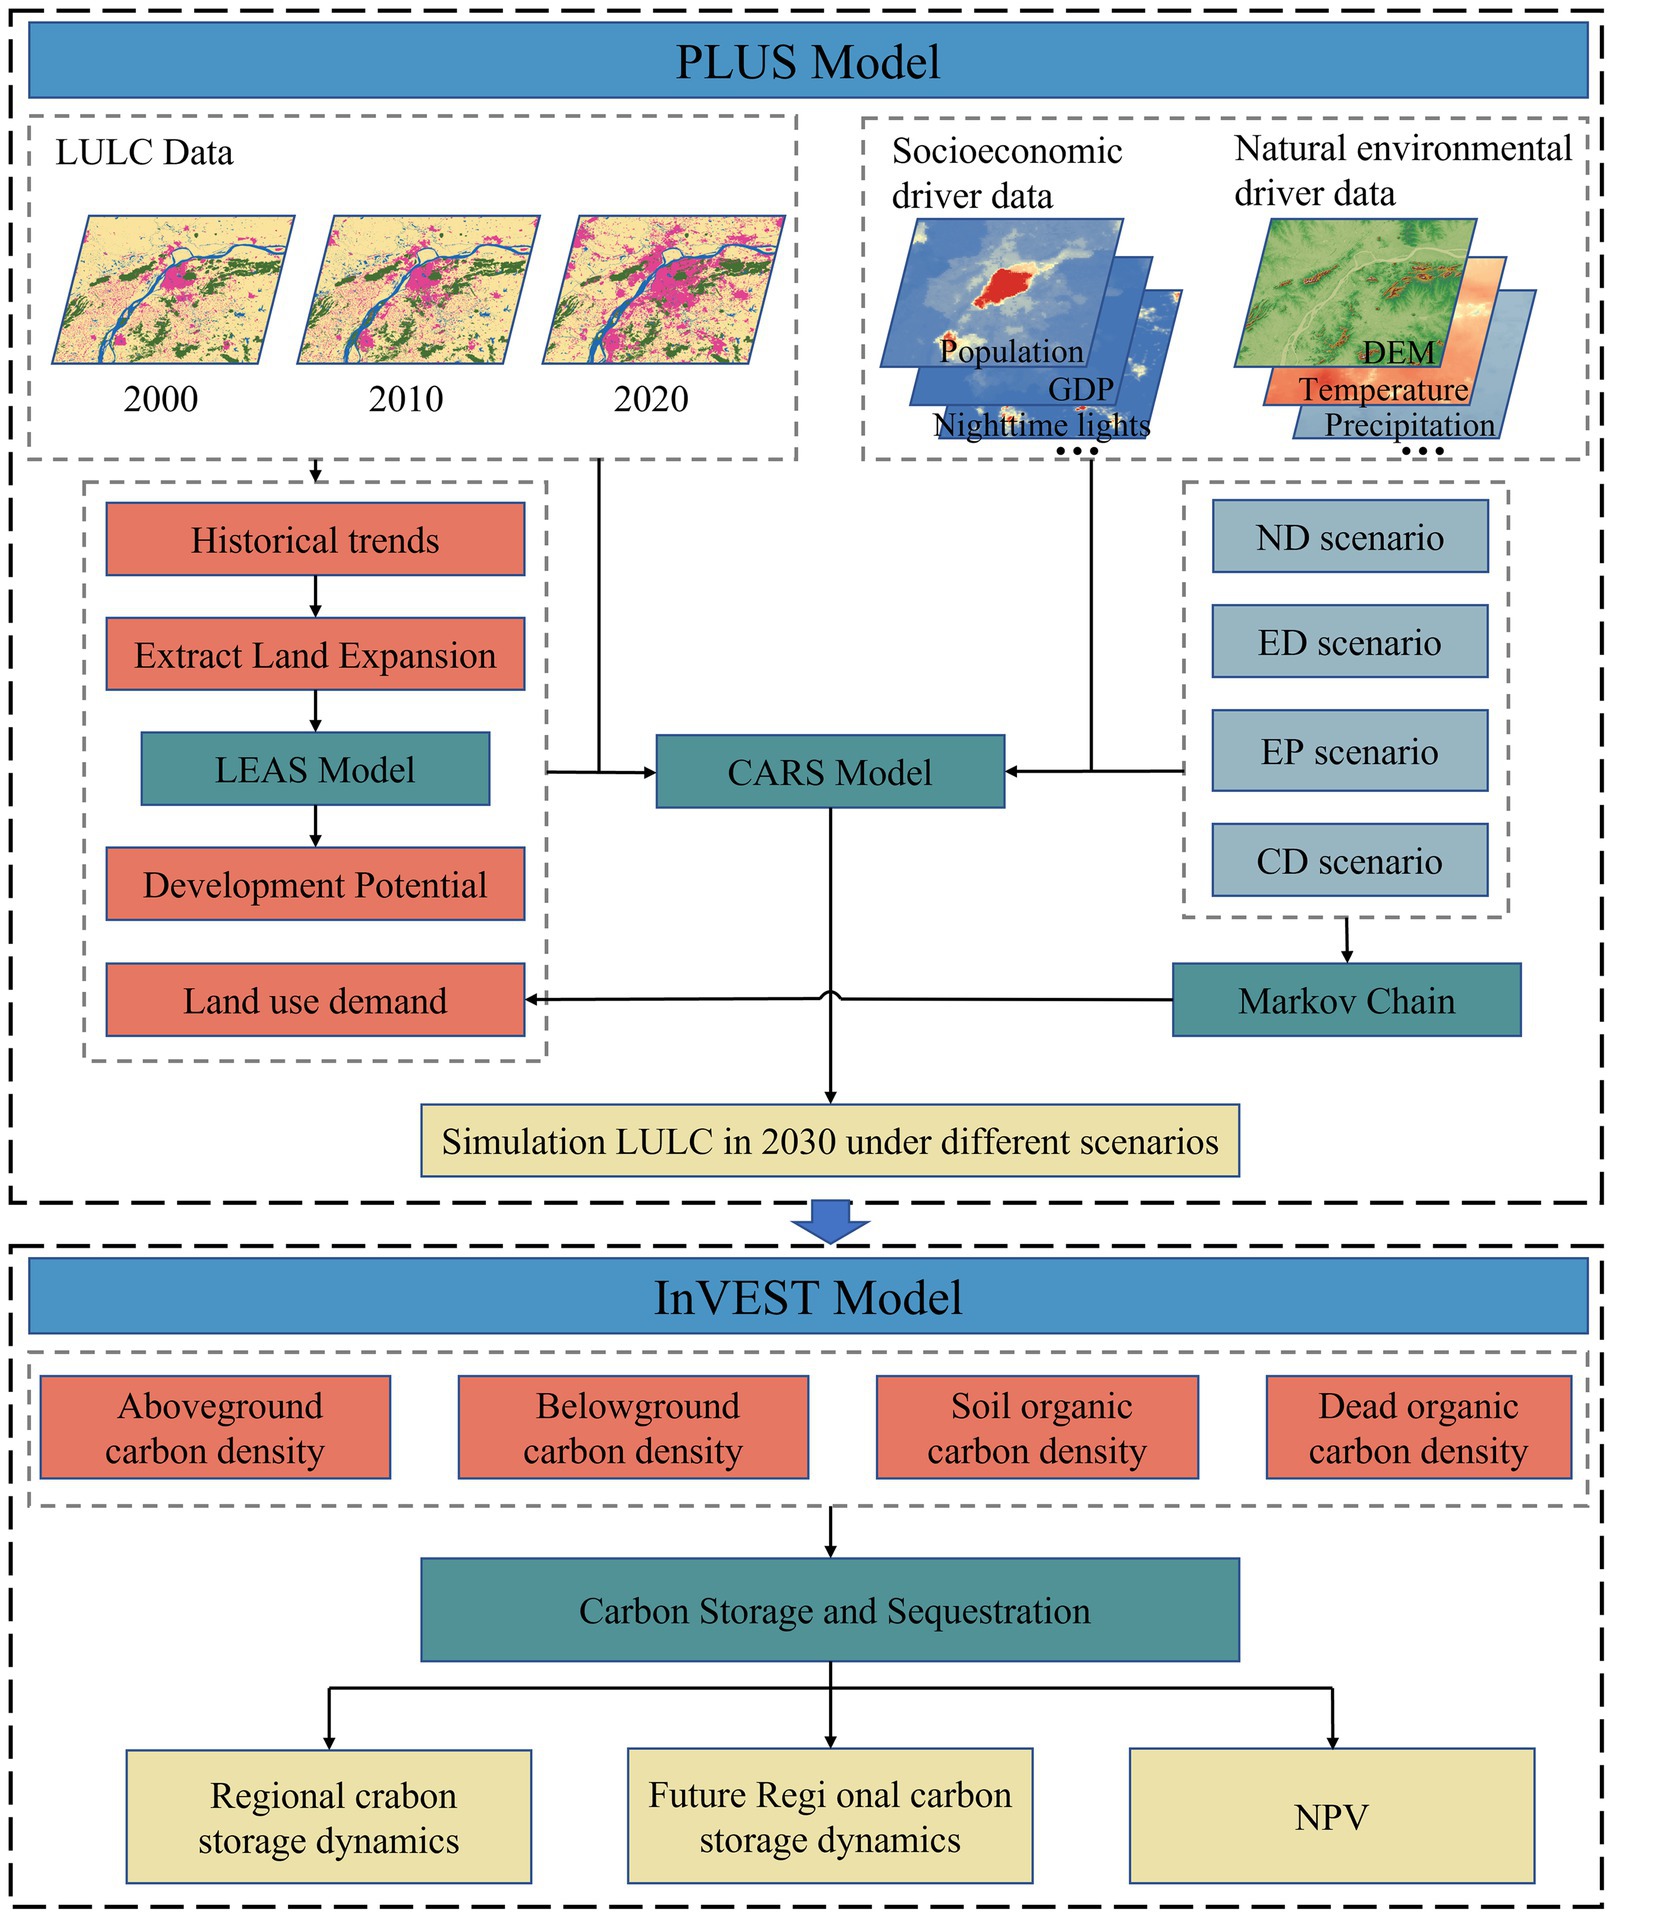
Figure 4. Research framework.
The contributions of the driving factors for each land use type based on the RF algorithm, as illustrated in Figure 5. It should be noted that the contribution of the driving factor of the water body is not given in Figure 5 due to the small area of change in the water, which was mainly affected by a single driving factor, which is the distance to the water (96.73%). The main driving factors for the change in cropland were nighttime light (12.90%), distance to water (12.39%), and temperature (10.30%). Nighttime lights are indicators of urban development and can represent the rate of urban expansion. The loss of cropland was mainly due to urban expansion and agricultural restructuring. The main driving factors affecting forests were elevation (13.68%), population (13.09%), and nighttime lights (9.73%). Specifically, forests are mainly distributed in the higher elevation areas in the southern part of the study area (Figures 1, 3) and elevation may have affected the interconversion of forest to non-forest land use types. Elevation (17.48%) is the main driving factor for grassland changes. Distance from water (16.50%), nighttime lights (14.72%), and elevation (12.70%) were the main driving factors for artificial surface expansion. The water area generally does not convert to other land use types and urban expansion tends to avoid water areas. Elevation (12.70%) was also the primary driving factor for other land use types. In conclusion, the main driving factors of LULC change in the Nanjing metropolitan circle are elevation, nighttime lights, and population.
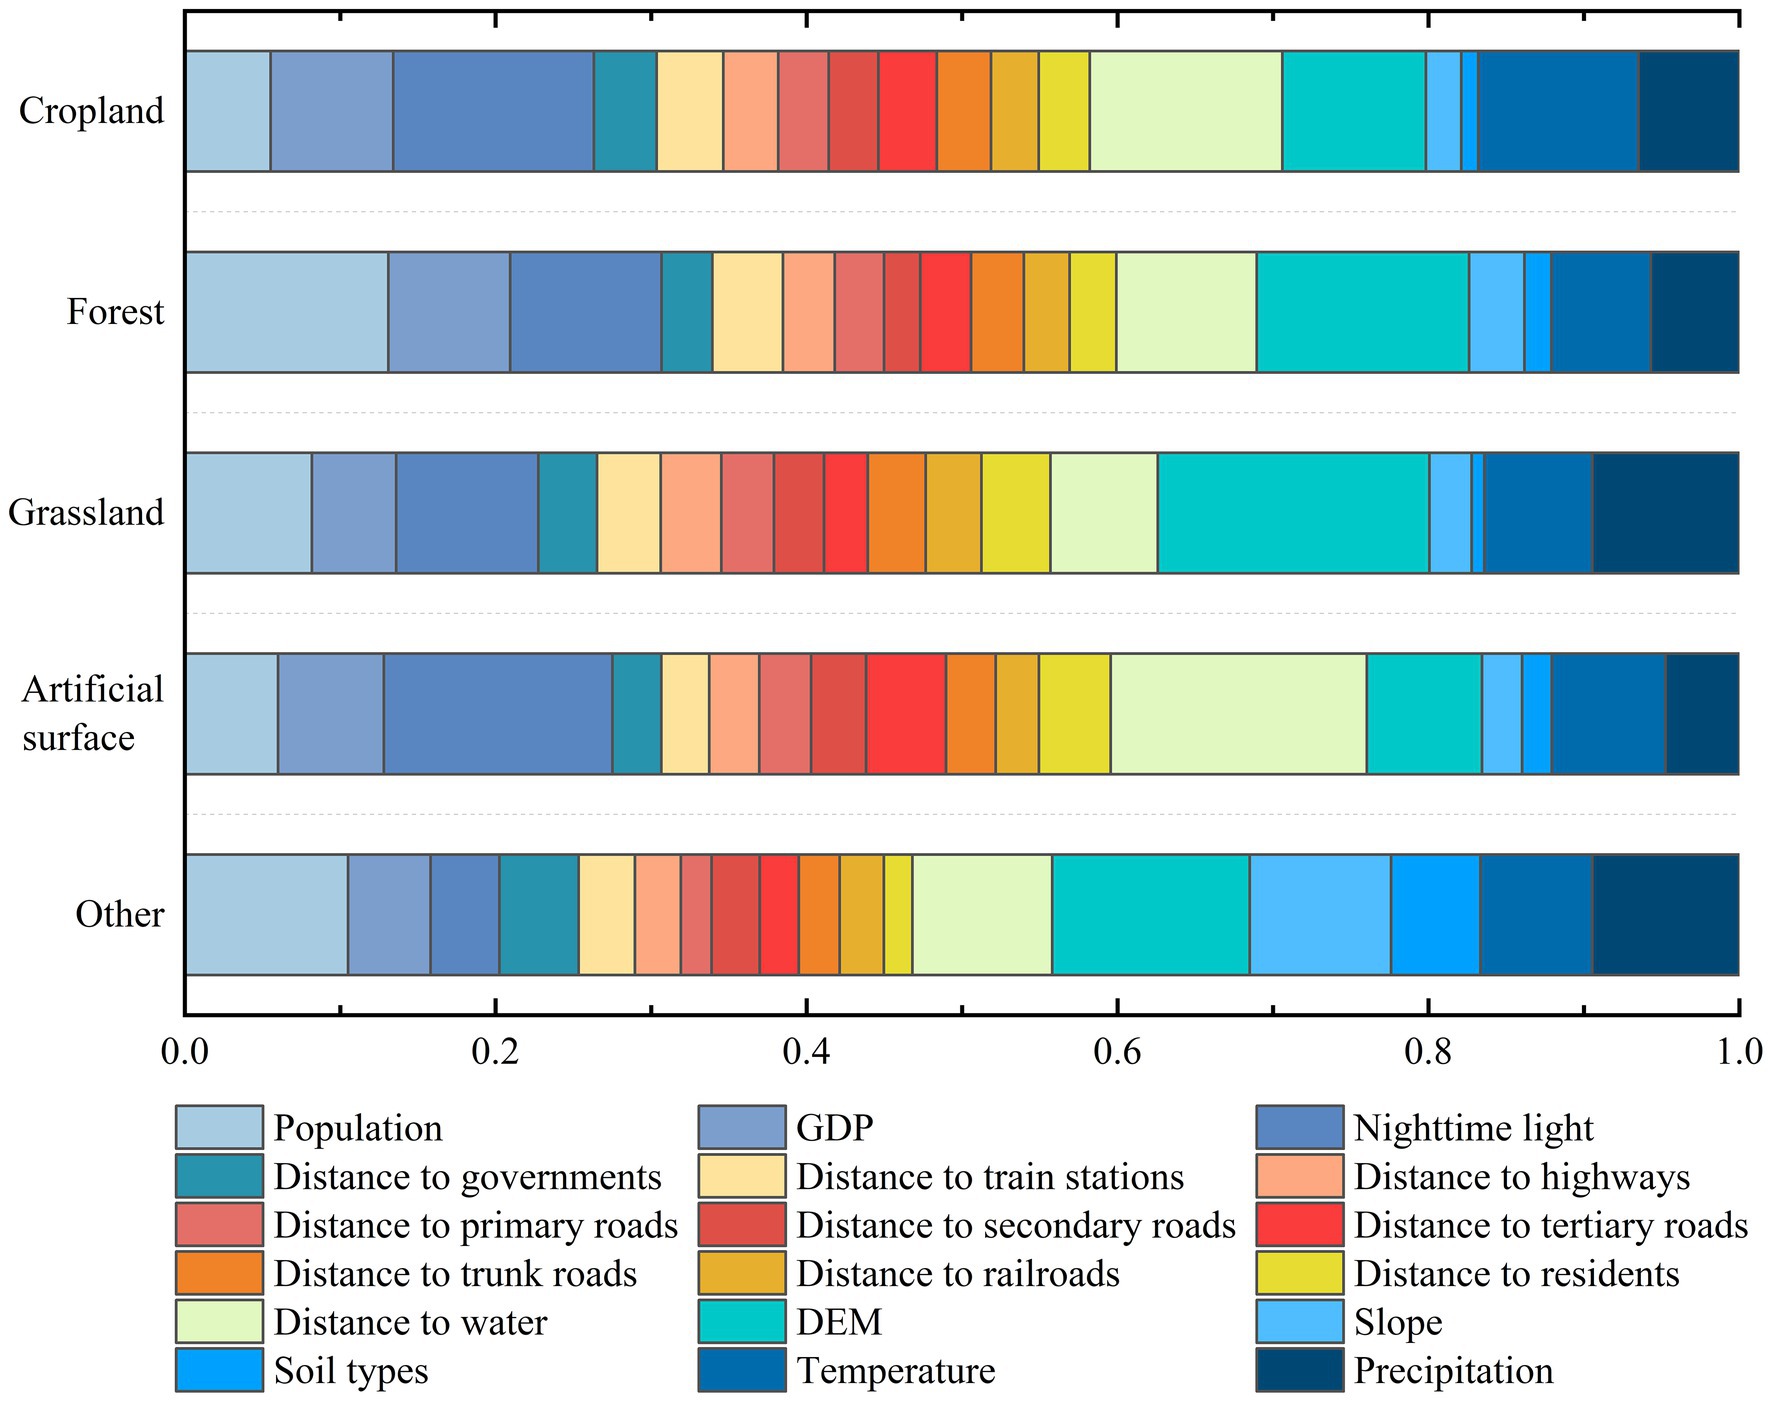
Figure 5. Contributions of driving factors.
Overall accuracy (OA) and Kappa coefficients were used to evaluate the accuracy of the PLUS model. The comparison of the simulated 2020 LULC data with the actual 2020 LULC data shows that the OA and Kappa coefficient are 91.8% and 0.85, respectively, which indicates that the PLUS model simulates land use data with high accuracy and can be reliably applied to simulate LULC.
Subsequently, the 2030 LULC data for the Nanjing metropolitan circle under four development scenarios were successfully simulated using the PLUS model (Figure 6), and its statistics are shown in Table 3. Furthermore, Figure 7 illustrates the different land use type conversions for the period of 2020–2030 under the different scenarios. Specifically, under the ND scenario, the land use pattern in 2030 for the Nanjing metropolitan circle was similar to that of the historical (i.e., 2010–2020 land use change trend, which was consistent with our expectations). The artificial surface maintained relatively high growth, with an increase of 1597.40 km2, which was achieved by encroaching on cropland, forest land, and grassland. Under the ED scenario, the artificial surface area expanded sharply, reaching 11,554.77 km2, which is an increase of 3,400.07 km2 (41.69%) compared to 2020. The urban expansion pattern emerged in the form of Nanjing as the center, with neighboring cities expanding in all directions (Figure 6B). As forests and grasslands were not effectively protected under this scenario, the area of cropland significantly decreased, and water and other land areas saw varying degrees of decrease. Overall, the ED scenario demonstrated a future land-use development pattern with economic primacy and unrestricted urban expansion.
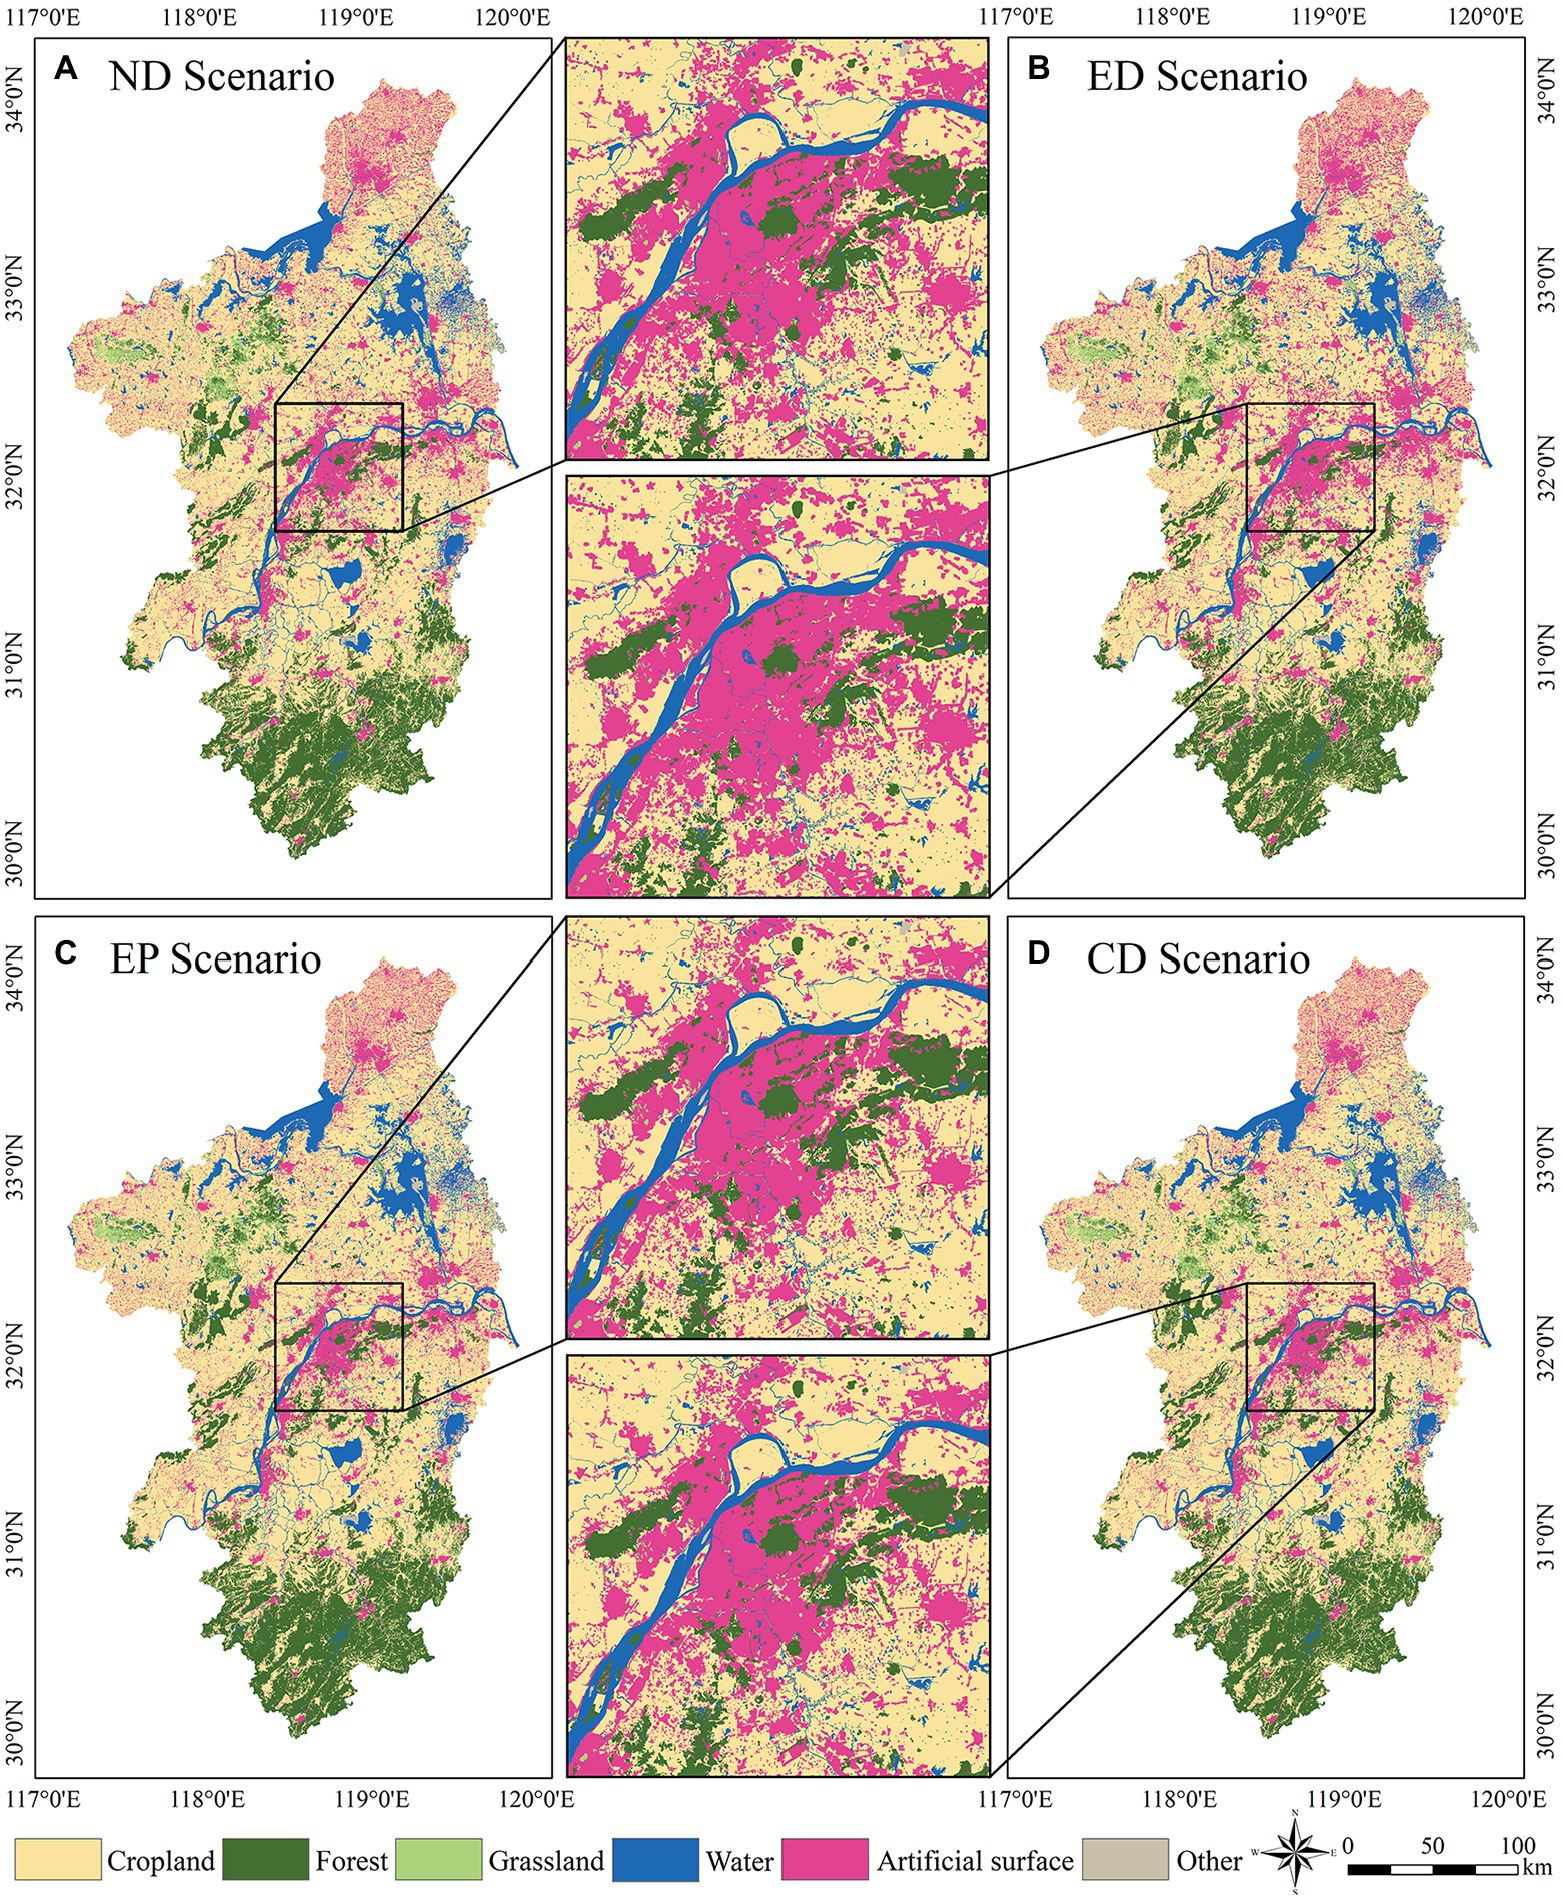
Figure 6. Simulation results of LULC in 2030 under four scenarios: (A) ND; (B) ED; (C) EP; and (D) CD.
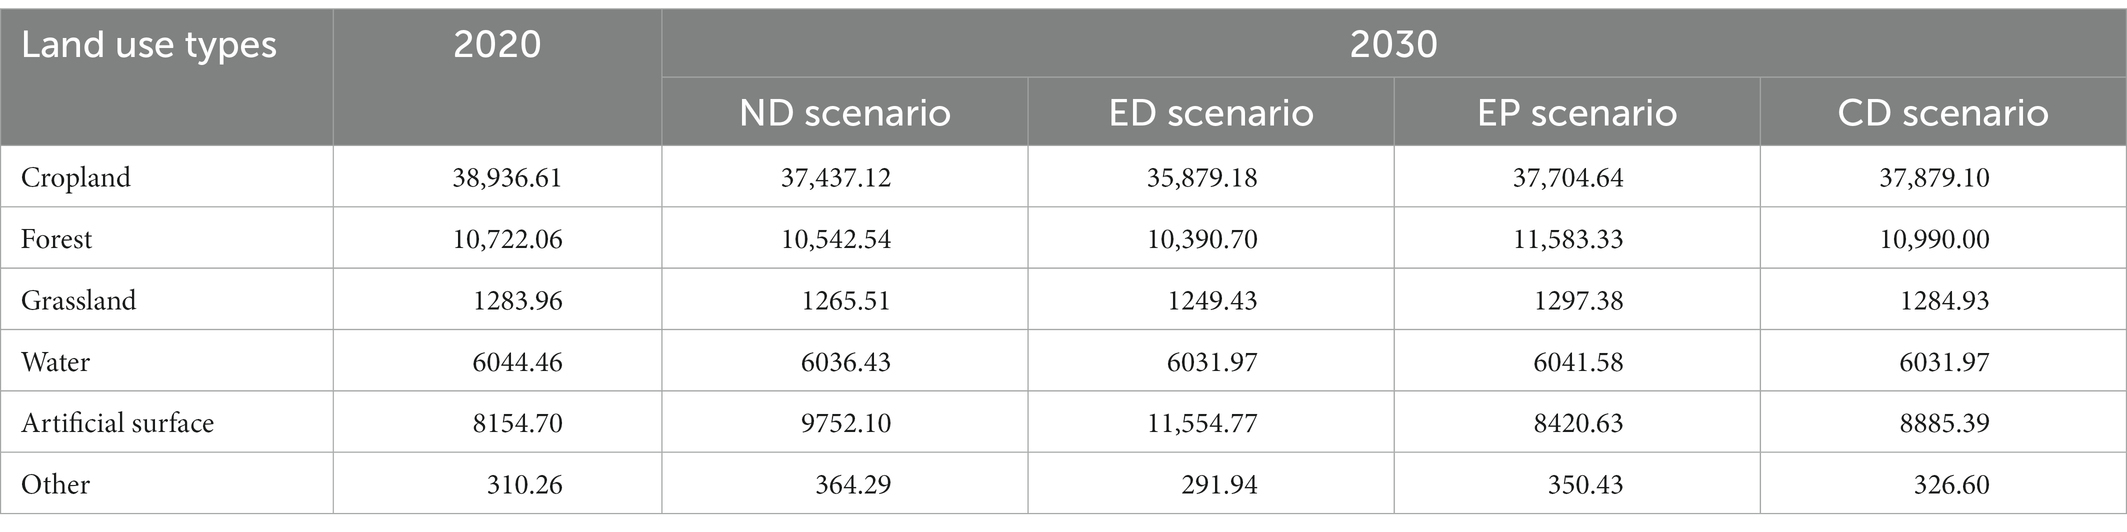
Table 3. LULC area for four scenarios (km2).
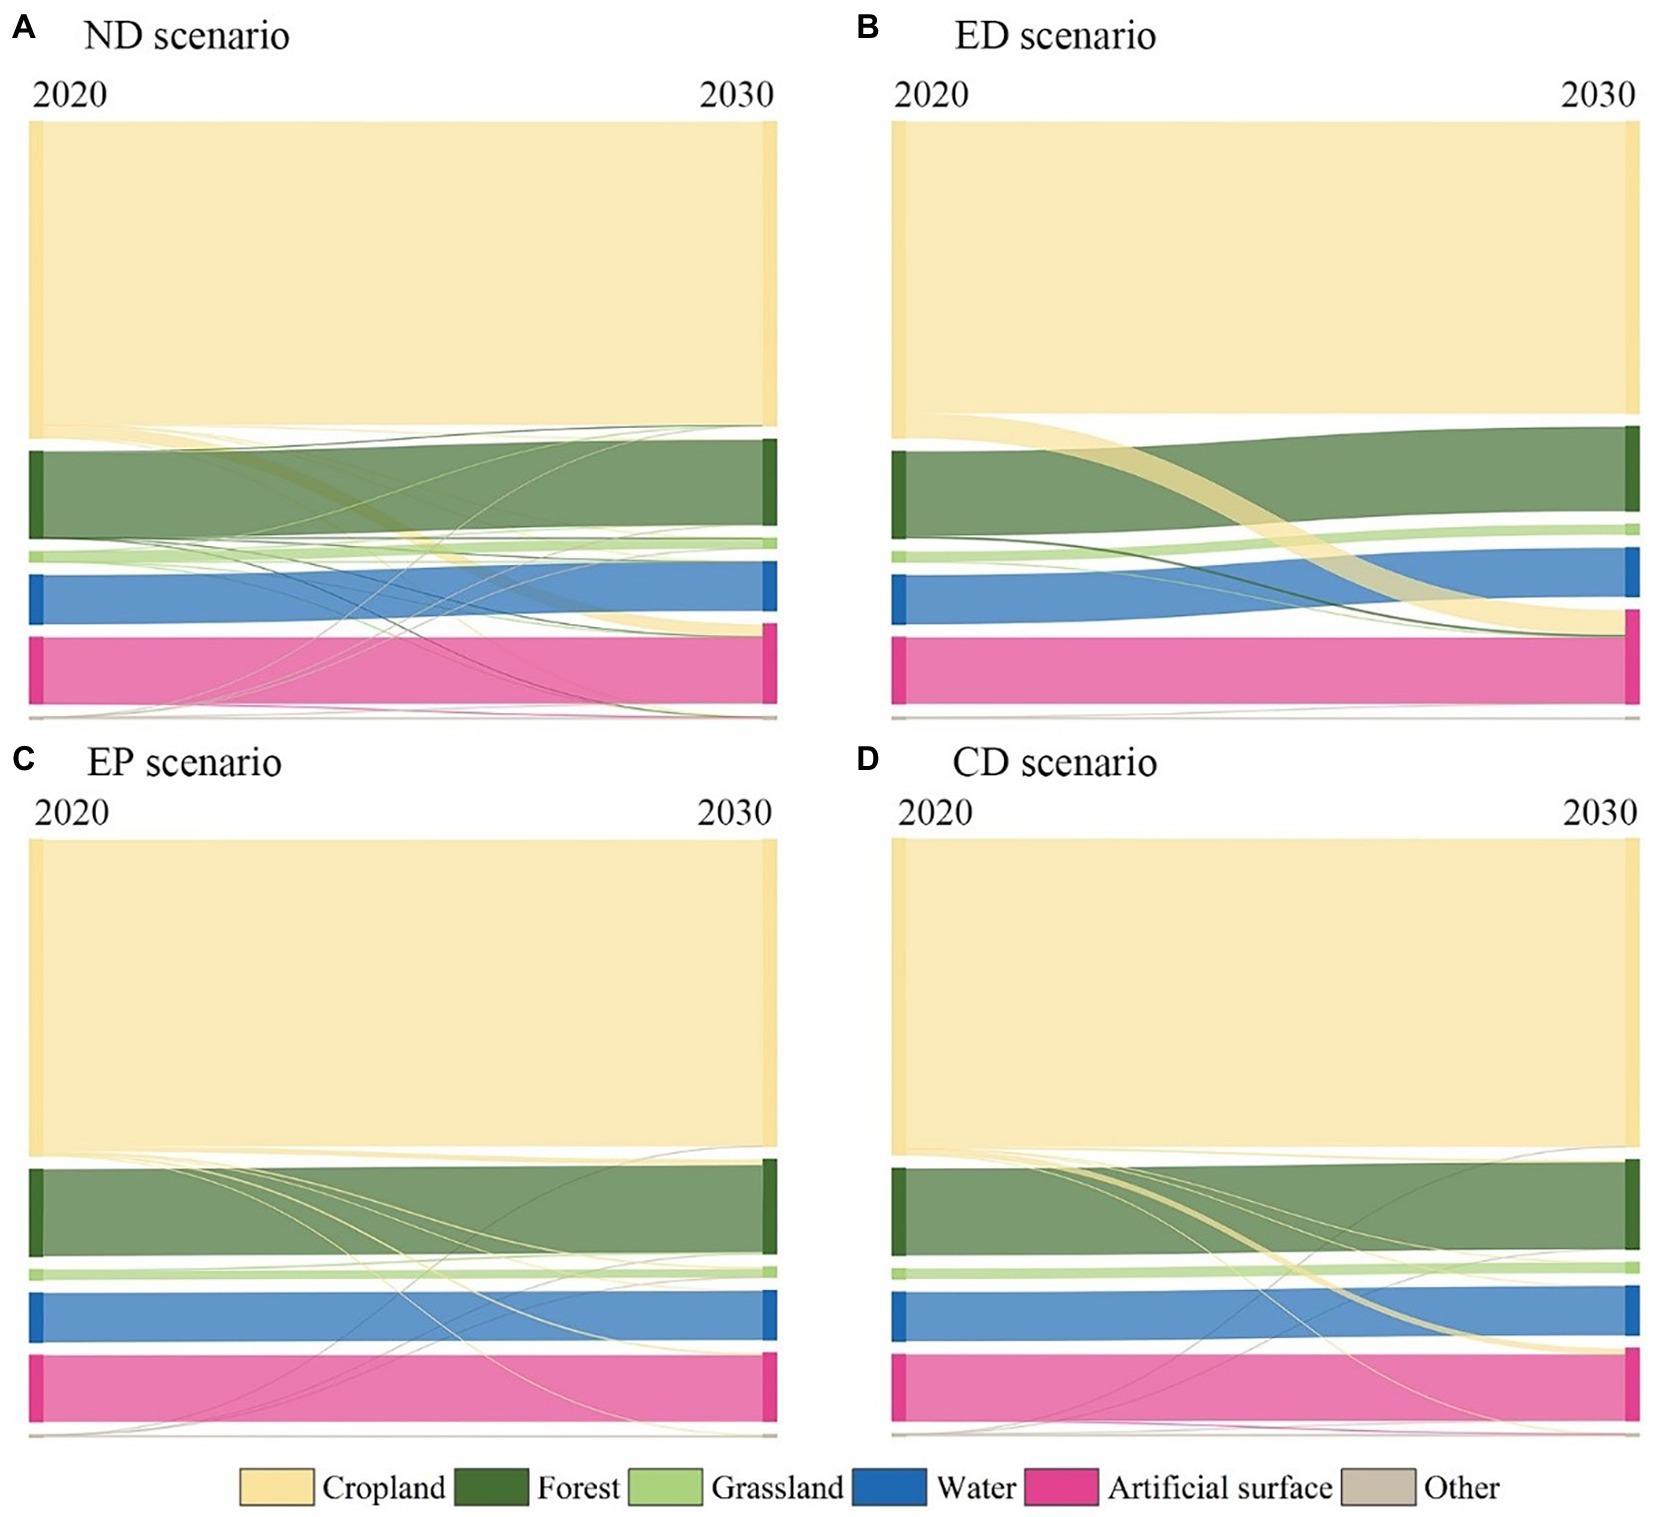
Figure 7. Land use type conversions from 2020–2030 under four scenarios: (A) ND; (B) ED; (C) EP; and (D) CD.
Under the EP scenario, the area of artificial surface increases only 265.93 km2 by 2030. Forest land and grassland were effectively protected, with an increase in area of 861.27 km2 and 13.42 km2, respectively. The area of water remained virtually unchanged and other land areas showed a slight increase. The land use pattern under the CD scenario was more balanced than those under the other three scenarios because this scenario integrates the consideration of EP and ED, which is reflected in the land use change pattern that the artificial surface is maintained with a certain increase, while the forest and grassland are effectively protected. This scenario is of great significance to the Nanjing metropolitan circle for implementing EP, high-speed ED policies, optimizing urban functions and spatial structure, and empowering high-quality and sustainable urban development.
The distribution of carbon storage in the Nanjing metropolitan circle in 2030 under different scenarios is illustrated in Figure 8, and the carbon storage under different scenarios is significantly different (Figure 9; Table 4). Under the ND scenario, the carbon storage of other land slightly increased in 2030 (0.04 Tg); however, the other land use types showed varying degrees of decrease in carbon storage: cropland, forest land, and grassland decreased by 1.42, 0.34, and 0.02 Tg, respectively, resulting in a net total decrease in carbon storage of 1.74 Tg. This implies that if the Nanjing metropolitan circle is developed according to the ND scenario, the carbon storage of vegetation will continue to decrease, which is not beneficial for stabilizing the carbon balance.
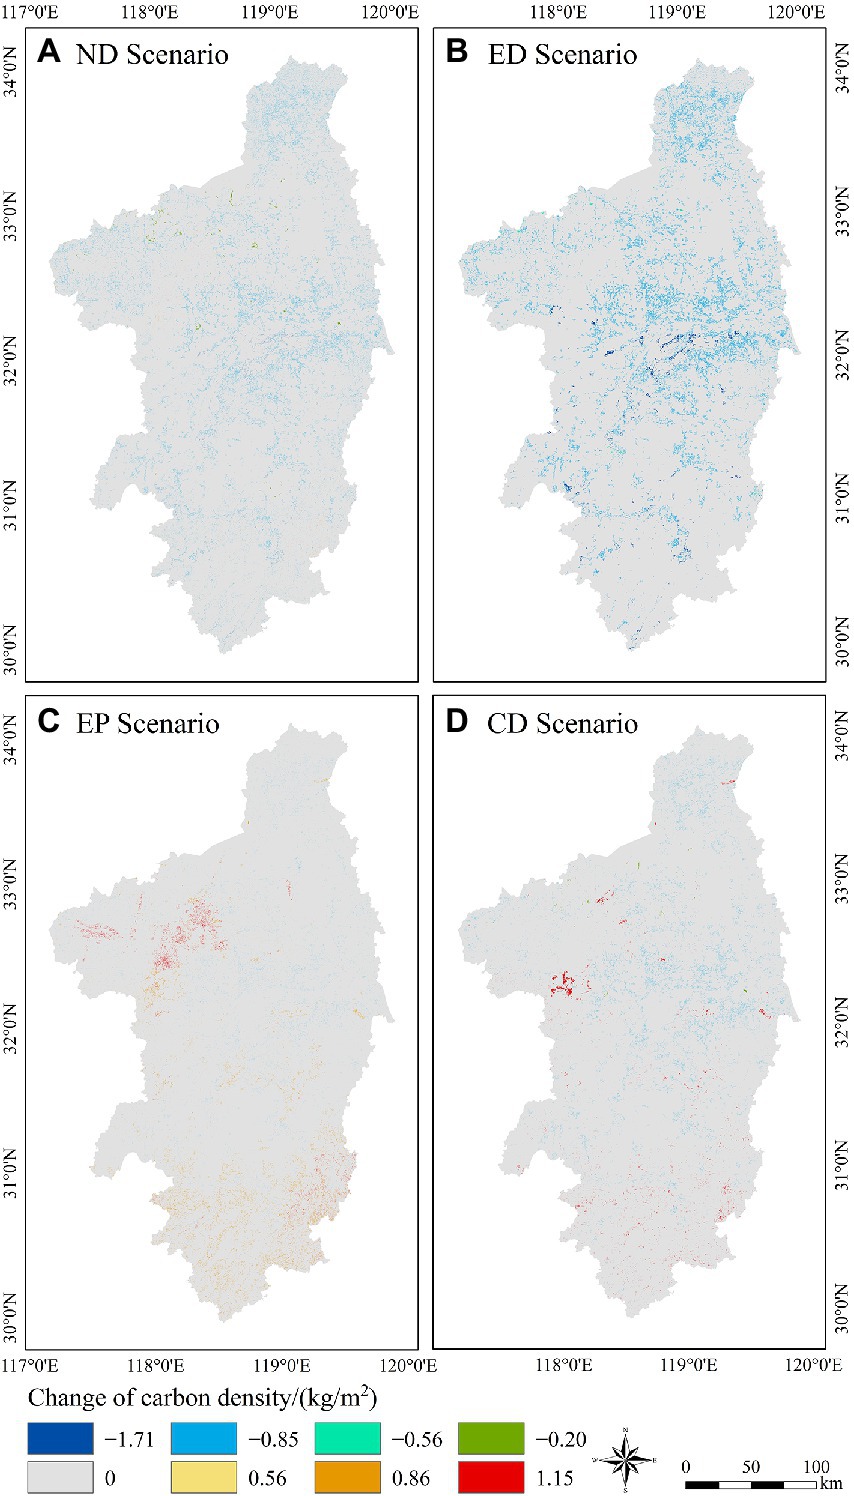
Figure 8. Carbon storage distribution in 2030 under four scenarios: (A) ND; (B) ED; (C) EP; and (D) CD.
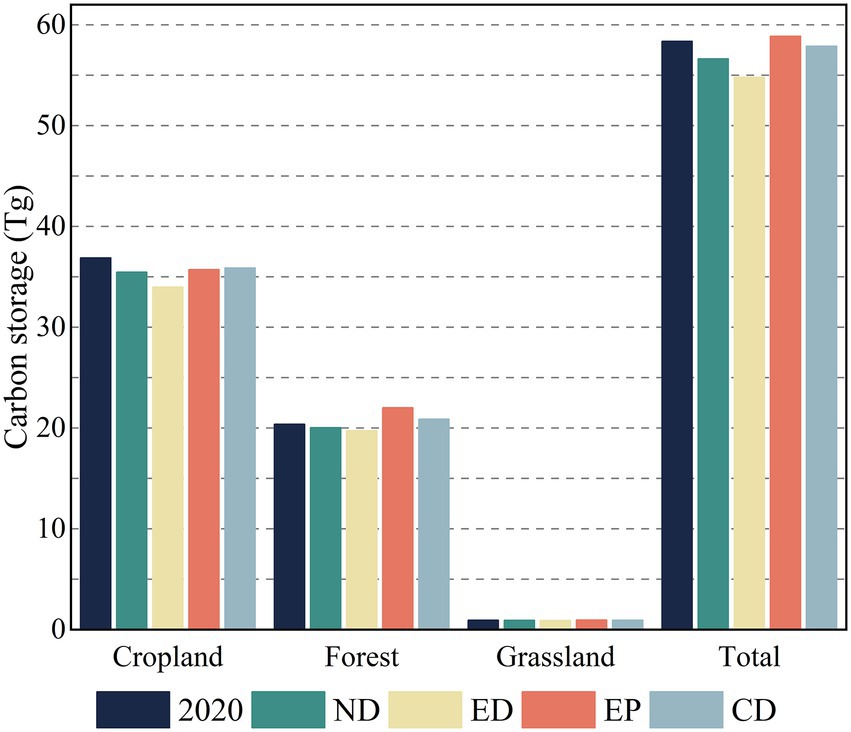
Figure 9. Sequestered carbon content of different land uses over 2020–2030 under four scenarios.
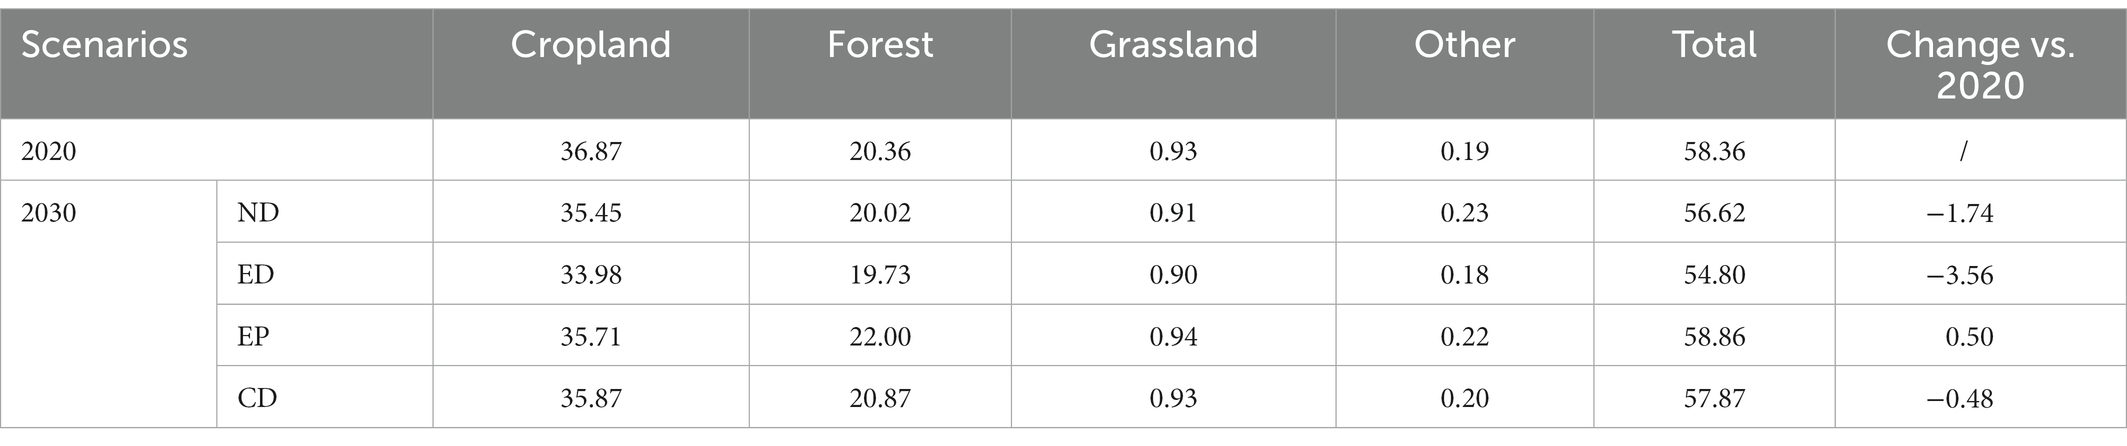
Table 4. Carbon storage dynamic changes of LULC under four scenarios in Nanjing metropolitan circle over 2020–2030 (Unit: Tg).
The ED scenario resulted in a significant decrease in total carbon storage of 3.56 Tg by 2030, with the carbon storage of cropland, forest land, and grassland decreasing by 2.89, 1.57, and 0.03 Tg, respectively. Under this scenario, the Nanjing metropolitan circle showed a spatial distribution pattern of decreasing carbon storage over a wide range (Figure 8B). Evidently, the ED scenario critically affected the carbon balance of the Nanjing metropolitan circle. Under the EP scenario, the ecological condition of the Nanjing metropolitan circle has improved significantly and the total carbon storage increased by 0.50 Tg. By 2030, forest land, grassland, and other land carbon storage increased by 1.74, 0.01, and 0.03 Tg, respectively, while that of cropland decreased by 1.16 Tg. As can be seen, the increased carbon storage mainly came from forest land, which offset the decrease in that of cropland and contributes to carbon sequestration in ecosystems.
The CD scenario strikes a balance between ED and EP by preserving the local ecosystem as much as possible while ensuring a certain level of ED. Under the CD scenario, the carbon storage of forest land and other land increased by 0.51 and 0.01 Tg, respectively, that of cropland decreased by 1.00 Tg, while that of grassland remained stable. Although the total carbon storage in the Nanjing metropolitan circle decreased by 0.48 Tg under the CD scenario, the trend of decreasing carbon storage under the CD scenario was effectively mitigated compared to that of the ND and ED scenarios. According to this scenario, the Nanjing metropolitan circle is expected to have a positive increase in total carbon storage by 2040. This indicates that the trend of decreasing carbon storage in the Nanjing metropolitan circle could be reversed through integrated and coordinated development.
Figure 10 illustrates the economic value of carbon sequestration in terrestrial ecosystems under different scenarios, with positive values representing carbon sequestration and negative values representing carbon loss. In this study, we assumed that the future carbon sequestration and current carbon sequestration values were the same and the discount rate of carbon sequestration and social value were constant (i.e., 3%). The economic values of carbon loss of Nanjing metropolitan circle in 2020–2030 under ND and ED scenarios were 96.83 million and 201.38 million RMB, respectively. Under the EP scenario, the carbon sequestration economy of the Nanjing metropolitan circle will be positive in 2020–2030, with a value of 32.03 million RMB. Under the CD scenario, the economic value of carbon loss in the Nanjing metropolitan circle in 2020–2030 was 24.59 million. Although the sequestration economy was still negative compared with the EP model, the economic value of carbon loss was significantly lower than those under the ND and ED scenarios. Overall, this ecosystem carbon sequestration function, expressed as a monetary value, can effectively demonstrate the value of ecosystem services and convey it to policymakers (Babbar et al., 2021).
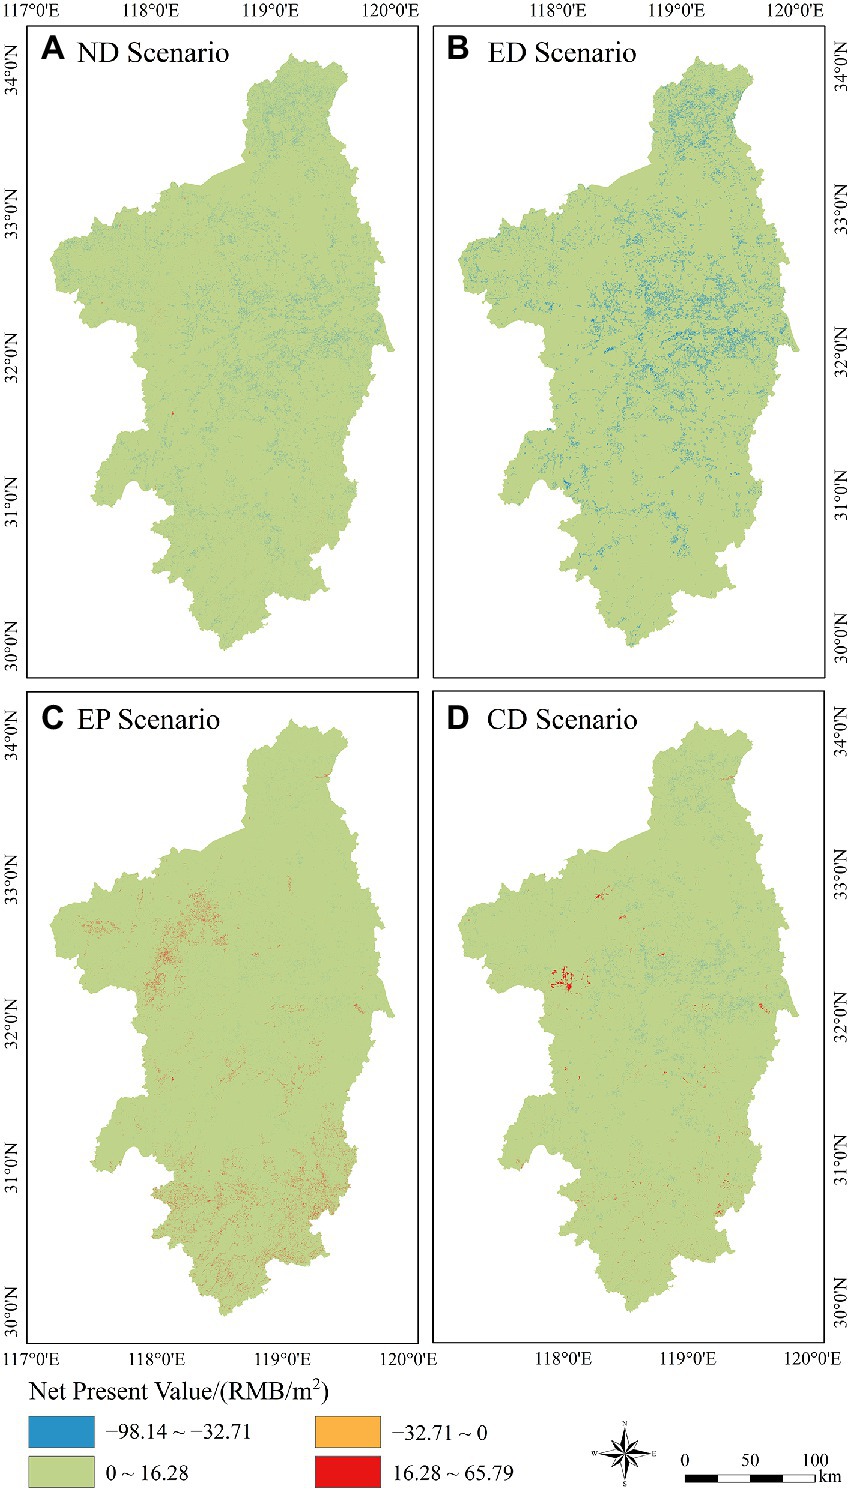
Figure 10. Net present value (unit RMB) of Nanjing metropolitan circle in 2020–2030 under four scenarios: (A) ND; (B) ED; (C) EP; and (D) CD.
We evaluated the impacts of four future development scenarios on LULC and carbon storage in the Nanjing metropolitan circle. Significant spatial heterogeneity was observed in the distribution of LULC changes and carbon storage in 2020–2030 under the four scenarios. The effects of different drivers on LULC were reflected in the impact of LULC on carbon storage changes.
Forest land had the highest carbon density in this study, followed by cropland and grassland (Table 2), which implies that forest land, cropland, and grassland accumulated more carbon storage than other land use types (Li et al., 2020). The area of cropland decreased under all scenarios, but by different degrees; in contrast, the artificial surface showed the opposite result, instead of increasing under all scenarios (Table 3). The change in the cropland area was driven more by nighttime lights, whereas the expansion of the artificial surface was mainly affected by the distance to water, nighttime lights, and elevation (Figure 5). Nighttime lights are indicators of urban development and can represent the rate of urban expansion (Liu et al., 2012; Ma et al., 2012; Zhang and Su, 2016). Previous studies have shown that nighttime lights are positively correlated with regional GDP and population (Shi et al., 2014; Bennett and Smith, 2017; Lan et al., 2020). Increased GDP and population growth require larger urban areas (capacity), while urban expansion usually occurs through encroachment on natural land and cropland, which results in a vicious circle. Similar results were reported in other studies. He et al. (2016) and Jiang et al. (2017) also reported great carbon storage losses, and the occupation of natural land and farmland is the main reason for the losses of carbon storage in the Beijing and Changsha-Zhuzhou-Xiangtan urban agglomerations. Moreover, another study on the loss and loss rate of carbon storage in the Yangtze River Delta urban agglomeration from 1990 to 2015 also showed that the reduction of natural land and arable land surrounding the urban area was the main reason for the loss of carbon storage (Gao and Wang, 2019). In addition, topographical factors influence the difficulty and cost of urban construction, which also determine urban expansion. Generally, cities are established in areas with flat topography, fertile soil, and easy access to agriculture, which facilitates transportation links and saves on building investments, thus urban expansion avoids large topographic undulations (e.g., mountains; Zhai et al., 2021). The general pattern of urban development determines that the expanded artificial surface is mainly distributed in flat areas with relatively low topographic relief (Figure 6). Under the ED scenario, carbon storage in terrestrial ecosystems decreases by 35.07 Mg, which is due to the increase in artificial surface. Urban expansion, which provides more jobs and rapidly increases GDP, seems profitable, but will reduce carbon storage in regional ecosystems in the long term (Weisberg et al., 2007; Eigenbrod et al., 2011).
The expansion of forest land differed between the development scenarios, with a decrease in forest land area under the ND and ED scenarios and an increase in area under the EP and CD scenarios. Correspondingly, different forest land area changes resulted in different carbon storage patterns. Specifically, under the ND and ED scenarios, 222.52 and 313.56 km2 of forest land are projected to be converted to other types of land by 2030, decreasing the forest ecosystem carbon storage by 2.47 and 5.95 Mg, respectively. Under the EP scenario, 655.53 km2 of cropland is expected to be converted to forest land by 2030, increasing carbon storage by 6.24 Mg. This was confirmed by the study of Zhang et al. (2010) that the ecological engineering of grain to feed conversion can significantly increase the carbon sink of soil ecosystems in China. In addition, 222.65 km2 of grassland will be converted to forest land, increasing carbon storage by 2.62 Mg. Overall, the conversion from other land use types to forest land contributes 8.86 Mg of carbon storage under the EP scenario. The CD scenario is similar to the EP scenario, with a projected increase in forest land area of 285.74 km2 by 2030 and increase in carbon storage of 2.72 Mg. Balancing urban expansion and ecological conservation can maintain woodland and grassland areas, slow urban sprawl (Yang et al., 2020), and contribute to the growth of carbon storage in forest ecosystems (Zhao et al., 2019).
In the study area, forests were mainly distributed at higher elevations of the mountains. Zhang and Xie (2019) believe that population expansion not only requires forests to provide more forestry products, but people also need to enjoy the value of ecological services provided by forests, which may explain the impact of population expansion on forests. Moreover, previous studies have shown that the growth of forest land area benefits from lower economic growth rates and more stable climatic conditions (Angelsen and Kaimowitz, 1999; Noss, 2001; Tian et al., 2022b) and that and that areas with higher ecological quality are more suitable for forest growth (Weisberg et al., 2007). Forest ecosystems tend to be more influenced by various factors, and have the greatest impact on carbon storage in terrestrial ecosystems. Therefore, protection of forests from destruction and increasing the area of forested land through measures such as natural restoration and artificial afforestation would help increase the carbon sink capacity of forest ecosystems and increase the carbon storage of the entire terrestrial ecosystem (Tian et al., 2022b).
Urban development patterns are particularly important in the context of increased climate and socioeconomic uncertainty in the future, especially for urban agglomerations such as the Nanjing metropolitan circle, which are nationally planned and built at the inter-provincial level. If urban expansion is carried out according to the ND or ED scenarios, the artificial surface area of the Nanjing metropolitan circle will continue to increase and natural vegetation land use types, such as forest land, will continue to degrade, leading to an increasingly fragile ecological environment. Carbon storage in terrestrial ecosystems will also be significantly reduced in recent decades. If urban expansion is carried out according to the EP scenario, there will be an increase in the forest and grassland area of the Nanjing metropolitan circle will increase, artificial surface area, and carbon storage of terrestrial ecosystems. However, this scenario ignores the demonstration role of the Nanjing metropolitan circle as the leading city in the ED of the Yangtze Delta region of China, which is not conducive to the realization of future ED of the Nanjing metropolitan circle and the national development strategy.
The CD scenario balances the ED and EP of the Nanjing metropolitan circle and maintains a balance of local carbon storage with stable economic growth. Although the terrestrial ecosystem carbon storage will decrease by 0.48 Tg by 2030 under this scenario, the carbon storage reduction of the scenario will decrease significantly and the terrestrial ecosystem carbon storage under the scenario will be positive by 2040. Therefore, reasonable planning of the future urban structure, optimization of land use types, and an increase in carbon storage are particularly important for the future urban development of the Nanjing metropolitan circle. The results of this study show that rapid economic growth will lead to a continuous decrease in carbon storage and a gradual deterioration of the ecological environment. Therefore, slowing the rate of economic growth and promoting ED from “high speed” to “high quality” could improve the carbon storage and ecosystem service value of the study area (Wang et al., 2022). Limiting the disorderly expansion of urban boundaries and constructing ecological red lines can help stabilize the structure of local ecosystems and improve EP (Wu Y. et al., 2019). Moreover, in order to mitigate the effects of climate change, it is necessary to further increase the proportion of clean energy use in the energy structure and reduce the use of fossil fuels (Tian et al., 2022b). More importantly, protecting forests from destruction and increasing the area of forest land can contribute to increasing carbon storage in terrestrial ecosystems (Cao et al., 2009; Xiao, 2014).
In this work, we developed a novel approach for spatial simulation and carbon storage assessment of future LULC based on four set future development scenarios of the Nanjing metropolitan circle and land use demand combining the PLUS and InVEST models (Figure 2). We determined the most suitable future urban development scenario for the Nanjing metropolitan circle to be the CD scenario and simulated a reasonable spatial distribution of LULC and carbon storage. This framework provides relatively accurate spatial and temporal simulations of LULC and carbon storage, and is useful for assessing the distribution of LULC and the impact on carbon storage under different scenarios, which is important for LULC management of urban agglomerations (Gao and Wang, 2019). Our study reveals the model for the dynamic evolution of factors controlling carbon storage in a key area of urban agglomerations, which provides support for decision-making on sustainable regional urbanization. China has three national urban agglomerations and several small urban agglomerations. The rapid growth of urban agglomerations affects carbon storage and threatens other multi-ecosystems, such as water yields, biodiversity conservation, and recreation opportunities (Nelson et al., 2009). Therefore, future research should focus on the following aspects: (1) Different regions have different geographic environments, development patterns, and cultural climates, etc. Scenarios should be set according to the individual characteristics of the regions. Therefore, it is necessary to explore the different driving mechanisms of urban agglomerations in other regions. (2) Besides carbon storage, other ecosystem services can also be assessed by the InVEST model (Nelson et al., 2010; Gao and Wang, 2019). PLUS model combined with InVEST model is meaningful and feasible for simulating LULC and carbon storage changes under different scenarios. Future studies should also examine the spatiotemporal variation of LULC and carbon storage in different regions.
However, the setting of different development scenarios needs to consider more factors, such as the urban planning layout and national forest park reserve planning (Liang et al., 2021b). In addition, the GDP, population, temperature, and precipitation data in this work were resampled to 30 m. This scale difference may cause some uncertainty in the results (Fang et al., 2022). Additionally, the limitations of the InVEST model remain a major challenge in current carbon storage estimations. The model assumes that the carbon storage of the LULC type does not change over time and is equal to the mean value of the carbon storage of the LULC type, which obviously simplifies the carbon cycle process. A second limitation is that the accuracy of the model in estimating carbon storage is dependent on the carbon density estimates for each LULC type. However, the acquisition of carbon density for each land use type is labor-intensive, and regional carbon density values usually cannot be applied to other regions (Sharp et al., 2020). For this purpose, carbon density data were collected for all land use types in the study area to the extent possible to minimize uncertainty in the assessment of carbon storage. Despite these limitations, our work revealed the spatial and temporal distribution patterns of possible future LULCs and the dynamics of carbon storage in the Nanjing metropolitan circle. Based on the results of this study, we explored an optimal future urban development scenario for the Nanjing metropolitan circle, which can aid the Nanjing metropolitan circle achieve a win-win situation for both ED and EP, formulate policies for sustainable socio-ED, and achieve a reasonable future urban LULC layout.
We analyzed and simulated the spatial and temporal changes in LULC and its caused ecosystem carbon storage in the Nanjing metropolitan circle under four scenarios for 2020–2030 using the PLUS and InVEST models. The driving factors of LULC changes and the spatial and temporal differences in carbon storage were discussed and the main conclusions were as follows. (1) integrating the PLUS and InVEST models can effectively simulate LULC changes and the resulting carbon storage changes under different development scenarios. (2) The dominant driving factors for LULC changes in the Nanjing metropolitan circle were elevation, nighttime lights, and population. (3) The Nanjing metropolitan circle agglomeration experienced a carbon storage increase of 0.50 Tg under the EP scenario and losses of 1.74, 3.56, and 0.48 Tg under the ND, ED, and CD scenarios from 2020–2030. (4) The conversion of cropland and forest land to artificial surface in Nanjing metropolitan circle is the main cause of carbon storage loss, and this reduced ecosystem carbon storage can be effectively offset by increasing forest ecosystem carbon storage. Overall, the CD scenario was the most appropriate for the future development of the Nanjing metropolitan circle as it balanced ED and EP. Increasing the area of forested land through afforestation can improve the carbon sink capacity of forest ecosystems and increase carbon storage in terrestrial ecosystems. The results provide new perspectives for future land resource reallocation and ED strategies on a regional scale and provide data to support the achievement of China’s carbon neutrality goals.
The original contributions presented in the study are included in the article/supplementary material, further inquiries can be directed to the corresponding author.
YT, LT, and CW: conceptualization and writing—review and editing. YT and LT: methodology, software, and writing—original draft preparation. WD: formal analysis. LT and CW: funding acquisition. All authors contributed to the article and approved the submitted version.
This work was supported by the Major Project of Natural Science Research of Anhui Provincial Department of Education (no. KJ2021ZD0130), the Project of Physical Geographic Environment Intelligent Technology Industry Innovation, the Scientific Research Projects of Anhui Higher Education Institutions (no. 2022AH010066), and the Postgraduate Research and Practice Innovation Program of Jiangsu Province (KYCX22_1114).
The authors declare that the research was conducted in the absence of any commercial or financial relationships that could be construed as a potential conflict of interest.
All claims expressed in this article are solely those of the authors and do not necessarily represent those of their affiliated organizations, or those of the publisher, the editors and the reviewers. Any product that may be evaluated in this article, or claim that may be made by its manufacturer, is not guaranteed or endorsed by the publisher.
Angelsen, A., and Kaimowitz, D. (1999). Rethinking the causes of deforestation: lessons from economic models. World Bank Res. Obs. 14, 73–98. doi: 10.1093/wbro/14.1.73
Arneth, A., Brown, C., and Rounsevell, M. D. A. (2014). Global models of human decision-making for land-based mitigation and adaptation assessment. Nat. Clim. Chang. 4, 550–557. doi: 10.1038/nclimate2250
Ayanlade, A. (2016). Seasonality in the daytime and night-time intensity of land surface temperature in a tropical city area. Sci. Total Environ. 557-558, 415–424. doi: 10.1016/j.scitotenv.2016.03.027
Babbar, D., Areendran, G., Sahana, M., Sarma, K., Raj, K., and Sivadas, A. (2021). Assessment and prediction of carbon sequestration using Markov chain and InVEST model in Sariska Tiger Reserve. J. Clean. Prod. 278:123333. doi: 10.1016/j.jclepro.2020.123333
Bennett, M. M., and Smith, L. C. (2017). Advances in using multitemporal night-time lights satellite imagery to detect, estimate, and monitor socioeconomic dynamics. Remote Sens. Environ. 192, 176–197. doi: 10.1016/j.rse.2017.01.005
Bukoski, J. J., Dronova, I., and Potts, M. D. (2022). Net loss statistics underestimate carbon emissions from mangrove land use and land cover change. Ecography 2022:e05982. doi: 10.1111/ecog.05982
Cao, S. X., Chen, L., and Liu, Z. D. (2009). An investigation of Chinese attitudes toward the environment: case study using the grain for green project. Ambio 38, 55–64. doi: 10.1579/0044-7447-38.1.55
Cramer, W., Guiot, J., Fader, M., Garrabou, J., Gattuso, J. P., Iglesias, A., et al. (2018). Climate change and interconnected risks to sustainable development in the Mediterranean. Nat. Clim. Chang. 8, 972–980. doi: 10.1038/s41558-018-0299-2
Dybala, K. E., Steger, K., Walsh, R. G., Smart, D. R., Gardali, T., and Seavy, N. E. (2019). Optimizing carbon storage and biodiversity co-benefits in reforested riparian zones. J. Appl. Ecol. 56, 343–353. doi: 10.1111/1365-2664.13272
Eigenbrod, F., Bell, V. A., Davies, H. N., Heinemeyer, A., Armsworth, P. R., and Gaston, K. J. (2011). The impact of projected increases in urbanization on ecosystem services. Proce. R. Soc. Lond. Ser. B Biol. Sci. 278, 3201–3208. doi: 10.1098/rspb.2010.2754
Fang, Z., Ding, T. H., Chen, J. Y., Xue, S., Zhou, Q., Wang, Y. D., et al. (2022). Impacts of land use/land cover changes on ecosystem services in ecologically fragile regions. Sci. Total Environ. 831:154967. doi: 10.1016/j.scitotenv.2022.154967
Fang, J.Y., Zhu, J.X., Li, P., Ji, C.J., Zhu, J.L., Jiang, L., et al. (2021). Carbon Budgets of Forest Ecosystems in China. Beijing, China: Science Press.
Feddema, J. J., Oleson, K. W., Bonan, G. B., Mearns, L. O., Buja, L. E., Meehl, G. A., et al. (2005). The importance of land-cover change in simulating future climates. Science 310, 1674–1678. doi: 10.1126/science.1118160
Foley, J. A., DeFries, R., Asner, G. P., Barford, C., Bonan, G., Carpenter, S. R., et al. (2005). Global consequences of land use. Science 309, 570–574. doi: 10.1126/science.1111772
Gao, J., and Wang, L. C. (2019). Embedding spatiotemporal changes in carbon storage into urban agglomeration ecosystem management - a case study of the Yangtze River Delta. J. Clean. Prod. 237:117764. doi: 10.1016/j.jclepro.2019.117764
Gauthier, S., Bernier, P., Burton, P. J., Edwards, J., Isaac, K., Isabel, N., et al. (2014). Climate change vulnerability and adaptation in the managed. Environ. Rev. 22, 256–285. doi: 10.1139/er-2013-0064
Guan, D. J., Zhao, Z. L., and Tan, J. (2019). Dynamic simulation of land use change based on logistic-CA-Markov and WLC-CA-Markov models: a case study in three gorges reservoir area of Chongqing. Umweltwissenschaften und Schadstoff-Forschung 26, 20669–20688. doi: 10.1007/s11356-019-05127-9
He, C. Y., Zhang, D., Huang, Q. X., and Zhao, Y. Y. (2016). Assessing the potential impacts of urban expansion on regional carbon storage by linking the LUSD-urban and InVEST models. Environ. Model. Softw. 75, 44–58. doi: 10.1016/j.envsoft.2015.09.015
Homer, C., Dewitz, J., Jin, S. M., Xian, G., Costello, C., Danielson, P., et al. (2020). Conterminous United States land cover change patterns 2001-2016 from the 2016 National Land Cover Database. Photogrammetria 162, 184–199. doi: 10.1016/j.isprsjprs.2020.02.019
Huang, X., Wen, D. W., Li, J. Y., and Qin, R. J. (2017). Multi-level monitoring of subtle urban changes for the megacities of China using high-resolution multi-view satellite imagery. Remote Sens. Environ. 196, 56–75. doi: 10.1016/j.rse.2017.05.001
Huppmann, D., Rogelj, J., Kriegler, E., Krey, V., and Riahi, K. (2018). A new scenario resource for integrated 1.5 degrees C research. Nat. Clim. Chang. 8, 1027–1030. doi: 10.1038/s41558-018-0317-4
Jiang, W. G., Deng, Y., Tang, Z. H., Lei, X., and Chen, Z. (2017). Modelling the potential impacts of urban ecosystem changes on carbon storage under different scenarios by linking the CLUE-S and the InVEST models. Ecol. Model. 345, 30–40. doi: 10.1016/j.ecolmodel.2016.12.002
Lal, P., Dubey, A. K., Kumar, A., Kumar, P., and Dwivedi, C. S. (2022). Measuring the control of landscape modifications on surface temperature in India. Geocarto Int. 1-18, 1–18. doi: 10.1080/10106049.2022.2102224
Lal, P., Shekhar, A., and Kumar, A. (2021). Quantifying temperature and precipitation change caused by land cover change: a case study of India using the WRF model. Front. Environ. Sci. 9:588. doi: 10.3389/fenvs.2021.766328
Lambin, E. F., and Meyfroidt, P. (2011). Global land use change, economic globalization, and the looming land scarcity. PNAS Nexus 108, 3465–3472. doi: 10.1073/pnas.1100480108
Lan, F., Gong, X. Y., Da, H. L., and Wen, H. Z. (2020). How do population inflow and social infrastructure affect urban vitality? Evidence from 35 large-and medium-sized cities in China. Cities 100:102454. doi: 10.1016/j.cities.2019.102454
Lawal, S., Lennard, C., and Hewitson, B. (2019). Response of southern African vegetation to climate change at 1.5 and 2.0 degrees global warming above the pre-industrial level. Clim. Serv. 16, 100134–100116. doi: 10.1016/j.cliser.2019.100134
Lee, R. J. (2021). Vacant land, flood exposure, and urbanization: examining land cover change in the Dallas-Fort Worth metro area. Landsc. Urban Plan. 209:104047. doi: 10.1016/j.landurbplan.2021.104047
Li, S. C., Bing, Z. L., and Jin, G. (2019). Spatially explicit mapping of soil conservation Service in Monetary Units due to land use/cover change for the three gorges reservoir area, China. Remote Sens. 11:468. doi: 10.3390/rs11040468
Li, J. Y., Chen, X., Kurban, A., Van de Voorde, T., De Maeyer, P., and Zhang, C. (2021). Coupled SSPs-RCPs scenarios to project the future dynamic variations of water-soil-carbon-biodiversity services in Central Asia. Ecol. Indic. 129:107936. doi: 10.1016/j.ecolind.2021.107936
Li, J. Y., Gong, J., Guldmann, J. M., Li, S. C., and Zhu, J. (2020). Carbon dynamics in the northeastern Qinghai-Tibetan plateau from 1990 to 2030 using Landsat land use/cover change data. Remote Sens. 12:528. doi: 10.3390/rs12030528
Li, X. C., Zhou, Y. Y., Zhu, Z. Y., Liang, L., Yu, B. L., and Cao, W. T. (2018). Mapping annual urban dynamics (1985-2015) using time series of Landsat data. Remote Sens. Environ. 216, 674–683. doi: 10.1016/j.rse.2018.07.030
Liang, X., Guan, Q. F., Clarke, K. C., Chen, G. Z., Guo, S., and Yao, Y. (2021a). Mixed-cell cellular automata: a new approach for simulating the spatio-temporal dynamics of mixed land use structures. Landscape Urban Plan. 205:103960. doi: 10.1016/j.landurbplan.2020.103960
Liang, X., Guan, Q. F., Clarke, K. C., Liu, S. S., Wang, B. Y., and Yao, Y. (2021b). Understanding the drivers of sustainable land expansion using a patch-generating land use simulation (PLUS) model: a case study in Wuhan. Comput. Environ. Urban. Syst. 85:101569. doi: 10.1016/j.compenvurbsys.2020.101569
Liang, X., Liu, X. P., Li, X., Chen, Y. M., Tian, H., and Yao, Y. (2018). Delineating multi-scenario urban growth boundaries with a CA-based FLUS model and morphological method. Landscape Urban Plan. 177, 47–63. doi: 10.1016/j.landurbplan.2018.04.016
Liao, Q. P., Liu, X. R., and Xiao, M. Z. (2022). Ecological restoration and carbon sequestration regulation of mining areas-a case study of Huangshi City. Int. J. Env. Res. Public Health 19:4175. doi: 10.3390/ijerph19074175
Liu, Z. F., He, C. Y., Zhang, Q. F., Huang, Q. X., and Yang, Y. (2012). Extracting the dynamics of urban expansion in China using DMSP-OLS nighttime light data from 1992 to 2008. Landscape Urban Plan. 106, 62–72. doi: 10.1016/j.landurbplan.2012.02.013
Liu, X. P., Huang, Y. H., Xu, X. C., Li, X. C., Li, X., Ciais, P., et al. (2020). High-spatiotemporal-resolution mapping of global urban change from 1985 to 2015. Nat. Sustain. 3, 564–570. doi: 10.1038/s41893-020-0521-x
Liu, X. P., Liang, X., Li, X., Xu, X. C., Ou, J. P., Chen, Y. M., et al. (2017). A future land use simulation model (FLUS) for simulating multiple land use scenarios by coupling human and natural effects. Landscape Urban Plan. 168, 94–116. doi: 10.1016/j.landurbplan.2017.09.019
Long, Y., Han, H. Y., Lai, S. K., and Mao, Q. Z. (2013). Urban growth boundaries of the Beijing metropolitan area: comparison of simulation and artwork. Cities 31, 337–348. doi: 10.1016/j.cities.2012.10.013
Lu, M., Zhou, X. H., Yang, Q., Li, H., Luo, Y. Q., Fang, C. M., et al. (2013). Responses of ecosystem carbon cycle to experimental warming: a meta-analysis. Ecology 94, 726–738. doi: 10.1890/12-0279.1
Luo, G. P., Yin, C. Y., Chen, X., Xu, W. Q., and Lu, L. (2010). Combining system dynamic model and CLUE-S model to improve land use scenario analyses at regional scale: a case study of Sangong watershed in Xinjiang, China. Ecol. Complex. 7, 198–207. doi: 10.1016/j.ecocom.2010.02.001
Ma, T., Zhou, C., Pei, T., Haynie, S., and Fan, J. (2012). Quantitative estimation of urbanization dynamics using time series of DMSP/OLS nighttime light data: a comparative case study from China's cities. Remote Sens. Environ. 124, 99–107. doi: 10.1016/j.rse.2012.04.018
Meyfroidt, P., de Bremond, A., Ryan, C. M., Archer, E., Aspinall, R., Chhabra, A., et al. (2022). Ten facts about land systems for sustainability. P. Natl. Acad. Sci. U. S. A. 119:e2109217118. doi: 10.1073/pnas.2109217118
Molotoks, A., Stehfest, E., Doelman, J., Albanito, F., Fitton, N., Dawson, T. P., et al. (2018). Global projections of future cropland expansion to 2050 and direct impacts on biodiversity and carbon storage. Glob. Chang. Biol. 24, 5895–5908. doi: 10.1111/gcb.14459
Munsi, M., Areendran, G., and Joshi, P. K. (2012). Modeling spatio-temporal change patterns of forest cover: a case study from the Himalayan foothills (India). Reg. Environ. Chang. 12, 619–632. doi: 10.1007/s10113-011-0272-3
Nelson, E., Mendoza, G., Regetz, J., Polasky, S., Tallis, H., Cameron, D. R., et al. (2009). Modeling multiple ecosystem services, biodiversity conservation, commodity production, and tradeoffs at landscape scales. Front. Ecol. Environ. 7, 4–11. doi: 10.1890/080023
Nelson, E., Sander, H., Hawthorne, P., Conte, M., Ennaanay, D., Wolny, S., et al. (2010). Projecting global land-use change and its effect on ecosystem service provision and biodiversity with simple models. PLoS One 5:e14327. doi: 10.1371/journal.pone.0014327
Newbold, T., Hudson, L. N., Hill, S. L. L., Contu, S., Lysenko, I., Senior, R. A., et al. (2015). Global effects of land use on local terrestrial biodiversity. Nature 520, 45–50. doi: 10.1038/nature14324
Nor, A. N. M., Corstanje, R., Harris, J. A., and Brewer, T. (2017). Impact of rapid urban expansion on green space structure. Ecol. Indic. 81, 274–284. doi: 10.1016/j.ecolind.2017.05.031
Noss, R. F. (2001). Beyond Kyoto: Forest management in a time of rapid climate change. Conserv. Biol. 15, 578–590. doi: 10.1046/j.1523-1739.2001.015003578.x
Popp, A., Humpenöder, F., Weindl, I., Bodirsky, B. L., Bonsch, M., Lotze-Campen, H., et al. (2014). Land-use protection for climate change mitigation. Nat. Clim. Chang. 4, 1095–1098. doi: 10.1038/nclimate2444
Powers, R. P., and Jetz, W. (2019). Global habitat loss and extinction risk of terrestrial vertebrates under future land-use-change scenarios. Nat. Clim. Chang. 9, 323–329. doi: 10.1038/s41558-019-0406-z
Rogelj, J., Shindell, D., Jiang, K., Fifita, S., Forster, P., Ginzburg, V., et al. (2018). “Mitigation pathways compatible with 1.5°C in the context of sustainable development,” in Global Warming of 1.5°C. An IPCC Special Report on the Impacts of Global Warming of 1.5°C Above Pre-industrial Levels and Related Global Greenhouse Gas Emission Pathways, in the Context of Strengthening the Global Response to the Threat of Climate Change, Sustainable Development, and Efforts to Eradicate Poverty. eds. V. Masson-Delmotte, P. Zhai, H.-O. Pörtner, D. Roberts, J. Skea, and P. R. Shukla, et al. (Geneva, Switzerland: Intergovernmental Panel on Climate Change/World Meteorological Organization), 93–174.
Schoenberger, E., and Walker, R. A. (2017). Beyond exchange and agglomeration: resource flows and city environments as wellsprings of urban growth. J. Econ. Geogr. 17, lbw012–lbw958. doi: 10.1093/jeg/lbw012
Sharp, R., Douglass, J., Wolny, S., Arkema, K., Bernhardt, J., Bierbower, W., et al. (2020). InVEST 3.10.2 User’s Guide, the Natural Capital Project. Stanford University: Stanford, CA, USA; University of Minnesota: Minneapolis, MN, USA; The Nature Conservancy, and World Wildlife Fund: Arlington, VI, USA.
Shi, K. F., Yu, B. L., Huang, Y. X., Hu, Y. J., Yin, B., Chen, Z. Q., et al. (2014). Evaluating the ability of NPP-VIIRS nighttime light data to estimate the gross domestic product and the electric power consumption of China at multiple scales: a comparison with DMSP-OLS data. Remote Sens. 6, 1705–1724. doi: 10.3390/rs6021705
Sleeter, B. M., Wilson, T. S., Sharygin, E., and Sherba, J. T. (2017). Future scenarios of land change based on empirical data and demographic trends. Earths Future 5, 1068–1083. doi: 10.1002/2017ef000560
Solomon, S., Plattner, G. K., Knutti, R., and Friedlingstein, P. (2009). Irreversible climate change due to carbon dioxide emissions. Proc. Natl. Acad. Sci. U. S. A. 106, 1704–1709. doi: 10.1073/pnas.0812721106
Sun, L. L., Cui, H. J., and Ge, Q. S. (2022). Will China achieve its 2060 carbon neutral commitment from the provincial perspective? Adv. Clim. Chang. Res. 13, 169–178. doi: 10.1016/j.accre.2022.02.002
Tang, X. J., Woodcock, C. E., Olofsson, P., and Hutyra, L. R. (2021). Spatiotemporal assessment of land use/land cover change and associated carbon emissions and uptake in the Mekong River basin. Remote Sens. Environ. 256:112336. doi: 10.1016/j.rse.2021.112336
Thonfeld, F., Steinbach, S., Muro, J., Hentze, K., Games, I., Naschen, K., et al. (2020). The impact of anthropogenic land use change on the protected areas of the Kilombero catchment. ISPRS J. Photogramm. Remote Sens. 168, 41–55. doi: 10.1016/j.isprsjprs.2020.07.019
Tian, L., and Fu, W. (2020). Bi-temporal analysis of spatial changes of boreal Forest cover and species in Siberia for the years 1985 and 2015. Remote Sens. 12:4116. doi: 10.3390/rs12244116
Tian, L., Fu, W. X., Tao, Y., Li, M. Y., and Wang, L. (2022a). Dynamics of the alpine timberline and its response to climate change in the Hengduan mountains over the period 1985-2015. Ecol. Indic. 135:108589. doi: 10.1016/j.ecolind.2022.108589
Tian, L., Tao, Y., Fu, W. X., Li, T., Ren, F., and Li, M. Y. (2022b). Dynamic simulation of land use/cover change and assessment of Forest ecosystem carbon storage under climate change scenarios in Guangdong Province, China. Remote Sens. 14:2330. doi: 10.3390/rs14102330
Wang, Z. Y., Li, X., Mao, Y. T., Li, L., Wang, X. R., and Lin, Q. (2022). Dynamic simulation of land use change and assessment of carbon storage based on climate change scenarios at the city level: a case study of Bortala, China. Ecol. Indic. 134:108499. doi: 10.1016/j.ecolind.2021.108499
Wang, Y., Li, X. M., Zhang, Q., Li, J. F., and Zhou, X. W. (2018). Projections of future land use changes: multiple scenarios-based impacts analysis on ecosystem services for Wuhan city, China. Ecol. Indic. 94, 430–445. doi: 10.1016/j.ecolind.2018.06.047
Wang, Z. H., Liu, H. M., Guan, Q. W., Wang, X. J., Hao, J. P., Ling, N., et al. (2011). Carbon storage and density of urban forest ecosystems in Nanjing. J. Nanjing For. Univ. 35, 18–22. doi: 10.3969/j.issn.1000-2006.2011.04.004
Weisberg, P. J., Lingua, E., and Pillai, R. B. (2007). Spatial patterns of pinyon-juniper woodland expansion in Central Nevada. Rangel. Ecol. Manag. 60, 115–124. doi: 10.2111/05-224r2.1
Wilfried, T. (2007). Biodiversity: climate change and the ecologist. Nature 448, 550–552. doi: 10.1038/448550a
Winkler, K., Fuchs, R., Rounsevell, M., and Herold, M. (2021). Global land use changes are four times greater than previously estimated. Nat. Commun. 12:2501. doi: 10.1038/s41467-021-22702-2
Wu, H., Li, Z., Clarke, K. C., Shi, W. Z., Fang, L. C., Lin, A. Q., et al. (2019). Examining the sensitivity of spatial scale in cellular automata Markov chain simulation of land use change. Int. J. Geogr. Inf. Sci. 33, 1040–1061. doi: 10.1080/13658816.2019.1568441
Wu, Y., Tao, Y., Yang, G. S., Ou, W. X., Pueppke, S., Sun, X., et al. (2019). Impact of land use change on multiple ecosystem services in the rapidly urbanizing Kunshan City of China: past trajectories and future projections. Land Use Policy 85, 419–427. doi: 10.1016/j.landusepol.2019.04.022
Xiao, J. F. (2014). Satellite evidence for significant biophysical consequences of the "grain for green" program on the loess plateau in China. J. Geophys. Res. Biogeosci. 119, 2261–2275. doi: 10.1002/2014jg002820
Xu, T. T., Gao, J., and Coco, G. (2019). Simulation of urban expansion via integrating artificial neural network with Markov chain - cellular automata. Int. J. Geogr. Inf. Sci. 33, 1960–1983. doi: 10.1080/13658816.2019.1600701
Xu, L., He, N. P., and Yu, G. R. (2014). A dataset of carbon density in Chinese terrestrial ecosystems (2010s). China Science Data 4, 90–96.
Yang, X., Chen, R., and Zheng, X. Q. (2016). Simulating land use change by integrating ANN-CA model and landscape pattern indices. Geomat. Nat. Haz. Risk 7, 918–932. doi: 10.1080/19475705.2014.1001797
Yang, H., Huang, J. L., and Liu, D. F. (2020). Linking climate change and socioeconomic development to urban land use simulation: analysis of their concurrent effects on carbon storage. Appl. Geogr. 115:102135. doi: 10.1016/j.apgeog.2019.102135
Yee, S. H., Paulukonis, E., Simmons, C., Russell, M., Fulford, R., Harwell, L., et al. (2021). Projecting effects of land use change on human well-being through changes in ecosystem services. Ecol. Model. 440:109358. doi: 10.1016/j.ecolmodel.2020.109358
Zhai, H., Lv, C. Q., Liu, W. Z., Yang, C., Fan, D. S., Wang, Z. K., et al. (2021). Understanding Spatio-temporal patterns of land use/land cover change under urbanization in Wuhan, China, 2000-2019. Remote Sens. 13:3331. doi: 10.3390/rs13163331
Zhang, K., Dang, H., Tan, S., Cheng, X., and Zhang, Q. (2010). Change in soil organic carbon following the ‘grain-for-green’ programme in China. Land Degrad. Dev. 21, 13–23. doi: 10.1002/ldr.954
Zhang, X., and Gu, R. X. (2022). Spatio-temporal pattern and multi-scenario simulation of land use conflict: a case study of the Yangtze River Delta urban agglomeration. Geogr. Res. 41:16. doi: 10.11821/dlyj020210375
Zhang, Q. W., and Su, S. L. (2016). Determinants of urban expansion and their relative importance: a comparative analysis of 30 major metropolitans in China. Habitat Int. 58, 89–107. doi: 10.1016/j.habitatint.2016.10.003
Zhang, Y. W., and Xie, H. L. (2019). Interactive relationship among urban expansion, economic development, and population growth since the reform and opening up in China: an analysis based on a vector error correction model. Land 8:153. doi: 10.3390/land8100153
Zhang, S. H., Zhong, Q. L., Cheng, D. L., Xu, C. B., Chang, Y. N., Lin, Y. Y., et al. (2022). Landscape ecological risk projection based on the PLUS model under the localized shared socioeconomic pathways in the Fujian Delta region. Ecol. Indic. 136:108642. doi: 10.1016/j.ecolind.2022.108642
Zhao, M. M., He, Z. B., Du, J., Chen, L. F., Lin, P. F., and Fang, S. (2019). Assessing the effects of ecological engineering on carbon storage by linking the CA-Markov and InVEST models. Ecol. Indic. 98, 29–38. doi: 10.1016/j.ecolind.2018.10.052
Zhu, S. Y., Kong, X. S., and Jiang, P. (2020). Identification of the human-land relationship involved in the urbanization of rural settlements in Wuhan city circle, China. J. Rural Stud. 77, 75–83. doi: 10.1016/j.jrurstud.2020.05.004
Keywords: carbon storage, land use and land cover, scenario simulation, PLUS model, InVEST model, Nanjing metropolitan circle
Citation: Tao Y, Tian L, Wang C and Dai W (2023) Dynamic simulation of land use and land cover and its effect on carbon storage in the Nanjing metropolitan circle under different development scenarios. Front. Ecol. Evol. 11:1102015. doi: 10.3389/fevo.2023.1102015
Edited by:
Wei Zhao, Institute of Geographic Sciences and Natural Resources Research (CAS), ChinaReviewed by:
Cuicui Jiao, Sichuan University of Science and Engineering, ChinaCopyright © 2023 Tao, Tian, Wang and Dai. This is an open-access article distributed under the terms of the Creative Commons Attribution License (CC BY). The use, distribution or reproduction in other forums is permitted, provided the original author(s) and the copyright owner(s) are credited and that the original publication in this journal is cited, in accordance with accepted academic practice. No use, distribution or reproduction is permitted which does not comply with these terms.
*Correspondence: Chun Wang, ✉ d2FuZ2NodW5AY2h6dS5lZHUuY24=
†These authors have contributed equally to this work
Disclaimer: All claims expressed in this article are solely those of the authors and do not necessarily represent those of their affiliated organizations, or those of the publisher, the editors and the reviewers. Any product that may be evaluated in this article or claim that may be made by its manufacturer is not guaranteed or endorsed by the publisher.
Research integrity at Frontiers
Learn more about the work of our research integrity team to safeguard the quality of each article we publish.