 Melissa L. Brock1†
 Rachel Richardson1Melissa Ederington-Hagy1†Lisa Nigro1†Richard A. Snyder2
 Wade H. Jeffrey1*
- 1Center for Environmental Diagnostics and Bioremediation, University of West Florida, Pensacola, FL, United States
- 2Virginia Institute of Marine Science Eastern Shore Laboratory, College of William & Mary, Wachapreague, VA, United States
Oil spills are common occurrences in the United States and can result in extensive ecological damage. The 2010 Deepwater Horizon oil spill in the Gulf of Mexico was the largest accidental spill recorded. Many studies were performed in deep water habitats to understand the microbial response to the released crude oil. However, much less is known about how planktonic coastal communities respond to oil spills and whether that response might vary over the course of the year. Understanding this temporal variability would lend additional insight into how coastal Florida habitats may have responded to the Deepwater Horizon oil spill. To assess this, the temporal response of planktonic coastal microbial communities to acute crude oil exposure was examined from September 2015 to September 2016 using seawater samples collected from Pensacola Beach, Florida, at 2-week intervals. A standard oil exposure protocol was performed using water accommodated fractions made from MC252 surrogate oil under photo-oxidizing conditions. Dose response curves for bacterial production and primary production were constructed from 3H-leucine incorporation and 14C-bicarbonate fixation, respectively. To assess drivers of temporal patterns in inhibition, a suite of biological and environmental parameters was measured including bacterial counts, chlorophyll a, temperature, salinity, and nutrients. Additionally, 16S rRNA sequencing was performed on unamended seawater to determine if temporal variation in the in situ bacterial community contributed to differences in inhibition. We observed that there is temporal variation in the inhibition of primary and bacterial production due to acute crude oil exposure. We also identified significant relationships of inhibition with environmental and biological parameters that quantitatively demonstrated that exposure to water-soluble crude oil constituents was most detrimental to planktonic microbial communities when temperature was high, when there were low inputs of total Kjeldahl nitrogen, and when there was low bacterial diversity or low phytoplankton biomass.
1. Introduction
Oil spills are common occurrences in waterways of the United States. From 2000 to 2019, an average of 3,871 spills occurred each year resulting in an average of 1,233,863 gallons of oil released per year (Ramseur and Resources, Science, and Industry Division, 2017). Depending on the location and severity of the spill, extensive economic and ecological destruction may result. The 2010 Deepwater Horizon (DWH) oil spill in the Gulf of Mexico is the largest accidental oil spill recorded. The DWH oil platform suffered a catastrophic blowout on 20 April 2010 that began releasing crude oil at a subsurface depth of 1,500 m until the well was capped 84 days later on 15 July 2010 (McNutt et al., 2012). The DWH spill released 4.9 million barrels of crude oil ∼80 km offshore (McNutt et al., 2012). An estimated 60% of the subsurface oil reached the sea surface where hydrodynamic forces then affected its distribution (Ziervogel et al., 2012). A portion of the DWH oil (<15%) reached the shoreline (Beyer et al., 2016) where it contaminated 1,773 km of shoreline with 847 km of shoreline oiling persisting after 1 year (Michel et al., 2013).
Coastal habitats are environmentally and economically critical for the region (Mendelssohn et al., 2012; Wiesenburg et al., 2021), yet the impact of the DWH spill on planktonic microbial communities in coastal waters was not studied nearly as extensively as coastal sediments (Kostka et al., 2011; Bik et al., 2012; King et al., 2015; Huettel et al., 2018) and offshore environments (Joye et al., 2014). It has been hypothesized that natural oil seeps in the Gulf of Mexico “pre-primed” microbial communities for oil degradation (Atlas and Hazen, 2011; Hazen et al., 2016; Liu et al., 2017), but the toxic effects of these seeps are spatially limited as opposed to a massive spill. Exposure to crude oil released by DWH reduced microbial diversity and altered community structure from the surface ocean to the seafloor in offshore environments (Hazen et al., 2010; Valentine et al., 2010; Kessler et al., 2011). However, the impact of DWH oil on planktonic coastal microbial communities may be more complex due to the variable extent of weathering that the crude oil underwent before reaching coastal environments. As crude oil was transported, its physical and chemical properties changed due to evaporation, emulsification, dissolution, photo-oxidation, and microbial degradation (Mendelssohn et al., 2012; Farrington et al., 2021). Dissolution of crude oil releases highly toxic compounds such as low-molecular-weight aliphatic compounds, aromatic hydrocarbons, and PAHs into the surrounding seawater (Abbriano et al., 2011). This solution of water-soluble petroleum compounds is termed the water accommodated fraction (WAF). Compounds in the WAF have variable effects on phytoplankton growth with low PAH concentrations (1 mg L–1) observed to stimulate growth while high PAH concentrations (100 mg L–1) inhibited growth (Harrison et al., 1986). Additionally, photo-oxidation of crude oil degrades large, aromatic hydrocarbons, and produces water-soluble oxidized species which facilitate biodegradation but may also increase the toxicity of the surrounding seawater (King et al., 2015; Beyer et al., 2016). Thus, weathered crude oil is a dynamic substance which may have variable impacts on planktonic coastal microbes.
Weathering of crude oil is also influenced by nutrient availability and by physicochemical parameters, such as temperature, indicating that the location (e.g., eutrophic versus oligotrophic waters) and the timing (e.g., winter versus summer) of an oil spill plays a large role on its impact. Nutrient availability, specifically N and P, controls the rate of hydrocarbon degradation in the environment (Atlas and Bartha, 1972; Head et al., 2006). Because WAFs have high C content, their mineralization results in little regenerated nitrogen or phosphorus which hinders further microbial production (Mendelssohn et al., 2012). This effect may be more severe in environments with low inorganic nutrient concentrations, such as oligotrophic waters. Additionally, high temperature has consistently been shown to influence crude oil physicochemical properties by reducing viscosity which increases bioavailability and degradation rates (Wright et al., 1997; Coulon et al., 2007; King et al., 2015). Higher temperatures (24°C) increased the bioavailability of water-soluble components and increased the degradation of total petroleum hydrocarbons compared to lower temperatures (4°C) (Coulon et al., 2007). Following the DWH spill, temperature was suggested to be a significant determinant in structuring microbial communities and in selecting for oil degraders within deep waters, surface waters, and oil mousses (Redmond and Valentine, 2012; Liu and Liu, 2013). However, crude oil is highly toxic to many members within these microbial communities (Parsons et al., 2015; Doyle et al., 2018; Kamalanathan et al., 2021). In microcosm and mesocosm experiments, exposure to crude oil drastically changed the community structure (Doyle et al., 2018) and reduced the relative abundance of bacteria that were initially abundant (Doyle et al., 2018; Kamalanathan et al., 2021). Additionally, in an incubation experiment, Cyanobacteria initially dominated the in situ surface community (60.4% relative abundance). After incubation with crude oil, there was a large reduction in Cyanobacteria abundance (10–30% relative abundance) at low temperature (4°C), and under high temperature (24°C) Cyanobacteria were almost eliminated (Liu et al., 2017). Therefore, under low nutrient availability and high temperature conditions, an oil spill may reduce microbial growth. It remains unknown how weathered crude oil components (i.e., WAF), temperature, and nutrients interact across seasons and how those interactions affect microbial growth.
Here, we ask the following questions: (1) Is there a temporal response of planktonic coastal microbes to WAF? and; (2) What are the environmental drivers of this temporal response? We hypothesized that there is a temporal response that is primarily driven by variations in temperature and inorganic nutrient availability. Thus, we expected highest inhibition of primary production and bacterial production under high temperatures and low inorganic nutrient concentrations. To test these hypotheses, we developed a standard WAF exposure assay and measured inhibition of primary and bacterial production in bi-weekly seawater samples collected over a year from coastal Northwest Florida waters. Understanding temporal variability in the microbial response to crude oil contamination will provide additional insight into the ecological response to DWH within Florida waters.
2. Materials and methods
2.1. Sample overview
Surface seawater samples were collected bi-weekly for 1 year (09/2015 to 09/2016; n = 26) from the end of the Pensacola Beach pier (30° 19.640′ N, 87° 08.514′W) which extends approximately 0.3 km into the Northwestern Gulf of Mexico. Samples were transported at in situ temperatures in the dark to the laboratory. Samples were classified into seasons based on the astronomical calendar as follows: fall was defined as September 23rd – December 20th, winter was defined as December 21st – March 18th, spring was defined as March 19th – June 19th, and summer was defined as June 20th – September 21st.
2.2. Analytics and laboratory techniques
In situ seawater temperature, salinity, NO3– + NO2– concentrations, NH3 concentrations, total Kjeldahl nitrogen (TKN) concentrations, orthophosphate concentrations, and total phosphorus (TP) concentrations were measured for each water sample (Table 1). NO3– + NO2– and orthophosphate concentrations were measured on a Lachat QuickChem 8500 using EPA standard method 353.2 (1993) for NO3– + NO2– concentrations and 365.1 (Kopp, 1979) for orthophosphate concentrations. NH3, TKN, and TP concentrations were measured using EPA standard method 350.1 (1993), EPA standard method 351.2 (1993), and EPA standard method 365.4 (1974), respectively.
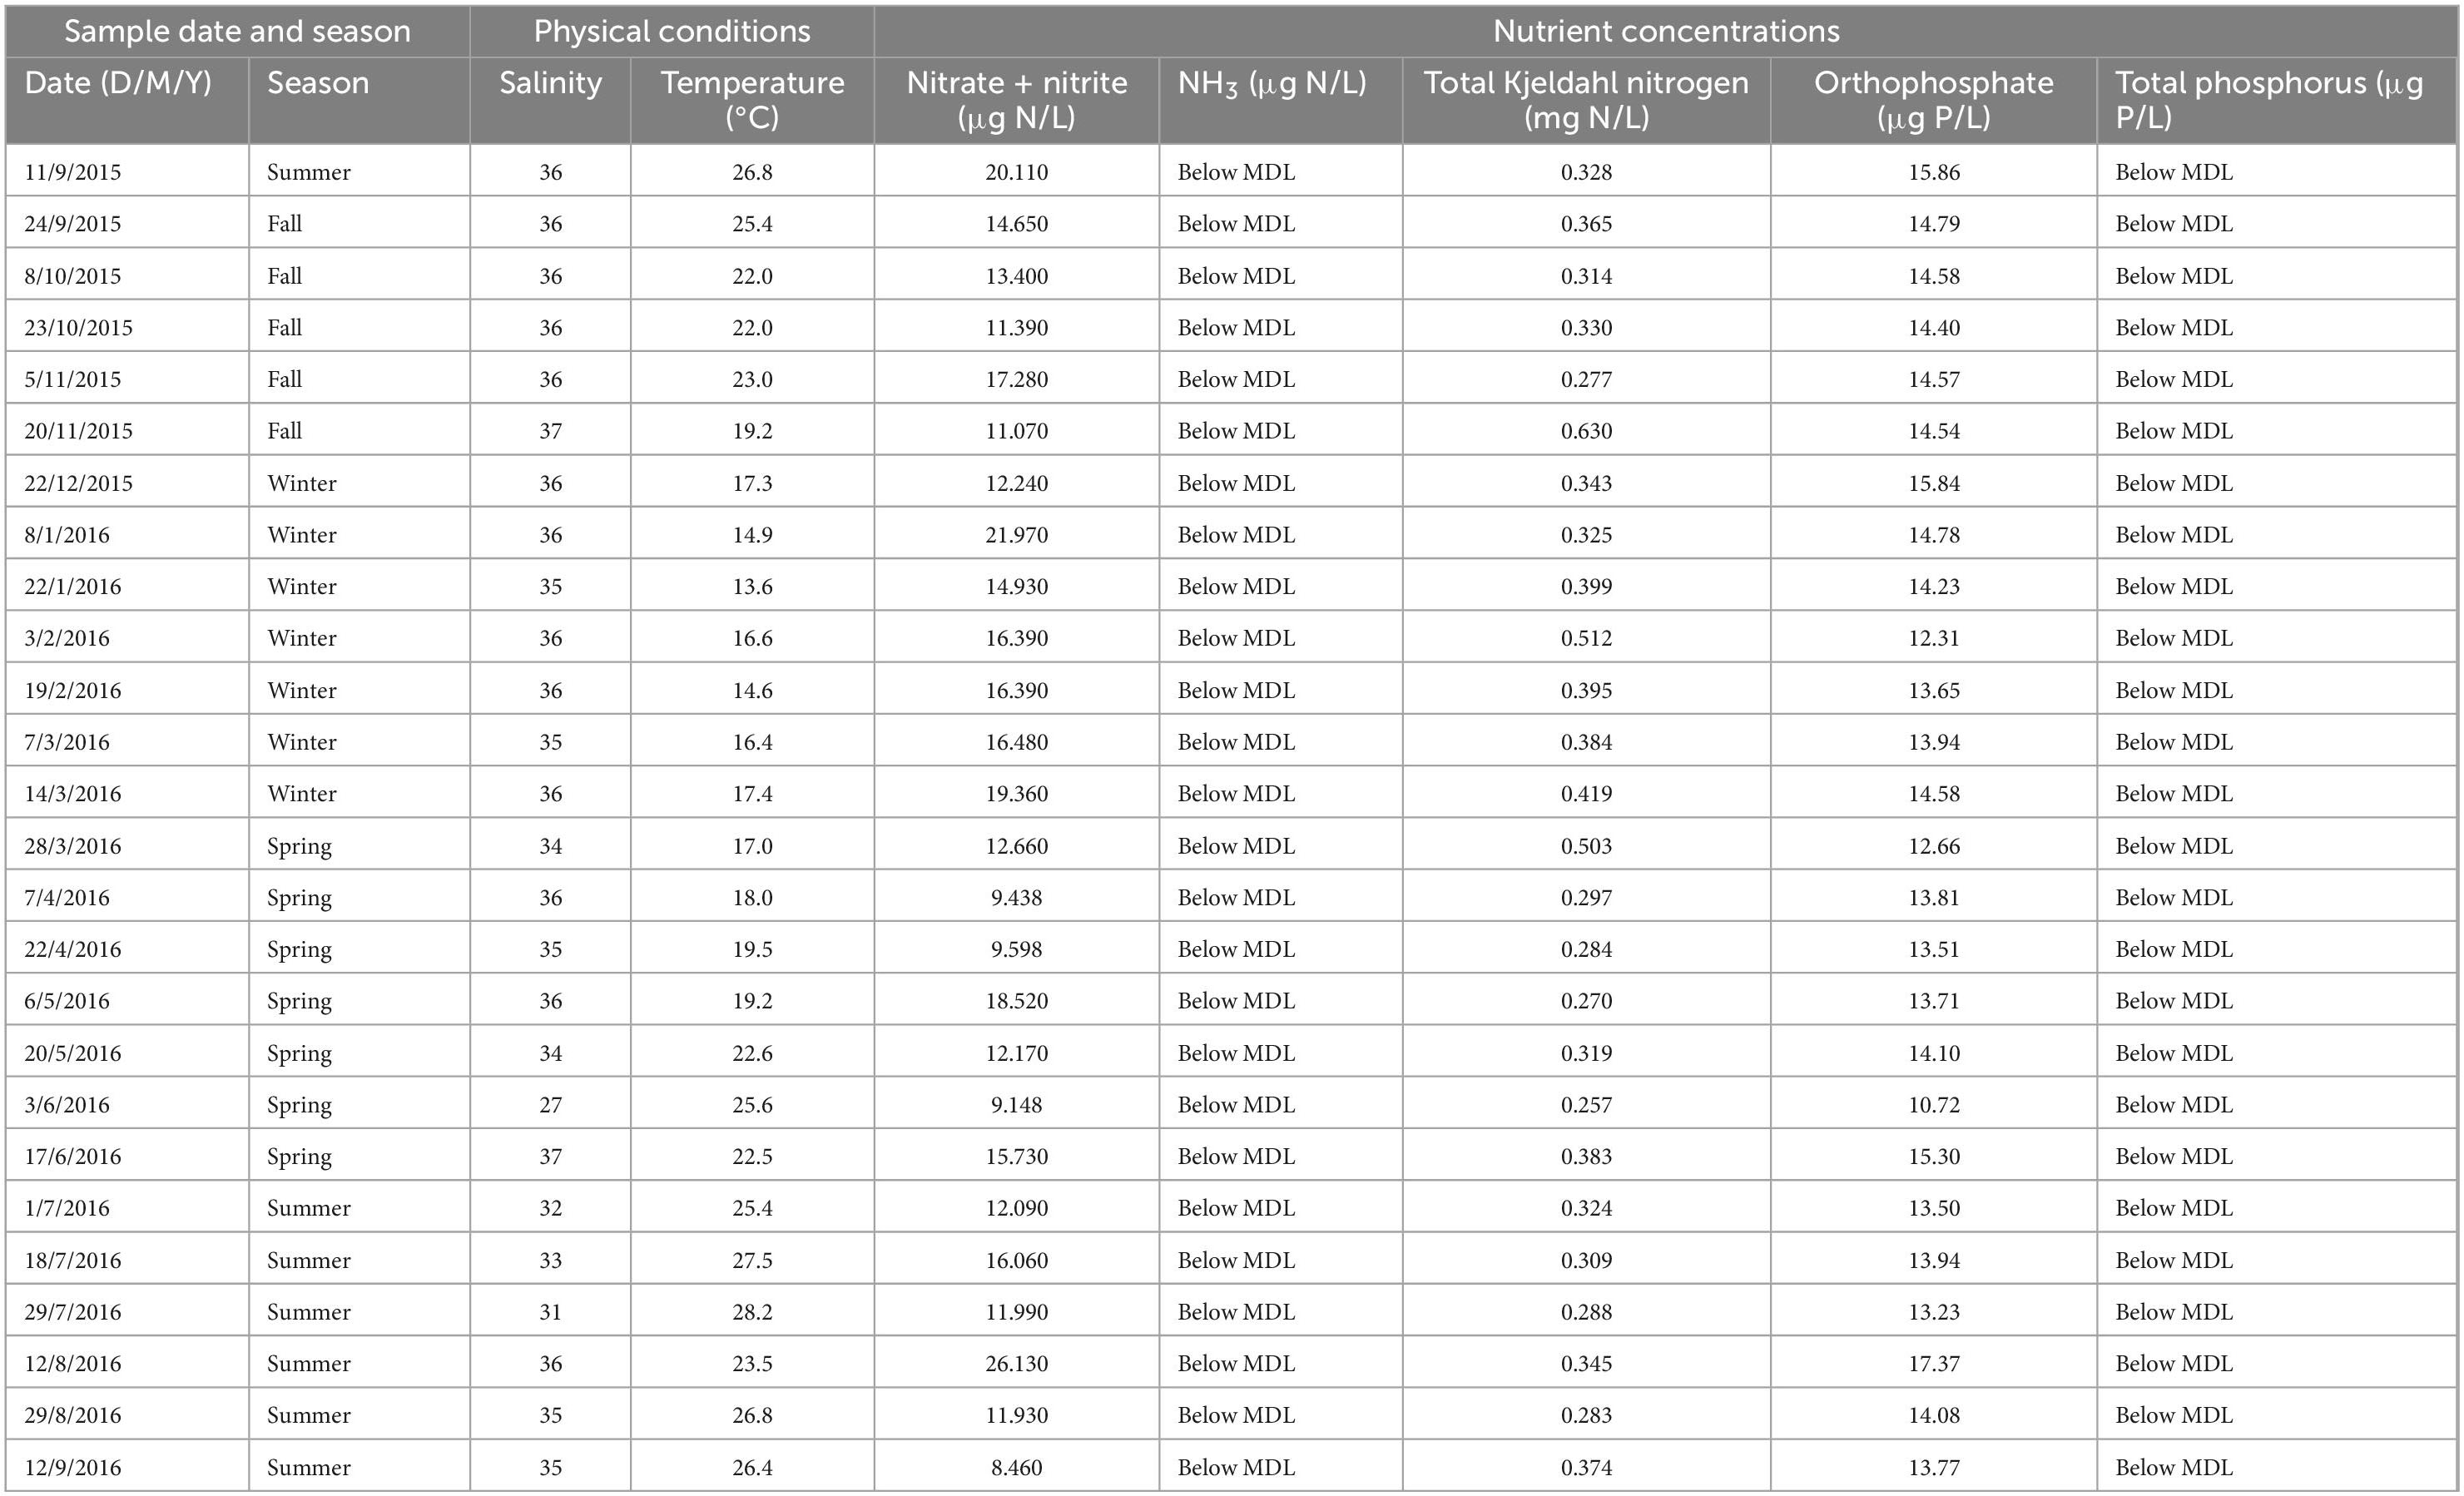
Table 1. Environmental parameters for each sample.
Samples for bacterial counts were preserved with 0.2 μm filtered, buffered formalin. Preserved samples were stained with 4′,6-diamidino-2-phenylindole, dihydrochloride (DAPI) using the method of Porter and Feig (1980) and counted using an epifluorescence microscope. Samples for chlorophyll a concentrations were filtered (200 mL) onto 25 mm GF/F filters in triplicate, extracted in 90% acetone overnight, and measured fluorometrically (Turner Trilogy Laboratory Fluorometer) using a standard curve (Welschmeyer, 1994).
Aged Gulf of Mexico seawater (collected ∼40 km offshore Pensacola, FL and >3 years old) was filtered using a 0.2 μm pore-size polycarbonate filter (Millipore). Twenty-five milliliter of filtered seawater was aliquoted into 35 mL Teflon bottles (Nalgene FEP). Bottles containing filtered seawater were pasteurized at 70°C for 2–4 h. Once cooled, pasteurized seawater was amended with surrogate crude oil (Pelz et al., 2011) to contain a final volume of 2% crude oil. Bottles were incubated in a 20°C temperature-controlled water table (Fisherbrand, Isotemp 4100) under full solar exposure for 5 days during the summer on the roof of the Environmental Sciences building at the University of West Florida (Vaughan et al., 2016). Bottles were shaken twice per day and returned to the water table. Samples were pooled into a separatory funnel, and the aqueous fraction (i.e., the WAF) was collected and transferred to 20 mL scintillation vials in 10 mL aliquots and stored frozen at −20°C. Here, we make the assumption that because we used filtered, pasteurized aged seawater, any organic carbons in the seawater were dissolved hydrocarbons. Therefore, total organic carbon (TOC) was used as a proxy for hydrocarbon concentrations. TOC concentrations of the WAF were determined as non-purgeable organic carbon with a Shimadzu TPC-VVSN Analyzer using standard method 5310 (2018). WAFs contained an average TOC concentration of 68.9 ppm (SD = 1.1, n = 4). Fractions were thawed prior to each sensitivity assay. In this way, each bi-weekly water sample was exposed to the same WAF for the duration of the project.
Bacterial production was estimated through incorporation of 3H-leucine. The standard WAF exposure consisted of a dose response curve of 0, 0.5, 1, 2.5, 5, and 10% v/v WAF (final concentration amended to the seawater sample) for each time point. WAF was aliquoted into 4 replicate 5 mL polystyrene snap-cap tubes for each treatment. Four replicate controls received 100 μL of filtered seawater (0.2 μm pore size syringe filter). Seawater was amended with 3H-leucine (52.9 Ci mmol–1 PerkinElmer, Bridgeport, CT, USA) to a final concentration of 10 nM; 3.1 mL of labeled seawater was added to each tube. Samples were capped, mixed, and incubated in the dark at in situ temperature for 4 h. To terminate leucine incorporation, triplicate 1.0 mL subsamples were removed from each snap cap tube and placed into 2 mL microfuge tubes containing 50 μL of 100% trichloroacetic acid. Samples were processed following the procedure of Smith and Azam (1992). Liquid scintillation counting using a Packard Tri-Carb 2900 was performed to determine 3H-leucine incorporation in samples.
Primary production was determined through the fixation of 14C-bicarbonate under increasing light exposures (PI curves) (Matrai et al., 1995) using a modified photosynthetron. Triplicate dose response curves of 0, 0.5, 1, 2.5, 5, and 10% WAF treatment were generated for each time point. WAF and 33 mL of seawater were aliquoted into 50 mL conical centrifuge tubes for each treatment which were then amended with 14C-bicarbonate (2 μCi/mL). Triplicate controls received 1 mL of filtered seawater (0.2 μm pore size syringe filter) and 33 mL of seawater that were then amended with 14C-bicarbonate. Each treatment was aliquoted into eight, 4 mL snap cap tubes that were incubated at in situ temperature for 4 h in a photosynthesis irradiance incubator. The photosynthetically active radiation of each position was measured with a quantum scalar laboratory radiometer (Biospherical Instruments Inc.) and recorded. Irradiances for the eight positions were ∼180, 90, 50, 30, 20, 15, 10, and 7 μE cm–2 for each treatment and time point. Lower irradiances were used to maximize the number of points within the linear part of the curve for calculating inhibition of primary production (see below). Fixed 14C was determined after overnight acidification of the samples via liquid scintillation counting using a Packard Tri-Carb 2900. Photosynthetic efficiency was determined as described by Matrai et al. (1995).
Bacterial production inhibition and primary production inhibition were determined using dose response curves (0, 0.5, 1, 2.5, 5, and 10% WAF). For bacterial production inhibition, the average disintegrations per minute (DPM) of each treatment replicate were expressed as a percent of the average DPM of the control (0% WAF). The percent control was log-transformed, and a linear regression of the log-transformed percent of the control versus percent WAF concentration was performed in Excel. The positive slope of the regression for each experiment was then used as a quantitative value for degree of inhibition and is referred to as ‘‘bacterial production inhibition’’ throughout. For primary production inhibition, PI curves were constructed for each control and each treatment replicate. Linear regressions were performed on the linear part of the curve in Kaleidagraph. The slope of each treatment replicate was expressed as a percent of the average slope of the control. The percent control was log-transformed, and a linear regression of the log-transformed percent of the control versus percent WAF concentration was performed in Excel. The positive slope of the regression for each experiment was then used as a quantitative value for degree of inhibition and is referred to as ‘‘primary production inhibition’’ throughout. The standard error of the regression slopes was obtained from Kaleidagraph and was used to assess the uncertainty in bacterial production inhibition and primary production inhibition. Raw data and example calculations are available on GitHub.1
2.3. DNA extraction and 16S rRNA amplicon sequencing
To determine how temporal variation in the background bacterial community contributed to temporal changes in the inhibition of bacterial production, samples for DNA extraction were collected bi-weekly. Samples were collected by filtering 2 L of seawater through three 0.22 μm GPWP (MilliporeSigma) filters. Samples were stored at −80°C until further processing. Half of each previously frozen filter and 250 μL of extraction buffer (Milli-Q water, 5 mM EDTA, 25 mM Tris, and 50 mM glucose) were added to tubes containing a mixture of 0.1 mm silica and 0.5 mm glass beads. Filters were ground using a sterile plastic pestle and were homogenized for two 1-min cycles at 2,000 rpm. Samples were cooled to −80°C, heated to 80°C for 10 min, cooled to −80°C again, and then brought to room temperature. Lysozyme (final concentration = 1.5 mg mL–1) was added to each sample, and samples were incubated for 90 min at 37°C. Proteinase K (final concentration = 3 mg mL–1) was added to each sample, and samples were incubated for 90 min at 50°C. Sodium chloride (final concentration = 0.5 M) and M1 buffer from the Omega E.Z.N.A. Mollusc DNA Kit were added to each sample. The Omega E.Z.N.A. Mollusc DNA Kit was used to wash and collect purified DNA. Extracted DNA was quantified using a NanoDrop spectrophotometer and were stored at −20°C. DNA extracts were sent to the University of Illinois at Chicago’s Sequencing Core for amplification and sequencing. The V4–V5 region of the 16S rRNA gene was amplified using the 515F/926R universal primers (Needham and Fuhrman, 2016). Amplicons were pair-end sequenced (2 ×300) with the MiSeq Illumina platform. Sequence files are available at the NCBI Sequence Read Archive under BioProject ID: PRJNA894536. Accession numbers for each sample are reported in Supplementary Table 1.
2.4. Data analysis and statistics
Forward and reverse primers were removed using cutadapt (Martin, 2011) in QIIME2 (Bolyen et al., 2019). Forward and reverse reads were quality filtered with fastq-mcf (Aronesty, 2013). A window-size of 10 was used to calculate mean quality score. Reads were truncated when the mean quality score was less than 20. After trimming, reads that were shorter than the minimum length threshold of 150 bp were removed. Reads that contained N-calls were also removed. Forward and reverse reads were merged based on a minimum overlap threshold of 10 bp, minimum merge length threshold of 350 bp, and number of maximum differences of 5 bp allowed in the overlapping region using usearch (Edgar, 2010). Final trimming, quality filtering, clustering of amplicons, and removal of chimeras was performed using DADA2 (Callahan et al., 2016) in QIIME2. The merged reads were trimmed to a length threshold of 365 bp to maintain alignment. Reads that matched to the PhiX genome or that contained more than 3 expected errors were removed. The error model was trained using a minimum of 800,000 reads. Samples were then dereplicated, reads were clustered into amplicon sequence variants (ASVs), and chimeric ASVs were removed using a consensus procedure. QIIME2 artifacts generated from this bioinformatics workflow are available on GitHub2 and the contents of each artifact are described in Supplementary Table 2.
Taxonomic, diversity, and statistical analyses were performed in R (version 3.5.1) (R Core Team, 2018). All R code is available on GitHub.3 All colors used in figures were checked for accessibility using Adobe Color’s “Color Blind Safe” Accessibility Tool. Taxonomy was assigned (“assignTaxonomy” function; dada2 package; Callahan et al., 2016) using RDP’s Naïve Bayesian classifier (Wang et al., 2007) and the SILVA 138 reference database (Quast et al., 2012). ASVs matching to eukaryotes, archaea, or that were unassigned at the bacterial Kingdom or Phylum level were removed from subsequent taxonomy and diversity analyses. Temporal trends in the 25 most abundant genera were examined across the time series. Counts of all genera in each sample are available in Supplementary Table 3.
For alpha-diversity analyses, sequencing depth was normalized by rarefying each sample to 16000 sequences (“rrarefy” function; vegan package; Oksanen et al., 2022). Alpha-diversity was calculated using the Shannon index (“diversity” function; vegan package) which is a composite metric of richness and evenness. Therefore, alpha-diversity was also calculated as richness (i.e., the number of ASVs in each sample; “richness” function; microbiome package) and evenness using Pielou’s index. Pielou’s index was calculated as H/log(S) where H is the Shannon index and S is richness. A one-way analysis of variance (ANOVA) was performed to determine if the three metrics of alpha-diversity varied by season. Prior to performing ANOVAs, assumptions of normality and homogeneity were checked using the Shapiro–Wilk test and Levene’s test, respectively. Tukey’s HSD was then performed to identify differences in alpha-diversity between seasons. To visualize similarities and differences in ASV composition by season, a Euler diagram was constructed using the rarefied ASV count table (“ps_euler” function; MicEco package; Russel, 2021). Additionally, the nestedness and turnover of ASVs between seasons were calculated (“beta.temp” function; betapart package; Baselga et al., 2022) to better understand ecological succession throughout the year. Lastly, correlation analysis of the three metrics of alpha-diversity with temperature and TKN were performed (“cor.test” function, method = “pearson”).
For beta-diversity analyses, sequences were normalized using the variance stabilizing transformation (“varianceStabilizingTransformation” function; DESeq2 package; Love et al., 2014). Principal component analysis (PCA) was conducted on the normalized ASV table to visualize differences in microbial community structure by season (“ordinate” function; phyloseq package; McMurdie and Holmes, 2013). PC1 was extracted and correlation tests of temperature and TKN with PC1 were conducted (“cor.test” function; method = “pearson”). A PCA was also conducted on the environmental variables (“rda” function; vegan package), loadings were extracted, and the environmental loadings were overlaid as vectors onto the community ordination plot to create a biplot. Permutational ANOVA was performed to determine if community structure varied by season (“adonis” function; vegan package). Prior to performing the permutational ANOVA, the assumption of homogeneity of dispersion among groups was checked (“betadisper” function; vegan package). To identify which seasons significantly differed in their community structures, pairwise permutation multivariate ANOVA was performed (“pairwise.perm.manova” function; RVAideMemoire package; Hervé, 2020). To prevent inflation of Type I error rate due to multiple comparisons, the Hochberg method was applied to calculate adjusted p-values.
To determine if changes in the inhibition of primary and bacterial production varied by season, ANOVAs were performed, as described above. Simple linear regressions were performed to identify significant linear relationships between inhibition and biological/environmental variables. A mantel test was performed to determine if variation in the inhibition of bacterial production was correlated with changes in microbial community structure (“mantel” function; vegan package). The mantel test was performed using 10,000 permutations on two normalized dissimilarity matrices: (1) a Euclidean distance matrix of inhibition of bacterial production and (2) a Bray–Curtis distance matrix constructed from the rarefied ASV count table (“vegdist” function; vegan package).
3. Results
3.1. Environmental conditions
Surface coastal waters exhibited a strong temporal temperature trend but lacked temporal variability in salinity and nutrient concentrations (Figure 1 and Table 1). Sea surface temperatures during the summer were significantly higher than all other seasons (p < 0.05) with a maximum value of 28.2°C, while temperatures during the winter were significantly colder than all other seasons (p < 0.01) with a minimum value of 13.6°C (Figure 1A). Salinity ranged from 27 to 37 with no significant differences between seasons but with higher variability observed at the end of spring and during summer due to increased rainfall (Figure 1B). NH3 and TP concentrations were below the minimum detection limits (MDL). NO3– + NO2–, TKN, and orthophosphate concentrations were above the MDL but exhibited minimal variation and had no temporal trends (p > 0.05) (Figures 1C-E).
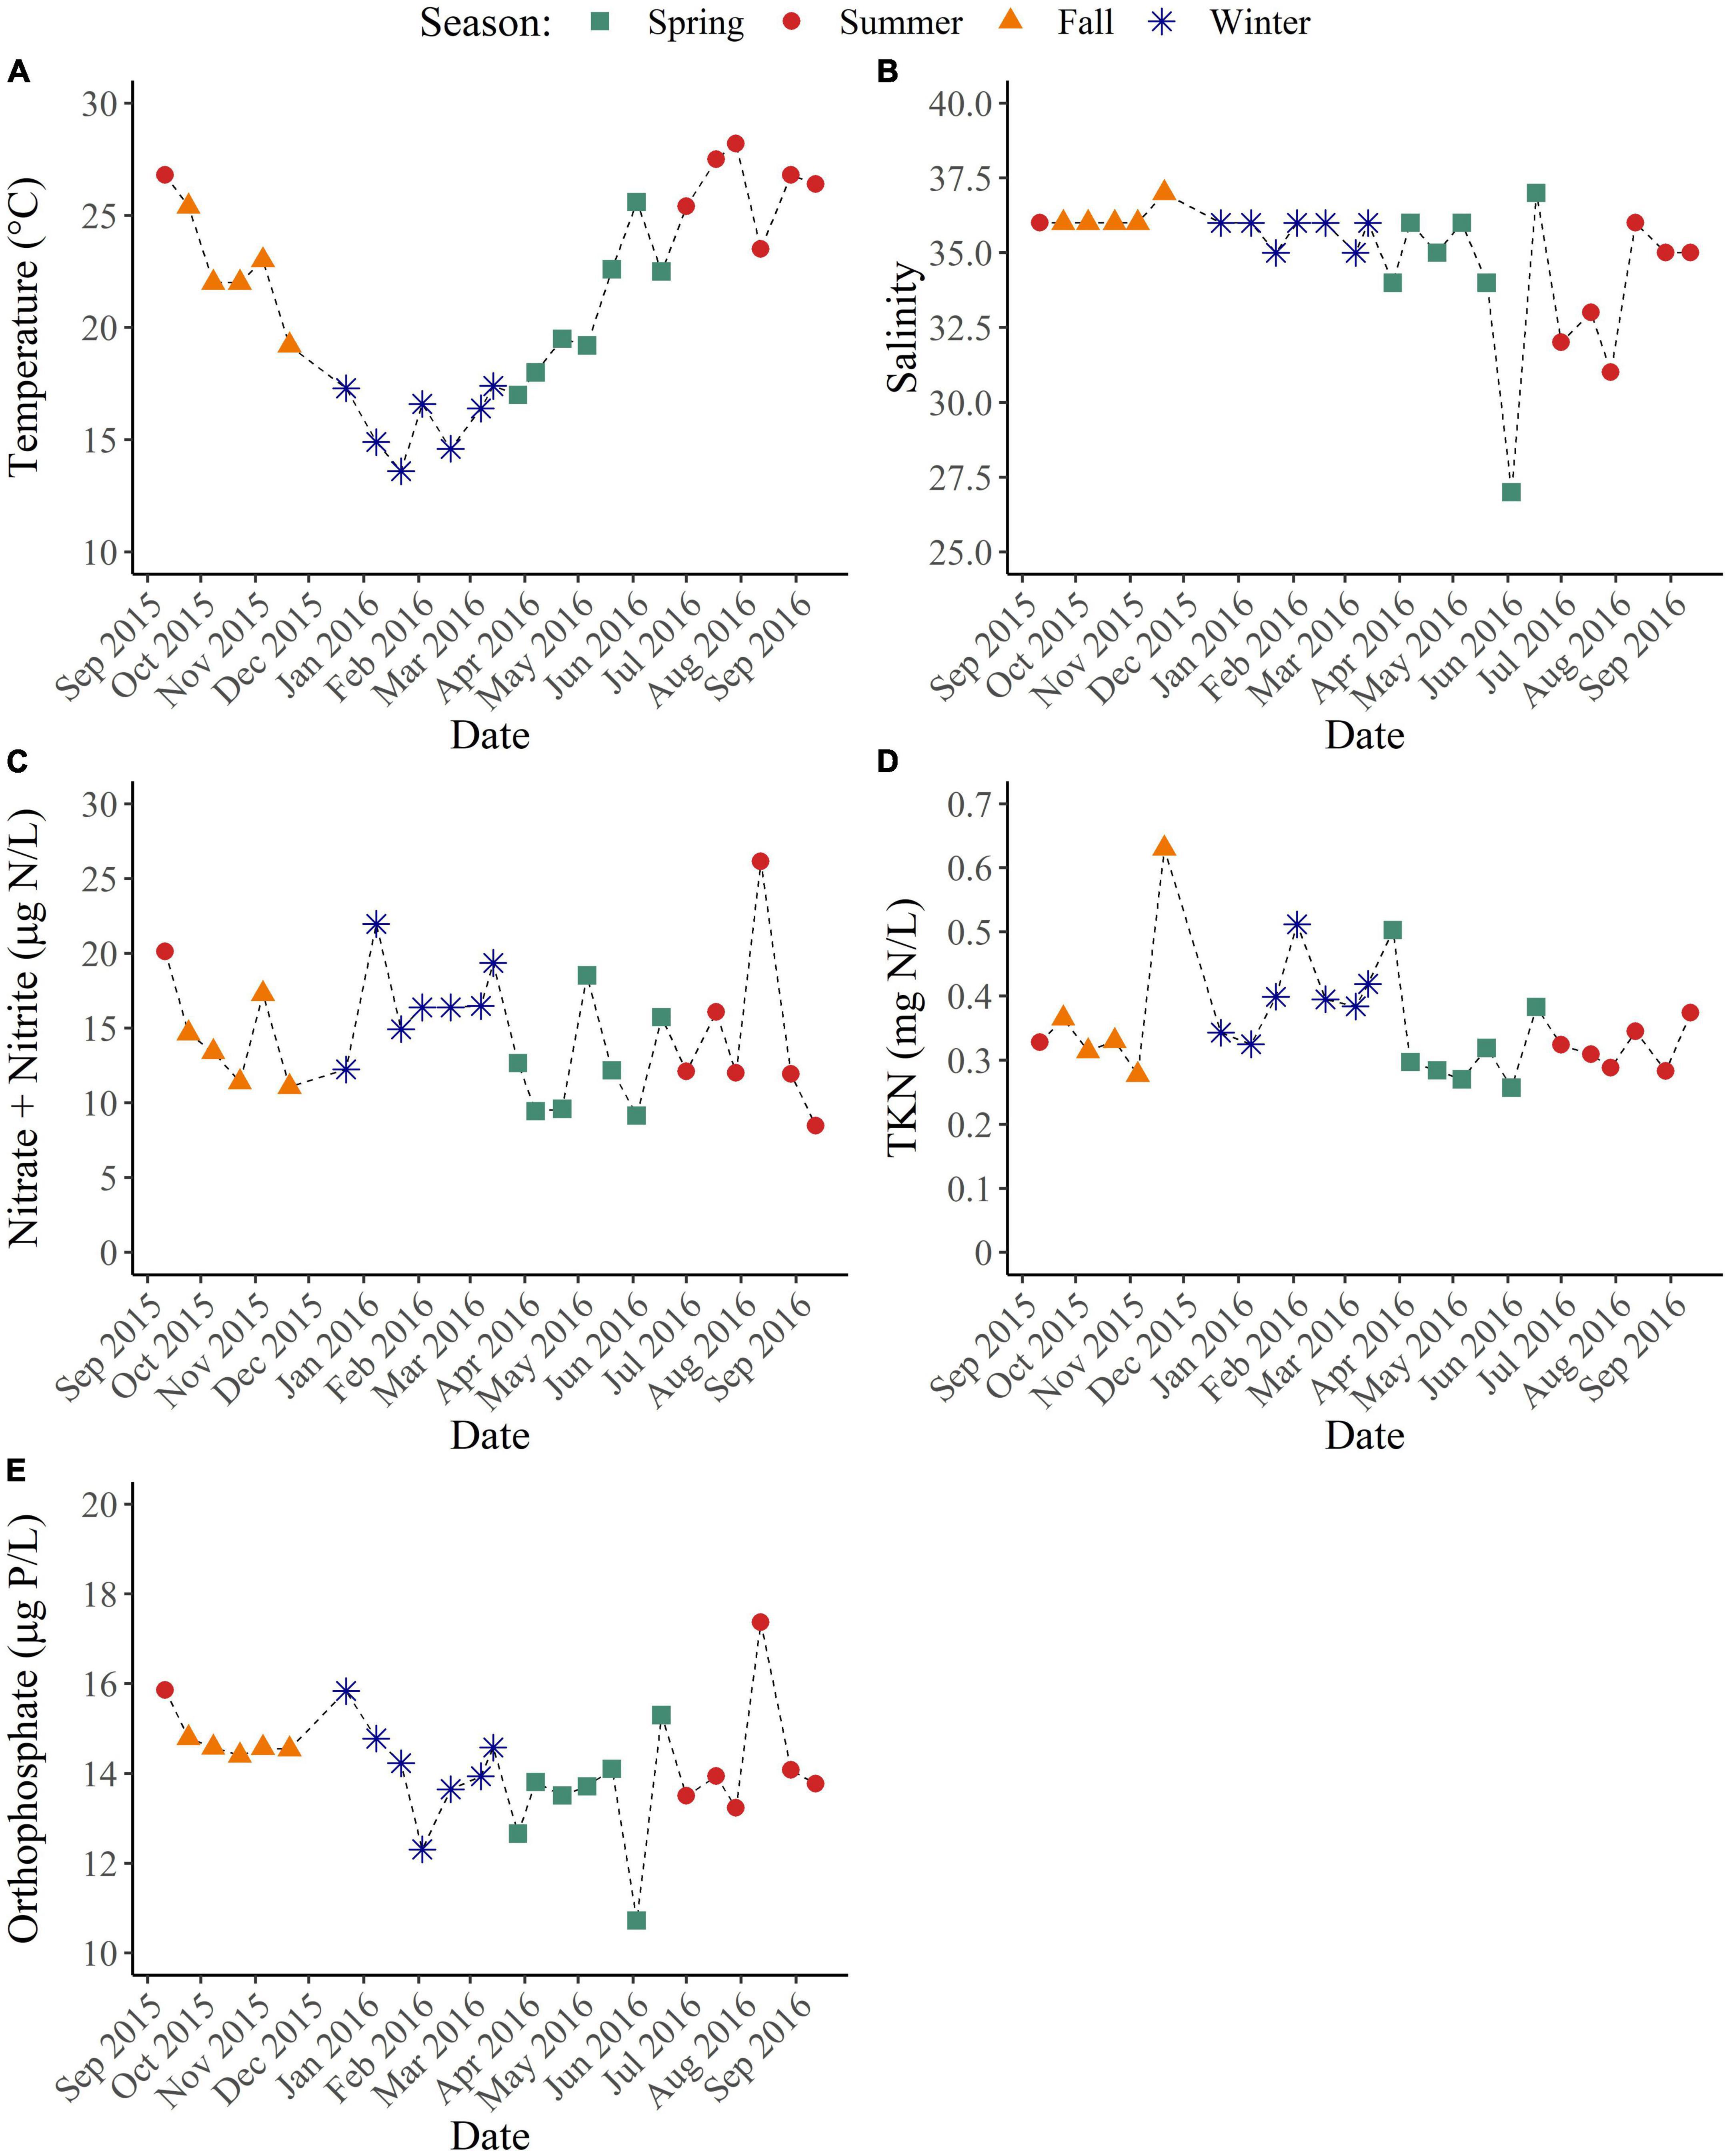
Figure 1. Environmental conditions of coastal Pensacola Beach waters from 09/2015 to 09/2016. (A) Temperature (°C). (B) Salinity. (C) NO3– + NO2– (μg N/L). (D) Total Kjeldahl nitrogen (mg N/L). (E) Orthophosphate (μg P/L).
3.2. Bacterial diversity, community structure, and composition
Patterns in bacterial diversity, community structure, and taxonomic composition were examined by sequencing the V4–V5 region of the 16S rRNA gene. Alpha-diversity was calculated using three different metrics: the Shannon index, ASV richness, and Pielou’s evenness index (Supplementary Table 1). The Shannon index and ASV richness did not exhibit any temporal trends (Supplementary Figures 1A, B), but evenness did significantly vary between winter and summer with winter having higher evenness than summer (p < 0.05) (Figure 2A and Supplementary Figure 1C). While alpha-diversity varied minimally across seasons, there were significant differences in community structure by season. Although PCA indicates that there is some overlap in community structure (Figure 2B), PERMANOVA confirmed that they are statistically distinct from each other according to season (p < 0.05). Partitioning beta-diversity into turnover and nestedness components revealed that the differences in community structure are largely due to turnover, with the turnover component accounting for 84–93% of the dissimilarity between seasons. This analysis is supported by a Euler diagram which shows that there are larger proportions of ASVs unique to each season compared to the proportion of ASVs shared between subsequent seasons (Figure 2C). There are also noticeable transitions between seasons in community composition. Candidatus Actinomarina, SAR11 clade Ia, HIMB11, NS2b marine group, NS4 marine group, NS5 marine group, OM60 (NOR5) clade, and Synechococcus dominated the bacterial community throughout the year (>1% average relative abundance) (Figure 3A), but their relative abundances shifted across seasons (Figure 3B). Within each season, particular genera became dominant (>1% average relative abundance). During the spring, Blastopirellula, Candidatus Aquiluna, and Cyanobium were dominant genera, while during the summer, Balneola and Cyanobium were dominant. The largest shifts in dominant genera occurred during the fall and winter with Cyanobium, Formosa, MB11C04 marine group, and SAR11 clade Ib becoming dominant in the fall, and Ascidiaceihabitans, Blastopirellula, Formosa, and the OM43 clade being dominant in the winter. Thus, we observed that these bacterial communities have distinct structures and compositional shifts according to season.
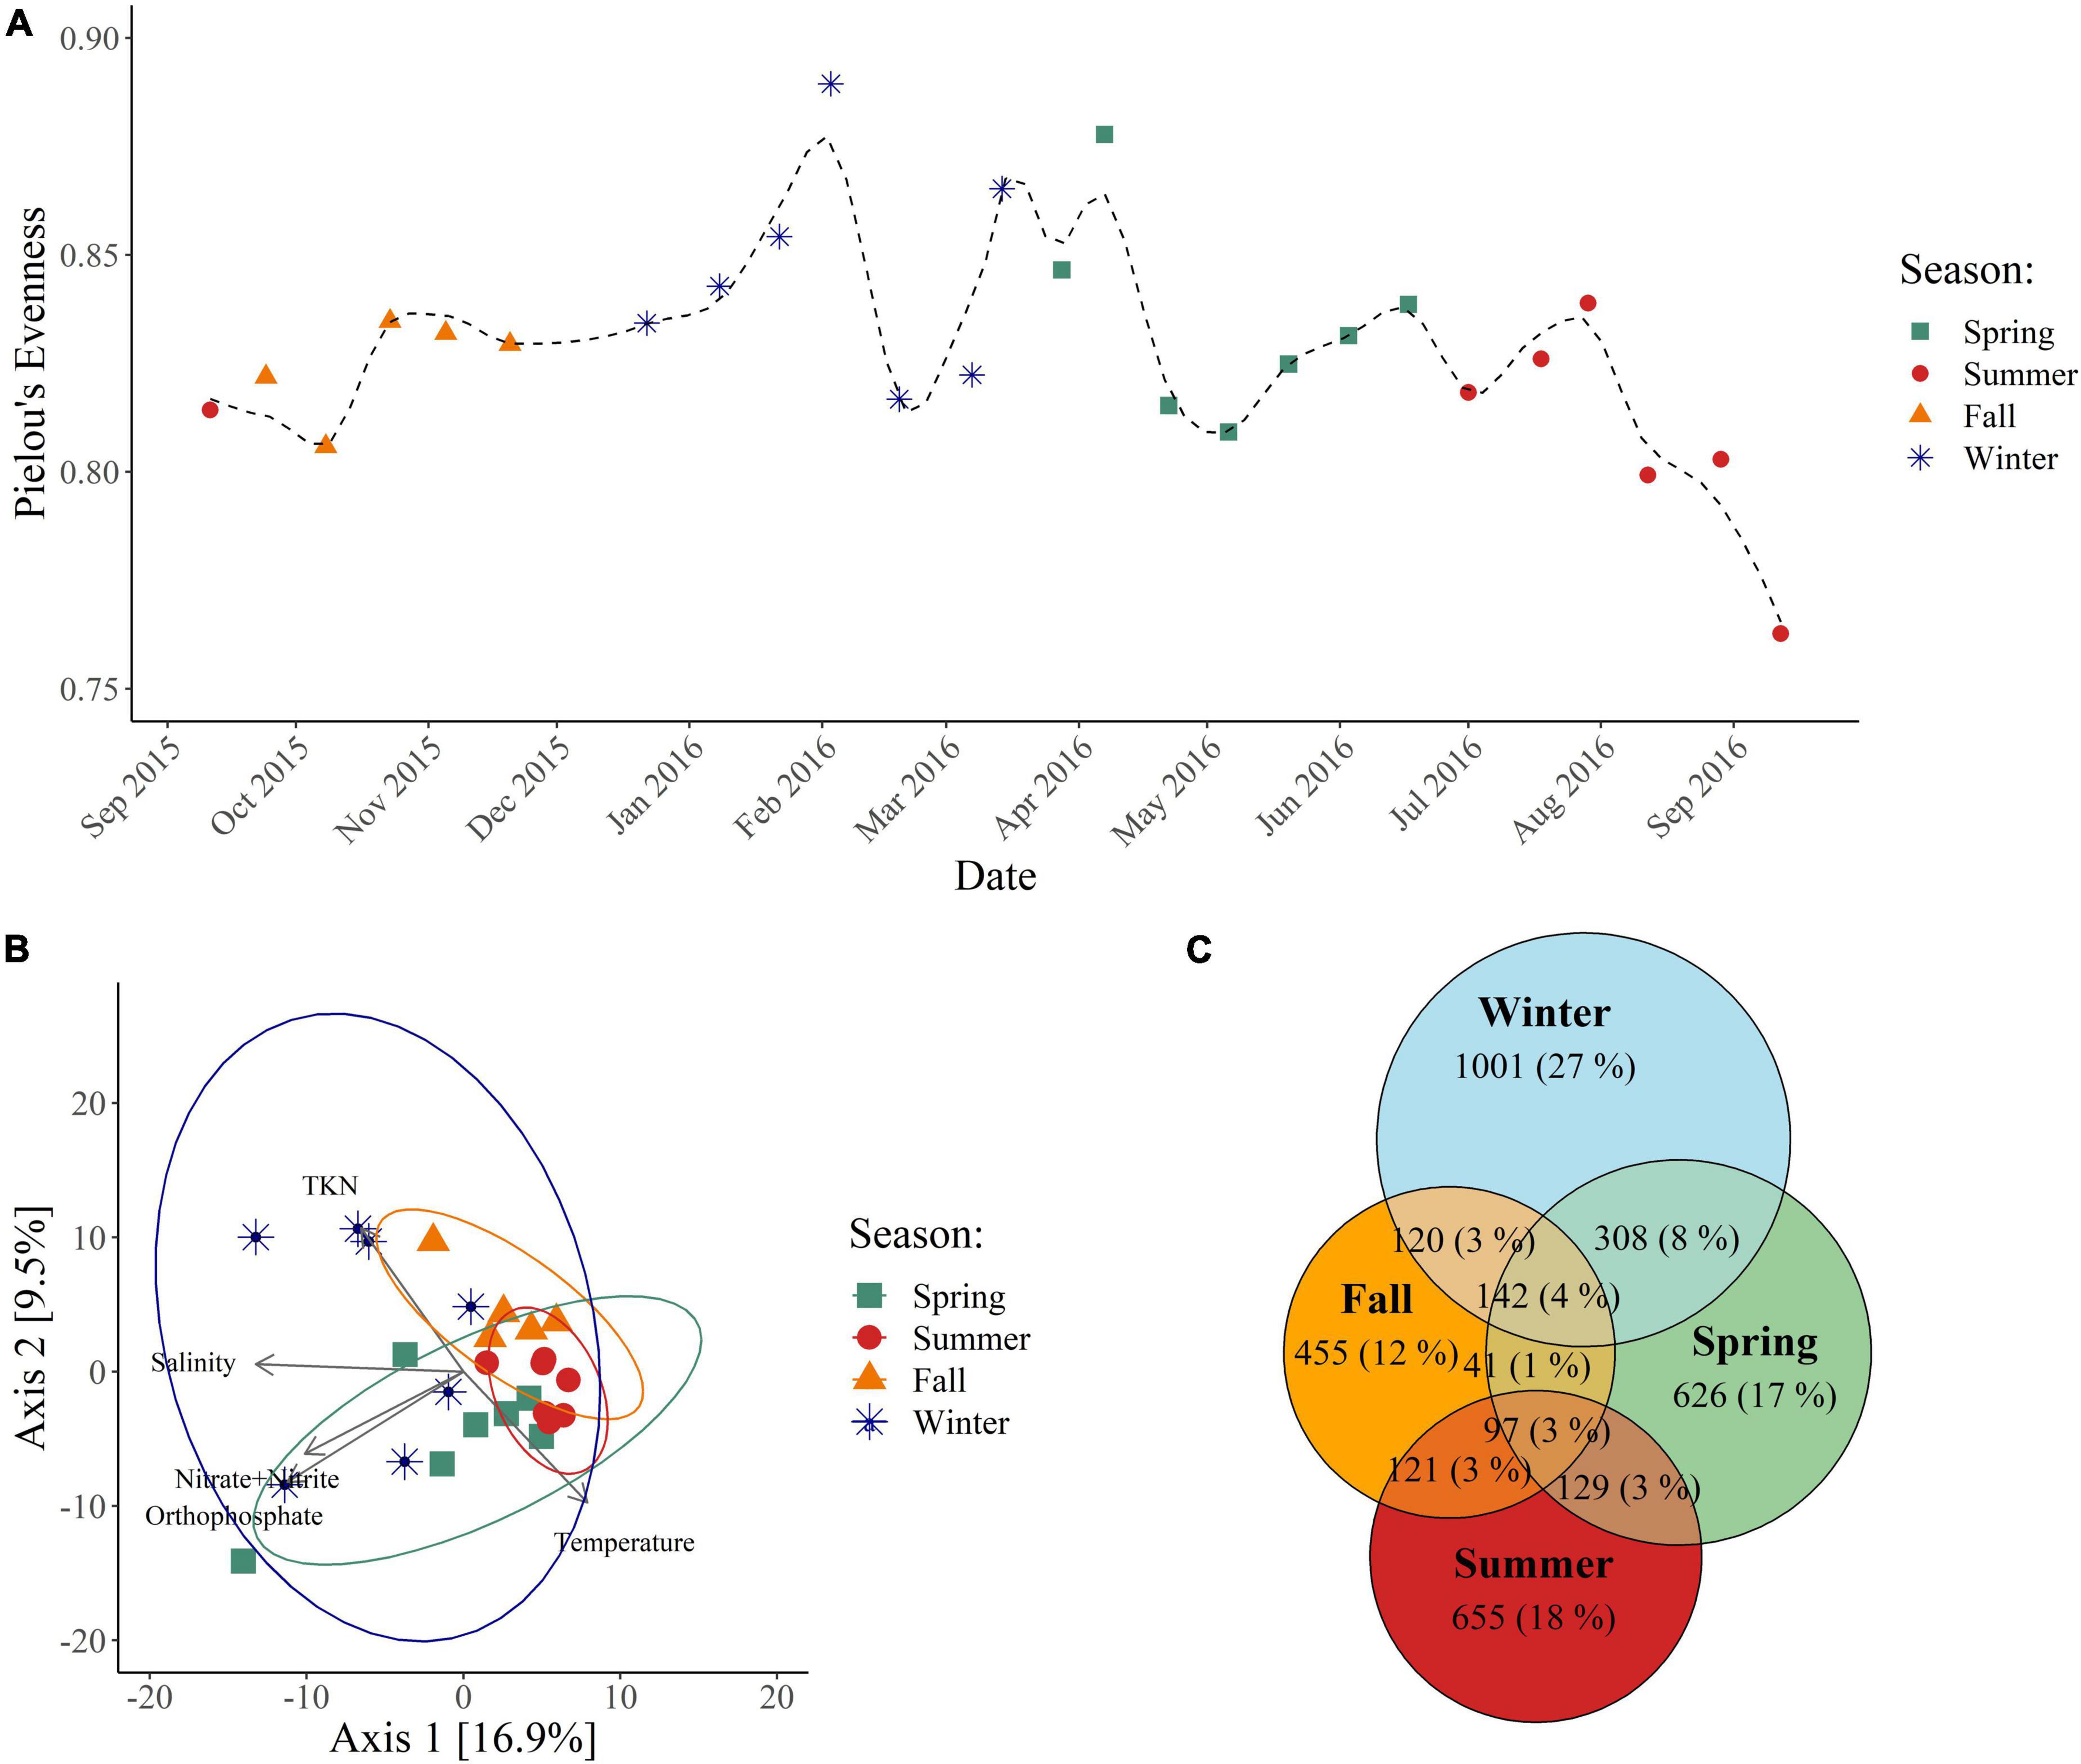
Figure 2. Bacterial alpha-diversity and community structure. (A) Alpha-diversity calculated from the rarefied ASV count table using Pielou’s evenness index. (B) PCA constructed from the variance stabilizing transformed ASV count table. Ellipses represent the 95% confidence interval. (C) Euler diagram constructed from the rarefied ASV count table.
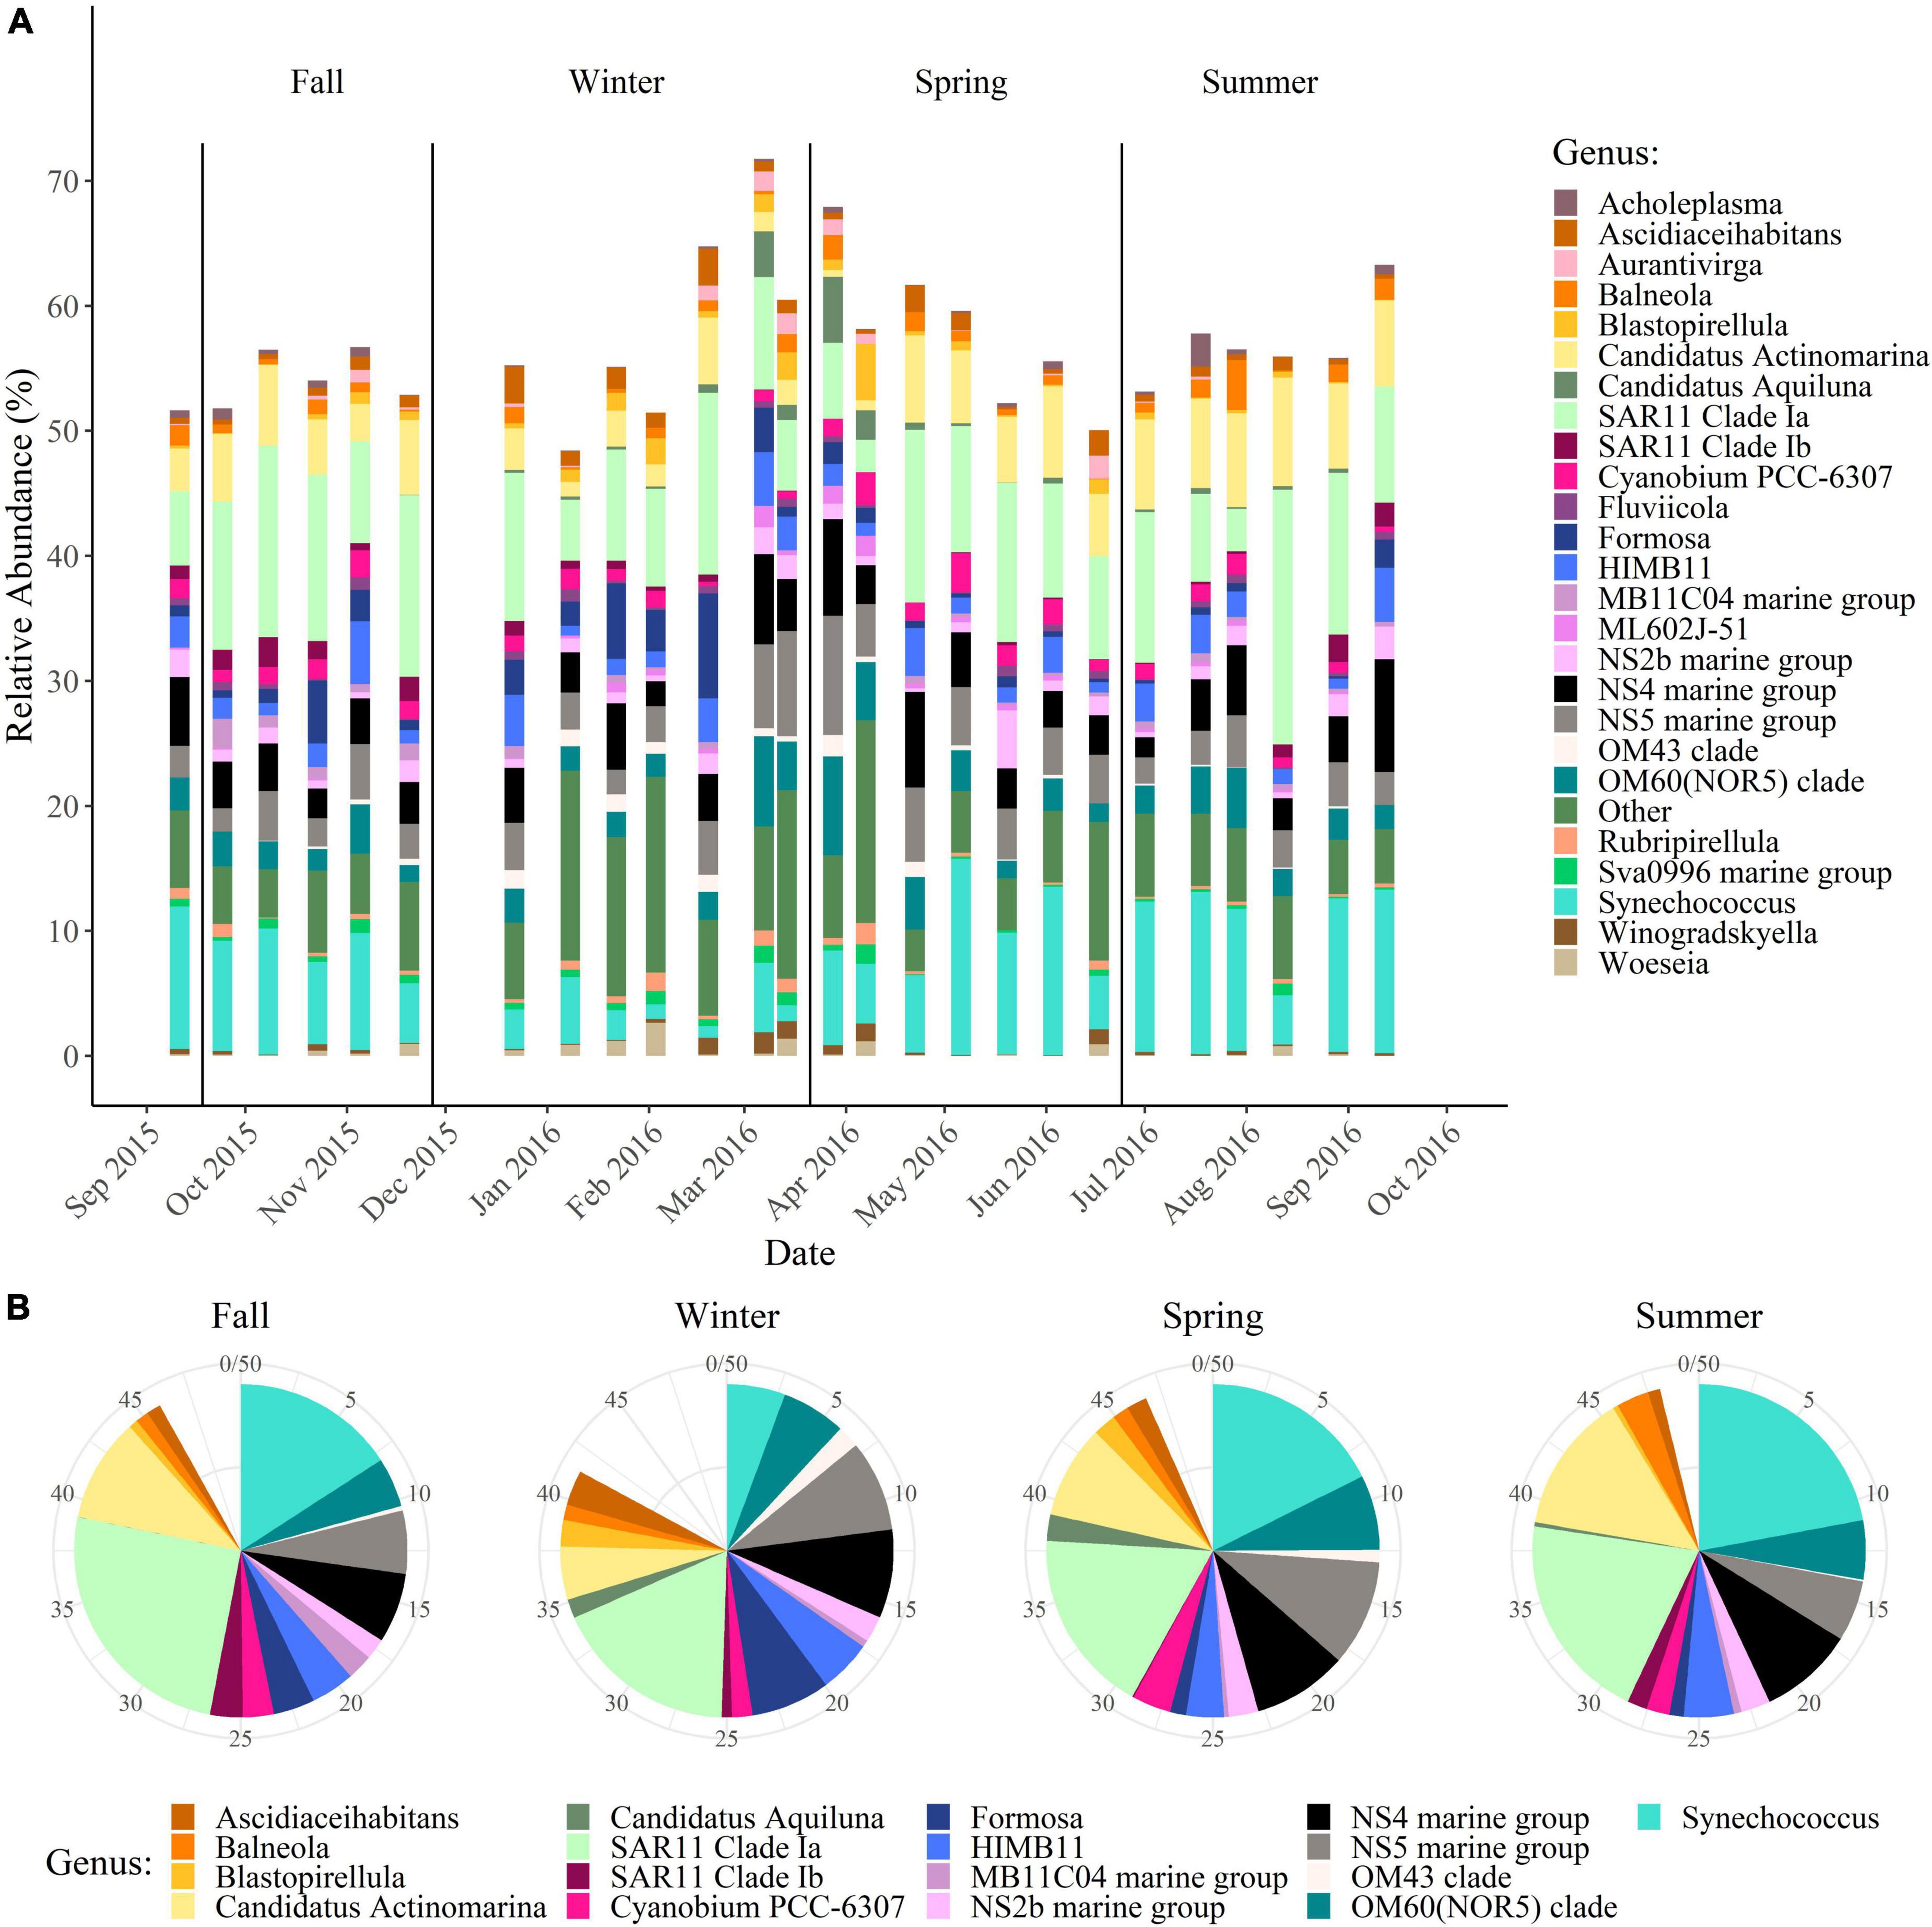
Figure 3. Shifts in the most abundant bacterial genera. Taxonomy was assigned using RDP’s Naïve Bayesian classifier and the SILVA138 reference database. (A) Changes in the top 25 most abundant genera by date. (B) Changes in the dominant genera (>1% average relative abundance) between seasons.
3.3. Inhibition of primary and bacterial production
To determine the temporal effect that exposure to water-soluble crude oil components had on the inhibition of primary and bacterial production, triplicate dose response curves (0, 0.5, 1, 2.5, 5, and 10% WAFs) were generated bi-weekly for 1 year. Exposure to WAFs led to inhibition of primary production across all seasons (Figure 4A). Inhibition of primary production was significantly lower during the winter compared to the spring and summer (p < 0.05) (Figure 4A). Inhibition of primary production exhibited strong negative relationships with chlorophyll a concentrations (p < 0.0001; Adj. R2 = 0.765) (Figure 4B). Additionally, inhibition of primary production had a positive relationship with temperature (p = 0.0002; Adj. R2 = 0.444) (Figure 4C) but no relationship with NO3– + NO2– concentrations (p = 0.08) or with orthophosphate concentrations (p = 0.51). However, inhibition of primary production had a negative relationship with TKN (p = 0.002; Adj. R2 = 0.332) (Figure 4D). These results indicate that water soluble crude oil constituents have the strongest inhibitory effect on primary production when surface coastal waters are warm, when TKN concentrations are low, or when phytoplankton abundance is low.
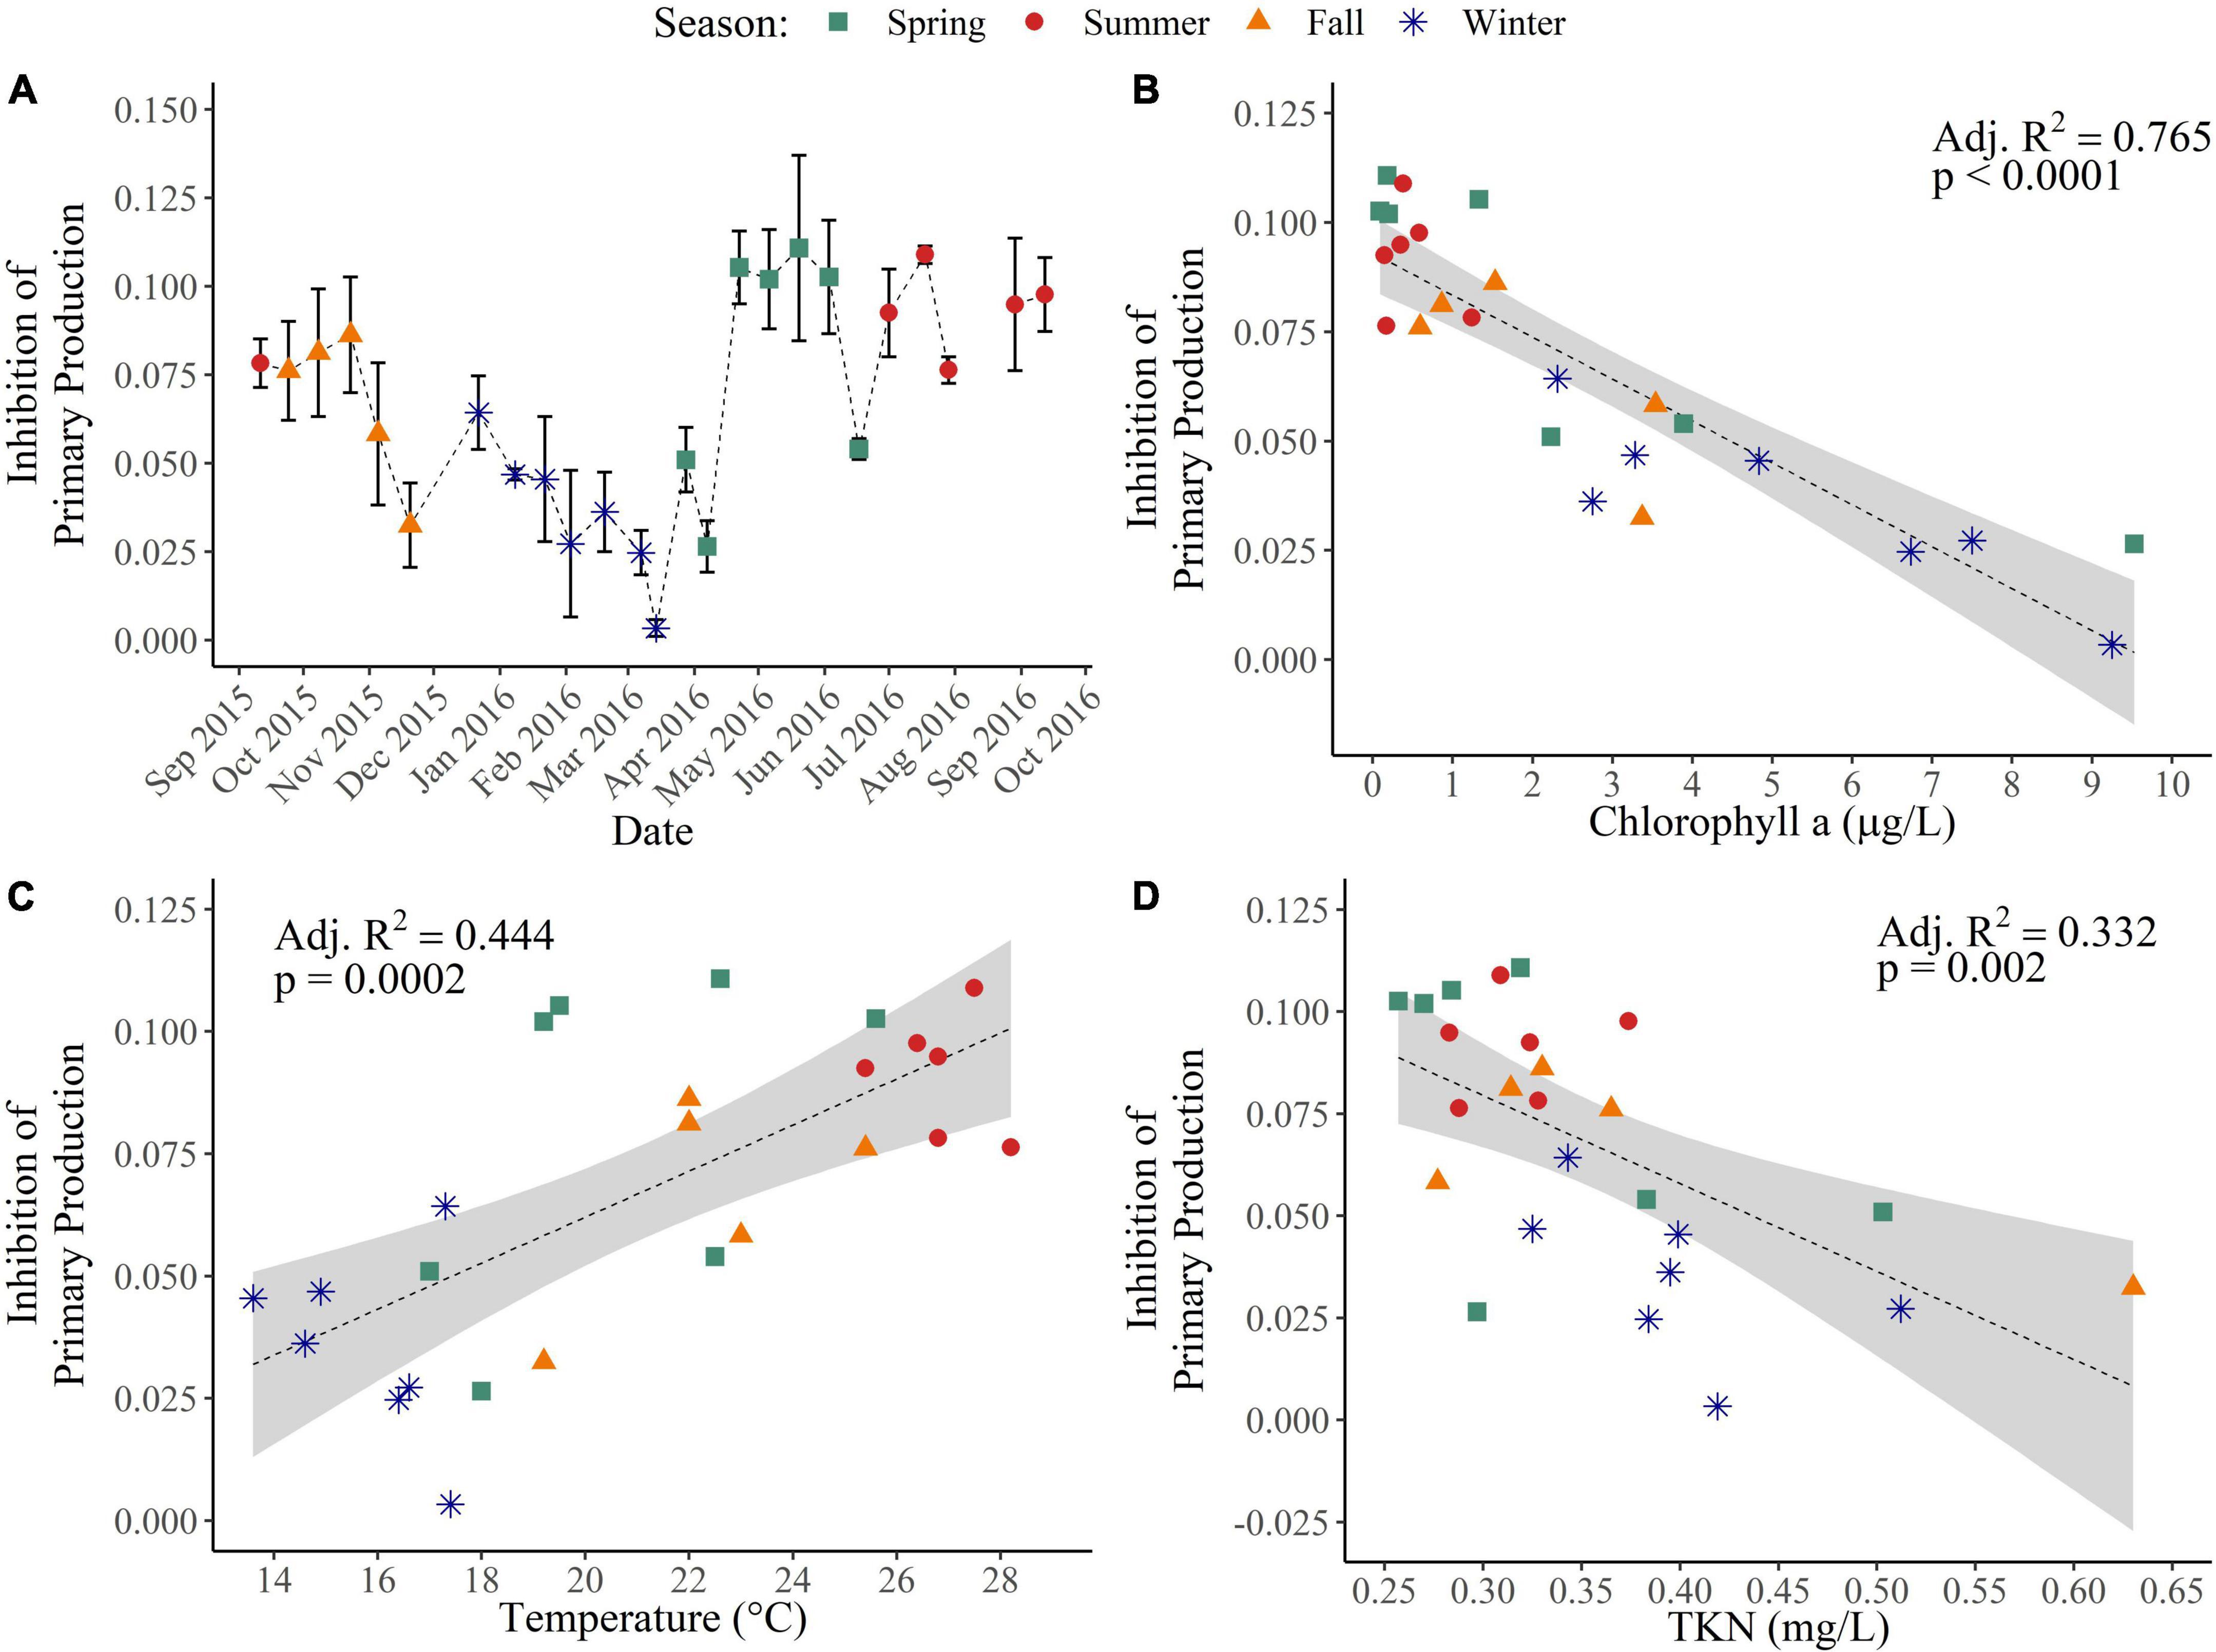
Figure 4. Inhibition of primary production across seasons and environmental drivers. (A) Inhibition of primary production was determined through the fixation of 14C-bicarbonate along triplicate dose response curves of 0, 0.5, 1, 2.5, 5, and 10% WAF treatment. Linear regressions of the inhibition of primary production with (B) chlorophyll a concentrations (μg/L), (C) with temperature (°C), and (D) with total Kjeldahl nitrogen (mg N/L).
Exposure to WAFs also led to inhibition of bacterial production across all seasons. Inhibition of bacterial production was significantly lower during winter compared to all other seasons (p < 0.05) (Figure 5A). There was no relationship of the inhibition of bacterial production with absolute bacterial abundance (p = 0.34), but there were weak, negative relationships of bacterial production inhibition with bacterial alpha-diversity (Shannon index: p = 0.028, Adj. R2 = 0.152; Pielou’s evenness index: p = 0.012, Adj. R2 = 0.205) (Figure 5B). Additionally, there was a weak, positive correlation of bacterial production inhibition with bacterial community structure (p = 0.002; mantel r = 0.28), indicating that the severity of inhibition is partially dependent on the background bacterial community. Although inhibition of bacterial production had no relationship with inorganic nutrient concentrations (NO3– + NO2– and orthophosphate) (p > 0.10), it did have a weak, negative relationship with TKN (p = 0.032; Adj. R2 = 0.143) (Figure 5D) as well as a strong, positive relationship with temperature (p < 0.0001; Adj. R2 = 0.64) (Figure 5C). These results are similar to what was seen for inhibition of primary production and indicate that water soluble crude oil constituents are most inhibitory to bacterial production when temperatures are high, when TKN concentrations are low, or when alpha-diversity is low.
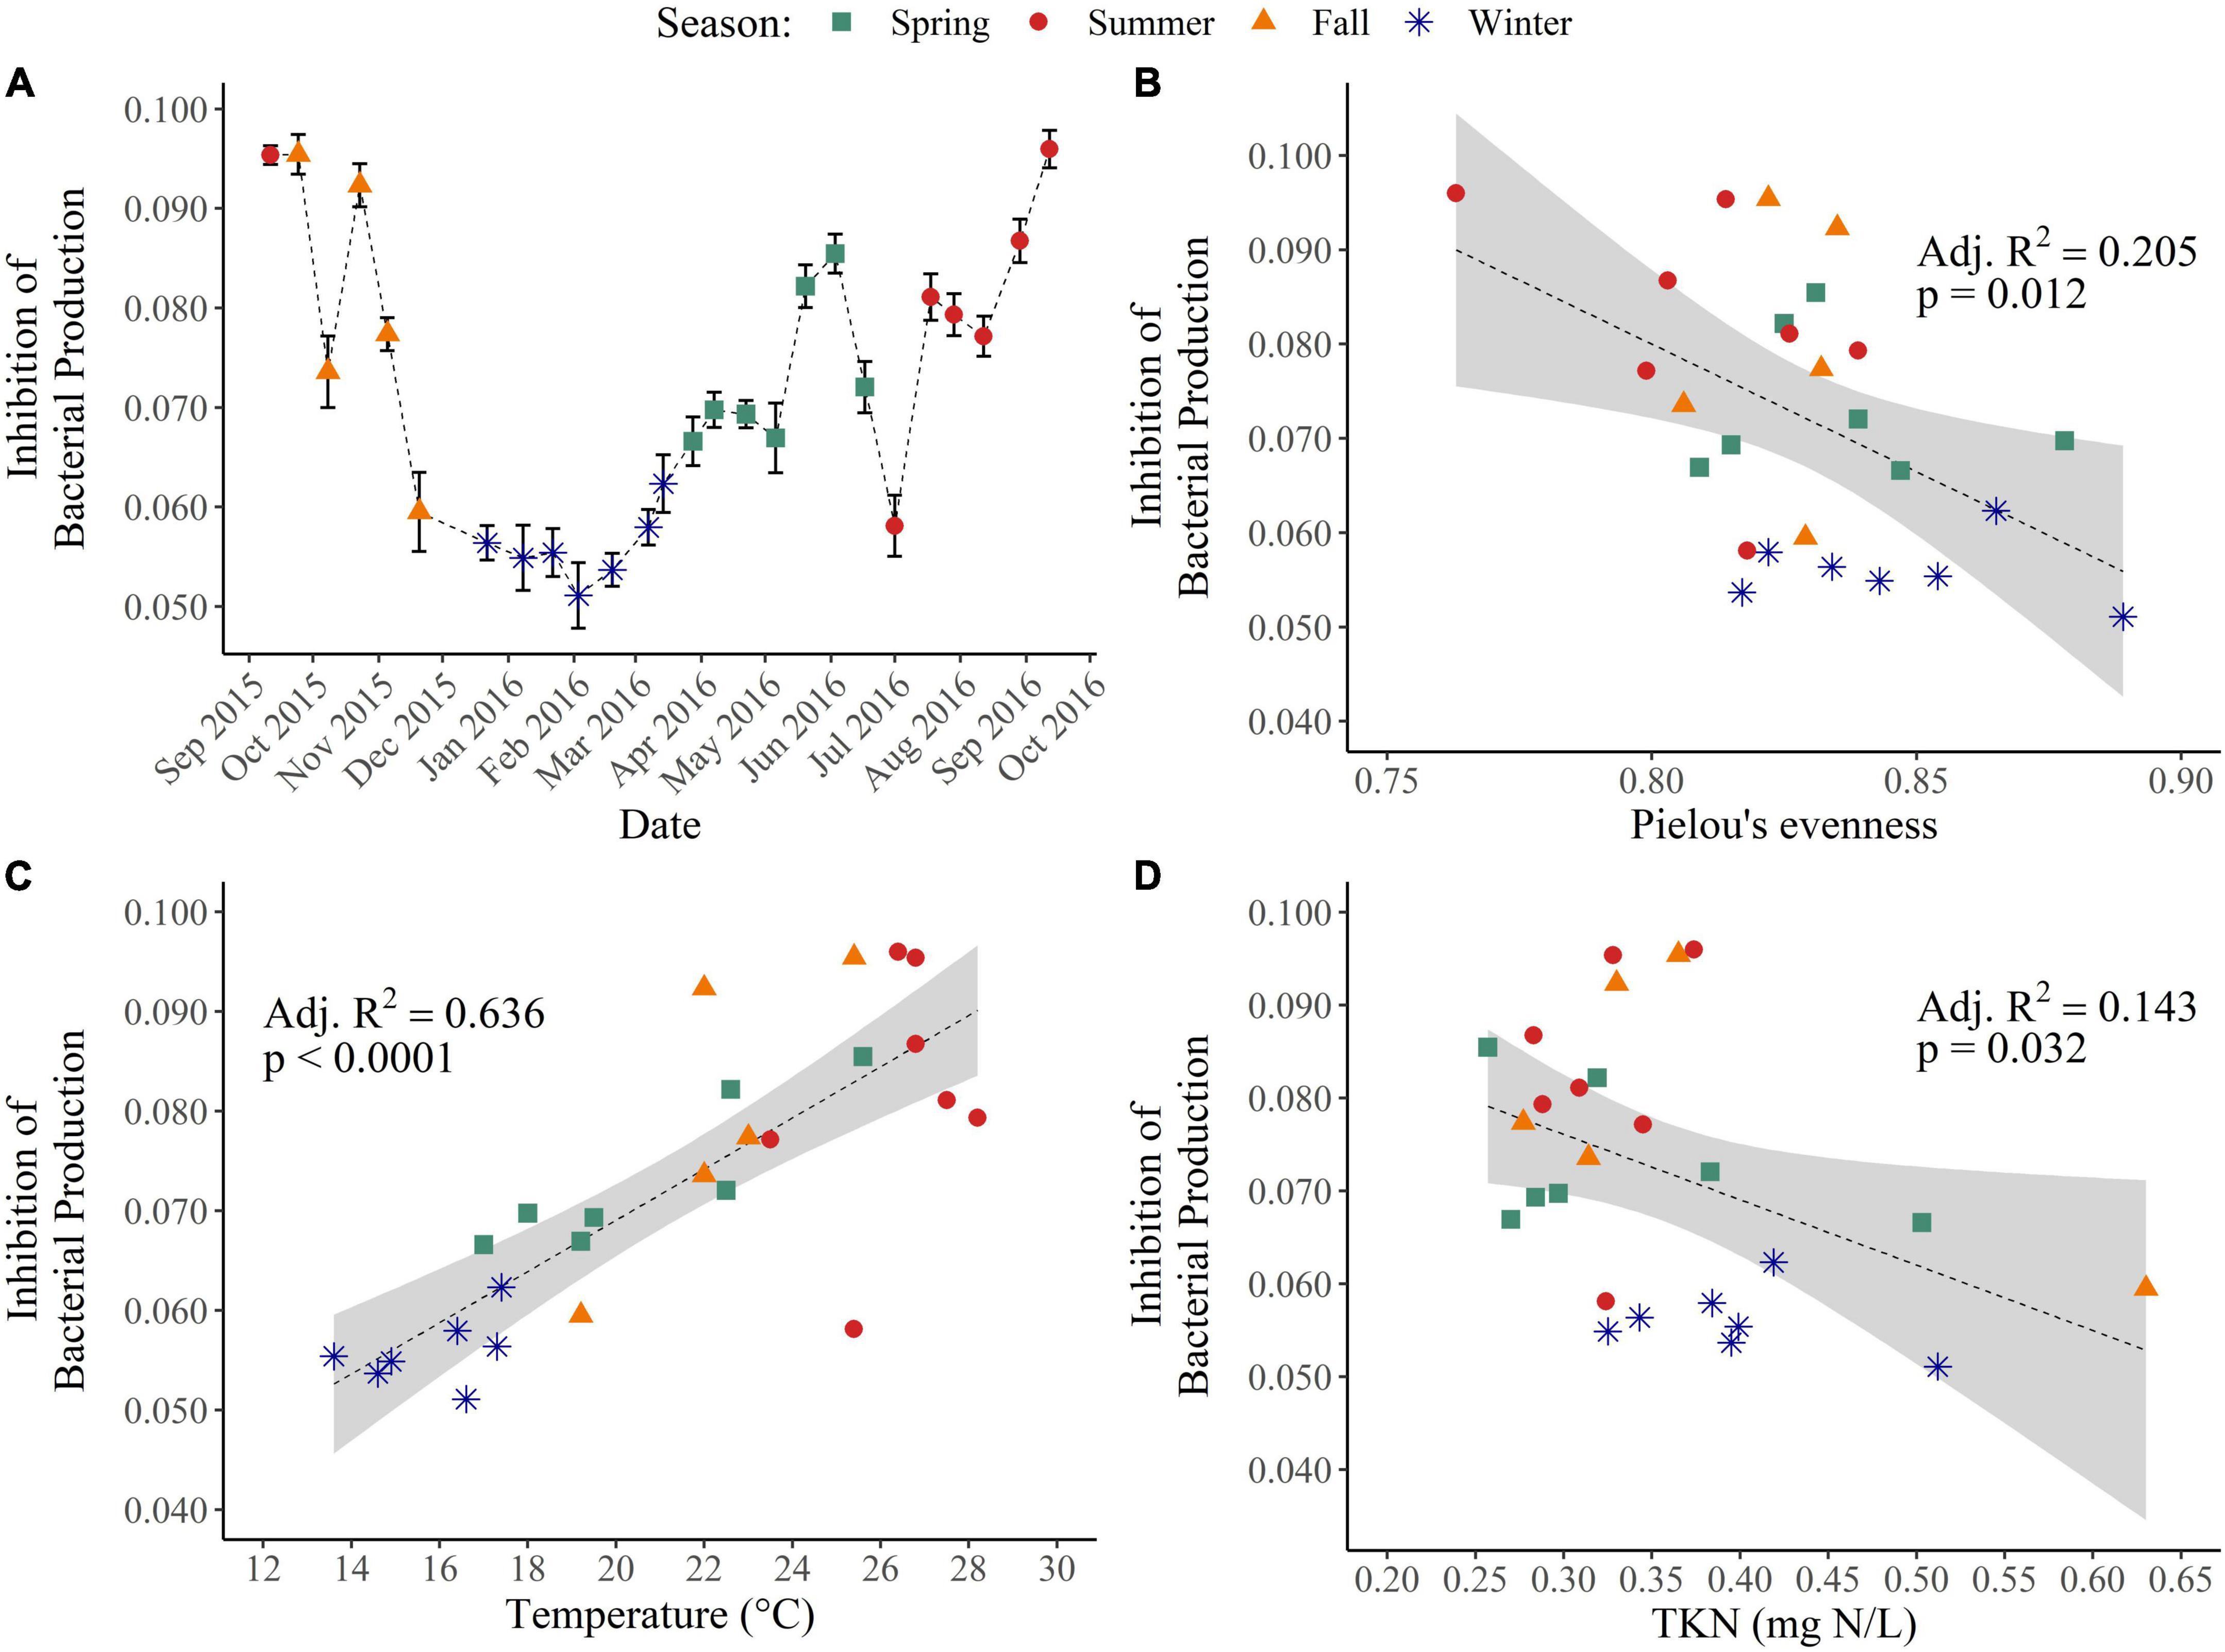
Figure 5. Inhibition of bacterial production across seasons and environmental drivers. (A) Inhibition of bacterial production was determined through the incorporation of 3H-leucine along triplicate dose response curves of 0, 0.5, 1, 2.5, 5, and 10% WAF treatment. Linear regression of the inhibition of bacterial production (B) with alpha-diversity, (C) with temperature (°C), and (D) with total Kjeldahl nitrogen (mg N/L).
Additionally, there were strong relationships between environmental conditions and the bacterial community which corresponded to the degree of bacterial production inhibition. Temperature had a strong positive correlation with PC1 (p < 0.0001, r = 0.756) (Figure 2B), a moderate negative correlation with the Shannon index (p = 0.028, r = −0.431), and a moderate negative correlation with Pielou’s evenness index (p = 0.01, r = −0.498), while TKN had a moderate negative correlation with PC1 (p = 0.025, r = −0.438), a moderate positive correlation with the Shannon index (p = 0.048, r = 0.392), and a moderate positive correlation with ASV richness (p = 0.035, r = 0.415). Also, winter, which was the season with the coldest temperatures, had more unique ASVs compared to warmer seasons (Figure 2C). This demonstrates that changes in temperature strongly corresponded with changes in bacterial community structure and with variability in alpha-diversity through changes in evenness, while TKN had a weaker correspondence with bacterial community structure and with variability in alpha-diversity through changes in richness. Combined, the data showed that lower temperatures corresponded to a bacterial community with more unique ASVs, higher evenness, and less inhibition of bacterial production, while higher concentrations of TKN corresponded to a bacterial community with higher richness and lower inhibition of bacterial production.
These results partially supported our hypothesis that there is a temporal response in inhibition due to acute exposure to water-soluble components of crude oil and that this response would be primarily driven by high temperature and low inorganic nutrient availability. We observed that exposure led to inhibition of primary and bacterial production across all seasons. The impact of exposure was found to be highest during warm months. Interestingly, we did not observe any effects of inorganic nutrient concentrations (NO3– + NO2– and orthophosphate), likely because there was low variability throughout the year. Surprisingly, there was a negative relationship between inhibition and TKN concentrations for both primary and bacterial production. This relationship may suggest links between human inputs of nitrogen, microbial community response, and the inhibition of production due to water soluble crude oil constituents. TKN primarily comes from human inputs and is a composite measurement of organic nitrogen, ammonia, and ammonium. When TKN concentrations increase in coastal waters, some heterotrophs and phytoplankton can use these compounds for their growth. Thus, increases in TKN may alter the community and buffer the impacts of water-soluble crude oil components. This is further supported by the relationships we observed between TKN, microbial community structure, and microbial community diversity. Additionally, we observed that changes in temperature strongly corresponded with changes in the bacterial community which then corresponded to the severity of bacterial production inhibition. For example, we observed that the impact of exposure to WAF was partially dependent on the background phytoplankton and bacterial communities as seen through the positive relationship of primary production inhibition with chlorophyll a concentrations (i.e., phytoplankton abundance), the negative relationship of bacterial production inhibition with alpha-diversity, and the positive relationship of bacterial production inhibition with bacterial community structure. Therefore, it appears that there are tight linkages between environmental factors, the microbial community, and the response to WAF. Combined, these results suggest that changes in environmental factors, such as temperature and TKN, corresponded with changes in the microbial community, which thus resulted in varying degrees of production inhibition when exposed to WAF.
4. Discussion
In this study, we exposed in situ planktonic coastal microbial communities to water-soluble components of crude oil and assessed the temporal response in the inhibition of primary and bacterial production. Temporal variability in inhibition was observed across seasons with temperature having a strong influence on inhibition. Temperature has been hypothesized to be a significant factor in structuring microbial responses to the DWH oil spill (Redmond and Valentine, 2012; Liu and Liu, 2013). Additionally, it has been demonstrated that oil biodegrades more rapidly at higher temperatures (Venosa and Holder, 2007) and that higher temperatures increase oil toxicity to sensitive microbes (Liu et al., 2017). This suggests that the interaction between temperature and oil exposure should most severely impact microbes at high temperatures. Our results quantitatively demonstrate that exposure to the water-soluble components of MC252 surrogate crude oil most severely inhibited production during the warmest months of the year.
We hypothesized that inorganic nutrient concentrations would be a key environmental driver of inhibition under crude oil exposure, but this relationship was not observed. The impact of inorganic nutrient concentrations on microbial communities in oiled environments is variable. Many studies have observed that the addition of inorganic nutrients to oiled polar and subtropical environments increases microbial hydrocarbon degradation rates (Head et al., 2006; Atlas and Hazen, 2011; Sun and Kostka, 2019) as well as increases heterotrophic abundance and biomass (Edwards et al., 2011). However, this response is not observed in nutrient-rich systems. In a Louisiana marsh, nutrient additions had little effect on crude oil biodegradation due to high background pore water ammonium concentrations (Tate et al., 2012), and in temperate estuarine waters, nutrient additions to oiled seawater did not alter microbial community structure as observed in oligotrophic environments (Coulon et al., 2007). In our study, we used in situ coastal Gulf of Mexico waters with no nutrient additions. NO3– + NO2– and orthophosphate concentrations varied minimally throughout the year with a maximum difference of 17.67 μg N/L NO3– + NO2– and 6.65 μg P/L orthophosphate. Therefore, because nutrient concentrations exhibited small fluctuations, they were not a main factor influencing production. Thus, fluctuations in nutrient concentrations may not have a strong influence on microbes in oiled environments that experience small temporal fluctuations in nutrient concentrations or in oiled environments that are nutrient-rich year-round.
In this study, the background bacterial community structure played a role in the severity of inhibition due to oil exposure. A general pattern in bacterial succession is expected after marine oil spills. Accordingly, clear patterns of bacterial succession within the deep-sea hydrocarbon plume of DWH were observed (Dubinsky et al., 2013) which began with a community dominated by Oceanospirillales (Hazen et al., 2010; Redmond and Valentine, 2012) to a community dominated by Colwellia and Cycloclasticus (Valentine et al., 2010; Redmond and Valentine, 2012) and then to a community dominated by methylotrophic bacteria (Kessler et al., 2011). However, less is known about succession in surface water microbial communities and how responses to crude oil contamination varies based on the background microbial community. Our finding that the background bacterial community structure correlated with the severity of inhibition aligns with results from microcosms and incubation experiments. In a microcosm study, microcosms were seeded with surface water from polar, subtropical, and tropical sites (Sun and Kostka, 2019). The source waters each had a distinct initial microbial structure which resulted in different hydrocarbon-degrading microbial communities developing and ultimately resulted in different hydrocarbon degradation rates by site. Additionally, in an incubation experiment using surface waters from the Gulf of Mexico, initial community structure was a key driver in the development of bacterial communities following oil exposure (Liu et al., 2017). Therefore, the background bacterial community may be an important factor in the microbial response to marine oil spills.
Temperature can interact with WAF and the microbial community in a variety of ways that may have influenced production inhibition. Specifically, there are three ways in which temperature could have impacted production inhibition. The first way is that temperature can have a direct effect on WAF composition (Faksness et al., 2008; Bilbao et al., 2022), which could cause variability in production inhibition. However, since the same WAF was used throughout the experiment, we can eliminate this as a possibility. The second way is that temperature can have a direct effect on microbial physiology (Brown et al., 2004). However, to observe these effects, large differences in temperature are typically needed. For example, bacterial growth of planktonic communities from a eutrophic lake was measured at 2, 4, 8, 16, 20, and 30°C (Felip et al., 1996). Bacterial growth was significantly lower at the lowest temperatures of 2, 4, and 8°C compared to higher temperatures of 16, 20, and 30°C, but bacterial growth did not significantly vary within the higher temperature treatments. Additionally, measurements of bacterial production from a 2-year time-series in a temperate estuary showed that bacterial production at temperatures ranging from 10 to 30°C exhibited an upward trend until 25°C but were not statistically distinct (Apple et al., 2006). Our bi-weekly production inhibition experiments were conducted at in situ temperatures, which varied from 13.6 to 28.2°C, and we observed that there was no relationship of bacterial production inhibition with absolute bacterial abundance even though abundance varied throughout the year. The third way is that temperature may exert a strong influence on microbial diversity, resulting in variability in the community level response to WAF exposure. Planktonic microbial communities are influenced by temporal variability in environmental conditions. For example, a 5-year time-series in Ofunato Bay, Japan, found that changes in bacterial communities corresponded with changes in temperature, salinity, and dissolved oxygen (Kobiyama et al., 2021). Additionally, a 2-year time-series in the North Pacific Subtropical Gyre found that changes in alpha-diversity correlated most strongly with average wind speed (Bryant et al., 2016), while a 6-year coastal time-series in the English Channel found that variability in alpha-diversity was best explained by change in day length (Gilbert et al., 2012). Here, we observed that changes in temperature most strongly corresponded with changes in bacterial community structure and with variability in alpha-diversity and that changes in temperature strongly corresponded with changes in production inhibition. Our results therefore suggest that temperature had a strong influence on bacterial diversity and that these changes in the community affected the overall response to WAF exposure.
5. Conclusion
In conclusion, we observed that temperature was a key driver of the inhibition of primary and bacterial production under acute exposure to water-soluble components of MC252 surrogate crude oil. Inorganic nutrient concentrations had no significant effect on the inhibition of primary or bacterial production, perhaps because concentrations varied minimally throughout the year. Additionally, we observed that the background bacterial community structure and diversity correlated with changes in the inhibition of bacterial production, indicating that certain communities are more susceptible to exposure than others. Lastly, we observed that temperature strongly corresponded with changes in the microbial community, providing linkages between environmental conditions, the microbial community, and the community level response to oil exposure. Combined, these observations indicate that there is no universal response to oil spills and that in coastal, surface waters crude oil exposure has the highest inhibitory effect on phytoplankton and bacterial communities during warm months.
Data availability statement
Environmental data collected during this study are available in Supplementary Table 1. Raw data from dose response curves, example calculations for determining production inhibition from the raw data, QIIME2 artifacts, and R code are available on GitHub at https://github.com/melissa-brock/temporal-response-oil-exposure. The 16S rRNA sequences generated for this study can be found in the NCBI Sequence Read Archive under BioProject: PRJNA894536.
Author contributions
MB performed the laboratory experiments, conducted the bioinformatics and statistical analysis, generated the figures, and wrote the manuscript. RR performed the laboratory experiments. ME-H performed the laboratory experiments and oversaw the sample analysis. LN extracted the DNA, conducted the bioinformatics analysis, and edited the manuscript. RS contributed to conceptualization and edited the manuscript. WJ conceptualized the project, developed the experimental methodology, acquired the funding, and edited the manuscript. All authors contributed to the article and approved the submitted version.
Funding
This research was made possible in part by a grant from BP/The Gulf of Mexico Research Initiative as part of the C-IMAGE II Consortium and the University of West Florida Office of Undergraduate Research.
Acknowledgments
We thank Jane Caffrey, Elba de la Torre, Nine Henriksson, Gary Baine, Sigrid Solgard, Claire Quina, Emily Marshall, and Adelyn Benz for their contributions to this work. We thank Brandi Kiel Reese of the Dauphin Island Sea Lab for carbon analysis of WAFs.
Conflict of interest
The authors declare that the research was conducted in the absence of any commercial or financial relationships that could be construed as a potential conflict of interest.
Publisher’s note
All claims expressed in this article are solely those of the authors and do not necessarily represent those of their affiliated organizations, or those of the publisher, the editors and the reviewers. Any product that may be evaluated in this article, or claim that may be made by its manufacturer, is not guaranteed or endorsed by the publisher.
Supplementary material
The Supplementary Material for this article can be found online at: https://www.frontiersin.org/articles/10.3389/fevo.2023.1096880/full#supplementary-material
Footnotes
- ^ https://github.com/melissa-brock/temporal-response-oil-exposure/tree/main/Production%20Inhibition
- ^ https://github.com/melissa-brock/temporal-response-oil-exposure/tree/main/QIIME2%20artifacts
- ^ https://github.com/melissa-brock/temporal-response-oil-exposure/tree/main/R%20Code
References
Abbriano, R. M., Carranza, M. M., Hogle, S. L., Levin, R. A., Netburn, A. N., Seto, K. L., et al. (2011). Deepwater Horizon oil spill: A review of the planktonic response. Oceanography 24, 294–301. doi: 10.5670/oceanog.2011.80
Apple, J., del Giorgio, P., and Kemp, W. (2006). Temperature regulation of bacterial production, respiration, and growth efficiency in a temperate salt-marsh estuary. Aquat. Microb. Ecol. 43, 243–254. doi: 10.3354/ame043243
Aronesty, E. (2013). Comparison of sequencing utility programs. Open Bioinform. J. 7, 1–8. doi: 10.2174/1875036201307010001
Atlas, R. M., and Bartha, R. (1972). Degradation and mineralization of petroleum in sea water: Limitation by nitrogen and phosphorous. Biotechnol. Bioeng. 14, 309–318. doi: 10.1002/bit.260140304
Atlas, R. M., and Hazen, T. C. (2011). Oil biodegradation and bioremediation: A tale of the two worst spills in U.S. history. Environ. Sci. Technol. 45, 6709–6715.
Baselga, A., Orme, D., Villeger, S., De Bortoli, J., Leprieur, F., and Logez, M. (2022). Betapart: partitioning beta diversity into turnover and nestedness components. R package version 1.5.6. Available online at: https://CRAN.R-project.org/package=betapart
Beyer, J., Trannum, H. C., Bakke, T., Hodson, P. V., and Collier, T. K. (2016). Environmental effects of the Deepwater Horizon oil spill: A review. Mar. Pollut. Bull. 110, 28–51. doi: 10.1016/j.marpolbul.2016.06.027
Bik, H. M., Halanych, K. M., Sharma, J., and Thomas, W. K. (2012). Dramatic shifts in benthic microbial eukaryote communities following the Deepwater Horizon oil spill. PLoS One 7:e38550. doi: 10.1371/journal.pone.0038550
Bilbao, D., De Miguel-Jiménez, L., Igartua, A., Olivares, M., Izagirre, U., Prieto, A., et al. (2022). Chemical characterization of oil and water accommodated fraction (WAF) at different temperatures. Results Eng. 14:100433. doi: 10.1016/j.rineng.2022.100433
Bolyen, E., Rideout, J. R., Dillon, M. R., Bokulich, N., Abnet, C., and Al-Ghalith, G. (2019). Reproducible, interactive, scalable and extensible microbiome data science using QIIME 2. Nat. Biotechnol. 37, 852–857. doi: 10.1038/s41587-019-0209-9
Brown, J. H., Gillooly, J. F., Allen, A. P., Savage, V. M., and West, G. B. (2004). Toward a metabolic theory of ecology. Ecology 85, 1771–1789. doi: 10.1890/03-9000
Bryant, J. A., Aylward, F. O., Eppley, J. M., Karl, D. M., Church, M. J., and DeLong, E. F. (2016). Wind and sunlight shape microbial diversity in surface waters of the North Pacific Subtropical Gyre. ISME J. 10, 1308–1322. doi: 10.1038/ismej.2015.221
Callahan, B. J., McMurdie, P. J., Rosen, M. J., Han, A. W., Johnson, A. J. A., and Holmes, S. P. (2016). DADA2: High-resolution sample inference from Illumina amplicon data. Nat. Methods 13, 581–583. doi: 10.1038/nmeth.3869
Coulon, F., McKew, B. A., Osborn, A. M., McGenity, T. J., and Timmis, K. N. (2007). Effects of temperature and biostimulation on oil-degrading microbial communities in temperate estuarine waters. Environ. Microbiol. 9, 177–186. doi: 10.1111/j.1462-2920.2006.01126.x
Doyle, S. M., Whitaker, E. A., De Pascuale, V., Wade, T. L., Knap, A. H., Santschi, P. H., et al. (2018). Rapid formation of microbe-oil aggregates and changes in community composition in coastal surface water following exposure to oil and the dispersant Corexit. Front. Microbiol. 9:689. doi: 10.3389/fmicb.2018.00689
Dubinsky, E., Conrad, M., Chakraborty, R., Bill, M., Borglin, S., Hollibaugh, J., et al. (2013). Succession of hydrocarbon-degrading bacteria in the aftermath of the Deepwater Horizon oil spill in the Gulf of Mexico. Environ. Sci. Technol. 47, 10860–10867. doi: 10.1021/es401676y
Edgar, R. C. (2010). Search and clustering orders of magnitude faster than BLAST. Bioinformatics 26, 2460–2461. doi: 10.1093/bioinformatics/btq461
Edwards, B. R., Reddy, C. M., Camilli, R., Carmichael, C. A., Longnecker, K., and Van Mooy, B. A. S. (2011). Rapid microbial respiration of oil from the Deepwater Horizon spill in offshore surface waters of the Gulf of Mexico. Environ. Res. Lett. 6:035301. doi: 10.1088/1748-9326/6/3/035301
EPA standard method 350.1. (1993). “Determination of ammonia nitrogen by semi-automated colorimetry. Revision 2.0,” in Selected analytical methods for environmental remediation and recovery (SAM).
EPA standard method 351.2. (1993). “Determination of total kjeldahl nitrogen by semi-automated colorimetry. Revision 2.0,” in Methods for the chemical analysis of water and wastes, (MCAWW) (EPA/600/4-79/020).
EPA standard method 353.2. (1993). “Determination of nitrate-nitrite nitrogen by automated colorimetry. Revision 2.0,” in Methods for the determination of inorganic substances in environmental samples, (EPA/600/R-93/100).
EPA standard method 365.4. (1974). “Phosphorus, total (colorimetric, automated, block digestor AA II),” in Methods for the chemical analysis of water and wastes, (MCAWW) (EPA/600/4-79/020).
Faksness, L.-G., Brandvik, P. J., and Sydnes, L. K. (2008). Composition of the water accommodated fractions as a function of exposure times and temperatures. Mar. Pollut. Bull. 56, 1746–1754. doi: 10.1016/j.marpolbul.2008.07.001
Farrington, J. W., Overton, E. B., and Passow, U. (2021). Biogeochemical processes affecting the fate of discharged Deepwater Horizon gas and oil new insights and remaining gaps in our understanding. Oceanography 34, 76–97.
Felip, M., Pace, M. L., and Cole, J. J. (1996). Regulation of planktonic bacterial growth rates: The effects of temperature and resources. Microb. Ecol. 31, 15–28. doi: 10.1007/BF00175072
Gilbert, J. A., Steele, J. A., Caporaso, J. G., Steinbrück, L., Reeder, J., and Temperton, B. (2012). Defining seasonal marine microbial community dynamics. ISME J. 6, 298–308. doi: 10.1038/ismej.2011.107
Harrison, P. J., Cochlan, W. P., Acreman, J. C., Parsons, T. R., Thompson, P. A., Dovey, H. M., et al. (1986). The effects of crude oil and Corexit 9527 on marine phytoplankton in an experimental enclosure. Mar. Environ. Res. 18, 93–109. doi: 10.1016/0141-1136(86)90002-4
Hazen, T. C., Dubinsky, E. A., DeSantis, T. Z., Andersen, G., Piceno, Y., Singh, N., et al. (2010). Deep-sea oil plume enriches indigenous oil-degrading bacteria. Science 330, 204–208. doi: 10.1126/science.1195979
Hazen, T. C., Prince, R. C., and Mahmoudi, N. (2016). Marine oil biodegradation. Environ. Sci. Technol. 50, 2121–2129. doi: 10.1021/acs.est.5b03333
Head, I. M., Jones, D. M., and Röling, W. F. M. (2006). Marine microorganisms make a meal of oil. Nat. Rev. Microbiol. 4, 173–182. doi: 10.1038/nrmicro1348
Hervé, M. (2020). RVAideMemoire: Testing and plotting procedures for biostatistics. R package version 0.9-81-2. Available online at: https://CRAN.R-project.org/package=RVAideMemoire
Huettel, M., Overholt, W. A., Kostka, J. E., Hagan, C., Kaba, J., Wells, W. B., et al. (2018). Degradation of Deepwater Horizon oil buried in a Florida beach influenced by tidal pumping. Mar. Pollut. Bull. 126, 488–500. doi: 10.1016/j.marpolbul.2017.10.061
Joye, S. B., Teske, A. P., and Kostka, J. E. (2014). Microbial dynamics following the Macondo oil well blowout across Gulf of Mexico environments. Bioscience 64, 766–777. doi: 10.1093/biosci/biu121
Kamalanathan, M., Schwehr, K. A., Labonté, J. M., Taylor, C., Bergen, C., Patterson, N., et al. (2021). The interplay of phototrophic and heterotrophic microbes under oil exposure: A microcosm study. Front. Microbiol. 12:675328. doi: 10.3389/fmicb.2021.675328
Kessler, J. D., Valentine, D. L., Redmond, M. C., Du, M., Chan, E., Mendes, S., et al. (2011). A persistent oxygen anomaly reveals the fate of spilled methane in the deep Gulf of Mexico. Science 331, 312–315. doi: 10.1126/science.1199697
King, G. M., Kostka, J. E., Hazen, T. C., and Sobecky, P. A. (2015). Microbial responses to the Deepwater Horizon oil spill: From coastal wetlands to the deep sea. Ann. Rev. Mar. Sci. 7, 377–401. doi: 10.1146/annurev-marine-010814-015543
Kobiyama, A., Rashid, J., Reza, M. S., Ikeda, Y., Yamada, Y., Kudo, T., et al. (2021). Seasonal and annual changes in the microbial communities of Ofunato Bay, Japan, based on metagenomics. Sci. Rep. 11:17277. doi: 10.1038/s41598-021-96641-9
Kopp, J. F. (1979). Methods for chemical analysis of water and wastes. 1978. Cincinnati, OH: Environmental Monitoring and Support Laboratory, Office of Research and Development, US Environmental Protection Agency.
Kostka, J. E., Prakash, O., Overholt, W. A., Green, S., Freyer, G., Canion, A., et al. (2011). Hydrocarbon-degrading bacteria and the bacterial community response in Gulf of Mexico beach sands impacted by the Deepwater Horizon oil spill. Appl. Environ. Microbiol. 77, 7962–7974. doi: 10.1128/AEM.05402-11
Liu, J., Bacosa, H. P., and Liu, Z. (2017). Potential environmental factors affecting oil-degrading bacterial populations in deep and surface waters of the northern Gulf of Mexico. Front. Microbiol. 7:2131. doi: 10.3389/fmicb.2016.02131
Liu, Z., and Liu, J. (2013). Evaluating bacterial community structures in oil collected from the sea surface and sediment in the northern Gulf of Mexico after the Deepwater Horizon oil spill. Microbiologyopen 2, 492–504. doi: 10.1002/mbo3.89
Love, M. I., Huber, W., and Anders, S. (2014). Moderated estimation of fold change and dispersion for RNA-seq data with DESeq2. Genome Biol. 15:550. doi: 10.1186/s13059-014-0550-8
Martin, M. (2011). Cutadapt removes adapter sequences from high-throughput sequencing reads. EMBnet J. 17:10. doi: 10.14806/ej.17.1.200
Matrai, P. A., Vernet, M., Hood, R., Jennings, A., Brody, E., and Saemundsdóttir, S. (1995). Light-dependence of carbon and sulfur production by polar clones of the genus Phaeocystis. Mar. Biol. 124, 157–167. doi: 10.1007/BF00349157
McMurdie, P. J., and Holmes, S. (2013). phyloseq: An R package for reproducible interactive analysis and graphics of microbiome census data M. Watson [ed.]. PLoS One 8:e61217. doi: 10.1371/journal.pone.0061217
McNutt, M. K., Camilli, R., Crone, T. J., Guthrie, G. D., Hsieh, P. A., Ryerson, T. B., et al. (2012). Review of flow rate estimates of the Deepwater Horizon oil spill. Proc. Natl. Acad. Sci. U.S.A. 109, 20260–20267. doi: 10.1073/pnas.1112139108
Mendelssohn, I. A., Andersen, G. L., Baltz, D. M., Caffey, R., Carman, K., Fleeger, J., et al. (2012). Oil impacts on coastal wetlands: Implications for the Mississippi River Delta ecosystem after the Deepwater Horizon oil spill. Bioscience 62, 562–574. doi: 10.1525/bio.2012.62.6.7
Michel, J., Owens, E. H., Zengel, S., Graham, A., Nixon, Z., Allard, T., et al. (2013). Extent and degree of shoreline oiling: Deepwater Horizon oil spill, Gulf of Mexico, USA. PLoS One 8:e65087. doi: 10.1371/journal.pone.0065087
Needham, D. M., and Fuhrman, J. A. (2016). Pronounced daily succession of phytoplankton, archaea and bacteria following a spring bloom. Nat. Microbiol. 1:16005. doi: 10.1038/nmicrobiol.2016.5
Oksanen, J., Simpson, G., Blanchet, F., Kindt, R., Legendre, P., Minchin, P., et al. (2022). Vegan: community ecology package. R package version 2.6-4. Available online at: https://CRAN.R-project.org/package=vegan
Parsons, M. L., Morrison, W., Rabalais, N. N., Turner, R. E., and Tyre, K. N. (2015). Phytoplankton and the Macondo oil spill: A comparison of the 2010 phytoplankton assemblage to baseline conditions on the Louisiana shelf. Environ. Pollut. 207, 152–160. doi: 10.1016/j.envpol.2015.09.019
Pelz, O., Brown, J., Huddleston, M., Rand, G., Gardinali, P., Stubblefield, W., et al. (2011). “Selection of a surrogate MC252 oil as a reference material for future aquatic toxicity tests and other studies,” in Proceedings of the SETAC 2011 meeting, Boston, MA.
Porter, K. G., and Feig, Y. S. (1980). The use of DAPI for identifying and counting aquatic microflora. Limnol. Oceanogr. 25, 943–948. doi: 10.4319/lo.1980.25.5.0943
Quast, C., Pruesse, E., Yilmaz, P., Gerken, J., Schweer, T., Yarza, P., et al. (2012). The SILVA ribosomal RNA gene database project: Improved data processing and web-based tools. Nucleic Acids Res. 41, D590–D596. doi: 10.1093/nar/gks1219
R Core Team (2018). R: A language and environment for statistical computing. Vienna: R Foundation for Statistical Computing.
Ramseur, J. L., and Resources, Science, and Industry Division (2017). Oil spills: background and governance (United States environmental protection agency). Washington, DC: Library of Congress, Congressional Research Service.
Redmond, M. C., and Valentine, D. L. (2012). Natural gas and temperature structured a microbial community response to the Deepwater Horizon oil spill. Proc. Natl. Acad. Sci. U.S.A. 109, 20292–20297. doi: 10.1073/pnas.1108756108
Russel, J. (2021). MicEco: Various functions for microbial community data. San Francisco, CA: GitHub.
Smith, D. C., and Azam, F. (1992). A simple, economical method for measuring bacterial protein synthesis rates in seawater using 3H-leucine. Mar. Microb. Food Webs. 6, 107–114.
standard method 5310 (2018). Standard methods for the examination of water and wastewater, eds W. Lipps, T. Baxter, and E. Braun-Howland (Washington, DC: APHA Press).
Sun, X., and Kostka, J. E. (2019). Hydrocarbon-degrading microbial communities are site specific, and their activity is limited by synergies in temperature and nutrient availability in surface ocean waters. Appl. Environ. Microbiol. 85, e00443–19. doi: 10.1128/AEM.00443-19
Tate, P. T., Shin, W. S., Pardue, J. H., and Jackson, W. A. (2012). Bioremediation of an experimental oil spill in a coastal Louisiana salt marsh. Water Air Soil Pollut. 223, 1115–1123. doi: 10.1007/s11270-011-0929-z
Valentine, D. L., Kessler, J. D., Redmond, M. C., Mendes, S., Heintz, M., Farwell, C., et al. (2010). Propane respiration jump-starts microbial response to a deep oil spill. Science 330, 208–211. doi: 10.1126/science.1196830
Vaughan, P. P., Wilson, T., Kamerman, R., Hagy, M. E., McKenna, A., Chen, H., et al. (2016). Photochemical changes in water accommodated fractions of MC252 and surrogate oil created during solar exposure as determined by FT-ICR MS. Mar. Pollut. Bull. 104, 262–268. doi: 10.1016/j.marpolbul.2016.01.012
Venosa, A. D., and Holder, E. L. (2007). Biodegradability of dispersed crude oil at two different temperatures. Mar. Pollut. Bull. 54, 545–553. doi: 10.1016/j.marpolbul.2006.12.013
Wang, Q., Garrity, G. M., Tiedje, J. M., and Cole, J. R. (2007). Naïve Bayesian classifier for rapid assignment of rRNA sequences into the new bacterial taxonomy. Appl. Environ. Microbiol. 73, 5261–5267. doi: 10.1128/AEM.00062-07
Welschmeyer, N. A. (1994). Fluorometric analysis of chlorophyll a in the presence of chlorophyll b and pheopigments. Limnol. Oceanogr. 39, 1985–1992. doi: 10.4319/lo.1994.39.8.1985
Wiesenburg, D., Shipp, B., Fodrie, J., Powers, S., Lartigue, J., Darnell, K. M., et al. (2021). Prospects for gulf of mexico environmental recovery and restoration. Oceanography 34, 164–173. doi: 10.5670/oceanog.2021.124
Wright, A. L., Weaver, R. W., and Webb, J. W. (1997). Oil bioremediation in salt marsh mesocosms as influenced by N and P fertilization, flooding, and season. Water. Air. Soil Pollut. 95, 179–191. doi: 10.1007/BF02406164
Keywords: oil spill, coastal environment, marine microbes, temporal response, primary production, secondary production
Citation: Brock ML, Richardson R, Ederington-Hagy M, Nigro L, Snyder RA and Jeffrey WH (2023) Temporal variability of microbial response to crude oil exposure in the northern Gulf of Mexico. Front. Ecol. Evol. 11:1096880. doi: 10.3389/fevo.2023.1096880
Received: 12 November 2022; Accepted: 23 January 2023;
Published: 13 February 2023.
Edited by:
Marcus W. Beck, Tampa Bay Estuary Program, United StatesReviewed by:
Laura Bretherton, Dalhousie University, CanadaColin J. Brislawn, Contamination Source Identification, United States
Copyright © 2023 Brock, Richardson, Ederington-Hagy, Nigro, Snyder and Jeffrey. This is an open-access article distributed under the terms of the Creative Commons Attribution License (CC BY). The use, distribution or reproduction in other forums is permitted, provided the original author(s) and the copyright owner(s) are credited and that the original publication in this journal is cited, in accordance with accepted academic practice. No use, distribution or reproduction is permitted which does not comply with these terms.
*Correspondence: Wade H. Jeffrey,  d2plZmZyZXlAdXdmLmVkdQ==
†Present Address: Melissa L. Brock, Department of Ecology and Evolutionary Biology, University of California, Irvine, Irvine, CA, United States Melissa Ederington-Hagy, Department of Earth and Environment, Boston University, Boston, MA, United States Lisa Nigro, Microbial Analysis, Resources and Services, Center for Open Research Resources and Equipment, University of Connecticut, Storrs, CT, United States