 Sarah E. Beatham
 Philip A. Stephens
 Julia Coats1
 Giovanna Massei
94% of researchers rate our articles as excellent or good
Learn more about the work of our research integrity team to safeguard the quality of each article we publish.
Find out more
ORIGINAL RESEARCH article
Front. Ecol. Evol., 13 June 2023
Sec. Conservation and Restoration Ecology
Volume 11 - 2023 | https://doi.org/10.3389/fevo.2023.1096321
This article is part of the Research TopicEcology, Impact, and Management of Squirrel InvasionsView all 7 articles
Effective wildlife population management requires an understanding of the abundance of the target species. In the United Kingdom, the increase in numbers and range of the non-native invasive grey squirrel Sciurus carolinensis poses a substantial threat to the existence of the native red squirrel S. vulgaris, to tree health, and to the forestry industry. Reducing the number of grey squirrels, is crucial to mitigate their impacts. Camera traps are increasingly used to estimate animal abundance, and methods have been developed that do not require the identification of individual animals. Most of these methods have been focussed on medium to large mammal species with large range sizes and may be unsuitable for measuring local abundances of smaller mammals that have variable detection rates and hard to measure movement behaviour. The aim of this study was to develop a practical and cost-effective method, based on a camera trap index, that could be used by practitioners to estimate target densities of grey squirrels in woodlands to provide guidance on the numbers of traps or contraceptive feeders required for local grey squirrel control. Camera traps were deployed in ten independent woods of between 6 and 28 ha in size. An index, calculated from the number of grey squirrel photographs recorded per camera per day had a strong linear relationship (R2 = 0.90) with the densities of squirrels removed in trap and dispatch operations. From different time filters tested, a 5 min filter was applied, where photographs of squirrels recorded on the same camera within 5 min of a previous photograph were not counted. There were no significant differences between the number of squirrel photographs per camera recorded by three different models of camera, increasing the method’s practical application. This study demonstrated that a camera index could be used to inform the number of feeders or traps required for grey squirrel management through culling or contraception. Results could be obtained within 6 days without requiring expensive equipment or a high level of technical input. This method can easily be adapted to other rodent or small mammal species, making it widely applicable to other wildlife management interventions.
Effective wildlife population management requires an understanding of the abundance of the target species. This knowledge is important to plan how much effort, in terms of equipment and hours, is required to achieve a set population reduction. In the United Kingdom, the increase in numbers and range of the non-native, invasive grey squirrel Sciurus carolinensis poses a substantial threat to the existence of the native red squirrel Sciurus vulgaris (Rushton et al., 2006; Gurnell et al., 2016), to tree health and to the forestry industry (Mayle and Broome, 2013; The Royal Forestry Society, 2021). The UK Government has implemented a national management plan to control the grey squirrel (Forestry Commission, 2014) which, recently, has included providing landowners with financial incentives to reduce their numbers (Rural Payments Agency and Natural England, 2022).
Currently, the most widely used method of squirrel control is trap and dispatch (Mayle et al., 2007). Fertility control, using oral contraceptives delivered in baits via feeders, is currently being developed as an additional tool to reduce population sizes and to slow the rate of population recovery after culling (Massei et al., 2020; Croft et al., 2021). The density of traps for effective control and the density of feeders for effective contraceptive bait delivery both depend on local densities of squirrels. Grey squirrel management is conducted by volunteers and practitioners throughout the United Kingdom. A practical and cost-effective method for estimating squirrel densities is therefore required to guide population control operations and to assess the impact of these interventions on a local scale.
Camera traps are increasingly used to estimate mammal population sizes (Noss et al., 2012; Massei et al., 2018; Jayasekara and Mahaulpatha, 2022; Mason et al., 2022) and, in the last few decades, methods have been developed that estimate animal abundance based on the detection rates of animals by camera traps that, unlike traditional capture-mark recapture applications, do not require the identification of individual animals (Howe et al., 2017; Moeller et al., 2018; Gilbert et al., 2021; Loonam et al., 2021; Palencia et al., 2021). These methods often require strict sampling protocols, the provision of complex ancillary data on factors such as animal movement and most have been developed on medium to large mammal species with large range sizes, such as ungulates or big cats. Most of these models are based on passive detection rates of animals in their environment, with the assumption that the presence of the cameras should not affect the behaviour of the target species, so baits or lures should not be used. It is therefore challenging to apply these methods to obtain abundances for species with hard to measure movement behaviour and variable detection probabilities, such as those that are small in size or that spend a lot of their time in hard to monitor locations, such as fossorial or arboreal mammals.
Developments in camera trap technology, which include longer battery life, faster trigger speeds, higher sensitivity and greater memory capacity, have widened their application for monitoring the activity of rodents and other small, fast-moving mammals. To increase the detection probability of small mammals, studies have focussed cameras on areas of animal activity, based on activity signs or by using bait, and indices calculated from the number of camera trap photos per unit effort have been found to be closely correlated with other measures of population size for Norway rats Rattus norvegicus (Lambert et al., 2018), red-backed voles Myodes rutilus and deer mice Peromyscus maniculatus (Villette et al., 2016) and snowshoe hares Lepus americanus and red squirrels Tamiasciurus hudsonicus (Villette et al., 2017).
The aim of this study was to develop a practical and cost-effective camera trap method that could be used by practitioners to estimate target densities of grey squirrels in woodlands to determine the number of traps or contraceptive feeders required for effective control. Camera traps were deployed in ten independent woods of between 6 and 28 ha in size. Piles of bait were used to lure squirrels in front of the cameras, to create areas of activity and increase detection probability. Indices were calculated for each wood based on the number of squirrel photographs recorded per camera per day and these were compared with the total number of squirrels removed through trap and dispatch, undertaken as part of local eradications for other studies and for management purposes. An index was selected based on the relative linear regression model fit, measured by R2, its practical application and cost-effectiveness. Different time filters were tested and the filter that produced the best model fit was selected. To improve the cost-effectiveness and practical application of the method, two cheaper models of camera were tested alongside the higher end model used to develop the method. We discuss how these methods could be adapted to improve their application to grey squirrel management methods and the assessment of other rodent and small mammal populations.
The study was conducted in 10 mature woods at the same time of year, between mid-June and mid-July, from 2018 to 2021 (Table 1). Woods were located in two regions of the United Kingdom; eight in Yorkshire, England (54oN, 0oW) and two in Denbighshire, Wales (53oN, −3oW). Woods were between 6 ha and 28 ha in area and consisted of either broadleaf or a mix of broadleaf and conifer tree species. The area of each wood was measured from a satellite base map using a measure tool (Google My Maps 2018 to 2021). During the study, each wood was sampled once. To ensure independence, woods sampled within consecutive years were not directly connected to each other via wooded corridors or hedgerows and were located at least 600 M apart. The first seven woods, sampled in 2018 and 2019, were discrete areas of woodland with little connectivity to other woodland areas. The last three woods sampled were highly connected to other woodland areas.
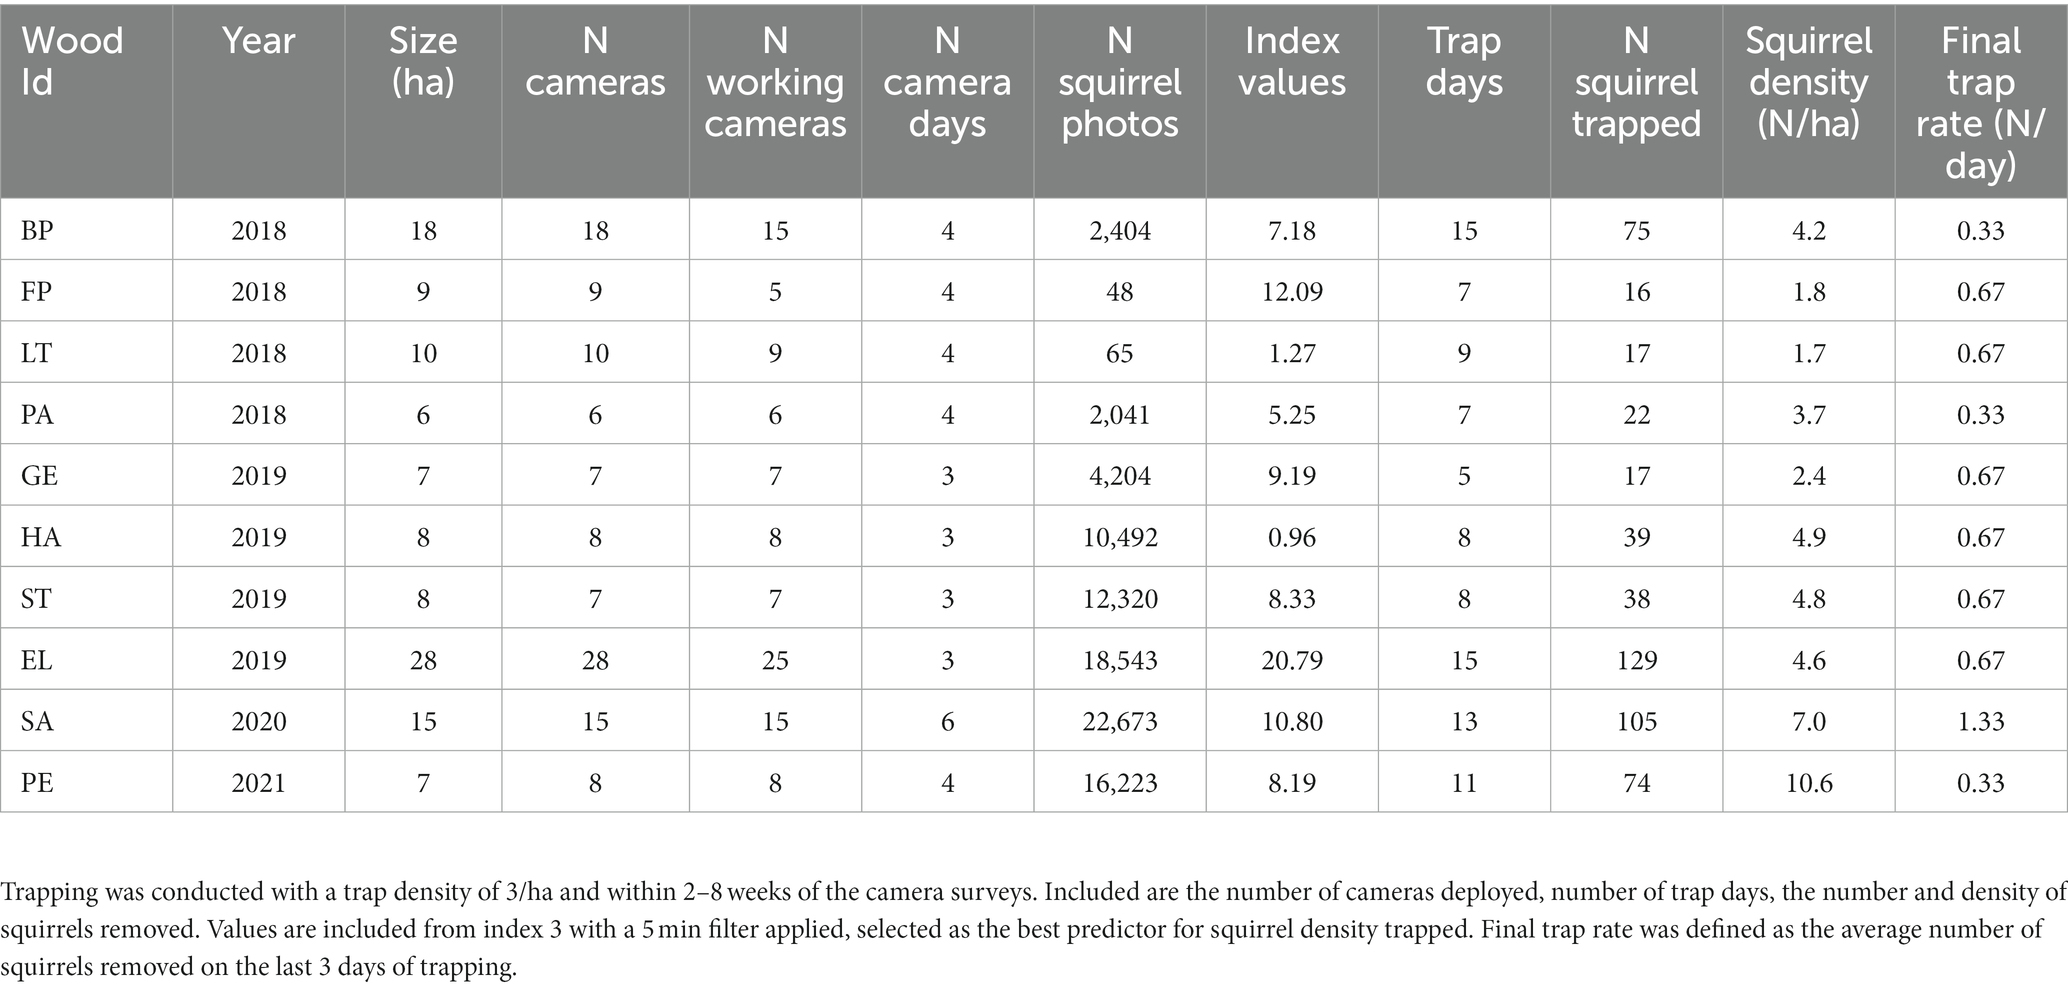
Table 1. The results of grey squirrel camera surveys and live trap and removal conducted at 10 woods.
At each wood, camera traps (Reconyx™ HC500 or HS2X) were deployed at a density of 1/ha. Camera placement in the field was guided by a 1 ha grid generated in ArcGIS (version 10.7.1) overlayed onto a satellite map using the ArcGIS Collector mobile phone application and was adjusted according to accessibility; for example, steep slopes or thick vegetation were avoided (Figure 1A).
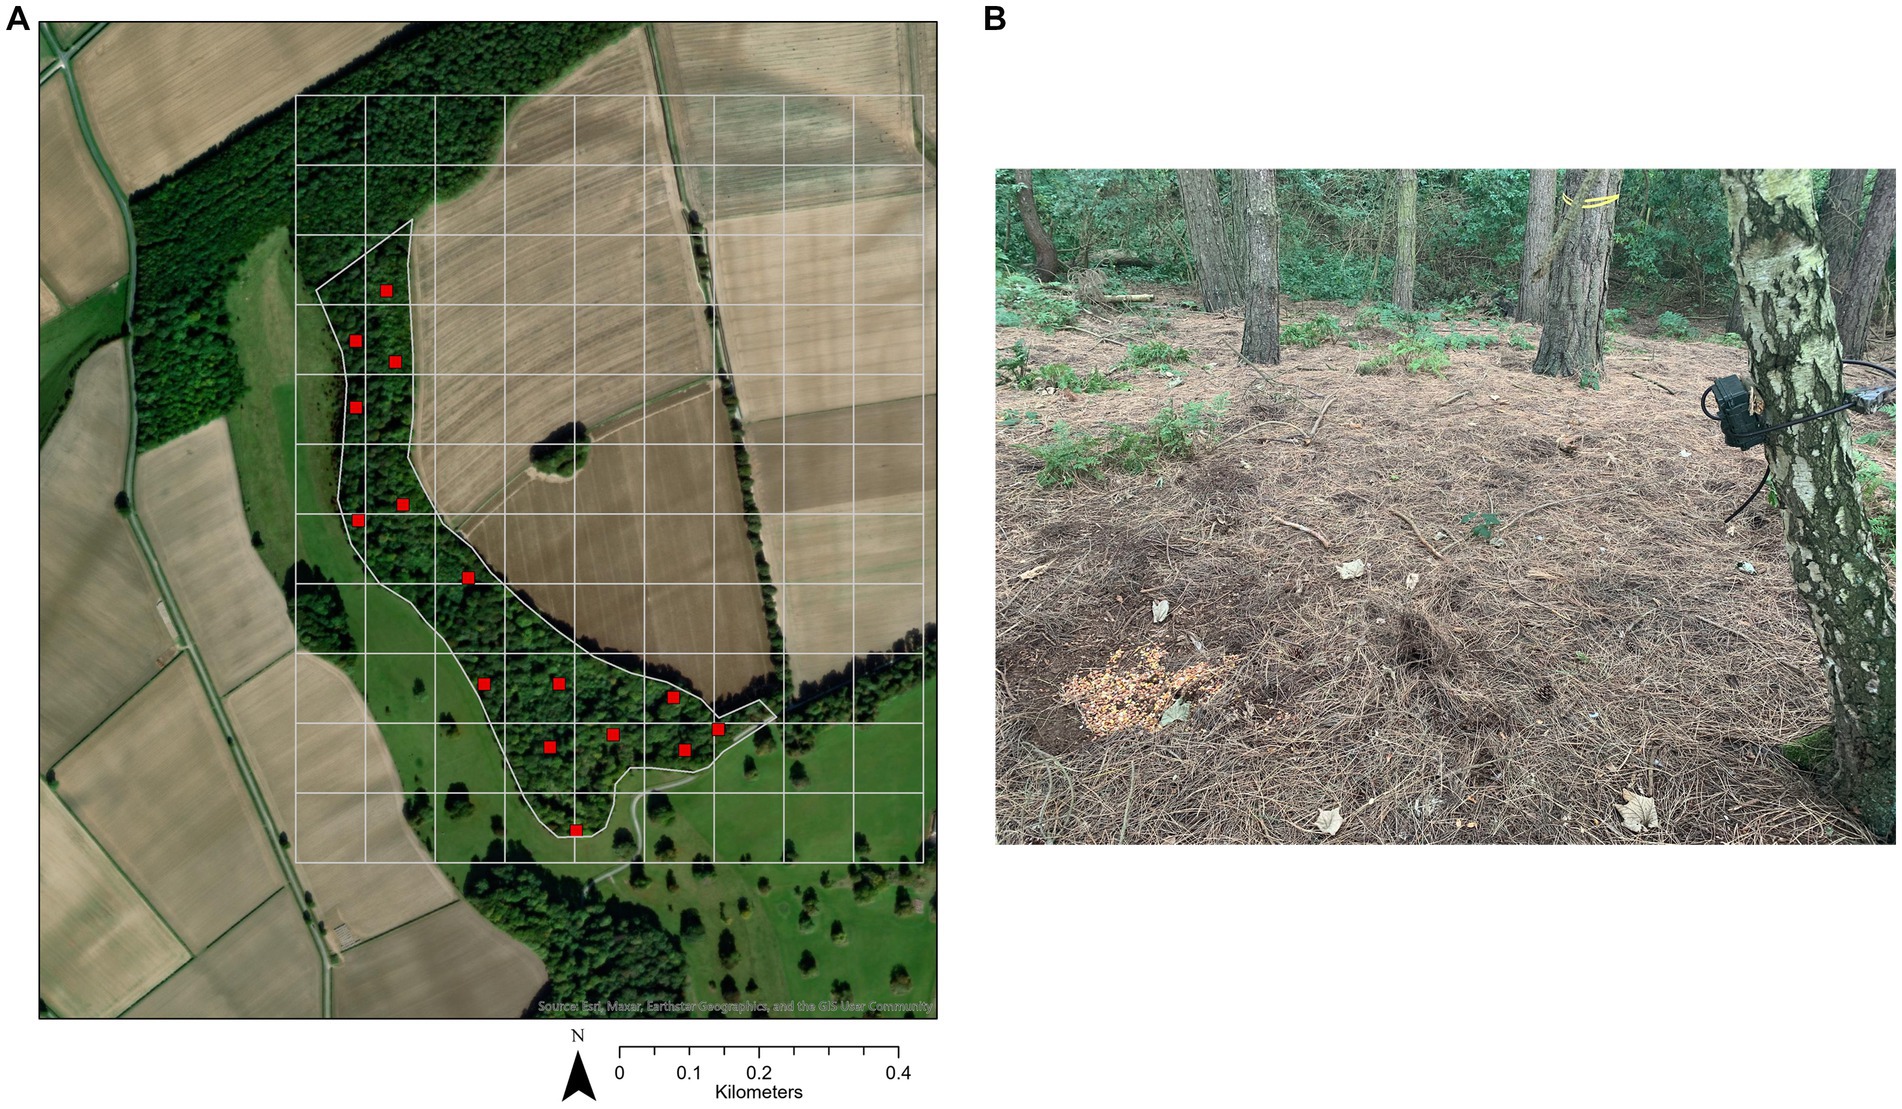
Figure 1. Cameras were placed at a density of 1/ha, guided by a 1 ha grid, at random locations approximately evenly spaced across 10 woods. Camera placement was adjusted according to accessibility; for example, steep slopes or thick vegetation were avoided. A map of the camera locations (red squares) at wood SA (outline in grey) is provided as an example (A). Cameras were fixed to trees at approximately 1 meter above the ground and with the lens angled between horizontal and 45° below horizontal, focussed on a bait pile (B).
Cameras were fixed to trees at approximately 1 M above the ground and with the lens angled between horizontal and 45o below horizontal (Figure 1B). A laser pen or 1 M wooden pole, placed parallel to the base of the camera, was used to position a pile of bait at the centre of the camera field of view, between 1 and 2 M away from the camera lens. The bait pile consisted of approximately 1.5 kg of 50:50 whole maize and peanuts. The cameras were set to take one photograph per trigger and the passive infrared sensor to high sensitivity. Cameras were deployed for 3–6 days and the bait in front of each camera was checked every 1–3 days (guided by a prior assessment of potential bait uptake by non-target species) and replenished, if required.
At the end of each deployment, the cameras were removed and all the photographs containing squirrels were digitally tagged using the Reconyx MapView Professional™ software. For the first five woods, photographs were also tagged with the number of squirrels present in each photograph. The resulting data were quality checked by a second observer re-analysing a sub-sample of the photographs to ensure there was no observer bias in the records. The final photographs taken by each camera in each wood were checked for the amount of bait remaining, as this is likely to affect squirrel activity and the number of photographs recorded. Photograph data were not analysed, and the number of cameras adjusted accordingly for days when a camera ceased to work due to insufficient battery power or faults, when the bait had been completely removed, or when the camera was not focussed on any part of the bait pile, due to set up error or if it was subsequently knocked out of position by a person or an animal.
Grey squirrel trapping and dispatch methods were approved by an Animal Welfare and Ethical Review Body (AWERB). Within 2–8 weeks of camera deployment, squirrel live-capture cage-traps were installed in each wood, secured to 1 M high wooden stands, evenly distributed throughout each wood at a density of 3 traps/ha. The traps in each wood were left open and pre-baited with a mixture of maize, peanuts and several whole hazelnuts for three to 11 days, dependent on the availability of resources. Traps were then set and checked at least once every 24 h. For animal welfare and health and safety reasons, traps were not set if heavy rain, high winds or high temperatures were forecast, and each trap was partly covered with a waterproof sheet. Trapping was conducted within a 4 week period, typically Monday to Friday, for a minimum of 5 days, until squirrel capture rates were reduced to an average of less than one per day over three consecutive days. Lawton and Rochford (2007) found that most, if not all, grey squirrels in a population could be captured within 5 days of an intensive trapping regime. Squirrels that were trapped were humanely dispatched using a United Kingdom Home Office approved (schedule 1) method, by a trained and competent person and the sex recorded.
Four camera indices were considered as candidates for estimating grey squirrel densities. All indices were based on the number of squirrel photographs per number of working cameras per trial day and were designed to be practical, cost-effective and representative of squirrel activity. Trial days consisted of consecutive 24 h. The differences between indices concerned the time the first trial day began and which trial days were used for the photograph counts. Index 1 used all squirrel photographs recorded during consecutive 24 h from the time the last camera was deployed in each wood. Index 2 used all squirrel photographs recorded during consecutive 24 h, from 24 h after the last camera was deployed; this was to allow the squirrels time to find the bait piles before the assessment began. Index 3 used all squirrel photographs recorded within consecutive 24 h, from 24:00 on the day the cameras were deployed. Index 4 used all squirrel photographs from the 24 h that recorded the maximum number of squirrel photographs from each consecutive 24 h starting from when the last camera was deployed; this was to provide the maximum level of activity.
For all four indices, time filters of 0.5, 1, 2, 3, 4, 5, 10, 20 and 30 min were applied, where any photographs that were recorded within the specified interval after the previous photograph were excluded from the photograph counts. The application of a time filter was used to moderate inflated counts caused by individuals that remain in front of a camera for extended periods of time (Tourani et al., 2020). This is especially applicable at bait piles, where some individuals may feed for longer than others. Linear regressions were used to test whether the values calculated for each index could be used to predict the density of squirrels trapped and removed in each wood. The coefficient of determination (R2) was calculated as a measure of fit (Nakagawa and Cuthill, 2007; Villette et al., 2016, 2017) and the statistical significance of the model with the greatest R2 was assessed using an F-test. Data normality was confirmed using a Jarque-Bera test and through plots of the residuals. To make the data processing methods more widely accessible to practitioners, all data analysis was conducted using Microsoft Excel®.
A method developed to be a practical tool available to a wide range of practitioners needs to be suitable for use with most of makes and models of cameras. The Reconyx cameras that were used to develop the method are one of the most technologically advanced models on the market, but they are also one of the most expensive, making them inaccessible to many grey squirrel management practitioners. The method was therefore trialled with two alternative types of camera, the widely used, mid-priced Browning® BT-5 and a lower budget camera, the Toguard H70A. Table 2 provides a comparison of the main parameters for each of the three cameras.
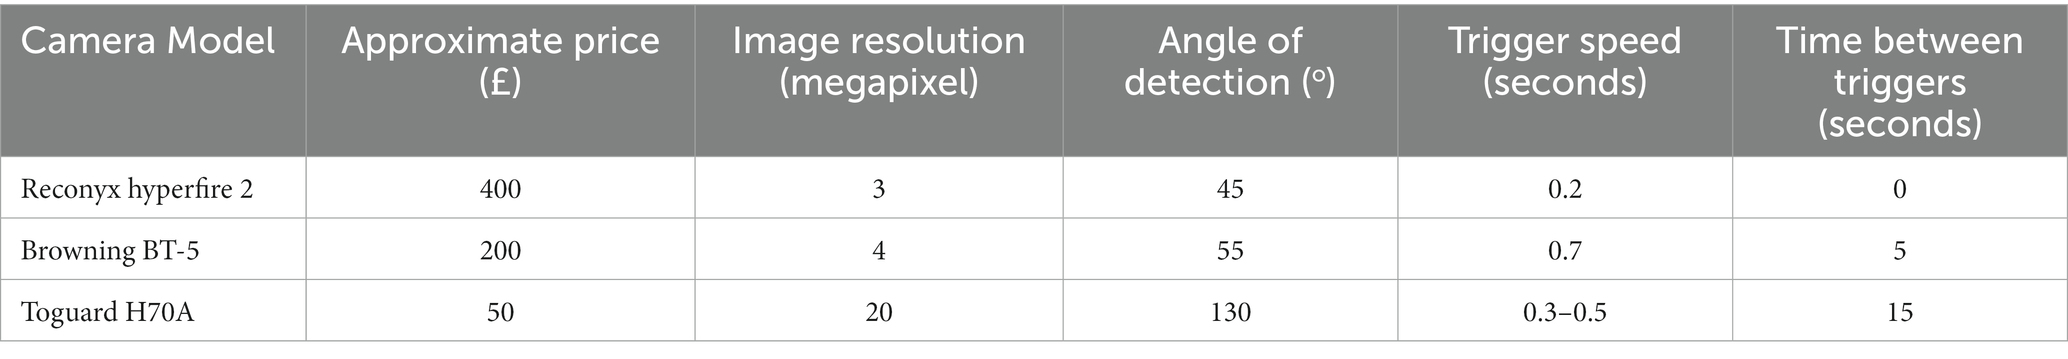
Table 2. A comparison of features for three different camera traps trialled to calculate a camera-based density index based on the number of squirrel photographs recorded/camera/trial day.
In trial 1, seven Reconyx Hyperfire 2 cameras and seven Browning BT-5 cameras were deployed in a 7 ha wood in North Yorkshire in February 2020. Both camera models were placed next to each other vertically on a tree, angled towards a bait pile, using the same camera deployment method described above. The position of the cameras from each model (top or bottom) was alternated for each consecutive deployment within the same wood, to reduce any bias caused by camera position. In trial 2, conducted in August 2021, volunteers from the Westmorland red squirrel group, were trained to deploy nine Toguard cameras and nine Reconyx camera in a 9 ha area of a woodland. For both trials, cameras were baited for 3 days, then removed and the photographs containing squirrels tagged and counted. The total number of photographs per camera per trial day and the number of photographs per camera per trial day with a 5 min filter applied were then compared between the Reconyx cameras and two other models.
A total of 89,011 squirrel photographs were recorded in the ten study woods, with a range of 52–22,671 photographs per wood (Table 1). For most woods, the camera deployment and photograph analysis were completed within 6 days. Out of the 31,031 squirrel photographs recorded in the first seven study woods, 98% contained one individual, rather than multiple individuals; therefore, it was decided that it would not be cost-effective to include the number of squirrels in photographs in the index analysis, as this would considerably increase the photograph processing time.
The duration of grey squirrel feeding activity, taken from the photographs, was consistent across woods; the average time the first squirrel photograph was taken was 5:20 (SD = 00:38 min) and the average time the last squirrel photograph was taken was 21:09 (SD = 00:46 min) producing an average duration of squirrel activity of 15 h 49 min (SD = 1 h 17 min).
For all ten woods, the number of days between the completion of the camera survey and the start of the trap and dispatch was, on average, 29 days (range = 3–54 days). Between 16 and 129 squirrels were trapped at the 10 study woods (Table 1). On average, 53% of the squirrels caught were male (range = 43–65%) and on average, 86% of the squirrels trapped in each wood were trapped within the first 5 days (range = 67–100%). For nine woods, a trap rate of less than 1 squirrel/day for three consecutive days was achieved in 15 trap days or less. For wood SA, trapping was stopped on day 13 due to insufficient resources and the final trap rate was 1.33 squirrels/day, with the final 3 days’ capture numbers 3, 1 and 0, respectively. The densities of squirrels trapped at each wood, were between 1.6 and 10.6 squirrels/ha.
Each of the four camera indices tested provided a good linear fit with the density of squirrels trapped at each wood, all achieving R2 values of over 0.77 (Figure 2). Time filters of between 1 and 5 min improved the model fit for all indices. The regression model for index 3, with a 5 min filter applied, had the highest R2 (0.90, Figure 3) and was highly significant (F1,8 = 71.4, p < 0.001).
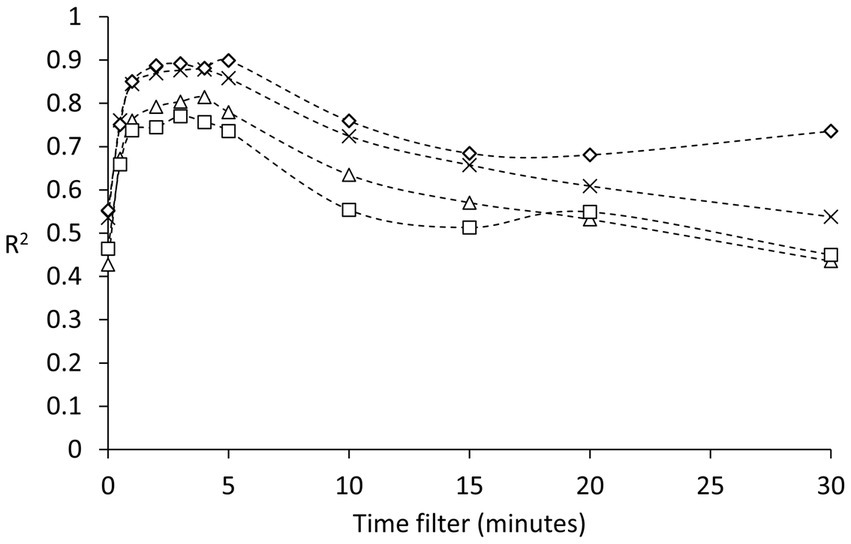
Figure 2. The relationship between four camera indices (based on the number of squirrel photographs/camera/trial day) and the density of squirrels trapped and removed in 10 woods. R2 denotes the variability explained. A time filter ranging from 0.5 to 30 min was applied to each index. Index 1 (cross) = all squirrel photographs recorded during consecutive 24 h from the time the last camera was deployed. Index 2 (square) = all squirrel photographs recorded during consecutive 24 h, from 24 h after the last camera was deployed. Index 3 (diamond) = all squirrel photographs recorded within consecutive 24 h, from 24:00 on the day the cameras were deployed. Index 4 (triangle) = all squirrel photographs from the 24 h that recorded the maximum number of squirrel photographs from consecutive 24 h starting from when the last camera was deployed.
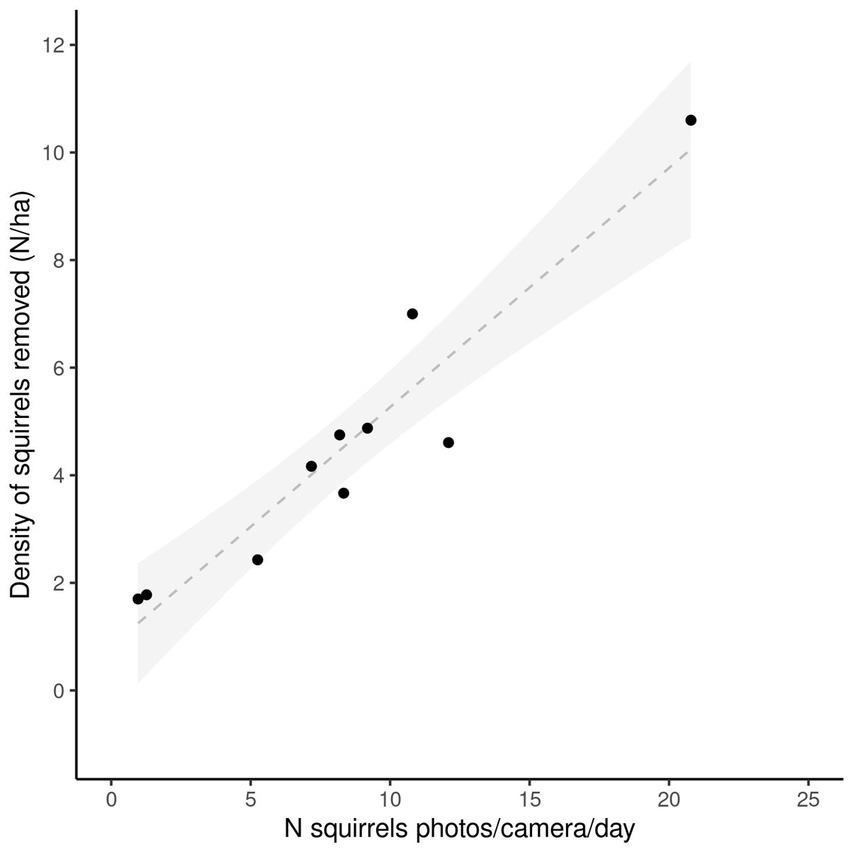
Figure 3. A camera index, based on the number of squirrel photographs taken/camera/trial day by baited cameras deployed at 1/ha, plotted against the density of squirrels trapped and removed in 10 woods. Only photographs recorded within consecutive 24 h, from 24:00 on the day the cameras were deployed were used and any squirrel photograph obtained within 5 min of a previous squirrel photograph at the same camera was filtered out of the analysis. Line of best fit (dashed) is y = 0.4446x + 0.8203, 95% confidence intervals (grey shading) are also shown, R2 = 0.90.
During trial 1, a Reconyx camera in one location stopped working on day 1, due to battery failure. The analysis was therefore conducted using photograph data from six locations in the wood. Analysis of the bait piles in the camera field of view showed that both camera models in each location were focussed on over 90% of the bait piles. The number of squirrel photographs recorded by the Reconyx cameras (Table 3) was significantly higher than the Browning cameras (Paired sample Wilcoxon signed rank two-tailed; W(17) = 3, p < 0.05). When a 5 min filter was applied to the data from both cameras there was no significant difference between the two camera models (Paired sample Wilcoxon signed rank two-tailed; W(12) = 26.5, p > 0.05).
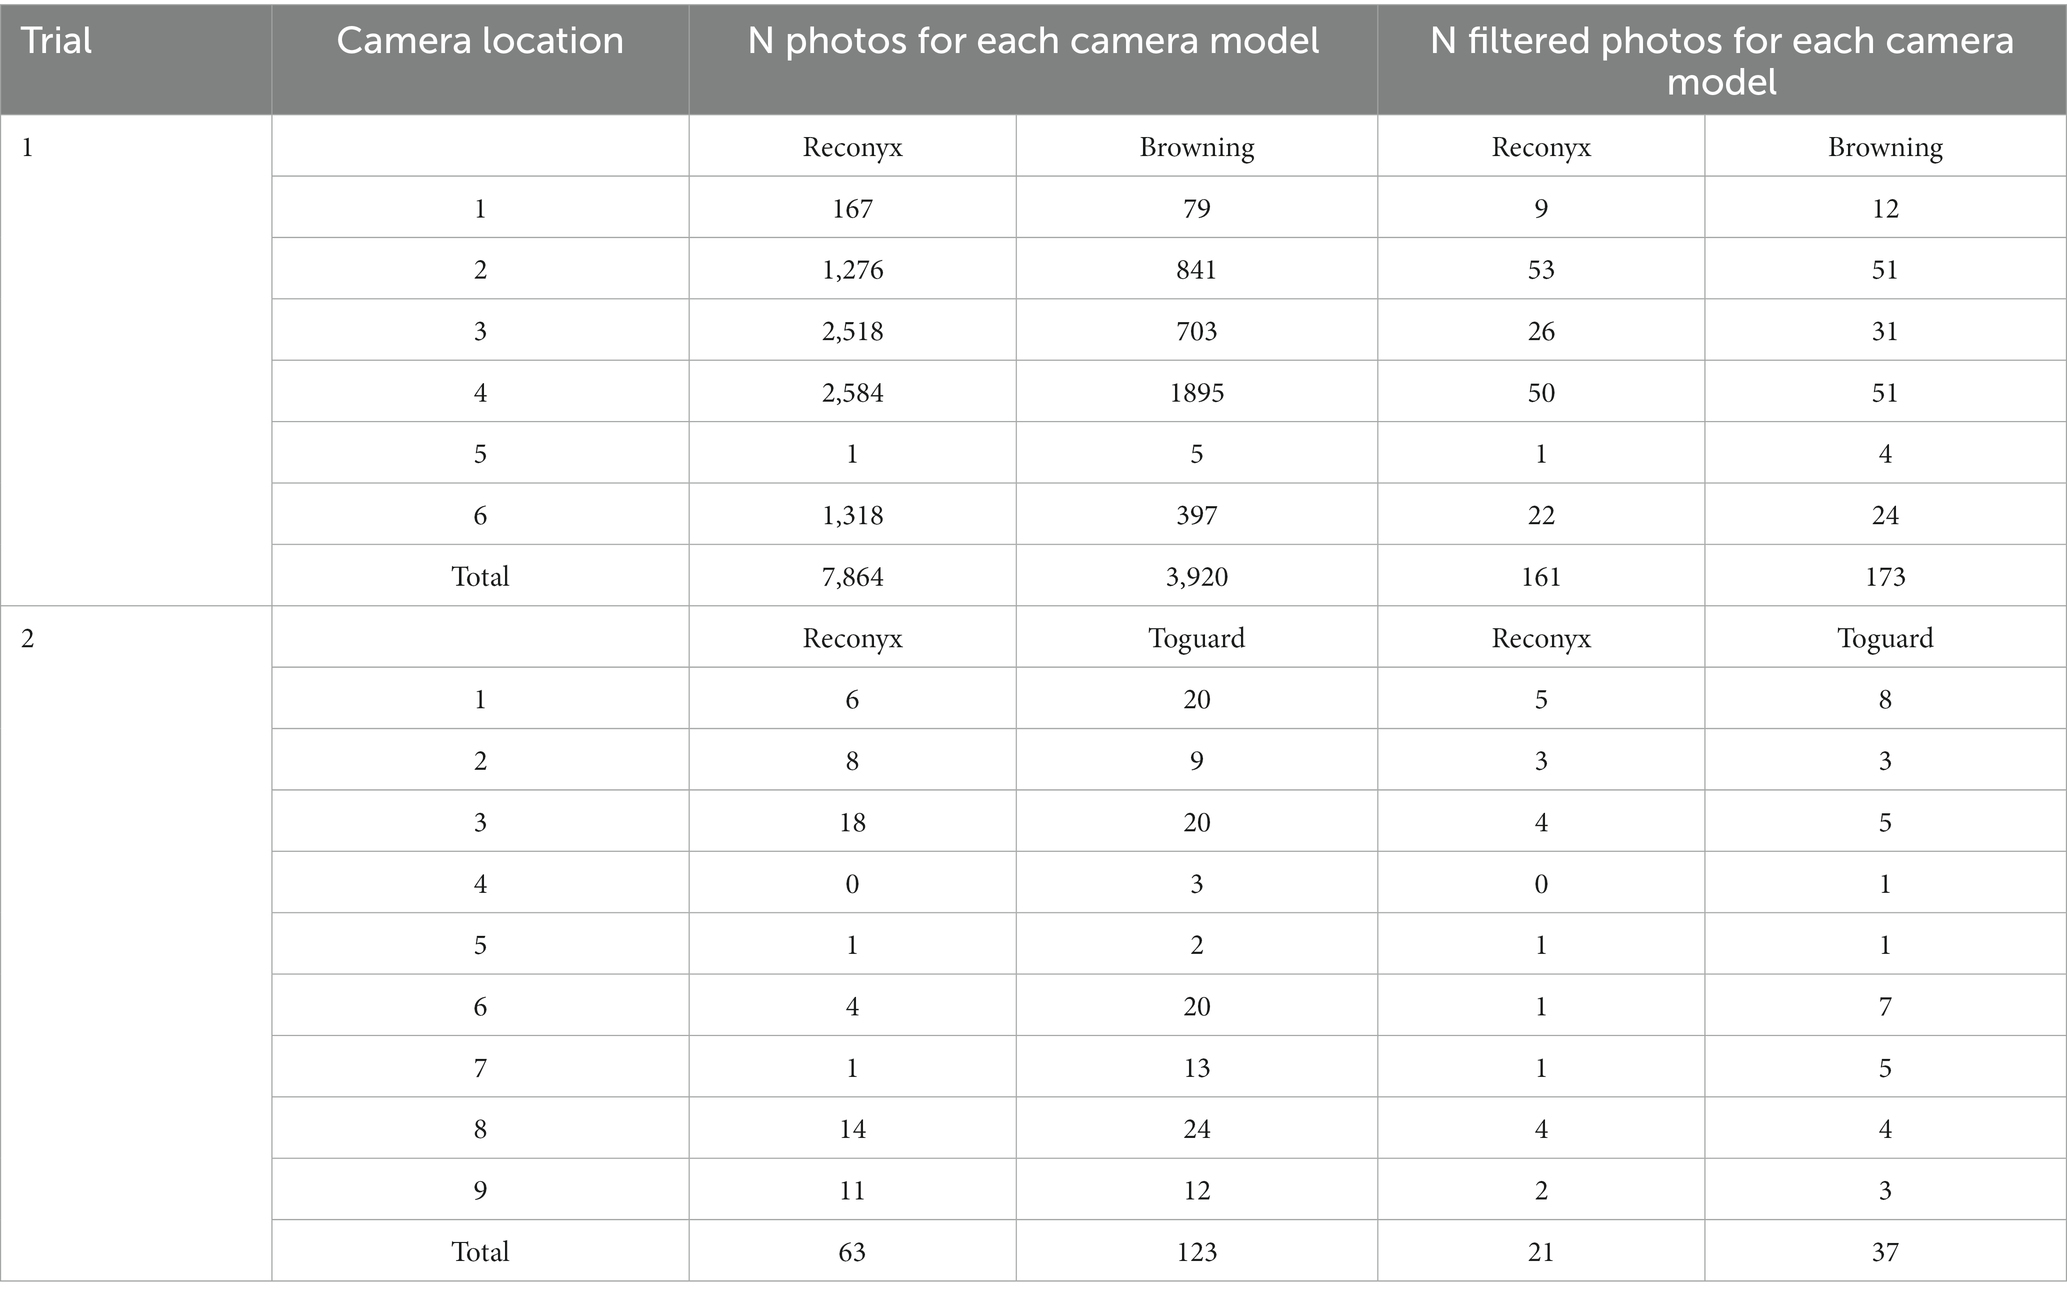
Table 3. The results of a comparative analysis between the total number of grey squirrel photos recorded and the number of grey squirrel recorded when a 5 min filter was applied (excluding any photos taken withing 5 min of a previous photo) by three different camera models, placed in the same woodland locations focussed on the same bait piles for 3 days.
In trial 2, nine Reconyx cameras recorded photographs for three trial days, with six cameras focussed on 100% of a bait pile, two on 75% and one on 25%. Nine Toguard cameras also recorded data for the duration of the trial, all focussed on 100% of a bait pile. The data were combined for the three trial days at each location, as there were many days with zero squirrel photograph counts. The number of squirrel photographs recorded by the Reconyx cameras (Table 3) was significantly lower [W(8) = 0, p < 0.05] than the Toguard cameras. When a 5 min filter was applied to the data, there was no significant difference in the number of photographs recorded by the two camera models (Paired sample Wilcoxon signed rank two-tailed; W(7) = 5, p > 0.05).
The aim of this study was to develop and test a cost-effective and practical method that could be used by practitioners to estimate target densities of grey squirrels in woodlands to improve the efficacy of management applications. A camera index, based on the number of squirrel photographs per camera per day, had a strong linear association with densities of grey squirrels trapped and dispatched in ten woods in less than 3 weeks. The index that provided the best relationship (R2 = 0.90) applied a 5 min filter to all squirrel photographs recorded from 24:00 on the day the cameras were deployed, for at least two consecutive 24 h. The linear association found was strong when compared with other studies, which have reported R2 values of 0.6 to 0.9, between camera-trap indices and independent estimates of mammal density (Rowcliffe et al., 2008; Rovero and Marshall, 2009; Villette et al., 2016, 2017).
The relationship between the camera index and density of squirrels removed was consistent over different time periods, with all four indices accounting for a significant amount of variance in the densities of squirrels trapped (R2 > 0.77) when a time filter of between 1 and 5 min was applied. The application of the time filter was important, as R2 values for all four indices were less than 0.56 when all squirrel photographs were used unfiltered. This is presumably because some squirrels remained at the bait piles for some time and contributed to a greater proportion of the number of photographs. Other studies have found that applying a filter of more than 1 min, will reduce the proportion of photographs triggered by the same animal (Yasuda, 2004) and thus improve the relationship between camera indices and animal density values (Villette et al., 2016, 2017; Massei et al., 2018). The optimum filter length is likely to be study specific, dependent on the species, environment and camera methodology used.
One advantage of using a time filter is that the photographic rate is not as sensitive to camera variables as results will be standardised between different camera models and locations. For example, locations that have a wider detection area and models that have faster trigger speeds are likely to record more photographs of the same individual for the same time period. A time filter will omit these extra photos thus moderating the number of photographs per event. In this study, this meant that the number of photographs recorded by low, medium and high budget camera models tested, that had very different specifications, were not significantly different, making the method more practical and accessible to practitioners with specific resources. Another advantage is that the index will be more robust to observer errors made in the photograph processing, for example, if a squirrel photograph is missed and is not tagged. This is because only one photograph per individual per bait pile visit needs to be accounted for. This makes the index less subject to observer bias and also means it may be more adaptable for use with machine learning automated image identification software, which can now achieve accuracies of over 90% (Tabak et al., 2019), thus offering a large reduction in processing time.
One issue with using camera traps to index relative abundance is the lack of suitable independent methods for comparison. Most published estimates of mammal abundance concern individually identifiable animals (Gilbert et al., 2021) and the use of capture-mark-recapture based models (Hayato, 2020). Live trapping and mark-recapture is one of the most widely used methods for estimating small mammal abundance and has been shown to have a strong relationship with camera trap indices when estimating the density of red squirrels (Villette et al., 2017). For many scenarios, it is not practical to trap, mark and recapture animals to estimate abundance, as the process has cost, time and welfare implications. In addition, as the grey squirrel is an invasive species in the United Kingdom, it is an offence under section 14 of the Wildlife and Countryside Act (1981) to release grey squirrels into the wild without an appropriate licence (UK Government, 2023). This is likely to be the situation for other non-native invasive species throughout Europe.
This study exploited local eradications as an opportunity to estimate squirrel density and to compare this estimate with camera trap indices. If conducted correctly, local eradications can provide accurate estimates of mammal density in a defined area, as every individual in the population should be accounted for. If there is uncertainty that 100% eradication has been achieved, then the minimum number alive (MNA) per unit area can be calculated and used to estimate a minimum density. For instance, MNA densities calculated from live trapping have been shown to have a strong relationship with camera trap indices for snowshoe hares (Villette et al., 2017).
The mean number of grey squirrels trapped in the ten study woods was 4.6 squirrels/ha, with a range of 1.7–10.6 squirrels/ha. A mean density of 4/ha has been recorded for grey squirrels in broadleaf woodland in the United Kingdom, ranging from 0 to 13 per ha (Merrick et al., 2016). There are several reasons why the density of squirrels trapped should reflect the total density in each wood. Trap effort was high and standardised between each wood, with cameras and traps deployed at the same time of year, across discrete woodland habitats, that were larger than the size of an average grey squirrel home range (less than 5 ha; Wauters et al., 2002; Lawton and Rochford, 2007). Trap density was high (3/ha) and trapping was conducted consistently for between 5 and 15 days, until no squirrels were caught.
Grey squirrels typically have a high capture probability and previous studies have confirmed, via capture mark recapture, that grey squirrel eradications in woods were achievable within 5 days, using trap densities of between 1 and 2 traps/ha (Lawton and Rochford, 2007). Thus, using 3 trap/ha with this methodology should enable the capture every squirrel within 5 trap days for even the highest densities of squirrels recorded in the United Kingdom. Other studies, using the same trapping methods as this study, demonstrated that eradications conducted in two woods within 8 days produced density estimates that were agreeable with those obtained from capture mark recapture estimates based on PIT-tagged squirrels (Beatham et al., pers. obs., unpublished; Croft et al., 2021).
In all 10 woods, within 15 days the squirrel trap rate was reduced to 1 per day or less for 3 consecutive days and on average 86% of the squirrels trapped in each wood were caught in the first 5 days. Out of the total number of squirrels trapped, 53% were male and 47% were female, suggesting that capture probabilities were not significantly different between sexes and that both sexes were equally attracted to bait.
Grey squirrels will quickly recolonise an area where numbers have been removed (Lawton and Rochford, 2007), therefore population closure was maximised to avoid an overestimate of density. This was achieved through a short camera survey time (less than 5 days), the time between camera survey and squirrel removal (average 29 days) and the intensity and short period of removal (less than 3 weeks). Closure was also likely to be maintained as studies on individually marked squirrels have shown they will typically move no more than 200 M between baited traps or feeders within the timescale of the study (Beatham et al., pers. obs., unpublished) and less than 500 M between traps over several years (Taylor et al., 1971).
Indices based on photographic capture rates per effort are commonly used as proxies for population abundance (Palmer et al., 2018) and have been shown to accurately estimate relative abundance for range of mammals in a variety of environments (Rowcliffe et al., 2008; Villette et al., 2016, 2017; Lambert et al., 2018). However, this continues to be an area of contention in Ecology (Stephens et al., 2015). Studies that assume a direct relationship between detection rates and abundance often do not account for other factors that may affect this relationship, such as animal movement or activity levels, probability of detection and the effort employed to detect the animal (Pollock et al., 2002; Sollmann et al., 2013; Broadley et al., 2019). Many camera-trap based methods rely on random sampling and assume that animal movement and behaviour are not affected by camera trap presence; therefore, camera traps must be unbaited (Palencia et al., 2021). Although such methods have been used to measure landscape level densities of grey squirrels (Mason et al., 2022), as grey squirrels are largely arboreal, fast moving and relatively hard to detect compared with larger mammals, achieving accurate local densities of grey squirrels can be challenging. By luring animals to the camera field of view using bait, it was possible to capture a meaningful index of the resident squirrel population within 4 days.
The use of bait, to some extent, addresses some of the issues associated with indices, by increasing the consistency of squirrel activity levels and the probability of detection. The effort used to detect squirrels was standardised between woods by using a set density of cameras and averaging the number of photographs by the number of cameras and days they were deployed. To ensure the attractiveness of the bait to squirrels remained consistent across woods, cameras were deployed in all woods early to mid-summer, at a time of year when natural food availability is relatively low. As bait piles are necessary for detecting squirrels, it is important to ensure that the bait pile is located in the centre of the camera field of view and that bait does not run out during the trial. At least one bait check is recommended within the 3 days following the first deployment of bait, depending on initial observations or knowledge of local bait uptake by non-target species such as badgers, deer or birds.
Overall, 98% of squirrel photographs contained only one squirrel. In all woods, there were more squirrels than cameras deployed, and it appears that, to avoid confrontation, squirrels might stagger their access to bait over the course of a day as a consistent duration of squirrel activity was recorded by the cameras at all woods. This has been found in previous studies where squirrel populations have demonstrated a hierarchy of dominance over feeding resources (Lawton et al., 2016). One advantage of this is that it requires much less processing time if the number of squirrels in each photograph does not need to be counted and the density estimate will be more accurate if each squirrel can be detected discretely within different timeframes.
Methods for estimating animal abundance have to be specifically adapted to take into account the life history of the focal species (Gilbert et al., 2021). It is recommended that, if applying the methodology presented here to estimate the abundance of other mammalian species, an alternative reliable method to validate abundance is initially required. Methods used to validate camera indices estimates have included distance sampling (Rovero and Marshall, 2009), direct counts (Rowcliffe et al., 2008), mark-recapture live trapping (Villette et al., 2016, 2017), tracking plates (Lambert et al., 2018) and models to simulate animal movement and photographic rate (Nakashima et al., 2018; Luo et al., 2020). However, all field techniques used to estimate animal populations are subject to some bias and models are only as good as the empirical data that are used to parameterise them (Chauvenet et al., 2017).
The camera index was found to be cost-effective for measuring a range of densities of squirrels in woodlands that could be targeted by traps or feeders, with estimates achievable within 6 days, however, further development is required to widen its application. For instance, the method needs to be tested on very low densities of squirrels, to ensure it can be used effectively to monitor the progress of eradications. Similarly, more data are required for woods in which squirrel density is over 7/ha, to test the relationship more thoroughly at the higher end of the scale. In addition, the method has so far only been tested in broadleaf or mixed woodlands in summer. Management through culling or contraceptives will likely be most effective when applied immediately before the grey squirrel’s main breeding season, in late winter (Hayssen, 2016); consequently, the suitability of this method needs to be tested in late November/early December. It is likely that the relationship will be different in winter, as squirrel feeding activity is greatly reduced by restricted daylight hours (Thompson, 1977), affecting access to bait piles.
In all woods, cameras were deployed at 1/ha. To improve cost-effectiveness, it may be worth modelling lower densities of cameras. However, as each camera was associated with a bait pile, which will affect the distribution of squirrels in a wood and, thus, the detection of squirrels at other bait piles, cameras cannot be modelled independently, and field trials would have to be conducted with lower numbers of cameras and associated bait piles to assess the comparative effect of lowering camera density.
Rodents and other small mammals cause a large number of negative economic and environmental impacts worldwide, including losses to the food industry, damage to property and the transmission of diseases (Stenseth et al., 2003; Witmer, 2022), so it is important to have practical tools to aid the mitigation of their impacts. This study and other similar studies (Villette et al., 2016, 2017; Lambert et al., 2018) have demonstrated that camera indices can be used to accurately measure densities of rodents that could be targeted by baited devices used for population control, such as traps or feeders containing contraceptives or biocides. The method presented in this study is highly adaptable to other rodents and small mammal species in different environments, however, confirmation of estimate accuracy would initially be required with an alternative robust technique to measure population sizes. Once achieved, this camera trap method has the potential to be more cost-effective and more employable than other approaches.
This study demonstrated that a camera index based on the number of photographs per camera per day could be used estimate target densities of grey squirrels in woods, to inform the number of feeders or traps required for effective grey squirrel control. The method was cost-effective and practical, with density estimates achieved within 5 days, with low budget cameras, minimum equipment and a low level of technical input. Providing that estimate accuracy can be initially confirmed with an alternative reliable density method, this method could be adapted to other rodents and small mammal species in other environments.
The original contributions presented in the study are publicly available. This data can be found here: Dryad, https://doi.org/10.5061/dryad.95x69p8q5.
The animal study was reviewed and approved by an Animal Welfare and Ethics Review Body.
SB, GM, and PS conceived the ideas and designed methodology. SB, JC, and JP collected and processed the data. By the input from GM and PS, SB analysed the data and led the writing of the manuscript. All authors contributed to the article and approved the submitted version.
This research was funded by Defra and the UK Squirrel Accord.
We would like to thank Defra and the UK Squirrel Accord for their support. We also thank the landowners who provided the study sites, the Westmorland red squirrel group for their assistance and the volunteers and practitioners who contributed to the data collection.
The authors declare that the research was conducted in the absence of any commercial or financial relationships that could be construed as a potential conflict of interest.
All claims expressed in this article are solely those of the authors and do not necessarily represent those of their affiliated organizations, or those of the publisher, the editors and the reviewers. Any product that may be evaluated in this article, or claim that may be made by its manufacturer, is not guaranteed or endorsed by the publisher.
Broadley, K., Burton, A. C., Avgar, T., and Boutin, S. (2019). Density-dependent space use affects interpretation of camera trap detection rates. Ecol. Evol. 9, 14031–14041. doi: 10.1002/ece3.5840
Chauvenet, A. L., Gill, R. M., Smith, G. C., Ward, A. I., and Massei, G. (2017). Quantifying the bias in density estimated from distance sampling and camera trapping of unmarked individuals. Ecol. Model. 350, 79–86. doi: 10.1016/j.ecolmodel.2017.02.007
Croft, S., Aegerter, J. N., Beatham, S., Coats, J., and Massei, G. (2021). A spatially explicit population model to compare management using culling and fertility control to reduce numbers of grey squirrels. Ecol. Model. 440:109386. doi: 10.1016/j.ecolmodel.2020.109386
Forestry Commission (2014). Grey Squirrels and England's Woodland. Available at: https://assets.publishing.service.gov.uk/government/uploads/system/uploads/attachment_data/file/700022/Grey-squirrels-policy-and-action-plan.pdf (Accessed September 25, 2020).
Gilbert, N. A., Clare, J. D. J., Stenglein, J. L., and Zuckerberg, B. (2021). Abundance estimation of unmarked animals based on camera-trap data. Conserv. Biol. 35, 88–100. doi: 10.1111/cobi.13517
Gurnell, J., Lurz, P. W. W., and Shuttleworth, C. M. (2016). “Ecosystem impacts of an alian invader in Europe, the grey squirrel Sciurus carolinensis” in The Grey Squirrel: Ecology and Management of an Invasive Species in Europe. eds. C. M. Shuttleworth, P. W. W. Lurz, and J. Gurnell (Stoneleigh Park, Warwickshire, UK: European Squirrel Initiative), 307–328.
Hayato, I. (2020). A review of wildlife abundance estimation models: comparison of models for correct application. Mammal Study 45, 177–188. doi: 10.3106/ms2019-0082
Hayssen, V. (2016). “Reproduction in grey squirrels: from anatomy to conservation” in The Grey Squirrel: Ecology and Management of an Invasive Species in Europe. eds. C. M. Shuttleworth, P. W. W. Lurz, and J. Gurnell (Stoneleigh Park, Warwickshire, UK: European Squirrel Initiative), 115–132.
Howe, E. J., Buckland, S. T., Després-Einspenner, M. L., and Kühl, H. S. (2017). Distance sampling with camera traps. Methods Ecol. Evol. 8, 1558–1565. doi: 10.1111/2041-210X.12790
Jayasekara, E. G. D. P., and Mahaulpatha, D. (2022). Modeling the habitat suitability for sympatric small and medium sized felids and investigating the spatiotemporal niche overlapping in Maduru Oya National Park, Sri Lanka. J. Wildl. Biodivers. 6, 31–56. doi: 10.22120/jwb.2022.542338.1378
Lambert, M., Bellamy, F., Budgey, R., Callaby, R., Coats, J. C., and Talling, J. C. (2018). Validating activity indices from camera traps for commensal rodents and other wildlife in and around farm buildings. Pest Manag. Sci. 74, 70–77. doi: 10.1002/ps.4668
Lawton, C., and Rochford, J. (2007). The recovery of grey squirrel (Sciurus carolinensis) populations after intensive control programmes. Biol. Environ. Proce. R. Irish Acad. 107B, 19–29. doi: 10.1353/bae.2007.0014
Lawton, C., Shuttleworth, C. M., and Kenward, R. E. (2016). “Ranging behaviour, density and social structure in grey squirrels” in The Grey Squirrel: Ecology and Management of an Invasive Species in Europe. eds. C. M. Shuttleworth, P. W. W. Lurz, and J. Gurnell (Stoneleigh Park, Warwickshire, UK: European Squirrel Initiative), 133–152.
Loonam, K. E., Lukacs, P. M., Ausband, D. E., Mitchell, M. S., and Robinson, H. S. (2021). Assessing the robustness of time-to-event models for estimating unmarked wildlife abundance using remote cameras. Ecol. Appl. 31:e02388. doi: 10.1002/eap.2388
Luo, C., Song, C., and Zhang, Z. (2020). Generalizing person re-identification by camera-aware invariance learning and cross-domain mixup. Computer Vision – ECCV 2020. ECCV 2020. Lecture Notes in Computer Science. eds. A. Vedaldi, H. Bischof, T. Brox, and J. M. Frahm (Cham: Springer) 12360, 224–241. doi: 10.1007/978-3-030-58555-6_14
Mason, S. S., Hill, R. A., Whittingham, M. J., Cokill, J., Smith, G. C., and Stephens, P. A. (2022). Camera trap distance sampling for terrestrial mammal population monitoring: lessons learnt from a UK case study. Remote Sens. Ecol. Conserv. 8, 717–730. doi: 10.1002/rse2.272
Massei, G., Coats, J., Lambert, M. S., Pietravalle, S., Gill, R., and Cowan, D. (2018). Camera traps and activity signs to estimate wild boar density and derive abundance indices. Pest Manag. Sci. 74, 853–860. doi: 10.1002/ps.4763
Massei, G., Cowan, D., Eckery, D., Mauldin, R., Gomm, M., Rochaix, P., et al. (2020). Effect of vaccination with a novel GnRH-based immunocontraceptive on immune responses and fertility in rats. Heliyon 6:e03781. doi: 10.1016/j.heliyon.2020.e03781
Mayle, B. A., and Broome, A. C. (2013). Changes in the impact and control of an invasive alien: the grey squirrel (Sciurus carolinensis) in Great Britain, as determined from regional surveys. Pest Manag. Sci. 69, 323–333. doi: 10.1002/ps.3458
Mayle, B., Ferryman, M., and Pepper, H. (2007) Controlling Grey Squirrel Damage to Woodlands, Forestry Commission, Edinburgh.
Merrick, M. J., Evans, K. L., and Bertolino, S. (2016). Urban grey squirrel ecology, associated impacts, and management challenges. Grey Squirrel Ecol. Manag. Invasive Species Europe 69, 323–333. doi: 10.1002/ps.3458
Moeller, A. K., Lukacs, P. M., and Horne, J. S. (2018). Three novel methods to estimate abundance of unmarked animals using remote cameras. Ecosphere 9:e02331. doi: 10.1002/ecs2.2331
Nakagawa, S., and Cuthill, I. C. (2007). Effect size, confidence interval and statistical significance: a practical guide for biologists. Biol. Rev. Camb. Philos. Soc. 82, 591–605. doi: 10.1111/j.1469-185X.2007.00027.x
Nakashima, Y., Fukasawa, K., and Samejima, H. (2018). Estimating animal density without individual recognition using information derivable exclusively from camera traps. J. Appl. Ecol. 55, 735–744. doi: 10.1111/1365-2664.13059
Noss, A. J., Gardner, B., Maffei, L., Cuéllar, E., Montaño, R., Romero-Muñoz, A., et al. (2012). Comparison of density estimation methods for mammal populations with camera traps in the Kaa-Iya del Gran Chaco landscape. Anim. Conserv. 15, 527–535. doi: 10.1111/j.1469-1795.2012.00545.x
Palencia, P., Rowcliffe, J. M., Vicente, J., and Acevedo, P. (2021). Assessing the camera trap methodologies used to estimate density of unmarked populations. J. Appl. Ecol. 58, 1583–1592. doi: 10.1111/1365-2664.13913
Palmer, M. S., Swanson, A., Kosmala, M., Arnold, T., and Packer, C. (2018). Evaluating relative abundance indices for terrestrial herbivores from large-scale camera trap surveys. Afr. J. Ecol. 56, 791–803. doi: 10.1111/aje.12566
Pollock, K. H., Nichols, J. D., Simons, T. R., Farnsworth, G. L., Bailey, L. L., and Sauer, J. R. (2002). Large scale wildlife monitoring studies: statistical methods for design and analysis. Environmetrics 13, 105–119. doi: 10.1002/env.514
Rovero, F., and Marshall, A. R. (2009). Camera trapping photographic rate as an index of density in forest ungulates. J. Appl. Ecol. 46, 1011–1017. doi: 10.1002/env.514
Rowcliffe, J. M., Field, J., Turvey, S. T., and Carbone, C. (2008). Estimating animal density using camera traps without the need for individual recognition. J. Appl. Ecol. 45, 1228–1236. doi: 10.1111/j.1365-2664.2008.01473.x
Rural Payments Agency and Natural England. (2022). WS3: Squirrel Control and Management. Available at: https://www.gov.uk/countryside-stewardship-grants/ws3-squirrel-control-and-management (Accessed November 01, 2022).
Rushton, S. P., Lurz, P. W. W., Gurnell, J., Nettleton, P., Bruemmer, C., Shirley, M. D. F., et al. (2006). Disease threats posed by alien species: the role of a poxvirus in the decline of the native red squirrel in Britain. Epidemiol. Infect. 134, 521–533. doi: 10.1017/S0950268805005303
Sollmann, R., Mohamed, A., Samejima, H., and Wilting, A. (2013). Risky business or simple solution–relative abundance indices from camera-trapping. Biol. Conserv. 159, 405–412. doi: 10.1016/j.biocon.2012.12.025
Stenseth, N. C., Leirs, H., Skonhoft, A., Davis, S. A., Pech, R. P., Andreassen, H. P., et al. (2003). Mice, rats, and people: the bio-economics of agricultural rodent pests. Front. Ecol. Environ. 1, 367–375. doi: 10.1890/1540-9295(2003)001[0367:MRAPTB]2.0.CO;2
Stephens, P. A., Pettorelli, N., Barlow, J., Whittingham, M. J., and Cadotte, M. W. (2015). Management by proxy? The use of indices in applied ecology. J. Appl. Ecol. 52, 1–6. doi: 10.1111/1365-2664.12383
Tabak, M. A., Norouzzadeh, M. S., Wolfson, D. W., Sweeney, S. J., Vercauteren, K. C., Snow, N. P., et al. (2019). Machine learning to classify animal species in camera trap images: applications in ecology. Methods Ecol. Evol. 10, 585–590. doi: 10.1111/2041-210X.13120
Taylor, K., Shorten, M., Lloyd, H., and Courtier, F. (1971). Movements of the grey squirrel as revealed by trapping. J. Appl. Ecol. 8, 123–146. doi: 10.2307/2402132
The Royal Forestry Society (2021). An Analysis of the Cost of Grey Squirrel Damage to Woodland. Available at: https://rfs.org.uk/insights-publications/rfs-reports/an-analysis-of-the-cost-of-grey-squirrel-damage-to-woodland/ (Accessed September 30, 2022).
Thompson, D. C. (1977). Diurnal and seasonal activity of the grey squirrel (Sciurus carolinensis). Can. J. Zool. 55, 1185–1189. doi: 10.1139/z77-153
Tourani, M., Brøste, E. N., Bakken, S., Odden, J., and Bischof, R. (2020). Sooner, closer, or longer: detectability of mesocarnivores at camera traps. J. Zool. 312, 259–270. doi: 10.1111/jzo.12828
UK Government (2023). Wildlife and Countryside Act 1981. Available at: https://www.legislation.gov.uk/ukpga/1981/69/contents (Accessed April 16, 2023).
Villette, P., Krebs, C. J., and Jung, T. S. (2017). Evaluating camera traps as an alternative to live trapping for estimating the density of snowshoe hares (Lepus americanus) and red squirrels (Tamiasciurus hudsonicus). Eur. J. Wildl. Res. 63:7. doi: 10.1007/s10344-016-1064-3
Villette, P., Krebs, C. J., Jung, T. S., and Boonstra, R. (2016). Can camera trapping provide accurate estimates of small mammal (Myodes rutilus and Peromyscus maniculatus) density in the boreal forest? J. Mammal. 97, 32–40. doi: 10.1093/jmammal/gyv150
Wauters, L. A., Gurnell, J., Martinoli, A., and Tosi, G. (2002). Interspecific competition between native Eurasian red squirrels and alien grey squirrels: does resource partitioning occur? Behav. Ecol. Sociobiol. 52, 332–341. doi: 10.1007/s00265-002-0516-9
Witmer, G. (2022). Rodents in agriculture: a broad perspective. Agronomy 12:1458. doi: 10.3390/agronomy12061458
Keywords: camera indices, invasive species, hit rate, eradications, oral contraceptives, live trapping, population control, rodents
Citation: Beatham SE, Stephens PA, Coats J, Phillips J and Massei G (2023) A camera trap method for estimating target densities of grey squirrels to inform wildlife management applications. Front. Ecol. Evol. 11:1096321. doi: 10.3389/fevo.2023.1096321
Edited by:
Valentina La Morgia, Istituto Superiore per la Protezione e la Ricerca Ambientale (ISPRA), ItalyReviewed by:
Jim Casaer, Research Institute for Nature and Forest (INBO), BelgiumCopyright © 2023 Beatham, Stephens, Coats, Phillips and Massei. This is an open-access article distributed under the terms of the Creative Commons Attribution License (CC BY). The use, distribution or reproduction in other forums is permitted, provided the original author(s) and the copyright owner(s) are credited and that the original publication in this journal is cited, in accordance with accepted academic practice. No use, distribution or reproduction is permitted which does not comply with these terms.
*Correspondence: Sarah E. Beatham, c2FyYWguYmVhdGhhbUBhcGhhLmdvdi51aw==
†ORCID: Sarah E. Beatham, https://orcid.org/0000-0001-8300-8953
Disclaimer: All claims expressed in this article are solely those of the authors and do not necessarily represent those of their affiliated organizations, or those of the publisher, the editors and the reviewers. Any product that may be evaluated in this article or claim that may be made by its manufacturer is not guaranteed or endorsed by the publisher.
Research integrity at Frontiers
Learn more about the work of our research integrity team to safeguard the quality of each article we publish.