 Hao Ma
 Lihua Wang1,2,3*
 Weiwei Sun
 Gang Yang
95% of researchers rate our articles as excellent or good
Learn more about the work of our research integrity team to safeguard the quality of each article we publish.
Find out more
ORIGINAL RESEARCH article
Front. Ecol. Evol. , 02 March 2023
Sec. Environmental Informatics and Remote Sensing
Volume 11 - 2023 | https://doi.org/10.3389/fevo.2023.1093454
This article is part of the Research Topic Advances in Characterizing and Monitoring Land Cover/Use and Associated Ecosystem Changes Using Remote Sensing Data View all 13 articles
Accurate mapping of rice-growing areas is essential to ascertain the spatial distribution of rice fields, and ensure food security. It is a challenging task to timely and accurate identify rice under the complex terrain due to its diversified land cover, small- or middle-sized rice fields with fragmented distribution. In this paper, the time series VV and VH backscatter coefficient datasets were first constructed based on 411 sentinel-1 synthetic aperture radar (SAR) images in Chongqing city with complex terrain. Then, the rice multi-characteristic parameters, including SAR backscatter features, composite features, rice phenological parameters, texture features and topographic features, were generated. On this basis, the homogeneous image objects were produced. Furthermore, a rice identification algorithm combining multi-characteristic parameters and homogeneous objects based on time series dual-polarization SAR (MPHO-DPSAR) was established. The research demonstrated that the MPHO-DPSAR algorithm can achieve accurate mapping of small and medium-sized and fragmented rice fields in regions under complex terrain according to the accuracy evaluation at three levels and the comparison with other three classical rice identification methods. The suitability and limitations of proposed MPHO-DPSAR algorithm were also discussed from the aspects of SAR data temporal and spatial resolution, rice phenology, and surface landscape complexity.
Rice is one of the most important food crops for mankind and the staple food for nearly half of the world’s population, especially in East Asian countries with large populations and limited arable land per capita (Corcione et al., 2016; Xie and Chen, 2019; Han et al., 2022). Sufficient food supply is the foundation of human survival, social stability and economic development (Zheng et al., 2016). Meantime, rice is an important source of agricultural carbon emissions, which releases carbon in the form of greenhouse gases such as CO2, CH4, and N2O during its growth (Chen and Pan, 2022; Lin et al., 2022). The development of low-carbon agriculture is an important measure to achieve the goal of comprehensive energy conservation and emission reduction (Lin et al., 2022). Therefore, monitoring the rice planting area is the basis for the government to accelerate the construction of a modern, low-carbon rice industry system, and to promote the continuous increase of farmers’ income and the sustainable development of the rice industry. Timely and accurate mapping of paddy fields is of great significance for assisting in formulating food policies, ensuring food supply, promoting carbon emission reduction and developing smart agriculture.
Compared with the traditional rice identification methods based on field investigation, the application of optical remote sensing technology in agricultural monitoring is becoming increasingly mature (Yin et al., 2019; Zhu et al., 2022). Optical spectral reflectance, vegetation indices and rice phenological parameters can be used to map rice fields. The optical spectral reflectance of rice fluctuates with the rice nutrient conditions and canopy structure change (He et al., 2021). The spectral indices constructed based on spectral reflectance data can highlight the physical and chemical parameters and growth conditions of rice. Among them, vegetation indices are indicators that reflect rice growth status and canopy coverage, such as the Normalized Difference Vegetation Index (NDVI; Belgiu and Csillik, 2018; Belgiu et al., 2021), and Enhanced Vegetation Index (EVI; Cao et al., 2020). Rice phenological parameters can reflect the growth rhythm of rice that is different from other crops (Zhang and Lin, 2019; Ni et al., 2021). Previous researches have released global land cover datasets based on spectral reflectance and spectral indices using MODIS, Envisat and Sentinel-2 data. Representative datasets are MCD12Q1 (Sulla-Menashe et al., 2019), GlobCover (Arino et al., 2008) and FROM-GLC (Gong et al., 2012), all contain farmland distribution information. However, the spatial resolution of the MCD12Q1 and GlobCover datasets is only 500 m and 300 m, respectively. And none of the three datasets distinguish specific crop types. In addition, the MCD12Q1, GlobCover and FROM-GLC datasets were updated to 2019, 2009, and 2017, respectively. Eventually, optical remote sensing is easily affected by weather conditions, cannot obtain information on objects occluded by clouds and cloud shadows, and cannot ensure that satellite data is obtained in the best phenological stage for rice identification, which makes it difficult to reconstruct the optical remote sensing time series curve, and affects the accuracy of rice identification.
In contrast to optical remote sensing, synthetic aperture radar (SAR) has proven to be an attractive alternative for rice monitoring and mapping due to the independence of SAR signals from the cloud and solar radiation (Torbick et al., 2017; Pan et al., 2021). Many studies have used single-temporal SAR backscatter characteristics to monitor rice (Gao et al., 2019), whereas single-temporal SAR data usually results in low identification accuracy due to missing key phenological stage information (Lopez-Sanchez et al., 2012; Li et al., 2014). Compared with single-temporal SAR data, multi-temporal or time-series SAR data can capture phenological information about rice in the whole growth cycle, thereby contributing to improving rice identification accuracy (Yang et al., 2017, 2018; Csorba et al., 2019; Chandra Paul et al., 2020; Pang et al., 2021; Zhan et al., 2021). At present, most studies on rice identification using SAR have focused on the flat terrain areas where rice fields are concentrated and large-sized, such as the Mekong Delta (Bouvet and Le Toan, 2011; Clauss et al., 2018), Bangladesh (Panigrahy et al., 2012), Vijayawada in India (Mandal et al., 2020), and Northeast China and the Middle and Lower Yangtze Valley Plain (Zhan et al., 2021). However, in the mountainous and hilly areas represented by Chongqing, timely and accurate paddy rice identification based on remote sensing faces many difficulties and challenges for the following reasons: (1) Chongqing city is located in the transition zone between the rice growing area in southwest China and the rice growing area in the middle and lower reaches of the Yangtze River (Lisan, 1993), and the terrain is mainly mountainous and hilly. Therefore, the fields in Chongqing are small and scattered. In most cases, a pixel contains multiple land types, forming a mixed pixel. (2) Mountain topography and great altitude differences lead to large differences in water and heat conditions in various regions, inconsistent rice planting times, and inconsistent rice phenology. Therefore, the best time to identify rice varies from region to region. (3) Chongqing is located in the subtropical monsoon humid climate zone. Under the combined effect of climate, topography and water vapor from the Yangtze River, the annual average foggy days in Chongqing are as high as 104 days. Therefore, it is difficult to obtain high-quality optical remote sensing images. Due to these challenges, few researchers have conducted satellite-based rice monitoring in Chongqing.
In addition, given the inherent speckle noise of SAR images, the mixed pixels and pixel heterogeneity at the edge of rice fields, the recognition accuracy of rice still needs to be further improved. Previous studies showed that spatial domain filtering can reduce the influence of speckle noise in SAR data, and time series smoothing methods [Gaussian fitting (Bazzi et al., 2019), Savitzky–Golay filtering (Krishnan and Seelamantula, 2013), double logistic regression (Zheng et al., 2016), etc] can be used to reconstruct time series SAR data (Zeng et al., 2020). Both are beneficial to improving rice identification accuracy. Moreover, compared with the pixel-based method, the object-based classification method can avoid a large number of broken patches in the classification results and can obtain more accurate mapping results in the application of crop classification (Peña-Barragán et al., 2011; Belgiu and Csillik, 2018). Therefore, this paper focuses on solving the difficulties of high-precision rice identification in Chongqing due to factors such as cloudy and foggy weather (annual average of 104 days of cloudy and foggy weather), fragmented and small- and middle-sized rice fields, large fluctuations in terrain, significant differences in precipitation and temperature within the region, and large changes in rice phenological information.
The main research objectives of this study are to: (1) reconstruct the Sentinel-1 SAR time-series backscatter data, and suppress inherent speckle noise in SAR data, (2) calculate multi-characteristic parameters and analyze the separability of rice and other land cover types in each feature image, (3) propose a rice identification algorithm combining multi-characteristic parameters and homogeneous objects based on time series dual-polarization SAR (MPHO-DPSAR), (4) generate an annual map of rice fields in Chongqing in 2020.
Chongqing is located in the southwest of China, in the upper reaches of the Yangtze River, between 105°11′E ~ 110°11′E and 28°10’N ~ 32°13’N, and has an area of 82,400 km2. The elevation span is large (73.1–2796.8 m) and the terrain is strongly undulating. So, the landforms are various, mainly mountains, hills, tablelands, and flatlands. Specifically, in Chongqing, 38.61% of the areas are below 500 m, 25.41% are between 500 and 800 m, 20.42% are between 800 and 1,200 m, and 15.56% are over 1,200 m (Figure 1).
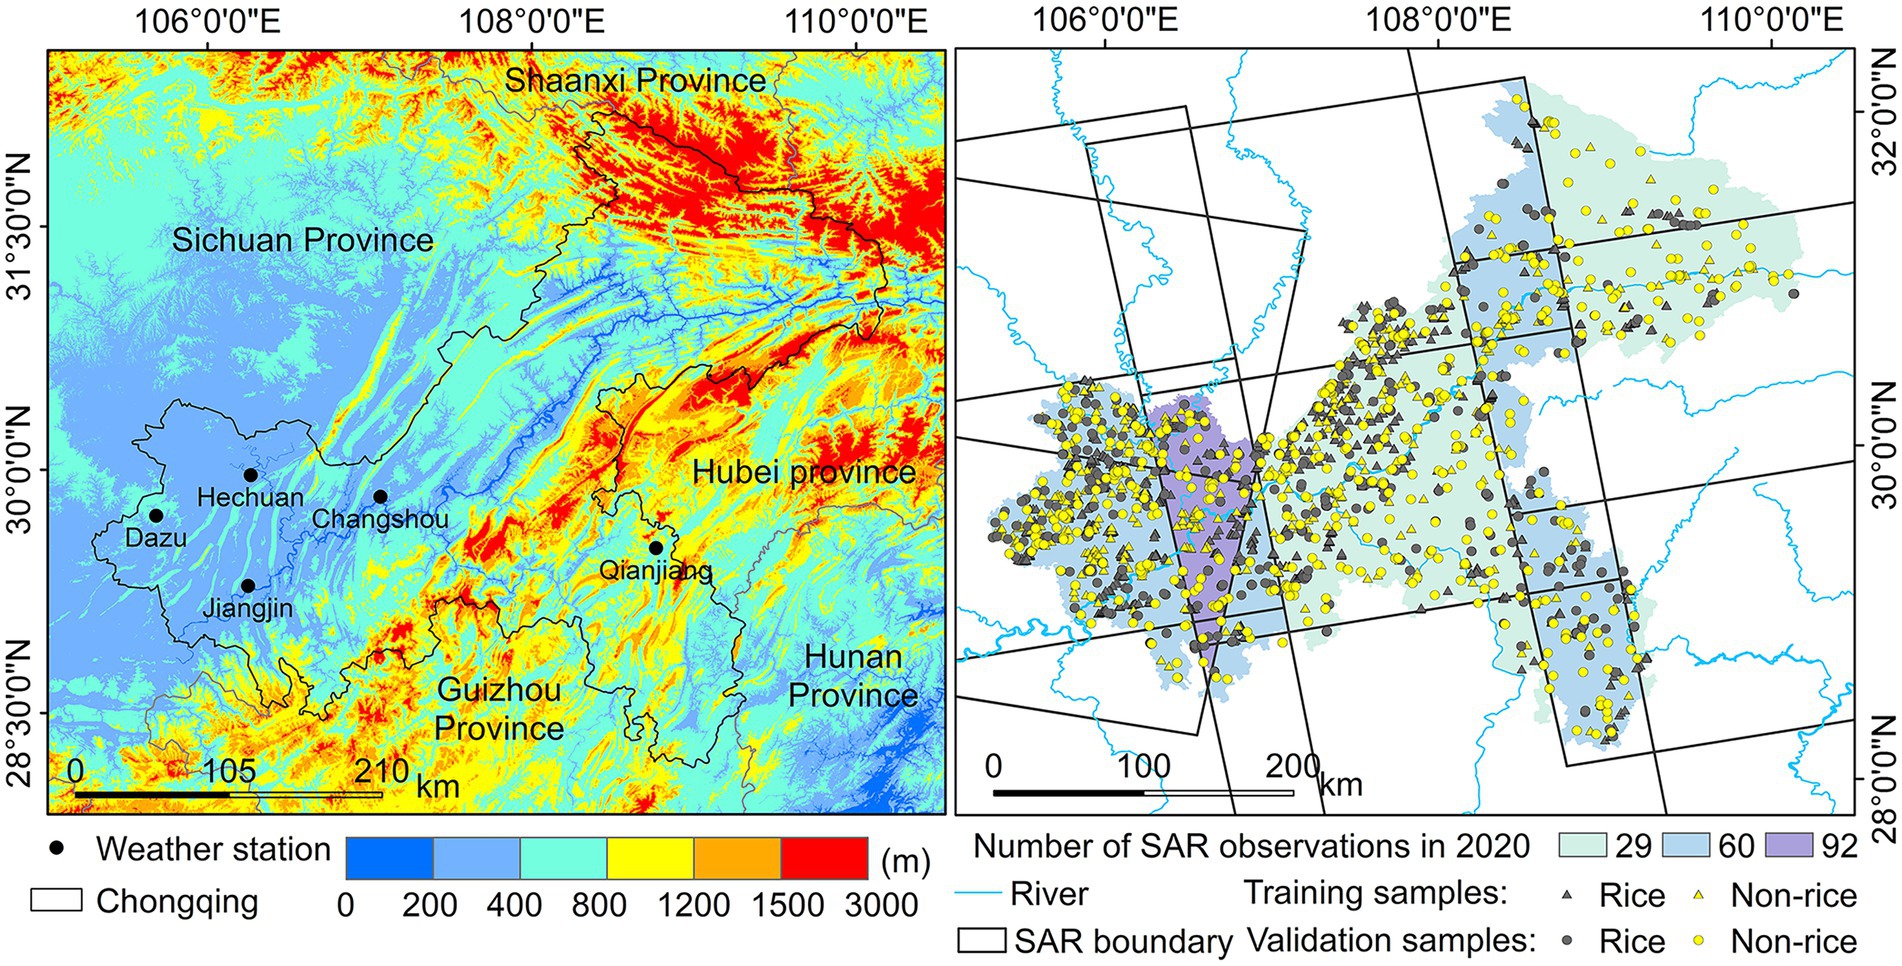
Figure 1. Topography of the study area, spatial range of SAR observations and spatial distribution of sample points.
In terms of climate, Chongqing has a humid subtropical monsoon climate, with an annual average sunshine duration of 1,000–1,400 h, which is one of the areas with the least annual sunshine in China. The annual average temperature, annual precipitation, and annual sunshine duration vary greatly within the study area (Table 1). Affected by the topography and climate, the annual average foggy day in Chongqing is 104 days a year, so it is known as the “Fog City.”
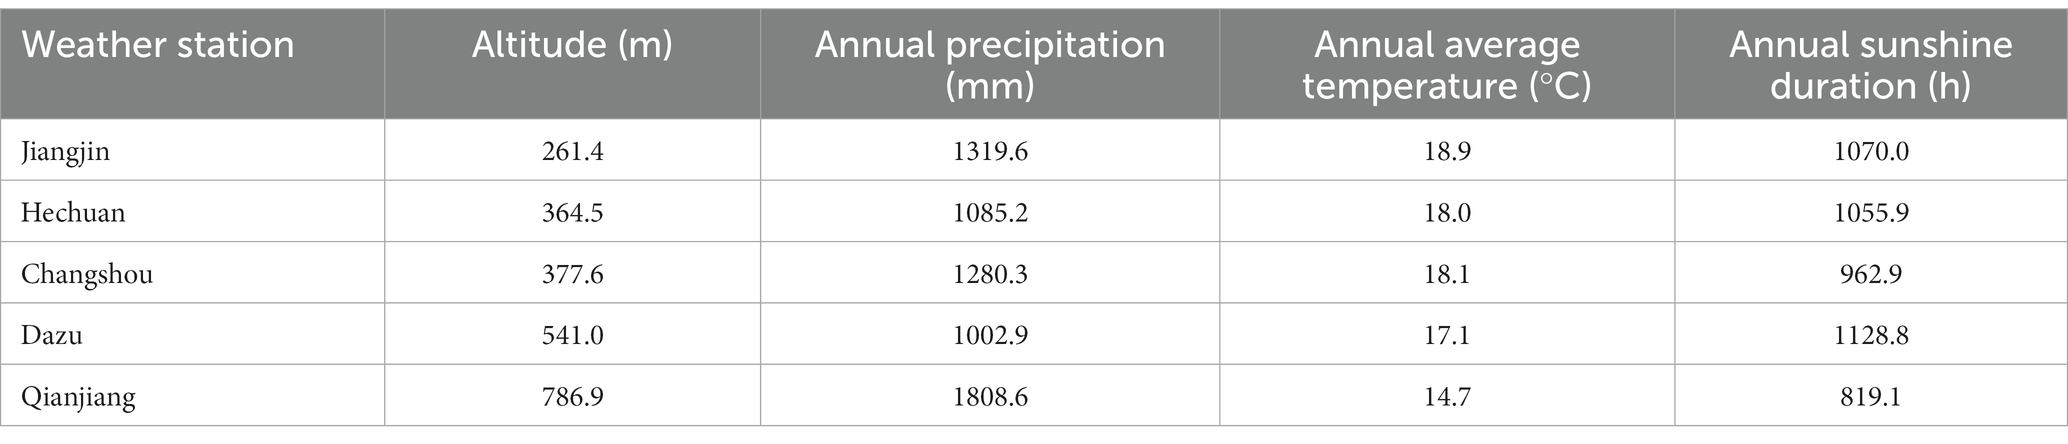
Table 1. The annual average temperature, annual precipitation, and annual average sunshine duration in Chongqing in 2020.
The main crops in Chongqing are rice, corn, and wheat, of which the distribution area of rice is 655,000 hm2, accounting for 32.9% of the planting area of all grain crops (Chongqing Statistics Bureau, 2020). In recent decades, many cultivated lands have been converted into construction land due to urbanization or returned to forest or grasslands due to ecological restoration, resulting in a rapid decline in the rice field area. From 2000 to 2020, the rice fields area in Chongqing dropped from 780,000 hm2 to 660,000 hm2 (Chongqing Statistics Bureau, 2020). The crop phenology data measured by the Chongqing Institute of Meteorological Sciences showed that the rice is single-season rice. The sowing and transplanting stage of rice is from March to mid-May, the growth stage is from mid-May to mid-August. Specifically, the growth stage includes five specific stages: the tillering stage, jointing stage, booting stage, heading stage and milk-ripe stage. The mature harvest stage is from mid-August to late September. As for corn, the sowing stage is from mid-March to late May, the growth stage is from June to early August, and the harvest is from late August to early September. For wheat, the sowing stage is in November and the harvest stage is in April of the following year.
Sentinel-1A SAR is a C-band radar imaging system developed by the European Commission (EC) and the European Space Agency (ESA) and launched in 2014. The Sentinel-1A SAR has four imaging modes and can produce dual-polarization data. A total of 411 scenes Level-1 Ground range detected image of Interferometric Wide Swath (IW) SAR with dual-polarization (VV and VH) in 2020, covering Chongqing were applied, a spatial resolution of 10 m and a temporal resolution of 12 days. The temporal resolution of overlapping regions of adjacent images is less than 12 days (Figure 1).
Sentinel-1 SAR image data preprocessing included four main steps. (1) The SAR image pixel values were converted into the backscatter coefficient δ0 by radiometric calibration. (2) Correction of SAR image distortion caused by terrain changes and sensor tilt was performed through range Doppler terrain correction. (3) A 3 × 3 mean filter was used to smooth the SAR image to reduce noise and improve the quality of the SAR image. (4) Backscatters to dB (Eq. 1) is a logarithmic transformation of the backscatter coefficient, so that the SAR image histogram approximates a Gaussian distribution, and the number of data storage bits becomes smaller, which is also conducive to data analysis and visualization.
where δ0 is the original backscatter coefficient, δ is the backscatter coefficient after backscatters to dB.
Other auxiliary data include DEM data, multispectral images, field survey data, Google Earth high-resolution imagery, and agricultural statistics.
The DEM data was collected by the advanced land observing satellite (ALOS) L-band SAR with a horizontal and vertical accuracy of 12.5 meters. Multispectral images from an unmanned aerial vehicle (UAV) and field survey data were acquired from July 30 to August 3, 2020. The UAV equipment is a DJI Phantom 4Pro, and the obtained multispectral images include blue, green, red, red edge, and near-infrared bands. The sample point collection device is a handheld GPS locator, with a positioning accuracy of about 1 m, and a total of 400 sample points were collected (Figure 1). Google Earth high-resolution imagery was used as an auxiliary data source for 2060 sample points selection through visual interpretation (Figure 1). Among them, the training and validation samples of rice are 600 and 500, respectively. Non-rice includes 4 sub-categories (build, forest, and grasslands, water bodies, dry land (wheat/corn)). Each sub-category has 200 training samples, a total of 800, and 140 validation samples, a total of 560. The agricultural statistics refer to the area of rice fields in all districts and counties in Chongqing in 2020, obtained from the statistical yearbook, and used for subsequent evaluation of rice identification accuracy at the district/county level.
The rice field map was generated based on the Sentinel-1 dual-polarization SAR backscatter time series and ALOS-12.5 m DEM. We first performed SG filtering on the preprocessed SAR image to construct smooth VH backscatter time-series. We first performed SG filter to reconstruct the time series Sentinel-1 image to construct a smooth VV and VH backscatter coefficient time series data set, and analyzed the unique temporal backscatter characteristics of rice. Further, the MPHO-DPSAR algorithm combining multi-feature parameters and homogeneous objects was established for mapping rice fields. The accuracy evaluation of the rice fields map was carried out on three levels, namely district/county level, object level, and rice field level. The technical route is shown in Figure 2.
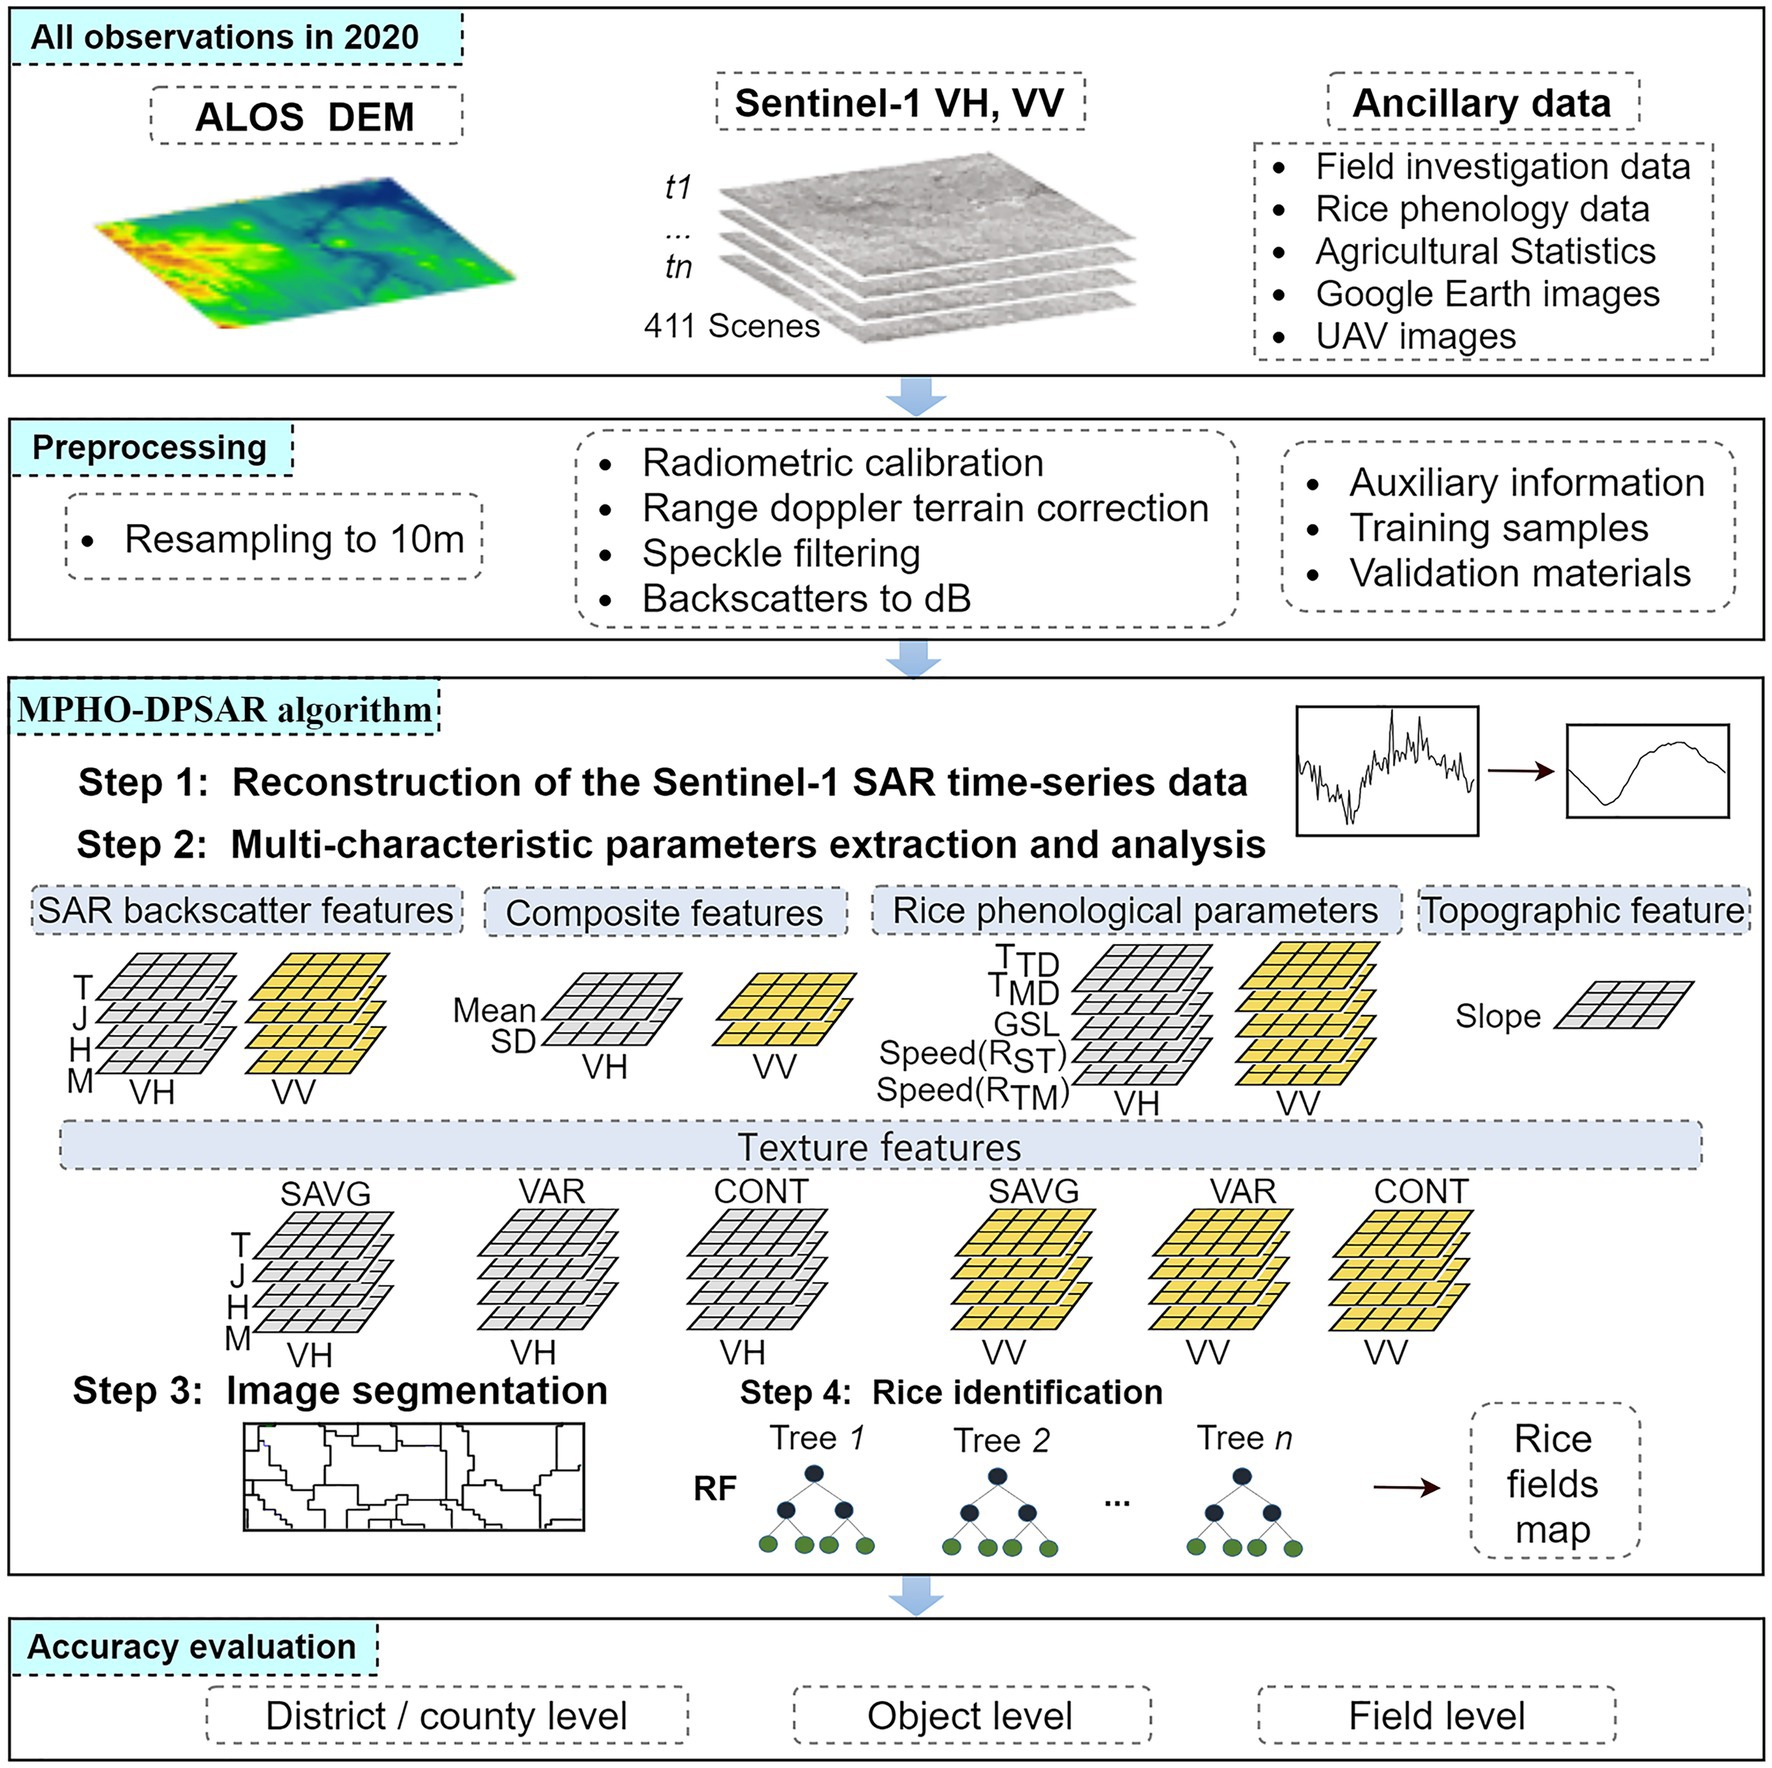
Figure 2. Schematic flow of MPHO-DPSAR method, T, J, H, and M denote the rice transplanting, jointing, heading, and mature stage, respectively.
Although the mean filter had been applied in the SAR image to reduce speckle noise, some noises still existed in the backscatter coefficient image due to the influence of the coherent superposition of scattering from multiple targets. At the transplanting stage and early growth stage of rice, the backscatter intensity of shallow water and land areas with high water content is similar to that of rice fields, which increases the difficulty of rice identification (Nguyen et al., 2015; Son et al., 2021). In addition, rainfall will reduce the radar backscatter intensity, which will disturb the rice time-series curve of the backscatter intensity in different polarizations SAR, resulting in an inaccurate change rule of the SAR backscatter coefficient of rice growth (Yu et al., 2020). Therefore, in order to make the SAR backscatter information more accurately reflect the rice growth rhythm and minimize the influence of noise and other environmental factors, we reconstructed the Sentinel-1 SAR time-series backscatter data.
The method of combining mean value compositing and the Savitzky–Golay (SG) filtering algorithm was used for the reconstruction of the sentinel-1 SAR time-series backscatter data. We first performed a 12-day mean value compositing of the backscatter coefficient to alleviate the fluctuation. Secondly, SG filtering (Krishnan and Seelamantula, 2013, Gir et al., 2015) was used to obtain the variation trend of the SAR backscatter coefficient time series. The length of the SG filter fitting window and the polynomial fitting times were set to 3 and 3 respectively, which can ensure that the noise of the time series data was effectively suppressed, and the various characteristics of the time series backscatter coefficient can be preserved to the maximum extent. Figure 3 showed the reconstruction results of the time-series SAR VH backscatter coefficients of rice. Compared with the original VH backscatter profile, noise and outliers caused by environmental factors were weakened, and the reconstructed backscatter coefficient time series curve can more clearly reflect the intensity-changing trend with rice growth.
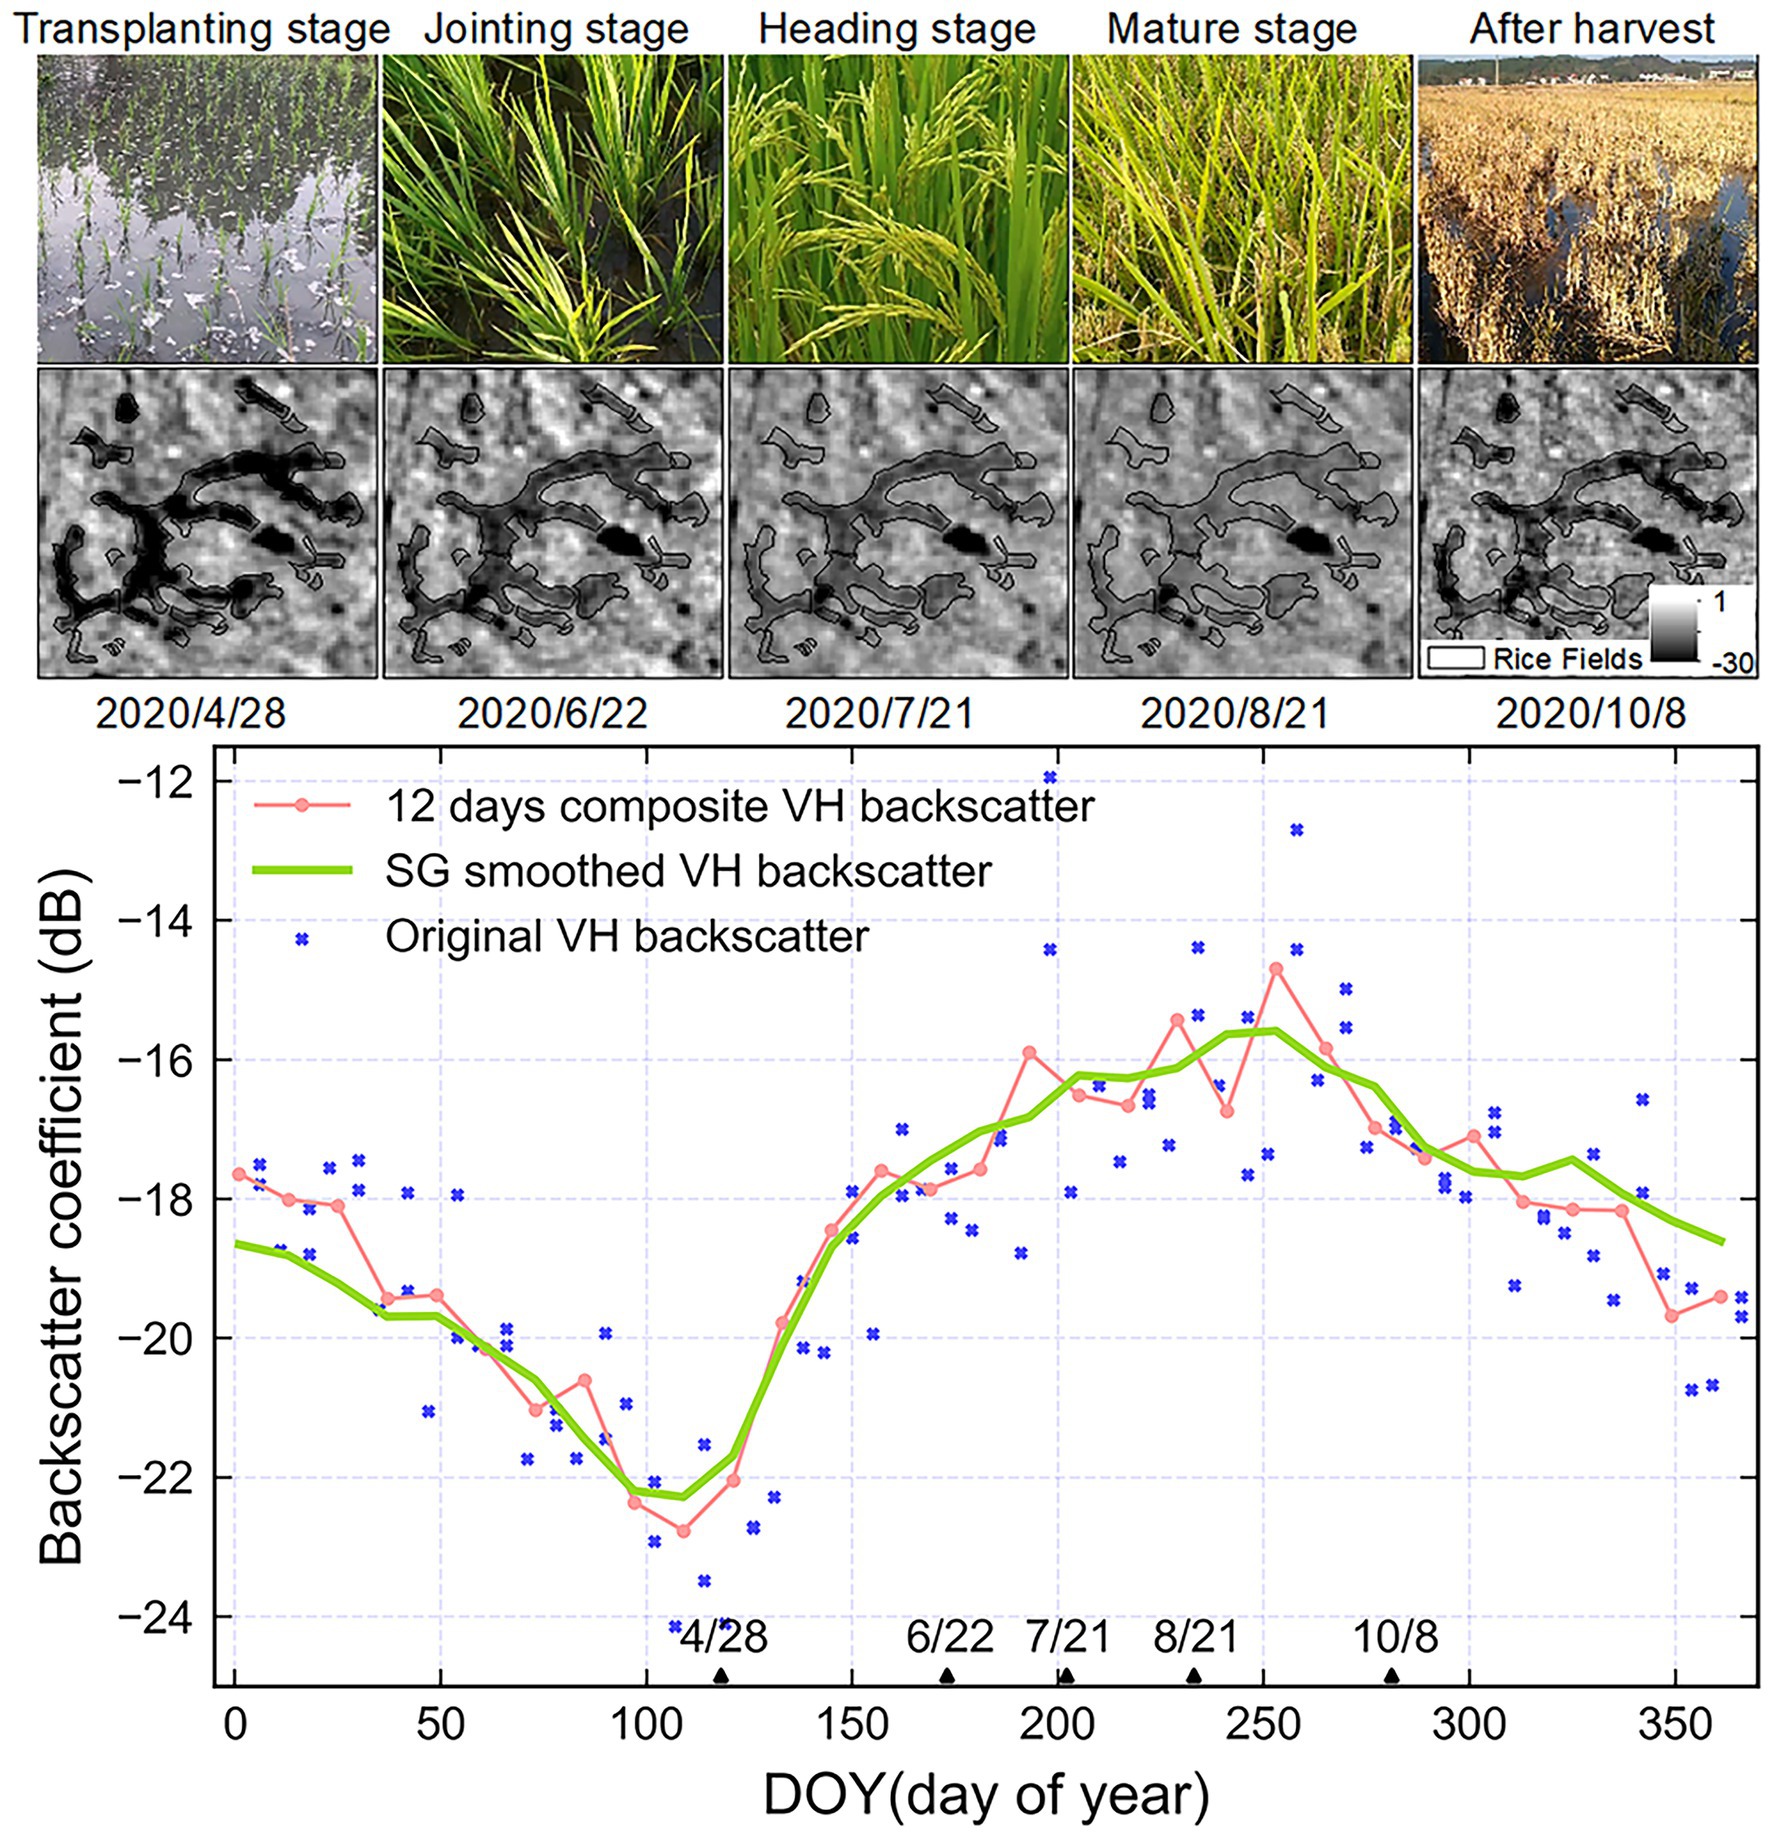
Figure 3. Rice fields status at key phenological stages and reconstruction of the sentinel-1 SAR time-series backscatter characteristics.
The varying backscatter signature of rice were presented throughout the whole growth cycle. The overall performance was a trend of first falling, then rising and then falling (Figure 4). Specifically, the sowing stage of rice begins in early March (DOY 61), rice fields are submerged for land preparation, field topography leveling and weeding to provide a suitable environment for rice planting. At this stage, the humidity of the rice fields gradually increases, the roughness gradually decreases. The specular reflection is the main backscatter mechanism, which makes the SAR backscatter coefficient drop rapidly from −19 dB to −24 dB (the lowest value). At the stage of rice transplanting in mid-to-late April (DOY 110), the rice seedlings are relatively short and their distribution is very sparse. Also, the water content of the rice fields is high, which triggers the backscatter mechanism to be dominated by specular reflection with less volume scattering and double scattering. Accordingly, the backscatter coefficient begins to gradually increase. At the stage of rice jointing period in mid-June (DOY 160), rice grows taller rapidly with the number of leaves, biomass and roughness of rice fields gradually increasing. The main backscatter mechanisms transform to volume scattering from the rice canopy, double scattering between the rice stem and the underlying surface of the rice field, and specular reflection from the water body in the rice field (Torbick et al., 2017; Son et al., 2021). The VH backscatter coefficient accordingly increased from −24 dB to about −18 dB. In late July (DOY 200), rice began to head, with higher plant height and more leaves. The leaves almost completely cover the water body of the rice fields. Double scattering is reduced and the backscatter mechanism is mainly volume scatter. The backscatter intensity of rice fields continued to increase, reaching about −17 dB. Rice matures in mid-to-late August, the backscatter intensity accordingly reaches the maximum (−15 dB). Then as the rice ears drop and the leaves turn yellow, the backscatter intensity of the rice fields correspondingly decreases. After the rice harvest, the backscatter intensity of rice fields continues to decrease. If its water content is high, the backscattering coefficient will be lower, close to that of water.
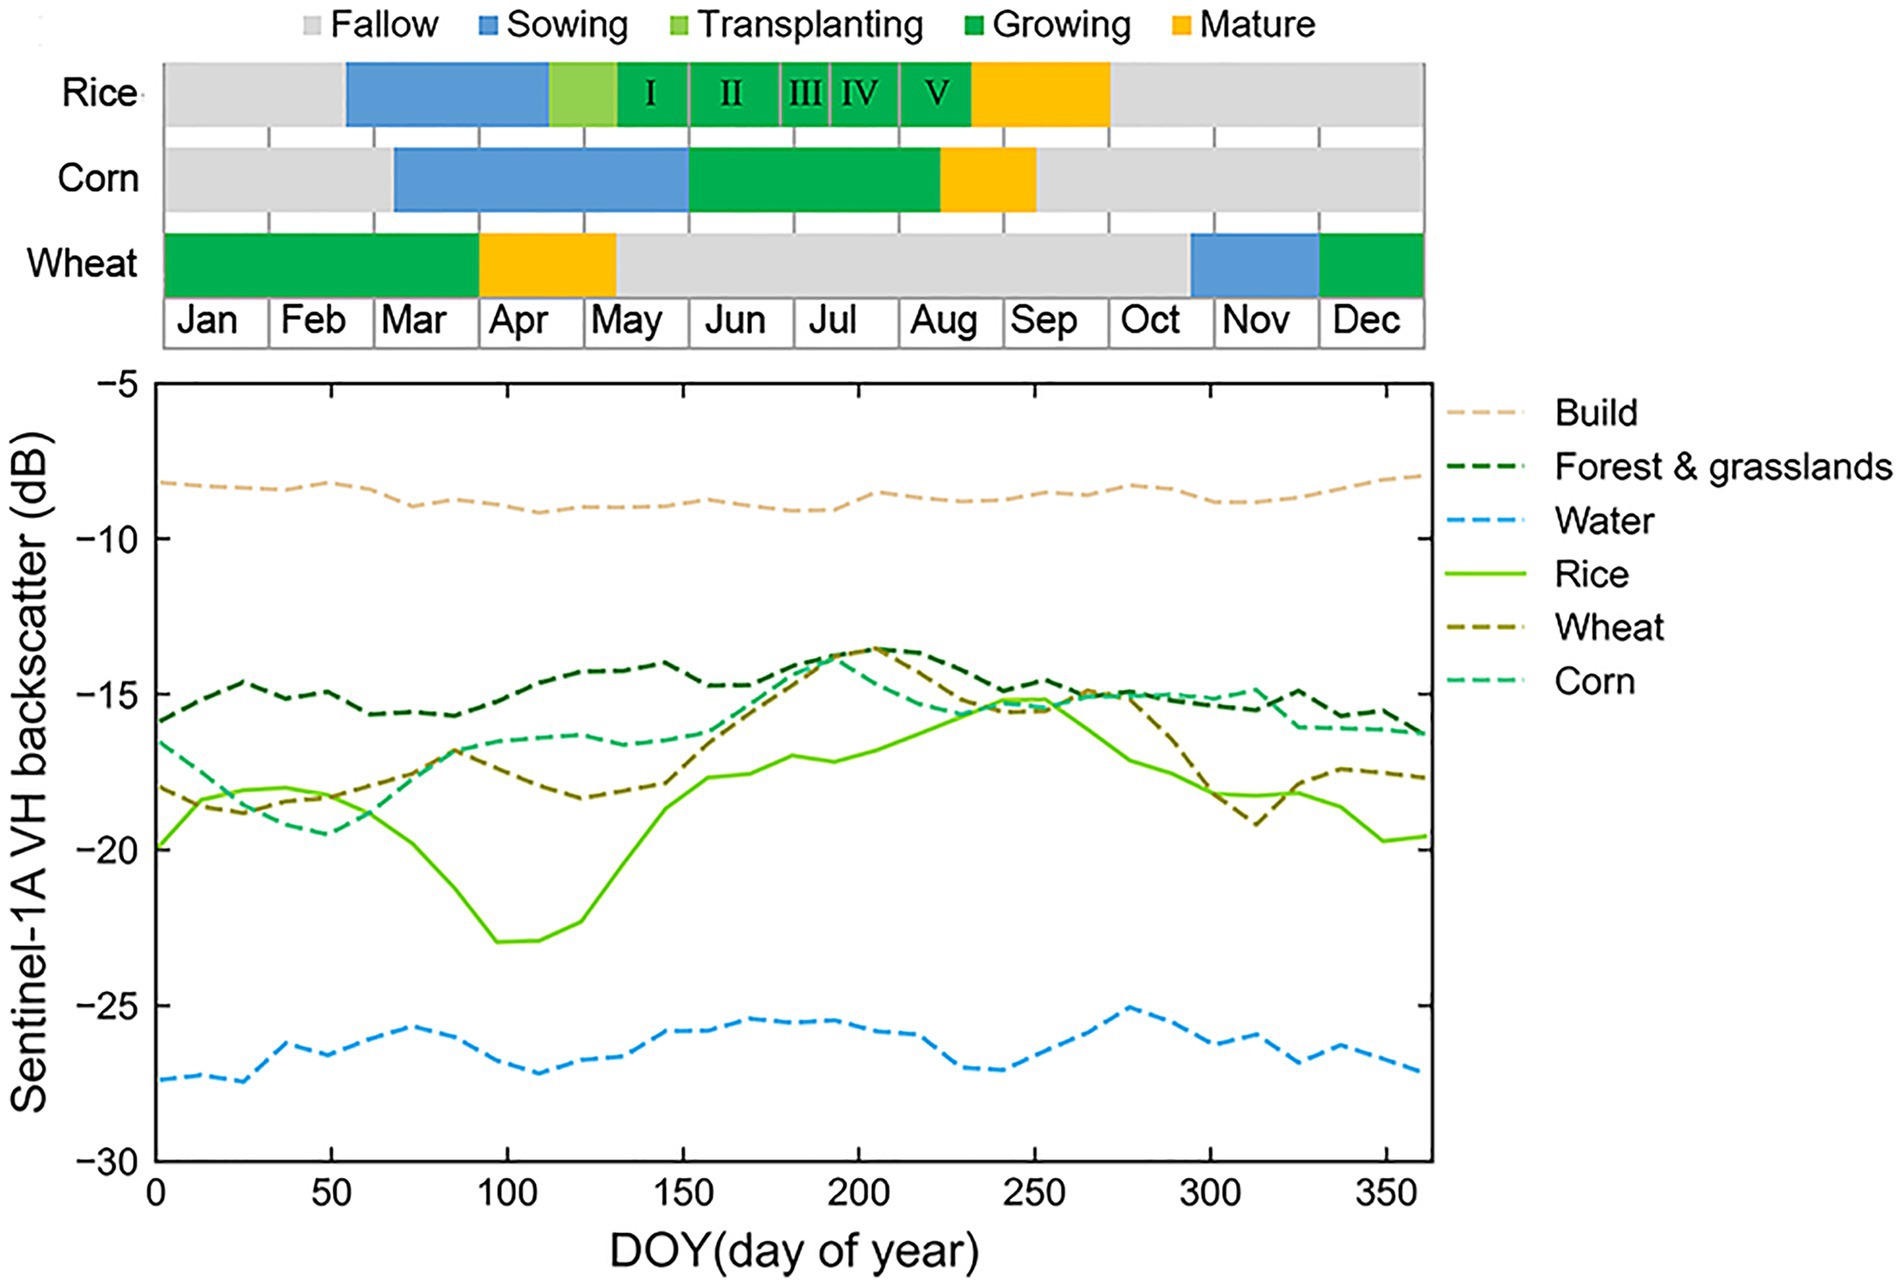
Figure 4. Main crop cropping calendar and temporal characteristics of VH backscatter for rice and other land types. I, II, III, IV, and V denote the tillering stage, jointing stage, booting stage, heading stage and milk-ripe stage of rice, respectively.
The variation characteristics of SAR backscatter coefficient curves of rice and other land cover types are different (Figure 4). Because double scattering occurs primarily in built-up areas, the backscatter coefficient was correspondingly high and remained stable at around −9 dB throughout the year. Specular reflection occurs mostly in water bodies, the backscatter coefficient was correspondingly less than −25 dB. The interaction between electromagnetic waves and forest/grasslands mainly produces volume scattering, thus the backscatter coefficient fluctuated around −15 dB. As for the corn at the stage of sowing and jointing (DOY70-150), its backscatter mechanism is mainly rough surface scattering and double scattering between corn stem and underlying surface. The backscatter coefficient varied slowly between −16 and -17 dB. At the stage of jointing to mature (DOY 150–200), the backscatter mechanism mainly transforms to volume scattering from corn canopy. The backscatter coefficient correspondingly increased to about -14 dB. Then the backscatter coefficient began to decrease after harvest. As for the wheat, the backscatter coefficient in its phenological period (DOY330-DOY130 in the following year) was basically between −19.5 and −16.5 dB.
In terms of the difference in temporal backscattering characteristics between rice and other land types, it gradually increased before the rice transplanting stage. From the rice transplanting stage to the mature stage, it gradually decreased. Specifically, in the middle and late August when rice entered the mature stage, the backscatter coefficients of forest/grasslands, corn and wheat were basically the same as those of rice, but the separability of rice and water was the highest.
Considering the special phenological characteristics of rice, the complex topographic conditions and surface landscape of Chongqing, multi-characteristic parameters were extracted (Table 2), including SAR backscatter features, composite features, rice phenological parameters, texture features, and a topographic feature.
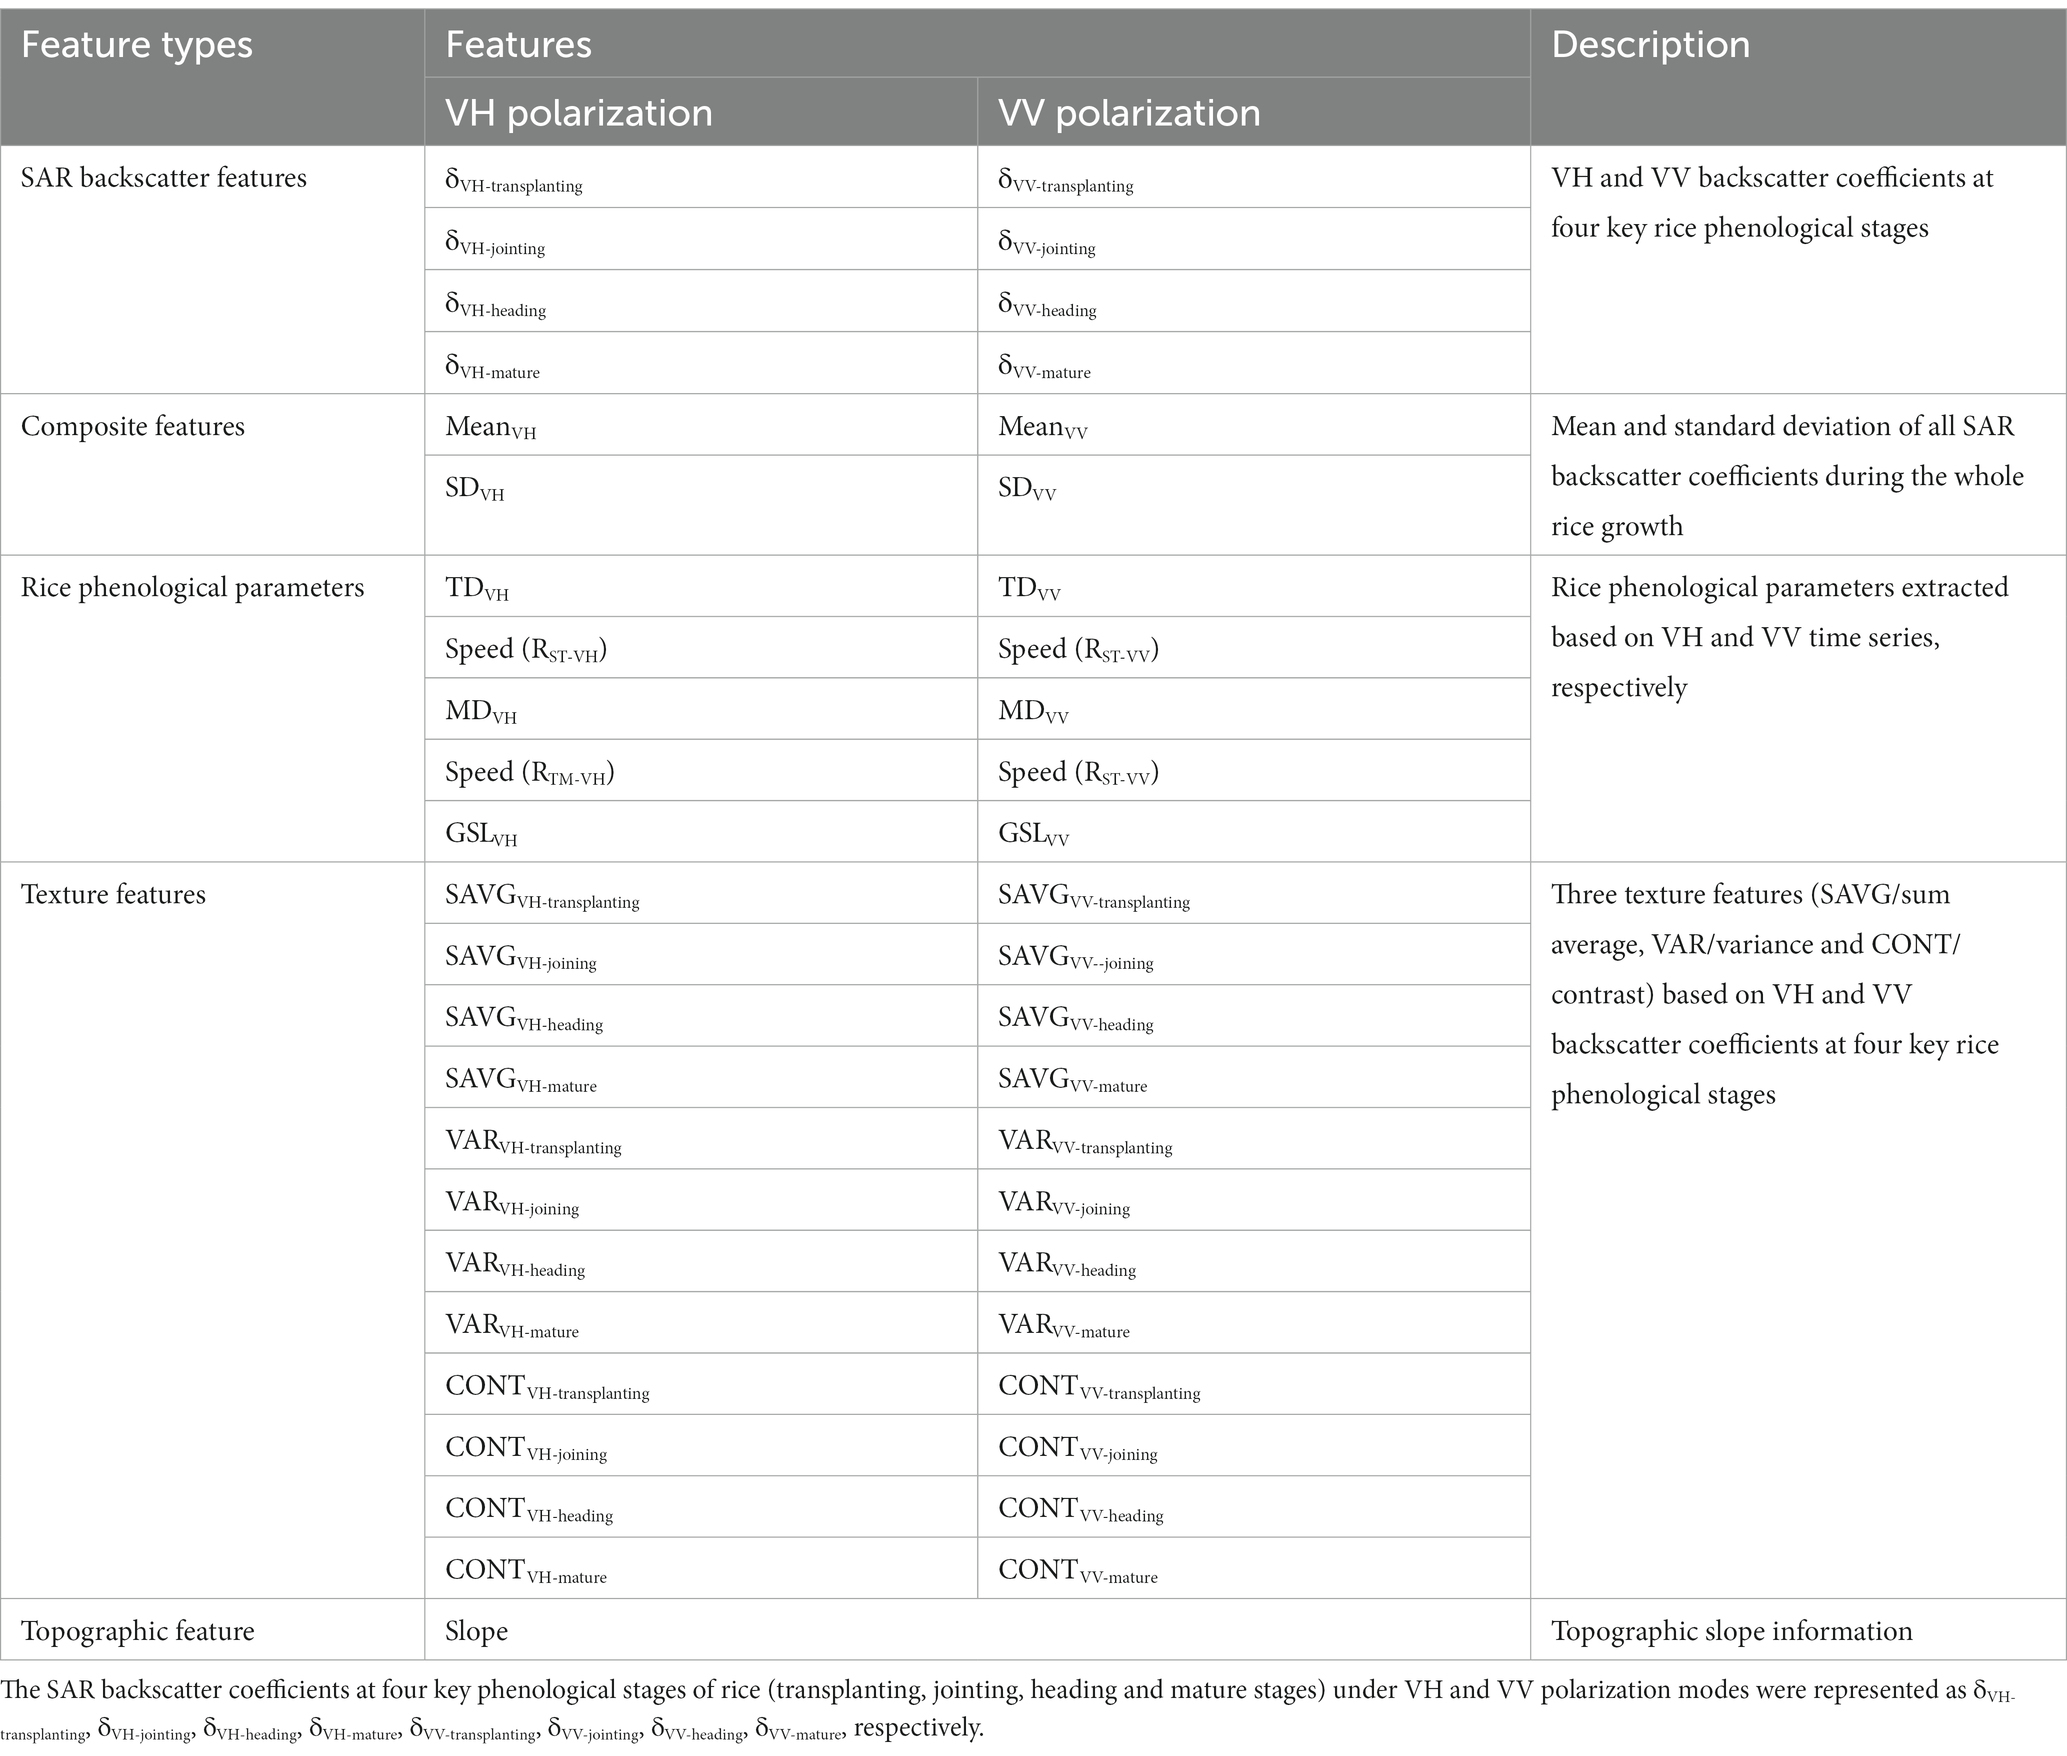
Table 2. Multi-characteristic parameters, including five types of features in this study.
The composite features included mean composite (MeanVH, MeanVV) and standard deviation composite (SDVH, SDVV) based on all Sentinel-1 VV and VH images throughout the rice growing season.
Considering the phenological characteristics of the whole life cycle of rice, we extracted five rice phenological parameters based on the backscatter coefficients of VH and VV time series (Figure 5), respectively, which are the transplanting date (TD), rice agronomy flooding decline speed (Speed (RST)), mature date (MD), green-up speed (Speed (RTM)) and growing season length (GSL). The rice transplanting date (TD) was defined as 5 days after the day of year (DOY) of the SAR backscatter reaches the local annual minima. The rice agronomy flooding decline speed (Speed (RST)) was defined as the ratio of the SAR backscatter changes over the number of days from rice field submerged date (SD) to TD. The rice mature date (MD) was defined as DOY when the SAR backscatter reaches the maximum. The green-up speed (Speed (RTM)) was defined as the ratio of the SAR backscatter changes over the number of days from rice TD to MD. The growing season length (GSL) was defined as the length from rice TD to MD (Wang et al., 2022).
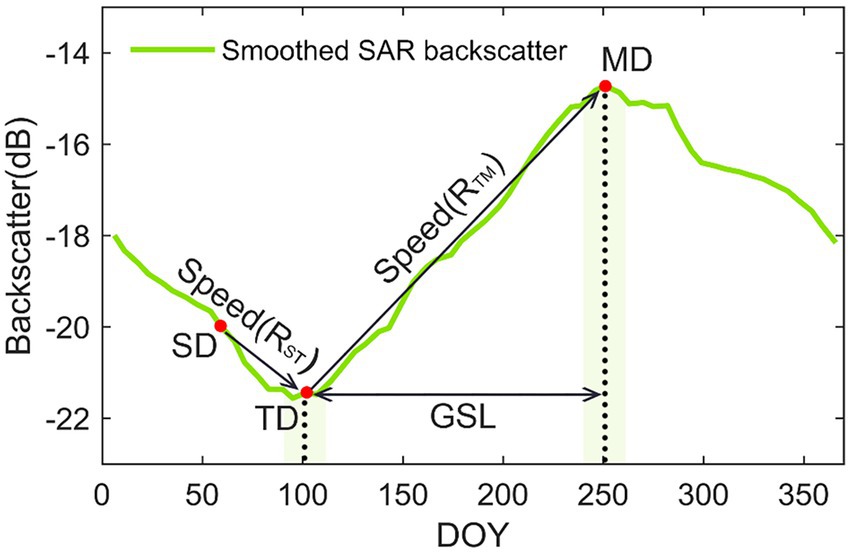
Figure 5. An VH backscatter profile of the rice field and schematic diagram of rice phenological parameters.
SAR images have significant advantages in displaying texture features (Peña-Barragán et al., 2011; Li et al., 2022). Considering data redundancy and computational efficiency, three texture parameters (SAVG/sum average, VAR/variance and CONT/contrast) were selected for rice identification according to the feature importance calculated by the random forest algorithm (Table 3).
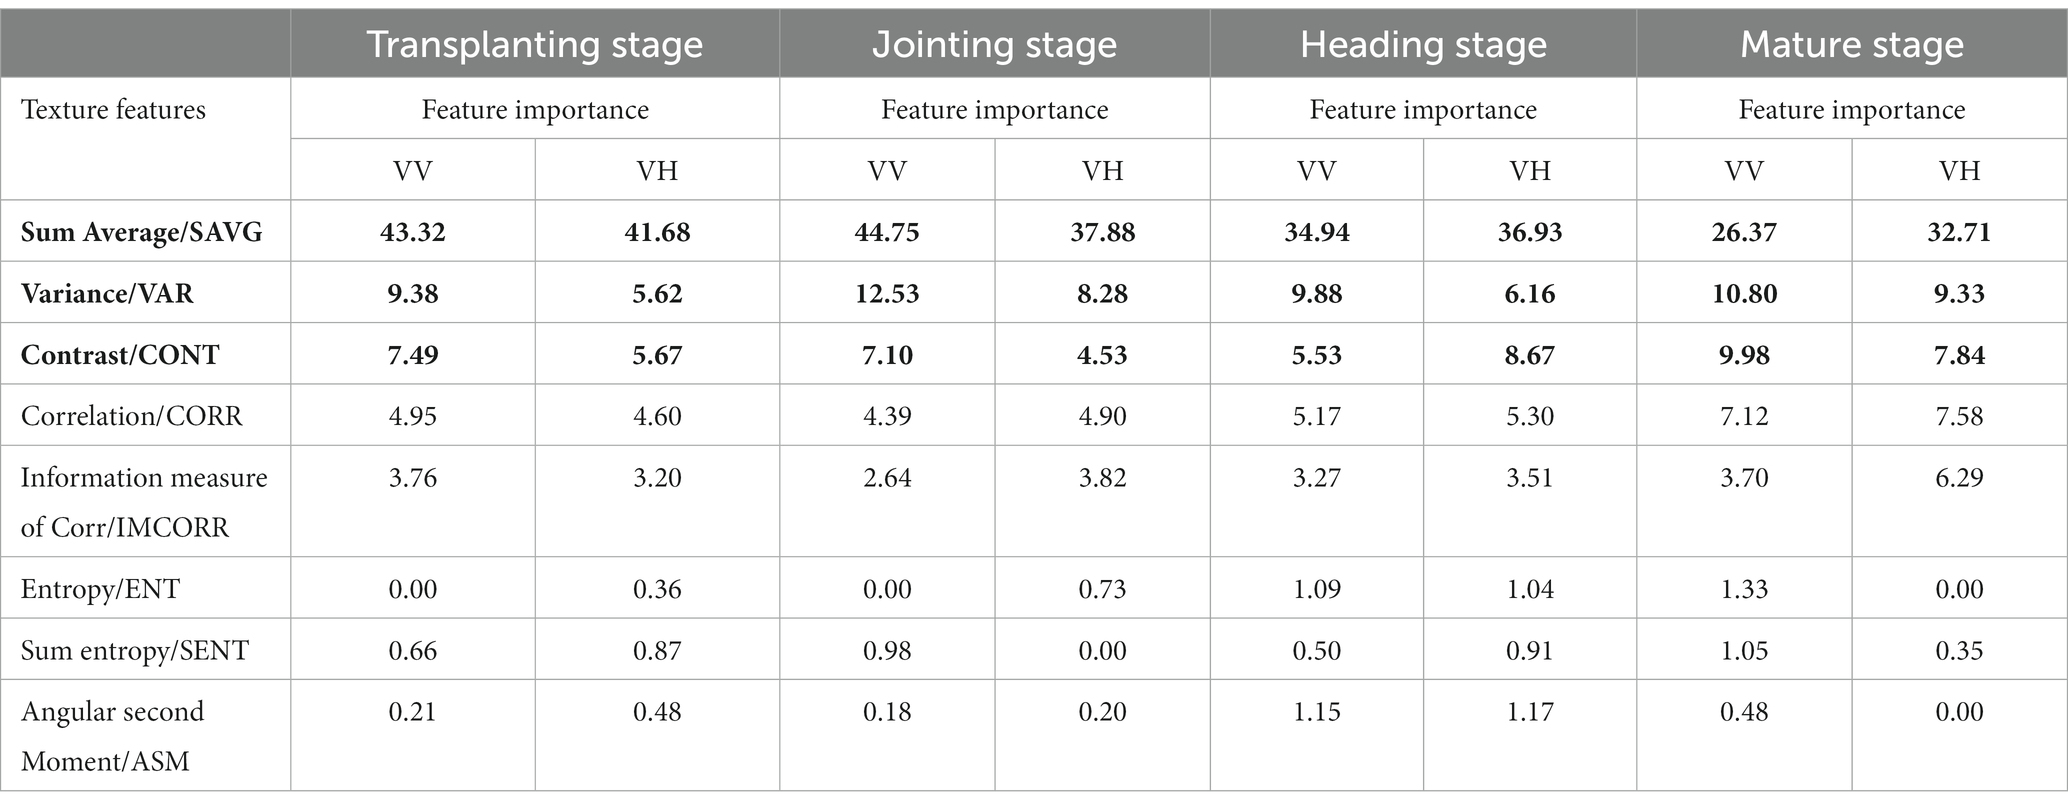
Table 3. Feature importance of texture features calculated by the random forest algorithm. The three texture features of highest importance were selected for this study (shown in bold).
The complex topographical conditions lead to the rice fields being fragmented and dominated by small- and medium-sized. Therefore, topographic slope information (Slope) was also considered.
The multi-resolution segmentation algorithm merges pixels or objects level by level from bottom to top (Dragut et al., 2014). The algorithm can effectively fuse spectral and spatial features of pixels or objects, locally minimize the average heterogeneity and maximize the internal homogeneity of objects. Thus, it is suitable for the Chongqing area with highly complex surface landscapes.
The segmentation scale determines the object size, which directly affects the accuracy of rice identification (Figure 6). Therefore, it is necessary to determine the optimal segmentation scale. The change rate of the image local variance under different segmentation scales (Figure 6) was calculated to determine the optimal segmentation scale (Drǎguţ et al., 2010). Here, the optimal segmentation scale, the local peak, was 5. In addition, the spectral weight of the backscattering coefficient ( ) is set to 0.9, and the shape weight ( ) is 0.1 in the segmentation algorithm (Eq. 2). The weight of spatial shape parameter ( ) was further divided (Eq. 3) by the compactness ( ) of 0.8, and the smoothness ( ) of 0.2 (Drǎguţ et al., 2010; Dragut et al., 2014).
where is the weight of color and is the weight of compactness.
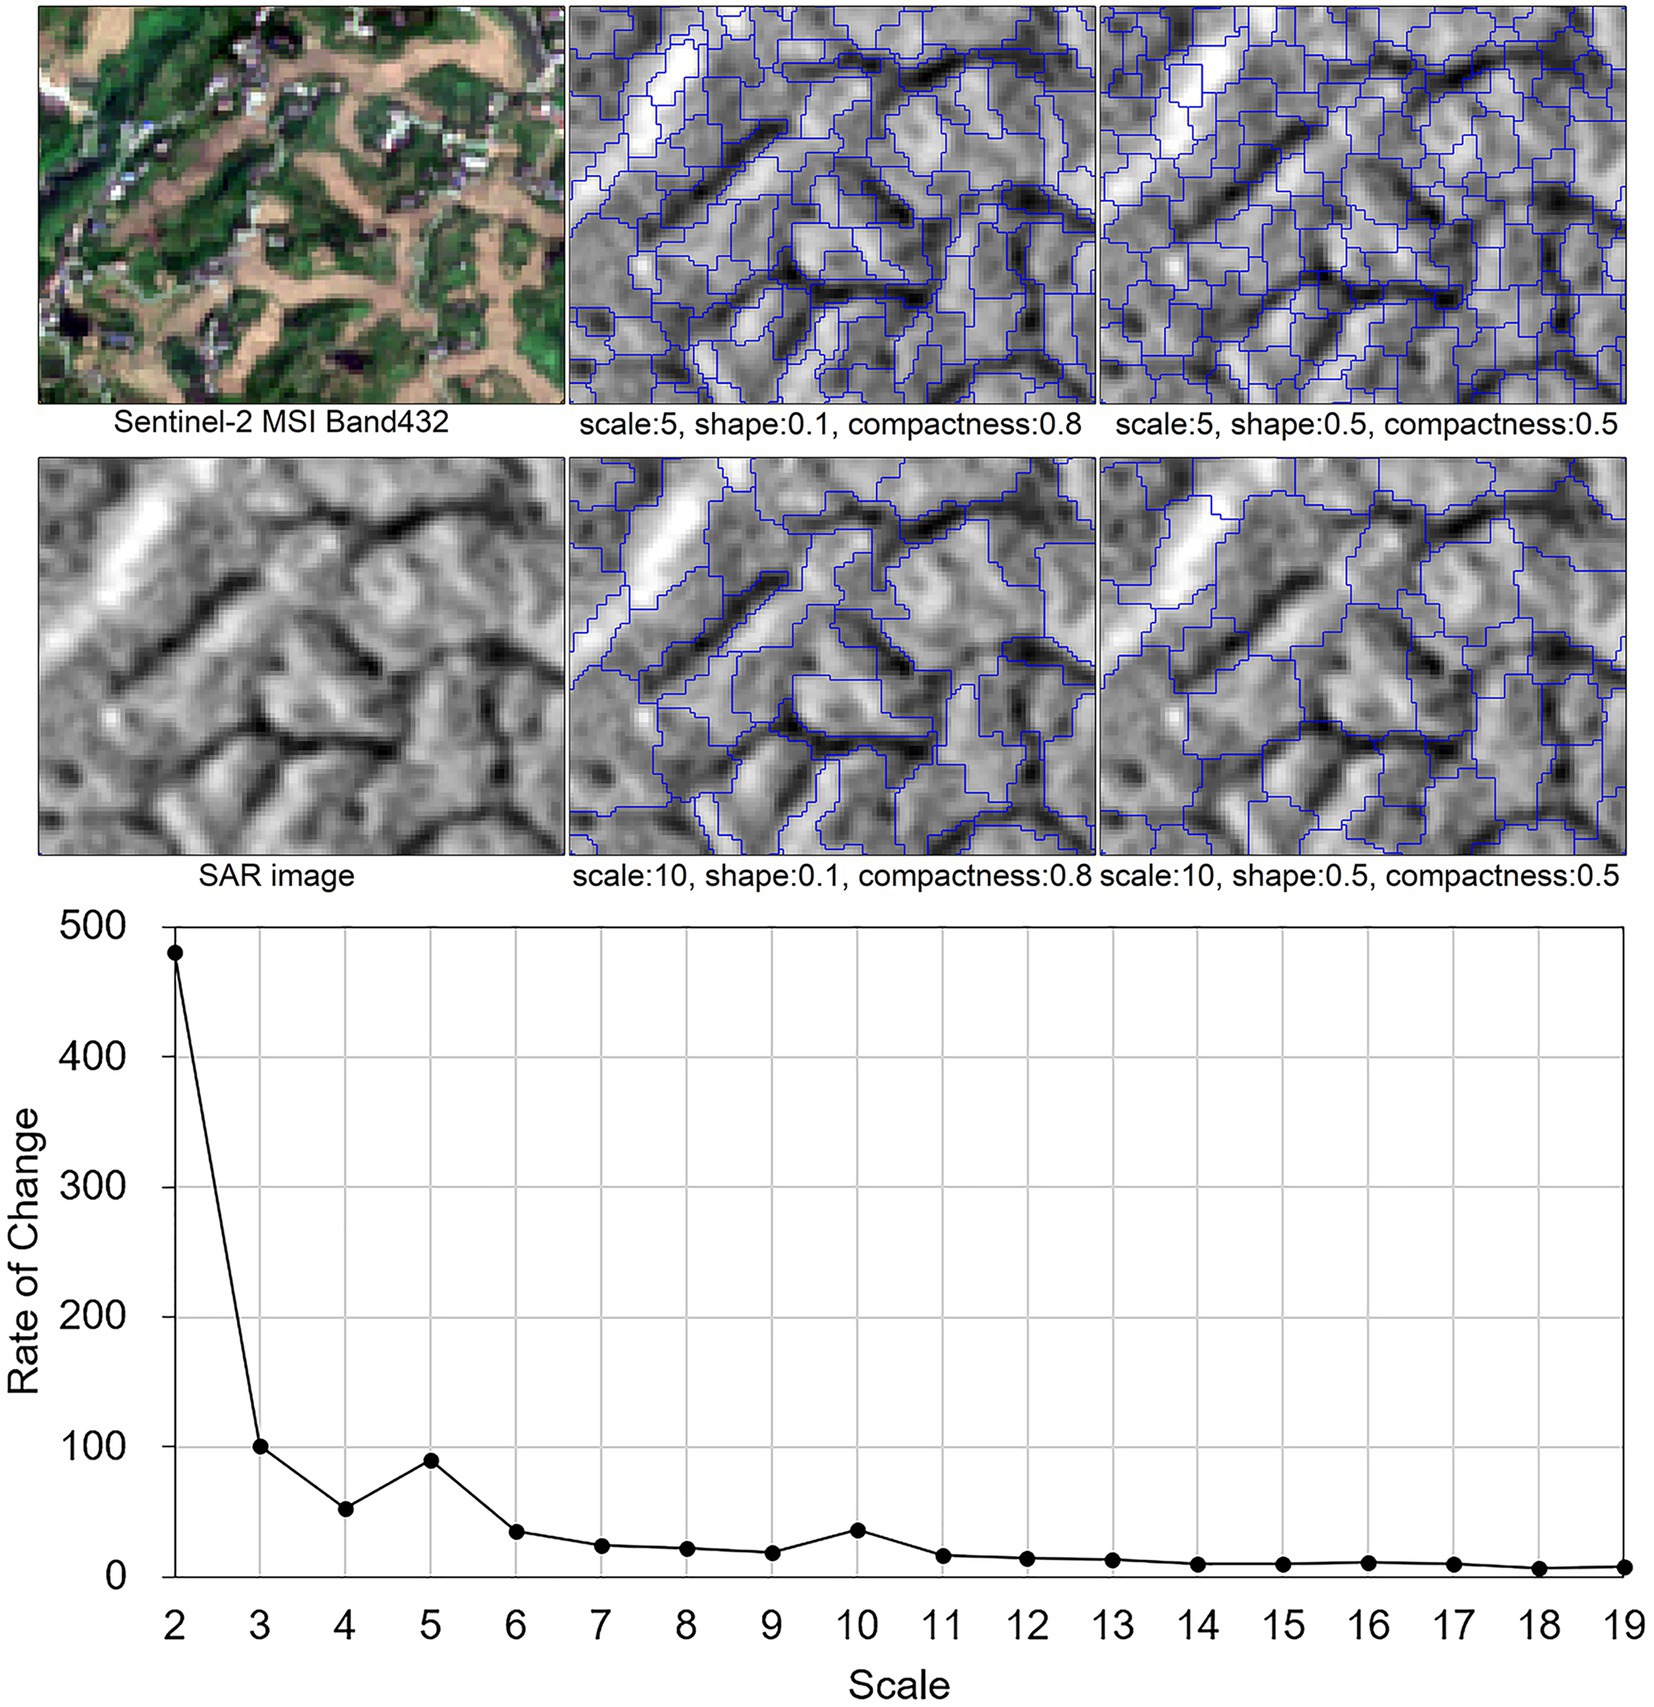
Figure 6. Multiresolution segmentation results with different segmentation parameters and rate of change (ROC) of the local variance.
Random forest integrates many classification and regression trees (CARTs) together to form an integrated classifier through the idea of ensemble learning. It has the advantages of flexibility and high precision, which is suitable for high-dimensional data. In the paper, the bootstrap method was firstly used to randomly select a certain proportion of samples as the training sample set. Secondly, when splitting the nodes of the CART, features from the abovementioned multi-characteristic parameters were extracted, and the nodes were split according to the principle of the smallest Gini coefficient. Repeating the above operation to establish 50 CARTs, and then form a random forest classifier, the results were decided by the votes of all CARTs.
The separability of rice and other land types in multi-characteristic parameters was further evaluated (Figure 7). For SAR backscatter features, the value of δVH-transplanting (−28 to −20 dB), δVH-jointing (−20 to −16 dB) are higher than that of water bodies, lower than that of other land types. The value of δVH-heading (−19 to -14 dB), δVH-mature (−17 to -12 dB) are lower than those of build, corn, forest, and grasslands. The VV backscatter coefficients of rice and other land types in the four key phenological stages are higher than VH backscattering coefficients. Especially in the transplanting stage, the separability of rice and corn in δVV-transplanting is higher thanδVH-transplanting. Therefore, the SAR backscatter coefficients at VH and VV polarizations are key indicators for identifying rice fields. However, only using SAR backscatter features cannot achieve the purpose of identifying rice well, because the SAR backscatter features of rice partially coincide with those of other land types. In particular, the recognition effect is not good in the mountainous area due to the heterogeneity of the land cover.
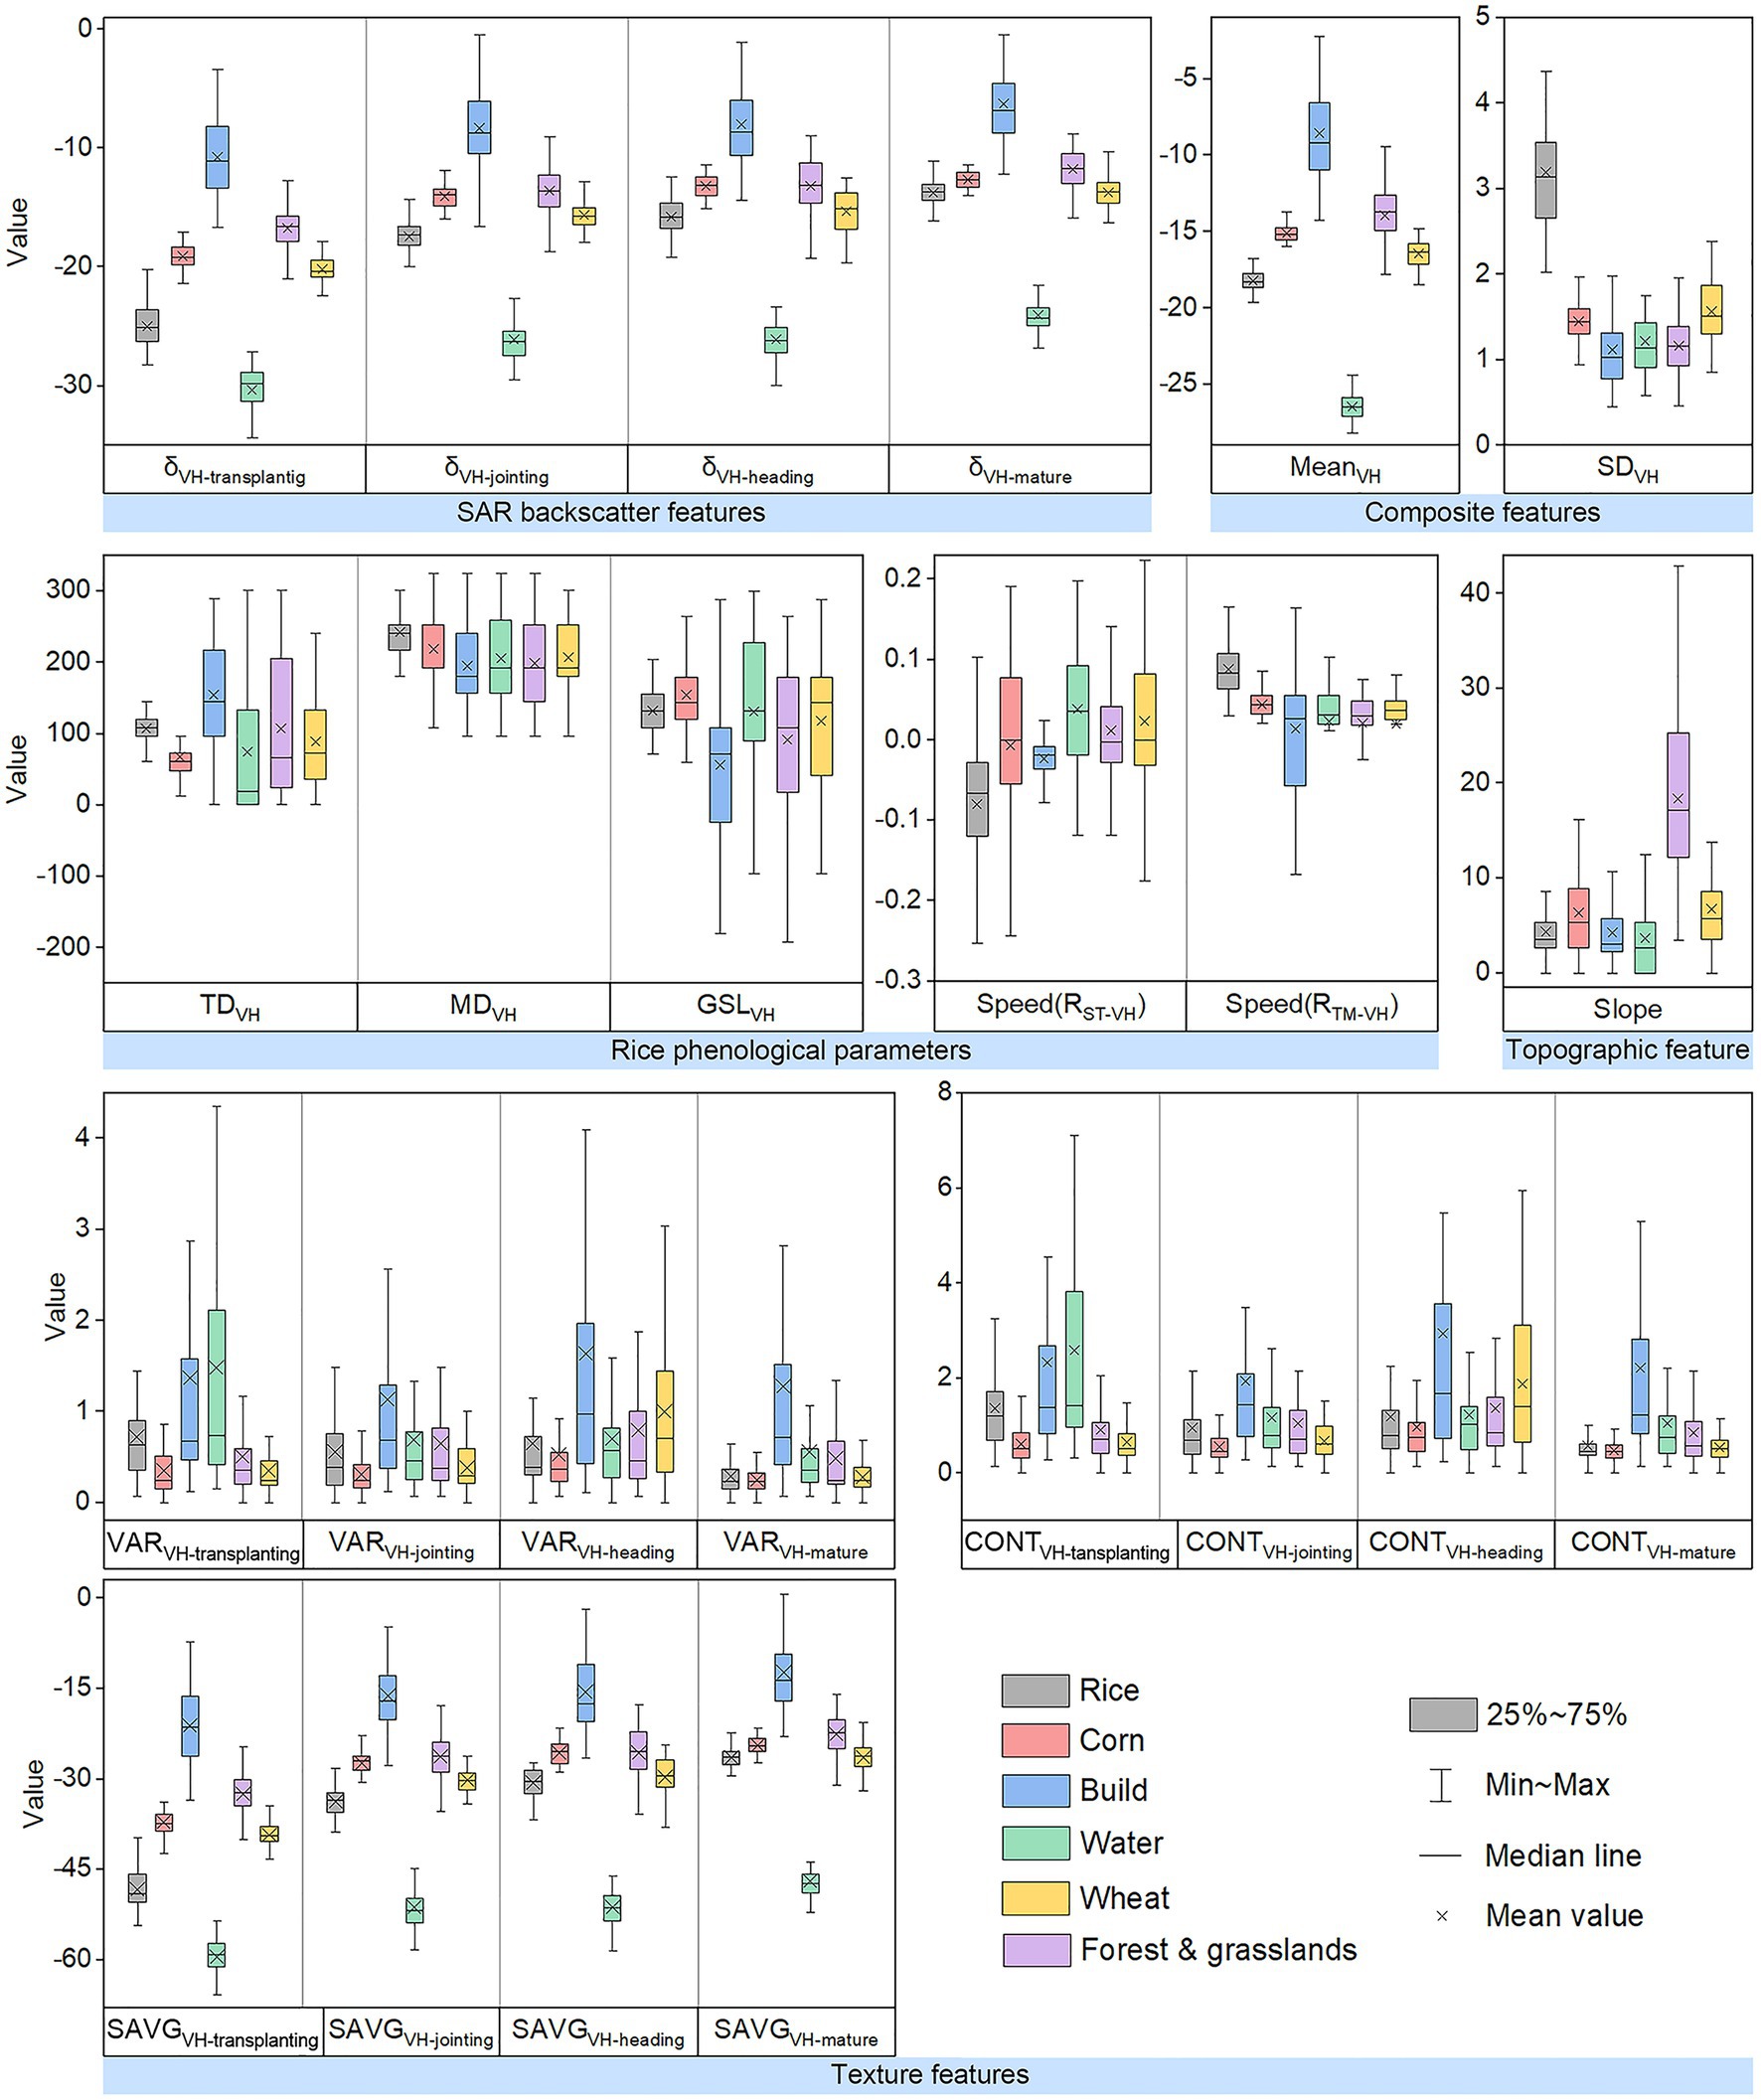
Figure 7. Separability of rice and other land cover types in each feature image based on VH Polarimetric Images. The δVH-transplanting, δVH-jointing, δVH-heading, δVH-mature represent SAR backscatter coefficients at four key phenological stages of rice (transplanting, jointing, heading and mature stages), MeanVH and SDVH represent the mean and standard deviation calculated based on all Sentinel-1 images throughout the rice growing season, SAVGVH-transplanting, SAVGVH-joining, SAVGVH-heading, SAVGVH-mature, VARVH-transplanting, VARVH-joining, VARVH-heading, VARVH-mature, CONTVH-transplanting, CONTVH-joining, CONTVH-heading and CONTVH-mature represent three types of texture parameters at four key phenological stages of rice, namely sum average, variance and contrast, slope represents topographic slope information.
For composite features, the MeanVH of rice is concentrated between −20 and -17 dB, which is larger than water and smaller than that of build, forest, and grasslands, corn, and wheat. The SDVH of rice was between 2 and 4.5, higher than other land types. Compared with the MeanVH and SDVH, the overlap of MeanVV and SDVV between rice and other land types is less, and the separation is higher. The composite features based on time series SAR data reflect the average level and dispersion of the backscatter coefficients of rice during the growth period, which can expand the distinguishability of rice and other land types.
For rice phenological parameters, the TDVH, MDVH and GSLVH of rice are between 70 and 150, 190 and 300, and 80 and 200, respectively. The TDVV, MDVV and GSLVV of rice are between 60 and 140, 210 and 310, and 110 and 210, respectively. The Speed (RST-VH) and Speed (RST-VV) of rice are lower than that of other land cover types, the Speed (RTM-VH) and Speed (RTM-VV) are higher than that of other land types. In addition, compared with other land types, the rice phenological parameters are more concentrated and rice is more recognizable. Therefore, rice phenological parameters can help to better eliminate some vegetation that may be misclassified, such as herbaceous vegetation that is seasonally submerged by the summer monsoon.
For texture features, the SAVGVH-transplanting, SAVGVH-joining, SAVGVH-heading and SAVGVH-mature of rice are between −50 dB to −36 dB, −35 dB to -27 dB, −33 dB to -25 dB, and − 27 dB to -22 dB, which are higher than that of the water, lower than that of other land types. The CONTVH-transplanting, CONTVV-transplanting, VARVH-transplanting and VARVV-transplanting of rice are higher than those of corn, forest/grasslands, wheat at the transplanting stage. The CONTVH-mature, CONTVV-mature, VARVH-mature and VARVV-mature of rice are lower than those of building, water, and forest/grasslands at the mature stage. Therefore, the SAR texture features are helpful to better identify rice fields.
Terrain slope information (Slope) is important auxiliary data, which is used to cover up forests and grasslands in mountainous areas, as well as the shadows caused by high mountains on SAR images, which can improve the accuracy of the rice fields map.
The spatial distribution of rice fields extracted by the MPHO-DPSAR algorithm (Figure 8) showed that the area of rice fields in Chongqing in 2020 is 632,400 hm2, which were mainly distributed in the hilly areas in the mid-west of Chongqing with the terrain relatively flat. There also were many rice fields distributed in the valleys in the northeast and south of Chongqing. Figures 8B–E shows the distribution of rice fields in the four sites (b–e) in Figure 8A. That is, the distribution of rice fields is mainly zonal and dispersed, which is very different from rice fields distributed in succession in plain areas. The main reason is that there are many mountains and hills in Chongqing, and paddy fields are mainly distributed in the relatively flat strip of narrow area between many small hills. Figures 8B’–E’ shows the VH polarization image of Sentinel-1 during the transplanting period. The Figure 8F is a comparison chart between the mapping results of the algorithm and the mapping results of the statistics. For the rice classified area by the MPHO-DPSAR algorithm, the rice classified area is 458.92km2 in Hechuan District, which is the largest. The rice classified area in Jiangjin, Yongchuan and Fuling is 397.00 km2, 316.35 km2 and 363.25 km2, respectively, all of which are more than 300 km2. There are less than 20km2 rice fields in Shapingba, Jiulongpo, Chengkou, Jiangbei, Nan’an and Dadukou.
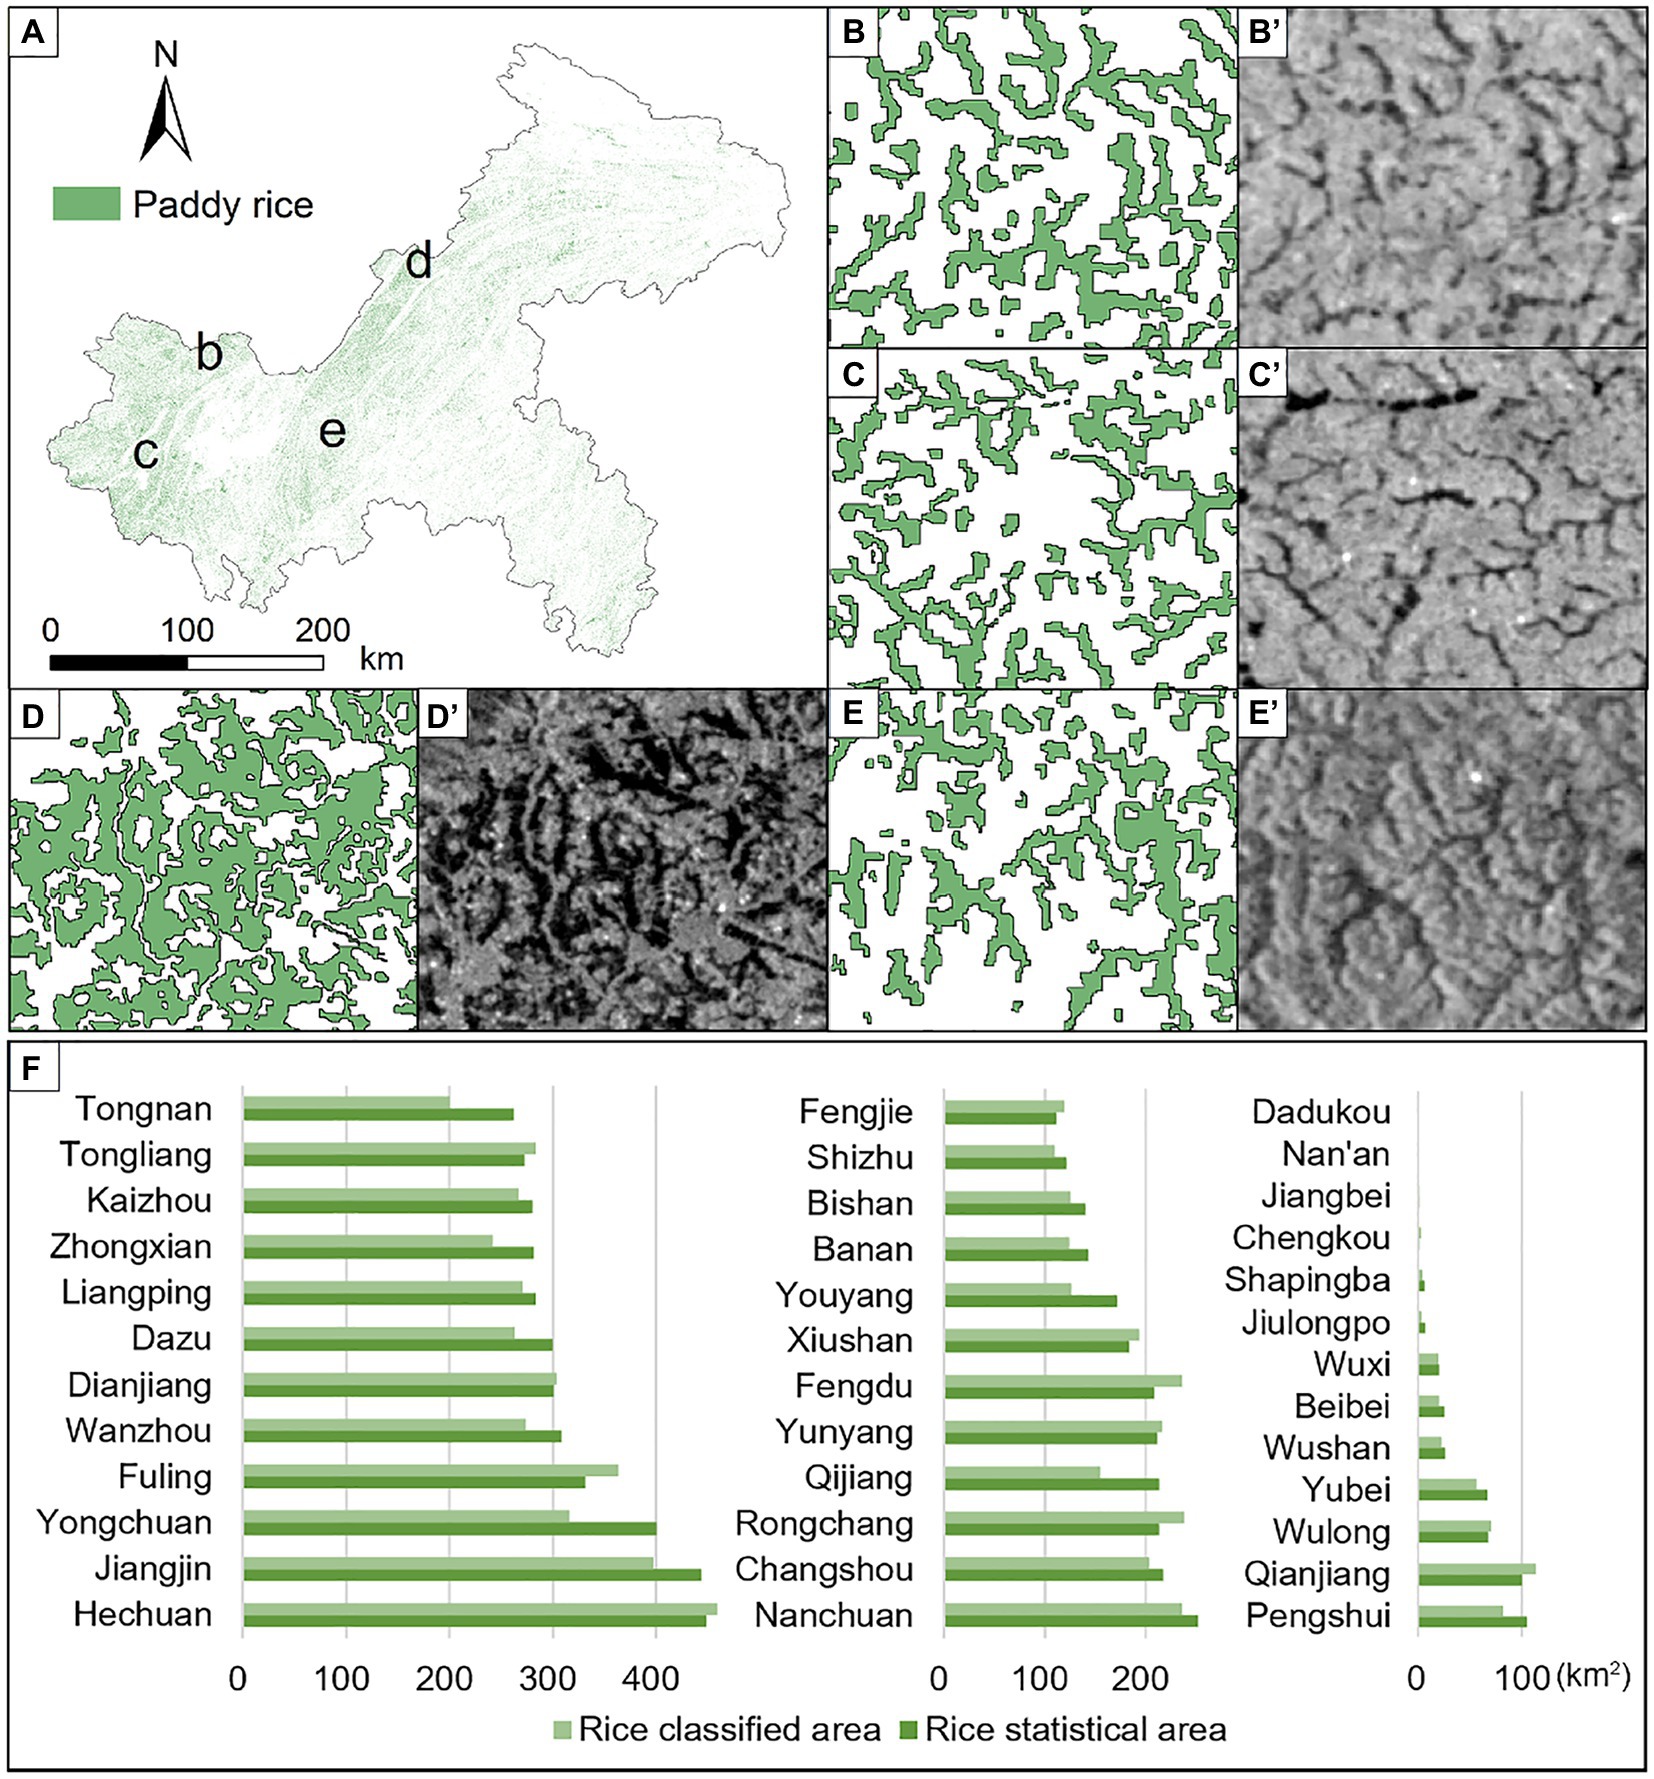
Figure 8. The rice fields map of Chongqing in 2020 based on the MPHO-DPSAR algorithm. Four regions, denoted as b–e in (A), randomly selected for zoom-in views shown in (B–E), respectively. The corresponding SAR image in transplanting stage shown in (B’–E’), respectively. The (F) is a comparison chart between the mapping results of the algorithm and the mapping results of the statistics.
The accuracy evaluation of the rice fields map was carried out on three levels, namely district/county level, object level, and rice field level.
At the district/county level, the linear regression between the MPHO-DPSAR derived results and agricultural statistics data was performed. The correlation coefficient of determination (R2) is 0.97. And the regression slope is 0.94, close to 1, which presented a significant linear correlation between the two datasets, and indicated the high precision of the resultant rice fields map (Figure 9).
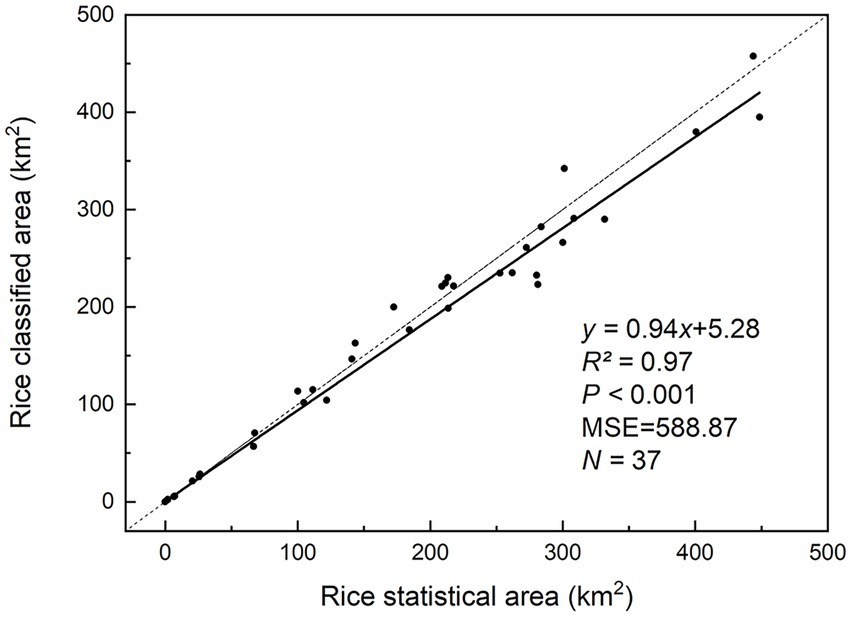
Figure 9. Correlation between MPHO-DPSAR derived results and the statistics of rice fields area.
At the object level, the confusion matrix showed that the user’s accuracy (UA), producer’s accuracy (PA), F1 score, overall accuracy (OA) and Kappa coefficient were 0.96, 0.93, 0.95, 0.95 and 0.90, respectively (Table 4).
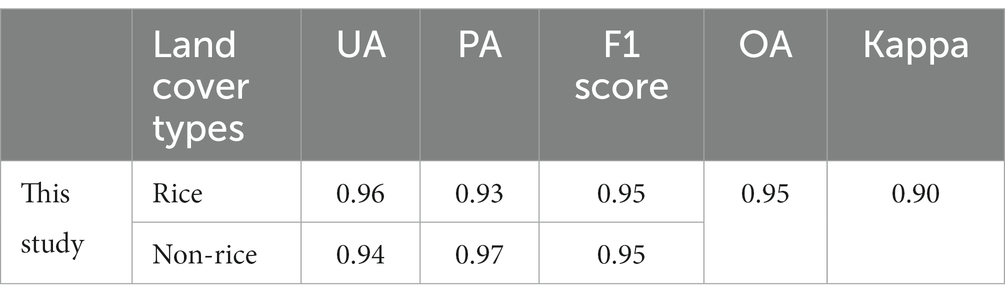
Table 4. Accuracy assessment of rice fields map in 2020.
At the rice field level, the precise rice fields map based on UAV images was used to verify the accuracy of MPHO-DPSAR derived results in low-altitude regions in Hechuan District and middle-altitude regions in Zhongxian County. For rice fields in the two regions, the ratio of recognized and unrecognized rice fields of different sizes was calculated. The results showed that the proportion of recognized paddy fields continued to increase with the size of a single paddy field increased. And more than 80% of the rice fields can be accurately recognized by the MPHO-DPSAR algorithm when the size of a single rice field is larger than 600 m2, corresponding to 6 pixels (Figure 10). This shows that the MPHO-DPSAR algorithm is suitable for identifying small and medium-sized rice fields in complex terrain.
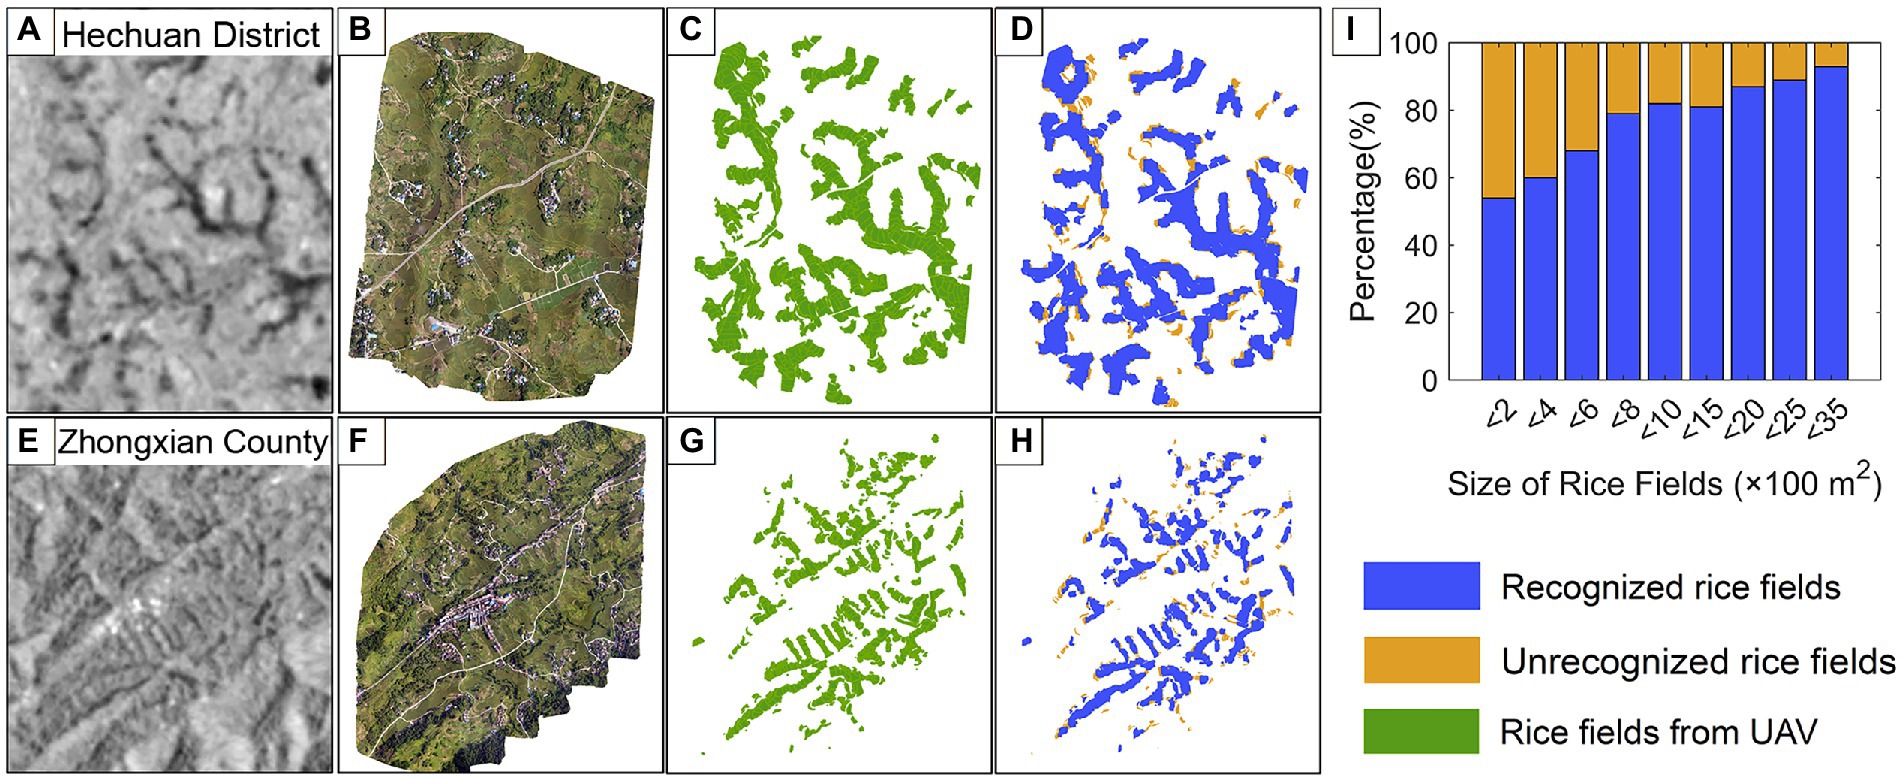
Figure 10. Accuracy assessment of rice fields map in two pilot regions based on UAV images. (A,E) Sentinel-1 VH images during rice transplanting stage. (B,F) UAV images in two pilot regions. (C,G) Real rice fields based on UAV images. (D,H) The recognized and unrecognized parts within each rice field for two pilot regions. (I) Proportions of recognized and unrecognized area with the changes of rice field sizes.
The study reproduced two classic rice identification methods based on remote sensing technology, which were further applied to identify rice fields in the complex terrain in Chongqing. The method I mainly utilized the “V” shaped feature in the Sentinel-1 SAR VH backscatter time series during the rice growth season (Zhan et al., 2021). The method II applied multi-temporal Landsat spectral reflectance and spectral indices to construct a decision tree to identify rice (Cao et al., 2020). In addition, this study also compared the decision tree algorithm developed by our team for rice identification in Chongqing (marked as method III), which integrated rice phenological and topographic features (Wang et al., 2022).
The performance of the four rice identification algorithms showed that the proposed MPHO-DPSAR algorithm in this paper obtained the best classification accuracy, with all the accuracy indicators highest (Table 5). As for the UA, our algorithm achieved a recognition accuracy of 0.96, which was much higher than that of the method I. The low UA of the method I indicated that a large number of non-rice fields (wet grassland and other crops) were identified as rice fields. Because this method only uses the Sentinel-1 VH polarization image, it does not make full use of the rich information provided by the VV polarization image, especially the method does not consider the terrain feature parameters. As for the PA, the method II obtained the accuracy of 0.69, indicating that there were serious omissions. Because this method sets a threshold value for the difference image of the EVI (Enhanced Vegetation Index) of two fixed dates to identify rice fields after masking other land types, it does not consider the inconsistent phenology of rice in the study area. The method III achieved the same UA (0.96), but other accuracy indicators were lower than those of this study. The main reasons are the comprehensive utilization of dual-polarization SAR backscatter features, composite features, rice phenological parameters, texture features and a topographic feature in this study. While the method III only employed VH polarization-based rice phenological and topographic features, without considering VV polarization-based features and texture features.
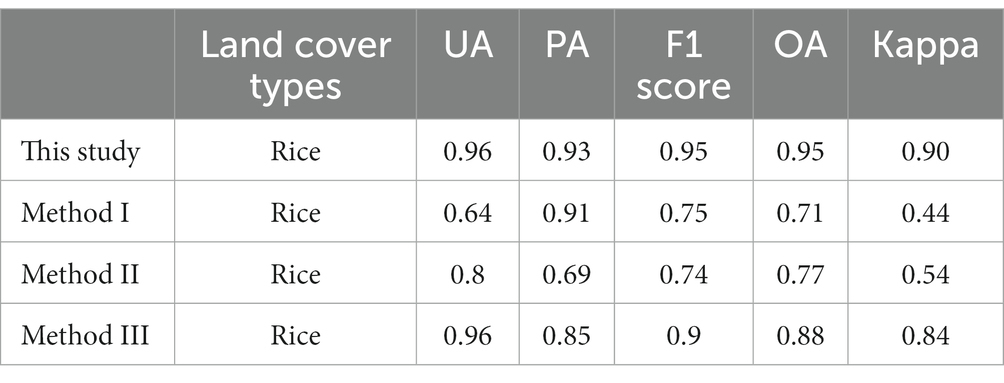
Table 5. The comparison of rice mapping performances of the four methods.
The high identification accuracy of our proposed algorithm could be attributed to the following reasons. (1) Abundant dual-polarization Sentinel-1A SAR data has high temporal of 12 days and high spatial resolution of 10 m (ENVISAT: 35d/20-500 m, RADARSAT-1: 24d/10-100 m, PALSAR-2: 45d/25 m). Therefore, the time-series SAR backscatter coefficients could accurately reflect rice characteristics at the whole phenological period and meet the needs of small- and middle-sized rice fields identification in Chongqing. Moreover, the dual-polarization SAR data can reflect the backscatter characteristics of rice under different polarization modes, which is helpful for the rice identification. (2) Sufficient rice identifiability features were extracted. The scattering mechanism of rice, which is different from other land types, can be well reflected in the backscatter features of time series SAR. The texture features well reflect the structures of rice fields and the connection between the rice fields and surrounding objects. The rice phenological parameters highlight the unique phenological cycle and growth characteristics. The composite features based on time series SAR data display the average level and dispersion of the backscatter coefficients of rice during the rice whole growth period. The use of the slope information is beneficial to obtain a suitable terrain environment for rice cultivation, especially in areas with complex terrain. (3) There were enough high-quality ground truth samples from field survey and UAV observation for algorithm training and accuracy verification. (4) The MPHO-DPSAR algorithm can effectively integrate the spectral features and spatial features of land cover types, locally minimize the average heterogeneity and maximize the internal homogeneity of objects, which is suitable for the regions with highly complex surface landscapes.
It is still a challenging task to produce high-precision rice mapping in large spatial areas with complex terrain. The accuracy of rice mapping is mainly affected by several factors, including the temporal and spatial resolution of SAR images, the complexity of the surface landscape, the size of rice fields, the segmentation algorithm and rice feature parameters.
The higher the spatial resolution, the higher the ability of the image to distinguish the details of the ground target. Although the Sentinel-1 SAR image with a spatial resolution of 10 m can meet the requirements of accurate rice field mapping in Chongqing. The rice fields mapping accuracy will be higher if the SAR image with a higher spatial resolution is used. The time-series SAR backscatter coefficients can reflect the variety of rice in the different growth states, which is important for elucidating the unique phenological characteristics of rice. The high temporal resolution of SAR images is beneficial to measure the complete phenological parameters characteristics of rice growth, thus improving the rice fields mapping accuracy (Wang et al., 2022).
SAR image distortion (foreshortening, layover, and shadow) caused by complex mountainous terrain may not be completely corrected by terrain correction in the SAR preprocessing step, which will affect the accuracy of rice identification (Wang et al., 2022). The foreshortening leads to larger SAR backscatter coefficients of objects at high altitudes, while the shadow results in the backscatter coefficient smaller, which increases the difficulty of rice identification. Most of the existing studies (Son et al., 2021; Zhan et al., 2021) on rice identification using SAR images were aimed at regions with simple topography and large-sized rice fields. In contrast, the terrain of the study area in this paper is complex, and the rice fields are small- and middle-sized and fragmented. In addition, other land cover types that have similar trends to the SAR backscatter curve of rice may be misclassified. For example, the lotus pond in Tuqiao Town, Tongliang District, and the grassland that is seasonally submerged due to the impoundment and drainage of the Three Gorges Reservoir.
Under the complex terrain, the area and shape of rice are quite diversity. Therefore, the optimal segmentation scale of multi-resolution segmentation algorithm determined in this paper are relative. In general, when the segmentation scale is reduced, the homogeneity of objects will be improved, the probability of dividing different land types into single objects will be reduced, and the accuracy of rice recognition will be improved. However, too small segmentation scale will lead to great heterogeneity between objects belonging to the same category, which is not conducive to rice recognition. Therefore, it is necessary to find a balance between segmentation scale and recognition accuracy.
The proposed MPHO-DPSAR algorithm for rice identification integrates SAR backscatter features, composite features, rice phenological parameters, texture features and a topographic feature. Therefore, enough SAR acquisitions are required to generate a time series dataset. At present, only Sentinel-1A SAR images covering Chongqing with a time resolution of 12 days were applied due to no Sentinel-1B data available. For the region covered by both Sentinel-1A and Sentinel-1B, the temporal resolution of SAR images can reach 6 days, which can more accurately obtain the phenological information of rice, and help to improve the recognition accuracy. In addition, other SAR sensor data (e.g., GF-3, RADARSAT) can also be supplemented to generate denser time-series datasets, then to obtain rice complete phenological information.
The proposed MPHO-DPSAR algorithm can be applied to rice identification in other regions. Firstly, the four key phenological stages of rice, including transplanting, jointing, heading and mature stage, should be clarified. Rice phenology has little difference in a certain spatial range and is relatively stable in different years, so the rice phenology data can be used for many years (Dong et al., 2015). Once obtaining the rice phenological data, the corresponding multi-characteristic parameters can be extracted, and then the MPHO-DPSAR algorithm can be used for high-precision rice mapping. For regions without rice phenology data, the rice phenology can be estimated based on air temperature data (Son et al., 2021). Because temperature is an important factor affecting plant growth and crop phenology (Dong et al., 2015). A temperature-based phenology algorithm was previously proposed to identify rice and achieved an overall accuracy higher than 84% (Dong et al., 2015).
There are many clouds and fog in Chongqing, so SAR has advantages over optical remote sensing for rice recognition in Chongqing. However, in regions with less cloudy and rainy weather, compared with using a single type of remote sensing image, multi-source heterogeneous optical remote sensing image and SAR image can be integrated for rice mapping, then to achieve complementary advantages of data sources (He et al., 2021).
In this study, we reconstructed the Sentinel-1 SAR time-series backscatter data, calculated multi-characteristic parameters, including SAR backscatter features, composite features, rice phenology parameters, texture features, and topographic features, and analyzed the separability of rice and other land cover types in each feature image. On this basis, a rice identification algorithm combining multi-characteristic parameters and homogeneous objects based on time series dual-polarization SAR (MPHO-DPSAR) for high-precision rice fields mapping was proposed. We tested the performance of the algorithm in Chongqing city with complex terrain, fragmentation, small and medium-sized paddy fields, and compared its performance with three existing methods. Results show that the MPHO-DPSAR was able to provide an accurate rice fields map with an overall accuracy of 95%, which is better than the existing methods. The MPHO-DPSAR derived results were in good agreement with the statistics of rice fields area in districts and counties, the correlation coefficient of determination (R2) was 0.97. The local verification based on UAV images shows that more than 80% of the rice fields can be accurately identified by the MPHO-DPSAR algorithm when the size of a single rice field is larger than 600 m2, corresponding to 6 pixels. In addition, MPHO-DPSAR algorithm can be applied to rice recognition based on time-series optical remote sensing and SAR data to realize the complementary advantages of multi-source heterogeneous data sources. It can also be combined with the temperature-based phenology algorithm, so that MPHO-DPSAR algorithm can be applied to regions where rice phenological data are not released. This study can provide new methods and references for satellite-based rice monitoring in other regions. In future work, we will test the potential of the MPHO-DPSAR algorithm on early season rice fields mapping.
The original contributions presented in the study are included in the article/Supplementary material, further inquiries can be directed to the corresponding author.
HM: writing, methodology, and formal analysis. LW: project administration, reviewing, and editing. WS: conceptualization. SY, YG, and LF: investigation and project administration. GY and YW: investigation and methodology. All authors participated in the final writing—review and editing of the manuscript.
This research was supported in part by the National Natural Science Foundation of China (Nos. 42176174, 42122009, and 42171311), in part by the National Science Foundation for Post-Doctoral Scientists of China (No. 2020 M683258), Zhejiang Provincial Natural Science Foundation of China (Nos. LY22D010002, LR19D010001), Key Projects of Major Scientific and Technological Tasks in Ningbo (No. 2021Z107), Public Projects of Ningbo City (No. 2022S101), and Chongqing Natural Science Foundation (No. CSTB2022NSCQ-MSX0588).
We sincerely thank the ESA for providing time-series Sentinel-1 Level-1 SAR products and thank all reviewers who provided detailed and valuable comments or suggestions to improve this manuscript.
The authors declare that the research was conducted in the absence of any commercial or financial relationships that could be construed as a potential conflict of interest.
All claims expressed in this article are solely those of the authors and do not necessarily represent those of their affiliated organizations, or those of the publisher, the editors and the reviewers. Any product that may be evaluated in this article, or claim that may be made by its manufacturer, is not guaranteed or endorsed by the publisher.
The Supplementary material for this article can be found online at: https://www.frontiersin.org/articles/10.3389/fevo.2023.1093454/full#supplementary-material
Arino, O., Bicheron, P., Frédéric, A., Latham, J., Witt, R., and Weber, J.-L. (2008). GLOBCOVER: the most detailed portrait of Earth. European Space Agency Bull. 2008, 24–31.
Bazzi, H., Baghdadi, N., El Hajj, M., Zribi, M., Minh, D. H. T., Ndikumana, E., et al. (2019). Mapping Paddy Rice using Sentinel-1 SAR time series in Camargue, France. Remote Sens. 11:887. doi: 10.3390/rs11070887
Belgiu, M., Bijker, W., Csillik, O., and Stein, A. (2021). Phenology-based sample generation for supervised crop type classification. Int. J. Appl. Earth Obs. Geoinf. 95:102264. doi: 10.1016/j.jag.2020.102264
Belgiu, M., and Csillik, O. (2018). Sentinel-2 cropland mapping using pixel-based and object-based time-weighted dynamic time warping analysis. Remote Sens. Environ. 204, 509–523. doi: 10.1016/j.rse.2017.10.005
Bouvet, A., and Le Toan, T. (2011). Use of ENVISAT/ASAR wide-swath data for timely rice fields mapping in the Mekong River Delta. Remote Sens. Environ. 115, 1090–1101. doi: 10.1016/j.rse.2010.12.014
Cao, J., Cai, X., Tan, J., Cui, Y., Xie, H., Liu, F., et al. (2020). Mapping paddy rice using Landsat time series data in the Ganfu plain irrigation system, southern China, from 1988−2017. Int. J. Remote Sens. 42, 1556–1576. doi: 10.1080/01431161.2020.1841321
Chandra Paul, G., Saha, S., and Hembram, T. K. (2020). Application of phenology-based algorithm and linear regression model for estimating rice cultivated areas and yield using remote sensing data in Bansloi River basin, eastern India. Rem. Sens. Appl. 19:100367. doi: 10.1016/j.rsase.2020.100367
Chen, T., and Pan, J. (2022). Estimation and temporal and spatial pattern of anthropogenic CH4 emissions in China from 2009 to 2019. Chin. Environ. Sci. 1:914. doi: 10.19674/j.cnki.issn1000-6923.20220914.004
Chongqing Statistics Bureau. (2020). Chongqing statistical year book 2020. Beijing: China Statistics Press.
Clauss, K., Ottinger, M., Leinenkugel, P., and Kuenzer, C. (2018). Estimating rice production in the Mekong Delta, Vietnam, utilizing time series of Sentinel-1 SAR data. Int. J. Appl. Earth Obs. Geoinf. 73, 574–585. doi: 10.1016/j.jag.2018.07.022
Corcione, V., Nunziata, F., Mascolo, L., and Migliaccio, M. (2016). A study of the use of COSMO-SkyMed SAR PingPong polarimetric mode for rice growth monitoring. Int. J. Remote Sens. 37, 633–647. doi: 10.1080/01431161.2015.1131902
Csorba, A., Szegi, T., Fodor, H., Bukombe, B., Uwiragiye, Y., Naramabuye, F. X., et al. (2019). Characterization of rice agriculture in the Southern Province of Rwanda by means of microwave remote sensing. Phys. Chem. Earth 112, 58–65. doi: 10.1016/j.pce.2019.02.002
Dong, J., Xiao, X., Kou, W., Qin, Y., Zhang, G., Li, L., et al. (2015). Tracking the dynamics of paddy rice planting area in 1986–2010 through time series Landsat images and phenology-based algorithms. Remote Sens. Environ. 160, 99–113. doi: 10.1016/j.rse.2015.01.004
Dragut, L., Csillik, O., Eisank, C., and Tiede, D. (2014). Automated parameterization for multi-scale image segmentation on multiple layers. ISPRS J. Photogramm. Remote Sens. 88, 119–127. doi: 10.1016/j.isprsjprs.2013.11.018
Drǎguţ, L., Tiede, D., and Levick, S. R. (2010). ESP: a tool to estimate scale parameter for multi-resolution image segmentation of remotely sensed data. Int. J. Geogr. Inf. Sci. 24, 859–871. doi: 10.1080/13658810903174803
Gao, H., Wang, C., and Yang, M. (2019). Analysis and classification of crop scattering characteristics based on GF-3 polarized SAR data. Eng. Surv. Mapp. 28, 50–56. doi: 10.19349/j.cnki.issn 1006-7949.2019.03.010
Gir, R., Jain, L., and Rai, R. (2015). Speckle reduction of synthetic aperture radar images using median filter and savitzky-golay filter. Int. J. Comput. Appl. 113.
Gong, P., Wang, J., Yu, L., Zhao, Y., Zhao, Y., Liang, L., et al. (2012). Finer resolution observation and monitoring of global land cover: first mapping results with Landsat TM and ETM+ data. Int. J. Remote Sens. 34, 2607–2654. doi: 10.1080/01431161.2012.748992
Han, J., Zhang, Z., Luo, Y., Cao, J., Zhang, L., Zhuang, H., et al. (2022). Annual paddy rice planting area and cropping intensity datasets and their dynamics in the Asian monsoon region from 2000 to 2020. Agric. Syst. 200:103437. doi: 10.1016/j.agsy.2022.103437
He, Y., Dong, J., Liao, X., Sun, L., Wang, Z., You, N., et al. (2021). Examining rice distribution and cropping intensity in a mixed single- and double-cropping region in South China using all available sentinel 1/2 images. Int. J. Appl. Earth Obs. Geoinf. 101:102351. doi: 10.1016/j.jag.2021.102351
Krishnan, S. R., and Seelamantula, C. S. (2013). On the selection of optimum Savitzky-Golay filters. IEEE Trans. Signal Process. 61, 380–391. doi: 10.1109/TSP.2012.2225055
Li, K., Brisco, B., Yun, S., and Touzi, R. (2014). Polarimetric decomposition with RADARSAT-2 for rice mapping and monitoring. Can. J. Remote. Sens. 38, 169–179. doi: 10.5589/m12-024
Li, C., Chen, W., Wang, Y., Wang, Y., Ma, C., Li, Y., et al. (2022). Mapping winter wheat with optical and SAR images based on Google earth engine in Henan Province, China. Remote Sens. 14:284. doi: 10.3390/rs14020284
Lin, B., Xu, M., and Wang, X. (2022). China's agricultural carbon emission reduction policies, research status and prospects. Chin. J. Ecol. Agric. 30, 500–515. doi: 10.12357/cjea.20210843
Lisan, Z. (1993). The theory and practice of agricultural regionalization in China. Hefei: University of Science and Technology of China Press.
Lopez-Sanchez, J. M., Cloude, S. R., and Ballester-Berman, J. D. (2012). Rice phenology monitoring by means of SAR polarimetry at X-band. IEEE Trans. Geosci. Remote Sens. 50, 2695–2709. doi: 10.1109/TGRS.2011.2176740
Mandal, D., Kumar, V., Ratha, D., Lopez-Sanchez, J. M., Bhattacharya, A., McNairn, H., et al. (2020). Assessment of rice growth conditions in a semi-arid region of India using the generalized radar vegetation index derived from RADARSAT-2 polarimetric SAR data. Remote Sens. Environ. 237:111561. doi: 10.1016/j.rse.2019.111561
Nguyen, D., Wagner, W., Naeimi, V., and Cao, S. (2015). Rice-planted area extraction by time series analysis of ENVISAT ASAR WS data using a phenology-based classification approach: a case study for red River Delta, Vietnam. Int. Arch. Photogramm. Remote. Sens. Spat. Inf. Sci. XL-7/W3, 77–83. doi: 10.5194/isprsarchives-XL-7-W3-77-2015
Ni, R., Tian, J., Li, X., Yin, D., Li, J., Gong, H., et al. (2021). An enhanced pixel-based phenological feature for accurate paddy rice mapping with Sentinel-2 imagery in Google earth engine. ISPRS J. Photogramm. Remote Sens. 178, 282–296. doi: 10.1016/j.isprsjprs.2021.06.018
Pan, B., Zheng, Y., Shen, R., Ye, T., Zhao, W., Dong, J., et al. (2021). High resolution distribution dataset of double-season Paddy Rice in China. Remote Sens. 13:4609. doi: 10.3390/rs13224609
Pang, J., Zhang, R., Yu, B., Liao, M., Lv, J., Xie, L., et al. (2021). Pixel-level rice planting information monitoring in Fujin City based on time-series SAR imagery. Int. J. Appl. Earth Obs. Geoinf. 104:102551. doi: 10.1016/j.jag.2021.102551
Panigrahy, S., Jain, V., Patnaik, C., and Parihar, J. S. (2012). Identification of Aman Rice crop in Bangladesh using temporal C-band SAR – a feasibility study. J. Indian Soc. Remote Sens. 40, 599–606. doi: 10.1007/s12524-011-0193-0
Peña-Barragán, J. M., Ngugi, M. K., Plant, R. E., and Six, J. (2011). Object-based crop identification using multiple vegetation indices, textural features and crop phenology. Remote Sens. Environ. 115, 1301–1316. doi: 10.1016/j.rse.2011.01.009
Son, N.-T., Chen, C.-F., Chen, C.-R., Toscano, P., Cheng, Y.-S., Guo, H.-Y., et al. (2021). A phenological object-based approach for rice crop classification using time-series Sentinel-1 synthetic aperture radar (SAR) data in Taiwan. Int. J. Remote Sens. 42, 2722–2739. doi: 10.1080/01431161.2020.1862440
Sulla-Menashe, D., Gray, J. M., Abercrombie, S. P., and Friedl, M. A. (2019). Hierarchical mapping of annual global land cover 2001 to present: the MODIS collection 6 land cover product. Remote Sens. Environ. 222, 183–194. doi: 10.1016/j.rse.2018.12.013
Torbick, N., Chowdhury, D., Salas, W., and Qi, J. (2017). Monitoring Rice agriculture across Myanmar using time series Sentinel-1 assisted by Landsat-8 and PALSAR-2. Remote Sens. 9:119. doi: 10.3390/rs9020119
Wang, L., Ma, H., Li, J., Gao, Y., Fan, L., Yang, Z., et al. (2022). An automated extraction of small- and middle-sized rice fields under complex terrain based on SAR time series: a case study of Chongqing. Comput. Electron. Agric. 200:107232. doi: 10.1016/j.compag.2022.107232
Xie, H., and Chen, Z. W. (2019). Prospects for agricultural sustainable intensification: A review of research. Land 8:157. doi: 10.3390/land8110157
Yang, H., Pan, B., Wu, W., and Tai, J. (2018). Field-based rice classification in Wuhua county through integration of multi-temporal sentinel-1A and Landsat-8 OLI data. Int. J. Appl. Earth Obs. Geoinf. 69, 226–236. doi: 10.1016/j.jag.2018.02.019
Yang, Z., Shao, Y., Li, K., Liu, Q., Liu, L., and Brisco, B. (2017). An improved scheme for rice phenology estimation based on time-series multispectral HJ-1A/B and polarimetric RADARSAT-2 data. Remote Sens. Environ. 195, 184–201. doi: 10.1016/j.rse.2017.04.016
Yin, Q., Liu, M., Cheng, J., Ke, Y., and Chen, X. (2019). Mapping Paddy Rice planting area in northeastern China using spatiotemporal data fusion and phenology-based method. Remote Sens. 11:1699. doi: 10.3390/rs11141699
Yu, L., Huang, Y., Liu, J., and Duan, L. (2020). Extraction of polarization characteristics of Oryza sativa growth under the rainfall fluctuation. J. Zhejiang A&F Univ. 37, 992–998. doi: 10.11833/j.issn.2095-0756.20190605
Zeng, L., Wardlow, B. D., Xiang, D., Hu, S., and Li, D. (2020). A review of vegetation phenological metrics extraction using time-series, multispectral satellite data. Remote Sens. Environ. 237:111511. doi: 10.1016/j.rse.2019.111511
Zhan, P., Zhu, W., and Li, N. (2021). An automated rice mapping method based on flooding signals in synthetic aperture radar time series. Remote Sens. Environ. 252:112112. doi: 10.1016/j.rse.2020.112112
Zhang, M., and Lin, H. (2019). Object-based rice mapping using time-series and phenological data. Adv. Space Res. 63, 190–202. doi: 10.1016/j.asr.2018.09.018
Zheng, H., Cheng, T., Yao, X., Deng, X., Tian, Y., Cao, W., et al. (2016). Detection of rice phenology through time series analysis of ground-based spectral index data. Field Crop Res. 198, 131–139. doi: 10.1016/j.fcr.2016.08.027
Keywords: rice, multi-characteristic parameters, homogeneous objects, time series, dual-polarization, synthetic aperture radar
Citation: Ma H, Wang L, Sun W, Yang S, Gao Y, Fan L, Yang G and Wang Y (2023) A new rice identification algorithm under complex terrain combining multi-characteristic parameters and homogeneous objects based on time series dual-polarization synthetic aperture radar. Front. Ecol. Evol. 11:1093454. doi: 10.3389/fevo.2023.1093454
Edited by:
George Xian, United States Geological Survey (USGS), United StatesReviewed by:
Qiqi Zhu, China University of Geosciences Wuhan, ChinaCopyright © 2023 Ma, Wang, Sun, Yang, Gao, Fan, Yang and Wang. This is an open-access article distributed under the terms of the Creative Commons Attribution License (CC BY). The use, distribution or reproduction in other forums is permitted, provided the original author(s) and the copyright owner(s) are credited and that the original publication in this journal is cited, in accordance with accepted academic practice. No use, distribution or reproduction is permitted which does not comply with these terms.
*Correspondence: Lihua Wang, d2FuZ2xpaHVhMUBuYnUuZWR1LmNu
Disclaimer: All claims expressed in this article are solely those of the authors and do not necessarily represent those of their affiliated organizations, or those of the publisher, the editors and the reviewers. Any product that may be evaluated in this article or claim that may be made by its manufacturer is not guaranteed or endorsed by the publisher.
Research integrity at Frontiers
Learn more about the work of our research integrity team to safeguard the quality of each article we publish.